Yale University 2015 Sustainable Transportation Survey Report Transportation... · Yale University...
16
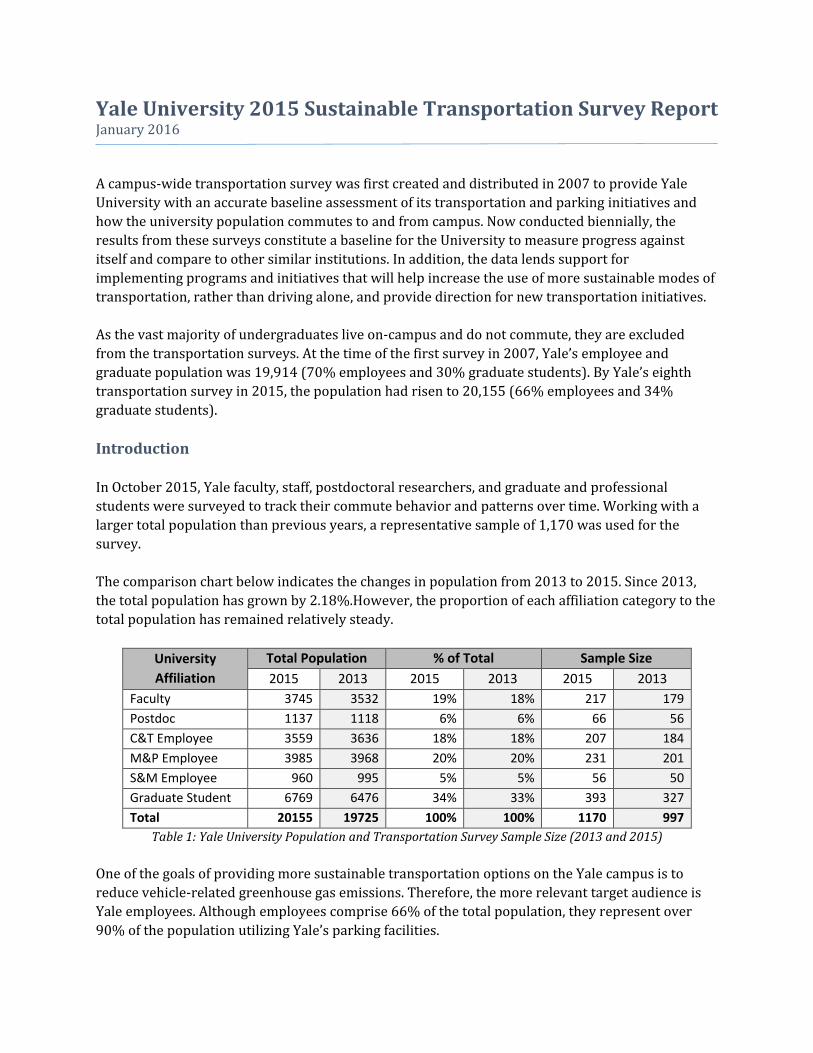
Yale University 2015 Sustainable Transportation Survey Report January 2016 A campus-wide transportation survey was first created and distributed in 2007 to provide Yale University with an accurate baseline assessment of its transportation and parking initiatives and how the university population commutes to and from campus. Now conducted biennially, the results from these surveys constitute a baseline for the University to measure progress against itself and compare to other similar institutions. In addition, the data lends support for implementing programs and initiatives that will help increase the use of more sustainable modes of transportation, rather than driving alone, and provide direction for new transportation initiatives. As the vast majority of undergraduates live on-campus and do not commute, they are excluded from the transportation surveys. At the time of the first survey in 2007, Yale’s employee and graduate population was 19,914 (70% employees and 30% graduate students). By Yale’s eighth transportation survey in 2015, the population had risen to 20,155 (66% employees and 34% graduate students). Introduction In October 2015, Yale faculty, staff, postdoctoral researchers, and graduate and professional students were surveyed to track their commute behavior and patterns over time. Working with a larger total population than previous years, a representative sample of 1,170 was used for the survey. The comparison chart below indicates the changes in population from 2013 to 2015. Since 2013, the total population has grown by 2.18%.However, the proportion of each affiliation category to the total population has remained relatively steady. University Affiliation Total Population % of Total Sample Size 2015 2013 2015 2013 2015 2013 Faculty 3745 3532 19% 18% 217 179 Postdoc 1137 1118 6% 6% 66 56 C&T Employee 3559 3636 18% 18% 207 184 M&P Employee 3985 3968 20% 20% 231 201 S&M Employee 960 995 5% 5% 56 50 Graduate Student 6769 6476 34% 33% 393 327 Total 20155 19725 100% 100% 1170 997 Table 1: Yale University Population and Transportation Survey Sample Size (2013 and 2015) One of the goals of providing more sustainable transportation options on the Yale campus is to reduce vehicle-related greenhouse gas emissions. Therefore, the more relevant target audience is Yale employees. Although employees comprise 66% of the total population, they represent over 90% of the population utilizing Yale’s parking facilities.
Transcript of Yale University 2015 Sustainable Transportation Survey Report Transportation... · Yale University...
Yale University 2015 Sustainable Transportation Survey Report January 2016
A campus-wide transportation survey was first created and distributed in 2007 to provide Yale
University with an accurate baseline assessment of its transportation and parking initiatives and
how the university population commutes to and from campus. Now conducted biennially, the
results from these surveys constitute a baseline for the University to measure progress against
itself and compare to other similar institutions. In addition, the data lends support for
implementing programs and initiatives that will help increase the use of more sustainable modes of
transportation, rather than driving alone, and provide direction for new transportation initiatives.
As the vast majority of undergraduates live on-campus and do not commute, they are excluded
from the transportation surveys. At the time of the first survey in 2007, Yale’s employee and
graduate population was 19,914 (70% employees and 30% graduate students). By Yale’s eighth
transportation survey in 2015, the population had risen to 20,155 (66% employees and 34%
graduate students).
Introduction
In October 2015, Yale faculty, staff, postdoctoral researchers, and graduate and professional
students were surveyed to track their commute behavior and patterns over time. Working with a
larger total population than previous years, a representative sample of 1,170 was used for the
survey.
The comparison chart below indicates the changes in population from 2013 to 2015. Since 2013,
the total population has grown by 2.18%.However, the proportion of each affiliation category to the
total population has remained relatively steady.
University
Affiliation
Total Population % of Total Sample Size
2015 2013 2015 2013 2015 2013
Faculty 3745 3532 19% 18% 217 179
Postdoc 1137 1118 6% 6% 66 56
C&T Employee 3559 3636 18% 18% 207 184
M&P Employee 3985 3968 20% 20% 231 201
S&M Employee 960 995 5% 5% 56 50
Graduate Student 6769 6476 34% 33% 393 327
Total 20155 19725 100% 100% 1170 997
Table 1: Yale University Population and Transportation Survey Sample Size (2013 and 2015)
One of the goals of providing more sustainable transportation options on the Yale campus is to
reduce vehicle-related greenhouse gas emissions. Therefore, the more relevant target audience is
Yale employees. Although employees comprise 66% of the total population, they represent over
90% of the population utilizing Yale’s parking facilities.
2 Yale University 2015 Sustainable Transportation Survey Report
Report Highlights
Most Yale commuters utilize sustainable transportation modes.
In 2015, the majority (60%) of Yale commuters utilized sustainable transportation
methods, i.e., transit (23%), walking (22%), biking (9%), ridesharing (5%), and
telecommuting (2%), while 40% used a single-occupancy vehicle.
The commuting habits of Yale employees have changed slightly since 2013, with the most
notable difference found in the 4% decrease in ridesharing. Driving alone increased by 2%,
while transit ridership decreased by the same amount. Walking increased by 3% and biking
and telecommuting remained steady since 2013. A significant decrease in gas prices since
2013 likely contributed to higher drive alone rates in 2015.
Employee commute satisfaction is higher for those who drive alone less often.
Employees who never drive alone to campus have the highest commute satisfaction, while
those who drive alone every day have the lowest.
More employees are utilizing the Yale Shuttle.
Overall transit ridership by employees decreased slightly from 22% in 2013 to 20% in
2015. However, 10% of all employees used the Yale Shuttle as their primary commute
mode, compared to 8% in 2013.
Use of the Yale shuttle for travel between campus locations increased by 10%.
More employees who drive alone to work would switch to alternative modes if provided incentives.
The most popular incentives are: (1) monthly cash allowance in exchange for parking space;
(2) flexible hours to accommodate transit or rideshare schedule; and, (3) free use of
CTTransit buses.
The same three reasons for driving alone have been the most common since 2009: irregular hours on
campus, need car for errands or appointments, and driving alone takes less time.
“Infrequent special circumstances” was added as a new choice in 2015, and was the fourth
most popular choice.
More employees are living closer to campus.
Over one-third of employees lived in New Haven in 2015, an increase of 4% since 2013.
Employees who live in New Haven drive alone to campus much less often than those living
in surrounding towns.
Awareness of important Yale sustainable transportation programs remains low.
Commuter awareness of important services such as customized commuter counseling from
CTRides, the NuRide commuter rewards program (a new survey choice in 2015), and
departmental Zipcar accounts remains below 30%.
The Yale community believes global warming is happening and is worried about it.
Among all employees and graduate students, 93% believe that global warming is at least
probably happening, and 75% believe it is definitely happening.
Forty-five percent are “very worried” about global warming and 44% are “somewhat
worried.”
3 Yale University 2015 Sustainable Transportation Survey Report
Methodology
Yale’s transportation survey was conducted primarily online, but was also distributed in paper
form to employees who do not have regular internet access at work. These employees received the
survey from their department supervisors. The survey asked faculty, staff, and graduate students
about the commute modes they used to get to campus the week of October 26 - 30, 2015. It was
three pages long with 22 questions, many of which were open-ended for individual responses.
Survey Process
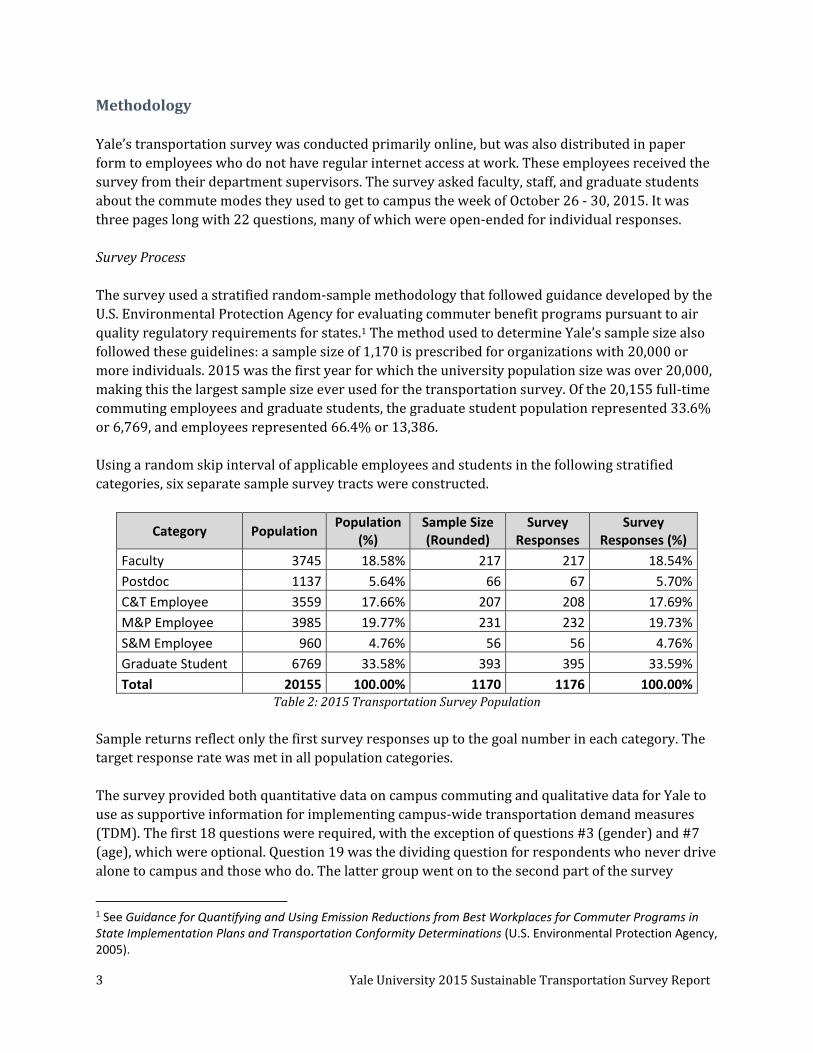
The survey used a stratified random-sample methodology that followed guidance developed by the
U.S. Environmental Protection Agency for evaluating commuter benefit programs pursuant to air
quality regulatory requirements for states.1 The method used to determine Yale’s sample size also
followed these guidelines: a sample size of 1,170 is prescribed for organizations with 20,000 or
more individuals. 2015 was the first year for which the university population size was over 20,000,
making this the largest sample size ever used for the transportation survey. Of the 20,155 full-time
commuting employees and graduate students, the graduate student population represented 33.6%
or 6,769, and employees represented 66.4% or 13,386.
Using a random skip interval of applicable employees and students in the following stratified
categories, six separate sample survey tracts were constructed.
Category Population Population
(%) Sample Size (Rounded)
Survey Responses
Survey Responses (%)
Faculty 3745 18.58% 217 217 18.54%
Postdoc 1137 5.64% 66 67 5.70%
C&T Employee 3559 17.66% 207 208 17.69%
M&P Employee 3985 19.77% 231 232 19.73%
S&M Employee 960 4.76% 56 56 4.76%
Graduate Student 6769 33.58% 393 395 33.59%
Total 20155 100.00% 1170 1176 100.00% Table 2: 2015 Transportation Survey Population
Sample returns reflect only the first survey responses up to the goal number in each category. The
target response rate was met in all population categories.
The survey provided both quantitative data on campus commuting and qualitative data for Yale to
use as supportive information for implementing campus-wide transportation demand measures
(TDM). The first 18 questions were required, with the exception of questions #3 (gender) and #7
(age), which were optional. Question 19 was the dividing question for respondents who never drive
alone to campus and those who do. The latter group went on to the second part of the survey
1 See Guidance for Quantifying and Using Emission Reductions from Best Workplaces for Commuter Programs in State Implementation Plans and Transportation Conformity Determinations (U.S. Environmental Protection Agency, 2005).
4 Yale University 2015 Sustainable Transportation Survey Report
expressly designed for collecting information about respondents in the sample who drive alone to
campus. Respondents who indicated that they never drive alone to campus ended the survey at
question 18.
In the combined employee and student results, 34% indicated they drive alone to campus five days
per week and 31% drive alone less often. Thirty-five percent indicated they never drive to campus.
Therefore, of the 1,170 total in the sample, only 761 respondents went on to the second part of the
survey. Since questions 19 through 22 were not required, not all respondents answered every
question. In addition, this section was designed for gathering opinions about possibilities for
changing commute behavior, so many of the questions allowed respondents to select multiple
answer choices.
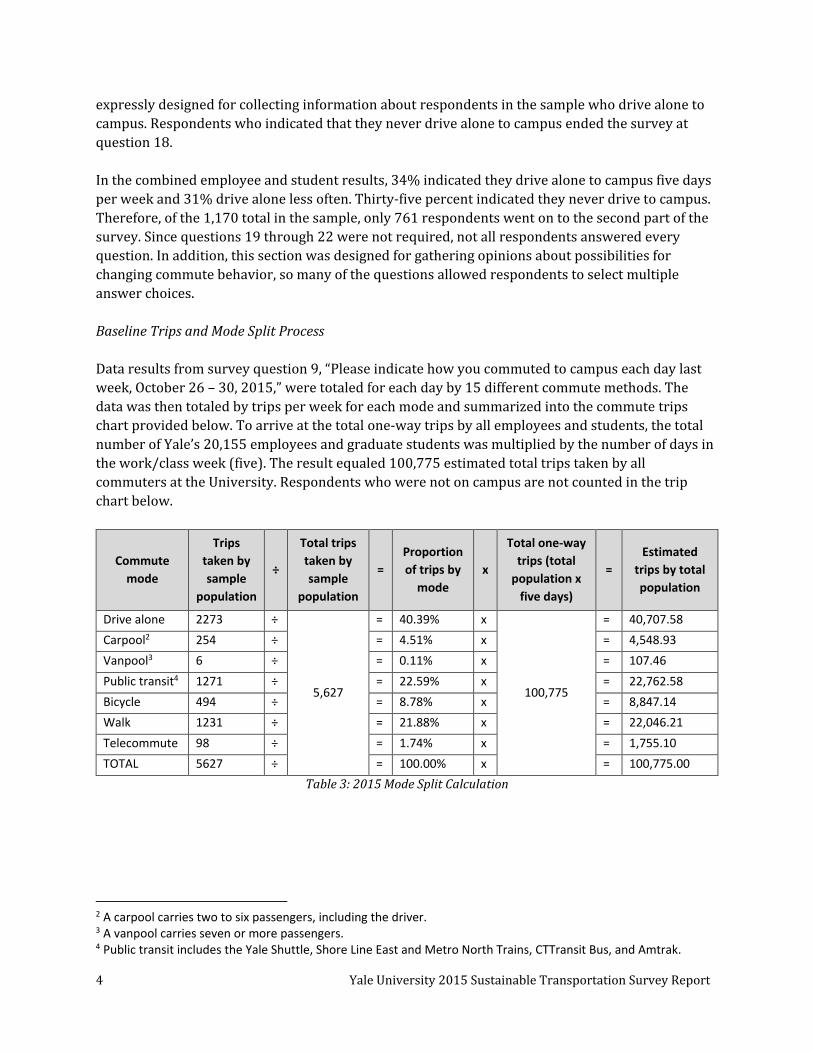
Baseline Trips and Mode Split Process
Data results from survey question 9, “Please indicate how you commuted to campus each day last
week, October 26 – 30, 2015,” were totaled for each day by 15 different commute methods. The
data was then totaled by trips per week for each mode and summarized into the commute trips
chart provided below. To arrive at the total one-way trips by all employees and students, the total
number of Yale’s 20,155 employees and graduate students was multiplied by the number of days in
the work/class week (five). The result equaled 100,775 estimated total trips taken by all
commuters at the University. Respondents who were not on campus are not counted in the trip
chart below.
Commute
mode
Trips
taken by
sample
population
÷
Total trips
taken by
sample
population
=
Proportion
of trips by
mode
x
Total one-way
trips (total
population x
five days)
=
Estimated
trips by total
population
Drive alone 2273 ÷
5,627
= 40.39% x
100,775
= 40,707.58
Carpool2 254 ÷ = 4.51% x = 4,548.93
Vanpool3 6 ÷ = 0.11% x = 107.46
Public transit4 1271 ÷ = 22.59% x = 22,762.58
Bicycle 494 ÷ = 8.78% x = 8,847.14
Walk 1231 ÷ = 21.88% x = 22,046.21
Telecommute 98 ÷ = 1.74% x = 1,755.10
TOTAL 5627 ÷ = 100.00% x = 100,775.00
Table 3: 2015 Mode Split Calculation
2 A carpool carries two to six passengers, including the driver. 3 A vanpool carries seven or more passengers. 4 Public transit includes the Yale Shuttle, Shore Line East and Metro North Trains, CTTransit Bus, and Amtrak.
5 Yale University 2015 Sustainable Transportation Survey Report
Commute Mode Split Trends
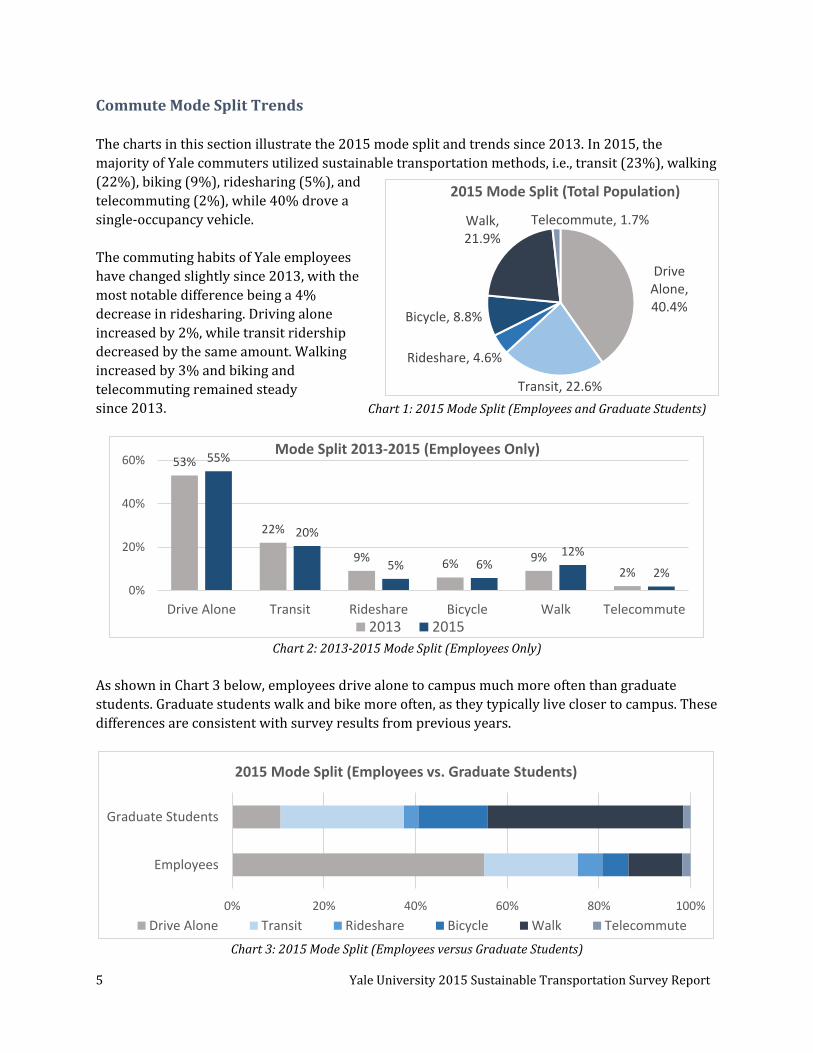
The charts in this section illustrate the 2015 mode split and trends since 2013. In 2015, the
majority of Yale commuters utilized sustainable transportation methods, i.e., transit (23%), walking
(22%), biking (9%), ridesharing (5%), and
telecommuting (2%), while 40% drove a
single-occupancy vehicle.
The commuting habits of Yale employees
have changed slightly since 2013, with the
most notable difference being a 4%
decrease in ridesharing. Driving alone
increased by 2%, while transit ridership
decreased by the same amount. Walking
increased by 3% and biking and
telecommuting remained steady
since 2013.
Chart 2: 2013-2015 Mode Split (Employees Only)
As shown in Chart 3 below, employees drive alone to campus much more often than graduate
students. Graduate students walk and bike more often, as they typically live closer to campus. These
differences are consistent with survey results from previous years.
Chart 3: 2015 Mode Split (Employees versus Graduate Students)
53%
22%
9% 6% 9%2%
55%
20%
5% 6%12%
2%
0%
20%
40%
60%
Drive Alone Transit Rideshare Bicycle Walk Telecommute
Mode Split 2013-2015 (Employees Only)
2013 2015
0% 20% 40% 60% 80% 100%
Employees
Graduate Students
2015 Mode Split (Employees vs. Graduate Students)
Drive Alone Transit Rideshare Bicycle Walk Telecommute
Chart 1: 2015 Mode Split (Employees and Graduate Students)
Drive Alone, 40.4%
Transit, 22.6%
Rideshare, 4.6%
Bicycle, 8.8%
Walk, 21.9%
Telecommute, 1.7%
2015 Mode Split (Total Population)
6 Yale University 2015 Sustainable Transportation Survey Report
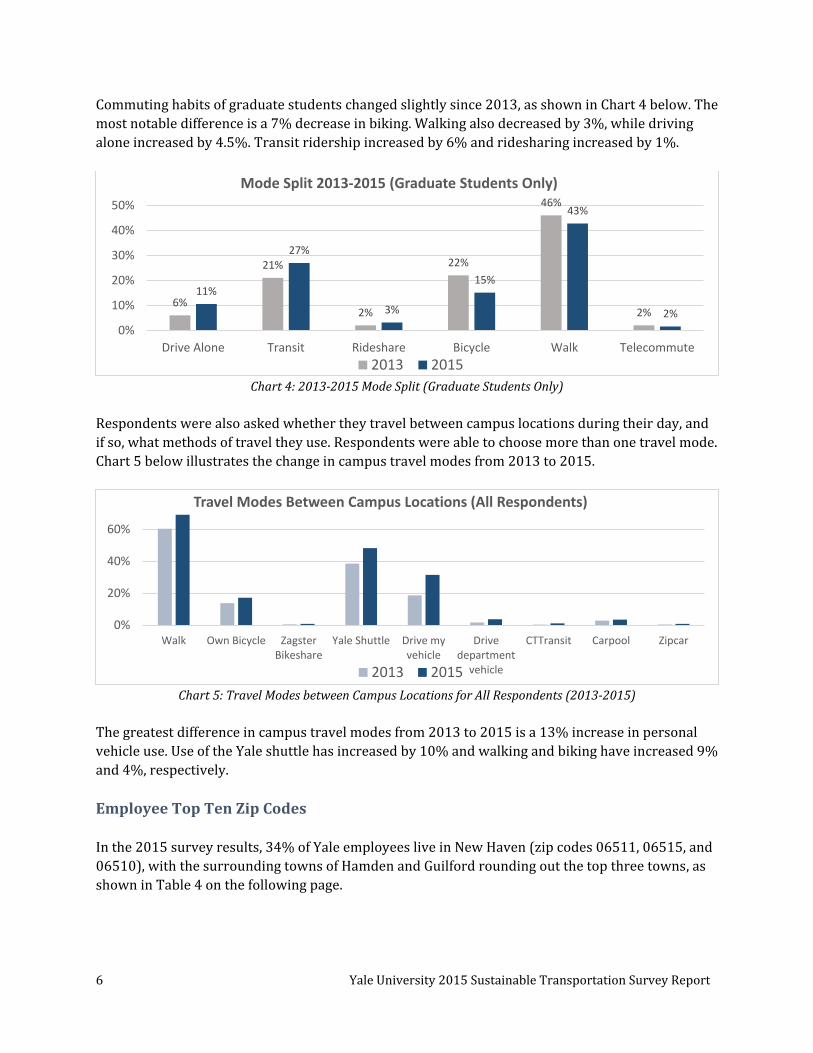
Commuting habits of graduate students changed slightly since 2013, as shown in Chart 4 below. The
most notable difference is a 7% decrease in biking. Walking also decreased by 3%, while driving
alone increased by 4.5%. Transit ridership increased by 6% and ridesharing increased by 1%.
Chart 4: 2013-2015 Mode Split (Graduate Students Only)
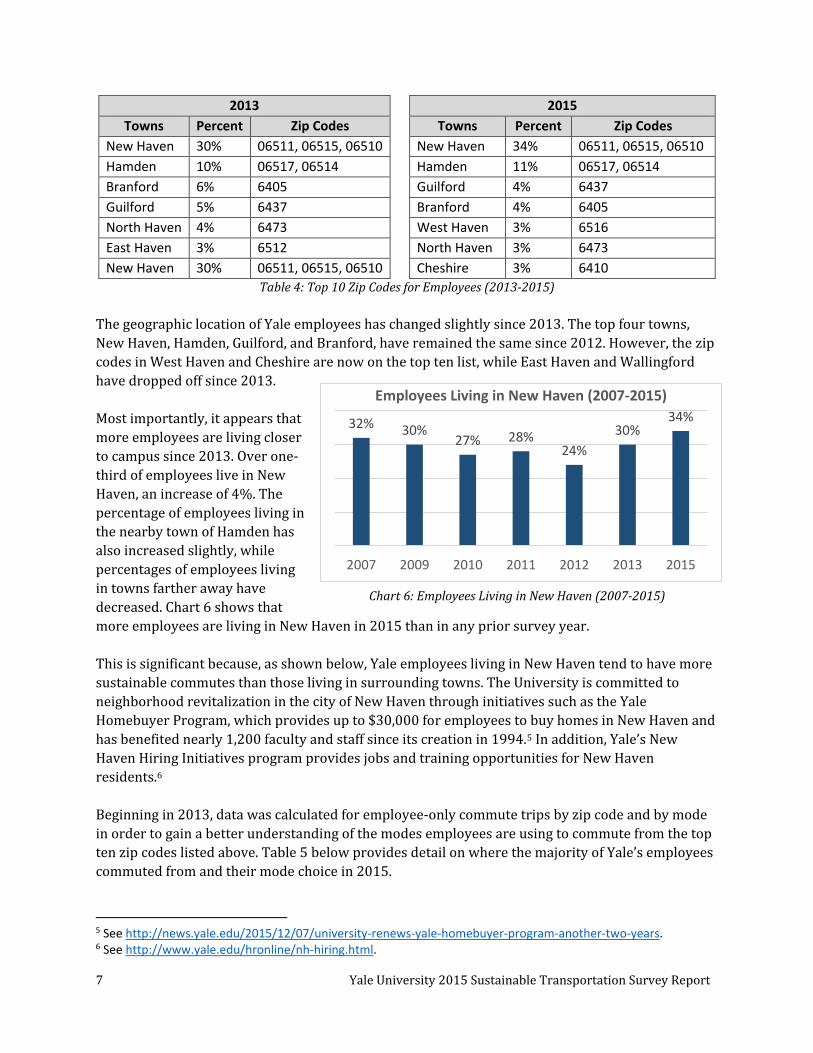
Respondents were also asked whether they travel between campus locations during their day, and
if so, what methods of travel they use. Respondents were able to choose more than one travel mode.
Chart 5 below illustrates the change in campus travel modes from 2013 to 2015.
Chart 5: Travel Modes between Campus Locations for All Respondents (2013-2015)
The greatest difference in campus travel modes from 2013 to 2015 is a 13% increase in personal
vehicle use. Use of the Yale shuttle has increased by 10% and walking and biking have increased 9%
and 4%, respectively.
Employee Top Ten Zip Codes
In the 2015 survey results, 34% of Yale employees live in New Haven (zip codes 06511, 06515, and
06510), with the surrounding towns of Hamden and Guilford rounding out the top three towns, as
shown in Table 4 on the following page.
6%
21%
2%
22%
46%
2%
11%
27%
3%
15%
43%
2%
0%
10%
20%
30%
40%
50%
Drive Alone Transit Rideshare Bicycle Walk Telecommute
Mode Split 2013-2015 (Graduate Students Only)
2013 2015
0%
20%
40%
60%
Walk Own Bicycle ZagsterBikeshare
Yale Shuttle Drive myvehicle
Drivedepartment
vehicle
CTTransit Carpool Zipcar
Travel Modes Between Campus Locations (All Respondents)
2013 2015
7 Yale University 2015 Sustainable Transportation Survey Report
2013 2015
Towns Percent Zip Codes Towns Percent Zip Codes
New Haven 30% 06511, 06515, 06510 New Haven 34% 06511, 06515, 06510
Hamden 10% 06517, 06514 Hamden 11% 06517, 06514
Branford 6% 6405 Guilford 4% 6437
Guilford 5% 6437 Branford 4% 6405
North Haven 4% 6473 West Haven 3% 6516
East Haven 3% 6512 North Haven 3% 6473
New Haven 30% 06511, 06515, 06510 Cheshire 3% 6410
Table 4: Top 10 Zip Codes for Employees (2013-2015)
The geographic location of Yale employees has changed slightly since 2013. The top four towns,
New Haven, Hamden, Guilford, and Branford, have remained the same since 2012. However, the zip
codes in West Haven and Cheshire are now on the top ten list, while East Haven and Wallingford
have dropped off since 2013.
Most importantly, it appears that
more employees are living closer
to campus since 2013. Over one-
third of employees live in New
Haven, an increase of 4%. The
percentage of employees living in
the nearby town of Hamden has
also increased slightly, while
percentages of employees living
in towns farther away have
decreased. Chart 6 shows that
more employees are living in New Haven in 2015 than in any prior survey year.
This is significant because, as shown below, Yale employees living in New Haven tend to have more
sustainable commutes than those living in surrounding towns. The University is committed to
neighborhood revitalization in the city of New Haven through initiatives such as the Yale
Homebuyer Program, which provides up to $30,000 for employees to buy homes in New Haven and
has benefited nearly 1,200 faculty and staff since its creation in 1994.5 In addition, Yale’s New
Haven Hiring Initiatives program provides jobs and training opportunities for New Haven
residents.6
Beginning in 2013, data was calculated for employee-only commute trips by zip code and by mode
in order to gain a better understanding of the modes employees are using to commute from the top
ten zip codes listed above. Table 5 below provides detail on where the majority of Yale’s employees
commuted from and their mode choice in 2015.
5 See http://news.yale.edu/2015/12/07/university-renews-yale-homebuyer-program-another-two-years. 6 See http://www.yale.edu/hronline/nh-hiring.html.
32% 30%27% 28%
24%
30%34%
2007 2009 2010 2011 2012 2013 2015
Employees Living in New Haven (2007-2015)
Chart 6: Employees Living in New Haven (2007-2015)
8 Yale University 2015 Sustainable Transportation Survey Report
Zip Code Town Percent of
Employees
Drive
Alone Transit Bike Walk Rideshare Other7 Total
06511 New Haven 26% 14% 31% 14% 34% 3% 4% 100%
06517 Hamden 8% 66% 13% 8% 0% 7% 6% 100%
06515 New Haven 5% 54% 19% 11% 2% 12% 3% 100%
06437 Guilford 4% 63% 20% 0% 0% 12% 5% 100%
06405 Branford 4% 70% 27% 0% 0% 0% 3% 100%
06514 Hamden 4% 81% 13% 4% 0% 0% 3% 100%
06516 West Haven 3% 68% 18% 0% 0% 12% 2% 100%
06473 North Haven 3% 83% 13% 0% 0% 3% 3% 100%
06410 Cheshire 3% 75% 10% 0% 0% 5% 10% 100%
06510 New Haven 3% 5% 16% 8% 66% 2% 2% 100%
Table 5: Commute Mode Split for Top 10 Employee Zip Codes (2015)
As expected, the drive alone rates for employees living in New Haven are much lower than those for
surrounding towns, with 24% on average across all three New Haven zip codes as compared to
72% on average from the other top zip codes.
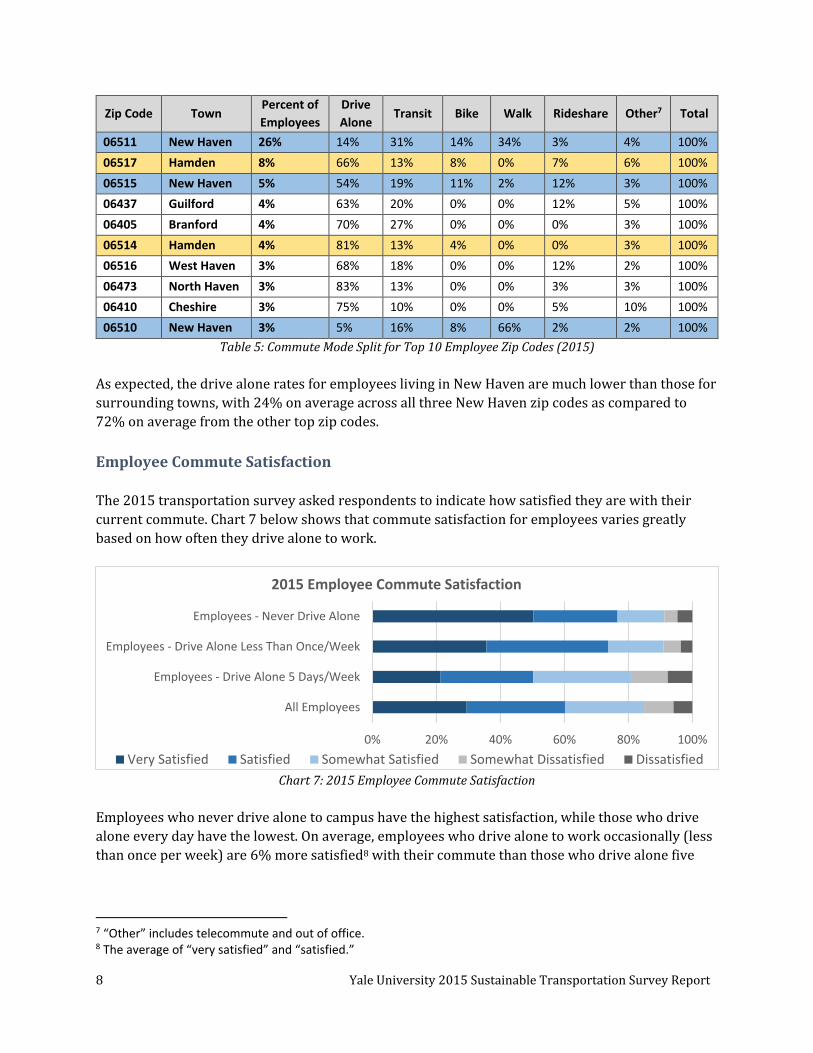
Employee Commute Satisfaction
The 2015 transportation survey asked respondents to indicate how satisfied they are with their
current commute. Chart 7 below shows that commute satisfaction for employees varies greatly
based on how often they drive alone to work.
Chart 7: 2015 Employee Commute Satisfaction
Employees who never drive alone to campus have the highest satisfaction, while those who drive
alone every day have the lowest. On average, employees who drive alone to work occasionally (less
than once per week) are 6% more satisfied8 with their commute than those who drive alone five
7 “Other” includes telecommute and out of office. 8 The average of “very satisfied” and “satisfied.”
0% 20% 40% 60% 80% 100%
All Employees
Employees - Drive Alone 5 Days/Week
Employees - Drive Alone Less Than Once/Week
Employees - Never Drive Alone
2015 Employee Commute Satisfaction
Very Satisfied Satisfied Somewhat Satisfied Somewhat Dissatisfied Dissatisfied
9 Yale University 2015 Sustainable Transportation Survey Report
days per week. This trend is not unique to the Yale community – in general, drivers tend to be less
satisfied with their commute than those who use other modes.9
Public Transit Mode Comparison
Overall transit ridership by employees decreased slightly from 22% in 2013 to 20% in 2015.
However, 10% of all employees use the Yale Shuttle as their primary commute mode, compared to
8% in 2013.
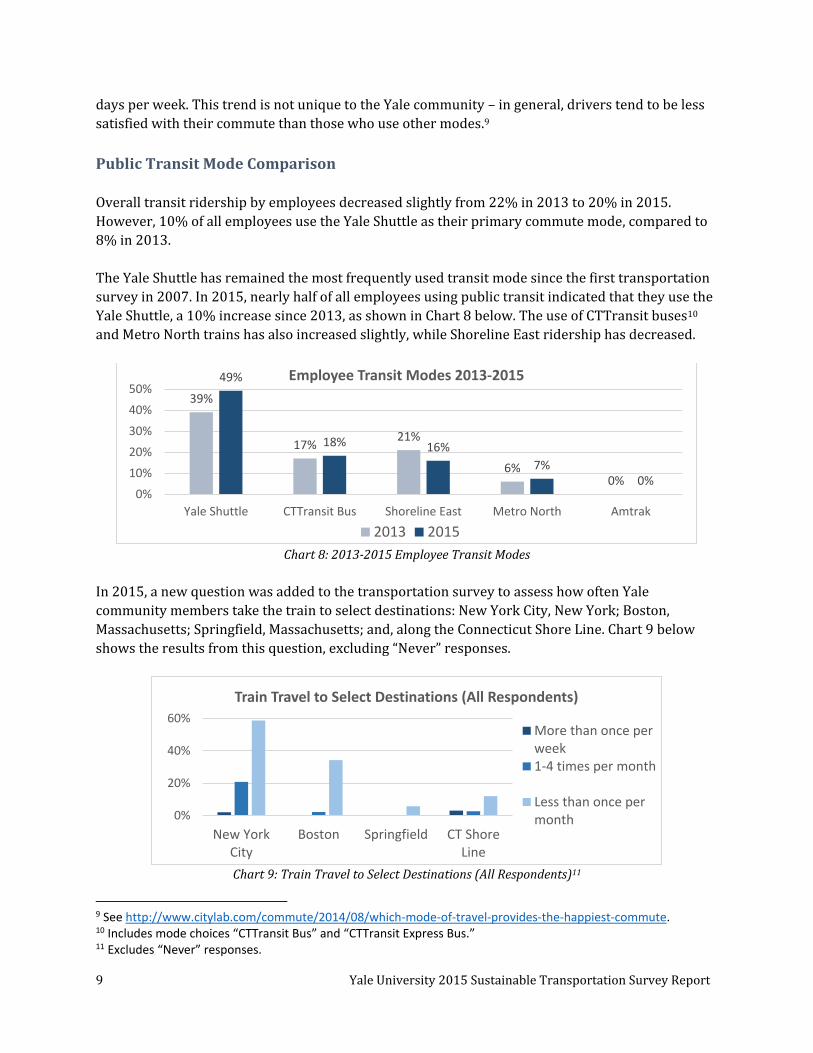
The Yale Shuttle has remained the most frequently used transit mode since the first transportation
survey in 2007. In 2015, nearly half of all employees using public transit indicated that they use the
Yale Shuttle, a 10% increase since 2013, as shown in Chart 8 below. The use of CTTransit buses10
and Metro North trains has also increased slightly, while Shoreline East ridership has decreased.
Chart 8: 2013-2015 Employee Transit Modes
In 2015, a new question was added to the transportation survey to assess how often Yale
community members take the train to select destinations: New York City, New York; Boston,
Massachusetts; Springfield, Massachusetts; and, along the Connecticut Shore Line. Chart 9 below
shows the results from this question, excluding “Never” responses.
Chart 9: Train Travel to Select Destinations (All Respondents)11
9 See http://www.citylab.com/commute/2014/08/which-mode-of-travel-provides-the-happiest-commute. 10 Includes mode choices “CTTransit Bus” and “CTTransit Express Bus.” 11 Excludes “Never” responses.
39%
17%21%
6%0%
49%
18% 16%
7%0%
0%
10%
20%
30%
40%
50%
Yale Shuttle CTTransit Bus Shoreline East Metro North Amtrak
Employee Transit Modes 2013-2015
2013 2015
0%
20%
40%
60%
New YorkCity
Boston Springfield CT ShoreLine
Train Travel to Select Destinations (All Respondents)
More than once perweek1-4 times per month
Less than once permonth
10 Yale University 2015 Sustainable Transportation Survey Report
New York City is the most popular destination, with nearly a quarter of all survey respondents
traveling there via train at least once per month. Springfield is the least popular, with 94% of
respondents indicating they never travel there via train.
Incentives to Stop Driving Alone to Campus
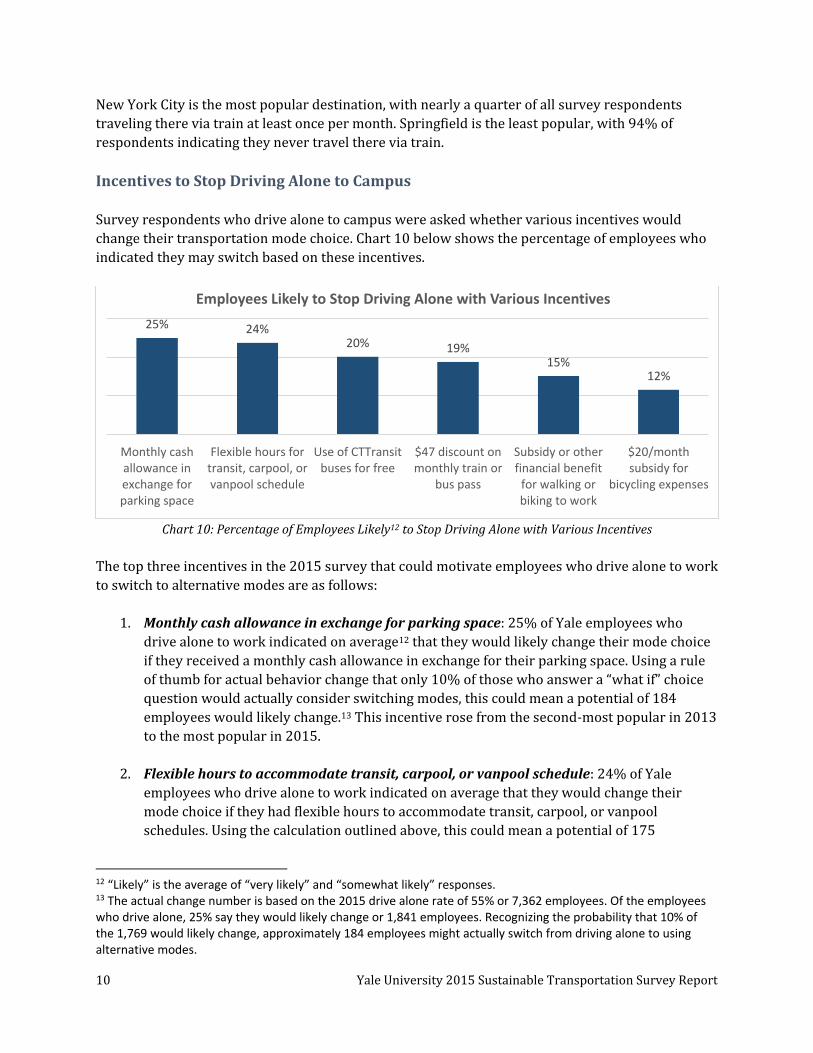
Survey respondents who drive alone to campus were asked whether various incentives would
change their transportation mode choice. Chart 10 below shows the percentage of employees who
indicated they may switch based on these incentives.
Chart 10: Percentage of Employees Likely12 to Stop Driving Alone with Various Incentives
The top three incentives in the 2015 survey that could motivate employees who drive alone to work
to switch to alternative modes are as follows:
1. Monthly cash allowance in exchange for parking space: 25% of Yale employees who
drive alone to work indicated on average12 that they would likely change their mode choice
if they received a monthly cash allowance in exchange for their parking space. Using a rule
of thumb for actual behavior change that only 10% of those who answer a “what if” choice
question would actually consider switching modes, this could mean a potential of 184
employees would likely change.13 This incentive rose from the second-most popular in 2013
to the most popular in 2015.
2. Flexible hours to accommodate transit, carpool, or vanpool schedule: 24% of Yale
employees who drive alone to work indicated on average that they would change their
mode choice if they had flexible hours to accommodate transit, carpool, or vanpool
schedules. Using the calculation outlined above, this could mean a potential of 175
12 “Likely” is the average of “very likely” and “somewhat likely” responses. 13 The actual change number is based on the 2015 drive alone rate of 55% or 7,362 employees. Of the employees who drive alone, 25% say they would likely change or 1,841 employees. Recognizing the probability that 10% of the 1,769 would likely change, approximately 184 employees might actually switch from driving alone to using alternative modes.
25% 24%20% 19%
15%12%
Monthly cashallowance inexchange forparking space
Flexible hours fortransit, carpool, orvanpool schedule
Use of CTTransitbuses for free
$47 discount onmonthly train or
bus pass
Subsidy or otherfinancial benefit
for walking orbiking to work
$20/monthsubsidy for
bicycling expenses
Employees Likely to Stop Driving Alone with Various Incentives
11 Yale University 2015 Sustainable Transportation Survey Report
employees who would likely change. Interest in this incentive decreased slightly since 2013,
when it was the most popular choice.
3. Use of CTTransit buses for free: 20% of Yale employees who drive alone to work indicated
on average that they would change their mode choice if they were able to use CTTransit
buses for free, resulting in a potential 148 who would likely change. Interest in this
incentive increased slightly since 2013, replacing “a $47 discount on monthly train or bus
pass” as the third-most popular choice.
Yale University can use this data to assess different ways to decrease the drive alone rate for
employees and either create new programs or expand education and outreach on existing ones. For
example, the University already offers resources for employees and their supervisors to propose
flexible scheduling.14
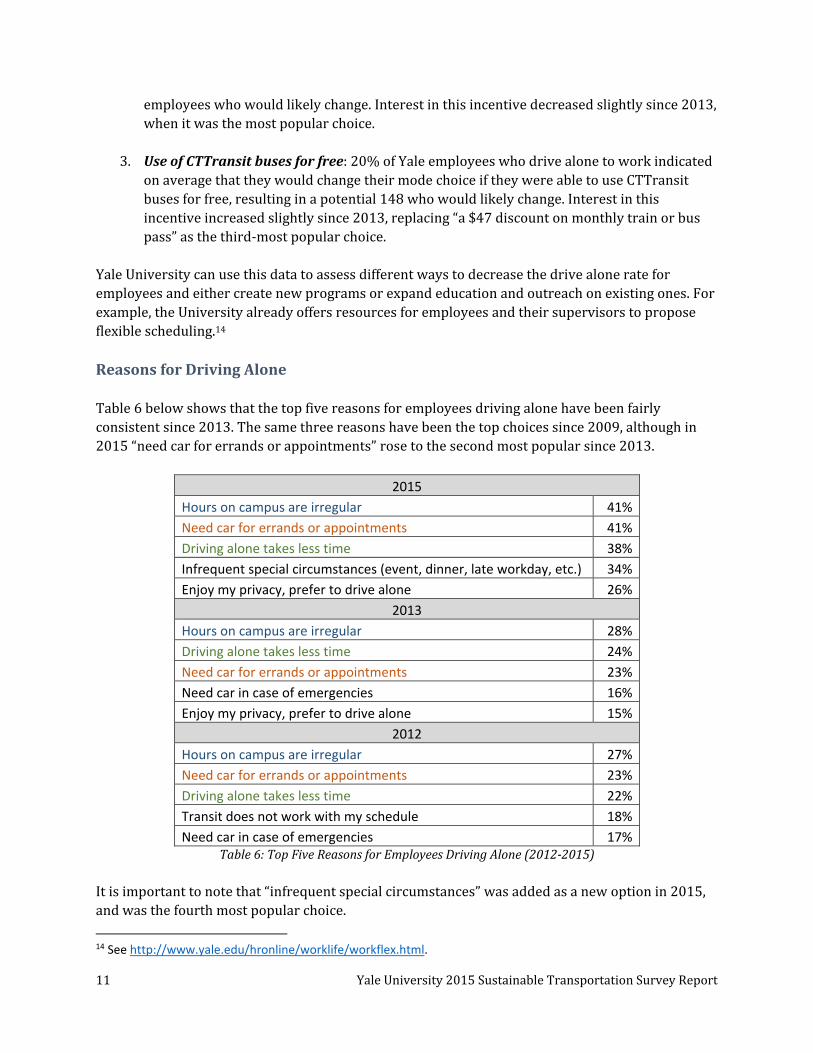
Reasons for Driving Alone
Table 6 below shows that the top five reasons for employees driving alone have been fairly
consistent since 2013. The same three reasons have been the top choices since 2009, although in
2015 “need car for errands or appointments” rose to the second most popular since 2013.
2015
Hours on campus are irregular 41%
Need car for errands or appointments 41%
Driving alone takes less time 38%
Infrequent special circumstances (event, dinner, late workday, etc.) 34%
Enjoy my privacy, prefer to drive alone 26%
2013
Hours on campus are irregular 28%
Driving alone takes less time 24%
Need car for errands or appointments 23%
Need car in case of emergencies 16%
Enjoy my privacy, prefer to drive alone 15%
2012
Hours on campus are irregular 27%
Need car for errands or appointments 23%
Driving alone takes less time 22%
Transit does not work with my schedule 18%
Need car in case of emergencies 17% Table 6: Top Five Reasons for Employees Driving Alone (2012-2015)
It is important to note that “infrequent special circumstances” was added as a new option in 2015,
and was the fourth most popular choice.
14 See http://www.yale.edu/hronline/worklife/workflex.html.
12 Yale University 2015 Sustainable Transportation Survey Report
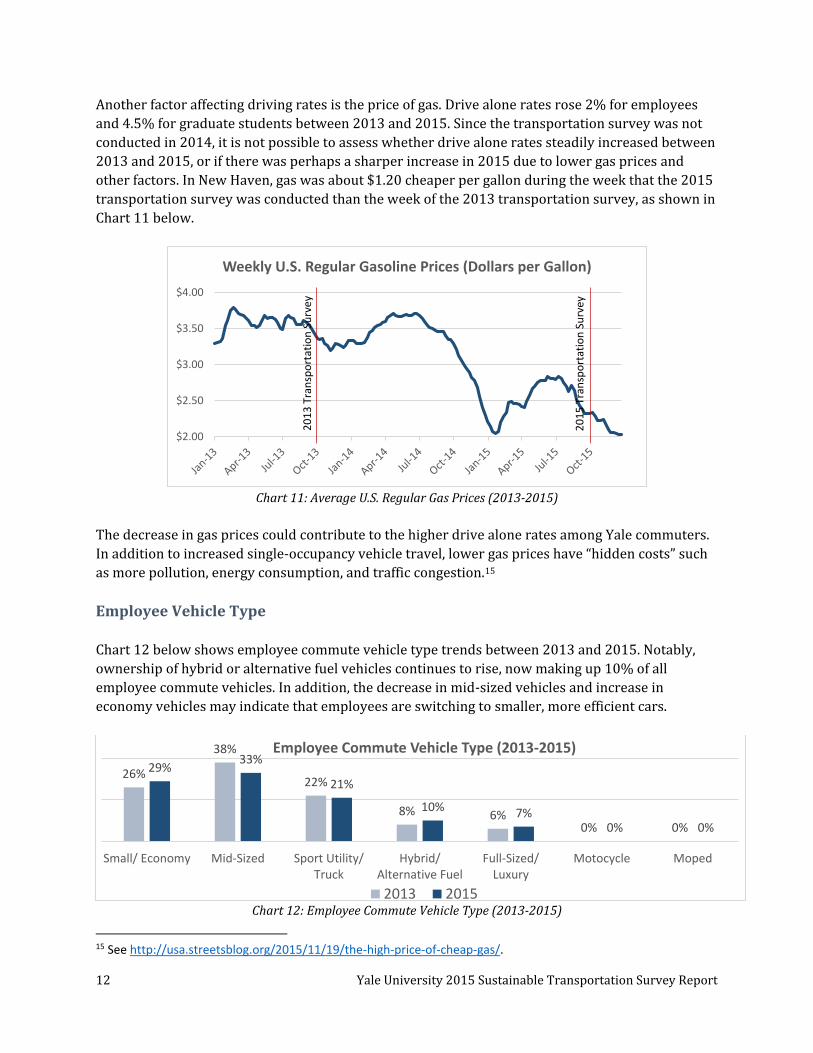
Another factor affecting driving rates is the price of gas. Drive alone rates rose 2% for employees
and 4.5% for graduate students between 2013 and 2015. Since the transportation survey was not
conducted in 2014, it is not possible to assess whether drive alone rates steadily increased between
2013 and 2015, or if there was perhaps a sharper increase in 2015 due to lower gas prices and
other factors. In New Haven, gas was about $1.20 cheaper per gallon during the week that the 2015
transportation survey was conducted than the week of the 2013 transportation survey, as shown in
Chart 11 below.
Chart 11: Average U.S. Regular Gas Prices (2013-2015)
The decrease in gas prices could contribute to the higher drive alone rates among Yale commuters.
In addition to increased single-occupancy vehicle travel, lower gas prices have “hidden costs” such
as more pollution, energy consumption, and traffic congestion.15
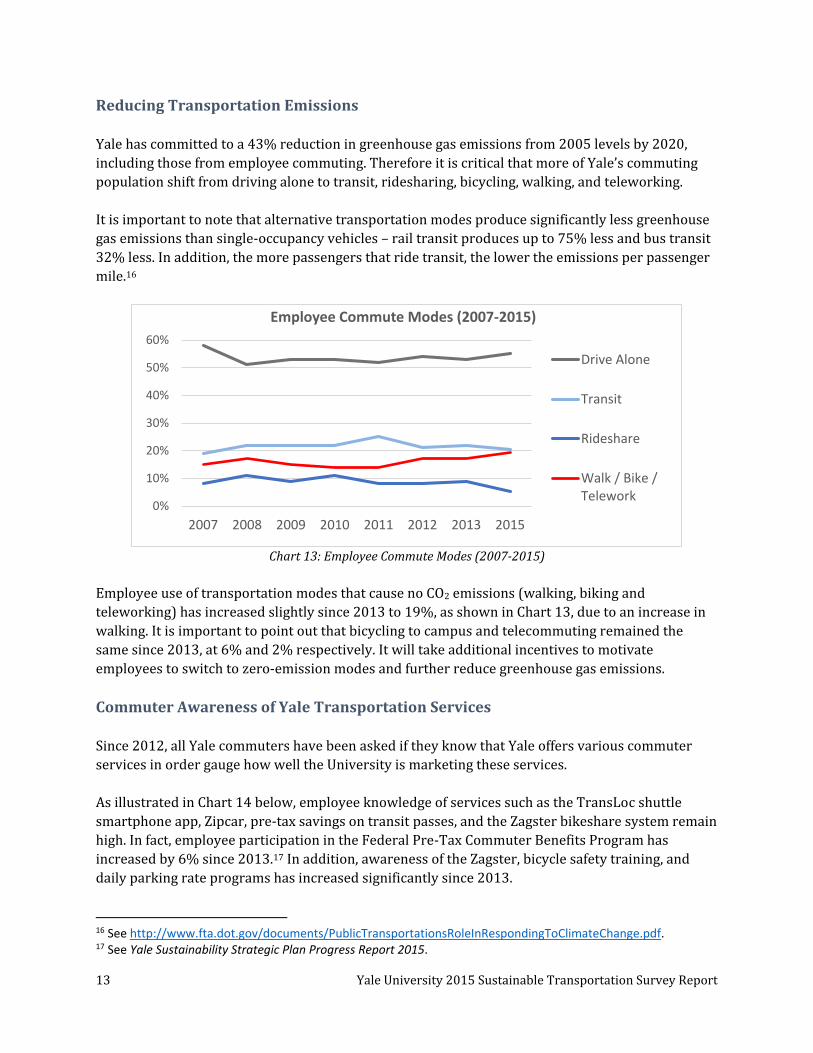
Employee Vehicle Type
Chart 12 below shows employee commute vehicle type trends between 2013 and 2015. Notably,
ownership of hybrid or alternative fuel vehicles continues to rise, now making up 10% of all
employee commute vehicles. In addition, the decrease in mid-sized vehicles and increase in
economy vehicles may indicate that employees are switching to smaller, more efficient cars.
Chart 12: Employee Commute Vehicle Type (2013-2015)
15 See http://usa.streetsblog.org/2015/11/19/the-high-price-of-cheap-gas/.
$2.00
$2.50
$3.00
$3.50
$4.00
Weekly U.S. Regular Gasoline Prices (Dollars per Gallon)
26%
38%
22%
8% 6%0% 0%
29%33%
21%
10% 7%0% 0%
Small/ Economy Mid-Sized Sport Utility/Truck
Hybrid/Alternative Fuel
Full-Sized/Luxury
Motocycle Moped
Employee Commute Vehicle Type (2013-2015)
2013 2015
20
13
Tra
nsp
ort
atio
n S
urv
ey
20
15
Tra
nsp
ort
atio
n S
urv
ey
13 Yale University 2015 Sustainable Transportation Survey Report
Reducing Transportation Emissions
Yale has committed to a 43% reduction in greenhouse gas emissions from 2005 levels by 2020,
including those from employee commuting. Therefore it is critical that more of Yale’s commuting
population shift from driving alone to transit, ridesharing, bicycling, walking, and teleworking.
It is important to note that alternative transportation modes produce significantly less greenhouse
gas emissions than single-occupancy vehicles – rail transit produces up to 75% less and bus transit
32% less. In addition, the more passengers that ride transit, the lower the emissions per passenger
mile.16
Chart 13: Employee Commute Modes (2007-2015)
Employee use of transportation modes that cause no CO2 emissions (walking, biking and
teleworking) has increased slightly since 2013 to 19%, as shown in Chart 13, due to an increase in
walking. It is important to point out that bicycling to campus and telecommuting remained the
same since 2013, at 6% and 2% respectively. It will take additional incentives to motivate
employees to switch to zero-emission modes and further reduce greenhouse gas emissions.
Commuter Awareness of Yale Transportation Services
Since 2012, all Yale commuters have been asked if they know that Yale offers various commuter
services in order gauge how well the University is marketing these services.
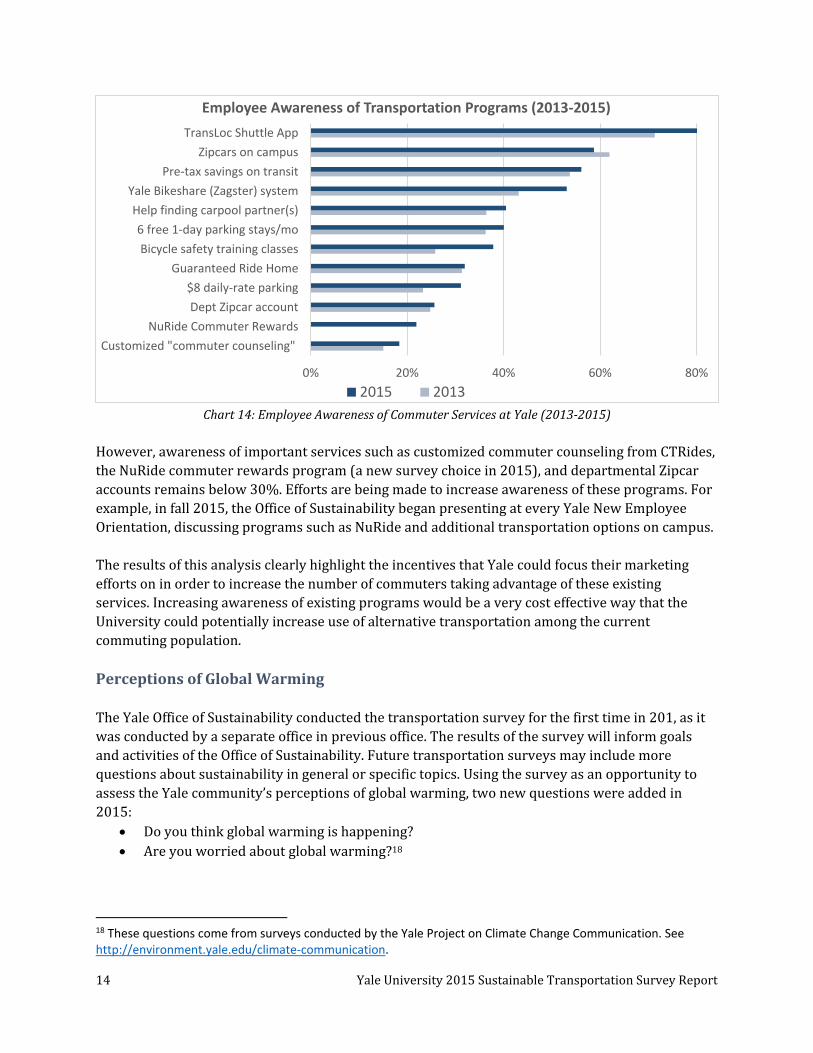
As illustrated in Chart 14 below, employee knowledge of services such as the TransLoc shuttle
smartphone app, Zipcar, pre-tax savings on transit passes, and the Zagster bikeshare system remain
high. In fact, employee participation in the Federal Pre-Tax Commuter Benefits Program has
increased by 6% since 2013.17 In addition, awareness of the Zagster, bicycle safety training, and
daily parking rate programs has increased significantly since 2013.
16 See http://www.fta.dot.gov/documents/PublicTransportationsRoleInRespondingToClimateChange.pdf. 17 See Yale Sustainability Strategic Plan Progress Report 2015.
0%
10%
20%
30%
40%
50%
60%
2007 2008 2009 2010 2011 2012 2013 2015
Employee Commute Modes (2007-2015)
Drive Alone
Transit
Rideshare
Walk / Bike /Telework
14 Yale University 2015 Sustainable Transportation Survey Report
Chart 14: Employee Awareness of Commuter Services at Yale (2013-2015)
However, awareness of important services such as customized commuter counseling from CTRides,
the NuRide commuter rewards program (a new survey choice in 2015), and departmental Zipcar
accounts remains below 30%. Efforts are being made to increase awareness of these programs. For
example, in fall 2015, the Office of Sustainability began presenting at every Yale New Employee
Orientation, discussing programs such as NuRide and additional transportation options on campus.
The results of this analysis clearly highlight the incentives that Yale could focus their marketing
efforts on in order to increase the number of commuters taking advantage of these existing
services. Increasing awareness of existing programs would be a very cost effective way that the
University could potentially increase use of alternative transportation among the current
commuting population.
Perceptions of Global Warming
The Yale Office of Sustainability conducted the transportation survey for the first time in 201, as it
was conducted by a separate office in previous office. The results of the survey will inform goals
and activities of the Office of Sustainability. Future transportation surveys may include more
questions about sustainability in general or specific topics. Using the survey as an opportunity to
assess the Yale community’s perceptions of global warming, two new questions were added in
2015:
Do you think global warming is happening?
Are you worried about global warming?18
18 These questions come from surveys conducted by the Yale Project on Climate Change Communication. See http://environment.yale.edu/climate-communication.
0% 20% 40% 60% 80%
Customized "commuter counseling"
NuRide Commuter Rewards
Dept Zipcar account
$8 daily-rate parking
Guaranteed Ride Home
Bicycle safety training classes
6 free 1-day parking stays/mo
Help finding carpool partner(s)
Yale Bikeshare (Zagster) system
Pre-tax savings on transit
Zipcars on campus
TransLoc Shuttle App
Employee Awareness of Transportation Programs (2013-2015)
2015 2013
15 Yale University 2015 Sustainable Transportation Survey Report
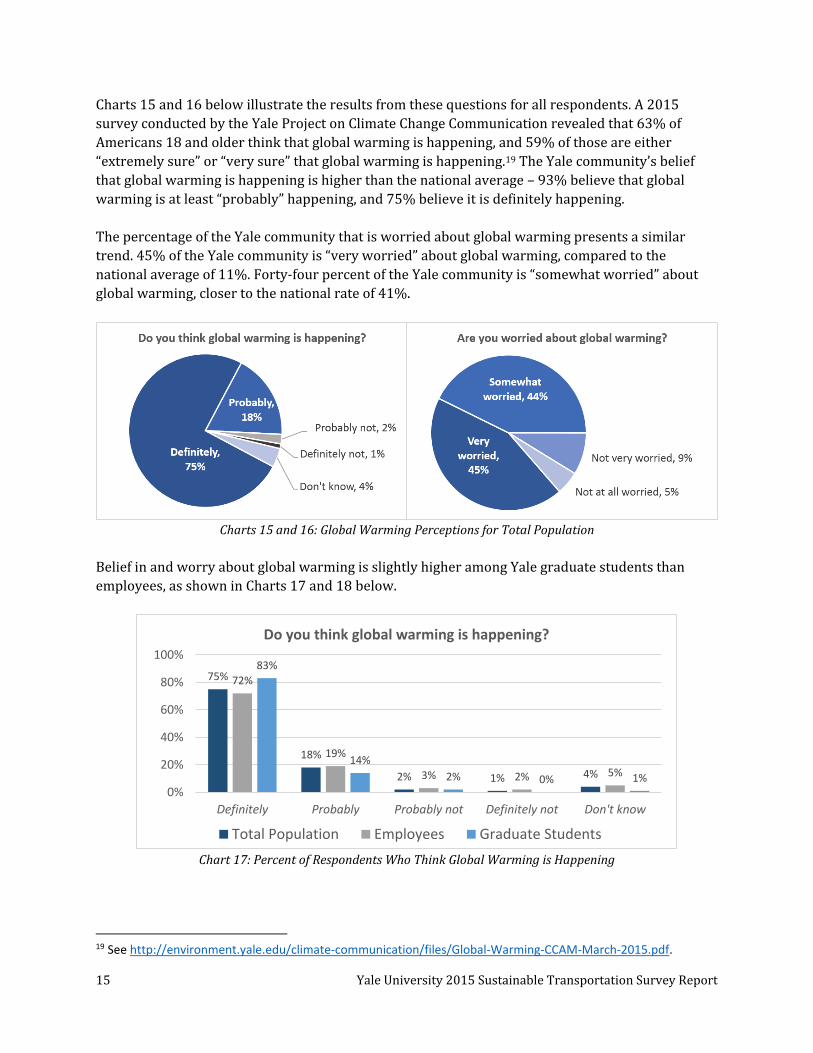
Charts 15 and 16 below illustrate the results from these questions for all respondents. A 2015
survey conducted by the Yale Project on Climate Change Communication revealed that 63% of
Americans 18 and older think that global warming is happening, and 59% of those are either
“extremely sure” or “very sure” that global warming is happening.19 The Yale community’s belief
that global warming is happening is higher than the national average – 93% believe that global
warming is at least “probably” happening, and 75% believe it is definitely happening.
The percentage of the Yale community that is worried about global warming presents a similar
trend. 45% of the Yale community is “very worried” about global warming, compared to the
national average of 11%. Forty-four percent of the Yale community is “somewhat worried” about
global warming, closer to the national rate of 41%.
Charts 15 and 16: Global Warming Perceptions for Total Population
Belief in and worry about global warming is slightly higher among Yale graduate students than
employees, as shown in Charts 17 and 18 below.
Chart 17: Percent of Respondents Who Think Global Warming is Happening
19 See http://environment.yale.edu/climate-communication/files/Global-Warming-CCAM-March-2015.pdf.
75%
18%
2% 1% 4%
72%
19%
3% 2% 5%
83%
14%
2% 0% 1%0%
20%
40%
60%
80%
100%
Definitely Probably Probably not Definitely not Don't know
Do you think global warming is happening?
Total Population Employees Graduate Students
16 Yale University 2015 Sustainable Transportation Survey Report
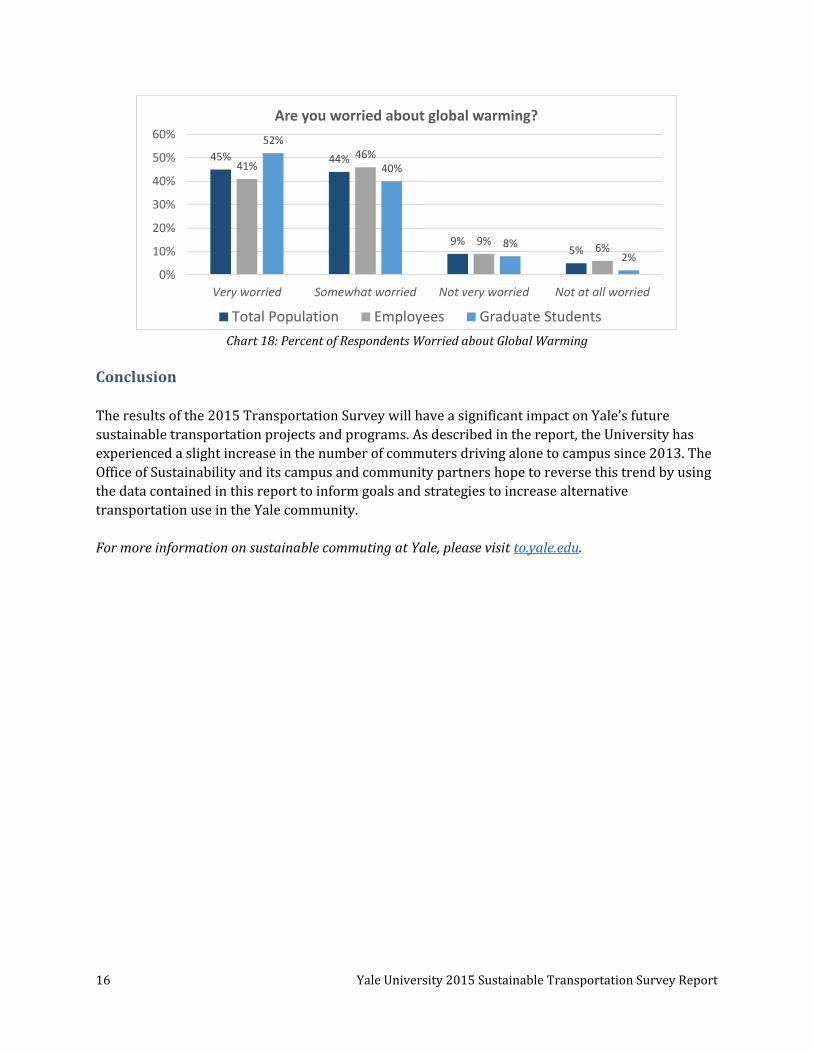
Chart 18: Percent of Respondents Worried about Global Warming
Conclusion
The results of the 2015 Transportation Survey will have a significant impact on Yale’s future
sustainable transportation projects and programs. As described in the report, the University has
experienced a slight increase in the number of commuters driving alone to campus since 2013. The
Office of Sustainability and its campus and community partners hope to reverse this trend by using
the data contained in this report to inform goals and strategies to increase alternative
transportation use in the Yale community.
For more information on sustainable commuting at Yale, please visit to.yale.edu.
45% 44%
9%5%
41%46%
9%6%
52%
40%
8%2%
0%
10%
20%
30%
40%
50%
60%
Very worried Somewhat worried Not very worried Not at all worried
Are you worried about global warming?
Total Population Employees Graduate Students