Xtra slides B&W
18
High Yield Relationships—Slide # 1 Q = P R CO = HR X SV C = P V C SV PP = R ∝ L r 4 T ∝ Pr (LaPlace) Pulse pressure (PP) = systolic - diastolic P ∝ R MAP = 1/3 PP + diastolic pressure Velocity = Q/CSA P = height X density X gravity Uptake of O 2 A – V O 2 difference Flow = MAP = CO X TPR Reynold’s # = (velocity) (diameter) (density) / viscosity EF = SV/EDV X 100 Cardiac Index = CO/ body surface area (BSA)
-
Upload
vishala-mishra -
Category
Documents
-
view
43 -
download
18
description
Slides
Transcript of Xtra slides B&W

High Yield Relationships—Slide # 1
Q =PR CO = HR X SV C =
PV
CSV
PP =R ∝
Lr4
T ∝ Pr (LaPlace)
Pulse pressure (PP) = systolic - diastolic
P ∝ R
MAP = 1/3 PP + diastolic pressure
Velocity = Q/CSAP = height X density X gravity
Uptake of O2
A – V O2 difference Flow =
MAP = CO X TPR
Reynold’s # = (velocity) (diameter) (density) / viscosity
EF = SV/EDV X 100
Cardiac Index = CO/ body surface area (BSA)

MAP = CO X TPR
4 factors determine
1. HR ( CO exercise; CO with tachyarrhythmias)
2. Contractility (direct)
3. Afterload (inverse)
4. Preload (direct)
Directly related to venous return
• Blood volume (direct)
• Venous compliance (inverse)
Tone of arterioles
• Sympathetic (alpha)
• AII
• AVP
• Epi (alpha/beta-2)
• Metabolism
• NO
• Pharm integration
Whole Body CV Regulation—Slide # 2

Anti-hypertensive drugs
Short/Long Term MAP Reg—Slide # 3
Mean Arterial Pressure
Inhibits Stimulates
Baroreceptor activity
Sympathetic activity
Contractility
TPRCardiac output
Heart rate
Veno-
constriction
Stroke volumePreload
M2
Parasympathetic activity
Urine volume
Blood volume
Renin
A II
VR
VRF-S
Aldo
Shock
Autonomic drugs

100 150
40
80
120
50
Pres
sure
(mm
Hg)
Volume (ml)
Passive tension
PV Loops: Systolic/Diastolic Dysfunction Systolic dysfunction:
decreased contractility results in elevated volumes
Diastolic dysfunction: decreased compliance
causes increased pressure
Slide #4

Pg 143
IPP—Pulmonary Blood Flow—Slide # 5Inspiration
PTM = 0 – -5 = 5
Becomes more
negative
RA in chest expands pressure so Q (VR)
Increased output delays closing of pulmonic valve
(physiologic splitting of S2)
PTM for pulmonary
vessels; their volume increases
Increases pulmonary vascular resistance
Flow to LH
MAP = CO X TPR
Inspiration decreases vagal outflow to the heart, thus HR increases (respiratory sinus arrhythmia)
Veins here are unaffected

Differential for Causes of Hypoxemia—Slide # 6
Low PaO2(hypoxemia)
A – a gradient
FIO2 corrects
PaCO2 likely elevated
Normal
Cause is PAO2
Elevated
Increase FIO2
Doesn’t correct PaO2
Cause is right-to-left shunts
Corrects PaO2
VA/Q mismatch
Diffusion impairment
PAO2: calculate using alveolar air equation or
use end-tidal PO2

Relationships/Equations for Renal—Slide # 7
GFR RPF
FF =
FF impacts Pc!!!Filtered load = GFR X PX
Rate of excretion = UX X V
Transport = excretion – filtered load
Renal clearance =
UX X V
PX
UPAH X V CPAH =
PPAH
ERPF =
Renal blood flow =1- HctERPF

Factors Affecting GFR and FF—Slide # 8
Glomerular cap
pressure
Peritubular cap
pressure
Nephron plasma
flow
GFR FF
Constrict efferent
Dilate efferent
Constrict afferent
Dilate afferent

50
100
0[H]
% R
espo
nse
E + S (ES) E + P H + R (HR) response stimulus response
50
100
0[S]
Velo
city
(% o
f max
)
Michaelis-Menten
Km
Vmax: determined by [E] & [S]
Properties of Receptors—Slide # 9
[H] is limiting
[S] is limiting
[R] is one factor
50
100
0Log [A]
% R
espo
nse
50
100
0[H]
% R
espo
nse
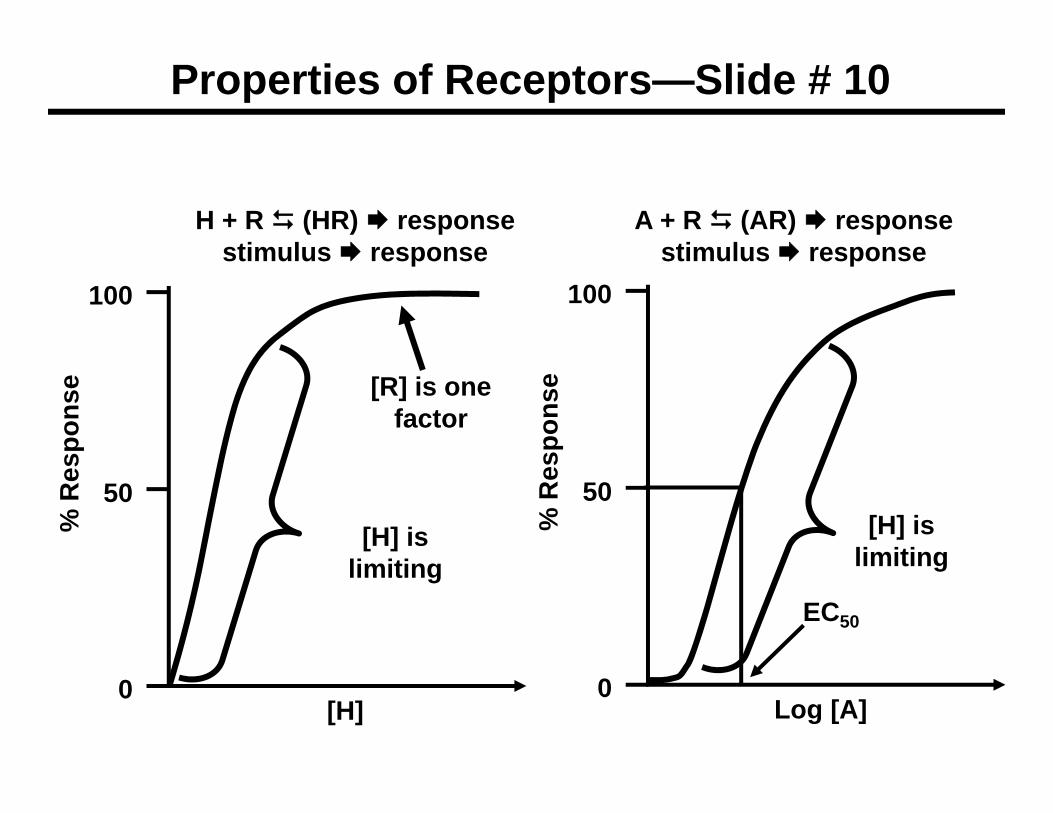
Properties of Receptors—Slide # 10
H + R (HR) response stimulus response
A + R (AR) response stimulus response
EC50
[H] is limiting
[H] is limiting
[R] is one factor

Overview of AVP Pathophysiology—Slide # 11
Low
Dehydration(2O)
High
Primary Poly-dipsia (2O)
SIADH(1O)
Plasma AVP
POSM
UOSM<< 1
POSM
UOSM>> 1
LowHigh
LowHigh
Plasma osmolality
*Nephro DI (1O)
Plasma AVP
POSM
UOSM<< 1
POSM
UOSM>> 1
Neuro DI* (1O)
Note: AVP=ADH

Metabolism—Cortisol—Slide # 12
Glucose
G6-phos
Glucose 6-P
GlucokinaseGly
phos
GlycogenGly
synthase
PEPCK
Fructose 1,6-bisphosphatase
PDH (thiamine)
Acetyl CoAPyruvate carboxylase
(biotin)
OAA
Lactate
LDH
Acetyl CoA carboxylase
Malonyl CoA
TCA Ketones
FAFA
synthase
Pyruvate kinase
PFK-1 (via PFK-2)
Pyruvate
AA (alanine)
Cortisol
Cortisol

Glucose
G6-phos
Glucose 6-P
GlucokinaseGly
phos
GlycogenGly
synthase
PEPCK
Fructose 1,6-bisphosphatase
PDH (thiamine)
Acetyl CoAPyruvatecarboxylase
(biotin)
OAAAcetyl CoA carboxylase
Malonyl CoA
TCA Ketones
FAFA
synthase
Pyruvate kinase
PFK-1 (via PFK-2)
Pyruvate
AA (alanine)
Insulin stimulatesGlucagon stimulates
Insulin—Glucagon—Slide # 13
Urea
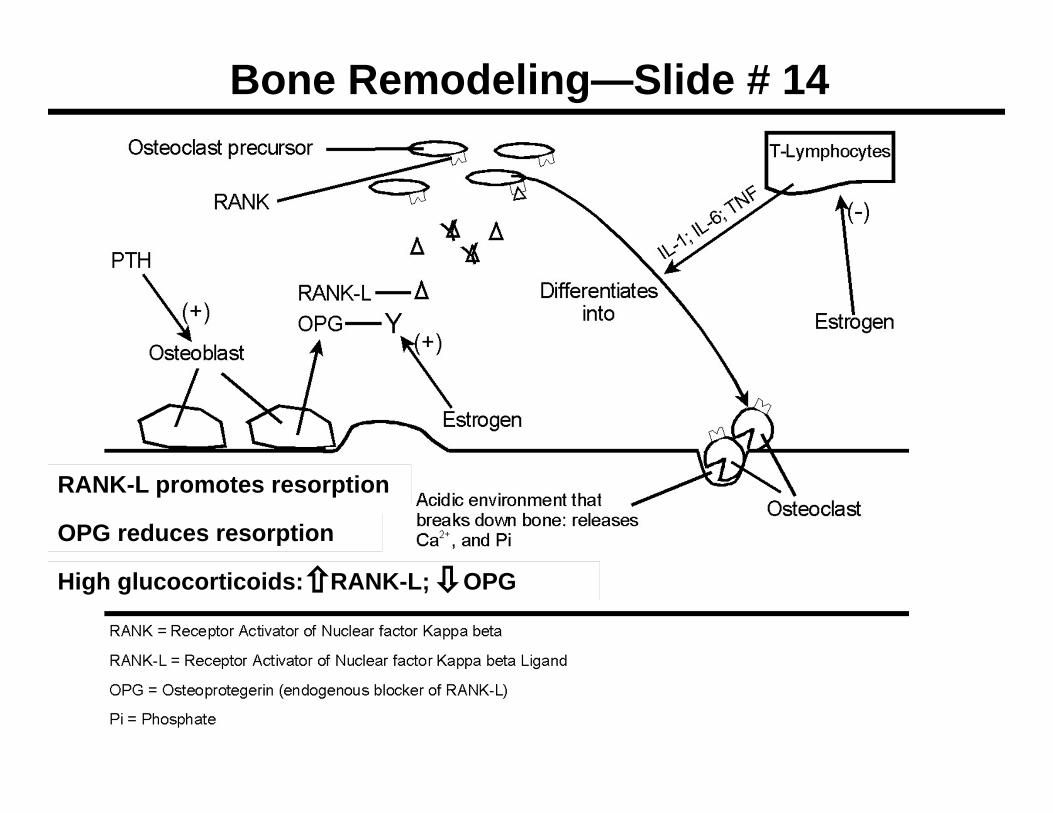
Bone Remodeling—Slide # 14
RANK-L promotes resorption
OPG reduces resorption
High glucocorticoids: RANK-L; OPG

Sexual Differentiation—Slide # 15
Wolffian ducts
Müllerian ducts
Wolffian ducts
Müllerian ducts
Fallopian tubes,
uterus, inner vagina
Epididymis, vas
deferens, seminal vesicles
Epididymis, vas
deferens, seminal vesicles
T = TestosteroneSRY = sex determining
region of Y
MIH = Müllerian inhibiting hormone
Ovaries
Fallopian tubes, uterus,
inner vagina
XY has SRY
XX—no SRY Testes
TMIH
Regress Regress
Undifferentiated gonad

Sexual Differentiation—Slide # 16
Ovaries Testes
Undifferentiated organs
DHT
Clitoris, outer vagina, labia
Penis, scrotum, &
prostate
No DHT
Testosterone dihydrotestosterone (DHT)5 alpha-reductase

Menopause—Slide # 17
Test/A
17-Estradiol
CholesCholes
Adipose tissue
Adrenal cortexBlood
A
DHEA
FSH/LHACTH
aromataseEstrone
aromatase
Ovary
DHEA A
Tumor Growth
Anastrozole
Letrozole Tamoxifen
Raloxifene

Polycystic Ovarian Syndrome—Slide # 18PCOS
Hirsutism; irregular menstrual bleeding; chronic anovulation; obesity; insulin resistance; infertility
Thecalhormone
production
Adipose estrone
LH FSH
Pituitary
Follicle maturationaromatase Estradiol
anovulation
Androgens
Adrenal
AdiposeOvaries
Androgens
Oral contraceptives to LH
Thiazolidinediones; Metformin
insulin
SHBG
Clomiphene: FSH
Dexamethasone