
Www.ncof.gov.uk Results of the assimilation of sea ice concentration and velocity into a...
22
www.ncof.gov.u k Results of the assimilation of sea ice concentration and velocity into a sea-ice- ocean model. John Stark, Mike Bell, Matt Martin, Adrian Hines, Alistair Sellar, Jeff Ridley.
-
Upload
ronald-armstrong -
Category
Documents
-
view
223 -
download
0
Transcript of Www.ncof.gov.uk Results of the assimilation of sea ice concentration and velocity into a...

www.ncof.gov.uk
Results of the assimilation of sea ice concentration and velocity into a sea-ice-ocean model.John Stark, Mike Bell, Matt Martin, Adrian Hines, Alistair Sellar, Jeff Ridley.

www.ncof.gov.uk
Motivation & Outline of Talk.
Motivation• Improve operational forecasts of sea-ice and ocean
• Improve seasonal and decadal forecasts
• Improve NWP forecasts by using better sea-ice data
• Reduce uncertainties in sea-ice models by detailed intercomparison of models & data.
Overview of talk• Overview of the assimilation system.
– Ice concentration assimilation.– Ice velocity assimilation.
• Results from year-long reanalysis integrations– Period from October 1999 December 2000.
• Summary

www.ncof.gov.uk
The Sea-Ice-Ocean Model
1° Global FOAM.• Ocean component is identical to the operational FOAM model.• 6-hourly NWP fluxes.• Ice thickness distribution (ITD), 5 categories (Lipscomb 2001).• Elastic viscous plastic rheology (Hunke & Dukowicz 1997)
1° FOAM, Operational since 1997
• Derived from the CICE model (Hunke & Lipscomb, LANL)
• Configuration of sea ice model is identical to our latest climate model, HadGEM1.
• Regular Lat-Long grid (Polar island participates in ice flow)

www.ncof.gov.uk
Sea Ice Concentration Assimilation Scheme
• Obs from SSM/I (passive microwave).• ASI algorithm converts brightness temperature to ice concentration estimates.• Optimal interpolation used :
– Can process many observations efficiently.– Can cope with poor estimates of the error.– Does not require accurate knowledge of error correlations (but these can be used).– Does not require an adjoint or inverse model or ensemble runs.
ASI algorithm & Q.C.
O.I. Analysis Forecast
NWP surface temperature
SST & Ice
Ice concentration
Swath data
An
aly
sis
Incr
em
en
ts
www.ncof.gov.uk
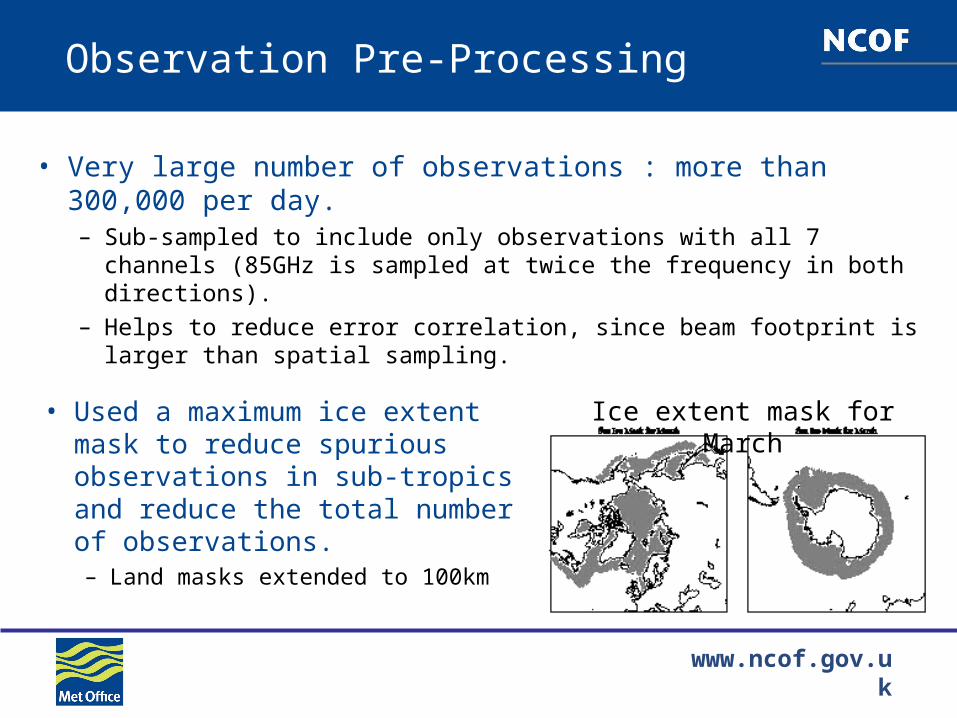
Observation Pre-Processing
• Very large number of observations : more than 300,000 per day.– Sub-sampled to include only observations with all 7 channels
(85GHz is sampled at twice the frequency in both directions). – Helps to reduce error correlation, since beam footprint is larger than
spatial sampling.
• Used a maximum ice extent mask to reduce spurious observations in sub-tropics and reduce the total number of observations.– Land masks extended to 100km
Ice extent mask for March

www.ncof.gov.uk
Ice Conc. Observation Pre-Processing
• Observations that fail the weather filter are treated as 0% ice cover.
Swath Obs, Tb
NASA-Team
Weather Filter Fail Conc=0%
NTA > 30% ? Discard
Conc(ASI)
Ice Extent Filter
Error Estimate
NWP Surface T. Fail

www.ncof.gov.uk
Effect of 30% NTA threshold.
Threshold = 5% Threshold = 30%
• Trade off between spurious ice observations & resolving the marginal ice zone:

www.ncof.gov.uk
Application of Analysis Increments
• Preferentially altering the thinnest ice.– Smallest change in heat content– Represents thermodynamic changes to the sea
ice.
• Scaling all categories– Smallest RMS change in category ice area.– Represents convergence / divergence in the flow.– Can result in large changes to thick ice.
• The analysis scheme provides an estimate of total sea ice concentration– This must be mapped onto the ice thickness distribution
(ITD) in the model.
Ice Thickness
Fra
ctio
nal C
over

www.ncof.gov.uk
Application of Analysis Increments
Scaling all categories
Total Ice Volume Comparison : North
0.00E+00
5.00E+12
1.00E+13
1.50E+13
2.00E+13
2.50E+13
3.00E+13
28/08/1999
17/10/1999
06/12/1999
25/01/2000
15/03/2000
04/05/2000
23/06/2000
12/08/2000
01/10/2000
20/11/2000Time
Ice
Volu
me,
m^3
ControlConc. AssimVel. AssimConc.&Vel Assim
Total Ice Volume Comparison : North
0.00E+00
5.00E+12
1.00E+13
1.50E+13
2.00E+13
2.50E+13
3.00E+13
28/08/1999
17/10/1999
06/12/1999
25/01/2000
15/03/2000
04/05/2000
23/06/2000
12/08/2000
01/10/2000
20/11/2000Time
Ice
Volu
me,
m^3
ControlIceConcIceVelConcVel
Red = Free runCyan = Assim
Red = Free runCyan = Assim
Ice Thickness
Fra
ctio
nal C
over
Ice Thickness
Fra
ctio
nal C
over

www.ncof.gov.uk
Ice Velocity Assimilation Scheme
Obs Q.C.
Analysis
Analysis increments Balancing stress
Computed using free drift
i
Forecast
Model ice velocity bias
Ice-motion data from CERSAT-IFREMER and NSIDC
Ice motion forecast

www.ncof.gov.uk
Ice Vel. Observation Pre-Processing
CERSAT Obs (NetCDF)
DiscardQuality Flag==1 ? Fail
Fowler Obs (ASCII)
Coordinate Conversion & Vector Rotation
DiscardV > 1m/s ? FailModel N-day
Mean Velocities
Interpolate to Obs
Combine with Ob Errors, output to Obs file.

www.ncof.gov.uk
Velocity analysis scheme
• Assimilation– Assimilation scheme based on OI, similar to ice
concentration.– Assimilation scheme able to control divergence introduced
by the assimilation.– Relative amount of divergence can be controlled.– Uses a ‘balancing stress’ based on free drift dynamics to
apply the increments.– Uses 2 background error length scales.
• Quality Control– Observations near coastlines have reduced impact to
prevent velocities into land.

www.ncof.gov.uk
Ice Velocity : Application of Increments
• EVP scheme rapidly adjusts to maintain equilibrium with external forcing on ice.– Direct application of the analysis increments to the velocity fails.– Previous work (Meier, Zhang) has diagnosed an additional velocity which is
added to the model and plays no direct part in the dynamics.– We used an alternative approach : balancing stress.
Arctic Sea Ice Spin up : RMS Speed
0
2
4
6
8
10
12
14
16
18
00:00 06:00 12:00 18:00 00:00Time (Hours Since 00:00)
RM
S V
elo
city
(cm
/s)
Control
Zero-Velocity at 00:00
Velocity Vector Difference
Ice velocity after a perturbation compared to a control run.

www.ncof.gov.uk
Ice Velocity : Application of Increments
Ice velocity assimilation using a ‘balancing stress’• An additional term was added to the model sea-ice
momentum equation to apply the velocity increments.
• The additional stress term is computed by assuming the sea-ice is in free drift.
• The first term on the right is the additional stress required to balance the ice-ocean stress, the second term comes from the Coriolis term.
• This is a non-linear term since it depends on the sea ice velocity and not just the increment.
a w iˆm a a k mf at
u
τ τ u τ
i w i iˆ1k w w kc k mfa τ u u u u

www.ncof.gov.uk
Outline of Talk.
• Overview of the assimilation system.– Ice concentration assimilation.– Ice velocity assimilation.
• Results from year-long reanalysis integrations– Period from October 1999 December 2000.
• Summary
www.ncof.gov.uk
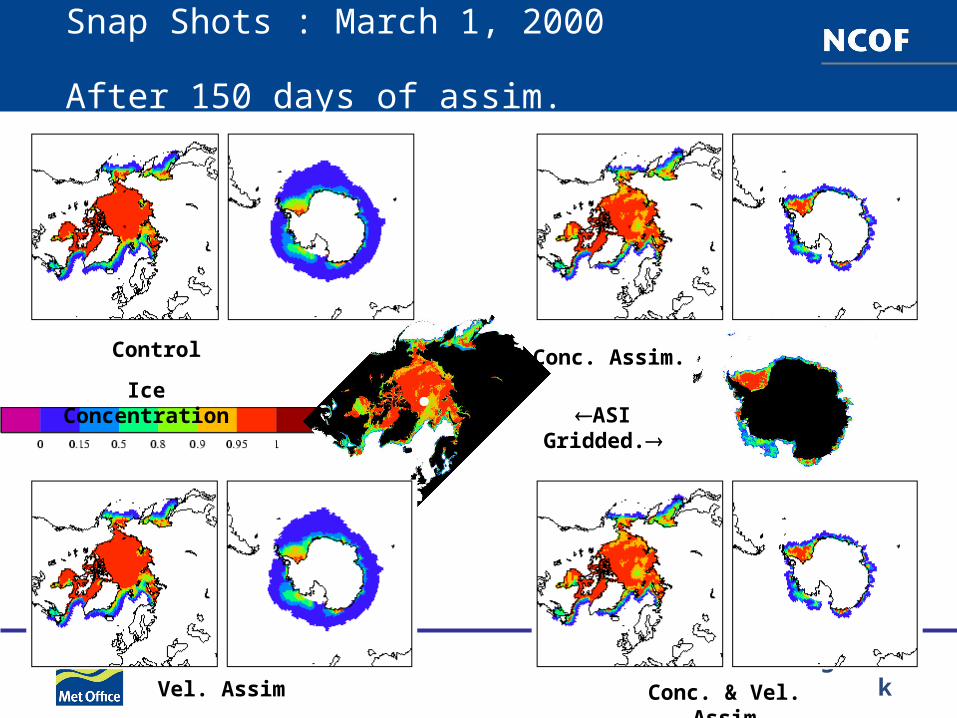
Snap Shots : March 1, 2000 After 150 days of assim.
Control Conc. Assim.
Vel. Assim Conc. & Vel. Assim
ASI Gridded.Ice Concentration
www.ncof.gov.uk
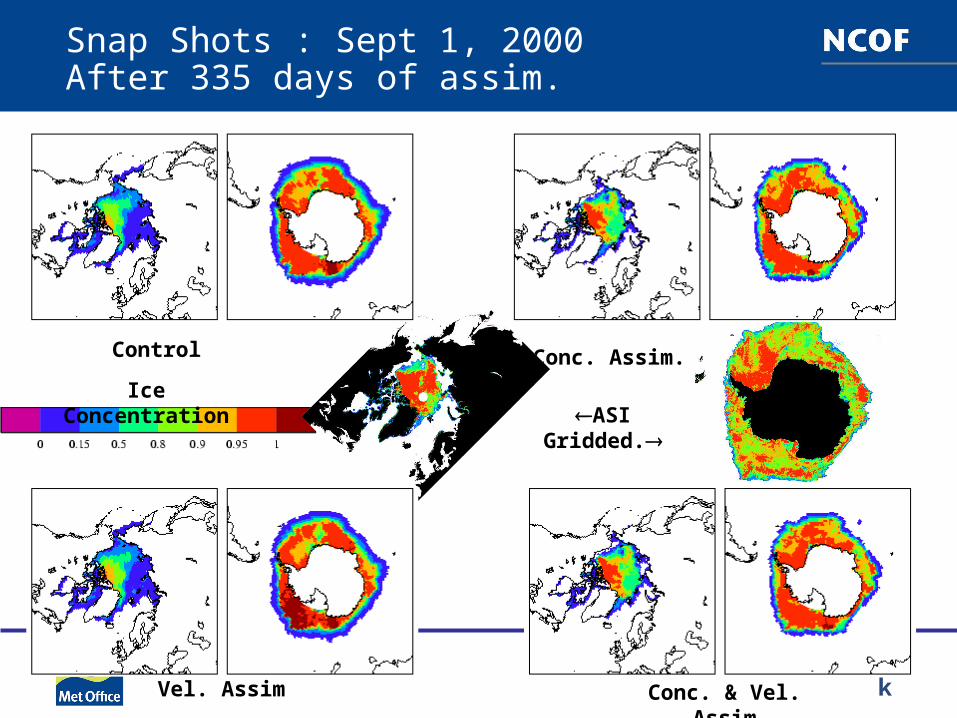
Snap Shots : Sept 1, 2000 After 335 days of assim.
Control Conc. Assim.
Conc. & Vel. Assim
ASI Gridded.Ice Concentration
Vel. Assim

www.ncof.gov.uk
Ice concentration statistics.
• Significant improvement with ice conc. assimilation.
• Small difference with ice vel. assimilation.
• Melt season a particular problem.
R.M.S Ice Concentration Compared to HadISST : North
00.05
0.10.15
0.20.25
0.30.35
0.40.45
0.5
28/08/1999
17/10/1999
06/12/1999
25/01/2000
15/03/2000
04/05/2000
23/06/2000
12/08/2000
01/10/2000
20/11/2000Time
RM
S C
onc.
Err
or
Control
IceConc
IceVel
ConcVel
R.M.S Ice Concentration Compared to HadISST : South
0
0.05
0.1
0.15
0.2
0.25
0.3
28/08/1999
17/10/1999
06/12/1999
25/01/2000
15/03/2000
04/05/2000
23/06/2000
12/08/2000
01/10/2000
20/11/2000Time
RM
S C
onc.
Err
or
Control
IceConc
IceVel
ConcVel
R.M.S Ice Concentration Compared to HadISST : North
00.05
0.10.15
0.20.25
0.30.35
0.40.45
0.5
28/08/1999
17/10/1999
06/12/1999
25/01/2000
15/03/2000
04/05/2000
23/06/2000
12/08/2000
01/10/2000
20/11/2000Time
RM
S C
onc.
Err
or
ControlA
IceConcA
ConcVelA
1° Global
1° Global1/3° Arctic
www.ncof.gov.uk
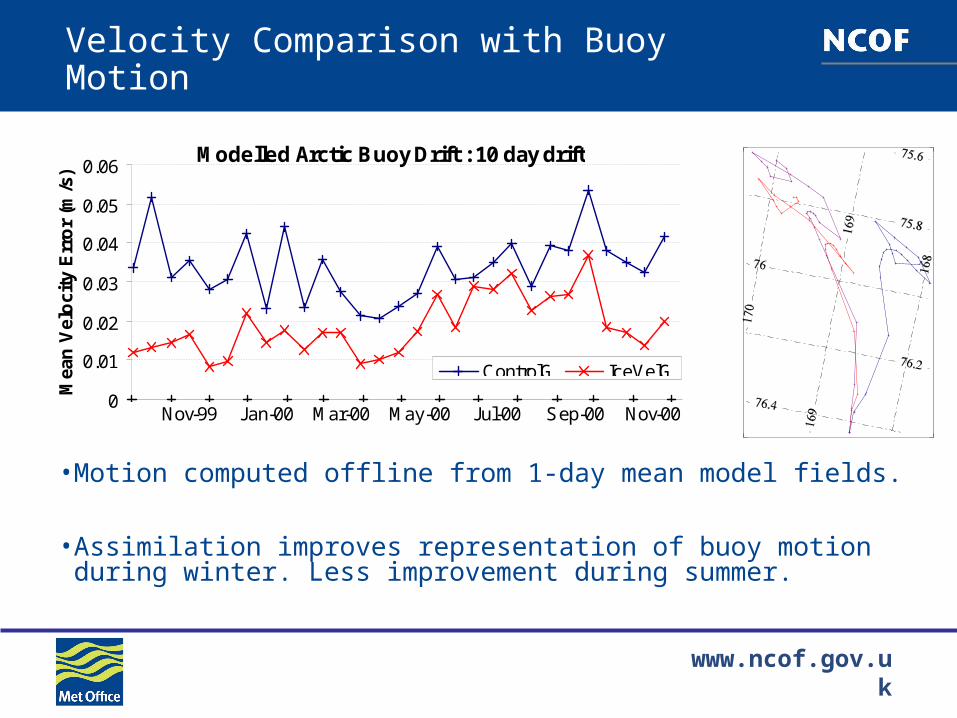
Velocity Comparison with Buoy Motion
• Motion computed offline from 1-day mean model fields.
• Assimilation improves representation of buoy motion during winter. Less improvement during summer.
Modelled Arctic Buoy Drift : 10 day drift
Jan-00 Mar-00 May-00 Jul-00 Sep-00 Nov-00Nov-990
0.01
0.02
0.03
0.04
0.05
0.06
Mea
n V
elo
city
Err
or
(m/s
)
ControlG IceVelGlabels ticks

www.ncof.gov.uk
Impact of velocity assim. on thickness.
• Velocity assimilation led to changes in thickness of order 30cm.
• Thicker ice around Greenland and Fram Strait.
• Thinner in Beaufort Gyre.
Annual avg. thickness change (m)
(assim. – control)

www.ncof.gov.uk
Correlation between velocity increments and wind stress.
Zonal Wind / Assim, October 1999 Meridional Wind / Assim, October 1999
Zonal Wind / Assim, March 2000 Meridional Wind / Assim, March 2000 Strong negative correlation in many areas indicates wind stress too strong.

www.ncof.gov.uk
Summary
• The ice concentration and velocity assimilation has been shown to give quantitative improvements in modelled sea ice.
• Very little coupling between ice concentration and ice velocity in this model.– Ice dynamics has little impact on ice concentration in this model.
• Velocity analysis increments applied indirectly, via a balancing stress.– Ice velocity cannot be directly assimilated using an EVP model.
• Use of bias correction techniques allows forecast improvement & reduces RMS errors.
• Diagnosis of deficiencies in the model and forcing are possible using the assimilation.