Remote Sensing of Sea Ice – Sea ice concentration
41
Remote Sensing of Sea Ice – Sea ice concentration Leif Toudal Pedersen, Technical University of Denmark
Transcript of Remote Sensing of Sea Ice – Sea ice concentration

Remote Sensing of Sea Ice – Sea ice concentrationLeif Toudal Pedersen, Technical University of Denmark

Leif Toudal Pedersen | DTU | 31/07/2018 | Slide 2
Acknowledgements
And others + a number of figures from Ulaby et al, 1986

Leif Toudal Pedersen | DTU | 31/07/2018 | Slide 3
In situ observations – Oden/LOMROG 2009

Leif Toudal Pedersen | DTU | 31/07/2018 | Slide 4
Airborne observations – new ice & icebergs

Leif Toudal Pedersen | DTU | 31/07/2018 | Slide 5
Navigation in ice

Arctic Sea ice1999-2007QuikSCAT
From Brigham Young University, US

Leif Toudal Pedersen | DTU | 31/07/2018 | Slide 7
MODIS Visible light imagery of the Arctic
Aug 24, 2013 Oct 4, 2013

Leif Toudal Pedersen | DTU | 31/07/2018 | Slide 8
Microwave imagery during the Polar Night (October 4, 2013)
Microwave radiometry
All weatherDay and night
However, at higherfrequencies not independent of weather influence

Leif Toudal Pedersen | DTU | 31/07/2018 | Slide 9
September 15, 2015, morning AMSR2, atmospheric influence
Leif Toudal Pedersen | DTU | 31/07/2018 | Slide 10
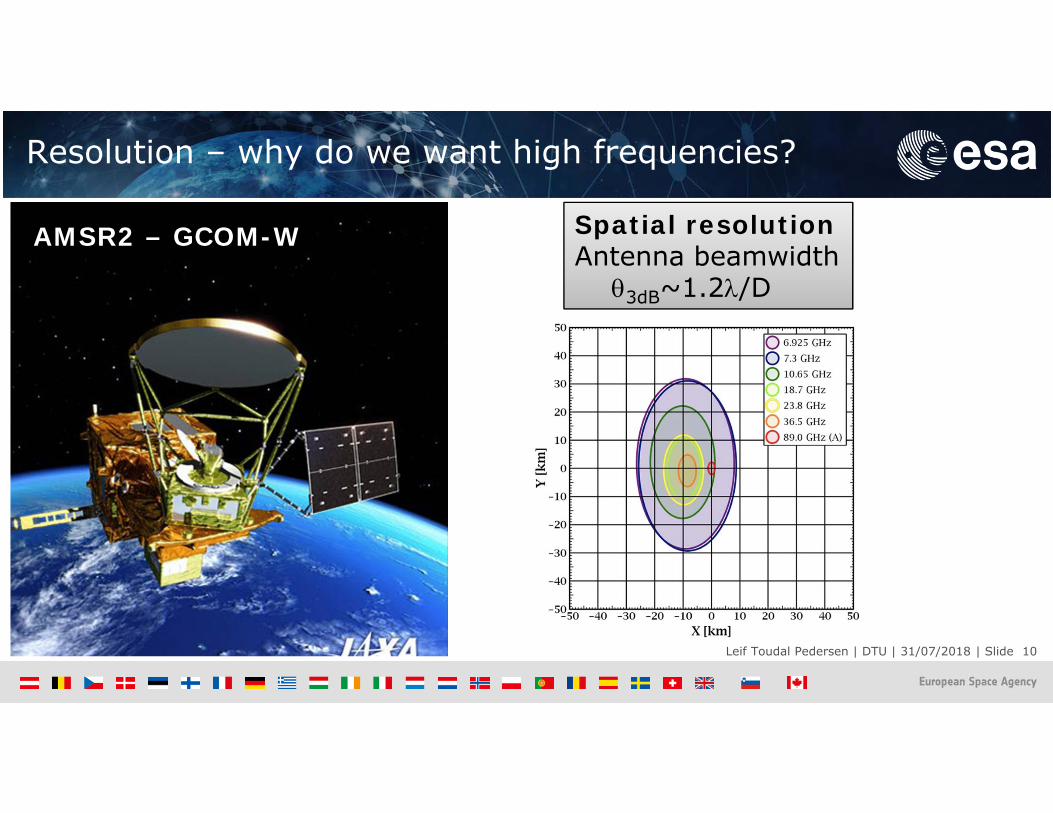
Resolution – why do we want high frequencies?
Spatial resolutionAntenna beamwidth
3dB~1.2/D
AMSR2 – GCOM-W
Leif Toudal Pedersen | DTU | 31/07/2018 | Slide 11
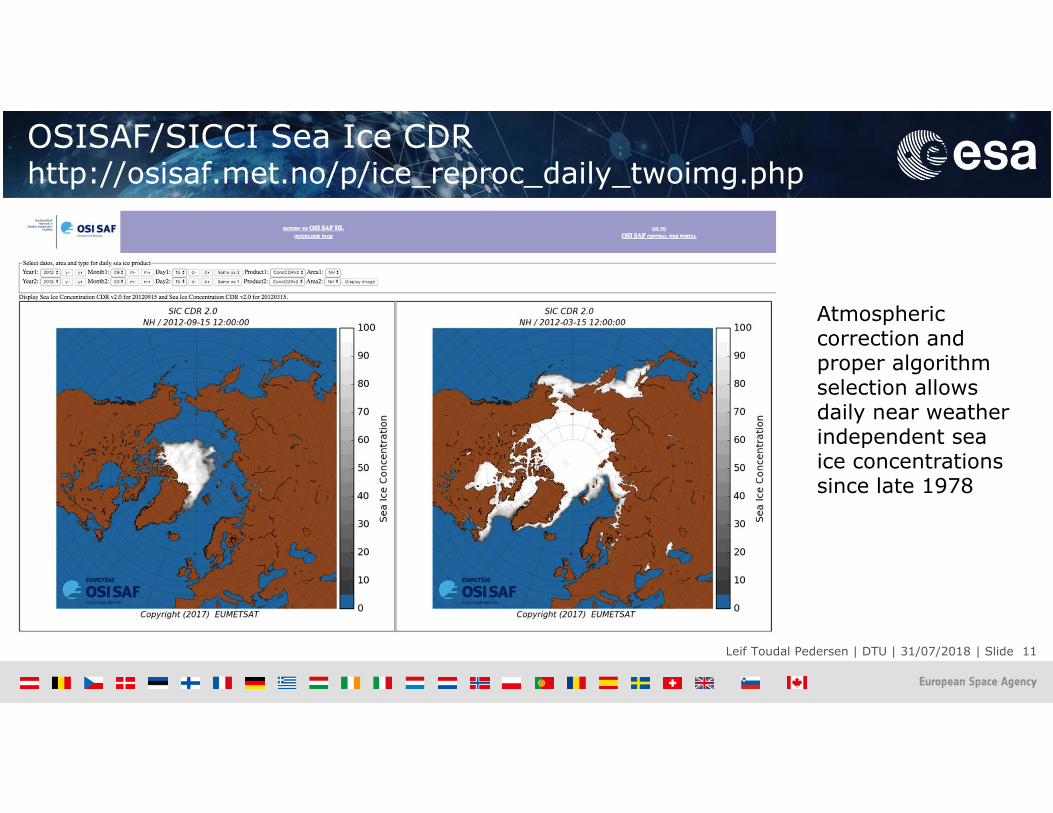
OSISAF/SICCI Sea Ice CDRhttp://osisaf.met.no/p/ice_reproc_daily_twoimg.php
Atmosphericcorrection and proper algorithmselection allowsdaily near weatherindependent seaice concentrationssince late 1978
Leif Toudal Pedersen | DTU | 31/07/2018 | Slide 12
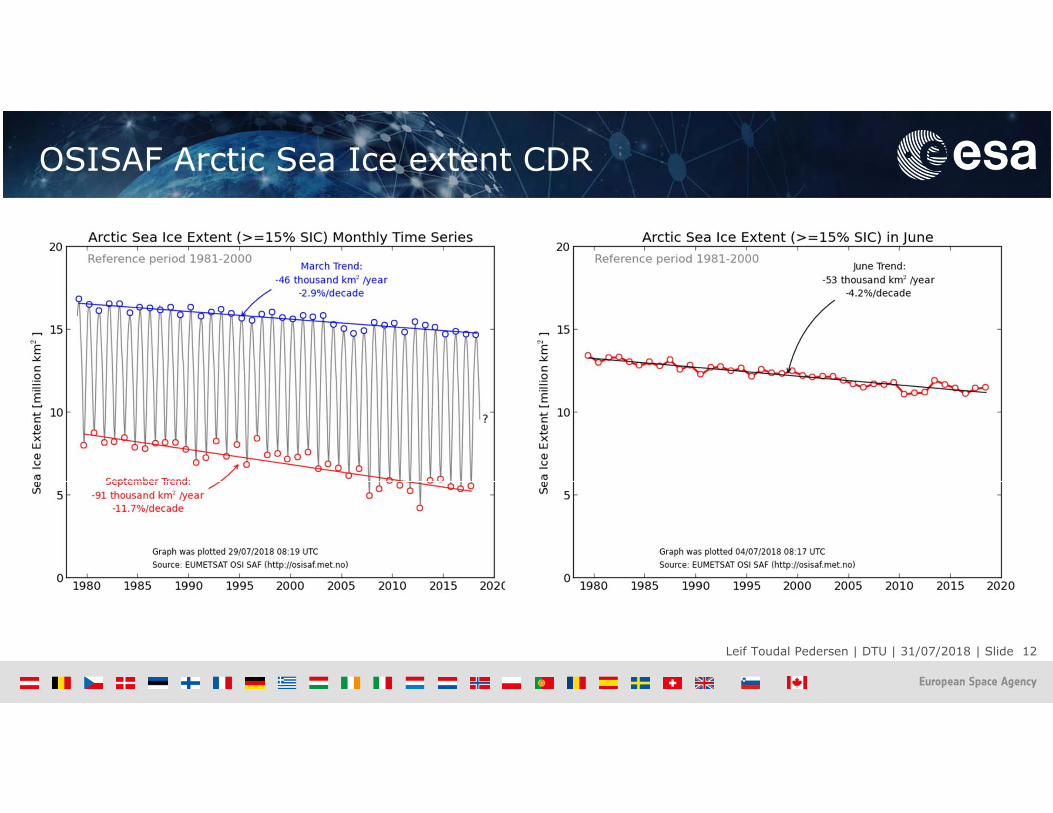
OSISAF Arctic Sea Ice extent CDR

Leif Toudal Pedersen | DTU | 31/07/2018 | Slide 13
OSISAF Arctic Sea Ice extent CDR

Leif Toudal Pedersen | DTU | 31/07/2018 | Slide 14
Microwaves?
Leif Toudal Pedersen | DTU | 31/07/2018 | Slide 15
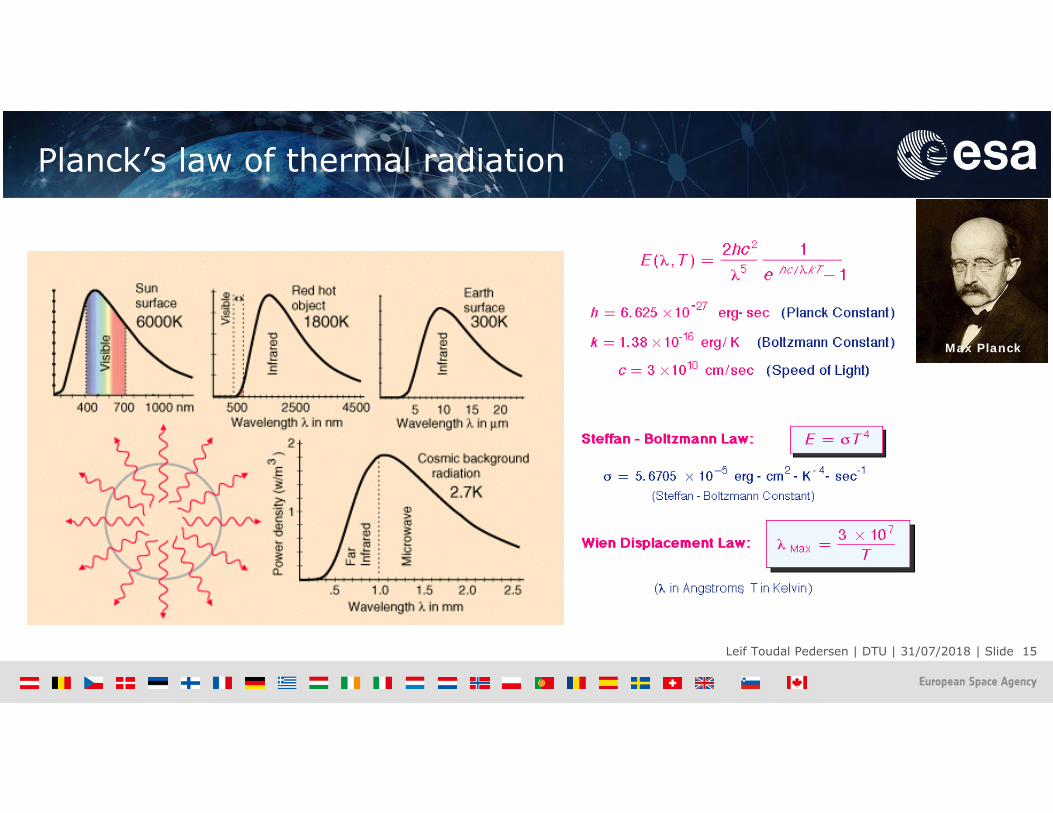
Planck’s law of thermal radiation
Max Planck

Leif Toudal Pedersen | DTU | 31/07/2018 | Slide 16
TB = T (grey body)
TB / T
is emissivity
TB is brightness temperature
Emissivity and brightness temperature
Wikipedia, 2017
ε = In thermodynamicequilibriumemissivity (ε)= absorptivity () Gustav Kirchhoff

Leif Toudal Pedersen | DTU | 31/07/2018 | Slide 17
Tsky
The Atmosphere- Radiative transfer

Leif Toudal Pedersen | DTU | 31/07/2018 | Slide 18
The Atmosphere - Radiative Transfer
Upwelling
Downwelling

Leif Toudal Pedersen | DTU | 31/07/2018 | Slide 19
H2O
O2
O2
Window
The Atmosphere - Transmissivity
H2O
Frequency (GHz)
Tran
smis
sivi
ty.

Leif Toudal Pedersen | DTU | 31/07/2018 | Slide 20
Cloud attenuation and Downwelling temperature (TDN)
Frequency[GHz]
TDN
[K]|exp(-τ)|
6.9 3-5 0.98210.7 4-6 0.97918.7 7-17 0.95523.8 10-35 0.91836.5 20-40 0.88650.5 120-140 0.48752.8 210-230 0.13989 30-110 0.749
Frequency (GHz)
Typical TDN values at higher latitudes
Incl.O2H20CloudTair
Excl. TSC

Leif Toudal Pedersen | DTU | 31/07/2018 | Slide 21
Water – Ocean surface reflectionFresnell reflection coefficients
Emissivity
= 1‐R
10 GHz
V
H”
’
Perm
ittivity
Frequency (GHz) Incidence angle

Leif Toudal Pedersen | DTU | 31/07/2018 | Slide 22
Water - Brightness temperatureThe effect of wind
Frequency (GHz)Frequency (GHz)
Brigh
tnes
s Te
mpe
ratu
re (
K)
Change in TB per change in WS (K/(m/s))
K/(
m/s
).
1
0
2
-1
Vertical pol
Horizontal pol
Nadir H
V

Leif Toudal Pedersen | DTU | 31/07/2018 | Slide 23
Water - Microwave penetration depth
Frequency (GHz)
Pene
trat
ion
dept
h (c
m)
0.5 to 1 mm water on top of ice will have the same TB as the ocean and cannot bedistinguished from open water
Above 5 GHz the curvelooks almost the same also for lower salinityand temperatures

Leif Toudal Pedersen | DTU | 31/07/2018 | Slide 24
Ice - First-year ice signatures - Winter
Brine pocket (salt water)
Salty ice
Snow
Absorbs almost almost all incoming radiation –nearly a black body at microwave wavelengths (emissivity ~0.9)

Leif Toudal Pedersen | DTU | 31/07/2018 | Slide 25
Ice - Multi-year ice signatures - Winter
Brine pocket (salt water)
Salty ice
Snow
Absorbs almost all incoming radiation at longer wavelengths – nearly a black body (emissivity ~0.9)Scatters radiation at shorter wavelengths (<2 cm) –> lower emissivity
Fresher ice
Air bubble
Salty ice

Leif Toudal Pedersen | DTU | 31/07/2018 | Slide 26
Ice - Signatures- Summer
Salty ice
Wet snow
Wet snow absorbs almost all incoming radiation ‐> nearly a black body (emissivity ~0.9)
Fresher ice
Brine pocket (salt water)Air bubble

Leif Toudal Pedersen | DTU | 31/07/2018 | Slide 27
Ice and snow - Seasonal cycle of TBs
170
190
210
230
250
270
AMSR2 TB‐V time series along CRREL buoy 2013J trajectory ‐ Year of 2014
x2m 6.9GHzV 10.7GHzV 18.7GHzV 36.5GHzV 89.0GHzV
From the ESA CCI Sea iceconcentrationreference dataset
https://figshare.com/articles/Reference_dataset_for_sea_ice_concentration/6626549

Leif Toudal Pedersen | DTU | 31/07/2018 | Slide 28
Ice and snow - Penetration depth
10 cm5 cm
30 cm100 cm

Leif Toudal Pedersen | DTU | 31/07/2018 | Slide 29
The influence of ice thickness (thin ice)

Leif Toudal Pedersen | DTU | 31/07/2018 | Slide 30
AMSR2 on JAXA’s GCOM-W
AMSR2 Channel Set
Center Freq. Band width Pol. Beam width Ground res.Samplinginterval
GHz MHz degree km km
6.925/7.3 350
V/H
1.8 35 x 62
10
10.65 100 1.2 24 x 42
18.7 200 0.65 14 x 22
23.8 400 0.75 15 x 26
36.5 1000 0.35 7 x 12
89.0 3000 0.15 3 x 5 5

Leif Toudal Pedersen | DTU | 31/07/2018 | Slide 31
Signature - Summary
Large PR for water
GR<0 for MY
GR~0 for FY
MY
W
W
Frequency (GHz)

End of part 1
Thank you

Icecharts

Leif Toudal Pedersen | DTU | 31/07/2018 | Slide 34
Include volume scattering

Leif Toudal Pedersen | DTU | 31/07/2018 | Slide 35
Nor
weg
ian
Danish
East Greenland Area
See also:Karvonen, Juha, Jouni Vainio, Marika Marnela, Patrick Eriksson, and Tuomas Niskanen, A Comparison Between High-Resolution EO-Based and Ice Analyst-Assigned Sea Ice Concentrations, IEEE JOURNAL OF SELECTED TOPICS IN APPLIED EARTH OBSERVATIONS AND REMOTE SENSING, VOL. 8, NO. 4, APRIL 2015
Icechart to OSISAF SIC intercomparison

Leif Toudal Pedersen | DTU | 31/07/2018 | Slide 36
Icechart vs OSISAF - SIC intercomparison
NorwegianDanish

Leif Toudal Pedersen | DTU | 31/07/2018 | Slide 37
Icechart vs OSI-SAF ice concentration

Leif Toudal Pedersen | DTU | 31/07/2018 | Slide 38
CIS Icechart vs Sentinel-1 SAR
CIS daily ice chart on July 20, 2017
Sentinel-1 SAR on July 20, 2017

Leif Toudal Pedersen | DTU | 31/07/2018 | Slide 39
Icechart to OSISAF SIC intercomparison

Icechart to OSISAF SIC intercomparison

Leif Toudal Pedersen | DTU | 31/07/2018 | Slide 41
Sentinel-1 SAR and MET Icechart2016-12-22