Www.ecometrica.co.uk ETS IMPLICATIONS ON ROUTE AND NETWORK DECISION MAKING Barry Moss Special...
21
www.ecometrica.co. uk ETS IMPLICATIONS ON ROUTE AND NETWORK DECISION MAKING Barry Moss Special Advisor ECOMETRICA Gary Crichlow Aviation Analyst ASCEND
Transcript of Www.ecometrica.co.uk ETS IMPLICATIONS ON ROUTE AND NETWORK DECISION MAKING Barry Moss Special...
www.ecometrica.co.uk
ETS IMPLICATIONS ON ROUTE AND NETWORK
DECISION MAKING
Barry MossSpecial AdvisorECOMETRICA
Gary CrichlowAviation Analyst
ASCEND
www.ecometrica.co.uk 2
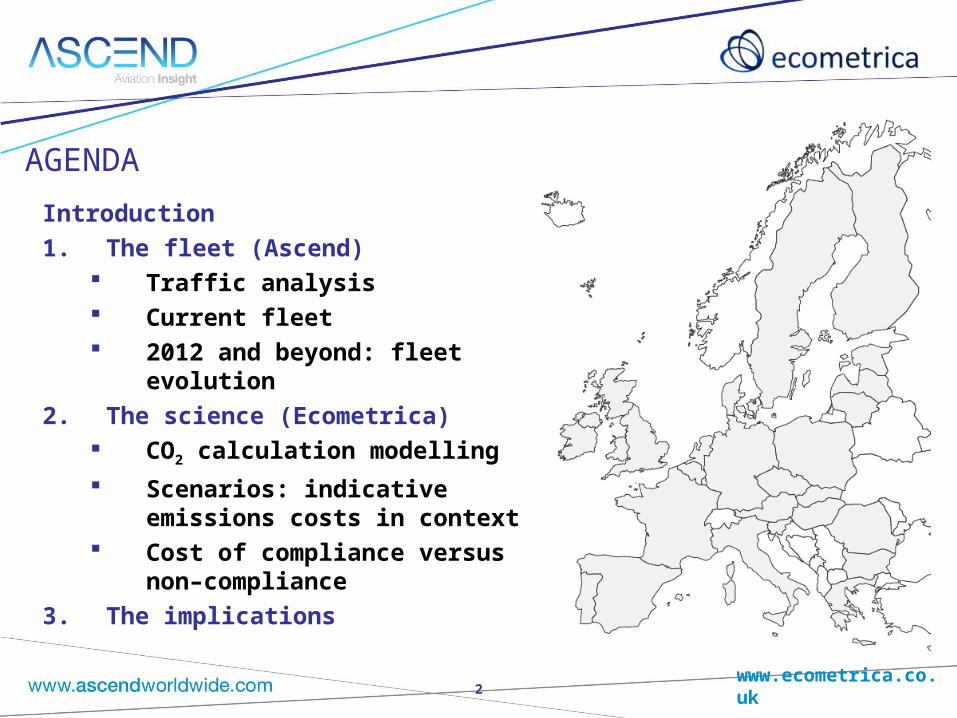
Introduction
1. The fleet (Ascend) Traffic analysis Current fleet 2012 and beyond: fleet evolution
2. The science (Ecometrica) CO2 calculation modelling
Scenarios: indicative emissions costs in context
Cost of compliance versus non–compliance
3. The implications
AGENDA

www.ecometrica.co.uk 3
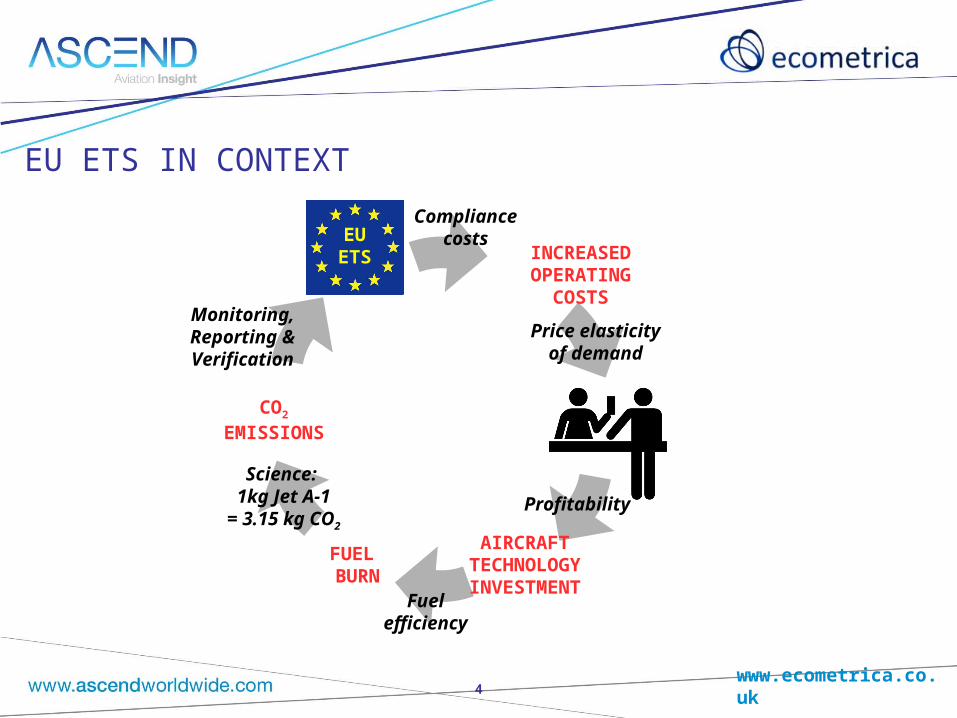
OUR THESIS: ETS IS EFFECTIVELY A FUEL “TAX”
ETS higher costs, in proportion to fuel burnt
“Tax” set by market forces: fluid
Fleet / route planning: already
a dynamic exercise
EUA cost
EUA market demand
CO2 emitted
FUEL BURNT
www.ecometrica.co.uk
AIRCRAFTTECHNOLOGYINVESTMENT
INCREASED OPERATING
COSTS
EUETS
CO2
EMISSIONS
FUEL BURN
EUETS
Price elasticityof demand
Profitability
Monitoring,Reporting &Verification
Fuelefficiency
Science: 1kg Jet A-1
= 3.15 kg CO2
Compliancecosts
EU ETS IN CONTEXT
4

www.ecometrica.co.uk 5
SETTING THE SCENE — ETS-COVERED ROUTES
Long-haul:>3,000nm7% of 2008 mvmts14% of 2008 seats
Medium haul: 1,501–3,000nm4% of 2008 mvmts6% of 2008 seats
Short haul:<1,500nm90% of 2008 mvmts81% of 2008 seats
Frankfurt
EU ETS would have covered 4m scheduled airline movements, 0.5bn seats in 2008

www.ecometrica.co.uk 6
SHORT-HAUL 2008 SCHEDULED AIRLINE MOVEMENTS
90% of 2008 scheduled airline movements
A320 family / 737 types dominate
Average stage length: 800 km (440 nm)
A320 family31%
737 NG14%
CRJ family6%
737 Classics
12%
ATRs6%
146/RJ5%
Embraer RJs5%
MD80/90 family
4%
Fokker 70/100
4%
Dash 84%
Other9%
Source: OAG, Ascend analysis

www.ecometrica.co.uk 7
MEDIUM-HAUL 2008 SCHEDULED AIRLINE MOVEMENTS
4% of 2008 scheduled airline movements
A320, A330, 757 and 737NG dominant types
Average stage length: 3,800 km (2,000nm)
Source: OAG, Ascend analysis
7675%
A3405%
7779%
Other10%
75714% A330
15%
737 NG16%
A320 family26%

www.ecometrica.co.uk 8
LONG-HAUL 2008 SCHEDULED AIRLINES MOVEMENTS
7% of 2008 scheduled airline movements
Widebody twins dominate
Other types include: 757 (mainly
transatlantic sched / charter)
737 / A319 long-haul premium operations
Average stage length: 7,500 km (4,000nm)
Source: OAG, Ascend analysis
77722%
76719%
A33015%
747-40017%
Other 7473%
A34016%
Other8%
www.ecometrica.co.uk
0
1,000
2,000
3,000
4,000
5,000
2004 2009 2014 2019
CSeries
737 NG
A320 family
737 Classics
MD-80/90
28%
20%
30%
0
1,000
2,000
3,000
4,000
5,000
2004 2009 2014 2019
CSeries
737 NG
A320 family
737 Classics
MD-80/90
28%28%
20%20%
30%30%
9
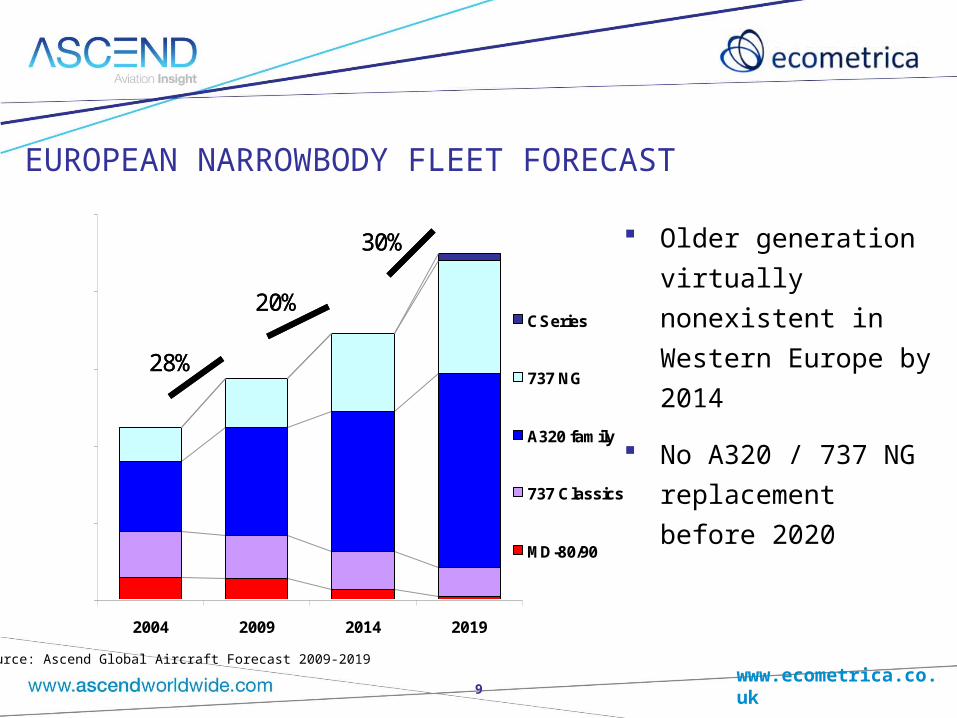
EUROPEAN NARROWBODY FLEET FORECAST
Older generation
virtually nonexistent in
Western Europe by
2014
No A320 / 737 NG
replacement before
2020
Source: Ascend Global Aircraft Forecast 2009-2019

www.ecometrica.co.uk
0
250
500
750
1,000
1,250
2004 2009 2014 2019
MRJ
ARJ
Superjet 100
CRJ700/900/1000
E-Jets
146/RJ
<50 seat RJs
-3%
35%
35%
0
250
500
750
1,000
1,250
2004 2009 2014 2019
MRJ
ARJ
Superjet 100
CRJ700/900/1000
E-Jets
146/RJ
<50 seat RJs
-3%-3%
35%35%
35%35%
10
EUROPEAN REGIONAL JET FLEET FORECAST
Decline in smaller RJs
Balance shifting
towards Embraer E-Jet
family
Superjet expected to
be strong in Eastern
Europe / CIS
Source: Ascend Global Aircraft Forecast 2009-2019
www.ecometrica.co.uk
0
250
500
750
1,000
1,250
1,500
2004 2009 2014 2019
A350
787
A380
777
A330
A340
747
767
A300/310
5%
14%
37%
0
250
500
750
1,000
1,250
1,500
2004 2009 2014 2019
A350
787
A380
777
A330
A340
747
767
A300/310
5%5%
14%14%
37%37%
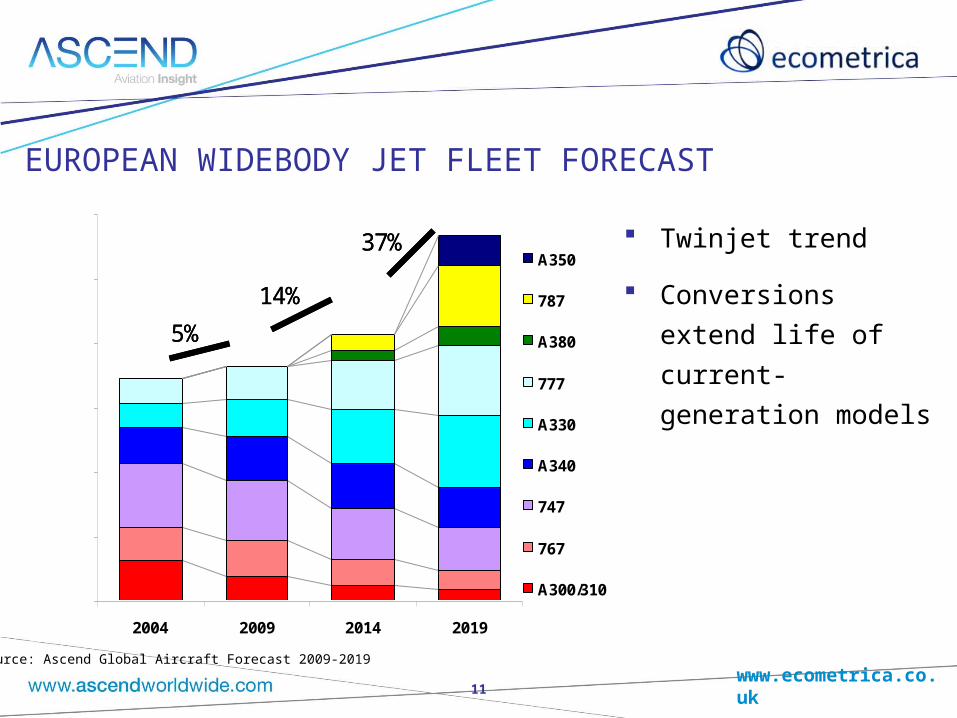
11
EUROPEAN WIDEBODY JET FLEET FORECAST
Twinjet trend
Conversions extend
life of current-
generation models
Source: Ascend Global Aircraft Forecast 2009-2019

www.ecometrica.co.uk 12
THE FLEET — KEY POINTS
A320 / 737 families’ dominance will continue well into the
foreseeable future
Short-haul flights account for the vast majority of movements
and seats majority of ETS impact
Long-haul flights have a proportionally greater CO2 footprint
than movement data indicates
2004–2006 average baseline: 2012 fleet more fuel-efficient
BUT larger growth in carbon footprint
www.ecometrica.co.uk 1313
.
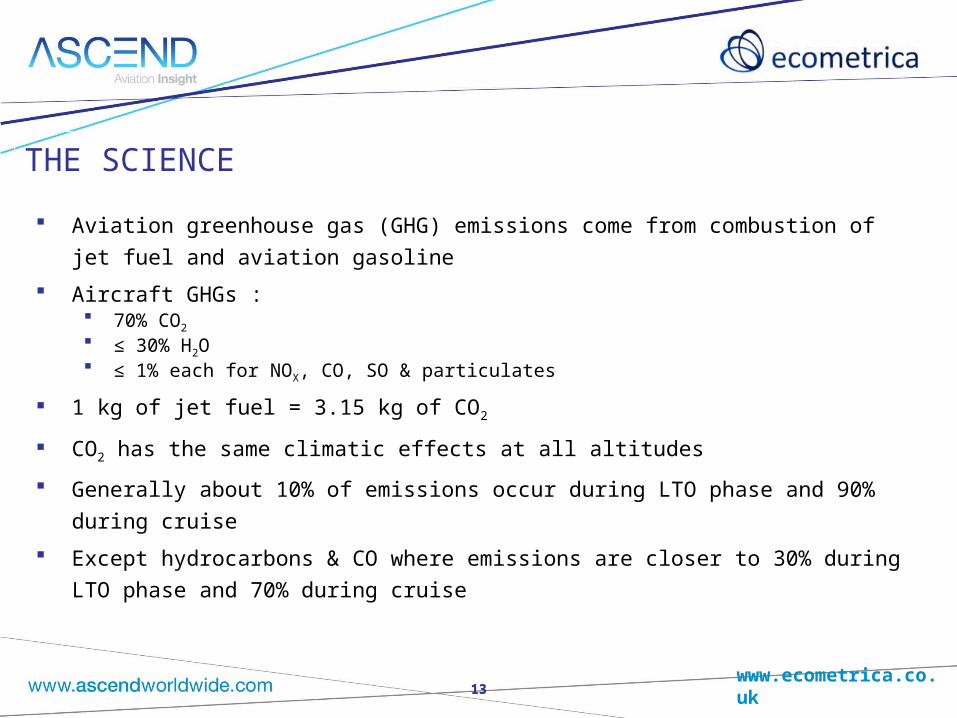
Aviation greenhouse gas (GHG) emissions come from combustion of jet fuel and
aviation gasoline
Aircraft GHGs : 70% CO2
≤ 30% H2O ≤ 1% each for NOX, CO, SO & particulates
1 kg of jet fuel = 3.15 kg of CO2
CO2 has the same climatic effects at all altitudes
Generally about 10% of emissions occur during LTO phase and 90% during cruise
Except hydrocarbons & CO where emissions are closer to 30% during LTO phase and
70% during cruise
THE SCIENCE

www.ecometrica.co.uk 1414
ALLOCATION OF ALLOWANCES
Cap CO2 emissions to 97% of baseline levels (being
average emissions between 2004 – 2006) in 2012 and 95%
of baseline levels from 2013
3% of allowances to be set aside for new entrants and
operators whose activities have rapidly increased
85% of baseline allowances to be issued free of charge –
This may only be 82%!
15% (or 18%) of allowances to be auctioned

www.ecometrica.co.uk 15
€114 €121
40
50
60
70
80
90
100
110
120
130
Co
st o
f al
low
ance
s re
qu
ired
per
ro
un
d-t
rip
SWISS AVRO 146-RJ100 KLM Cityhopper Fokker 100
REGIONAL: ZRH–AMSGCD: 603 km
Google mapsGoogle maps
LX RJ100
KL F.100
Allowance cost per pax* €2.08 €1.80
Typical round-trip fare €130
CO2 allowance add-on 1.6% 1.4%
Assuming round-trip, 65% load factor, €40 cost per allowance
www.ecometrica.co.uk 16
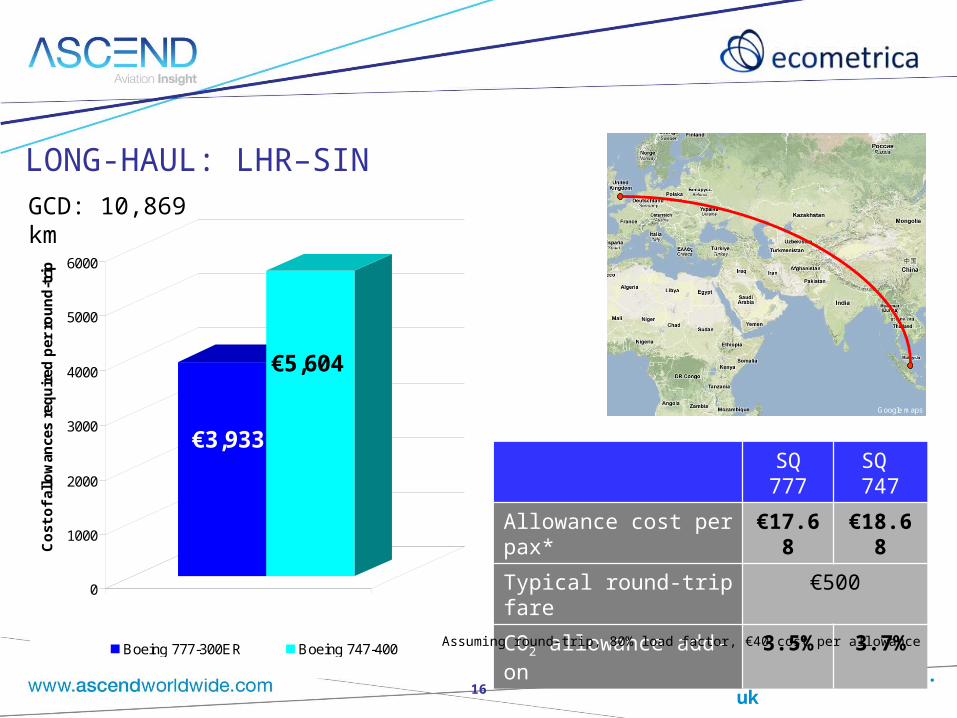
€3,933
€5,604
0
1000
2000
3000
4000
5000
6000
Co
st o
f al
low
ance
s re
qu
ired
per
ro
un
d-t
rip
Boeing 777-300ER Boeing 747-400
LONG-HAUL: LHR–SINGCD: 10,869 km
SQ 777
SQ 747
Allowance cost per pax* €17.68 €18.68
Typical round-trip fare €500
CO2 allowance add-on 3.5% 3.7%
Google maps
Assuming round-trip, 80% load factor, €40 cost per allowance

www.ecometrica.co.uk 1717
Scenario – EU ETS Compliant, Purchase 18% of Allowances– Short Haul Airbus A320
COMPLIANT
ETS allowance costApprox. €144,000
www.ecometrica.co.uk 1818
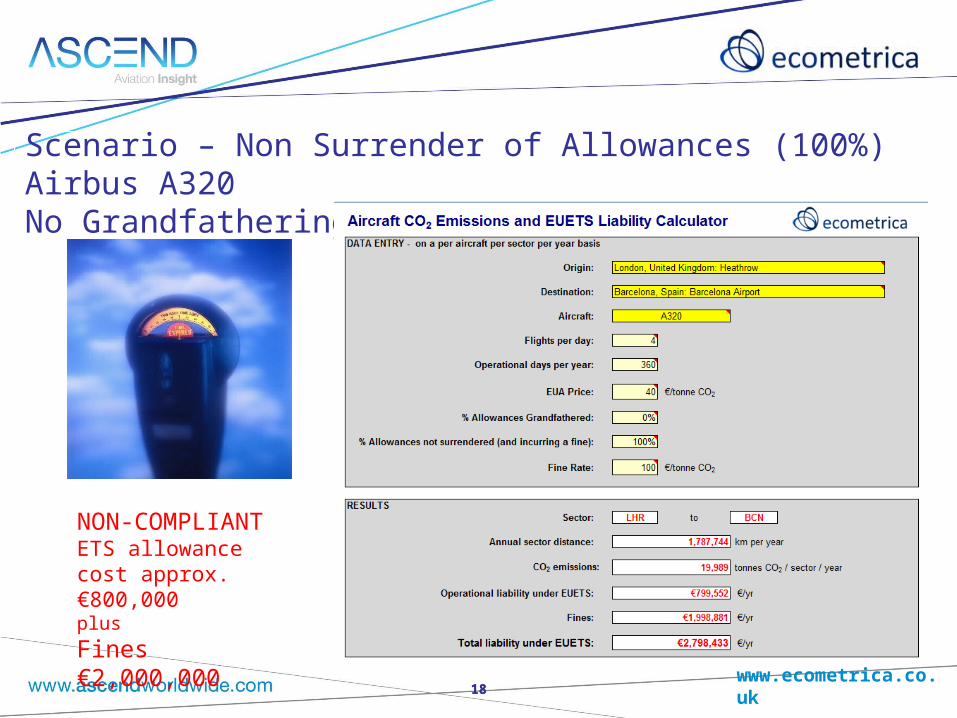
Scenario – Non Surrender of Allowances (100%) Airbus A320 No Grandfathering
NON-COMPLIANTETS allowance cost approx. €800,000plus
Fines €2,000,000
www.ecometrica.co.uk 19
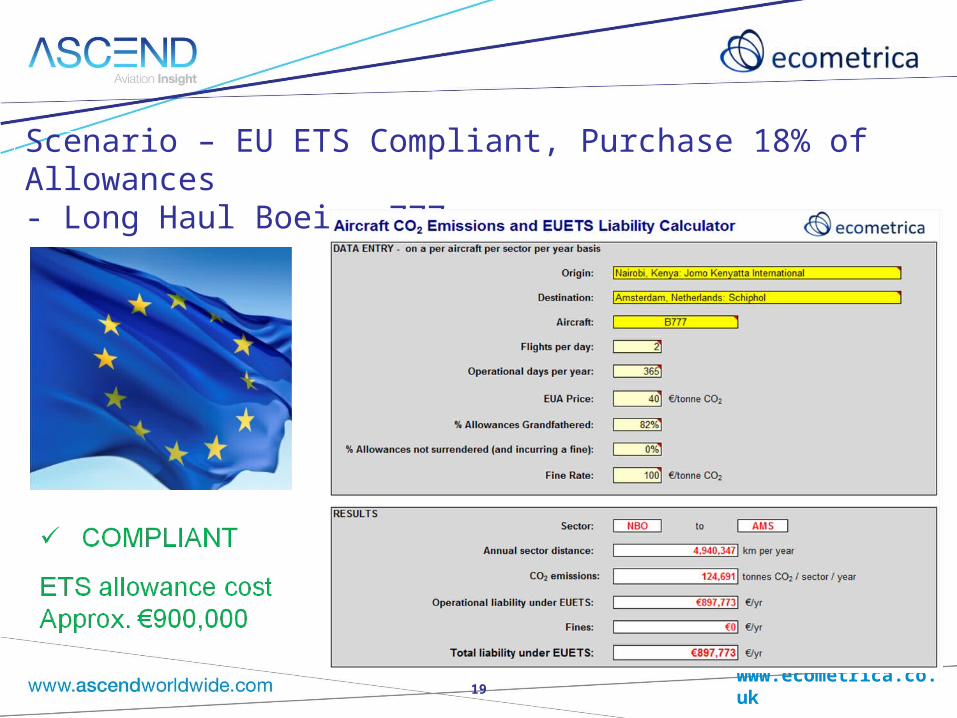
Scenario – EU ETS Compliant, Purchase 18% of Allowances - Long Haul Boeing 777

www.ecometrica.co.uk 20
Scenario – Non Surrender of Allowances (100%), No Grandfathering – Long Haul Boeing B777
NON-COMPLIANTETS allowance cost approx. €5,000,000 plus
Fines €12,500,000

www.ecometrica.co.uk 21
SUMMARY AND KEY TAKE-AWAY POINTS
EU ETS: equivalent to fuel tax Allowance costs directly proportional to fuel burnt
Penalties for non-compliance are stiff
Practical implications still far from set in stone
Supply-side costs vs demand elasticity — ability to pass on
costs will vary by market
Technology development incentives e.g., engine tech,
biofuels – weak, but will eventually strengthen as fossil fuel
prices rise