Practical Absorption Spectrometry: Ultraviolet Spectrometry Group
Upload
brayden-nurseCategory
view
224download
3
1
www.bioalgorithms.infoAn Introduction to Bioinformatics Algorithms
Protein Sequencing and
Identification by Mass
Spectrometry

An Introduction to Bioinformatics Algorithms www.bioalgorithms.info
2TK modified for WMU CS 6030
Outline• Introduction to Protein Structure
• Peptide Mass Spectra
• De Novo Peptide Sequencing
• Spectrum Graphs
• Protein Identification via Database Search
• Spectral Convolution
• Spectral Alignment Problem

An Introduction to Bioinformatics Algorithms www.bioalgorithms.info
TK Added for WMU CS 6030 3
Why are proteins and their sequences important?• Necessary in order to understand how cells and their
biochemical pathways function.• A unique set of proteins is involved in each function• Each organism has a unique set of expressed proteins• Each type of cell / tissue has a unique set of expressed
proteins• A key to understanding how the brain or liver works is to
determine what proteins they produce

An Introduction to Bioinformatics Algorithms www.bioalgorithms.info
4
Basic Summary of Protein Structure• A polypeptide is a polymer of amino acid
residues, a linear chain based on amino acids
• A polypeptide can be completely specified by indicating the sequence of amino acids
• A protein is a collection of one more peptides bonded together

An Introduction to Bioinformatics Algorithms www.bioalgorithms.info
The Amino Acids
5

An Introduction to Bioinformatics Algorithms www.bioalgorithms.info
6
Amino Acids – the basic building block

An Introduction to Bioinformatics Algorithms www.bioalgorithms.info
7
• Two amino acids can combine to form a dipeptide
Formation of polypeptides
• Structure in blue is a peptide link• If many amino acids are joined, we call it a
polypeptide
An Introduction to Bioinformatics Algorithms www.bioalgorithms.info
8
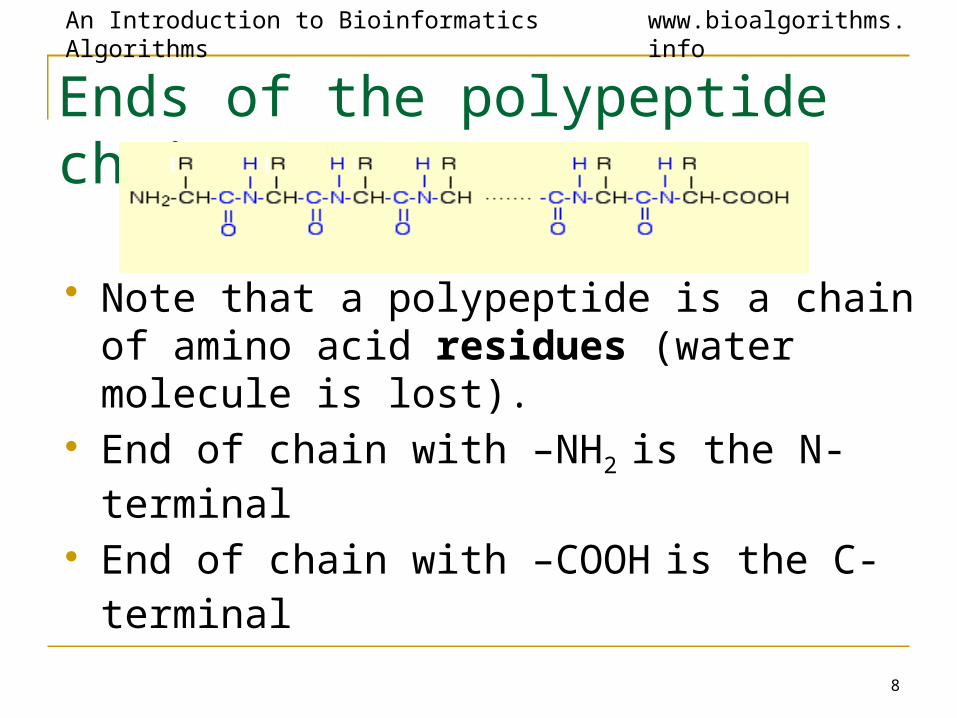
• Note that a polypeptide is a chain of amino acid residues (water molecule is lost).
• End of chain with –NH2 is the N-terminal
• End of chain with –COOH is the C-terminal
Ends of the polypeptide chain

An Introduction to Bioinformatics Algorithms www.bioalgorithms.info
9
Polypeptides -> Proteins

An Introduction to Bioinformatics Algorithms www.bioalgorithms.info
10
Proteins can be complex structures

An Introduction to Bioinformatics Algorithms www.bioalgorithms.info
11TK added for WMU CS 6030
• Break proteins into peptide chain fragments• Use enzymes to cut into pieces
• Further break apart peptide chains using mass spectrometry• Peptide chains will break up in a manner predictable by
molecular physics• The masses of the molecular fragments will collectively
deliver a “mass spectrum” from which the sequence can be derived
• First, we’ll explore the ways that mass spectrometry can break peptides apart
De Novo Sequencing Strategy

An Introduction to Bioinformatics Algorithms www.bioalgorithms.info
12
Masses of Amino Acid Residues

An Introduction to Bioinformatics Algorithms www.bioalgorithms.info
13
The Periodic Table (part of it!)

An Introduction to Bioinformatics Algorithms www.bioalgorithms.info
14
Protein Backbone
H...-HN-CH-CO-NH-CH-CO-NH-CH-CO-…OH
Ri-1 Ri Ri+1
AA residuei-1 AA residuei AA residuei+1
N-terminus C-terminus

An Introduction to Bioinformatics Algorithms www.bioalgorithms.info
15
Peptide Fragmentation
• Peptides tend to fragment along the backbone.• Fragments can also loose neutral chemical groups
like NH3 and H2O.
H...-HN-CH-CO . . . NH-CH-CO-NH-CH-CO-…OH
Ri-1 Ri Ri+1
H+
Prefix Fragment Suffix Fragment
Collision Induced Dissociation

An Introduction to Bioinformatics Algorithms www.bioalgorithms.info
16
Breaking Protein into Peptides and Peptides into Fragment Ions• Proteases, e.g. trypsin, break protein into
peptides.• A Tandem Mass Spectrometer further breaks the
peptides down into fragment ions and measures the mass of each piece.
• Mass Spectrometer accelerates the fragmented ions; heavier ions accelerate slower than lighter ones.
• Mass Spectrometer measure mass/charge ratio of an ion.

An Introduction to Bioinformatics Algorithms www.bioalgorithms.info
17
N- and C-terminal Peptides
N-term
inal
pep
tides
C-te
rmin
al p
eptid
es
An Introduction to Bioinformatics Algorithms www.bioalgorithms.info
18
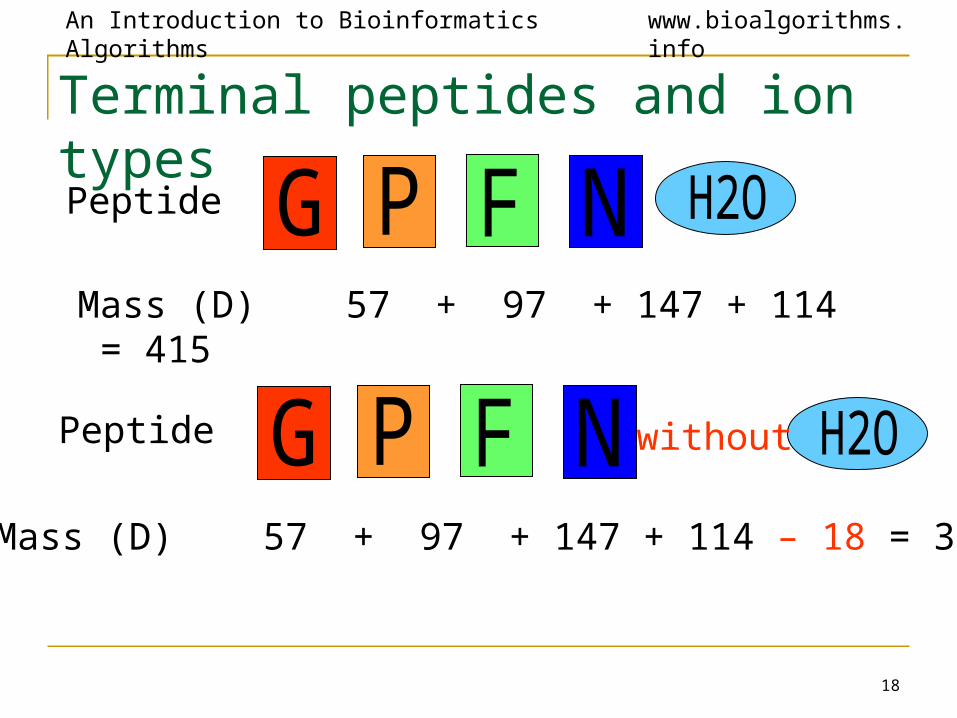
Terminal peptides and ion types
Peptide
Mass (D) 57 + 97 + 147 + 114 = 415
Peptide
Mass (D) 57 + 97 + 147 + 114 – 18 = 397
without

An Introduction to Bioinformatics Algorithms www.bioalgorithms.info
19
N- and C-terminal Peptides
N-term
inal
pep
tides
C-te
rmin
al p
eptid
es
415
486
301
154
57
71
185
332
429

An Introduction to Bioinformatics Algorithms www.bioalgorithms.info
20
N- and C-terminal Peptides
N-term
inal
pep
tides
C-te
rmin
al p
eptid
es
415
486
301
154
57
71
185
332
429

An Introduction to Bioinformatics Algorithms www.bioalgorithms.info
21
Peptide Fragmentation
y3
b2
y2 y1
b3a2 a3
HO NH3+
| |
R1 O R2 O R3 O R4
| || | || | || |H -- N --- C --- C --- N --- C --- C --- N --- C --- C --- N --- C -- COOH | | | | | | | H H H H H H H
b2-H2O
y3 -H2O
b3- NH3
y2 - NH3
An Introduction to Bioinformatics Algorithms www.bioalgorithms.info
22
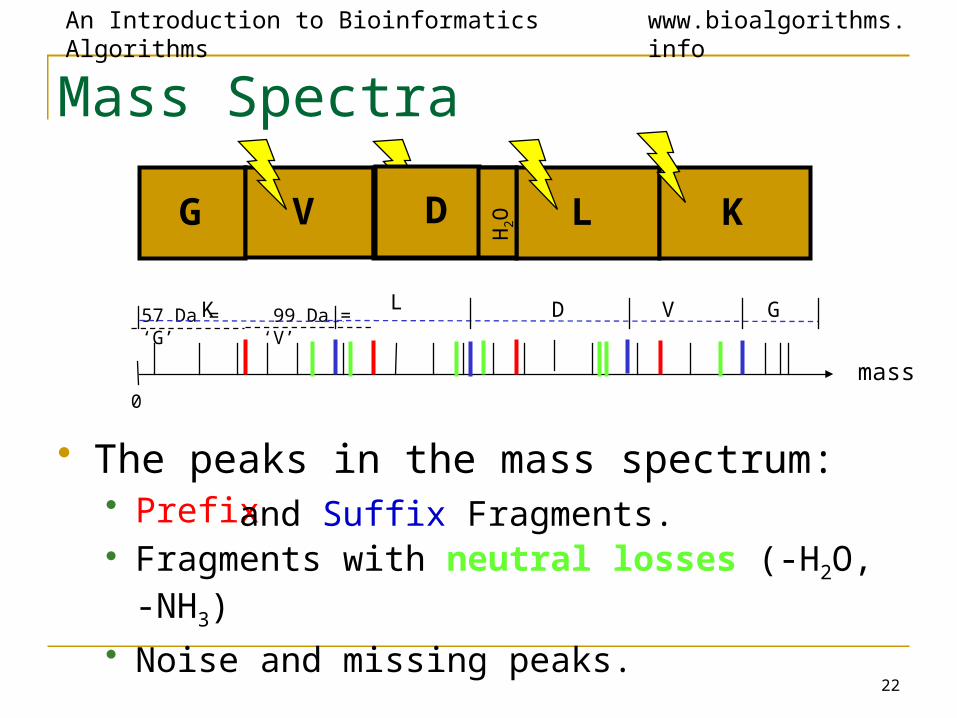
Mass Spectra
G V D L K
mass0
57 Da = ‘G’ 99 Da = ‘V’LK D V G
• The peaks in the mass spectrum:• Prefix • Fragments with neutral losses (-H2O, -NH3)
• Noise and missing peaks.
and Suffix Fragments.
D
H2O

An Introduction to Bioinformatics Algorithms www.bioalgorithms.info
23
Protein Identification with MS/MS
G V D L K
mass0
Inte
nsity
mass0
MS/MSPeptide Identification:

An Introduction to Bioinformatics Algorithms www.bioalgorithms.info
24
Tandem Mass-Spectrometry

An Introduction to Bioinformatics Algorithms www.bioalgorithms.info
25
Breaking Proteins into Peptides
peptides
MPSER……
GTDIMRPAKID
……
HPLCTo MS/MSMPSERGTDIMRPAKID......
protein

An Introduction to Bioinformatics Algorithms www.bioalgorithms.info
26
Tandem Mass SpectrometryRT: 0.01 - 80.02
5 10 15 20 25 30 35 40 45 50 55 60 65 70 75 80Time (min)
0
10
20
30
40
50
60
70
80
90
100
Relati
ve Ab
undanc
e
13891991
1409 21491615 1621
14112147
161119951655
15931387
21551435 19872001 21771445 1661
19372205
1779 21352017
1313 22071307 23291105 17071095
2331
NL:1.52E8
Base Peak F: + c Full ms [ 300.00 - 2000.00]
S#: 1708 RT: 54.47 AV: 1 NL: 5.27E6T: + c d Full ms2 638.00 [ 165.00 - 1925.00]
200 400 600 800 1000 1200 1400 1600 1800 2000
m/z
0
5
10
15
20
25
30
35
40
45
50
55
60
65
70
75
80
85
90
95
100
Rel
ativ
e A
bund
ance
850.3
687.3
588.1
851.4425.0
949.4
326.0524.9
589.2
1048.6397.1226.9
1049.6489.1
629.0
Scan 1708
LC
S#: 1707 RT: 54.44 AV: 1 NL: 2.41E7F: + c Full ms [ 300.00 - 2000.00]
200 400 600 800 1000 1200 1400 1600 1800 2000
m/z
0
5
10
15
20
25
30
35
40
45
50
55
60
65
70
75
80
85
90
95
100
Rel
ativ
e Ab
unda
nce
638.0
801.0
638.9
1173.8872.3 1275.3
687.6944.7 1884.51742.11212.0783.3 1048.3 1413.9 1617.7
Scan 1707
MS
MS/MSIon
Source
MS-1collision
cell MS-2

An Introduction to Bioinformatics Algorithms www.bioalgorithms.info
27
Tandem Mass Spectrum• Tandem Mass Spectrometry (MS/MS): mainly
generates partial N- and C-terminal peptides • Spectrum consists of different ion types
because peptides can be broken in several places.
• Chemical noise often complicates the spectrum.
• Represented in 2-D: mass/charge axis vs. intensity axis
An Introduction to Bioinformatics Algorithms www.bioalgorithms.info
28
De Novo vs. Database Search S#: 1708 RT: 54.47 AV: 1 NL: 5.27E6T: + c d Full ms2 638.00 [ 165.00 - 1925.00]
200 400 600 800 1000 1200 1400 1600 1800 2000m/z
0
5
10
15
20
25
30
35
40
45
50
55
60
65
70
75
80
85
90
95
100
Re
lative
Ab
un
da
nce
850.3
687.3
588.1
851.4425.0
949.4
326.0524.9
589.2
1048.6397.1226.9
1049.6489.1
629.0
WR
A
C
VG
E
K
DW
LP
T
L T
WR
A
C
VG
E
K
DW
LP
T
L T
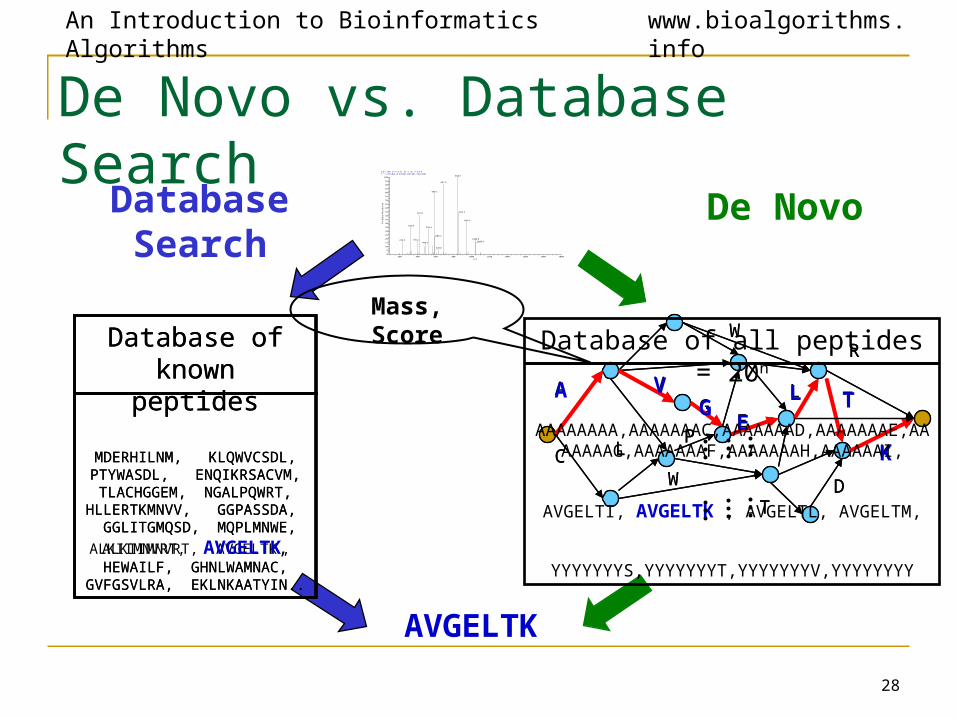
De Novo
AVGELTK
Database Search
Database of all peptides = 20n
AAAAAAAA,AAAAAAAC,AAAAAAAD,AAAAAAAE,AAAAAAAG,AAAAAAAF,AAAAAAAH,AAAAAAI,
AVGELTI, AVGELTK , AVGELTL, AVGELTM,
YYYYYYYS,YYYYYYYT,YYYYYYYV,YYYYYYYY
Database ofknown peptides
MDERHILNM, KLQWVCSDL, PTYWASDL, ENQIKRSACVM, TLACHGGEM, NGALPQWRT,
HLLERTKMNVV, GGPASSDA, GGLITGMQSD, MQPLMNWE,
ALKIIMNVRT, AVGELTK, HEWAILF, GHNLWAMNAC,
GVFGSVLRA, EKLNKAATYIN..
Database ofknown peptides
MDERHILNM, KLQWVCSDL, PTYWASDL, ENQIKRSACVM, TLACHGGEM, NGALPQWRT,
HLLERTKMNVV, GGPASSDA, GGLITGMQSD, MQPLMNWE,
ALKIIMNVRT, AVGELTK, HEWAILF, GHNLWAMNAC,
GVFGSVLRA, EKLNKAATYIN..
Mass, Score

An Introduction to Bioinformatics Algorithms www.bioalgorithms.info
29
De Novo vs. Database Search: A Paradox• The database of all peptides is huge ≈ O(20n) .
• The database of all known peptides is much smaller ≈ O(108).
• However, de novo algorithms can be much faster, even though their search space is much larger!
• A database search scans all peptides in the database of all known peptides search space to find best one.
• De novo eliminates the need to scan database of all peptides by modeling the problem as a graph search.
An Introduction to Bioinformatics Algorithms www.bioalgorithms.info
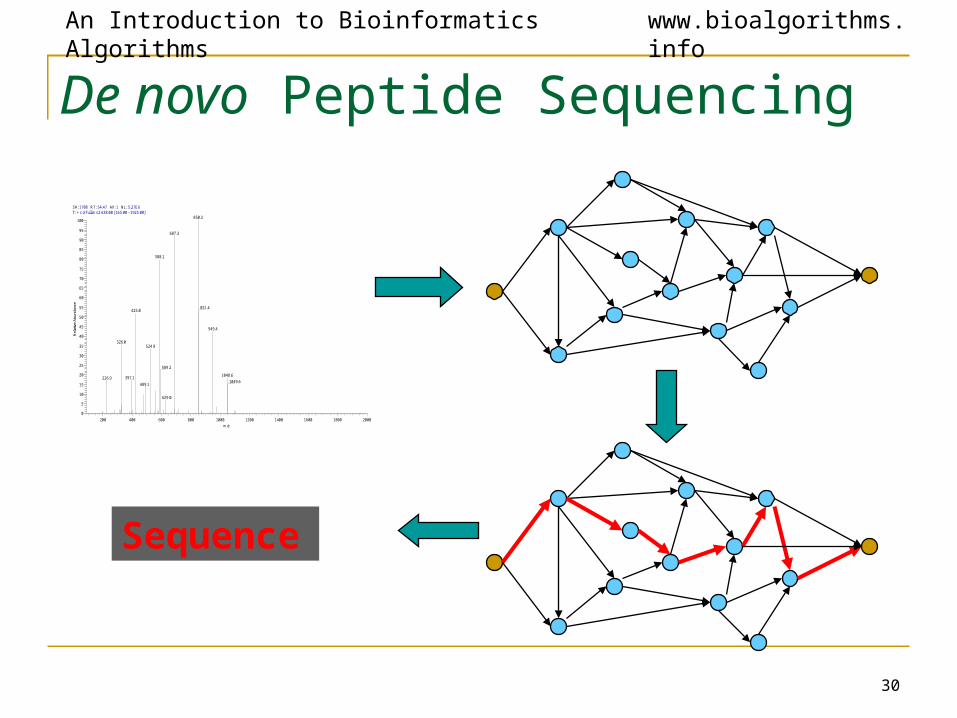
30
De novo Peptide Sequencing
S#: 1708 RT: 54.47 AV: 1 NL: 5.27E6T: + c d Full ms2 638.00 [ 165.00 - 1925.00]
200 400 600 800 1000 1200 1400 1600 1800 2000
m/z
0
5
10
15
20
25
30
35
40
45
50
55
60
65
70
75
80
85
90
95
100
Rel
ativ
e A
bund
ance
850.3
687.3
588.1
851.4425.0
949.4
326.0524.9
589.2
1048.6397.1226.9
1049.6489.1
629.0
Sequence

An Introduction to Bioinformatics Algorithms www.bioalgorithms.info
31
Theoretical Spectrum

An Introduction to Bioinformatics Algorithms www.bioalgorithms.info
32
Theoretical Spectrum (cont’d)

An Introduction to Bioinformatics Algorithms www.bioalgorithms.info
33
Theoretical Spectrum (cont’d)

An Introduction to Bioinformatics Algorithms www.bioalgorithms.info
34TK added slide for WMU CS 6030
• Exhaustive Search• Involves analysis of 20L sequences of length L• Branch and bound advisable, but success has
been limited
• Analysis of Spectrum Graph• Based on experimental spectrum rather than all
possible matches to possible spectra
Two approaches to determining sequence from the mass spectra

An Introduction to Bioinformatics Algorithms www.bioalgorithms.info
35
Building Spectrum Graph• How to create vertices (from masses)
• How to create edges (from mass differences)
• How to score paths
• How to find best path

An Introduction to Bioinformatics Algorithms www.bioalgorithms.info
36
Ion Types• Some masses correspond to fragment
ions, others are just random noise
• Knowing ion types Δ={δ1, δ2,…, δk} lets us
distinguish fragment ions from noise
• We can learn ion types δi and their
probabilities qi by analyzing a large test
sample of annotated spectra.

An Introduction to Bioinformatics Algorithms www.bioalgorithms.info
37TK modified slide for WMU CS 6030
Example of Ion Type
• Δ={δ1, δ2,…, δk}
• Ion types
{b, b-NH3, b-H2O}
correspond to
Δ={0, 17, 18}
• This is a set of masses of chemical groups frequently cleaved from
peptide fragments during bombardment of molecules with electrons
in the mass spectrometer collision cell
*Note: In reality the δ value of ion type b is -1 but we will “hide” it for the sake of simplicity

An Introduction to Bioinformatics Algorithms www.bioalgorithms.info
38TK added slide for WMU CS 6030
• The theoretical spectra of peptide P is designated as T(P)
• T(P) can be calculated by subtracting all possible ion types Δ={δ1, δ2,…, δk} from all possible partial peptides of P
• Every partial peptide will have k masses in T(P)
Theoretical Spectra

An Introduction to Bioinformatics Algorithms www.bioalgorithms.info
39
Match between Spectra and the Shared Peak Count• The match between two spectra is the number of
masses (peaks) they share (Shared Peak Count or
SPC)
• In practice mass-spectrometrists use the weighted SPC
that reflects intensities of the peaks
• Match between experimental (S) and theoretical spectra
(T) is defined similarly

An Introduction to Bioinformatics Algorithms www.bioalgorithms.info
40
Peptide Sequencing ProblemGoal: Find a peptide with maximal match between
an experimental and theoretical spectrum.Input:
• S: experimental spectrum• Δ: set of possible ion types• m: parent mass
Output: • P: peptide with mass m, whose theoretical
spectrum T matches the experimental S spectrum the best

An Introduction to Bioinformatics Algorithms www.bioalgorithms.info
41
Vertices of Spectrum Graph• Masses of potential N-terminal peptides
• Vertices are generated by reverse shifts corresponding to ion types
Δ={δ1, δ2,…, δk}
• Every N-terminal peptide can generate up to k ions
m-δ1, m-δ2, …, m-δk
• Every mass s in an MS/MS spectrum generates k vertices
V(s) = {s+δ1, s+δ2, …, s+δk}
corresponding to potential N-terminal peptides
• Vertices of the spectrum graph: {initial vertex}V(s1) V(s2) ... V(sm) {terminal vertex}
An Introduction to Bioinformatics Algorithms www.bioalgorithms.info
42
Edges of Spectrum Graph
• Two vertices with mass difference
corresponding to an amino acid A:
• Connect with an edge labeled by A

An Introduction to Bioinformatics Algorithms www.bioalgorithms.info
43TK added slide for WMU CS 6030
• A possible peptide sequence is identified by finding a path from mass 0 to parent mass m in the resulting DAG
• Many possible sequences (paths) will typically be identified in the DAG
• The “best path” is identified by scoring using probabilities that are based on experimental data
Peptide Sequences

An Introduction to Bioinformatics Algorithms www.bioalgorithms.info
44
Path Score• p(P,S) = probability that peptide P produces
spectrum S= {s1,s2,…sq}
• p(P, s) = the probability that peptide P generates a peak (mass) s
• Scoring = computing probabilities
• p(P,S) = πsєS p(P, s)

An Introduction to Bioinformatics Algorithms www.bioalgorithms.info
45
• For a position t that represents ion type dj :
qj, if peak is generated at t
p(P,st) =
1-qj , otherwise
Peak Score

An Introduction to Bioinformatics Algorithms www.bioalgorithms.info
46
Peak Score (cont’d)
• For a position t that is not associated with an ion type:
qR , if peak is generated at t
pR(P,st) =
1-qR , otherwise
• qR = the probability of a noisy peak that does not correspond to any ion type

An Introduction to Bioinformatics Algorithms www.bioalgorithms.info
47
Finding Optimal Paths in the Spectrum Graph
• For a given MS/MS spectrum S, find a peptide P’ maximizing p(P,S) over all possible peptides P:
• Peptides = paths in the spectrum graph
• P’ = the optimal path in the spectrum graph
p(P,S)p(P',S) Pmax

An Introduction to Bioinformatics Algorithms www.bioalgorithms.info
48
Ions and Probabilities• Tandem mass spectrometry is characterized
by a set of ion types {δ1,δ2,..,δk} and their probabilities {q1,...,qk}
• δi-ions of a partial peptide are produced independently with probabilities qi

An Introduction to Bioinformatics Algorithms www.bioalgorithms.info
49
Ions and Probabilities
• A peptide has all k peaks with probability
• and no peaks with probability
• A peptide also produces a ``random noise'' with uniform probability qR in any position.
k
iiq
1
k
iiq
1
)1(

An Introduction to Bioinformatics Algorithms www.bioalgorithms.info
50
Ratio Test Scoring for Partial Peptides
• Incorporates premiums for observed ions and penalties for missing ions.
• Example: for k=4, assume that for a partial peptide P’ we only see ions δ1,δ2,δ4.
The score is calculated as:RRRR q
q
q
q
q
q
q
q 4321
)1(
)1(

An Introduction to Bioinformatics Algorithms www.bioalgorithms.info
51
Scoring Peptides
• T- set of all positions.
• Ti={t δ1,, t δ2,..., ,t δk,}- set of positions that represent ions of partial peptides Pi.
• A peak at position tδj is generated with probability qj.
• R=T- U Ti - set of positions that are not associated with any partial peptides (noise).
An Introduction to Bioinformatics Algorithms www.bioalgorithms.info
52
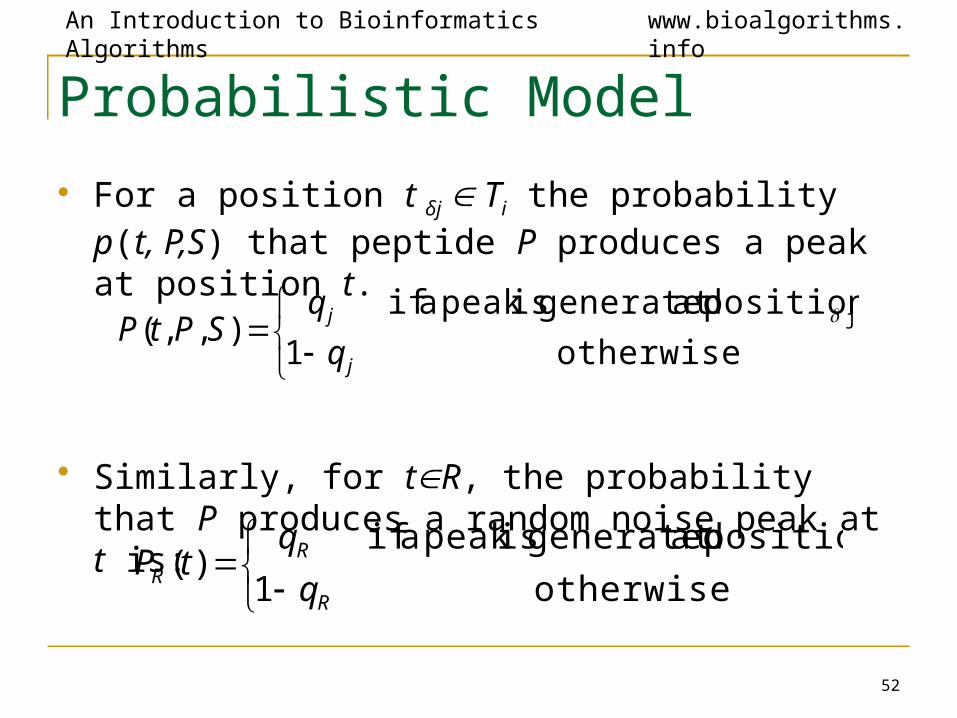
Probabilistic Model
• For a position t δj Ti the probability p(t, P,S) that peptide P produces a peak at position t.
• Similarly, for tR, the probability that P produces a random noise peak at t is:
otherwise1
position tat generated ispeak a if),,( j
j
j
q
qSPtP
otherwise1
position tat generated ispeak a if)(
R
RR q
qtP

An Introduction to Bioinformatics Algorithms www.bioalgorithms.info
53
Probabilistic Score
• For a peptide P with n amino acids, the score for the whole peptides is expressed by the following ratio test:
n
i
k
j iR
i
R j
j
tp
SPtp
Sp
SPp
1 1 )(
),,(
)(
),(

An Introduction to Bioinformatics Algorithms www.bioalgorithms.info
54TK added slide for WMU CS 6030
• Graph experimental spectrum S = {s1,…,sq}
• Label directed edges in graph that correspond to the mass of a single amino acid
• Find all possible peptide sequences, which are paths from 0 to m in the DAG
• Score possible sequences using probabilities of specific ion masses occurring
• Select the sequence with the maximum score
Summary of Steps for Peptide Sequencing using a Spectrum Graph (8.12)

An Introduction to Bioinformatics Algorithms www.bioalgorithms.info
55
• De novo sequencing is often not feasible with experimental data because the resulting spectra may be incomplete
• However, de novo algorithm is much faster!• Since thousands of proteins have been sequenced, a
database search is possible• Database search is therefore a more practical solution in
most cases• May save time in assay/experiment design
• SEQUEST is a program that implements database search algorithm
Protein Identification via Database Search (8.13)
Added by TK for WMU CS 6030References: http://fields.scripps.edu/sequest/. http://en.wikipedia.org/wiki/SEQUEST

An Introduction to Bioinformatics Algorithms www.bioalgorithms.info
56
De Novo vs. Database Search: A Paradox
• de novo algorithms are much faster, even though their search space is much larger!
• A database search scans all peptides in the search space to find best one.
• De novo eliminates the need to scan all peptides by modeling the problem as a graph search.
Why not sequence de novo?

An Introduction to Bioinformatics Algorithms www.bioalgorithms.info
57
Peptide Sequencing ProblemGoal: Find a peptide with maximal match between
an experimental and theoretical spectrum.Input:
• S: experimental spectrum• Δ: set of possible ion types• m: parent mass
Output: • A peptide with mass m, whose theoretical
spectrum matches the experimental S spectrum the best

An Introduction to Bioinformatics Algorithms www.bioalgorithms.info
58
Peptide Identification ProblemGoal: Find a peptide from the database with
maximal match between an experimental and theoretical spectrum.
Input:• S: experimental spectrum• database of peptides• Δ: set of possible ion types• m: parent mass
Output: • A peptide of mass m from the database whose
theoretical spectrum matches the experimental S spectrum the best

An Introduction to Bioinformatics Algorithms www.bioalgorithms.info
59
MS/MS Database Search
Database search in mass-spectrometry has been very successful in identification of already known proteins.
Experimental spectrum can be compared with theoretical spectra of database peptides to find the best fit.
SEQUEST (Yates et al., 1995)
But reliable algorithms for identification of modified peptides is a much more difficult problem.

An Introduction to Bioinformatics Algorithms www.bioalgorithms.info
61
The dynamic nature of the proteome • The proteome of the cell
is changing• Various extra-cellular,
and other signals activate pathways of proteins.
• A key mechanism of protein activation is post-translational modification (PTM)
• These pathways may lead to other genes being switched on or off
• Mass spectrometry is key to probing the proteome and detecting PTMs

An Introduction to Bioinformatics Algorithms www.bioalgorithms.info
62
Post-Translational ModificationsProteins are involved in cellular signaling and
metabolic regulation.
They are subject to a large number of biological modifications.
Almost all protein sequences are post-translationally modified and 200 types of modifications of amino acid residues are known.

An Introduction to Bioinformatics Algorithms www.bioalgorithms.info
63
Examples of Post-Translational Modification
Post-translational modifications increase the number of “letters” in amino acid alphabet and lead to a combinatorial explosion in both database search and de novo approaches.
An Introduction to Bioinformatics Algorithms www.bioalgorithms.info
64
Search for Modified Peptides: Virtual Database ApproachYates et al.,1995: an exhaustive search in a virtual
database of all modified peptides.
Exhaustive search leads to a large combinatorial problem, even for a small set of modifications types.
Problem (Yates et al.,1995). Extend the virtual database approach to a large set of modifications.

An Introduction to Bioinformatics Algorithms www.bioalgorithms.info
65
Exhaustive Search for modified peptides.
• YFDSTDYNMAK
• 25=32 possibilities, with 2 types of modifications!
Phosphorylation?
Oxidation?
• For each peptide, generate all modifications.
• Score each modification.

An Introduction to Bioinformatics Algorithms www.bioalgorithms.info
66
Peptide Identification Problem RevisitedGoal: Find a peptide from the database with
maximal match between an experimental and theoretical spectrum.
Input:• S: experimental spectrum• database of peptides• Δ: set of possible ion types• m: parent mass
Output: • A peptide of mass m from the database whose
theoretical spectrum matches the experimental S spectrum the best

An Introduction to Bioinformatics Algorithms www.bioalgorithms.info
67
Modified Peptide Identification ProblemGoal: Find a modified peptide from the database with maximal
match between an experimental and theoretical spectrum.Input:
• S: experimental spectrum• database of peptides• Δ: set of possible ion types• m: parent mass• Parameter k (# of mutations/modifications)
Output: • A peptide of mass m that is at most k
mutations/modifications apart from a database peptide and whose theoretical spectrum matches the experimental S spectrum the best

An Introduction to Bioinformatics Algorithms www.bioalgorithms.info
68
Database Search: Sequence Analysis vs. MS/MS Analysis

An Introduction to Bioinformatics Algorithms www.bioalgorithms.info
69
Peptide Identification Problem: Challenge
Very similar peptides may have very different spectra!
Goal: Define a notion of spectral similarity that correlates well with the sequence similarity.
If peptides are a few mutations/modifications apart, the spectral similarity between their spectra should be high.

An Introduction to Bioinformatics Algorithms www.bioalgorithms.info
70
Deficiency of the Shared Peaks Count
Shared peaks count (SPC): intuitive measure of spectral similarity.
Problem: SPC diminishes very quickly as the number of mutations increases.
Only a small portion of correlations between the spectra of mutated peptides is captured by SPC.

An Introduction to Bioinformatics Algorithms www.bioalgorithms.info
71
SPC Diminishes Quickly
S(PRTEIN) = {98, 133, 246, 254, 355, 375, 476, 484, 597, 632}
S(PRTEYN) = {98, 133, 254, 296, 355, 425, 484, 526, 647, 682}
S(PGTEYN) = {98, 133, 155, 256, 296, 385, 425, 526, 548, 583}
no mutations
SPC=10
1 mutation
SPC=5
2 mutations
SPC=2

An Introduction to Bioinformatics Algorithms www.bioalgorithms.info
72
Spectral Convolution
)0)((
))((,
12
12
122211
22111212
:
SS
xSSssSsSs
}S,sS:ss{sSS
x
:peak) (SPC count peaks shared The
with pairs of Number

An Introduction to Bioinformatics Algorithms www.bioalgorithms.info
73
Elements of S2 S1 represented as elements of a difference matrix. The elements with multiplicity >2 are colored; the elements with multiplicity =2 are circled. The SPC takes into account only the red entries

An Introduction to Bioinformatics Algorithms www.bioalgorithms.info
74
• The simplest approach is to base comparison only on SPC
• A more sophisticated, but still naïve, approach is to consider the mass differences that correspond to a known peptide modification. A high multiplicity of such a difference would indicate a possible match.
Naïve approaches to using Spectral Convolution
Added by TK for WMU CS 6030References: http://fields.scripps.edu/sequest/. http://en.wikipedia.org/wiki/SEQUEST

An Introduction to Bioinformatics Algorithms www.bioalgorithms.info
75
Spectral Comparison: Difficult Case
S = {10, 20, 30, 40, 50, 60, 70, 80, 90, 100}
Which of the spectra
S’ = {10, 20, 30, 40, 50, 55, 65, 75,85, 95}
or
S” = {10, 15, 30, 35, 50, 55, 70, 75, 90, 95}
fits the spectrum S the best?
SPC: both S’ and S” have 5 peaks in common with S.
Spectral Convolution: reveals the peaks at 0 and 5.

An Introduction to Bioinformatics Algorithms www.bioalgorithms.info
76
Spectral Comparison: Difficult Case
S S’
S S’’

An Introduction to Bioinformatics Algorithms www.bioalgorithms.info
77
Limitations of the Spectrum Convolutions
Spectral convolution does not reveal that spectra S and S’ are similar, while spectra S and S” are not.
Clumps of shared peaks: the matching positions in S’ come in clumps while the matching positions in S” don't.
This important property was not captured by spectral convolution.

An Introduction to Bioinformatics Algorithms www.bioalgorithms.info
78
Shifts
A = {a1 < … < an} : an ordered set of natural numbers.
A shift (i,) is characterized by two parameters,
the position (i) and the length ().The shift (i,) transforms
{a1, …., an}
into
{a1, ….,ai-1,ai+,…,an+ }

An Introduction to Bioinformatics Algorithms www.bioalgorithms.info
79
Shifts: An Example
The shift (i,) transforms {a1, …., an}
into {a1, ….,ai-1,ai+,…,an+ }
e.g.
10 20 30 40 50 60 70 80 90
10 20 30 35 45 55 65 75 85
10 20 30 35 45 55 62 72 82
shift (4, -5)
shift (7,-3)

An Introduction to Bioinformatics Algorithms www.bioalgorithms.info
80
Spectral Alignment Problem
• Find a series of k shifts that make the sets
A={a1, …., an} and B={b1,….,bn}
as similar as possible.
• k-similarity between sets
• D(k) - the maximum number of elements in common between sets after k shifts.

An Introduction to Bioinformatics Algorithms www.bioalgorithms.info
81TK modified for WMU CS 6030
Summary• Introduction to Protein Structure
• Peptide Mass Spectra
• De Novo Peptide Sequencing
• Spectrum Graphs
• Protein Identification via Database Search
• Spectral Convolution
• Spectral Alignment Problem

An Introduction to Bioinformatics Algorithms www.bioalgorithms.info
82TK added for WMU CS 6030
References• Jones, Neil C., and Pevzner, Pavel A., An Introduction to Bioinformatics Algorithms,
chapter 8, and Mass Spectrometry slides at http://bix.ucsd.edu/bioalgorithms/slides.php
• Russell, Peter J., iGenetics, A Molecular Approach, chapter 6 (Gene Expression: Translation)
• Hoppe, Pamela (WMU), lecture slides from BIOS 2500 (General Genetics)
• “The Structure of Proteins”, http://www.chemguide.co.uk/organicprops/aminoacids/proteinstruct.html
• SEQUEST site, http://fields.scripps.edu/sequest/

An Introduction to Bioinformatics Algorithms www.bioalgorithms.info
83TK modified for WMU CS 6030
Additional Slides from Bioinformatics.info

An Introduction to Bioinformatics Algorithms www.bioalgorithms.info
84
Representing Spectra in 0-1 Alphabet
• Convert spectrum to a 0-1 string with 1s corresponding to the positions of the peaks.

An Introduction to Bioinformatics Algorithms www.bioalgorithms.info
85
Comparing Spectra=Comparing 0-1 Strings• A modification with positive offset corresponds to
inserting a block of 0s• A modification with negative offset corresponds to
deleting a block of 0s• Comparison of theoretical and experimental spectra
(represented as 0-1 strings) corresponds to a (somewhat unusual) edit distance/alignment problem where elementary edit operations are insertions/deletions of blocks of 0s
• Use sequence alignment algorithms!

An Introduction to Bioinformatics Algorithms www.bioalgorithms.info
86
Spectral Alignment vs. Sequence Alignment• Manhattan-like graph with different alphabet
and scoring.• Movement can be diagonal (matching
masses) or horizontal/vertical (insertions/deletions corresponding to PTMs).
• At most k horizontal/vertical moves.

An Introduction to Bioinformatics Algorithms www.bioalgorithms.info
87
Spectral ProductA={a1, …., an} and B={b1,…., bn}
Spectral product AB: two-dimensional matrix with nm 1s corresponding to all pairs of
indices (ai,bj) and remaining
elements being 0s.
10 20 30 40 50 55 65 75 85 95
1 1 1 1 1 1 1 1 1 1
1 1 1 1 1 1 1 1 1 1
1 1 1 1 1 1 1 1 1 1
1 1 1 1 1 1 1 1 1 1
1 1 1 1 1 1 1 1 1 1
1 1 1 1 1 1 1 1 1 1
1 1 1 1 1 1 1 1 1 1
1 1 1 1 1 1 1 1 1 1
1 1 1 1 1 1 1 1 1 1
1 1 1 1 1 1 1 1 1 1
SPC: the number of 1s at the main diagonal.
-shifted SPC: the number of 1s on the diagonal (i,i+ )

An Introduction to Bioinformatics Algorithms www.bioalgorithms.info
88
Spectral Alignment: k-similarity k-similarity between spectra: the maximum number
of 1s on a path through this graph that uses at most k+1 diagonals.
k-optimal spectral
alignment = a path.
The spectral alignment allows one to detect more and more subtle similarities between spectra by increasing k.

An Introduction to Bioinformatics Algorithms www.bioalgorithms.info
89
SPC reveals only D(0)=3 matching peaks.
Spectral Alignment reveals more hidden similarities between spectra: D(1)=5 and D(2)=8 and detects corresponding mutations.
Use of k-Similarity

An Introduction to Bioinformatics Algorithms www.bioalgorithms.info
90
Black line represent the path for k=0
Red lines represent the path for k=1
Blue lines (right) represents the path for k=2

An Introduction to Bioinformatics Algorithms www.bioalgorithms.info
91
Spectral Convolution’ Limitation The spectral convolution considers diagonals
separately without combining them into feasible mutation scenarios.
D(1) =10 shift function score = 10 D(1) =6
10 20 30 40 50 55 65 75 85 95
10
20
30
40
50
60
70
80
90
100
10 15 30 35 50 55 70 75 90 95
10
20
30
40
50
60
70
80
90
100

An Introduction to Bioinformatics Algorithms www.bioalgorithms.info
92
Dynamic Programming for Spectral AlignmentDij(k): the maximum number of 1s on a path to
(ai,bj) that uses at most k+1 diagonals.
Running time: O(n4 k)
otherwisekD
jijiifkDkD
ji
ji
jijiij ,1)1(
),(~)','(,1)(max)(
''
''
),()','({
)(max)( kDkD ijij

An Introduction to Bioinformatics Algorithms www.bioalgorithms.info
93
Edit Graph for Fast Spectral Alignment
diag(i,j) – the position of previous 1 on the same diagonal as (i,j)

An Introduction to Bioinformatics Algorithms www.bioalgorithms.info
94
Fast Spectral Alignment Algorithm
1)1(
1)(max)(
1,1
),(
kM
kDkD
ji
jidiagij
)(max)( ''),()','(
kDkM jijiji
ij
)(
)(
)(
max)(
1,
,1
kM
kM
kD
kM
ji
ji
ij
ij
Running time: O(n2 k)

An Introduction to Bioinformatics Algorithms www.bioalgorithms.info
95
Spectral Alignment: Complications
Spectra are combinations of an increasing (N-terminal ions) and a decreasing (C-terminal ions) number series.
These series form two diagonals in the spectral product, the main diagonal and the perpendicular diagonal.
The described algorithm deals with the main diagonal only.

An Introduction to Bioinformatics Algorithms www.bioalgorithms.info
96
Spectral Alignment: Complications
• Simultaneous analysis of N- and C-terminal ions
• Taking into account the intensities and charges
• Analysis of minor ions
An Introduction to Bioinformatics Algorithms www.bioalgorithms.info
97
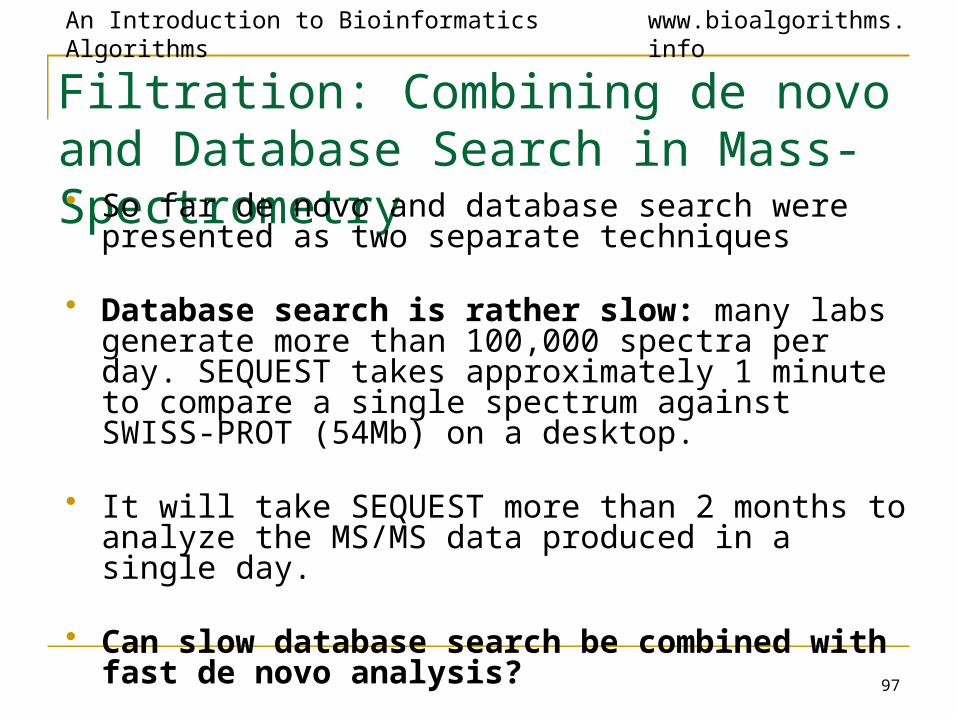
Filtration: Combining de novo and Database Search in Mass-Spectrometry• So far de novo and database search were presented as
two separate techniques
• Database search is rather slow: many labs generate more than 100,000 spectra per day. SEQUEST takes approximately 1 minute to compare a single spectrum against SWISS-PROT (54Mb) on a desktop.
• It will take SEQUEST more than 2 months to analyze the MS/MS data produced in a single day.
• Can slow database search be combined with fast de novo analysis?

An Introduction to Bioinformatics Algorithms www.bioalgorithms.info
98
Why Filtration ?
Scoring
Protein Query
Sequence Alignment – Smith Waterman Algorithm
Sequence matches
Protein Sequences
Filtration
Filtered Sequences
Sequence Alignment – BLAST
Database
actgcgctagctacggatagctgatccagatcgatgccataggtagctgatccatgctagcttagacataaagcttgaatcgatcgggtaacccatagctagctcgatcgacttagacttcgattcgatcgaattcgatctgatctgaatatattaggtccgatgctagctgtggtagtgatgtaaga
• BLAST filters out very few correct matches and is almost as accurate as Smith – Waterman algorithm.
Database
actgcgctagctacggatagctgatccagatcgatgccataggtagctgatccatgctagcttagacataaagcttgaatcgatcgggtaacccatagctagctcgatcgacttagacttcgattcgatcgaattcgatctgatctgaatatattaggtccgatgctagctgtggtagtgatgtaaga

An Introduction to Bioinformatics Algorithms www.bioalgorithms.info
99
Filtration and MS/MS
Scoring
MS/MS spectrum
Peptide Sequencing – SEQUEST / Mascot
Sequence matches
Peptide Sequences
Filtration
Peptide Sequences
Database
MDERHILNMKLQWVCSDLPTYWASDLENQIKRSACVMTLACHGGEMNGALPQWRTHLLERTYKMNVVGGPASSDALITGMQSDPILLVCATRGHEWAILFGHNLWACVNMLETAIKLEGVFGSV
LRAEKLNKAAPETYIN..
Database
MDERHILNMKLQWVCSDLPTYWASDLENQIKRSACVMTLACHGGEMNGALPQWRTHLLERTYKMNVVGGPASSDALITGMQSDPILLVCATRGHEWAILFGHNLWACVNMLETAIKLEGVFGSV
LRAEKLNKAAPETYIN..

An Introduction to Bioinformatics Algorithms www.bioalgorithms.info
100
Filtration in MS/MS Sequencing• Filtration in MS/MS is more difficult than in BLAST.
• Early approaches using Peptide Sequence Tags were not able to substitute the complete database search.
• Current filtration approaches are mostly used to generate additional identifications rather than replace the database search.
• Can we design a filtration based search that can replace the database search, and is orders of magnitude faster?

An Introduction to Bioinformatics Algorithms www.bioalgorithms.info
101
Asking the Old Question Again: Why Not Sequence De Novo?• De novo sequencing is still not very accurate!
Algorithm Amino Acid Accuracy
Whole Peptide Accuracy
Lutefisk (Taylor and Johnson, 1997). 0.566 0.189SHERENGA (Dancik et. al., 1999). 0.690 0.289Peaks (Ma et al., 2003). 0.673 0.246PepNovo (Frank and Pevzner, 2005). 0.727 0.296

An Introduction to Bioinformatics Algorithms www.bioalgorithms.info
102
So What Can be Done with De Novo? • Given an MS/MS spectrum:
• Can de novo predict the entire peptide sequence?
• Can de novo predict partial sequences?
• Can de novo predict a set of partial sequences, that with high probability, contains at least one correct tag?
A Covering Set of Tags
- No! (accuracy is less than 30%). - No!
(accuracy is 50% for GutenTag and 80% for PepNovo )
- Yes!

An Introduction to Bioinformatics Algorithms www.bioalgorithms.info
103
Peptide Sequence Tags
• A Peptide Sequence Tag is short substring of a peptide.
Example: G V D L KG V D V D L
D L K
Tags:

An Introduction to Bioinformatics Algorithms www.bioalgorithms.info
104
Filtration with Peptide Sequence Tags• Peptide sequence tags can be used as filters in
database searches.
• The Filtration: Consider only database peptides that contain the tag (in its correct relative mass location).
• First suggested by Mann and Wilm (1994).
• Similar concepts also used by:• GutenTag - Tabb et. al. 2003.• MultiTag - Sunayev et. al. 2003.• OpenSea - Searle et. al. 2004.

An Introduction to Bioinformatics Algorithms www.bioalgorithms.info
105
Why Filter Database Candidates?• Filtration makes genomic database searches practical
(BLAST).
• Effective filtration can greatly speed-up the process, enabling expensive searches involving post-translational modifications.
• Goal: generate a small set of covering tags and use them to filter the database peptides.

An Introduction to Bioinformatics Algorithms www.bioalgorithms.info
106
Tag Generation - Global Tags
• Parse tags from de novo reconstruction.• Only a small number of tags can be generated.• If the de novo sequence is completely incorrect,
none of the tags will be correct.
W
R
A
C
VG
EK
DW
LP
T
LT
AVGELTK
TAG Prefix Mass
AVG 0.0
VGE 71.0
GEL 170.1
ELT 227.1
LTK 356.2

An Introduction to Bioinformatics Algorithms www.bioalgorithms.info
107
Tag Generation - Local Tags
• Extract the highest scoring subspaths from the spectrum graph.
• Sometimes gets misled by locally promising-looking “garden paths”.
WR
A
C
VG
E
K
DW
LP
T
L T
TAG Prefix Mass
AVG 0.0
WTD 120.2
PET 211.4

An Introduction to Bioinformatics Algorithms www.bioalgorithms.info
108
Ranking Tags
• Each additional tag used to filter increases the number of database hits and slows down the database search.
• Tags can be ranked according to their scores, however this ranking is not very accurate.
• It is better to determine for each tag the “probability” that it is correct, and choose most probable tags.

An Introduction to Bioinformatics Algorithms www.bioalgorithms.info
109
Reliability of Amino Acids in Tags• For each amino acid in a tag we want to assign a
probability that it is correct.
• Each amino acid, which corresponds to an edge in the spectrum graph, is mapped to a feature space that consists of the features that correlate with reliability of amino acid prediction, e.g. score reduction due to edge removal

An Introduction to Bioinformatics Algorithms www.bioalgorithms.info
110
Score Reduction Due to Edge Removal
• The removal of an edge corresponding to a genuine amino acid usually leads to a reduction in the score of the de novo path.
• However, the removal of an edge that does not correspond to a genuine amino acid tends to leave the score unchanged.
WR
A
C
VG
K
DWL
P
T
L T
WR
A
C
VG
K
DWL
P
T
L T
WR
A
C
VG
K
DWL
P
T
L TE
W
WR
A
C
VG
K
DL
P
T
L T

An Introduction to Bioinformatics Algorithms www.bioalgorithms.info
111
Probabilities of Tags
• How do we determine the probability of a predicted tag ?
• We use the predicted probabilities of its amino acids and follow the concept:
a chain is only as strong as its weakest link

An Introduction to Bioinformatics Algorithms www.bioalgorithms.info
112
Experimental Results
• Results are for 280 spectra of doubly charged tryptic peptides from the ISB and OPD datasets.
Length 3 Length 4 Length 5
Algorithm \ #tags 1 10 1 10 1 10
GlobalTag 0.80 0.94 0.73 0.87 0.66 0.80
LocalTag+ 0.75 0.96 0.70 0.90 0.57 0.80
GutenTag 0.49 0.89 0.41 0.78 0.31 0.64

An Introduction to Bioinformatics Algorithms www.bioalgorithms.info
113
Tag-based Database Search
Tag filter SignificanceScore Tag extension
De novo
Db55M peptides
Candidate Peptides (700)

An Introduction to Bioinformatics Algorithms www.bioalgorithms.info
114
Matching Multiple Tags
• Matching of a sequence tag against a database is fast
• Even matching many tags against a database is fast
• k tags can be matched against a database in time proportional to database size, but independent of the number of tags.• keyword trees (Aho-Corasick algorithm)
• Scan time can be amortized by combining scans for many spectra all at once.
• build one keyword tree from multiple spectra

An Introduction to Bioinformatics Algorithms www.bioalgorithms.info
115
Keyword Trees
Y A K
SN
N
F
F
AT
YFAKYFNSFNTA
…..Y F R A Y F N T A…..

An Introduction to Bioinformatics Algorithms www.bioalgorithms.info
116
Tag Extension
Filter SignificanceScoreExtension
De novo
Db55M peptides
CandidatePeptides (700)

An Introduction to Bioinformatics Algorithms www.bioalgorithms.info
117
• Given: • tag with prefix and suffix masses <mP> xyz <mS>• match in the database
• Compute if a suffix and prefix match with allowable modifications.
• Compute a candidate peptide with most likely positions of modifications (attachment points).
Fast Extension
xyz<mP>xyz<mS>

An Introduction to Bioinformatics Algorithms www.bioalgorithms.info
118
Scoring Modified Peptides
Filter SignificanceScoreExtension
De novo
Db55M peptides

An Introduction to Bioinformatics Algorithms www.bioalgorithms.info
119
Scoring
• Input:• Candidate peptide with attached modifications• Spectrum
• Output:• Score function that normalizes for length, as
variable modifications can change peptide length.

An Introduction to Bioinformatics Algorithms www.bioalgorithms.info
120
Assessing Reliability of Identifications
Filter SignificanceScoreextension
De novo
Db55M peptides

An Introduction to Bioinformatics Algorithms www.bioalgorithms.info
121
Selecting Features for Separating Correct and Incorrect Predictions• Features:
• Score S: as computed• Explained Intensity I: fraction of total intensity explained by
annotated peaks.• b-y score B: fraction of b+y ions annotated• Explained peaks P: fraction of top 25 peaks annotated.
• Each of I,S,B,P features is normalized (subtract mean and divide by s.d.)
• Problem: separate correct and incorrect identifications using I,S,B,P

An Introduction to Bioinformatics Algorithms www.bioalgorithms.info
122
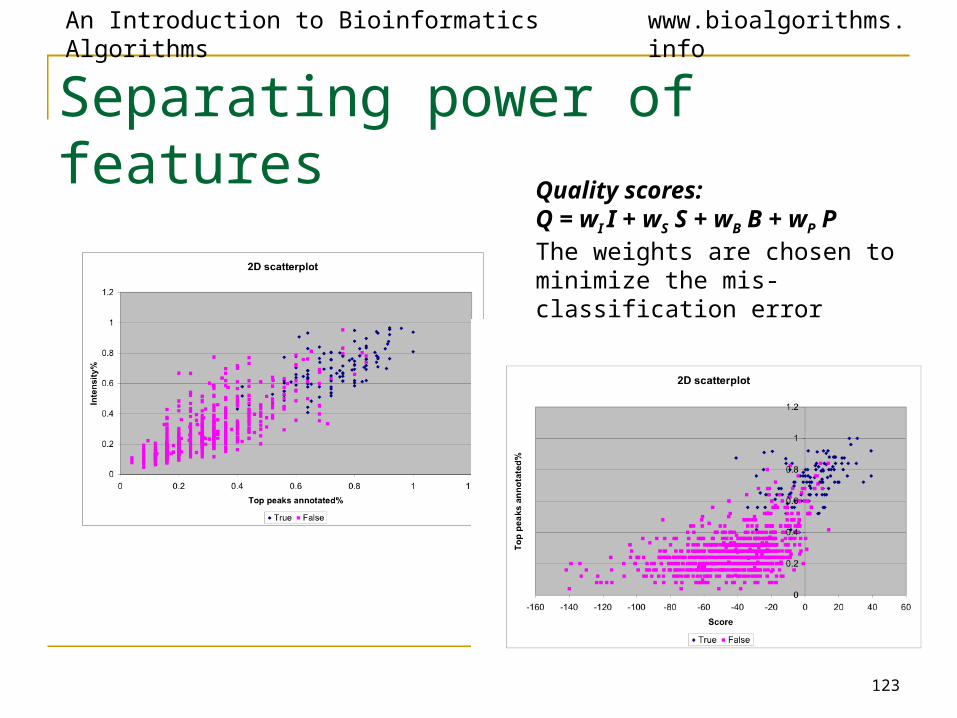
Separating power of features
An Introduction to Bioinformatics Algorithms www.bioalgorithms.info
123
Separating power of features
Quality scores:Q = wI I + wS S + wB B + wP PThe weights are chosen to minimize the mis-classification error

An Introduction to Bioinformatics Algorithms www.bioalgorithms.info
124
Distribution of Quality Scores

An Introduction to Bioinformatics Algorithms www.bioalgorithms.info
125
Results on ISB data-set
• All ISB spectra were searched. • The top match is valid for 2978 spectra (2765 for Sequest)• InsPecT-Sequest: 644 spectra (I-S dataset)• Sequest-InsPecT: 422 spectra (S-I dataset)• Average explained intensity of I-S = 52%• Average explained intensity of S-I = 28%• Average explained intensity IS = 58%• ~70 Met. Oxidations• Run time is 0.7 secs. per spectrum (2.7 secs. for Sequest)

An Introduction to Bioinformatics Algorithms www.bioalgorithms.info
126
Results for Mus-IMAC data-sets
• The Alliance for Cellular signalling is looking at proteins phosphorylated in specific signal transduction pathways.
• 6500 spectra are searched with upto 4 modifications (upto 3 Met. Oxidation and upto 2 Phos.)
• 281 phosphopeptides with P-value < 0.05
An Introduction to Bioinformatics Algorithms www.bioalgorithms.info
127
An Introduction to Bioinformatics Algorithms www.bioalgorithms.info
128
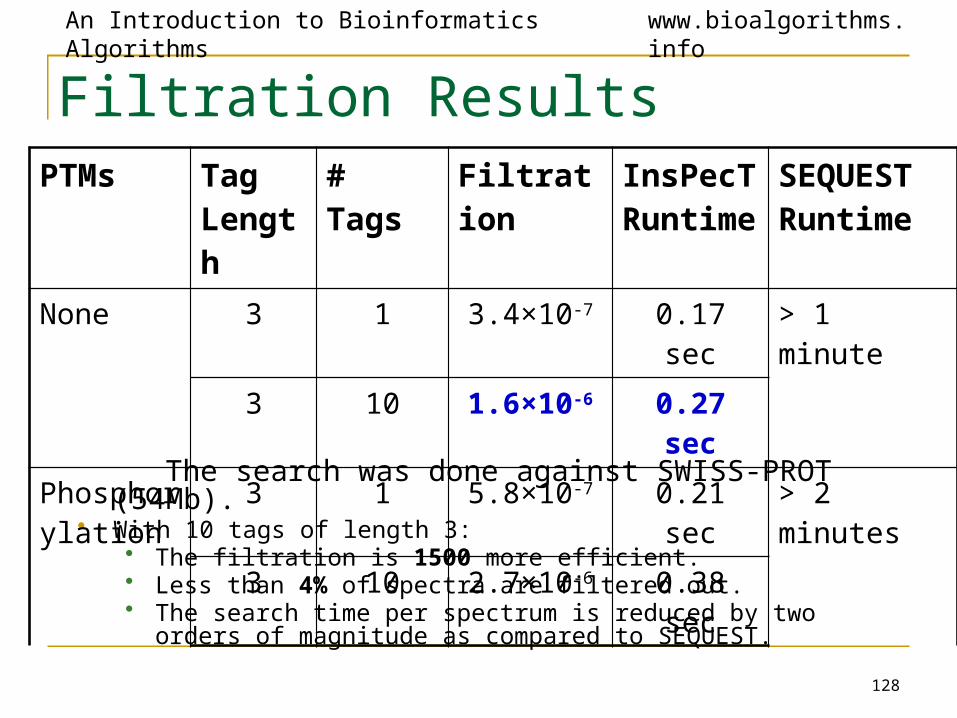
Filtration Results
The search was done against SWISS-PROT (54Mb).• With 10 tags of length 3:
• The filtration is 1500 more efficient.• Less than 4% of spectra are filtered out.• The search time per spectrum is reduced by two orders of magnitude
as compared to SEQUEST.
PTMs Tag Length
# Tags Filtration InsPecT Runtime
SEQUEST Runtime
None 3 1 3.4×10⁻⁷ 0.17 sec > 1 minute
3 10 1.6×10⁻⁶ 0.27 sec
Phosphorylation
3 1 5.8×10⁻⁷ 0.21 sec > 2 minutes
3 10 2.7×10⁻⁶ 0.38 sec
An Introduction to Bioinformatics Algorithms www.bioalgorithms.info
129
Conclusion• With 10 tags of length 3:
• The filtration is 1500 more efficient than using only the parent mass alone.
• Less than 4% of the positive peptides are filtered out.• The search time per spectrum is reduced from over a
minute (SEQUEST) to 0.4 seconds.

An Introduction to Bioinformatics Algorithms www.bioalgorithms.info
130
SPIDER: Yet Another Application of de novo Sequencing
• Suppose you have a good MS/MS spectrum of an elephant peptide
• Suppose you even have a good de novo reconstruction of this spectra
• However, until elephant genome is sequenced, it is hard to verify this de novo reconstruction
• Can you search de novo reconstruction of a peptide from elephant against human protein database?
• SPIDER (Han, Ma, Zhang ) addresses this comparative proteomics problem
Slides from Bin Ma, University of Western Ontario

An Introduction to Bioinformatics Algorithms www.bioalgorithms.info
131
Common de novo sequencing errors
GG
N and GG have the same mass

An Introduction to Bioinformatics Algorithms www.bioalgorithms.info
132
From de novo Reconstruction to Database Candidate through Real Sequence • Given a sequence with errors, search for
the similar sequences in a DB.
(Seq) X: LSCFAV(Real) Y: SLCFAV (Match) Z: SLCF-V
sequencing error
(Seq) X: LSCF-AV(Real) Y: EACF-AV (Match) Z: DACFKAV mass(LS)=mass(EA)
Homology mutations

An Introduction to Bioinformatics Algorithms www.bioalgorithms.info
133
Alignment between de novo Candidate and Database Candidate
• If real sequence Y is known then:
d(X,Z) = seqError(X,Y) + editDist(Y,Z)
(Seq) X: LSCF-AV(Real) Y: EACF-AV (Match) Z: DACFKAV

An Introduction to Bioinformatics Algorithms www.bioalgorithms.info
134
Alignment between de novo Candidate and Database Candidate
• If real sequence Y is known then:
d(X,Z) = seqError(X,Y) + editDist(Y,Z) • If real sequence Y is unknown then the distance between de
novo candidate X and database candidate Z: • d(X,Z) = minY ( seqError(X,Y) + editDist(Y,Z) )
(Seq) X: LSCF-AV(Real) Y: EACF-AV (Match) Z: DACFKAV

An Introduction to Bioinformatics Algorithms www.bioalgorithms.info
135
Alignment between de novo Candidate and Database Candidate
• If real sequence Y is known then: d(X,Z) = seqError(X,Y) + editDist(Y,Z) • If real sequence Y is unknown then the distance between de
novo candidate X and database candidate Z: • d(X,Z) = minY ( seqError(X,Y) + editDist(Y,Z) )
• Problem: search a database for Z that minimizes d(X,Z) • The core problem is to compute d(X,Z) for given X and Z.
(Seq) X: LSCF-AV(Real) Y: EACF-AV (Match) Z: DACFKAV

An Introduction to Bioinformatics Algorithms www.bioalgorithms.info
136
Computing seqError(X,Y)• Align X and Y (according to mass).
• A segment of X can be aligned to a segment of Y only if their mass is the same!
• For each erroneous mass block (Xi,Yi), the cost is f(Xi,Yi)=f(mass(Xi)).
• f(m) depends on how often de novo sequencing makes errors on a segment with mass m.
• seqError(X,Y) is the sum of all f(mass(Xi)).XYZ
seqError
editDist
(Seq) X: LSCFAV(Real) Y: EACFAV

An Introduction to Bioinformatics Algorithms www.bioalgorithms.info
137
Computing d(X,Z)
• Dynamic Programming:
• Let D[i,j]=d(X[1..i], Z[1..j])
• We examine the last block of the alignment of X[1..i] and Z[1..j].
(Seq) X: LSCF-AV(Real) Y: EACF-AV (Match) Z: DACFKAV

An Introduction to Bioinformatics Algorithms www.bioalgorithms.info
138
Dynamic Programming: Four Cases
• Cases A, B, C - no de novo sequencing errors
• Case D: de novo sequencing error
D[i,j]=D[i,j-1]+indel D[i,j]=D[i-1,j]+indel
D[i,j]=D[i-1,j-1]+dist(X[i],Z[j]) D[i,j]=D[i’-1,j’-1]+alpha(X[i’..i],Z[j’..j])
• D[i,j] is the minimum of the four cases.

An Introduction to Bioinformatics Algorithms www.bioalgorithms.info
139
Computing alpha(.,.)
• alpha(X[i’..i],Z[j’..j])
= min m(y)=m(X[i’..i]) [seqError (X[i’..i],y)+editDist(y,Z[j’..j])]
= min m(y)=m[i’..i] [f(m[i’..i])+editDist(y,Z[j’..j])].
= f(m[i’..i]) + min m(y)=m[i’..i] editDist(y,Z[j’..j]).
• This is like to align a mass with a string.• Mass-alignment Problem: Given a mass m and a
peptide P, find a peptide of mass m that is most similar to P (among all possible peptides)

An Introduction to Bioinformatics Algorithms www.bioalgorithms.info
140
Solving Mass-Alignment Problem
])[,()])1..([),((min
)])1..([,(
])..[),((min
min])..[,(
jZydistjiZymm
indeljiZm
indeljiZymm
jiZm
y
y

An Introduction to Bioinformatics Algorithms www.bioalgorithms.info
141
Improving the Efficiency• Homology Match mode:
• Assumes tagging (only peptides that share a tag of length 3 with de novo reconstruction are considered) and extension of found hits by dynamic programming around the hits.
• Non-gapped homology match mode:• Sequencing error and homology mutations do not
overlap.• Segment Match mode:
• No homology mutations.• Exact Match mode:
• No sequencing errors and homology mutations.

An Introduction to Bioinformatics Algorithms www.bioalgorithms.info
142
Experiment Result• The correct peptide sequence for each spectrum is known. • The proteins are all in Swissprot but not in Human
database.• SPIDER searches 144 spectra against both Swissprot and
human databases
An Introduction to Bioinformatics Algorithms www.bioalgorithms.info
143
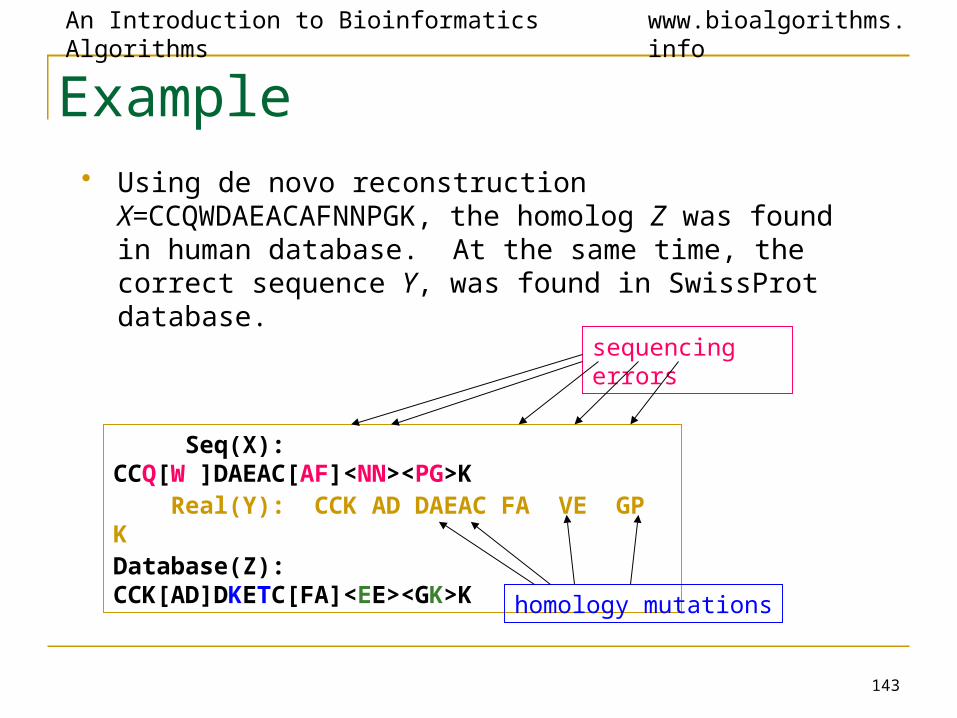
Example• Using de novo reconstruction X=CCQWDAEACAFNNPGK,
the homolog Z was found in human database. At the same time, the correct sequence Y, was found in SwissProt database.
Seq(X): CCQ[W ]DAEAC[AF]<NN><PG>K Real(Y): CCK AD DAEAC FA VE GP KDatabase(Z): CCK[AD]DKETC[FA]<EE><GK>K
sequencing errors
homology mutations