260.841 Protein Bioinformatics: Mass...
34
1 1 260.841 Protein Bioinformatics: Mass Spectrometry Robert J. Cotter Middle Atlantic Mass Spectrometry Laboratory Pharmacology and Molecular Sciences Johns Hopkins University School of Medicine Baltimore, MD 2 What is a mass spectrometer? ion source mass analyzer detector Chemical TOF: time-of-flight multiplier EI: electron impact ITMS: ion trap mass spectrometer channelplate CI: chemical ionization FTMS: Fourier transform mass spectrometer Biological …. and combinations of these (QTOF, TOF/TOF, IT/TOF) MALDI: matrix-assisted laser desorption/ionization ESI: electrospray ionization AP/MALDI: atmospheric pressure MALDI a balance for weighing molecules vacuum system
Transcript of 260.841 Protein Bioinformatics: Mass...

1
1
260.841 Protein Bioinformatics:Mass Spectrometry
Robert J. CotterMiddle Atlantic Mass Spectrometry Laboratory
Pharmacology and Molecular Sciences
Johns Hopkins University School of MedicineBaltimore, MD
2
What is a mass spectrometer?
ion source mass analyzer detector
Chemical TOF: time-of-flight multiplier
EI: electron impact ITMS: ion trap mass spectrometer channelplate
CI: chemical ionization FTMS: Fourier transform mass spectrometer
Biological …. and combinations of these (QTOF, TOF/TOF, IT/TOF)
MALDI: matrix-assisted laser desorption/ionization
ESI: electrospray ionization
AP/MALDI: atmospheric pressure MALDI a balance for weighing molecules
vacuum system

2
3
MALDI is one method for ionizing peptides and other biomolecules
Matrix-assisted laser desorption/ionization
MALDI mechanism
1. The matrix absorbs UV or IR energy from the pulsed laser
2. The matrix ionizes and dissociates; it undergoes a phase change to a supercompressed gas; charge is passed to some of the analyte molecules
3. Matrix expands at supersonic velocity; additional analyte ions are formed in the gas phase; ions are entrained in the expanding plume
laser
peptide
matrix
4
The MALDI “matrix”:In MALDI, samples are deposited in solutions of a UV-absorbing matrix, which absorbs the laser energy, ionizes and then protonatesthe sample molecules

3
5
DeVmt
2/1
2⎟⎠⎞
⎜⎝⎛=
Short source region (s) with a high field for extracting the ions
Longer field-free drift region (D)
Flight times follow a simple square root dependence on mass:
MALDI is most often used with a time-of-flight (TOF) mass spectrometer:
6
Time-of-flight mass spectrum.
Mass spectrum of a mixture of 11 peptides obtained with pulsed (delayed) extraction on a linear TOF.
160
180
200
220
240
0S 10uS 20uS 30uS
Substance P, 1348 Da
Methionine enkephalin-Arg-Gly Leu 900Da
Peptide sequencing standard, 1639 Da
Parathyroid hormone 28-48, 2148
Beta-melanocyte, 2660 Da
Hepatitus B virus pre-S region 120-145, 3008
Diabetes-associated peptide 8-37, 3200
ACTH 7-38, 3659 Da
ACTH 1-39, 4541 Da
Pancreatic polypeptide, 4182 Da
Biocytin beta-endorphin, 3819 Da
matrix ions
noise form extraction pulse
Raw data spectrum vs. time

4
7
Mass resolution is improved using a “single-stage” reflectron mass analyzer
t = m
2eV [ L + L + 4d]
1/ 2
1 2⎛⎝⎜
⎞⎠⎟
Flight times are still proportional to the square root of the mass:
8
Reflectrons compensate for the initial kinetic energy spread of ions.
The “dual-stage” reflectron mass analyzer provides “second order” focusing.
Flight times are proportional to the square root of mass.

5
9
160
180
200
220
240
0S 10uS 20uS 30uS
150
160
170
180
38.66uS 38.68uS 38.7uS 38.72uS 38.74uS
34000
36000
38000
40000
0S 20uS 40uS 60uS 80uS
34000
34500
35000
35500
36000
90.75uS 90.8uS 90.85uS 90.9uS
Comparison of linear and reflectron mass spectra
Mass spectrum of a mixture of 11 peptides obtained on a linear TOF
Mass spectrum of a mixture of 9 peptides obtained on a reflectron TOF
10
Another way to improve mass resolution is using “delayed extraction*”:
*also known as “pulsed extraction” or “time-lag focusing”
During the delay period, ions with different energies array themselves in different locations.
When the extraction pulse is applied the slower ions will be accelerated the most, and will catch up with the faster ions when they reach the detector
s0 s1 dbefore delay
after delay
V0 V1 V2 (ground)

6
11
Whittal, R.M.; Li, L., Anal. Chem. 67 (1995) 1950-1954Brown, R.S.; Lennon, J.J., Anal Chem. 67 (1995) 1998-2003.Vestal, M.L.; Juhasz, P.; Martin, S.A, Rapid Commun. Mass Spectrom. 9 (1995) 1044-1050.
V0
V1
V2
V0
V1
V2
20 kV (constant)
18 kV (constant)
Ground (constant) Ground (constant)
2 kV pulse20 kV18 kV
20 kVNegative pulse
0 V
delay delay
timetime
ABI, Kratos and others Bruker and others
A number of different methods are used to pulse the field in the first extraction region:
12
Maximum mass resolution results from a combination of a reflectron and delayed extraction

7
13
Introduced by John Fenn:
Yamashita, M.; Fenn, J.B., J. Phys. Chem. 88 (1984) 4451.Whitehouse, C.M.; Dreyer, R.N.; Yamashita, M.; Fenn, J.B., Anal. Chem. 57 (1985) 675.Fenn, J.B.; Mann, M.; Meng, C.K.; Wong, S.F.; Whitehouse, C.M., Science 246 (1989) 64.
Electrospray ionization (ESI)
14
Based on an ion evaporation model:Iribarne, J.V.; Thomson, B.A., J. Chem. Phys. 64 (1976) 2287.Thomson, B.A.; Iribarne, J.V., J. Chem. Phys. 71 (1979) 4451.
Tip at high positive voltage
Evaporation (desolvation) of positively-charged droplets until the Rayleigh limit is reached.
Ejection of positively charged ions from droplet.
Favors ejection of multiply-charged ions

8
15
ESI produces multiply-charged ions
Ions have the formula:
(M + nH)+n
From which one can determine M.
Average m/z are around 1000, which is compatible with quadrupole mass spectrometers and ion traps.
16
ESI is commonly used on quadrupole ion trap mass spectrometers (ITMS)
• 1.1 MHz
• Used to trap the ions
• used to scan the mass range in either mass-selective instability or resonance ejection modes
• supplementary RF for resonance ejection mode and high mass
• mass selection
• excitation in MS/MS mode

9
17
20
20
20 )2(
8Ω+
=zrm
eVqz
20
20
20 )2(
16Ω+
−=
zrmeUaz
zqzrV
zm
20
20
20 )2(
8Ω+
=
Mathieu parameters:
Mass selective instability mode: if dc voltage on the endcaps is zero, then scan along the az line (by varying the rf voltage); ion ejection occurs at the stability boundary when az = 0.908
The mass ejected is then given by:
Where z is the number of charges and Ω0 is the angular drive frequency(Ω0/2π = 1.1 MHz)
Williams, J.D.; Cox, K.A.; Schwartz, J.C.; Cooks, R.G., in Practical Aspects of Ion Trap Mass Spectrometry, Volume II, Cairns, T., Ed., CRC Press, Boca Raton (1995), pp. 3-50
endc
apbi
as v
olta
ge U
1.1 MHz ring voltage V
V mass scan
18
Resonance ejection mode:
A supplementary rf voltage is applied to the endcaps
The fundamental rf voltage on the ring electrode is scanned
Ions are ejected “through a hole in the stability region”
Extension of mass range through axial modulation
Supplementary rf = 69.9 kHzqeject = 0.182m/z = (0.91/0.182) x 650 = 5 x 650 = 3,250
Supplementary rf = 35.2 kHzqeject = 0.091m/z = (0.91/0.091) x 650 = 10 x 650 = 6,500
1.1 MHz ring voltage V
V
endc
apbi
as v
olta
ge U
U
mass scan

10
19
The “LCQ” ion trap mass spectrometry uses a quadrupole or octapole inlet system to interface to the atmosphere
RF-only quadrupole or octapole filters that collimate ions from high pressure ESI source.
Ion trap mass spectrometer
Electrospray source at atmospheric pressure
Capillary needle (3.5 kV)
N2
Increasing vacuum
20
Using mass spectrometry (MS) for peptide mapping and sequencing
Molecular weights obtained following the use of endoand exopeptidases
11
21
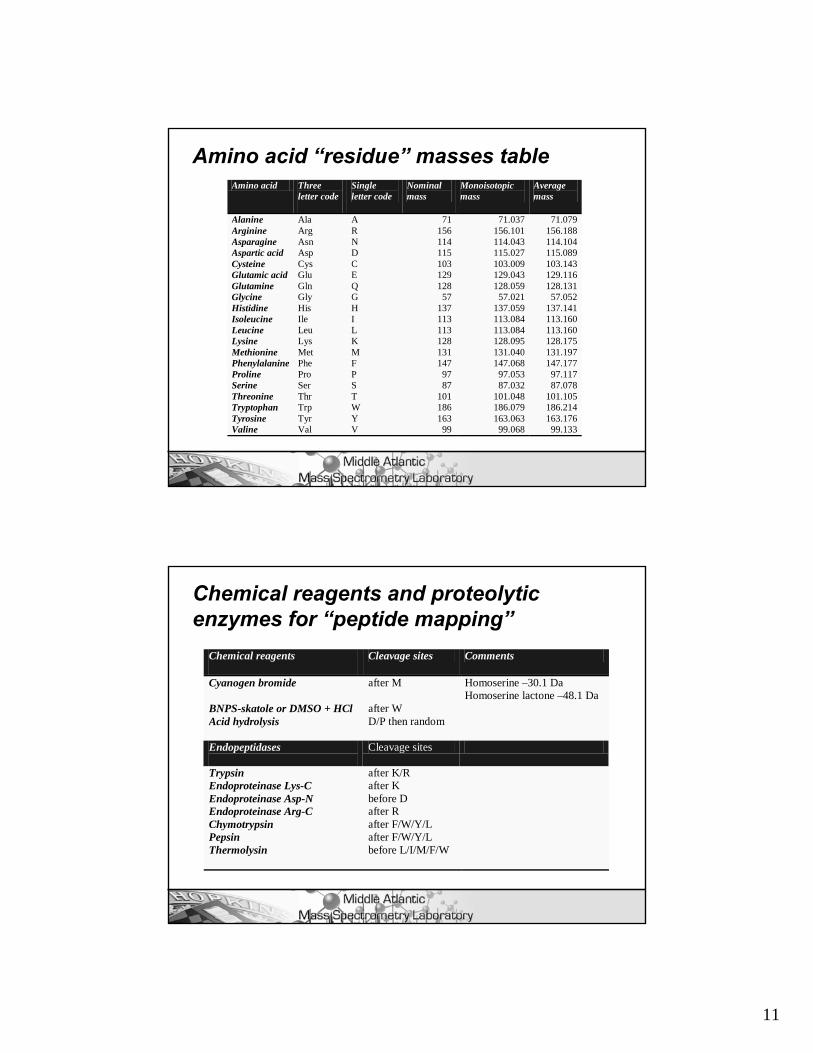
Amino acid “residue” masses tableAmino acid Three
letter code
Single letter code
Nominal mass
Monoisotopic mass
Average mass
Alanine Ala A 71 71.037 71.079 Arginine Arg R 156 156.101 156.188 Asparagine Asn N 114 114.043 114.104 Aspartic acid Asp D 115 115.027 115.089 Cysteine Cys C 103 103.009 103.143 Glutamic acid Glu E 129 129.043 129.116 Glutamine Gln Q 128 128.059 128.131 Glycine Gly G 57 57.021 57.052 Histidine His H 137 137.059 137.141 Isoleucine Ile I 113 113.084 113.160 Leucine Leu L 113 113.084 113.160 Lysine Lys K 128 128.095 128.175 Methionine Met M 131 131.040 131.197 Phenylalanine Phe F 147 147.068 147.177 Proline Pro P 97 97.053 97.117 Serine Ser S 87 87.032 87.078 Threonine Thr T 101 101.048 101.105 Tryptophan Trp W 186 186.079 186.214 Tyrosine Tyr Y 163 163.063 163.176 Valine Val V 99 99.068 99.133
22
Chemical reagents and proteolyticenzymes for “peptide mapping”
Chemical reagents
Cleavage sites Comments
Cyanogen bromide after M Homoserine –30.1 Da Homoserine lactone –48.1 Da
BNPS-skatole or DMSO + HCl after W Acid hydrolysis
D/P then random
Endopeptidases
Cleavage sites
Trypsin after K/R Endoproteinase Lys-C after K Endoproteinase Asp-N before D Endoproteinase Arg-C after R Chymotrypsin after F/W/Y/L Pepsin after F/W/Y/L Thermolysin before L/I/M/F/W
12
23
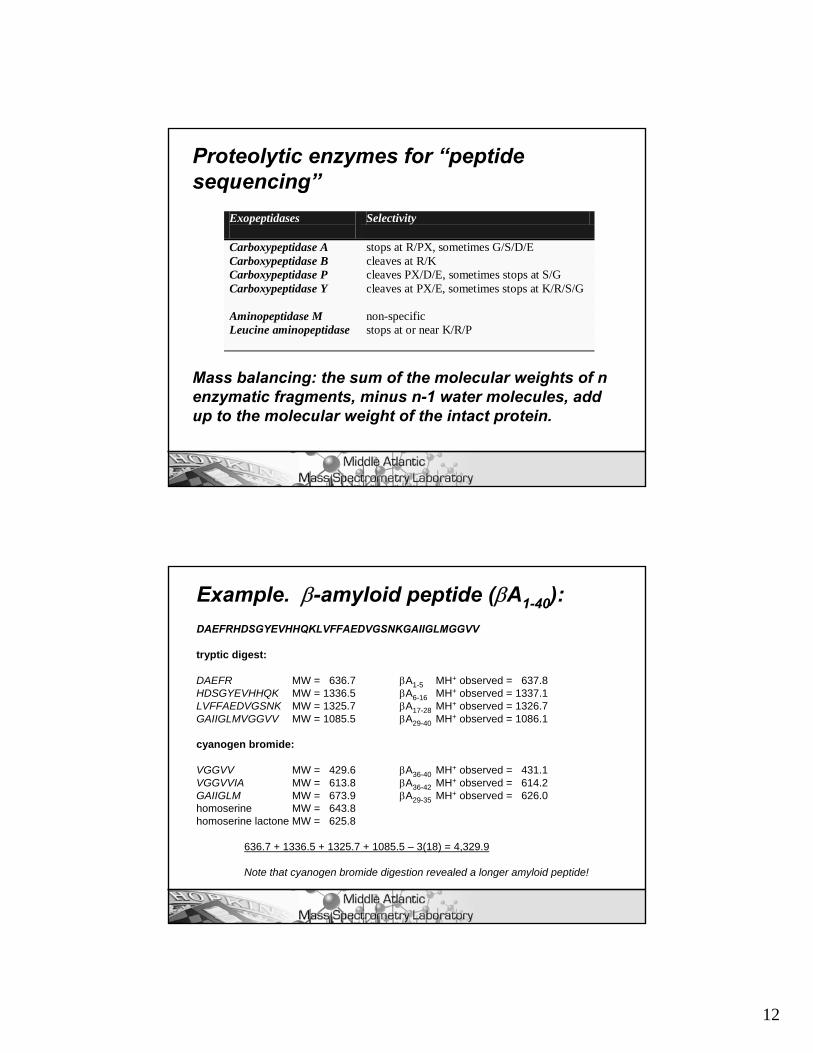
Mass balancing: the sum of the molecular weights of n enzymatic fragments, minus n-1 water molecules, add up to the molecular weight of the intact protein.
Proteolytic enzymes for “peptide sequencing”
Exopeptidases
Selectivity
Carboxypeptidase A stops at R/PX, sometimes G/S/D/E Carboxypeptidase B cleaves at R/K Carboxypeptidase P cleaves PX/D/E, sometimes stops at S/G Carboxypeptidase Y
cleaves at PX/E, sometimes stops at K/R/S/G
Aminopeptidase M non-specific Leucine aminopeptidase
stops at or near K/R/P
24
Example. β-amyloid peptide (βA1-40):DAEFRHDSGYEVHHQKLVFFAEDVGSNKGAIIGLMGGVV
tryptic digest:
DAEFR MW = 636.7 βA1-5 MH+ observed = 637.8HDSGYEVHHQK MW = 1336.5 βA6-16 MH+ observed = 1337.1LVFFAEDVGSNK MW = 1325.7 βA17-28 MH+ observed = 1326.7GAIIGLMVGGVV MW = 1085.5 βA29-40 MH+ observed = 1086.1
cyanogen bromide:
VGGVV MW = 429.6 βA36-40 MH+ observed = 431.1VGGVVIA MW = 613.8 βA36-42 MH+ observed = 614.2GAIIGLM MW = 673.9 βA29-35 MH+ observed = 626.0homoserine MW = 643.8homoserine lactone MW = 625.8
636.7 + 1336.5 + 1325.7 + 1085.5 – 3(18) = 4,329.9
Note that cyanogen bromide digestion revealed a longer amyloid peptide!

13
25
Chemical cleavage: Cyanogen bromide (CNBr) cleaves the amide bond on the C-terminal side of a methionine residue:
forming a terminal homoserine (∆m = -30) or homoserine lactone (∆m = -48) residue
NH
HC C OH
H2C
O
CH2
OH
NH
HC C
H2C
O
CH2
O
homoserine
homoserine lactone
NH
HC C N
HCH
C
CH2
CH2
S
CH3
O R O
26
Peptide mapping: tryptic digest of myoglobin
0
10
20
30
40
50
60
70
80
90
100
%Int.
1000 1200 1400 1600 1800 2000Mass/Charge
3[c].G
92 mV[sum= 27531 mV] Profiles 1-300 Smooth Av 1
AXIMA-QIT Data: myoglobin dig dhb0002.G7 19 Dec 2002 12:12 Cal: combined 19 Dec 2002 12:46 Kratos PC Axima QIT V2.3.1: Mode Positive, Mid 750+, Power: 59
1271.71 1606.92
1378.90
1854.01
1272.74
1379.88 1855.01 1982.111607.93
1268.591983.08
952.531192.70
1502.721273.73 1856.001608.90 1984.111380.91953.53 1096.56
1503.75996.52 1120.69 1856.991270.65902.471985.14997.53 1506.96 1609.881143.64 1393.83
MS obtained on a Kratos AXIMA Qit/TOF

14
27
PMF: Peptide Mass FingerprintingTaxonomy : Mammalia (mammals) (246067 sequences)Timestamp : 19 Dec 2002 at 12:18:46 GMTTop Score : 158 for gi|2506462, Myoglobin
Probability Based Mowse Score
Protein Summary Report
Switch to Concise Protein Summary Report
To create a bookmark for this report, right click this link: Protein Summary Report (../data/20021219/FtTtonYe.dat)
Index
Accession Mass Score Description1. gi|2506462 16941 158 Myoglobin2. gi|70561 16940 138 myoglobin [validated] - horse3. gi|2554649 16942 137 Myoglobin (Horse Heart) Mutant With Leu 104 Replaced By Asn (L104n)4. gi|494711 16967 118 Myoglobin (Horse Heart) Mutant With His 64 Replaced By Tyr (H64y)5. gi|2914321 16905 118 H64t Variant Of Myoglobin (Horse Heart) Recombinant Wild-Type
Complexed With Azide6. gi|999870 16967 117 Myoglobin Mutant With His 93 Replaced By Tyr (H93y)7. gi|1942750 16969 117 Myoglobin (Horse Heart) Mutant With Ser 92 Replaced By Asp (S92d)8. gi|25029635 33033 88 similar to pORF2 [Mus musculus domesticus]9. gi|127664 17226 66 Myoglobin
10. gi|127671 17034 65 MYOGLOBIN
Results List
1. gi|2506462 Mass: 16941 Score: 158MyoglobinObserved Mr(expt) Mr(calc) Delta Start End Miss Peptide941.48 940.47 940.47 0.01 146 - 153 1 YKELGFQG1271.67 1270.66 1270.66 0.01 32 - 42 0 LFTGHPETLEK1378.83 1377.82 1377.83 -0.01 64 - 77 0 HGTVVLTALGGILK1502.68 1501.67 1501.66 0.01 119 - 133 0 HPGDFGADAQGAMTK1506.94 1505.93 1505.93 0.00 64 - 78 1 HGTVVLTALGGILKK1606.85 1605.84 1605.85 -0.01 17 - 31 0 VEADIAGHGQEVLIR1815.88 1814.87 1814.90 -0.02 1 - 16 0 GLSDGEWQQVLNVWGK1853.94 1852.93 1852.95 -0.02 80 - 96 0 GHHEAELKPLAQSHATK1885.00 1883.99 1884.01 -0.02 103 - 118 0 YLEFISDAIIHVLHSK1982.02 1981.01 1981.05 -0.04 79 - 96 1 KGHHEAELKPLAQSHATK
No match to: 931.53, 934.49, 949.50, 951.50, 952.52, 968.46, 978.46, 988.49, 1006.54
The masses of the tryptic peptides from the mass spectrum can be used to identify the parent protein
28
Post-translational modifications will produce changes in the masses of tryptic fragments
Name
Site Modification ∆m
N-terminal acetylation terminal NH2- replaced by CH3CONH- +42 N-terminal formylation terminal NH2- replaced by HCONH- +28 N-terminal myristylation terminal NH2- replaced by CH3(CH2)12CONH- +210 N-terminal palmitoylation terminal NH2- replaced by CH3(CH2)14CONH- +238 C-terminal amidation terminal –COOH replaced by –CONH2 -1 disulfide bonds 2 Cys –SH replaced by –S-S- -2 glycosylation (N-linked) N-X-S/T addition of sugar glycosylation (O-linked) S/T addition of sugar sulfation -OH of Y replaced by –OSO3H +80 phosphorylation -OH of Y/S/T replaced by –OPO3H2 +80 N-methylation -NH2 of K/R/H/Q relaced by –NHCH3 +14 O-methylesterification -COOH of E/D replaced by –COOCH3 +14 carboxylation -NH2 of E/D replaced by –NHOCH3 +30 Hydroxylation
-NH2 of P/K/D replaced by –NHOH +16

15
29
Protein phosphorylation by kinasesEnzyme
Consensus sequence
protein kinase C (R/K1-3,X2-0)-S/T-(X2-0, R/K1-3)cAMP-dependent PK R-R-X-S/T cGMP-dependent PK R/K2-3-X-S/T casein kinase I S[P]-X1-3-S/T casein kinase II
S/T-(D/E/S[P])1-3,X2-0
X = unspecified peptide; S[P] = phosphorylated serine
30
Carboxypeptidase ladder sequencing 1 115.1 71.1 129.1 147.2 156.2 17 1 H - Asp - Ala - Glu - Phe - Arg - OH - H+ 637.7
1 115.1 71.1 129.1 147.2 17 1 H - Asp - Ala - Glu - Phe - OH - H+ 481.5
1 115.1 71.1 129.1 17 1 H - Asp - Ala - Glu - OH - H+ 334.3
1 115.1 71.1 17 1 H - Asp - Ala - OH - H+ 205.2
1 115.1 17 1 H - Asp - OH - H+ 134.1
Digestion of the tryptic peptide DAEFR from βAmyloid with carboxypeptidase followed by mass spectral analysis of the ladder mixture
All masses are molecular masses

16
31
1 115.1 71.1 129.1 147.2 156.2 17 1 H - Asp - Ala - Glu - Phe - Arg - OH - H+ 637.7
1 71.1 129.1 147.2 156.2 17 1 H - Ala - Glu - Phe - Arg - OH - H+ 522.6
1 129.1 147.2 156.2 17 1 H - Glu - Phe - Arg - OH - H+ 451.5
1 147.2 156.2 17 1 H - Phe - Arg - OH - H+ 322.4
1 156.2 17 1 H - Arg - OH - H+ 175.2
Aminopeptidase ladder sequencing
Digestion of the tryptic peptide DAEFR from βAmyloid with aminopeptidasefollowed by mass spectral analysis of the ladder mixture
All masses are molecular masses
32
In situ digestion: several aliquots of the intact peptide are place on different locations on the sample probe or slide. Enzyme (in excess) is added to each spot and quenched after a predetermined time by addition of the matrix solution.
Timed-course digests provide a means to maximize amino acid sequence information.
Patterson, D.H.; Tarr, G/E.; Regnier, F.E., Martin, S.A.; Anal. Chem. 67 (1995) 3971-3978.
Example of “timed”carboxypeptidase ladder sequencing

17
33
1 87.1 156.2 167.1 57.1 71.1 113.2 128.2 17 1H Ser Arg Ser Gly Ala Leu Lys OH H+ MW = 799.0
PO3H
1 156.2 167.1 57.1 71.1 113.2 128.2 17 1H Arg Ser Gly Ala Leu Lys OH H+ MW = 711.9
PO3H
1 167.1 57.1 71.1 113.2 128.2 17 1H Ser Gly Ala Leu Lys OH H+ MW = 555.7
PO3H
1 57.1 71.1 113.2 128.2 17 1H Gly Ala Leu Lys OH H+ MW = 388.6
1 71.1 113.2 128.2 17 1H Ala Leu Lys OH H+ MW = 331.5
1 113.2 128.2 17 1H Leu Lys OH H+ MW = 260.4
1 128.2 17 1H Lys OH H+ MW = 47.2
For phosphopeptides, amino and carboxypeptidase ladder sequencing is carried out in the same manner, but the sequence includes a phosphoserinewhich has a residue mass of:
87 + 80 = 167
Ladder sequencing of a phospho-peptide:
34
Sequencing by fragmentation: tandem and hybrid mass spectrometers
The tandem mass spectrometer:
• two or more mass analyzers (or mass analysis steps: “tandem in time”)
• the ability to select a ions of a particular mass observed in a mass spectrum and to observe its fragments in a subsequent spectrum
• a means for activating the ions to induce fragmentation

18
35
C-terminal ions: the “y” ions
NH
HC C N
H
HC C
R1
O
R2
O
NH
HC C N
H
HC C
R1
O
R2
O
NH
HC C N
H
HC C
R1
O
R2
O
H3NHC C
O
HC C
R2
O
H
H- NH3
+ H H
R2 y-ion
z-ion
36
N-terminal ions: the “a” and “b” ions
NH
HC C N
H
HC C
R1
O
R2
O
NH
HC C N
H
HC C
R1
O
R2
O
NH
HC C N
HC C
R1
O
R2
O
NH
HC C
R1
O
NH
HC C
R1
+ H
O
H
H
NH
CH
R1
H
- COb-ion
a-ion

19
37
y-ion masses can be determined for a known sequence:
b-ion masses can also be determined:
a-ion masses are determined by subtracting 28 from the masses of the b-ions
Sequence fragment nomenclature
Use these schemes to verify the masses in the next figure
38
Amino acid sequencing by fragmentation.
De novo sequencing of an unknown is complicated by the fact that one does not know a priori which type of fragmentation will occur.
Approaches include the location of peaks 28 mass units apart (a and b series) and noting that the molecular ion is a yion).

20
39
Tandem Mass SpectrometryMass filters vs. mass analyzersMass selectionCollision-induced dissociation (CID)
MS1 Collision chamber
MS2S D
In a normal configuration:
Mass filter:passes a single mass
Collision gas: He or Xe
Collision-induced dissociation
High energy (1-20 Kev) single collisions, or
Low energy (10-50 ev multiple collisions.
Mass analyzer:records a mass spectrum
Normal mode = product ion scan
40
Some examples of tandem (and hybrid) instruments
Tandem in time:Ion trap mass spectrometer (ITMS)Fourier transform mass spectrometer (FTMS)Linear ion trap/FTMS (LTQ-FT)
Tandem in space:Triple quadrupolesQuadrupole/time-of-flight (QTOF)Time-of-flight/time-of-flight (TOF/TOF)Ion trap/time-of-flight (trapTOF, Qit/TOF)
21
41
S D
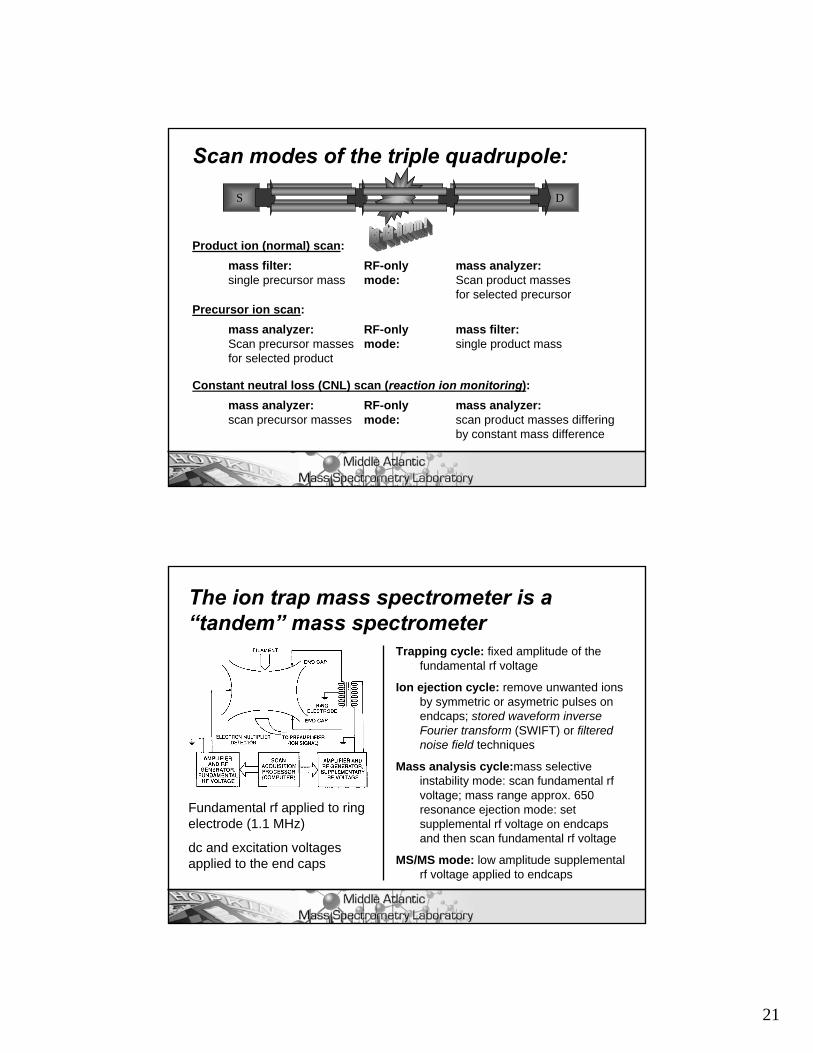
Scan modes of the triple quadrupole:
Product ion (normal) scan:mass filter:single precursor mass
RF-only mode:
mass analyzer:Scan product masses for selected precursor
Precursor ion scan:
Constant neutral loss (CNL) scan (reaction ion monitoring):
mass analyzer:Scan precursor masses for selected product
RF-only mode:
RF-only mode:
mass filter:single product mass
mass analyzer:scan precursor masses
mass analyzer:scan product masses differing by constant mass difference
42
The ion trap mass spectrometer is a “tandem” mass spectrometer
Fundamental rf applied to ring electrode (1.1 MHz)
dc and excitation voltages applied to the end caps
Trapping cycle: fixed amplitude of the fundamental rf voltage
Ion ejection cycle: remove unwanted ions by symmetric or asymetric pulses on endcaps; stored waveform inverse Fourier transform (SWIFT) or filtered noise field techniques
Mass analysis cycle:mass selective instability mode: scan fundamental rfvoltage; mass range approx. 650resonance ejection mode: set supplemental rf voltage on endcaps and then scan fundamental rf voltage
MS/MS mode: low amplitude supplemental rf voltage applied to endcaps

22
43
Tandem-in-timeI, II and III: trapping cycle: fundamental (1.1 MHz) RF voltage on ring electrode
IV: mass isolation cycle (MS1): resonant ejection of all but selected ion, using high amplitude supplementary RF on ring electrode
V: excitation cycle (low energy CID): low amplitude supplementary RF voltage on endcaps
VII: mass analysis cycle (MS2): resonance ejection mode, high amplitude supplementary RF voltage on endcaps while scanning the amplitude of the fundamental RF voltage on the ring electrode
44
IR AP MALDI from 0.1 % TFA solution
800 1000 1200 1400 1600 1800 2000 2200 2400 2600 2800 m/z0
100
Rel
ativ
e A
bund
ance
1420.4
1274.1
1079.5
2117.3
1296.6787.1
2101.1
[M+Na]+
[M+Na]+
[M+Na]+
MAN6
A1F
M3N2F
800 1000 1200 1400 1600 1800 2000 2200 2400 2600 2800 m/z0
100
Rel
ativ
e A
bund
ance
1420.4
1274.1
1079.5
2117.3
1296.6787.1
2101.1
800 1000 1200 1400 1600 1800 2000 2200 2400 2600 2800 m/z0
100
Rel
ativ
e A
bund
ance
1420.4
1274.1
1079.5
2117.3
1296.6787.1
2101.1
[M+Na]+
[M+Na]+
[M+Na]+
MAN6
A1F
M3N2F
650 700 750 800 850 900 950 1000 1050 m/z0
100
Rel
ativ
e A
bund
ance
1061.4
933.3712.2
1062.3
978.4979.5
714.4 917.4 1063.5980.4916.2 969.2 1049.7730.0 1077.5686.7 1009.6899.9832.1 959.3629.1 772.0 801.8
MS/MS 1079Da
M3N2F -Fuc
-Fuc
-GlcNAc
-GlcNAc
650 700 750 800 850 900 950 1000 1050 m/z0
100
Rel
ativ
e A
bund
ance
1061.4
933.3712.2
1062.3
978.4979.5
714.4 917.4 1063.5980.4916.2 969.2 1049.7730.0 1077.5686.7 1009.6899.9832.1 959.3629.1 772.0 801.8
650 700 750 800 850 900 950 1000 1050 m/z0
100
Rel
ativ
e A
bund
ance
1061.4
933.3712.2
1062.3
978.4979.5
714.4 917.4 1063.5980.4916.2 969.2 1049.7730.0 1077.5686.7 1009.6899.9832.1 959.3629.1 772.0 801.8
MS/MS 1079Da
M3N2F -Fuc
-Fuc
-GlcNAc
-GlcNAc
MS/MS 1079Da
M3N2F -Fuc
-Fuc
-GlcNAc
-GlcNAc
650 700 750 800 850 900 950 1000 1050 1100 1150 1200 1250 1300 1350 1400 m/z0
100
Rel
ativ
e A
bund
ance
1198.5
1401.4
1318.41216.5
995.2 1036.51257.4
1095.5875.3 1115.3 1321.3723.1 833.2772.2 1157.3
MS/MS 1420Da
MAN6-Man
-Man-Man
-GlcNAc-GlcNAc-GlcNAc
-Man
650 700 750 800 850 900 950 1000 1050 1100 1150 1200 1250 1300 1350 1400 m/z0
100
Rel
ativ
e A
bund
ance
1198.5
1401.4
1318.41216.5
995.2 1036.51257.4
1095.5875.3 1115.3 1321.3723.1 833.2772.2 1157.3
650 700 750 800 850 900 950 1000 1050 1100 1150 1200 1250 1300 1350 1400 m/z0
100
Rel
ativ
e A
bund
ance
1198.5
1401.4
1318.41216.5
995.2 1036.51257.4
1095.5875.3 1115.3 1321.3723.1 833.2772.2 1157.3
MS/MS 1420Da
MAN6-Man
-Man-Man
-GlcNAc-GlcNAc-GlcNAc
-Man
AP/IRIS MS spectrum of 3-oligosaccharide mixture(8 pmol of each oligosaccharide)
Taranenko N.I., Atmospheric Pressure Infrared Ionization from Solutions (AP/IRIS), Proceedings of the 51st
ASMS Conference on Mass Spectrometry and Allied Topics, Montreal, 2003.

23
45
S D
q1 is an RF-only quadrupole filter that collimates ions from high pressure source.
q3 is an RF-only quadrupole filter used as a collision chamber.
Collisions are low energy.
Q2 is a quadrupole mass filter that selects the precursor mass
The TOF makes it possible to analyze product ions with higher m/z than their precursors
Combined quadrupole and time-of-flight mass spectrometers (QTOF)
46
MS/MS spectrum of doubly charged ion on a QTOF mass spectrometerFigure 2. Fragment ion spectra of doubly-charged Bradykinin 2–9 (m/z 452.74) obtained on a hybrid quadrupole-time of flight instrument at (a) 20 V, (b) 25 V, (c) 35 V, and (d) 45 V potential difference.
Rogalski, J.C.; Lin, M.S.; Sniatynski, M.J.; Taylor, R.J.; Youhnovski, N.; Przybylski, M.; Kast, J. Statistical evaluation of electrospray tandem mass spectra for optimized peptide fragmentation, J. Am. Soc. Mass Spectrom. 16 (2005) 505-514.

24
47
Combined ion trap and time-of-flight mass spectrometer (trapTOF)
MSn-1 MSn
Kratos AXIMA Qit/TOF
MSn-1 MSn
Kratos AXIMA Qit/TOF
Compared with QTOF: can carry out MSn-1 steps in the ion trap
Compared with ion trap alone: obtain high resolution MSn spectrum
48
• Mass selection from an ion trap provides high accuracy, narrow mass range
• Full kinetic energy of product ions provides high mass resolution in MSn modes
0
10
20
30
40
50
60
70
80
90
100
%Int.
700 800 900 1000 1100 1200 1300 1400 1500 1600 1700 1800 1900 2000 2100 2200 2300 2400 2500Mass/Charge
4[c].N
705 mV[sum= 100100 mV] Profiles 1-142 Unsmoothed
Data: sample HM40001.N1 19 Aug 2002 15:59 Cal: Oklahoma 19 Aug 2002 16:10 Kratos PC Kompact MALDI 7 V2.3.0a: Mode PosMidMass, Power: 110
1014.57
921.50
1015.56
1260.63
922.481055.60
1261.65
997.54 1242.691147.591016.59
923.53 1535.731243.671026.61741.42 1148.61858.47 1438.831283.77 1611.87956.52742.43 1439.83 1847.941612.842348.101469.76 2166.071587.77 2041.061851.02
0
10
20
30
40
50
60
70
80
90
100
%Int.
200 300 400 500 600 700 800 900 1000 1100 1200 1300 1400 1500 1600Mass/Charge
1[c].P
18 mV[sum= 5546 mV] Profiles 1-300 Smooth Av 5 -Baseline 100X5 X5 X5
Data: sample HM4 1611 ms20001.N1 19 Aug 2002 16:35 Cal: Oklahoma 19 Aug 2002 16:10 Kratos PC Kompact MALDI 7 V2.3.0a: Mode PosMidMass, Power: 120
1054.63
587.031055.64
955.59458.04
588.07 1056.65
1036.64
570.051037.64858.53368.95 956.56 1592.92759.45702.21
587.40
1452.89
1053.77
1567.95895.56459.08 799.46 1169.67 1269.73343.15 682.14215.48 1455.881361.83 1568.73
0
10
20
30
40
50
60
70
80
90
100
%Int.
300 350 400 450 500 550 600 650 700 750 800 850 900 950 1000 1050 1100 1150 1200 1250Mass/Charge
1[c].N
3.7 mV[sum= 1114 mV] Prof iles 1-300 Smooth Av 5 -Baseline 100
Data: sample HM4 1260ms20001.N1 19 Aug 2002 17:04 Cal: Oklahoma 19 Aug 2002 16:10 Kratos PC Kompact MALDI 7 V2.3.0a: Mode PosMidMass, Power: 120
973.63
303.97
1243.71
566.94 715.27659.11 974.60314.96469.98 539.01400.95 756.43652.09355.97 955.56 1244.69697.15 842.51442.95 555.99 1102.65296.98 781.45
MALDI MS and MS/MS spectra obtained on a trapTOF

25
49
Mascot Search ResultsSearch title : digestMS data file : C:\Program Files\Kompact\data\Customers\Oklahoma\mass lists\HM4 1611 ms2.txtDatabase : NCBInr 20020814 (1030915 sequences; 326041867 residues)Taxonomy : Drosophila (fruit flies) (28122 sequences)Timestamp : 19 Aug 2002 at 16:03:04 GMTSignificant hits: gi|5921205 ATP synthase alpha chain, mitochondrial precursor (Protein bellwether)
1. gi|5921205 Mass: 59384 Total score: 48 Peptides matched: 1 1 1611.15 1610.14 1609.87 0.27 0 48 1 TGAIVDVPVGDELLGR
Mascot Search ResultsSearch title : digestMS data file : C:\Program Files\Kompact\data\Customers\Oklahoma\mass lists\HM4 1260 ms2.txtDatabase : NCBInr 20020814 (1030915 sequences; 326041867 residues)Taxonomy : Drosophila (fruit flies) (28122 sequences)Timestamp : 19 Aug 2002 at 16:17:32 GMTSignificant hits: gi|5921205 ATP synthase alpha chain, mitochondrial precursor (Protein bellwether)1. gi|5921205 Mass: 59384 Total score: 38 Peptides matched: 1 1 1260.70 1259.69 1259.64 0.06 0 38 1 SAEISNILEER
Both MS/MS spectra give the same IDMS/MS of 1611
MS/MS of 1260
50
Tandem time-of-flight (TOF/TOF) mass spectrometers
ion source
mass selection gate
retarding lens
collision cell
2nd source pulsed extraction
Applied BioSystems• 20 keV ions decelerated to 1-2 keV• product ions are reaccelerated by 18 keV• does not record metastable products formed in MS1• can be operated with (CID) or without (PSD) gas
CID = collision-induced disssociationPSD = post-source decay (metastable decomposition)

26
51
ion source
mass selection gate
collision cell “lift” cell
ion source mass selection gate
Bruker Daltonics• 8 keV collisions with products accelerated by lift cell• records metastables (PSD) and collision (CID) products
Kratos AXIMA• PSD with curved-field reflectron
52
MS/MS or sequence spectrum of 2-17 from HAT
Y-ions
GS
Y+H2O
SHHHHH
H H H H H S S G E N L
B-ions

27
53
b25
b23
b20
b18
b17
b15
b12
b9b8b4
b27
b26b29
b28
c31
y23
y9b5
c24
c19
c16
c7
c11
KREENTSNESTDVTKAcGDSKAcNAKAcKAcKAcNNKAcKAcTSKAcN
b25
b23
b20
b18
b17
b15
b12
b9b8b4
b27
b26b29
b28
c31
y23
y9b5
c24
c19
c16
c7
c11
KREENTSNESTDVTKAcGDSKAcNAKAcKAcKAcNNKAcKAcTSKAcN
MS/MS analysis of acetylated peptides from histone acetyl transferaseThompson, P.; Wang, D.; Wang, L.; Fulco, M.; Pediconi, N.; Zhang, D.; An W.; Ge Q.; Roeder, R.G.; Wong, J.; Levrero, M.; Sartorelli, V.; Cotter, R.J. and Cole, P.A., Regulation of the p300 HAT Domain via a Novel Activation Loop. Nature: Struct. Mol. Biol. 11(2004) 308-15.
54
Sequence tagsFor identification we need only a partial sequence …
FTMS/MS of a bacterial agent biomarker with a mass of 6710.5

28
55
… which can be combined with a molecular weight to obtain an identification with very high specificity
Here two peptides are found with the same sequence segment, but only one has the correct molecular weight
56
High energy and low energy collisionsHigh energy collisions• precursor ion kinetic energy: E1 = 1-20 keV
• single collision conditions
• product ion energy:
• used in instruments in which mass measurement depends upon kinetic energy, i.e. TOF/TOF mass spectrometers
• collision energy (Erel) in the center-of-mass frame
where M is the molecular ion and n is the collision gas
11
22 E
mmE =
MMn
nrel E
mmmE+
=

29
57
Protein MW 1 keV 8 keV 20 keV Substance P 1,348 2.97 ev 23.7 ev 59.4 ev Ubiquitin 8,566 0.47 ev 3.7 ev 9.3 ev Cytochrome C 12,328 0.32 ev 2.6 ev 2.5 ev C fragment of tetanus toxin 51,819 0.08 ev 0.6 ev 1.5 ev Bovine serum albumin 66,430 0.06 ev 0.5 ev 1.2 ev
High energy and low energy collisions
Low energy collisions• precursor ion kinetic energy = 10-50 ev
• activation through multiple collisions
• used in instruments in which the ion residence time is long
quadrupole ion traps (ITMS)linear ion traps (LTQ)Fourier transform mass spectrometers (FTMS)
58
High energy and low energy collisionsSome observations:• both high energy and low energy CID are less effective for high
mass because of the relativistic effect
• CID generally produces more internal fragment ions and single residue ions for amino acid composition
• low energy CID raises the internal energy slowly and has a tendency to break the weakest bonds: at proline and glutamic acid residues, losses of phosphate and other charged PTMs
• high energy CID produces more “remote site” fragmentation
What is needed…..
• Ability to fragment higher masses
• Ability to fragment without losing PTMs
Use something other than collisions

30
59
New methods of ion activation
On an FTMS:
• IRMPD• ECD
on an ion trap:
• ETD
Method
Characteristics
Metastable fragmentation Post-source decay
- Primarily b, y ions
Low energy collision induced dissociation (Low energy CID)
- Multiple low energy (20 – 200 ev) collisions - Used primarily for instruments with long ion residence times, i.e. quadrupole, ion trap or FTMS
High energy collision induced dissociation (High energy CID)
- Single high energy (1 keV to 20 keV) collisions - Primarily b, y ions (amide bond cleavage) - Some side chain losses for distinguishing residues of the same mass - Additional acyl and immonium internal ions
Infrared multiphoton dissociation (IRMPI)
- Similar to CID, but activation energy does not depend upon relative kinetic energy - Better for high mass - Requires high ion residence times for good cross section
Electron capture dissociation (ECD)
- Fewer neutral losses than CID, such as phosphate and sugar - More c and z ions (C-N bond cleavage) - Activation does not depend upon relative kinetic energy - Better for high mass - Used for “top down” proteomics - Requires high ion residence times for good cross section
60
Fourier transform mass spectrometer
frequency
frequency
time
FT
7 Tesla superconducting magnet field
8 MHz 100 KHz

31
61
Fourier transform mass spectrometer
What are the advantages?
• High mass accuracy:
• 2 ppm (external calibration)
• 1 ppm (internal calibration)
• Therefore, better protein identifications from mass fingerprinting
• Very high mass resolution
• Ability to carry out IRMPD and ECD, as well as CID
• Therefore, able to do “top-down” proteomics
62
Fourier transform mass spectrometer
Monoisotopic MH2+2 peaks for the peptides DRVYVHPF (m/z 516.76671) and
KRPPGFSPF (m/z 516.78490) at resolving powers of 15,000 and 56,700 , where thedifference in mass between these two peptides is 18.2 mmu or 35 ppm.
Courtesy: ThermoFinnegan
Inte
nsity
(%)
0
20
40
60
80
100
Mass [Th]516.65 516.70 516.75 516.80 516.85 516.90
516.77581 (observed)
516.76671(correct)
516.78490(correct) In
tens
ity (%
)
0
20
40
60
80
100
Mass [Th]516.65 516.70 516.75 516.80 516.85 516.90
516.78490516.76671
Inte
nsity
(%)
0
20
40
60
80
100
Mass [Th]516.65 516.70 516.75 516.80 516.85 516.90
516.77581 (observed)
516.76671(correct)
516.78490(correct)In
tens
ity (%
)
0
20
40
60
80
100
Mass [Th]516.65 516.70 516.75 516.80 516.85 516.90
Inte
nsity
(%)
0
20
40
60
80
100
0
20
40
60
80
100
Mass [Th]516.65 516.70 516.75 516.80 516.85 516.90516.65 516.70 516.75 516.80 516.85 516.90
516.77581 (observed)
516.76671(correct)
516.78490(correct) In
tens
ity (%
)
0
20
40
60
80
100
Mass [Th]516.65 516.70 516.75 516.80 516.85 516.90
516.78490516.76671
Inte
nsity
(%)
0
20
40
60
80
100
Mass [Th]516.65 516.70 516.75 516.80 516.85 516.90
Inte
nsity
(%)
0
20
40
60
80
100
0
20
40
60
80
100
Mass [Th]516.65 516.70 516.75 516.80 516.85 516.90516.65 516.70 516.75 516.80 516.85 516.90
516.78490516.76671
Salmonella GroEl (GMQFDRGYL) m/z 543.75575Mouse hsp (GMKFDRGYI) m/z 543.77390; 33 ppm,

32
63
Håkansson, Chalmers, M.J.; Quinn, J.P.; McFarland, M.A.; Hendrickson, C.L.; Marshall, A.G., Combined Electron Capture and Infrared MultiphotonDissociation for Multistage MS/MS in a Fourier Transform Ion Cyclotron Resonance Mass Spectrometer, Anal. Chem. 75 (2003) 3256-3262.
ECD on a Fourier transform mass spectrometer
64
Håkansson, Chalmers, M.J.; Quinn, J.P.; McFarland, M.A.; Hendrickson, C.L.; Marshall, A.G., Combined Electron Capture and Infrared Multiphoton Dissociation for Multistage MS/MS in a Fourier Transform Ion Cyclotron Resonance Mass Spectrometer, Anal. Chem. 75 (2003) 3256-3262.
Comparison of IRMPD and ECD on a Fourier transform mass spectrometerIRMPD fragmentation is similar to CID
33
65
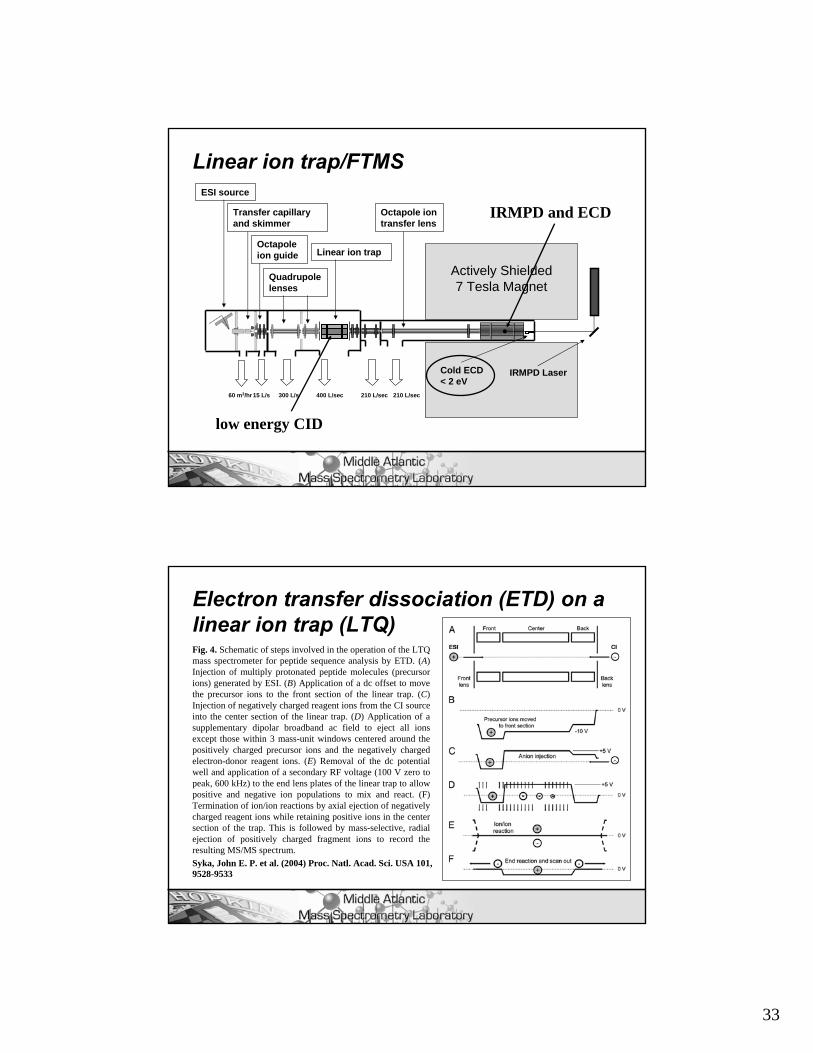
60 m3/hr 300 L/s 400 L/sec 210 L/sec 210 L/sec
Actively Shielded7 Tesla Magnet
Cold ECD< 2 eV
IRMPD Laser
15 L/s
ESI source
Transfer capillary and skimmer
Octapoleion guide
Quadrupole lenses
Octapole ion transfer lens
Linear ion trap
Linear ion trap/FTMS
low energy CID
IRMPD and ECD
66
Syka, John E. P. et al. (2004) Proc. Natl. Acad. Sci. USA 101, 9528-9533
Fig. 4. Schematic of steps involved in the operation of the LTQ mass spectrometer for peptide sequence analysis by ETD. (A) Injection of multiply protonated peptide molecules (precursor ions) generated by ESI. (B) Application of a dc offset to move the precursor ions to the front section of the linear trap. (C) Injection of negatively charged reagent ions from the CI source into the center section of the linear trap. (D) Application of a supplementary dipolar broadband ac field to eject all ions except those within 3 mass-unit windows centered around the positively charged precursor ions and the negatively charged electron-donor reagent ions. (E) Removal of the dc potential well and application of a secondary RF voltage (100 V zero to peak, 600 kHz) to the end lens plates of the linear trap to allow positive and negative ion populations to mix and react. (F) Termination of ion/ion reactions by axial ejection of negativelycharged reagent ions while retaining positive ions in the centersection of the trap. This is followed by mass-selective, radial ejection of positively charged fragment ions to record the resulting MS/MS spectrum.
Electron transfer dissociation (ETD) on a linear ion trap (LTQ)

34
67
Low energy CID
Multiple collisions
High energy CID
Single collisions
IRMPD
ECD
Less dependent on mass
More thermal; breaks weakest bond
More random fragmentation
Summary of activation methods
ETD
Requires long residence times
LTQ
TOF/TOF only
68
McCloskey, J.A., ed.; Methods in Enzymology 193 (1990).
Packer, N.H.; Harrison, M.J., Glycobiology and Proteomics: Is Mass Spectrometry the Holy Grail? Electrophoresis 19 (1998) 1872-1882.
Vestling, M.M.; Fenselau, C., Surfaces for Interfacing Protein Gel Electrophoresis Directly with Mass Spectrometry, Mass Spectrom. Rev. 14 (1995) 169-178.
Siuzdak, G., Mass Spectrometry for Biotechnology, Academic Press, NY (1996)
Willoughby, R.; Sheehan, E., Mitrovich, S., A Global View of LC/MS, Global View Publishing, Pittsburgh (1998).
Cotter, R.J., Time-of-Flight Mass Spectrometry: Instrumentation and Applications in Biological Research, American Chemical Society, Washington DC (1997).
Handout available electronically on the Middle Atlantic Mass Spectrometry Laboratory website: http://www.hopkinsmedicine.org/mams
References