WWE Reports Strong First Quarter 2018...
16
FOR IMMEDIATE RELEASE Contacts: Investors: Michael Weitz 203-352-8642 Michael Guido, CFA 203-352-8779 Media: Matthew Altman 203-352-1177 WWE ® Reports Strong First Quarter 2018 Results Raises Full Year 2018 Guidance First Quarter 2018 Highlights • Revenues reached $187.7 million, which was on-par with Q1 2017 (increasing 5% on a comparable year-over basis excluding the impact of ASC Topic 606 in Q1 2018) 1 • Operating income was $21.8 million ($29.0 million on a comparable basis) as compared to $4.0 million in the prior year quarter • Adjusted OIBDA 2 increased 40% to $35.2 million (increasing 68% to $42.4 million on a comparable basis) • WWE Network average paid subscribers 3 increased 5% to 1.56 million paid subscribers, consistent with the Company’s guidance • Digital video views increased 56% to 6.7 billion and hours consumed increased 69% to 243 million across digital and social media platforms 4 Selected WrestleMania Highlights • WrestleMania (April 8, 2018) broke the record for the Mercedes-Benz Superdome’s highest grossing entertainment event at $14.1 million, attracting 78,133 fans • WrestleMania hit a record 2.12 million global households on WWE Network alone, making it the most-watched WrestleMania in history • WWE Network subscribers viewed 25.2 million hours during WrestleMania week or 14 hours per subscriber during the week. This compares to 22.5 million hours last year, a 12% year-over-year increase • During WrestleMania week, 13.9 million hours were consumed on digital and social media platforms, up 27% from the prior year; April 9 was WWE’s most viewed day ever on YouTube with more than 50 million views STAMFORD, Conn., May 3, 2018 - WWE (NYSE: WWE) today announced financial results for its first quarter ended March 31, 2018. “We’re pleased with our continued success in creating and monetizing our content as evidenced by another record- breaking WrestleMania, which set new highs for network subscribers and viewership,” said Vince McMahon, WWE Chairman and Chief Executive Officer. “We will continue to focus on broadening our global audience across multiple platforms, providing the basis for significant growth.” George Barrios, Co-President, added, “During the first quarter, higher content rights fees, increased sales of advertising and sponsorships, and the continued growth of WWE Network supported strong 40% growth in Adjusted OIBDA. Based on our momentum and ability to capitalize on global opportunities, we are raising our target for 2018 Adjusted OIBDA to at least $150 million, which would be an all-time record, exceeding our previous guidance of at least $145 million. 5
Transcript of WWE Reports Strong First Quarter 2018...
FOR IMMEDIATE RELEASE Contacts:
Investors: Michael Weitz 203-352-8642
Michael Guido, CFA 203-352-8779
Media: Matthew Altman 203-352-1177
WWE® Reports Strong First Quarter 2018 Results
Raises Full Year 2018 Guidance
First Quarter 2018 Highlights
• Revenues reached $187.7 million, which was on-par with Q1 2017 (increasing 5% on a comparable year-over
basis excluding the impact of ASC Topic 606 in Q1 2018)1
• Operating income was $21.8 million ($29.0 million on a comparable basis) as compared to $4.0 million in the
prior year quarter
• Adjusted OIBDA2 increased 40% to $35.2 million (increasing 68% to $42.4 million on a comparable basis)
• WWE Network average paid subscribers3 increased 5% to 1.56 million paid subscribers, consistent with the
Company’s guidance
• Digital video views increased 56% to 6.7 billion and hours consumed increased 69% to 243 million across digital
and social media platforms4
Selected WrestleMania Highlights
• WrestleMania (April 8, 2018) broke the record for the Mercedes-Benz Superdome’s highest grossing
entertainment event at $14.1 million, attracting 78,133 fans
• WrestleMania hit a record 2.12 million global households on WWE Network alone, making it the most-watched
WrestleMania in history
• WWE Network subscribers viewed 25.2 million hours during WrestleMania week or 14 hours per subscriber
during the week. This compares to 22.5 million hours last year, a 12% year-over-year increase
• During WrestleMania week, 13.9 million hours were consumed on digital and social media platforms, up 27%
from the prior year; April 9 was WWE’s most viewed day ever on YouTube with more than 50 million views
STAMFORD, Conn., May 3, 2018 - WWE (NYSE: WWE) today announced financial results for its first quarter
ended March 31, 2018.
“We’re pleased with our continued success in creating and monetizing our content as evidenced by another record-
breaking WrestleMania, which set new highs for network subscribers and viewership,” said Vince McMahon, WWE
Chairman and Chief Executive Officer. “We will continue to focus on broadening our global audience across
multiple platforms, providing the basis for significant growth.”
George Barrios, Co-President, added, “During the first quarter, higher content rights fees, increased sales of
advertising and sponsorships, and the continued growth of WWE Network supported strong 40% growth in Adjusted
OIBDA. Based on our momentum and ability to capitalize on global opportunities, we are raising our target for
2018 Adjusted OIBDA to at least $150 million, which would be an all-time record, exceeding our previous guidance
of at least $145 million.5
2
First-Quarter Consolidated Results
Revenues of $187.7 million were essentially on-par with the first quarter 2017. Revenues in the first quarter 2018
were reduced by $10.3 million as a result of adopting a new FASB standard for revenue recognition, ASC Topic
606. On a comparable year-over-year basis (i.e., if the Company had maintained the prior year approach), revenue
increased 5% driven by increased revenue from the Media segment. See Basis of Presentation below and Financial
Results – Excluding the Impact of Adopting ASC Topic 606 on page 15 for additional information.
Operating Income increased to $21.8 million ($29.0 million on a comparable basis) as compared to $4.0 million
in the prior year quarter reflecting increased profits from the Media segment and the impact of $7.7 million in
certain non-recurring expenses in the first quarter 2017. The Company’s Operating income margin was 12% as
compared to 2% in the prior year quarter.
Adjusted OIBDA increased 40% to $35.2 million as the increased monetization of content as reflected in the Media
segment more than offset the impact of adopting ASC Topic 606. On a comparable basis, excluding the impact of
ASC Topic 606, Adjusted OIBDA would have been $42.4 million, representing a 68% increase. The Company’s
Adjusted OIBDA margin increased to 19% (or 21% on a comparable basis) from 13% in the prior year quarter.
Net Income increased to $14.8 million, or $0.18 per diluted share, as compared to $0.9 million, or $0.01 per diluted
share, in the prior year quarter.
Cash flows generated by operating activities of $2.6 million were essentially unchanged from the prior year
quarter as improved operating performance was offset by the unfavorable timing of working capital. Free Cash
Flow demonstrated a $1.8 million use of cash, which was also comparable to the prior year quarter.6
Cash, cash equivalents and short-term investments were $285 million as of March 31, 2018, and the Company
estimates debt capacity under its revolving line of credit of approximately $100 million.
Effective Tax Rate declined to 26% from 36% in the prior year quarter, primarily driven by the reduction of the
federal corporate income tax rate as a result of the Tax Cuts and Jobs Act of 2017 (the “Tax Act”), which reduced
the corporate rate from 35% to 21%, effective January 1, 2018.
Basis of Presentation
Effective with the communication of first quarter 2018 results (herein), the Company has begun to report its
financial results using three reportable segments: Media, Live Events and Consumer Products as well as to allocate
certain costs that were previously included in “Corporate & Other” to its revised segments.7 In addition, the
Company has changed its primary measure of performance from OIBDA to Adjusted OIBDA, and modified its
definition of Adjusted OIBDA to exclude stock-based compensation expense, a non-cash expense that may vary
from period to period with limited correlation to underlying operating performance in the period. To facilitate
evaluation of the Company’s performance under its revised approach, the Company has made schedules available
that provide a perspective of historical results over the 2015-2017 period as if these results had been reported under
the revised structure and using the revised measure of profit (see www.corporate.wwe.com/ investors).
Effective January 1, 2018, the Company adopted a new FASB standard for revenue recognition (ASC Topic 606).
Adoption of this standard reduced revenue in the quarter by $10.3 million and reduced Operating income and
Adjusted OIBDA by $7.2 million. See Financial Results – Excluding the Impact of Adopting ASC Topic 606 on
page 15 of this release.
For the first quarter 2017, reported Operating income reflected several non-recurring items that impact
comparability on a year-over-year basis, including $5.6 million in expenses primarily related to certain legal matters
and other contractual obligations and $2.1 million in film impairment charges. These items have been excluded
from 2017 Adjusted OIBDA. For the first quarter 2018, there were no such items that impacted year-over-year
comparability.
3
A reconciliation of Q1 2018 Adjusted OIBDA to Operating income (GAAP) can be found in the supplemental
schedules on pages 13-14 of this release.
First-Quarter Results by Operating Segment
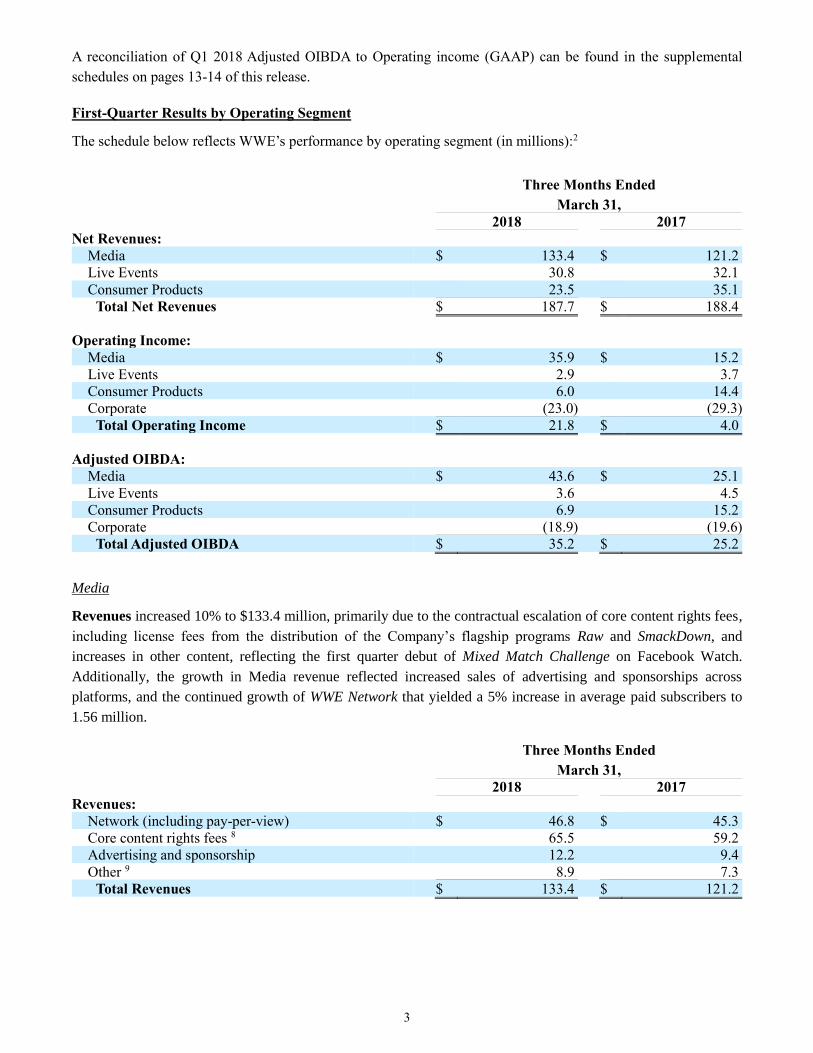
The schedule below reflects WWE’s performance by operating segment (in millions):2
Three Months Ended
March 31,
2018 2017
Net Revenues:
Media $ 133.4 $ 121.2
Live Events 30.8 32.1
Consumer Products 23.5 35.1
Total Net Revenues $ 187.7 $ 188.4
Operating Income:
Media $ 35.9 $ 15.2
Live Events 2.9 3.7
Consumer Products 6.0 14.4
Corporate (23.0) (29.3)
Total Operating Income $ 21.8 $ 4.0
Adjusted OIBDA:
Media $ 43.6 $ 25.1
Live Events 3.6 4.5
Consumer Products 6.9 15.2
Corporate (18.9) (19.6)
Total Adjusted OIBDA $ 35.2 $ 25.2
Media
Revenues increased 10% to $133.4 million, primarily due to the contractual escalation of core content rights fees,
including license fees from the distribution of the Company’s flagship programs Raw and SmackDown, and
increases in other content, reflecting the first quarter debut of Mixed Match Challenge on Facebook Watch.
Additionally, the growth in Media revenue reflected increased sales of advertising and sponsorships across
platforms, and the continued growth of WWE Network that yielded a 5% increase in average paid subscribers to
1.56 million.
Three Months Ended
March 31,
2018 2017
Revenues:
Network (including pay-per-view) $ 46.8 $ 45.3
Core content rights fees 8 65.5 59.2
Advertising and sponsorship 12.2 9.4
Other 9 8.9 7.3
Total Revenues $ 133.4 $ 121.2
4
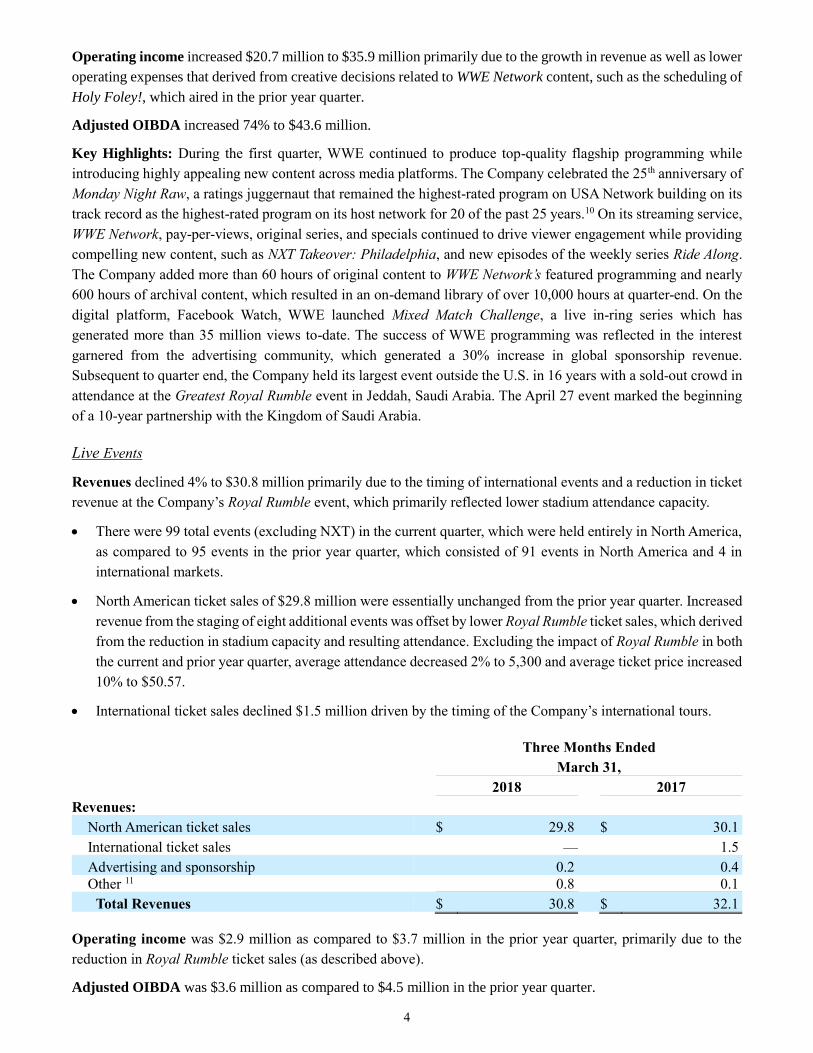
Operating income increased $20.7 million to $35.9 million primarily due to the growth in revenue as well as lower
operating expenses that derived from creative decisions related to WWE Network content, such as the scheduling of
Holy Foley!, which aired in the prior year quarter.
Adjusted OIBDA increased 74% to $43.6 million.
Key Highlights: During the first quarter, WWE continued to produce top-quality flagship programming while
introducing highly appealing new content across media platforms. The Company celebrated the 25th anniversary of
Monday Night Raw, a ratings juggernaut that remained the highest-rated program on USA Network building on its
track record as the highest-rated program on its host network for 20 of the past 25 years.10 On its streaming service,
WWE Network, pay-per-views, original series, and specials continued to drive viewer engagement while providing
compelling new content, such as NXT Takeover: Philadelphia, and new episodes of the weekly series Ride Along.
The Company added more than 60 hours of original content to WWE Network’s featured programming and nearly
600 hours of archival content, which resulted in an on-demand library of over 10,000 hours at quarter-end. On the
digital platform, Facebook Watch, WWE launched Mixed Match Challenge, a live in-ring series which has
generated more than 35 million views to-date. The success of WWE programming was reflected in the interest
garnered from the advertising community, which generated a 30% increase in global sponsorship revenue.
Subsequent to quarter end, the Company held its largest event outside the U.S. in 16 years with a sold-out crowd in
attendance at the Greatest Royal Rumble event in Jeddah, Saudi Arabia. The April 27 event marked the beginning
of a 10-year partnership with the Kingdom of Saudi Arabia.
Live Events
Revenues declined 4% to $30.8 million primarily due to the timing of international events and a reduction in ticket
revenue at the Company’s Royal Rumble event, which primarily reflected lower stadium attendance capacity.
• There were 99 total events (excluding NXT) in the current quarter, which were held entirely in North America,
as compared to 95 events in the prior year quarter, which consisted of 91 events in North America and 4 in
international markets.
• North American ticket sales of $29.8 million were essentially unchanged from the prior year quarter. Increased
revenue from the staging of eight additional events was offset by lower Royal Rumble ticket sales, which derived
from the reduction in stadium capacity and resulting attendance. Excluding the impact of Royal Rumble in both
the current and prior year quarter, average attendance decreased 2% to 5,300 and average ticket price increased
10% to $50.57.
• International ticket sales declined $1.5 million driven by the timing of the Company’s international tours.
Three Months Ended
March 31,
2018 2017
Revenues:
North American ticket sales $ 29.8 $ 30.1
International ticket sales — 1.5
Advertising and sponsorship 0.2 0.4
Other 11 0.8 0.1
Total Revenues $ 30.8 $ 32.1
Operating income was $2.9 million as compared to $3.7 million in the prior year quarter, primarily due to the
reduction in Royal Rumble ticket sales (as described above).
Adjusted OIBDA was $3.6 million as compared to $4.5 million in the prior year quarter.

5
Key Highlights: Ronda Rousey, a former champion in mixed martial arts and Olympic judo, made a surprise
appearance at Royal Rumble and subsequently had her debut match at WrestleMania (April 8). The Company
continued to expand its global talent base, signing 7 athletes from India and the Middle East.
Consumer Products
Revenues were $23.5 million as compared to $35.1 million in the prior year quarter primarily due to the impact of
adopting ASC Topic 606, which reduced revenue by $9.7 million. On a comparable basis, excluding the impact of
ASC Topic 606 in Q1 2018, consumer product revenues declined 5% from the prior year quarter primarily due to
the timing of merchandise sales related to WWE’s WrestleMania Fan Axxess and royalties from the sale of toy
products.
Three Months Ended
March 31,
2018 2017
Revenues:
Consumer product licensing $ 9.3 $ 20.1
eCommerce 8.4 7.9
Venue merchandise 5.8 7.1
Total Revenues $ 23.5 $ 35.1
Operating income was $6.0 million as compared to $14.4 million in the prior year quarter based on the change in
revenue. The adoption of ASC Topic 606 reduced Operating income by $7.2 million.
Adjusted OIBDA was $6.9 million as compared to $15.2 million in the prior year quarter. The adoption of ASC
Topic 606 reduced Adjusted OIBDA by $7.2 million.
Key Highlights: During the quarter, the Company remained one of the top three brands in the U.S. action figure
category while developing new licensing partnerships, such as with LIDS to create WWE headwear on demand,
and with Carl’s Jr.’s to promote kids meals and expand the presence of WWE among children. The Company also
continued to increase the penetration of its mobile games. As of quarter-end, the Company had more than 70 million
installs and an average of over 800,000 daily active users across its game portfolio. This includes WWE’s most
popular mobile game, WWE Champions, which has reached 29 million installs. The kids-oriented mobile
game, WWE Mayhem (Reliance) now has more than 9 million installs and recently earned the Editor’s Choice award
on Google Play.
Q2 2018 Business Outlook
The Company anticipates a meaningful increase in revenue based on the distribution of new content in certain
international markets, as well as higher rights fees in existing content agreements and the continued growth of WWE
Network. The Company projects Adjusted OIBDA of $30 million to $34 million.5 This range of results would
compare to Adjusted OIBDA of $24.3 million in the second quarter 2017.
WWE is unable to provide a reconciliation of second quarter guidance to GAAP measures as, at this time, WWE
cannot accurately determine all of the adjustments that would be required.
For the second quarter 2018, the Company projects average paid subscribers of approximately 1.77 million, which
represents an 8% increase from the second quarter 2017.

6
2018 Perspective
The range of financial performance projected for the second quarter would result in Adjusted OIBDA for the first
half of 2018 that represents growth of 32% to 40% from the prior year period. Based on this projected growth and
expectations of strong performance over the remainder of the year, the Company is raising its target for 2018
Adjusted OIBDA to at least $150 million (excluding stock-based compensation expense), which would be an all-
time record, exceeding its previous guidance of at least $145 million.5
Notes
(1) Financial results excluding the impact of adopting ASC Topic 606 in Q1 2018 (as if the prior year approach to revenue
recognition had been maintained in the current year) can be found in the Supplemental Information on page 15 of this
release. (2) The definition of Adjusted OIBDA can be found in the Non-GAAP Measures section of the release on page 6 (below). A
reconciliation of Q1 2018 Operating Income to Adjusted OIBDA can be found in the Supplemental Information in this
release on pages 13-14. (3) Average paid subscribers are calculated based on the arithmetic daily mean over the relevant period, and may differ
substantially from paid subscribers at the end of any period due to the timing of paid subscriber additions and losses. (4) Consumption includes videos viewed on third party (Facebook, YouTube, Twitter, Instagram, Snapchat, etc.) and WWE
platforms (WWE.com and WWE App). (5) The Company’s business model and expected results will continue to be subject to significant execution and other risks,
including those risks outlined in the Company’s Form 10-K filing with the SEC. (6) A reconciliation of Q1 2018 Free Cash Flow to Net cash provided by operating activities can be found in the Supplemental
Information in this release on page 16. (7) See WWE press release, “WWE® Announces Financial Reporting Changes Effective with Q1 2018 Results,” February 8,
2018 (corporate.wwe.com/investors). (8) Core content rights fees consist primarily of licensing revenues earned from the distribution of our flagship programs, Raw
and SmackDown, through global broadcast, pay television and digital platforms. (9) Other forms of media monetization reflect revenues earned from the distribution of other content, including, but not limited
to, scripted, reality and other in-ring programming, as well as theatrical and direct-to-home video releases. (10) Source: Nielsen NNTV, Live+SD Avg. Viewers P2+ primetime program ranking on selected networks by standard calendar
year. Includes first-run primetime (Mon-Sun 8pm-11pm) telecasts. (11) Other Live Events includes revenue from the sale of travel packages associated with the Company’s live events, and
commissions earned through secondary ticketing.
Non-GAAP Measures
The Company defines Adjusted OIBDA as operating income excluding depreciation and amortization, stock-based
compensation expense, certain impairment charges and other non-recurring material items that otherwise would
impact the comparability of results between periods. Adjusted OIBDA includes amortization expenses directly
related to the Company's revenue generating activities, including the amortization of feature film, television
production and WWE Network programming assets. The Company believes the presentation of Adjusted OIBDA is
relevant and useful for investors because it allows them to view the Company’s segment performance in the same
manner as the primary method used by management to evaluate segment performance and to make decisions
regarding the allocation of resources. Additionally, the Company believes that Adjusted OIBDA provides a
meaningful representation of operating cash flows generated by our business segments, and is a primary measure
used by media investors, analysts and peers for comparative purposes.
Adjusted OIBDA is a non-GAAP financial measure and may be different than similarly-titled non-GAAP financial
measures used by other companies. WWE views operating income as the most directly comparable GAAP measure.
Adjusted OIBDA (and other non-GAAP measures such as Adjusted Operating Income, Adjusted Net Income and
Adjusted EPS presented to exclude certain material items that impact the comparability between periods) should
7
not be considered in isolation from, or as a substitute for, operating income or other GAAP measures, such as net
income or operating cash flow, as an indicator of operating performance or liquidity.
The Company defines Free Cash Flow as net cash provided by operating activities less cash used for capital
expenditures. Although it is not a recognized measure of liquidity under U.S. GAAP, Free Cash Flow provides
useful information regarding the amount of cash WWE’s continuing business generates after capital expenditures
and is available for reinvesting in the business, debt service, and payment of dividends.
Additional Information
Additional business metrics are made available to investors on the corporate website -
corporate.wwe.com/investors. Note: As previously announced WWE will host a conference call at 11:00 a.m. ET
on May 3rd to discuss the Company's earnings results for the first quarter of 2018. All interested parties are welcome
to listen to a live web cast that will be hosted through the Company’s web site at corporate.wwe.com/investors.
Participants can access the conference call by dialing 1-855-200-4993 (toll free) or 1-323-794-2092 from outside
the U.S. (conference ID for both lines: 1674928). Please reserve a line 5-10 minutes prior to the start time of the
conference call.
The earnings presentation referenced during the call will be made available on May 3, 2018 at
corporate.wwe.com/investors. A replay of the call will be available approximately two hours after the conference
call concludes, and can be accessed on the Company’s web site.
About WWE
WWE, a publicly traded company (NYSE: WWE), is an integrated media organization and recognized leader in
global entertainment. The Company consists of a portfolio of businesses that create and deliver original content 52
weeks a year to a global audience. WWE is committed to family friendly entertainment on its television
programming, pay-per-view, digital media and publishing platforms. WWE’s TV-PG, family-friendly programming
can be seen in more than 800 million homes worldwide in 25 languages. WWE Network, the first-ever 24/7 over-
the-top premium network that includes all live pay-per-views, scheduled programming and a massive video-on-
demand library, is currently available in more than 180 countries. The Company is headquartered in Stamford,
Conn., with offices in New York, Los Angeles, London, Mexico City, Mumbai, Shanghai, Singapore, Dubai,
Munich and Tokyo.
Additional information on WWE (NYSE: WWE) can be found at wwe.com and corporate.wwe.com. For
information on our global activities, go to http://www.wwe.com/worldwide/.
Trademarks: All WWE programming, talent names, images, likenesses, slogans, wrestling moves, trademarks, logos and
copyrights are the exclusive property of WWE and its subsidiaries. All other trademarks, logos and copyrights are the
property of their respective owners.
Forward-Looking Statements: This press release contains forward-looking statements pursuant to the safe harbor provisions of
the Securities Litigation Reform Act of 1995, which are subject to various risks and uncertainties. These risks and uncertainties
include, without limitation, risks relating to: entering, maintaining and renewing major distribution agreements, including our
principal domestic television license which currently expires in September 2019; WWE Network (including the risk that we are
unable to attract, retain and renew subscribers); our need to continue to develop creative and entertaining programs and events;
the possibility of a decline in the popularity of our brand of sports entertainment; the continued importance of key performers
and the services of Vincent K. McMahon; possible adverse changes in the regulatory atmosphere and related private sector
initiatives; the highly competitive, rapidly changing and increasingly fragmented nature of the markets in which we operate
and greater financial resources or marketplace presence of many of our competitors; uncertainties associated with international
markets; our difficulty or inability to promote and conduct our live events and/or other businesses if we do not comply with
applicable regulations; our dependence on our intellectual property rights, our need to protect those rights, and the risks of our
infringement of others’ intellectual property rights; the complexity of our rights agreements across distribution mechanisms
and geographical areas; potential substantial liability in the event of accidents or injuries occurring during our physically
8
demanding events including, without limitation, claims relating to CTE; large public events as well as travel to and from such
events; our feature film business; our expansion into new or complementary businesses and/or strategic investments; our
computer systems and online operations; privacy norms and regulations; a possible decline in general economic conditions and
disruption in financial markets; our accounts receivable; our indebtedness; litigation; our potential failure to meet market
expectations for our financial performance, which could adversely affect our stock; Vincent K. McMahon exercises control
over our affairs, and his interests may conflict with the holders of our Class A common stock; a substantial number of shares
are eligible for sale by the McMahons and the sale, or the perception of possible sales, of those shares could lower our stock
price; and the relatively small public “float” of our Class A common stock. In addition, our dividend is dependent on a number
of factors, including, among other things, our liquidity and historical and projected cash flow, strategic plan (including
alternative uses of capital), our financial results and condition, contractual and legal restrictions on the payment of dividends
(including under our revolving credit facility), general economic and competitive conditions and such other factors as our Board
of Directors may consider relevant. Forward-looking statements made by the Company speak only as of the date made and are
subject to change without any obligation on the part of the Company to update or revise them. Undue reliance should not be
placed on these statements. For more information about risks and uncertainties associated with the Company’s business, please
refer to the “Management’s Discussion and Analysis of Financial Condition and Results of Operations” and “Risk Factors”
sections of the Company’s SEC filings, including, but not limited to, our annual report on Form 10-K and quarterly reports on
Form 10-Q.
9
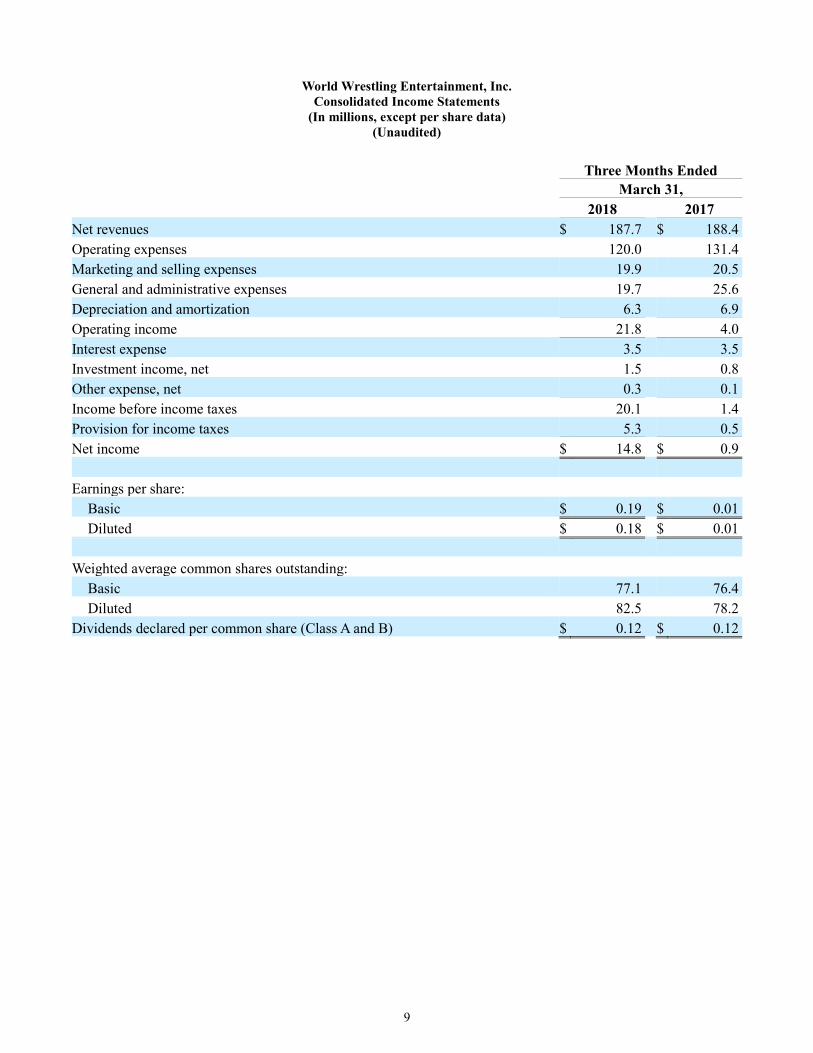
World Wrestling Entertainment, Inc.
Consolidated Income Statements
(In millions, except per share data)
(Unaudited)
Three Months Ended
March 31,
2018 2017
Net revenues $ 187.7 $ 188.4
Operating expenses 120.0 131.4
Marketing and selling expenses 19.9 20.5
General and administrative expenses 19.7 25.6
Depreciation and amortization 6.3 6.9
Operating income 21.8 4.0
Interest expense 3.5 3.5
Investment income, net 1.5 0.8
Other expense, net 0.3 0.1
Income before income taxes 20.1 1.4
Provision for income taxes 5.3 0.5
Net income $ 14.8 $ 0.9
Earnings per share:
Basic $ 0.19 $ 0.01
Diluted $ 0.18 $ 0.01
Weighted average common shares outstanding:
Basic 77.1 76.4
Diluted 82.5 78.2
Dividends declared per common share (Class A and B) $ 0.12 $ 0.12
10
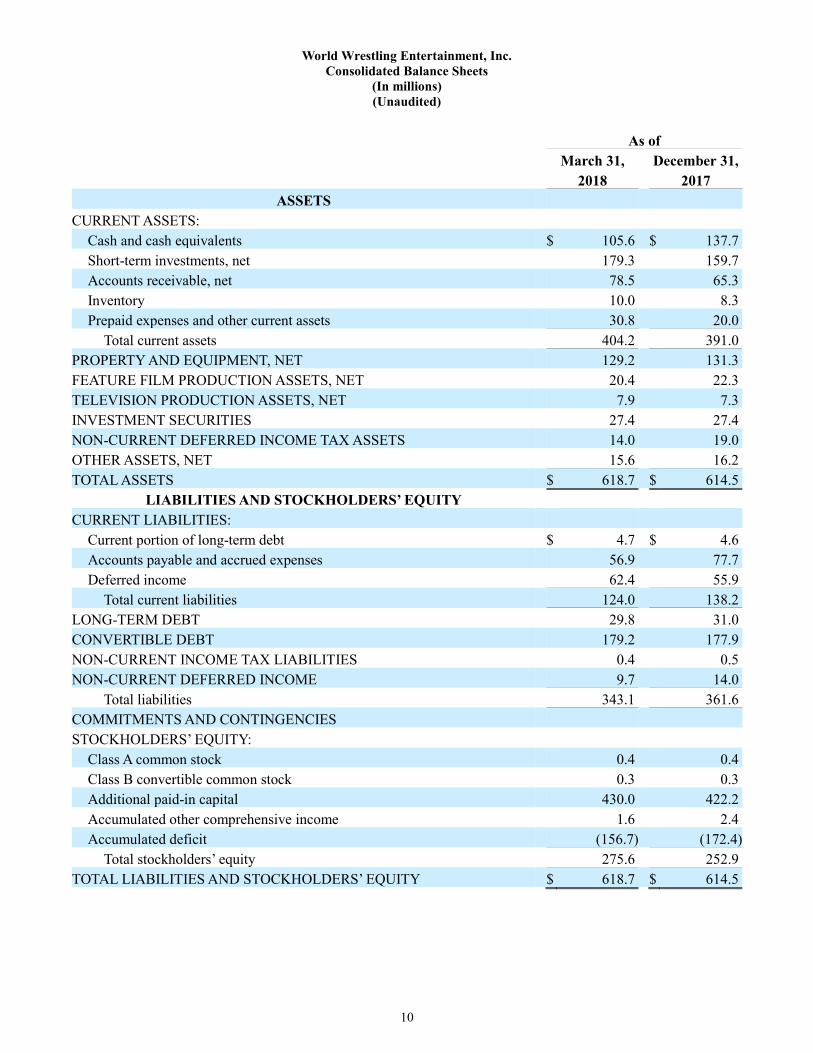
World Wrestling Entertainment, Inc.
Consolidated Balance Sheets
(In millions)
(Unaudited)
As of
March 31, December 31,
2018 2017
ASSETS
CURRENT ASSETS:
Cash and cash equivalents $ 105.6 $ 137.7
Short-term investments, net 179.3 159.7
Accounts receivable, net 78.5 65.3
Inventory 10.0 8.3
Prepaid expenses and other current assets 30.8 20.0
Total current assets 404.2 391.0
PROPERTY AND EQUIPMENT, NET 129.2 131.3
FEATURE FILM PRODUCTION ASSETS, NET 20.4 22.3
TELEVISION PRODUCTION ASSETS, NET 7.9 7.3
INVESTMENT SECURITIES 27.4 27.4
NON-CURRENT DEFERRED INCOME TAX ASSETS 14.0 19.0
OTHER ASSETS, NET 15.6 16.2
TOTAL ASSETS $ 618.7 $ 614.5
LIABILITIES AND STOCKHOLDERS’ EQUITY
CURRENT LIABILITIES:
Current portion of long-term debt $ 4.7 $ 4.6
Accounts payable and accrued expenses 56.9 77.7
Deferred income 62.4 55.9
Total current liabilities 124.0 138.2
LONG-TERM DEBT 29.8 31.0
CONVERTIBLE DEBT 179.2 177.9
NON-CURRENT INCOME TAX LIABILITIES 0.4 0.5
NON-CURRENT DEFERRED INCOME 9.7 14.0
Total liabilities 343.1 361.6
COMMITMENTS AND CONTINGENCIES
STOCKHOLDERS’ EQUITY:
Class A common stock 0.4 0.4
Class B convertible common stock 0.3 0.3
Additional paid-in capital 430.0 422.2
Accumulated other comprehensive income 1.6 2.4
Accumulated deficit (156.7) (172.4)
Total stockholders’ equity 275.6 252.9
TOTAL LIABILITIES AND STOCKHOLDERS’ EQUITY $ 618.7 $ 614.5
11
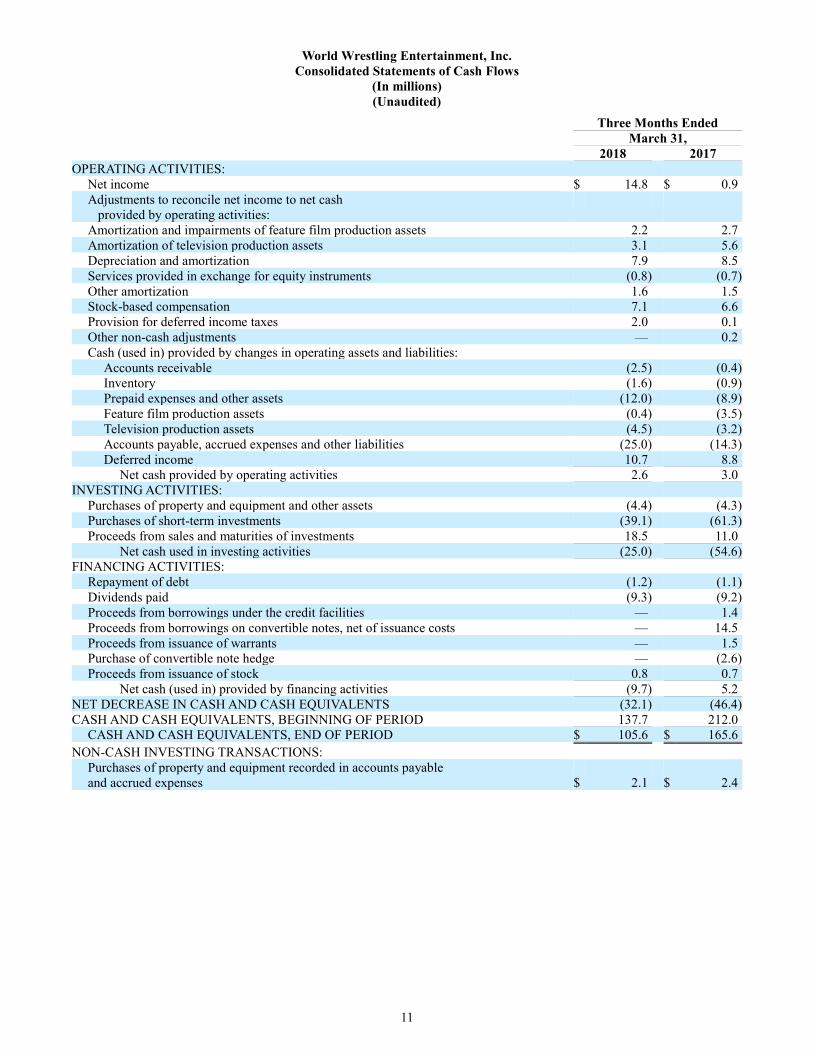
World Wrestling Entertainment, Inc.
Consolidated Statements of Cash Flows
(In millions)
(Unaudited)
Three Months Ended
March 31,
2018 2017
OPERATING ACTIVITIES:
Net income $ 14.8 $ 0.9
Adjustments to reconcile net income to net cash
provided by operating activities:
Amortization and impairments of feature film production assets 2.2 2.7
Amortization of television production assets 3.1 5.6
Depreciation and amortization 7.9 8.5
Services provided in exchange for equity instruments (0.8) (0.7)
Other amortization 1.6 1.5
Stock-based compensation 7.1 6.6
Provision for deferred income taxes 2.0 0.1
Other non-cash adjustments — 0.2
Cash (used in) provided by changes in operating assets and liabilities:
Accounts receivable (2.5) (0.4)
Inventory (1.6) (0.9)
Prepaid expenses and other assets (12.0) (8.9)
Feature film production assets (0.4) (3.5)
Television production assets (4.5) (3.2)
Accounts payable, accrued expenses and other liabilities (25.0) (14.3)
Deferred income 10.7 8.8
Net cash provided by operating activities 2.6 3.0
INVESTING ACTIVITIES:
Purchases of property and equipment and other assets (4.4) (4.3)
Purchases of short-term investments (39.1) (61.3)
Proceeds from sales and maturities of investments 18.5 11.0
Net cash used in investing activities (25.0) (54.6)
FINANCING ACTIVITIES:
Repayment of debt (1.2) (1.1)
Dividends paid (9.3) (9.2)
Proceeds from borrowings under the credit facilities — 1.4
Proceeds from borrowings on convertible notes, net of issuance costs — 14.5
Proceeds from issuance of warrants — 1.5
Purchase of convertible note hedge — (2.6)
Proceeds from issuance of stock 0.8 0.7
Net cash (used in) provided by financing activities (9.7) 5.2
NET DECREASE IN CASH AND CASH EQUIVALENTS (32.1) (46.4)
CASH AND CASH EQUIVALENTS, BEGINNING OF PERIOD 137.7 212.0
CASH AND CASH EQUIVALENTS, END OF PERIOD $ 105.6 $ 165.6
NON-CASH INVESTING TRANSACTIONS:
Purchases of property and equipment recorded in accounts payable
and accrued expenses $ 2.1 $ 2.4
12
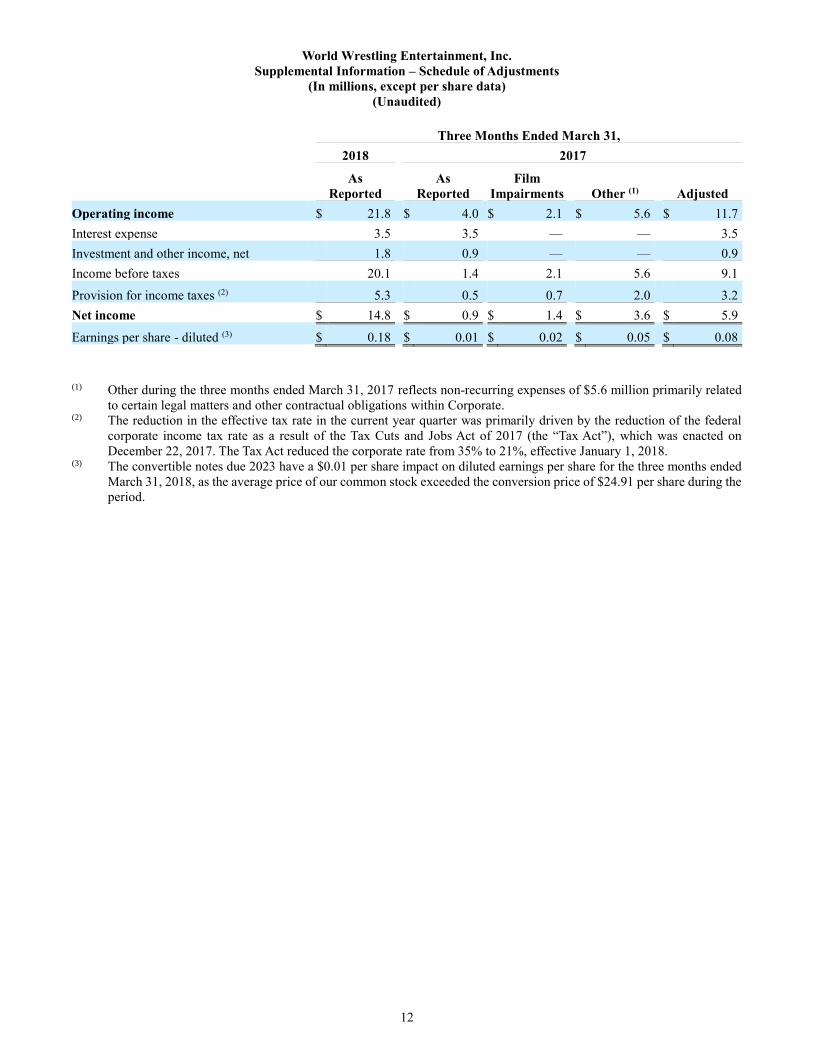
World Wrestling Entertainment, Inc.
Supplemental Information – Schedule of Adjustments
(In millions, except per share data)
(Unaudited)
Three Months Ended March 31,
2018 2017
As
Reported
As
Reported
Film
Impairments Other (1) Adjusted
Operating income $ 21.8 $ 4.0 $ 2.1 $ 5.6 $ 11.7
Interest expense 3.5 3.5 — — 3.5
Investment and other income, net 1.8 0.9 — — 0.9
Income before taxes 20.1 1.4 2.1 5.6 9.1
Provision for income taxes (2) 5.3 0.5 0.7 2.0 3.2
Net income $ 14.8 $ 0.9 $ 1.4 $ 3.6 $ 5.9
Earnings per share - diluted (3) $ 0.18 $ 0.01 $ 0.02 $ 0.05 $ 0.08
(1) Other during the three months ended March 31, 2017 reflects non-recurring expenses of $5.6 million primarily related
to certain legal matters and other contractual obligations within Corporate. (2) The reduction in the effective tax rate in the current year quarter was primarily driven by the reduction of the federal
corporate income tax rate as a result of the Tax Cuts and Jobs Act of 2017 (the “Tax Act”), which was enacted on
December 22, 2017. The Tax Act reduced the corporate rate from 35% to 21%, effective January 1, 2018. (3) The convertible notes due 2023 have a $0.01 per share impact on diluted earnings per share for the three months ended
March 31, 2018, as the average price of our common stock exceeded the conversion price of $24.91 per share during the
period.
13
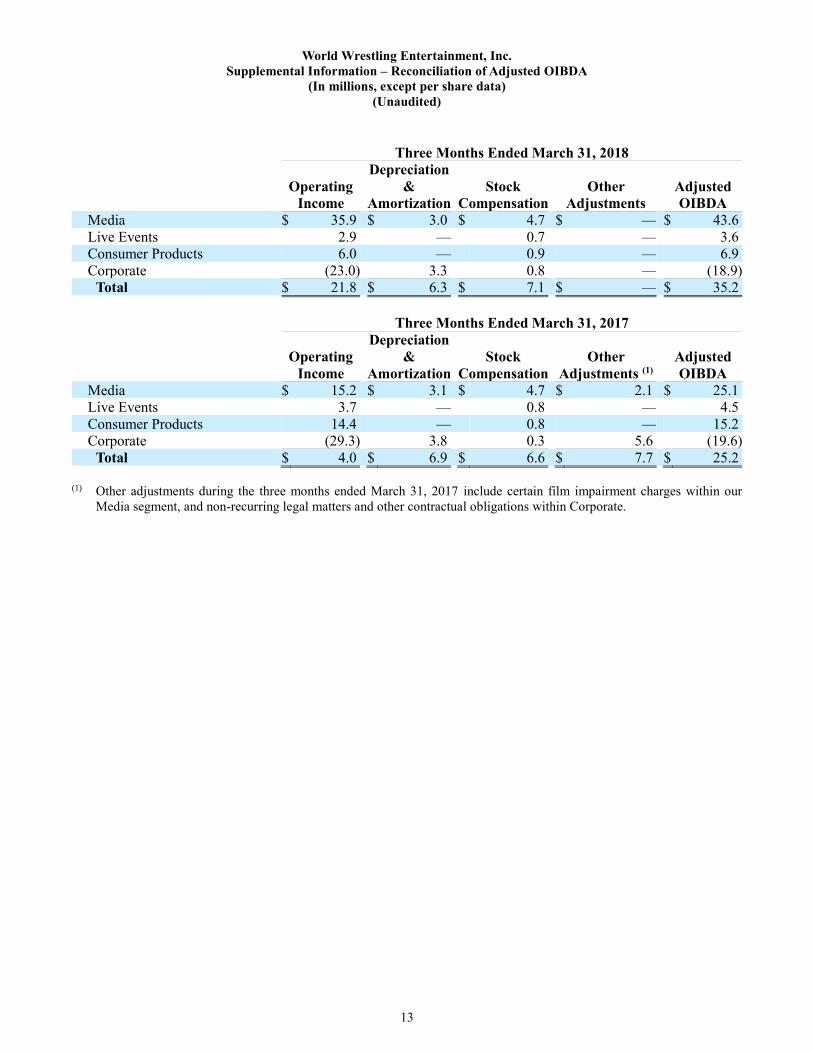
World Wrestling Entertainment, Inc.
Supplemental Information – Reconciliation of Adjusted OIBDA
(In millions, except per share data)
(Unaudited)
Three Months Ended March 31, 2018
Operating
Income
Depreciation
&
Amortization
Stock
Compensation
Other
Adjustments
Adjusted
OIBDA
Media $ 35.9 $ 3.0 $ 4.7 $ — $ 43.6
Live Events 2.9 — 0.7 — 3.6
Consumer Products 6.0 — 0.9 — 6.9
Corporate (23.0) 3.3 0.8 — (18.9)
Total $ 21.8 $ 6.3 $ 7.1 $ — $ 35.2
Three Months Ended March 31, 2017
Operating
Income
Depreciation
&
Amortization
Stock
Compensation
Other
Adjustments (1)
Adjusted
OIBDA
Media $ 15.2 $ 3.1 $ 4.7 $ 2.1 $ 25.1
Live Events 3.7 — 0.8 — 4.5
Consumer Products 14.4 — 0.8 — 15.2
Corporate (29.3) 3.8 0.3 5.6 (19.6)
Total $ 4.0 $ 6.9 $ 6.6 $ 7.7 $ 25.2
(1) Other adjustments during the three months ended March 31, 2017 include certain film impairment charges within our
Media segment, and non-recurring legal matters and other contractual obligations within Corporate.
14
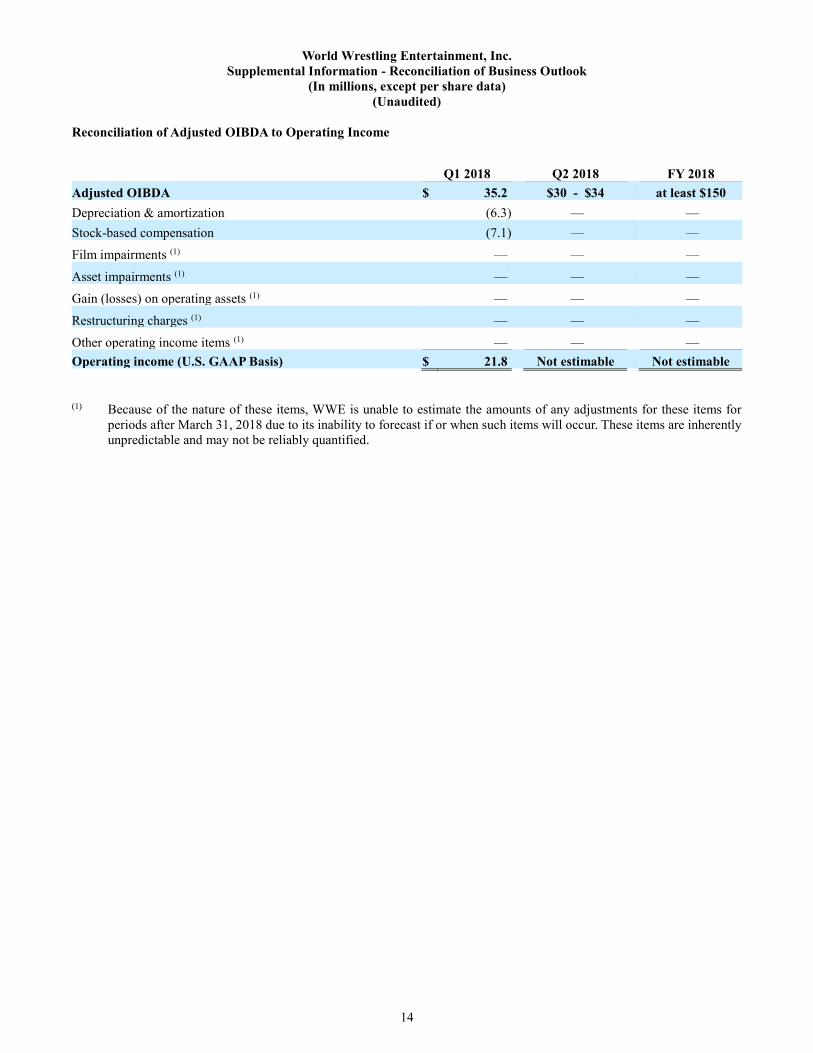
World Wrestling Entertainment, Inc.
Supplemental Information - Reconciliation of Business Outlook
(In millions, except per share data)
(Unaudited)
Reconciliation of Adjusted OIBDA to Operating Income
Q1 2018 Q2 2018 FY 2018
Adjusted OIBDA $ 35.2 $30 - $34 at least $150
Depreciation & amortization (6.3) — —
Stock-based compensation (7.1) — —
Film impairments (1) — — —
Asset impairments (1) — — —
Gain (losses) on operating assets (1) — — —
Restructuring charges (1) — — —
Other operating income items (1) — — —
Operating income (U.S. GAAP Basis) $ 21.8 Not estimable Not estimable
(1) Because of the nature of these items, WWE is unable to estimate the amounts of any adjustments for these items for
periods after March 31, 2018 due to its inability to forecast if or when such items will occur. These items are inherently
unpredictable and may not be reliably quantified.
15
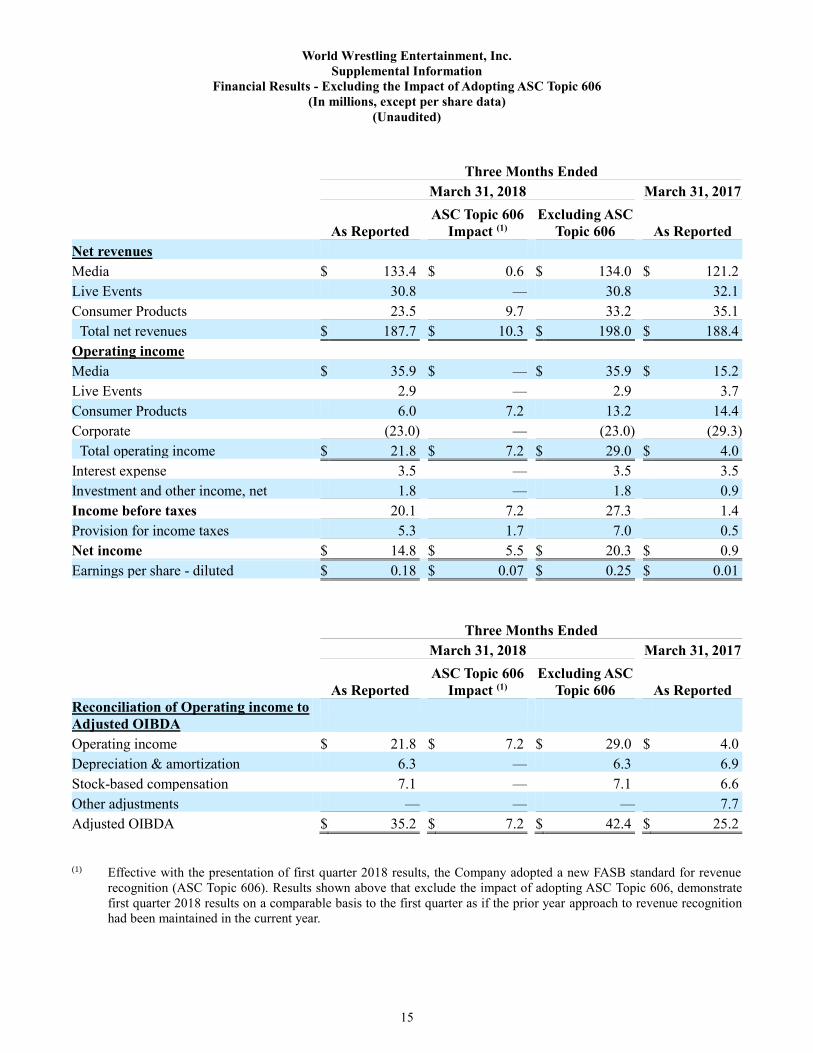
World Wrestling Entertainment, Inc.
Supplemental Information
Financial Results - Excluding the Impact of Adopting ASC Topic 606
(In millions, except per share data)
(Unaudited)
Three Months Ended
March 31, 2018 March 31, 2017
As Reported
ASC Topic 606
Impact (1)
Excluding ASC
Topic 606 As Reported
Net revenues
Media $ 133.4 $ 0.6 $ 134.0 $ 121.2
Live Events 30.8 — 30.8 32.1
Consumer Products 23.5 9.7 33.2 35.1
Total net revenues $ 187.7 $ 10.3 $ 198.0 $ 188.4
Operating income
Media $ 35.9 $ — $ 35.9 $ 15.2
Live Events 2.9 — 2.9 3.7
Consumer Products 6.0 7.2 13.2 14.4
Corporate (23.0) — (23.0) (29.3)
Total operating income $ 21.8 $ 7.2 $ 29.0 $ 4.0
Interest expense 3.5 — 3.5 3.5
Investment and other income, net 1.8 — 1.8 0.9
Income before taxes 20.1 7.2 27.3 1.4
Provision for income taxes 5.3 1.7 7.0 0.5
Net income $ 14.8 $ 5.5 $ 20.3 $ 0.9
Earnings per share - diluted $ 0.18 $ 0.07 $ 0.25 $ 0.01
Three Months Ended
March 31, 2018 March 31, 2017
As Reported
ASC Topic 606
Impact (1)
Excluding ASC
Topic 606 As Reported
Reconciliation of Operating income to
Adjusted OIBDA
Operating income $ 21.8 $ 7.2 $ 29.0 $ 4.0
Depreciation & amortization 6.3 — 6.3 6.9
Stock-based compensation 7.1 — 7.1 6.6
Other adjustments — — — 7.7
Adjusted OIBDA $ 35.2 $ 7.2 $ 42.4 $ 25.2
(1) Effective with the presentation of first quarter 2018 results, the Company adopted a new FASB standard for revenue
recognition (ASC Topic 606). Results shown above that exclude the impact of adopting ASC Topic 606, demonstrate
first quarter 2018 results on a comparable basis to the first quarter as if the prior year approach to revenue recognition
had been maintained in the current year.

16
World Wrestling Entertainment, Inc.
Supplemental Information - Free Cash Flow
(In millions)
(Unaudited)
Three Months Ended
March 31,
2018 2017
Net cash provided by operating activities $ 2.6 $ 3.0
Less cash used for capital expenditures:
Purchase of property and equipment and other assets (4.4) (4.3)
Free Cash Flow $ (1.8) $ (1.3)