WTCS Institutional Research Committee Fall 2010 Meeting · PDF fileWTCS Institutional Research...
43
WTCS Institutional Research Committee Fall Meeting September 22 and 23, 2010 MSTC – Stevens Point Campus, Room 122 Teleconference #: 715.342.3151 Agenda Wednesday, September 22, 2010 Time Topic Facilitator Focus 1:00 Welcome and Agenda Review Kim Pahl IRC 1:15 Economic Impact Study Discuss college trends and follow-up questions. Mike Gagner IRC 1:45 Closing the Loop QRP Passing Grade Decision - “C” IRC Website Host Data Systems Project Update Green Jobs Subcommittee Update Julie Tyznik Kelly Gallagher/ Tom Heaney Kelly Gallagher Workgroup IRC Packet 2:30 Using ERP Systems to Complete IPEDs Question How many colleges are using their ERP systems (i.e. Colleague, Banner, etc.) to do IPEDS? If any are, how much of IPEDS? Some? All? What were the challenges that were encountered during implementation? LeeAnn Mikula IRC 2:45 Break 3:00 New Ethnicity Categories Reporting Question How are districts going to aggregate the data for reporting multiple race individuals for the new ethnicity categories? LeeAnn Mikula IRC 3:30 Graduate Follow-Up Long-Range Trends Viktor will share WCTC’s long-range placement trends. Discuss trends system-wide or at other colleges. Viktor Brenner IRC 3:50 Evaluation of Cost Effectiveness of Instructional Initiatives Review models from California and Colorado. Provide feedback on use in grant evaluation and for other initiatives like RISE. Fran Johnson IRC/ Grants Packet 4:30 Best Practices and Sharing Needs Assessment Models College Updates Spring Meeting: March/April at NTC IRC 5:00 Adjourn
Transcript of WTCS Institutional Research Committee Fall 2010 Meeting · PDF fileWTCS Institutional Research...

WTCS Institutional Research Committee Fall Meeting September 22 and 23, 2010
MSTC – Stevens Point Campus, Room 122 Teleconference #: 715.342.3151
Agenda
Wednesday, September 22, 2010
Time Topic Facilitator Focus 1:00 Welcome and Agenda Review Kim Pahl IRC 1:15 Economic Impact Study
Discuss college trends and follow-up questions.
Mike Gagner IRC
1:45 Closing the Loop QRP Passing Grade Decision - “C” IRC Website Host Data Systems Project Update Green Jobs Subcommittee Update
Julie Tyznik Kelly Gallagher/ Tom Heaney Kelly Gallagher Workgroup
IRC
Packet
2:30 Using ERP Systems to Complete IPEDs Question How many colleges are using their ERP systems (i.e. Colleague, Banner, etc.) to do IPEDS? If any are, how much of IPEDS? Some? All? What were the challenges that were encountered during implementation?
LeeAnn Mikula
IRC
2:45 Break 3:00 New Ethnicity Categories Reporting Question
How are districts going to aggregate the data for reporting multiple race individuals for the new ethnicity categories?
LeeAnn Mikula IRC
3:30 Graduate Follow-Up Long-Range Trends Viktor will share WCTC’s long-range placement trends. Discuss trends system-wide or at other colleges.
Viktor Brenner IRC
3:50 Evaluation of Cost Effectiveness of Instructional Initiatives Review models from California and Colorado. Provide feedback on use in grant evaluation and for other initiatives like RISE.
Fran Johnson IRC/ Grants
Packet
4:30 Best Practices and Sharing Needs Assessment Models College Updates Spring Meeting: March/April at NTC
IRC
5:00 Adjourn

WTCS Institutional Research Committee Fall Meeting
Thursday, September 23, 2010
Breakfast on your own – Holiday Inn Express has a hot continental breakfast
Time Topic Facilitator Focus
8:00 a.m. Networking Time
8:20 a.m. Welcome and Agenda Review
8:30 a.m.
Concentrator Scorecard Discuss how colleges might use it.
Fran Johnson QRP
9:00 a.m.
Comprehensive QRP for the IT- Web & Software Development Program at WCTC
Alex Sielaff
9:30 a.m. New Basic Education Scorecard with Self Study Tab Fran Johnson QRP
9:45 a.m. BREAK
10:00 a.m. Effectively using Perkins Resources in QRP Fran Johnson QRP
10:30 a.m.
Discussion on College Scorecard Data Elements for Apprenticeship Scorecards How is each college handling this?
Fran Johnson QRP
11:20 a.m. Closing the Loop Retention Metric – no updates QRP Evaluation – no updates Target/threshold – no updates
Committee QRP
11:30 a.m. LUNCH & Networking
12:10 p.m. Student Services QRP Example from WCTC Utilized Value Stream Mapping with the various SS departments to improve and add value to processes.
Dawn Voight QRP
12:40 p.m. National Initiatives on Common Performance Measures Discuss and recommend metric models and what it means to us in the future. WI is not participating in either right now. Models: National Governor’s Association Complete to Compete and Achieving the Dream, a Lumina Foundation attempt to achieve common performance measures for community colleges
Fran Johnson QRP
1:20 p.m. BREAK
1:30 p.m. New Accreditation Pilot Program Option Gain awareness of a new a joint effort by Wisconsin Forward Award (WFA) and AQIP/HLC.
Lee Rasch, Western’s President and Elizabeth Menzer, WFA
AQIP/ Quality
3:00 AQIP & Quality Sharing & Best Practices Share how colleges determine Action Projects and how other continuous improvement projects are decided.
Group AQIP/ Quality
4:00 p.m. Adjourn Reminder: College level indicators due to WTCS before October 30th.

Closing the Loop QRP Passing Grade Decision - “C” I will reiterate that a “C” 2.0 is considered the passing grade in both QRP and Perkins (1P1 when course completion is used and 1P2). I know there was much discussion, but this has been the standard for at least two years and we may be in the third. It went from our discussion (IR) to the Presidents and our Administration at this point of time has made that decision. IRC Website Host Nancy Alar from the WTCS office has been charged with keeping the IR website up to date. Her email is [email protected] Green Jobs Subcommittee Update Purpose: Create a process for identifying New Energy Economy job opportunities in the state. Team: Ray Walter, Jill Metzger, and Alex Sielaff (WCTC) Tracy Dryden (Western) Beth Ellie (NTC) Randy Zogbaum (WTCS) Joanne Gorski (FVTC) Derek Jablonicky and Kim Pahl (LTC) Process:
1. Identify Energy Sectors. 2. Research sources of information (both subject matter experts and online sources). 3. Complete scan. Scan elements include the following:
a. Trends and Themes Summary b. Is this industry/career specific to a region/the state/Midwest? c. Occupational Outlook (occupations, existing and new jobs, wages) d. Influencing Factors e. Sources
Progress:
1. Created a team and developed a starting work plan. 2. Set up a shared workspace on GoogleDocs. 3. Identified and shared resources among team members on the workspace. 4. Began a scan process as shown in Table 1 – Green Jobs Scan.

Table 1 – Green Jobs Scan Before Meter Other Colleges Lead Progress Coal – Electrical Power MSTC, LTC, BTC, SWTC,
Madison LTC 80%
Nuclear LTC, NWTC LTC 70% Wind LTC, GTC, WCTC, Madison LTC Posted – 70%Solar/PhotoVoltaic FVTC, LTC, NWTC, GTC, WCTC LTC/ FVTC 0% Geothermal GTC, NWTC, WCTC NTC Posted ‐
100% Bio fuels/Refinery/ Digesters MSTC, NWTC, WITC NTC Posted ‐
100% Hydro Western Western 0% Distribution – Utility Line Workers NWTC LTC 0% After Meter (Commercial & Residential) Weatherization LTC, Western Western 50% Building Design Western 50% Auditing GTC, Milw, Western Western 50% Energy Management NWTC, WCTC, FVTC WCTC Posted ‐
100% Solar Thermal 0% Energy Auditing 0% Sustainable Operations – Facilities Management
GTC NTC 25%
Water Resources/Management Milw, WCTC WCTC Posted ‐ 100%
Links to Scans: Facilities Management: https://docs.google.com/Doc?docid=0AUUA191NDZcSZDdmbXR2ZF8xMmdkNDJ0cDQ0&hl=en&authkey=CL68gf8K Wind: https://docs.google.com/document/edit?id=1w9VPe5poUEtarjU-a0Vyc9Aw88eG6BWG_DDmuTNUZrM&hl=en&authkey=CNzJ45EK Biomass/Biofuels/Digesters/Refineries: https://docs.google.com/Doc?docid=0AUUA191NDZcSZDdmbXR2ZF8xN2R6OWszZGN4&hl=en&authkey=CJL_5LQK Geothermal: https://docs.google.com/Doc?docid=0AUUA191NDZcSZDdmbXR2ZF8xOGMyZjU5Y2Nt&hl=en&authkey=CPGvj-sI Water & Water Related: https://docs.google.com/document/edit?id=132GpGxM8oN1q-KEdyg5I_63j8FFShOrSyQbiP9v4fmE&hl=en&authkey=CLzrh_oN Energy Management: https://docs.google.com/document/edit?id=1mkrEtcJ3Qh7osdGvQAlgyTYSU_pWN0zB2qxCCpWLjbs&hl=en&authkey=CO_Cs80C

Two Scan Examples
Green Jobs Scan and Outlook June 2010
Type: X Before Meter After Meter Industry: Geothermal Trends and Themes Summary Below are the web resources Gateway included in their Scope document. Gateway coupled this national information with local labor market data for HVAC because they couldn't find local labor market data related to geothermal. Gateway is working with the state office on exactly what their needs assessment survey will look like and who will be in the survey population. Gateway needs the results for their Needs Demonstration which is due in October. They are trying to show a need for two geothermal programs: a technical diploma for installers and an associate degree for technicians. Source: Anne Whynott, Associate Vice President-Research, Planning & Development, Gateway Technical College Since the first geothermally-generated electricity in the world was produced at Larderello, Italy, in 1904 the use of geothermal energy for electricity has grown worldwide to about 7,000 megawatts in 21 countries around the world. The United States alone produces 2,700 megawatts of electricity from geothermal energy, electricity comparable to burning 60 million barrels of oil each year. Source: The Geothermal Education Office, http://geothermal/marin.org According to the Geothermal Energy Association, the use of geothermal heat pumps has been increasing at a rate of 15% every year. The GEA estimated that there were more than 600,000 units in 2005 with 50,000 to 60,000 heat pumps added every year. With energy costs seemingly ever on the rise in today’s world, it is no surprise that both people and businesses are turning more and more toward geothermal heating and cooling – a system that has been estimated to save consumers up to 50% on heating and cooling (according to the EPA). Source: http://www.pmengineer.com/Articles/Feature_Article/BNP_GUID_9-5-2006_A_10000000000000423105 A Renewable Energy Consumption and Electricity Preliminary Statistics 2008 report was released in July 2009 by the Energy Information Administration (EIA) Office of Coal, Nuclear, Electric and Alternate Fuels of the U.S. Department of Energy. This EIA report stated “total renewable energy consumption increased by 487 trillion Btu to 7,301 trillion Btu. This is the highest level attained based on EIA estimates of renewable energy back to 1949, and is due to substantial increases in the use of biofuels, wind and solar energy. Renewable energy’s share of total U.S. energy consumption was over 7 percent in 2008, compared to 6 percent in 2004.” This EIA report showed that geothermal energy produced 5 percent of renewable energy in the United States.

Table 1 U.S. Energy Consumption by Energy Source, 2004 – 2008 (Quadrillion Btu) Energy Source 2004 2005 2006 2007 2008Fossil Fuels 85.830 85.817 84.690 86.174 83.436Coal 22.466 22.797 22.447 22.748 22.421Coal Coke Net Imports 0.137 0.045 0.061 0.025 0.040Natural Gas 1 2.931 22.583 22.224 23.628 23.838Petroleum 2 40.294 40.393 39.958 39.773 37.137Electricity Net Imports 0.039 0.084 0.063 0.106 0.113Nuclear Electric Power 8.222 8.160 8.214 8.458 8.455Renewable Energy 6.260 6.423 6.909 6.814 7.301Biomass3 3.023 3.133 3.361 3.597 3.884Biofuels 0.513 0.594 0.795 1.025 1.413Waste 0.389 0.403 0.414 0.430 0.431Wood Derived Fuels 2.121 2.136 2.152 2.142 2.041Geothermal Energy 0.341 0.343 0.343 0.349 0.358Hydroelectric Conventional 2.690 2.703 2.869 2.446 2.453Solar/PV Energy 0.065 0.066 0.072 0.081 0.091Wind Energy 0.142 0.178 0.264 0.341 0.514Total 100.349 100.485 99.876 101.552 99.305
1 Includes supplemental gaseous fuels. 2Petroleum products supplied, including natural gas plant liquids and crude oil burned as fuel. 3Biomass includes: biofuels, waste (landfill gas, MSW biogenic, and other biomass), wood and wood derived fuels. PV = Photovoltaic. Notes: Data revisions are discussed in the Highlights section. Totals may not equal sum of components due to independent rounding. Data for 2008 is preliminary. Sources: Non-renewable energy: Energy Information Administration (EIA), Monthly Energy Review (MER) April 2009, DOE/EIA-0035 (2009/04) (Washington, DC, April 2009), Tables 1.3, 1.4a and 1.4b; Renewable Energy: Table 2 of this report.
U.S. Renewable Energy Consumption by Energy Use Sector and Energy Source, 2004 – 2008 (Quadrillion Btu)
Sector and Source 2004 2005 2006 2007 2008Residential Geothermal 0.014 0.016 0.018 0.022 0.026Commercial Geothermal 0.012 0.014 0.014 0.014 0.015Industrial Geothermal 0.004 0.004 0.004 0.005 0.005Electric Power Geothermal 0.311 0.309 0.306 0.308 0.312Overall Geothermal 0.341 0.343 0.343 0.349 0.358
Sources: Analysis conducted by Energy Information Administration, Office of Coal, Nuclear, Electric, and Alternate Fuels and specific sources described as follows. Residential: Energy Information Administration, Form EIA-457A/G, "Residential Energy Consumption Survey;" Oregon Institute of Technology, Geo-Heat Center; and Energy Information Administration, Form EIA-63-A, "Annual Solar Thermal Collector Manufacturers Survey" and Form EIA-63B, "Annual Photovoltaic Module/Cell Manufacturers Survey." Commercial: Energy Information Administration, Form EIA-906, "Power Plant Report," Form EIA-920, "Combined Heat and Power Plant Report," and Form EIA-923, "Power Plant Operations Report;" and Oregon Institute of Technology, Geo-Heat Center. Industrial: Energy Information Administration, Form EIA-846 (A, B, C) "Manufacturing Energy Consumption Survey," Form EIA-906, "Power Plant Report," Form EIA-920, "Combined Heat and Power Plant Report," and Form EIA-923, "Power Plant Operations Report;" and Oregon Institute of Technology, Geo-Heat Center; Government Advisory Associates, Resource Recovery Yearbook and Methane Recovery Yearbook; U.S. Environmental Protection Agency, Landfill Methane Outreach Program estimates; and losses and coproducts from the production of biodiesel and ethanol calculated as the difference between energy in feedstocks and production. Biofuels for Transportation: Biodiesel: Consumption: 2001-2008 Calculated as biodiesel production plus net imports; Production: 2001- 2005: U.S. Department of Agriculture (USDA), Commodity Credit Corporation, Bioenergy Program, 2006: U.S. Department of Commerce, Bureau of Census, Current Industrial Reports, Fats and Oils - Production, Consumption and Stocks, data for soybean oil in methyl esters (biodiesel) and 2007- 2008: U.S. Department of Commerce, Bureau of Census, Current Industrial Reports, Fats and Oils - Production, Consumption and Stocks, data for fats and oils in methyl esters; Trade: USDA imports data for Harmonized Tariff Schedule code 3824.90.40.20 (Fatty Esters Animal/ Vegetable Mixture) and exports data for Schedule B code 3824.90.40.00 (Fatty Substances Animal/ Vegetable Mixture; and Ethanol: 2001-2004: EIA, Petroleum Supply Annual, Tables 2 and 16. Calculated as ten percent of oxygenated finished motor gasoline field production (Table 2) plus fuel ethanol refinery input (Table 16). 2005-2007: EIA Petroleum Supply Annual (Various Issues), Tables 1 and 15. Calculated as motor gasoline blending components adjustments (Table 1), plus finished motor gasoline adjustments (Table 1), plus fuel ethanol refinery and blender net inputs (Table 15). 2008: EIA Petroleum Supply Monthly (various reports), Tables 1 and 27. Calculated as motorgasoline blending components adjustments (Table 1), plus finished motor gasoline adjustments (Table 1), plus fuel ethanol refinery and blender net inputs (Table 27). Small amounts of ethanol consumption are distributed to the commercial and industrial sectors according to those sector`s shares of U.S. motor gasoline supplied. Electric Power: Energy Information Administration, Form EIA-906, "Power Plant Report," Form EIA-920, "Combined Heat and Power Plant Report," and Form EIA-923, "Power Plant Operations Report."

Skill Set Needed According to “The State of Green Skills: How Credentials Create Value in the Clean Energy Economy” by Center on Wisconsin Strategy (COWS) (2010) recognized the following credential in the geothermal industry: “Certified GeoExchange Designer.” A Certified GeoExchange Designer would have the following educational requirements: A four-year engineering degree and/or be a registered Professional Engineer (P.E.), and/or a Registered Architect (R.A.), with at least three years of combined experience in the commercial geothermal heat pump design and heating, ventilating, and air conditioning field; OR A four-year non-technical degree, with at least five years of combined experience in the commercial geothermal heat pump design and heating, ventilating, and air conditioning field; OR A two-year technical degree, with at least eight years of combined experience in the geothermal heat pump design and heating, ventilating, and air conditioning field; OR Ten years or more of verified combined experience in the commercial geothermal heat pump design and heating, ventilating, and air conditioning field. 49-9099.01 - Geothermal Technicians Perform technical activities at power plants or individual installations necessary for the generation of power from geothermal energy sources. Monitor and control operating activities at geothermal power generation facilities and perform maintenance and repairs as necessary. Install, test, and maintain residential and commercial geothermal heat pumps. Tasks
• Identify and correct malfunctions of geothermal plant equipment, electrical systems, instrumentation, or controls.
• Install, maintain, or repair ground or water source-coupled heat pumps to heat and cool residential or commercial building air or water.
• Monitor and adjust operations of geothermal power plant equipment or systems. • Adjust power production systems to meet load and distribution demands. • Backfill piping trenches to protect pipes from damage. • Calculate heat loss and heat gain factors for residential properties to determine heating
and cooling required by installed geothermal systems. • Design and lay out geothermal heat systems according to property characteristics, heating
and cooling requirements, piping and equipment requirements, applicable regulations, or other factors.
• Determine the type of geothermal loop system most suitable to a specific property and its heating and cooling needs.
• Dig trenches for system piping to appropriate depths and lay piping in trenches. • Prepare newly installed geothermal heat systems for operation by flushing, purging, or
other actions. Wages & Employment Trends (National) Median wages data collected from Installation, Maintenance, and Repair Workers, All Other. Employment data collected from Installation, Maintenance, and Repair Workers, All Other. Industry data collected from Installation, Maintenance, and Repair Workers, All Other. Median wages (2009) $17.08 hourly, $35,520 annual Employment (2008) 170,000 employees Projected growth (2008-2018) Average (7% to 13%) Projected job openings (2008-2018) 41,800
Top industries (2008) Self-Employed Construction
Source: http://online.onetcenter.org/link/summary/49-9099.01

Is this industry/career specific to a region/the state/Midwest? No State and National Wages
49-9099.01 - Geothermal Technicians 2008
10% 25% Median 75% 90%
United States Hourly $9.59 $12.34 $16.46 $22.59 $28.51
Yearly $19,900 $25,700 $34,200 $47,000 $59,300
Wisconsin Hourly $10.40 $13.08 $17.19 $22.39 $27.81
Yearly $21,600 $27,200 $35,800 $46,600 $57,800 State and National Trends
United States Employment Percent
Change Job Openings 12008 2018
Installation, maintenance, and repair workers, all other 169,900 185,500 +9% 4,180
Wisconsin Employment Percent
Change Job Openings 12006 2016
Installation, maintenance, and repair workers, all other 4,120 4,340 +6% 50 1Job Openings refers to the average annual job openings due to growth and net replacement. Note: The data for the State Employment Trends and the National Employment Trends are not directly comparable. The projections period for state data is 2006-2016, while the projections period for national data is 2008-2018. Source: http://www.careerinfonet.org/occ_rep.asp?optstatus=011000000&soccode=499099&id=1&nodeid=2&stfips=55&search=Go Geothermal grants for state total $2.85 million By Thomas Content of the Journal Sentinel, Nov. 17, 2009 Wisconsin projects or companies are slated to receive $2.85 million from the federal economic stimulus package to advance the use of geothermal energy. Geothermal energy projects, also known as ground-source heat pumps, take advantage of the warmth below the Earth's surface, where the temperature remains a constant temperature of about 50 degrees year-round. Heat is pumped from the ground and transferred to the air in a home or office during the winter months. Johnson Controls received funding for two different projects, including $311,324 for its geothermal heating and cooling system at its headquarters campus in Glendale, and another $1,047,714 to Johnson Controls for a project in Oregon, to be installed at the Oregon Institute of Technology Campus in Klamath Falls. The funding also includes $190,395 to the Energy Center of Wisconsin, based in Madison, for its research on hybrid geothermal heat pumps. Two other projects that won funding include Riverheath LLC of Appleton, which will receive $978,168 for a project that would demonstrate river-based heat exchange plates using flowing water to provide high heat transfer, and Skychaser Energy Inc., of Twin Lakes, which will receive $325,125 to demonstrate the viability of what the Energy Department described as “an innovative GHP business and financing model.” Nationwide, a total of $338 million was funded to 123 projects in 39 states, with the funding from American Recovery and Reinvestment Act to be matched with $353 million in private funding. “These grants will be helpful to accelerate the growth of the geothermal industry,” analysts at Robert W. Baird & Co. said in a research note. Source: http://www.jsonline.com/blogs/business/70287067.html

List of firms in Wisconsin Offering Geothermal Services Midwest Geothermal Training Center for IGSHPA, the International Ground Source Heat Pump Association. Accredited Installer and Driller Course Earth Energy Services Installers Designers & Trainers of Geothermal Systems Classes Nationwide/Group discounts
� Business type: Geothermal Heating & Cooling Certification for Residential & Commercial � Product types: Installers, Designers and Trainers of Geothermal Systems. � Service types: Design, Installation, Engineering, Project development services, Education and Training Certification, Site survey and assessment services, certification services � Address: W6744 Rogersville Rd, Fond du Lac, Wisconsin USA 54937 � Telephone: 1-920-246-5159 � FAX: 1-877-801-6495 � Web Site: http://www.earthenergyservices.com � E-mail: Send Email to Earth Energy Services LLC
Don - Martin Heating and Cooling Inc. � Business type: hvac � Product types: geothermal heating and cooling, forced air heating system installation and components, air conditioning system installation, air filtering and purification systems. � Service types: consulting, design, installation, contractor services � Address: 3500 N Newville Rd, Janesville, Wisconsin USA 53545 � Telephone: 608 758 9882 � FAX: 608 758 9842 � Web Site: www.don-martinhvac.com � E-mail: Send Email to Don - Martin Heating and Cooling Inc.
Cardinal Heating � Business type: design/build � Product types: solar thermal energy, radiant heating systems, geothermal energy systems, Solar pool heating systems, solar electric systems. � Service types: design/Install � Address: 222 Linnerud Dr. , Sun Prairie, Wisconsin USA 53590 � Telephone: 608 837-9367 � FAX: 608 837-6469
E & W Heating and Air Conditioning, Inc. � Business type: retail sales � Product types: hydronic radiant heating systems, geothermal energy systems, air cooling systems, air heating systems, heat pumps, solar water heating systems. � Address: 8845 S. Greenview Drive, Ste 3, Middleton, Wisconsin USA 53562 � Telephone: 608-233-3434
Earth Energy Systems Co � Business type: retail sales � Product types: geothermal energy systems, air heating systems, air cooling systems, heat pumps, solar water heating systems. � Service types: installation, maintenance and repair services � Address: 24024 State Road 35, Siren, Wisconsin USA 54872 � Telephone: 715-349-2314 � FAX: 715-349-7333
Geothermal North � Product types: geothermal energy systems. � Service types: installation � Address: 6215 Iron Lake Road, Iron River, Wisconsin USA 54847 � Telephone: 715-372-8056

Indoor Comfort Systems, Inc. � Product types: air filtering and purification system components, geothermal energy system components, air filtering and purification systems, air heating systems, air cooling systems, geothermal energy systems. � Service types: design, installation, contractor services � Address: PO Box 628, Lake Geneva, Wisconsin USA 53147 � Telephone: 262-348-9920
Major Systems, Inc. � Product types: geothermal energy systems, solar water heating systems, home automation, radiant heating systems, hydronic radiant heating systems, waste heat recovery systems, Energy Management/Building Automation Systems - Commercial & Industrial Controls. � Service types: contractor services � Address: 11820 W. Ripley Avenue, Wauwatosa, Wisconsin USA 53226 � Telephone: (414) 771-4400 � FAX: (414) 771-7373
Mitchell's Heating & Cooling Company � Business type: Full Service HVAC Contractor � Product types: Geothermal Heating & Air Conditioning Systems, Hydronic Infloor Heating Systems, Solar Space & Water Heating Systems, Tankless Water Heaters, Wood Burning Outdoor Pressurized Boilers. . � Service types: All Brands � Address: N2759 Hill Street, Waupaca, Wisconsin USA 54981 � Telephone: 715/256-1372 � FAX: 715/256-9199
RG Heating & Air Conditioning � Business type: retail sales � Product types: geothermal energy systems, solar water heating systems. � Service types: consulting, installation, contractor services � Address: 305 West St, Waunakee, Wisconsin USA 53597 � Telephone: 608-849-6728 � FAX: 608-849-5733
Source: http://energy.sourceguides.com/businesses/byGeo/US/byS/WI/byP/geotherm/geotherm.shtml Influencing Factors Destination of Shipments of Geothermal Heat Pumps Exports of Geothermal HeatPumps shipments totaled 69,483 tons in 2008. The export market accounted for more than 16 percent of total shipments and was dominated by sales to Canada, with almost 81 percent (56,212 tons) of total exports. In 2008, a total of 346,622 tons of domestic GHP shipments went to all 50 States, Puerto Rico and the District of Columbia (Table 4.6). About 51 percent of domestic GHP shipments (175,190 tons) went to ten States: Florida, Illinois, Indiana, Iowa, Michigan, Minnesota, Nebraska, New York, Ohio, and Pennsylvania, with approximately 14 percent (49,093 tons) of the total shipments sent to Illinois and Pennsylvania. Source: Energy Information Administration Geothermal Heat Pump Manufacturing Activities, 2008 Johnson Controls sees a need to add 1,000 energy engineers and more than 1,000 employees with accreditation in Leadership in Energy and Environmental Design, and more than 15,000 field service technicians. Source: June 10, 2010 Milwaukee Journal Sentinel

Sources: • Green Careers Guide. (http://www.greencareersguide.com/Geothermal-Installer.html). • Federal budget supports geothermal growth (http://www.geo-
energy.org/pressReleases/2010/2011_Federal_Budget.pdf). • U.S. Leads in Geothermal Energy
(http://www.renewableenergyworld.com/rea/partner/geothermal-energy-association-4102/news/article/2010/05/us-maintains-geothermal-power-lead-germany-fastest-growing-new-industry-report-concludes)
• Geothermal Jobs Report (http://www.docstoc.com/docs/44261977/geothermal-job-report) • Geothermal Job growth
(http://www.greenjobs.com/public/info/industry_background.aspx?id=11)

Green Jobs Scan and Outlook June 2010
Type: X Before Meter After Meter Industry: Water and Water-Related Industry Trends and Themes Summary: In its publication, The Vital Center: A Federal-State Compact to Renew the Great Lakes Region, the Brookings Institute has given focused attention to the challenges of the Great Lakes region as an area rich in resources and, at the same time, in a state of decline in production and subsequent standard of living. Citing Wisconsin’s labor brain drain among seven of ten other Great Lakes states (with the exception of Illinois and Minnesota), the state is challenged to identify its natural opportunities to create a new mix of its industrial sectors, which will offer subsequent labor opportunities. This, in turn, calls upon educators and planners to prepare the populace to meet the challenges of the day. Water-based and water-related industries are especially called upon to respond to the United Nations’ recognition and challenge that identified Milwaukee as a water technology hub - one of thirteen global sites with only San Francisco as the other U.S. designated water hub. Source: http://www.brookings.edu/reports/2006/10metropolitanpolicy_austin.aspx U.N. names Milwaukee a water technology hub By John Schmid of the Journal Sentinel , Posted: April 27, 2009 “The United Nations on Tuesday will designate Milwaukee as a U.N. Global Compact City, making it one of 13 such cities worldwide, in a move that will help the region promote its image abroad as an international hub of water technology. The 5-year-old U.N. program obligates member cities to showcase progress on issues that involve human rights, environmentalism, health or labor standards. Milwaukee's application centers on water quality, with a pledge to tackle a catalog of projects ranging from the development of sensors to monitor water safety to pilot technologies meant to strip radium from underground aquifers.” Source: http://www.jsonline.com/business/43835922.html Designation as a water hub is timely considering the University of Wisconsin’s plans to build a new School of Freshwater Sciences building on the Milwaukee shore of Lake Michigan. This effort is part of a larger regional movement toward recognizing and supporting one of Wisconsin’s greatest natural resources: UWM School of Freshwater Sciences awarded $525,000 grant By John Schmid of the Journal Sentinel , Posted: July 22, 2010 |(11) COMMENTS Great Lakes, Great Peril Special Section: This series will periodically examine challenges facing the Great Lakes in what experts forecast will be the century of water. A federal health agency focused on public water sources on Thursday awarded a half-million dollar grant to the newly created School of Freshwater Sciences at the University of Wisconsin-Milwaukee for graduate student research fellowships focused on the Great Lakes. The National Oceanic and Atmospheric Administration announced the $525,000 grant to support six doctoral students - five at UWM and one at UW-Madison. The funding comes from the agency's Oceans and Human Health Initiative, which exists "to improve understanding and management of the ocean, coasts and Great Lakes to enhance benefits to human health and reduce public health risks," according to its website. The same federally funded program operates five other similar research efforts across the nation, making UWM's the sixth such program and the only one focused on the Great Lakes. The programs investigate marine toxins, chemical pollutants, seafood quality, beach safety and health and pharmaceuticals and bio-agents from aquatic sources. Source: http://www.jsonline.com/business/99024649.html

Skill Sets Needed: The skill sets needed to meet water and water-related industry labor requirements are as vast as the different kinds of industries that support the use and management of water resources. Public waterworks and wastewater management, entertainment, boating, metering, filtering and other industries in kind all support water usage and management. To this, the Regional Workforce Alliance identified 130 companies in southeast Wisconsin as water or water-related firms; this does not include the rich water-related tourism and industrial sectors of water-related employment throughout the rest of the state, which is vast in inland water resources and needs in addition to the state’s status as a Great Lakes state. The Regional Workforce Alliance has developed some key information about the demand and types of industry that hire and develop staff in water and water-related duties and tasks. This information follows: Table 1 – Occupational Competencies indicates the occupational, cross-walked competencies required to fulfill the demands of the above designated occupations.

Table 1 Occupational Competencies Occupational Competencies
Plumbers, pipefitters, and steamfitters (SOC 47-2152)
Civil Engineers (SOC 17-2051)
Environmental Engineers (SOC 17-2061)
Environmental Scientists and specialists, including health (SOC 19-2041)
Civil Engineering Technicians (SOC 17-3022)
Control & Valve installers and repairers, except mechanical door (SOC 49-9012)
Pipelayers (SOC 47-2151)
Hydrologists (SOC 19-2043) Total X's
KnowledgeCustomer and Personal Service x x x x x x x x 8Mathematics x x x x x x x x 8English Language x x x x x x x x 8Engineering and Technology x x x x x x x 7Design x x x x x x x 7Public Safety and Security x x x x x x 6Building and Construction x x x x x 5Physics x x x x x 5Computers and Electronics x x x x 4Transportation x x x x 4Mechanical x x x 3Education and Training x x x 3Administration and Management x x x 3Chemistry x x x 3Biology x x 2Geography x x 2Law and Government x x 2
SkillsCritical Thinking x x x x x x x x 8Active Listening x x x x x x x 7Active Learning x x x x x x 6Reading Comprehension x x x x x x 6Speaking x x x x x 5Time Management x x x x x 5Judgment and Decision Making x x x x x 5Complex Problem Solving x x x x x 5Writing x x x x x 5Coordination x x x x 4Mathematics x x x x 4Monitoring x x x x 4Installation x x 2Management of Personnel Resources x x 2Quality Control Analysis x x 2Repairing x 1Equipment Selection x 1Equipment Maintenance x 1Learning Strategies x 1Instructing x 1Troubleshooting x 1Systems Analysis x 1Science x 1Operation Monitoring x 1Service Orientation x 1
Plumbers, pipefitters, and steamfitters (SOC 47-2152)
Civil Engineers (SOC 17-2051)
Environmental Engineers (SOC 17-2061)
Environmental Scientists and specialists, including health (SOC 19-2041)
Civil Engineering Technicians (SOC 17-3022)
Control & Valve installers and repairers, except mechanical door (SOC 49-9012)
Pipelayers (SOC 47-2151)
Hydrologists (SOC 19-2043) Total X's
AbilitiesOral Comprehension x x x x x x x x 8Oral Expression x x x x x x x x 8Near Vision x x x x x x x 7Problem Sensitivity x x x x x x x 7Information Ordering x x x x x x 6Deductive Reasoning x x x x x x 6Written Comprehension x x x x x x 6Inductive Reasoning x x x x x x 6Written Expression x x x x x 5Visualization x x x 3Control Precision x x x 3Category Flexibility x x x 3Extent Flexibility x x 2Mathematical Reasoning x x 2Arm-Hand Steadiness x x 2Multilimb Coordination x x 2Manual Dexterity x 1Finger Dexterity x 1Speech Clarity x 1Depth Perception x 1
This tab contains a tabulation of competency characteristics for 8 occupations that received P ratings AND for which the numbers of industry jobs was at least 25% of the total number of jobs by occupation.Yellow highlight indicates the top 5 characteristics of each category.
Wages & Employment Trends
Is this industry/career specific to a region/the state/Midwest? No, these occupations are prevalent throughout North America although to varying degrees, allowing for regional variations in industry mix. State and National Wages /State Trends The following positions have been identified in the M7 Region as paying the highest salaries among water and water-related occupations. Engineering managers and civil engineers are expected to increase in demand as are construction trade supervisors and managers as well as plumbers, pipefitters and steamfitters. It should be noted that three of the seven occupations are projected to decline in number from 2009-2019. Source: Regional Workforce Alliance (RWA) and EMSI, Inc. The original EMSI data was supplemented with columns to show the number of jobs just within the 5 high priority occupation clusters. This helps put the New/Replacement job numbers into perspective. For example, the number of General and Operations Manager jobs and new/replacement is quite high. This might indicate a priority occupation. However, in the context of the water industry those numbers may be considerably lower, indicating that the occupation is not high priority for the water industry. The number of industry jobs was taken from EMSI staffing pattern reports by industry. Table 2 – Employment & Wage Trends by Occupation
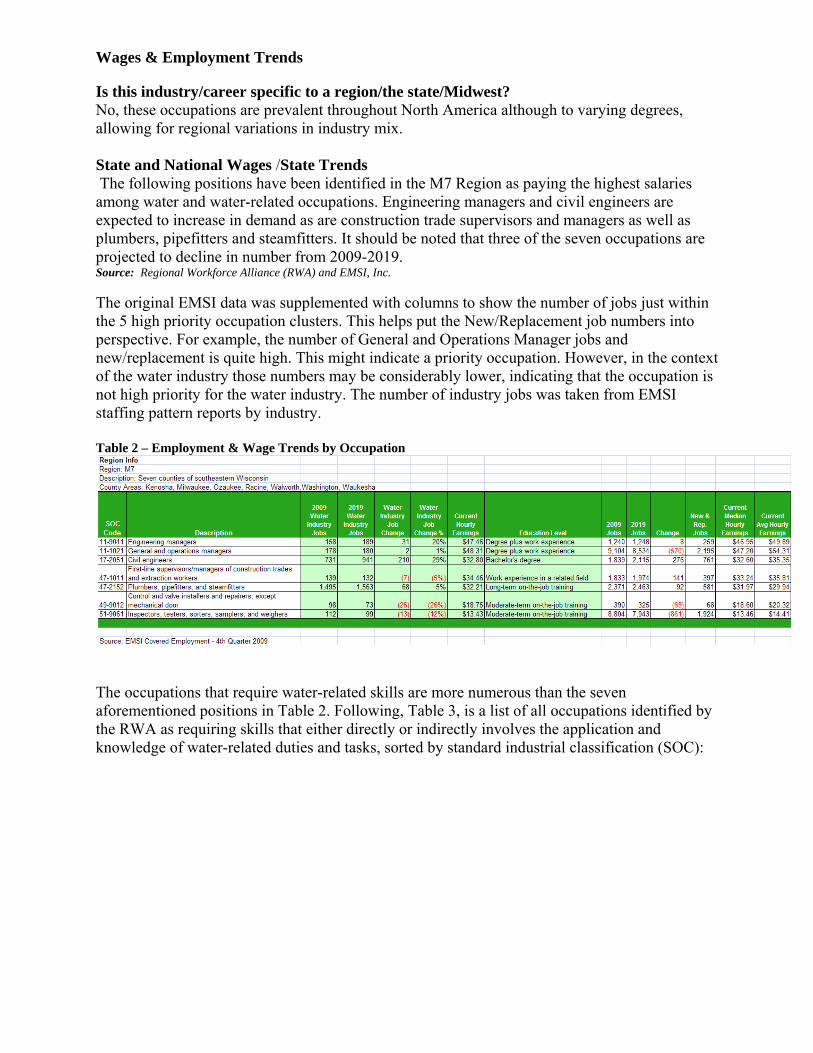
The occupations that require water-related skills are more numerous than the seven aforementioned positions in Table 2. Following, Table 3, is a list of all occupations identified by the RWA as requiring skills that either directly or indirectly involves the application and knowledge of water-related duties and tasks, sorted by standard industrial classification (SOC):
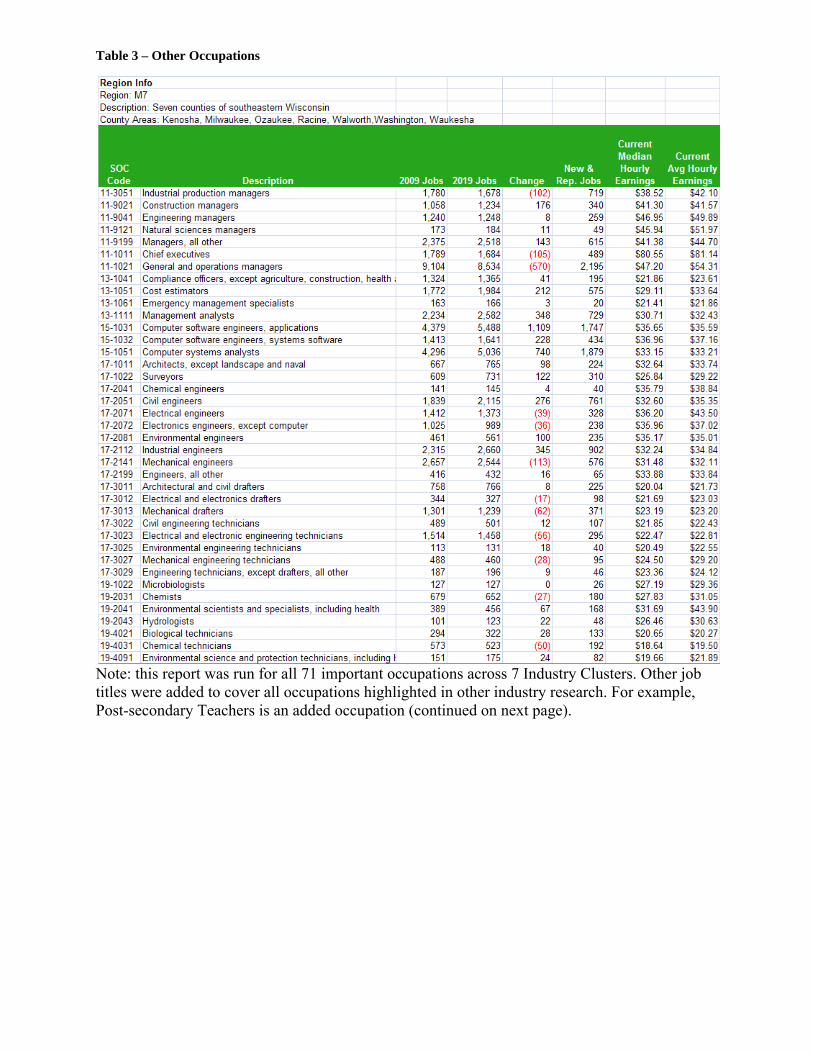
Table 3 – Other Occupations
Note: this report was run for all 71 important occupations across 7 Industry Clusters. Other job titles were added to cover all occupations highlighted in other industry research. For example, Post-secondary Teachers is an added occupation (continued on next page).
Of the occupations that are identified as water-related, the SOC occupations that are projected to grow are, generally:
• Business and Management Occupations (SOC 11) relevant to science and engineering firms;
• Network and Computer Systems Administrators (SOC 15); • Business and Financial Operations Occupations (SOC 13), notably cost estimators and
management analysts; • Life and Physical and Social Science Occupations (SOC 19), with the exception of
chemists and chemical technicians; • Construction and Extraction Occupations (SOC 47), notably first-line supervisors,
construction laborers, and electricians.

SOC occupational clusters that are shrinking in employment include:
• Architectural and engineering occupations (SOC 17) with exceptions for civil, environmental and industrial engineers;
• Design Occupations (SOC 27); • Sales Occupations (SOC 41); • Industrial and Machine Mechanics/Production Occupations (SOC 51) with the exception
of welders, cutters, solderers and brazers. Influencing Factors: Factors that will positively influence the future development of water and water-related industry in Wisconsin are in effect at all levels from international to local influences. The United Nations’ international endorsement of the region as a water hub, the Federal support of grant-funded initiatives, state-level support of conservation and energy-based funding and legislation, and regional responses to initiatives at all levels, such as the Public Policy Forum, will fuel the effort toward optimizing the water agenda. Key Sources
• O*NET Resource Center • Greening of the World of Work: Implications for O*NET-SOC and New and Emerging
Occupations • http://www.onetcenter.org/reports/Green.html • Wisconsin Department of Workforce Development • http://www.dwd.state.wi.us/ • Milwaukee Water Council • http://www.milwaukee7-watercouncil.com/wiki/show/Main

Calculating the productivity of
Kristin CorashAssociate Vice President
Strategic Planning and ResearchColorado Community College System
Elaine DeLott BakerPrincipal InvestigatorColorado Lumina Initiative for Performance
February 2009This report is supported through funding by:
The Ford Foundation Bridges to Opportunity Projectand Lumina Foundation for Education
innovation:Using a Simplified Cost-Benefit Analysis to Promote Effective Practice

AcknowledgementsThe authors would like to thank the Lumi-na Foundation for Education, which awarded a grant to the Colorado Commu-nity College System to study the costs and effectiveness of strategies to serve aca-demically underprepared students; and the Ford Foundation’s Bridges to Oppor-tunity Project, which provided further support for the development and dissemi-nation of the Simplified Cost-Benefit Anal-ysis model.
Individuals who contributed to this effort include our foundation program officers, John Colborn, Cyrus Driver, David Courn-oyer, Holly Zanville and Heather Wathington, who provided the flexibility and support critical to innovation. Davis Jenkins helped us think through the feasibility of the model
and its application to the broader commu-nity college audience. Rob Johnstone, Mark Superka, Andrew Stevens and Chandler Bar-rett provided a college finance and policy perspective. Pam Burdman helped us clarify the message. Most importantly, this project would not have been possible without the dedication of the practitioners and program coordinators at Community College of Den-ver and Front Range Community College who ran the programs, collected the data, and helped us understand the challenges and benefits of incorporating the model into the strategic planning process We would like to especially thank Institutional Advancement at the Community College of Denver, specifically Gretchen Occhionero, for the professional design of this document.
About the AuthorsKristin Corash is the Associate Vice President of Strategic Planning and Research for the Colorado Community College System. She has co-authored a number of research reports, including The Colorado Remedial Challenge and Success of Remedial Math Students in the Colorado Community College System: a Longitudinal Study. Prior to her work at the Colorado Community College System, Ms. Corash constructed business cases and fund-ing and analysis models, conducted research, and led strategic planning processes in state government and the non-profit sector.
Elaine DeLott Baker is the Principal Investigator for the Colorado Lumina Initiative for Performance and Director of Community College of Denver’s Breaking Through project. She is a national consultant and a frequent speaker on issues of accelerated developmental education, contextualized learning, and economic development and education. Ms Baker has published several policy reports and book chapters on topics related to the educational achievement of underserved populations.

Table of ContentsExecutive Summary ......................................................................................................................................................... 2-3
Introduction ................................................................................................................................................................................ 4
Methodology for the Simplified Cost Benefit Analysis ........................................................................... 5
Cost of Intervention .............................................................................................................................................................. 6
Exhibit 1: Cost Analysis
Benefit of Intervention ....................................................................................................................................................... 7
Exhibit 2: Data ........................................................................................................................................................ 7
Exhibit 3: Average Per Student Revenue ......................................................................................... 8
Cost-Benefit Analysis ........................................................................................................................................................... 9
Exhibit 4: Simplified Cost Benefit Analysis Summary ........................................................ 10
Exhibit 5: Simplified Cost Benefit Analysis ................................................................................. 11
Discussion ..................................................................................................................................................................................12
The Need ..................................................................................................................................................................12
The Challenge .....................................................................................................................................................12
Continuous Program Improvement .................................................................................................13
Evaluation of Grant-Funded Programs ..........................................................................................13
Appendixes .......................................................................................................................................................................14-17

�
Executive Summary
In the current climate of budget-ary constraints and increased accountability, productivity is emerging as a major issue with-in higher education policy dis-cussions. In 2007, the National Conference of State Legislatures published its Blue Ribbon Com-mission: Improving Higher Edu-cation Performance and Pro-ductivity, which advocated that higher education be held to the same productivity standards as other areas of state government. More recently, the Lumina Foundation for Educa-tion’s “Making Opportunity Affordable” initiative focused its efforts on increasing productivity within two-year and four-year public colleges and universi-ties through intentional investments that maximize student, parent, and taxpayer dollars.
The call from public policy experts, foundations, and the general public is loud and clear: “Improve student outcomes, and at the same time, increase the cost-effectiveness of programs.” Implicit in this message is the mounting pressure for public higher education to utilize the same business and strate-gic planning models that “for-profit” entities use in their strategic planning process.
Though some analysts have recommended chang-es in state funding mechanisms to help prioritize certain outcomes, the reality is that colleges ur-gently need to be able to make good decisions under existing policies. The Simplified Cost-Benefit Analysis model presented in this report is designed to aid colleges in the evaluation of productivity. The methodology is based on the assumption that ad-ditional resources are required to increase student success, that community colleges are under-fund-ed, and that the funding that colleges receive is based on enrollments rather than outcomes.
In the enrollment-driven ap-proach to fiscal stability, pro-gram improvement is seen as a cost rather than an investment in student success. The simpli-fied cost-benefit analysis dem-onstrates how investment in in-novation can result in increased revenue, over time, through in-creased retention. The model gives faculty and administration a way to evaluate the productiv-ity of innovations by determin-ing whether — and when — the
upfront costs of implementing effective strategies will be recouped with the revenue generated from increased retention.
The example used in this study is based on data from the Community College of Denver’s English as a Second Language (ESL) Learning Community pilot, funded through a grant from the Lumina Foundation for Education to the Colorado Com-munity College System Foundation. In this exam-ple, costs are calculated on the basis of additional costs per student. Revenue is determined on the basis of student success, by calculating increased retention and credit hours over time. Costs are ex-amined in two contexts — the costs to run the pi-lot intervention program and the costs to operate the intervention at scale. Costs and revenues are then analyzed in terms of time to break-even and long-term fiscal benefit to the college.
Data from the ESL Learning Community example show that even within the short-term, the financial benefit to the institution is greater than the addi-tional cost of the intervention. Break-even is reached within only a few terms, establishing the case for bringing the intervention to scale and sustaining it over time. The ESL Learning Community example demonstrates how a simplified cost benefit tool can
�
Although some analysts have
recommended changes in
state funding mechanisms
to help prioritize certain
outcomes, the reality is that
colleges urgently need to be
able to make good decisions
under existing policies.

�
provide administrators with the information needed to make timely, data-driven decisions related to sustaining or institutionalizing programmatic innovations.
Several logistical and institutional constraints work against the widespread incorporation of the model into the strategic planning process. These include the capacity of Institutional Research departments to track data, the lack of communication between program-matic and fiscal divisions, and the historical patterns of strategic planning, which favor the status quo. De-spite these constraints, the authors view the model as a valuable tool that can aid colleges in their shift from short-term cost considerations to a more strategic analysis of productivity. In addition, we see the model as having immediate application in two areas critical to the evolution of effective practice and to student success — continuous program improvement and the evaluation of grant-funded innovation.
Examples of the Simplified Cost-Benefit Analysis and a template that allows practitioners to enter and analyze their data are available online at the following sites: http://www.cccs.edu/Research/costeffect.html or http://www.communitycollegecentral.org.

� �
Introduction
In the current climate of budgetary pressures and increased focus on outcomes, community college leaders face difficult choices around the allocation of resources. At the same time that administrators are being asked to work within decreased budgets, they are also being held accountable for improved student outcomes, with an emphasis on degree and certificate completion for all student populations, and specifically, underserved populations. In short, community colleges are expected to increase productivity, by improving student achievement using existing resources.
The traditional measure of institutional success re-lies on continued enrollment growth. To address the challenges inherent in moving from an enroll-ment-based accountability to an outcome-based accountability, colleges must adapt the strategic planning process in ways that will link effective practice, student outcomes, and the actual costs of implementing successful strategies. By linking the cost of inputs to revenue from increased retention, the focus shifts from short-term revenue streams based on enrollment to long-term productivity based on student success.
Longitudinal data plays an important role in help-ing colleges understand the relative success of different student populations and programs. However, in the new paradigm of productivity, strategic planning requires a detailed understand-ing of both costs and outcomes. The Simplified Cost-Benefit Analysis provides colleges with a methodology to evaluate the cost effectiveness of investments in specific programs and strate-gies. Through the collection of a limited amount of data, this tool provides program administra-
�
tors and college leadership with the information needed to answer the question of whether the costs of implementing a specific intervention can be recouped within a reasonable amount of time to warrant the continuation and/or expansion of the program/strategy.
To successfully compete in the college business cycle, where business decisions are made on an annual or term basis, programs require a model that will yield an early proof of cost effectiveness. The Simplified Cost Benefit Analysis provides college leadership with the information needed to make timely, data-driven decisions related to approving, sustaining, or institutionalizing programmatic innovations.
By engaging faculty and program staff in a trans-parent process that links continued program in-vestment with student outcomes the Simplified Cost-Benefit Analysis enhances the relationships between the programmatic and business sides of the college, furthers authentic communication, and allows staff to work collaboratively toward the shared goal of improving outcomes for students.

� �
METHODOLOGY FOR THE SiMpLiFiED COST-BEnEFiT AnALYSiS
The methodology for calculating the Simplified Cost Ben-efit Analysis was developed with funding from the Ford Foundation — Bridges to Opportunity project and is part of the outcome analysis of the Colorado Lumina Initia-tive for Performance. The goal of the methodology is to identify the point at which a specific strategy or program reaches breakeven, or the point at which revenue equals or exceeds additional costs.
The example presented here was based on the rev-enues and costs of the ESL Learning Community strat-egy piloted at Community College of Denver through a Lumina Foundation for Education grant awarded to the Colorado Community College System Founda-tion. The intervention consisted of a learning commu-nity that combined ESL classes in reading, writing and speaking. Other inputs were case management/ad-vising, costs for additional instruction and curriculum development, and program coordination.
In this example, outcomes for students in the interven-tion were compared to outcomes of ESL students who did not participate in the intervention. A preliminary analysis of these outcomes indicated that students in the intervention demonstrated higher GPAs, rates of course completion, and retention.
In the normal course of new program design and imple-mentation, it is program staff members who track out-comes. A common mistake made by program staff is thinking that by providing data that shows improved outcomes, they have made a compelling case for the institutionalization of their programs. If the question of productivity rested solely on improved outcomes, then evidence of improved outcomes would be the major driver of decision making. However, an analysis of pro-ductivity calculates both program effectiveness and cost effectiveness, by looking at the relationship be-tween costs and outcomes. This is where the Simplified Cost Benefit Analysis enters the process, by including the first part of the productivity question — improved outcomes — and answering the second part of the pro-ductivity question, “Is the intervention cost effective?” or, “Can the startup costs be recouped within a reason-able period of time?”
�

� �
Cost of intervention
The first task of the cost analysis is to give program admin-istrators detailed information on the additional per student costs of their intervention. In calculating costs for this study, only those costs above the costs already being incurred to serve traditional ESL students were included. These catago-ries of costs are generally accessible to program administra-tors as part of their budget oversight. There was no attempt in this study to calculate the total cost of educating an ESL student or an attempt to evaluate any impact on fixed costs at the institution when the intervention is brought to scale. (This type of analysis requires full knowledge of the institu-tion and would need to be done by experts in the finance
office.) To arrive at the cost of the intervention, we looked at total additional costs of the intervention, the average per student cost, and projections of what additional costs would be incurred if the intervention went to scale.
The average per student cost is calculated by dividing the additional input costs for the program by the number of students in the program. Scale differs based on the indi-vidual intervention. This intervention scale is 60 students, based on CCD’s ESL enrollment patterns6. The Cost Analysis is supplied in Exhibit 1.
Exhibit 1
5 This is the incremental cost of providing the intervention that is above and beyond the cost already incurred for the comparison group.
6 Scale is determined based on the number of students enrolled in ESL. At capacity there are three ESL learning communities with 20 students in each. (20 students is the class capacity for an effective ESL classroom.)
7 The cost for the intervention is a one-time cost. The intervention lasts only one term.
Cost Description Average Per Student Cost
Pilot Study To Scale6
45 60
Project Management $12,000 Pilot: 0.5 FTE project director to implement $267 $0 $0 To Scale: no additional cost — coordination assumed by ESL Chair
Student Ambassadors $975 Pilot: 1 @ $975 per semester $22 $16 $975 To Scale: 1 @ $975 per semester
Instruction/Curriculum Development $3,600 Pilot: 6 instructors @ $600 stipend/semester $80 $85 $5,100 To Scale: 6 instructors @ $600/semester plus $1,500 curriculum development Educational Case Manager $8,800 Pilot: 0.4 FTE per semester = $8,800 $196 $147 $8,800 To Scale: 0.4 FTE per semester = $8,800
Average per Student Cost7 $564 $248
Total Cost For Intervention5 $25,375 $14,875
�
� �
Benefit of intervention
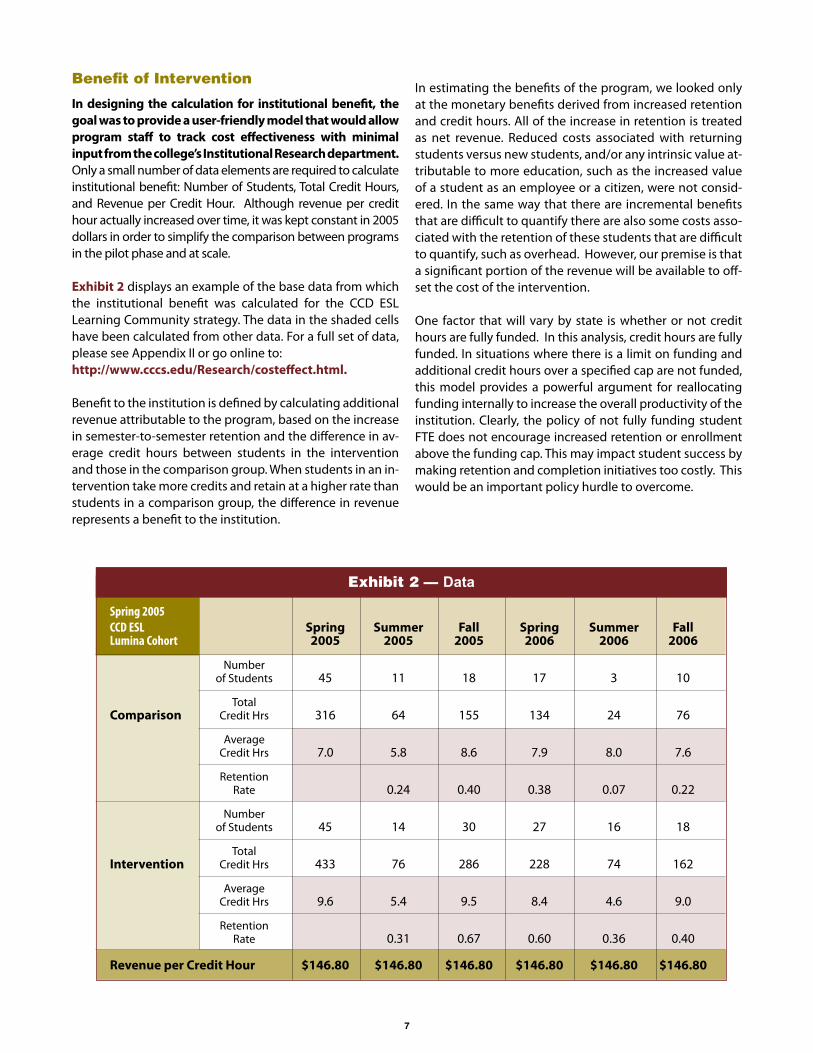
In designing the calculation for institutional benefit, the goal was to provide a user-friendly model that would allow program staff to track cost effectiveness with minimal input from the college’s Institutional Research department. Only a small number of data elements are required to calculate institutional benefit: Number of Students, Total Credit Hours, and Revenue per Credit Hour. Although revenue per credit hour actually increased over time, it was kept constant in 2005 dollars in order to simplify the comparison between programs in the pilot phase and at scale.
Exhibit 2 displays an example of the base data from which the institutional benefit was calculated for the CCD ESL Learning Community strategy. The data in the shaded cells have been calculated from other data. For a full set of data, please see Appendix II or go online to: http://www.cccs.edu/Research/costeffect.html.
Benefit to the institution is defined by calculating additional revenue attributable to the program, based on the increase in semester-to-semester retention and the difference in av-erage credit hours between students in the intervention and those in the comparison group. When students in an in-tervention take more credits and retain at a higher rate than students in a comparison group, the difference in revenue represents a benefit to the institution.
Spring 2005 CCD ESL Spring Summer Fall Spring Summer FallLumina Cohort 2005 2005 2005 2006 2006 2006 Number of Students 45 11 18 17 3 10 Total Comparison Credit Hrs 316 64 155 134 24 76 Average Credit Hrs 7.0 5.8 8.6 7.9 8.0 7.6 Retention Rate 0.24 0.40 0.38 0.07 0.22 Number of Students 45 14 30 27 16 18 TotalIntervention Credit Hrs 433 76 286 228 74 162
Average Credit Hrs 9.6 5.4 9.5 8.4 4.6 9.0 Retention Rate 0.31 0.67 0.60 0.36 0.40
Revenue per Credit Hour $146.80 $146.80 $146.80 $146.80 $146.80 $146.80
In estimating the benefits of the program, we looked only at the monetary benefits derived from increased retention and credit hours. All of the increase in retention is treated as net revenue. Reduced costs associated with returning students versus new students, and/or any intrinsic value at-tributable to more education, such as the increased value of a student as an employee or a citizen, were not consid-ered. In the same way that there are incremental benefits that are difficult to quantify there are also some costs asso-ciated with the retention of these students that are difficult to quantify, such as overhead. However, our premise is that a significant portion of the revenue will be available to off-set the cost of the intervention.
One factor that will vary by state is whether or not credit hours are fully funded. In this analysis, credit hours are fully funded. In situations where there is a limit on funding and additional credit hours over a specified cap are not funded, this model provides a powerful argument for reallocating funding internally to increase the overall productivity of the institution. Clearly, the policy of not fully funding student FTE does not encourage increased retention or enrollment above the funding cap. This may impact student success by making retention and completion initiatives too costly. This would be an important policy hurdle to overcome.
Exhibit 2 — Data

� �
Exhibit 3 demonstrates what can occur when intervention programs produce higher rates of student retention and credit-taking behaviors. In fall 2005, the ESL intervention group enjoyed a 26.7 percent higher retention rate as well as higher average credit hours per student (9.5 v. 8.6) than the comparison group. The result of increased retention and higher average credit hours produced a benefit to the insti-tution of $472.48 per student:
• Additional Average Per Student Retention Revenue is calculated by multiplying Average Per Student Revenue by the rate of increase in retention to the next term ($1,264.11 x 26.7% = $337.10).
• Additional revenue based on credit hours is calculated by subtracting the average per student revenue earned in the comparison group from the average per student revenue earned in the intervention group for that term ($1,399.49-$1,264.11 = $135.38).
Together these two sources of additional revenue equal $472.48 per student for fall 2005. Although not every se-mester shows the same pattern, the overall increased reten-tion and credit-taking behaviors of the two groups over ten terms resulted in a cumulative average per student revenue of $2,198, an amount that would not have been realized without the intervention. The full term by term benefit cal-culation is provided in Appendix I and is available online at: http://www.cccs.edu/Research/costeffect.html.
Exhibit 3Average per Student Revenue
Term 3 Fall 2005 Intervention continues to be followed
Average Revenue Average Credit Per Credit Per Student Retention
Average Revenue per Student Hours Hour Revenue Rate
Comparison 8.6 $146.80 $1,264.11 40.0%
Intervention 9.5 $146.80 $1,399.49 66.7%
Difference in Retention Rate 26.7%
Difference in Revenue based on Credit Hours1 $135.38
Additional Average Per Student Retention Revenue2 $337.10
Total Additional Average Per Student Revenue3 $472.48
1 Students in the treatment cohort take more credit hours on average than those in the comparison group.2 Students in the treatment cohort retain to the next semester at a rate that is generally higher than
the comparison group and the revenue from that increased retention is accounted for here. (Comparison Average Per Student Revenue multiplied by the Difference in Retention Rate)
3 The sum of the difference in revenue based on credit hours and the additional average per student retention revenue.

� �
Cost-Benefit Analysis
Exhibit 4 provides the results of the cost-benefit analysis as applied to the ESL Learning Community intervention. As judged by this analysis, the program represents a positive investment and reaches a break-even point (costs = ben-efits) in the third term. By the third term, due to increased credit-taking and retention of students in the intervention, a cumulative $854 of average per student revenue is gen-erated, resulting in a cumulative average per student net revenue greater than zero ($854 - $564 = $290). When the intervention is brought to scale, using the average per stu-dent costs at scale and the same benefits derived from the increased retention and credit-taking behavior observed in the pilot, the intervention pays for itself within one term.
Only a few terms are necessary to recoup costs (the break-even point at which costs are equal to benefits). On the other hand, institutional benefit continues to increase over time resulting in an incentive to the college to continue and/or ex-pand the program. In the example of the ESL Learning Com-munity intervention pilot, over the course of ten terms the resulting average per-student net benefit was $1,634. The ad-ditional average per student cost for the intervention is $564 for the pilot program. The average per student revenue pro-duced by the intervention over the first ten terms is $2,198, and exceeds the costs by $1,634 per student.

10 11
Exhibit 4Simplified Cost Benefit Analysis Summary*
Pilot Scale
Average Per Student Cost -$564 -$248
Additional Average Per Student Revenue $382 $382
Term 1 Cumulative Average Per Student Revenue $382 $382
Cumulative Average Per Student Net Revenue8 -$182 $134
Additional Average Per Student Revenue $0 $0
Term 2 Cumulative Average Per Student Revenue $381 $381
Cumulative Average Per Student Net Revenue8 -$182 $134
Additional Average Per Student Revenue $472 $472
Term 3 Cumulative Average Per Student Revenue $854 $854
Cumulative Average Per Student Net Revenue8 $290 $606
Additional Average Per Student Revenue $340 $340
Term 4 Cumulative Average Per Student Revenue $1,194 $1,194
Cumulative Average Per Student Net Revenue8 $630 $946
Additional Average Per Student Revenue -$156 -$156
Term 5 Cumulative Average Per Student Revenue $1,037 $1,037
Cumulative Average Per Student Net Revenue8 $473 $789
Additional Average Per Student Revenue $404 $404
Term 6 Cumulative Average Per Student Revenue $1,441 $1,441
Cumulative Average Per Student Net Revenue8 $877 $1,193
Additional Average Per Student Revenue $236 $236
Term 7 Cumulative Average Per Student Revenue $1,677 $1,677
Cumulative Average Per Student Net Revenue8 $1,113 $1,429
Additional Average Per Student Revenue -$142 -$142
Term 8 Cumulative Average Per Student Revenue $1,536 $1,536
Cumulative Average Per Student Net Revenue8 $972 $1,288
Additional Average Per Student Revenue $418 $418
Term 9 Cumulative Average Per Student Revenue $1,953 $1,953
Cumulative Average Per Student Net Revenue8 $1,389 $1,705
Additional Average Per Student Revenue $245 $245
Term 10 Cumulative Average Per Student Revenue $2,198 $2,198
Cumulative Average Per Student Net Revenue8 $1,634 $1,950
Gold shaded cells signify the break-even point. At scale this intervention breaks even within the first term. The pilot breaks even during the third term.
8 The Cumulative Average Per Student Net Revenue is calculated by adding the negative Average Per Student Cost to the Cumulative Average Per Student Revenue.
* Numbers may not add due to rounding
10 11
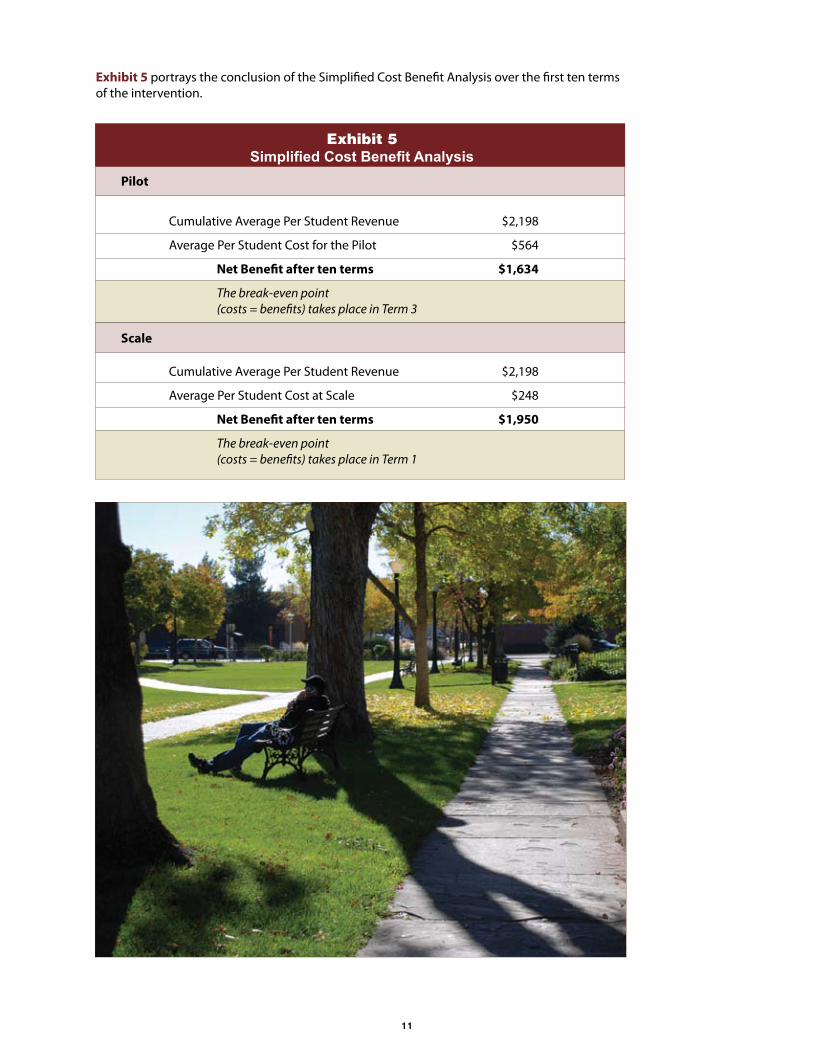
Exhibit 5 portrays the conclusion of the Simplified Cost Benefit Analysis over the first ten terms of the intervention.
Exhibit 5Simplified Cost Benefit Analysis
Pilot
Cumulative Average Per Student Revenue $2,198
Average Per Student Cost for the Pilot $564
Net Benefit after ten terms $1,634
The break-even point (costs = benefits) takes place in Term 3
Scale
Cumulative Average Per Student Revenue $2,198
Average Per Student Cost at Scale $248
Net Benefit after ten terms $1,950
The break-even point (costs = benefits) takes place in Term 1

1� 1�
Discussion
The Need: In the present environment of increased accountability and increased fiscal pressure, college leadership is faced with difficult decisions about where, and at what level to invest in program improvement.
Funding for program innovation often flows from founda-tions or public ventures concerned with the low success rate of disadvantaged populations. While “soft funds” bring great flexibility, the procedures necessary to evaluate the long-term fiscal viability of the innovations they support are seldom built into program design. Grant-funded programs are further marginalized from the strategic planning pro-cess by an organizational culture that views them as tran-sitory. Researchers often refer disparagingly to these pro-grams as “boutique” programs, suggesting that their cost renders them unsustainable. Even when a program shows a measurable impact, the practitioners and administrators who most clearly understand the potential value of the in-novation may lack the tools necessary to make the fiscal case for institutionalization.
The Challenge: In a perfect world, a user-friendly model that predicts “break even” and projects revenue would be welcomed into the strategic planning process.
There are several constraints that work against the adoption of this model, including the limited institutional research ca-pacity of community colleges, whose mission has tradition-ally excluded “research”. Productivity is coming into sharper focus as part of the national debate on increased access, but strategic business decisions are still more likely to focus on potential enrollment rather than productiv-ity, with limited input from the instructional side of the college.
The strategic planning process is the organi-zational structure en-trusted with long term planning, but it often functions to legitimize the status quo or to support the preroga-tives of key stakehold-ers rather than to eval-uate the relative merits of competing college priorities. Numerous subjective factors feed into the decision mak-ing process, such as the passion and interests of the president and vice presidents, the influence of the business community and/or other major constituencies, internal departmental politics and historical alliances.
Discussions of productivity are likely to surface during periods of declining enrollment or fiscal crises, but these discussions are unlikely to find their way into the strategic planning pro-cess without either a strong commitment from senior leader-ship or a clear directive from the foundations and/or external sources that fund innovation. Despite these constraints, we see two situations where a cost-effectiveness model can pro-vide immediate value — continuous program improvement and grant-funded program evaluation.
Numerous subjective factors
feed into the decision
making process, such as
the passion and interests
of the president and vice
presidents, the influence of
the business community
and/or other major
constituencies, internal
departmental politics and
historical alliances.

1� 1�
Continuous Program Improvement:The ability to analyze costs and outcomes can be an im-portant tool in the shift from a focus on enrollment to a fo-cus on student success, as well as a valuable resource in the continuous improve-ment process. Practitioners often feel a disconnect between their personal understanding of program effectiveness and the busi-ness decisions that control the fate of these programs. Working with the data can lessen this disconnect, deepen practitioners’ un-derstanding of cost effec-tiveness, and strengthen their ability to engage with the strategic planning pro-cess in a meaningful way. By helping practitioners and program staff bridge the gap between the types of data collected by institutional research and staff’s own understanding of program effec-tiveness the model gives practitioners the tools to adapt their programs and to communicate the importance and value of their programs in the language of business.
Evaluation of Grant-Funded Programs:In the case of foundation and other grant-funded efforts, the model provides valuable information on the relative productivity of different strategies, which in turn, can help funders make informed decisions about the course of future investments. The information gained from an analysis of productivity can also serve a variety of stakeholders whose agendas include cost effectiveness, student success and policy development. Foundations may provide the initial funding for innovation, but ultimately it is the college that must provide the proof of concept that will make the case for the broad-based institutionalization and replication of effective practice.
Practitioners often
feel a disconnect
between their personal
understanding of
program effectiveness
and the business
decisions that control
the fate of these
programs.
1� 1�
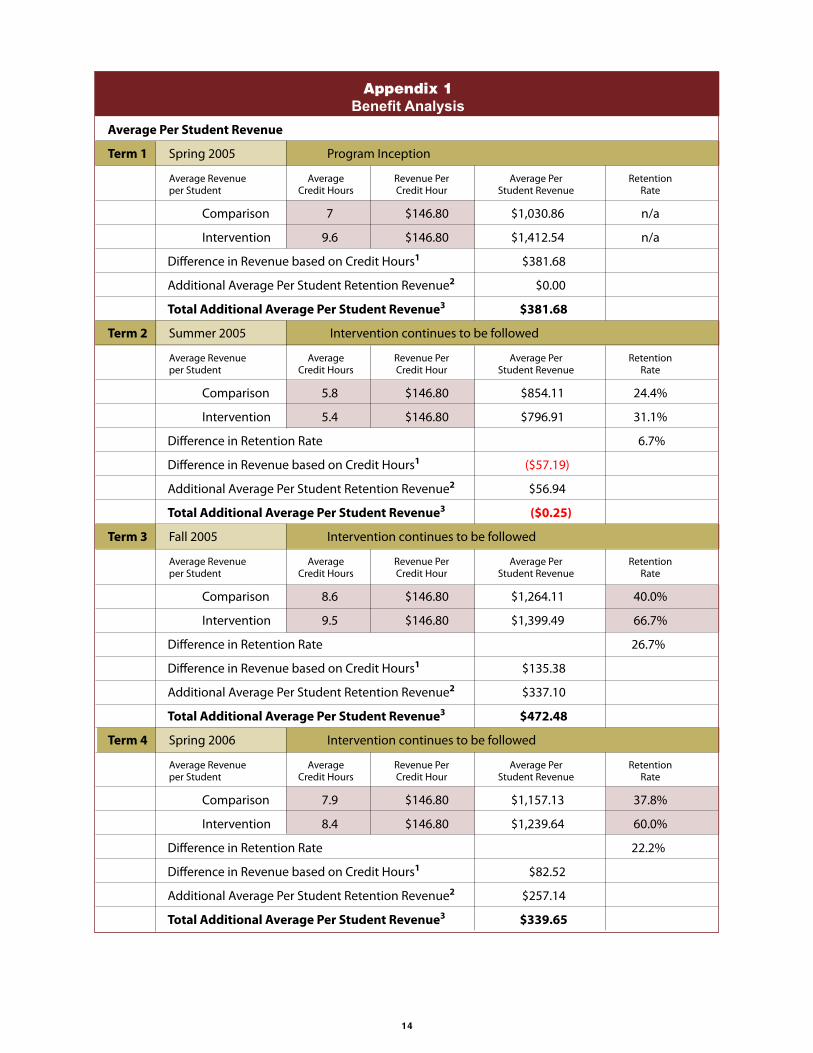
Appendix 1Benefit Analysis
Average Per Student Revenue
Term 1 Spring 2005 Program Inception
Average Revenue Average Revenue Per Average Per Retention per Student Credit Hours Credit Hour Student Revenue Rate
Comparison 7 $146.80 $1,030.86 n/a
Intervention 9.6 $146.80 $1,412.54 n/a
Difference in Revenue based on Credit Hours1 $381.68
Additional Average Per Student Retention Revenue2 $0.00
Total Additional Average Per Student Revenue3 $381.68
Term 2 Summer 2005 Intervention continues to be followed
Average Revenue Average Revenue Per Average Per Retention per Student Credit Hours Credit Hour Student Revenue Rate
Comparison 5.8 $146.80 $854.11 24.4%
Intervention 5.4 $146.80 $796.91 31.1%
Difference in Retention Rate 6.7%
Difference in Revenue based on Credit Hours1 ($57.19)
Additional Average Per Student Retention Revenue2 $56.94
Total Additional Average Per Student Revenue3 ($0.25)
Term 3 Fall 2005 Intervention continues to be followed
Average Revenue Average Revenue Per Average Per Retention per Student Credit Hours Credit Hour Student Revenue Rate
Comparison 8.6 $146.80 $1,264.11 40.0%
Intervention 9.5 $146.80 $1,399.49 66.7%
Difference in Retention Rate 26.7%
Difference in Revenue based on Credit Hours1 $135.38
Additional Average Per Student Retention Revenue2 $337.10
Total Additional Average Per Student Revenue3 $472.48
Term 4 Spring 2006 Intervention continues to be followed
Average Revenue Average Revenue Per Average Per Retention per Student Credit Hours Credit Hour Student Revenue Rate
Comparison 7.9 $146.80 $1,157.13 37.8%
Intervention 8.4 $146.80 $1,239.64 60.0%
Difference in Retention Rate 22.2%
Difference in Revenue based on Credit Hours1 $82.52
Additional Average Per Student Retention Revenue2 $257.14
Total Additional Average Per Student Revenue3 $339.65

1� 1�
Appendix 1 cont.Benefit Analysis
Average Per Student Revenue
Term 5 Summer 2006 Intervention continues to be followed
Average Revenue Average Revenue Per Average Per Retention per Student Credit Hours Credit Hour Student Revenue Rate
Comparison 8 $146.80 $1,174.40 6.7%
Intervention 4.6 $146.80 $678.95 35.6%
Difference in Retention Rate 28.9%
Difference in Revenue based on Credit Hours1 ($495.45)
Additional Average Per Student Retention Revenue2 $339.27
Total Additional Average Per Student Revenue3 ($156.18)
Term 6 Fall 2006 Intervention continues to be followed
Average Revenue Average Revenue Per Average Per Retention per Student Credit Hours Credit Hour Student Revenue Rate
Comparison 7.6 $146.80 $1,115.68 22.2%
Intervention 9 $146.80 $1,321.20 40.0%
Difference in Retention Rate 17.8%
Difference in Revenue based on Credit Hours1 $205.52
Additional Average Per Student Retention Revenue2 $198.34
Total Additional Average Per Student Revenue3 $403.86
Term 7 Spring 2007 Intervention continues to be followed
Average Revenue Average Revenue Per Average Per Retention per Student Credit Hours Credit Hour Student Revenue Rate
Comparison 9.18 $146.80 $1,347.89 24.4%
Intervention 9.16 $146.80 $1,344.38 42.2%
Difference in Retention Rate 17.8%
Difference in Revenue based on Credit Hours1 ($3.51)
Additional Average Per Student Retention Revenue2 $239.63
Total Additional Average Per Student Revenue3 $236.11
Term 8 Summer 2007 Intervention continues to be followed
Average Revenue Average Revenue Per Average Per Retention per Student Credit Hours Credit Hour Student Revenue Rate
Comparison 5.4 $146.80 $796.91 15.6%
Intervention 4.2 $146.80 $619.82 20.0%
Difference in Retention Rate 4.4%
Difference in Revenue based on Credit Hours1 ($177.09)
Additional Average Per Student Retention Revenue2 $35.42
Total Additional Average Per Student Revenue3 ($141.67)

1� 1�
Appendix 1 cont.Benefit Analysis
Average Per Student Revenue
Term 9 Fall 2007 Intervention continues to be followed
Average Revenue Average Revenue Per Average Per Retention per Student Credit Hours Credit Hour Student Revenue Rate
Comparison 7.3 $146.80 $1,071.64 22.2%
Intervention 9.3 $146.80 $1,370.13 33.3%
Difference in Retention Rate 11.1%
Difference in Revenue based on Credit Hours1 $298.49
Additional Average Per Student Retention Revenue2 $119.07
Total Additional Average Per Student Revenue3 $417.56
Term 10 Spring 2008 Intervention continues to be followed
Average Revenue Average Revenue Per Average Per Retention per Student Credit Hours Credit Hour Student Revenue Rate
Comparison 8.6 $146.80 $1,266.15 17.8%
Intervention 9.1 $146.80 $1,342.17 31.1%
Difference in Retention Rate 13.3%
Difference in Revenue based on Credit Hours1 $76.02
Additional Average Per Student Retention Revenue2 $168.82
Total Additional Average Per Student Revenue3 $244.84
Additional Average Per Student Revenue Through Ten Terms4 $2,198.09
1 Students in the treatment cohort take more credit hours on average than those in the comparison group.2 Students in the treatment cohort retain to the next semester at a rate that is generally higher than the comparison group and the
revenue from that increased retention is accounted for here. (Comparison Average Per Student Revenue multiplied by the Difference in Retention Rate)
3 The sum of the difference in revenue based on credit hours and the additional average per student retention revenue.4 The Additional Average Per Student Revenue through ten terms is the sum of the Total Additional Average Per Student Revenue in
each term.

1� 1�
Spring Summer Fall Spring Summer Fall Spring Summer Fall Spring 2005 2005 2005 2006 2006 2006 2007 2007 2007 2008
45 11 18 17 3 10 11 7 10 8
316 64 155 134 24 76 101 38 73 69
7.0 5.8 8.6 7.9 8.0 7.6 9.2 5.4 7.3 8.6
0.24 0.40 0.38 0.07 0.22 0.24 0.16 0.22 0.18
45 14 30 27 16 18 19 9 15 14
433 76 286 228 74 162 174 38 140 128
9.6 5.4 9.5 8.4 4.6 9.0 9.2 4.2 9.3 9.1
0.31 0.67 0.60 0.36 0.40 0.42 0.20 0.33 0.31
$146.80 $146.80 $146.80 $146.80 $146.80 $146.80 $146.80 $146.80 $146.80 $146.80
Spring 2005CCD ESLLuminaCohort
Comparison
Intervention
Appendix 2
Number of Students
TotalCredit Hours
Average Credit Hours
Retention Rate
Number of Students
TotalCredit Hours
Average Credit Hours
Retention Rate
Revenue per Credit Hour1
1 Costs and revenue have been kept constant in 2005 dollars for longitudinal comparison purposes.

1�
n Blue Ribbon Commission: Improving Higher Education Performance
and Productivity, NCSL Education ISBN # 978-1-58024-486-2 Denver, CO, 2007 n Making Opportunity Affordable is a multi-year initiative of the Lumina Foundation for Education. www.makingopportunityaffordable.org n English as a Second Language Learning
Communities www.communitycollegecentral.org
References
ATD/DEIBenchmarksofStudentSuccess
1
BenchmarkDescriptionsFirstYearStudentPerformance
Benchmark DescriptionPersistedfalltospring Thenumber(percent)oftheoriginalcohortwhowherestillenrolledin
thespringimmediatelyfollowingthefallstartingdate.Passed80%ormoreofattemptedhours
Thenumber(percent)oftheoriginalcohortwhopassedatleast80%ofthehoursinwhichtheywereofficiallyenrolledduringthefirstyear.Thepassedcoursesareforanyenrolledhournomatterthelevel.Thereisnominimumtocoursespassed.
Earned24ormorehours Thenumber(percent)oftheoriginalcohortwhopassedatleast24hoursduringthetrackingperiod.Thesehoursmaybeeitherindevelopmentaleducationorcollegelevelwork.
Earnedacertificatepriorto24hours
Thenumber(percent)oftheoriginalcohortwhopassedacertificatebeforeearning24hoursduringthetrackingperiod.
Transferredpriorto24hours
Thenumber(percent)oftheoriginalcohortwhotransferredbeforeearning24hoursduringthetrackingperiod.
SecondandThirdYearStudentPerformanceBenchmark DescriptionPersistedfalltofall Thenumber(percent)oftheoriginalcohortwhowherestillenrolledin
thefalloftheyearimmediatelyfollowingthefallstartingdate.Thislooksatonlythetwofallsandnotinterveningterms.
Passeddevelopmentalmathsequencebyyear2
Thenumber(percent)oftheoriginalcohortwhosuccessfullycompletedallrequireddevelopmentalmathematicscoursesbytheendofthesecondyearoftracking.Thismeanstheysuccessfullypassedthehighest‐levelcourserequired.
PassedgatekeeperEnglishorhigherbyyear3
Thenumber(percent)oftheoriginalcohortwhosuccessfullypassedthegatekeeperEnglishorahigher‐levelEnglishcoursebytheendofthethirdyearoftracking.Successisbaseduponanyenrollmentinthecourseanddoesnothavetobetheinitialenrollment.
Passedgatekeepermathorhigherbyyear3
Thenumber(percent)oftheoriginalcohortwhosuccessfullypassedthegatekeepermathematicsorahigher‐levelmathematicscoursebytheendofthethirdyearoftracking.Successisbaseduponanyenrollmentinthecourseanddoesnothavetobetheinitialenrollment.
Achievedthetwo‐yearhourmilestone
Thenumber(percent)oftheoriginalcohortwhosuccessfulpassedthehourmilestonesduringthetrackingperiod.Thesehoursmaybeeitherindevelopmentaleducationorcollegelevelworkandthenumberdependsupontheenrollmentstatusofthestudentsduringtheirfirstfalltermonly,nottheircurrentstatus.Thetwo‐yearhourmilestoneis24hoursforpart‐timestudentsand42hoursforfull‐timestudents.
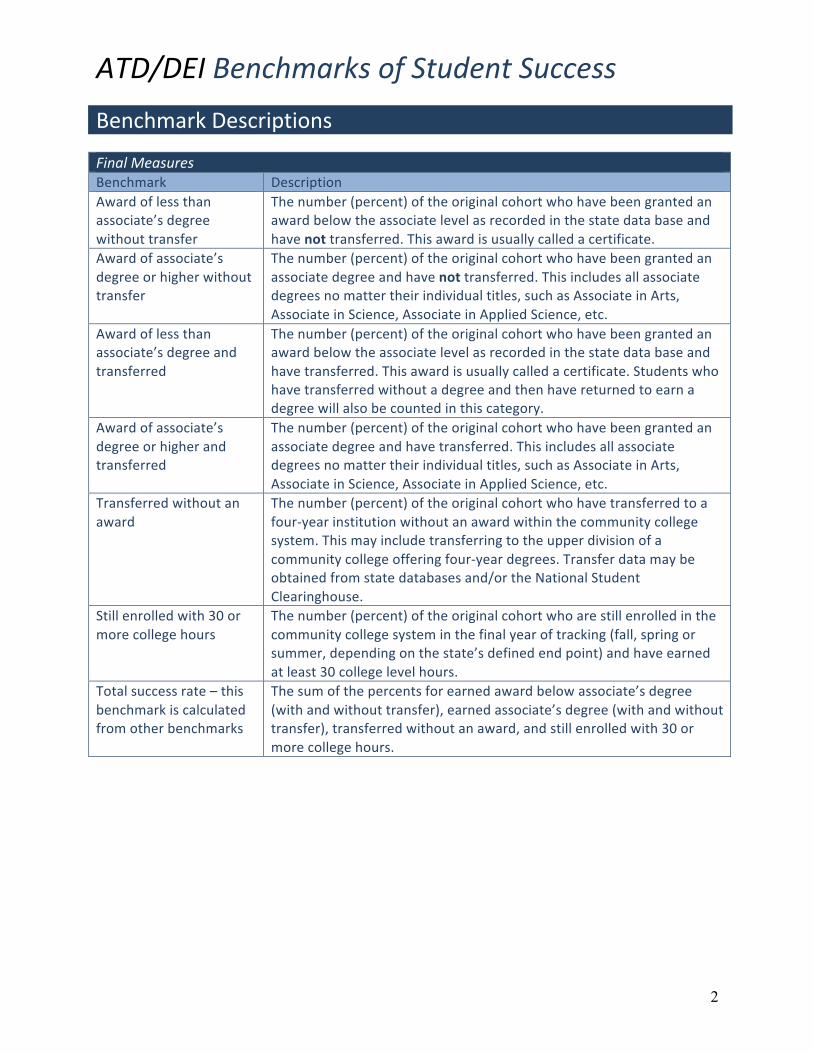
ATD/DEIBenchmarksofStudentSuccess
2
BenchmarkDescriptions FinalMeasuresBenchmark DescriptionAwardoflessthanassociate’sdegreewithouttransfer
Thenumber(percent)oftheoriginalcohortwhohavebeengrantedanawardbelowtheassociatelevelasrecordedinthestatedatabaseandhavenottransferred.Thisawardisusuallycalledacertificate.
Awardofassociate’sdegreeorhigherwithouttransfer
Thenumber(percent)oftheoriginalcohortwhohavebeengrantedanassociatedegreeandhavenottransferred.Thisincludesallassociatedegreesnomattertheirindividualtitles,suchasAssociateinArts,AssociateinScience,AssociateinAppliedScience,etc.
Awardoflessthanassociate’sdegreeandtransferred
Thenumber(percent)oftheoriginalcohortwhohavebeengrantedanawardbelowtheassociatelevelasrecordedinthestatedatabaseandhavetransferred.Thisawardisusuallycalledacertificate.Studentswhohavetransferredwithoutadegreeandthenhavereturnedtoearnadegreewillalsobecountedinthiscategory.
Awardofassociate’sdegreeorhigherandtransferred
Thenumber(percent)oftheoriginalcohortwhohavebeengrantedanassociatedegreeandhavetransferred.Thisincludesallassociatedegreesnomattertheirindividualtitles,suchasAssociateinArts,AssociateinScience,AssociateinAppliedScience,etc.
Transferredwithoutanaward
Thenumber(percent)oftheoriginalcohortwhohavetransferredtoafour‐yearinstitutionwithoutanawardwithinthecommunitycollegesystem.Thismayincludetransferringtotheupperdivisionofacommunitycollegeofferingfour‐yeardegrees.Transferdatamaybeobtainedfromstatedatabasesand/ortheNationalStudentClearinghouse.
Stillenrolledwith30ormorecollegehours
Thenumber(percent)oftheoriginalcohortwhoarestillenrolledinthecommunitycollegesysteminthefinalyearoftracking(fall,springorsummer,dependingonthestate’sdefinedendpoint)andhaveearnedatleast30collegelevelhours.
Totalsuccessrate–thisbenchmarkiscalculatedfromotherbenchmarks
Thesumofthepercentsforearnedawardbelowassociate’sdegree(withandwithouttransfer),earnedassociate’sdegree(withandwithouttransfer),transferredwithoutanaward,andstillenrolledwith30ormorecollegehours.

ATD/DEIBenchmarksofStudentSuccess
3
BenchmarkDataElementDefinitionsCoreDataDataElement DefinitionOriginalcohort Allbeginningfallaward‐seekingstudents.Thisincludesstudentswho
areseekingshort‐termcertificates,longer‐termcertificatesandassociate’sdegreesbothfullandpart‐time.ThisistheIPEDSFallcohortwiththeadditionofthepart‐timestudents.Thisgroupwillformthedenominatorforthedifferentpercentagecalculations.Inafewcases,selectedsubgroupsofstudentswillbesubtractedfromthisdenominatorpriortocalculatingthepercents.Seetemplatenotesforthespecificinstances
AwardSeeking Eitherthestudentortheinstitutionhasindicatedthatthestudentisseekinganassociatedegreeoracertificate(associatedegreeandcertificatedefinedbythestate).
Full‐time/Part‐timeStatus
Thedefinitionoffull‐timeisthecriteriausedbyIPEDS.Studentsenrolledinatleastfour‐fifthsofafullcourseloadtheirfirstterm—usually12creditsoutofapossible15credits—areconsideredfull‐time.Allotherstudentsareconsideredpart‐time.Thisinitialenrollmentstatusisusedtoclassifythestudentandisnotchangednomatterwhetherornotthestudent’senrollmentstatuschangesatsomepoint.
TraditionalAge Thestudent’sagewhentheyfirstentered,i.e.,thebeginningfallterm.Thiscanbetheagereportedbytheinstitutionorthedifferencebetweentheenteringyearandthestudent’sbirthyear.Ifthestudentwas22oryoungertheyareclassifiedastraditionalage.Thisclassificationdoesnotchangeduringthetrackingperiod.
Older Thestudent’sagewhentheyfirstentered,i.e.,thebeginningfallterm.Iftheywereover22,theyareclassifiedasOlder.Thisclassificationdoesnotchangeduringthetrackingperiod.
CollegeReady Thestudentisallowedtoenrollincollegelevelcoursesinallareasbeginningwiththeirenteringterm.Theywerenotrequiredtotakeremedialcourseworkbasedupontheirplacementscores.Statesthatdonotcollectplacementscoresshoulduseonlytheallstudentslineontheform.Instateswithoutuniformstandardsfor“college‐ready”,thisclassificationdoesnotchangeduringthetrackingperiod.
DevelopmentalEducation
Studentswhoneededtotakedevelopmentaleducationasindicatedbytheirplacementscoresforthosestatesthatcollectthatinformation.Statesthatdonotcollectthisinformationshouldnotattempttobreakoutthesestudentsandshouldusetheallstudentslineontheform.
Spring ForthePersistedfalltospringbenchmark,springisthetermfollowingthebeginningfallterm
Fall ForthePersistedfalltofallbenchmark,thesecondfallisthefalltermoftheyearfollowinginitialenrollment.

ATD/DEIBenchmarksofStudentSuccess
4
BenchmarkDataElementDefinitionsCoreDataDataElement DefinitionPersisted The student was listed in the enrollment records of the appropriate
springor fall term. Theydonothave to successfully pass any courses,merelyreturn.
Percent The number of students from the original cohort who successfullyachieved the benchmark under consideration divided by the totalnumberintheoriginalcohortorcorrectedcohortifappropriate.
Earnedxhourswithinyyears
The subsetof the cohort thathas successfullypassed xhourswithin yyears.Thenumberofhoursvariesbytheinitialenrollmentstatusofthestudents and by the time period involved. Except for the finalbenchmarkof“Stillenrolledwith30ormorecollegehours”, thehoursare a sum of both developmental and college level. The amount oftrackingtimealsovariesdependinguponthebenchmarkbeingused.
Passed TopassthestudentpassedthecoursewithaDorbetter.Inthecaseofgatekeepercourses,“passed”isdefinedbythestate.
Officiallyenrolled The student was listed as being enrolled in a given course on thedatabaseusedforthisproject.
Gatekeeperorhighercourse
The gatekeeper course is usually the first college level course that isrequired for an associate degree. It is often a part of the generaleducation requirements. Higher courses are those that are takenfollowingsuccessful completionof thegatekeeper.Thismaybedue toenrolling and completing the course or through an exemption such asAP. In measuring success rates for gatekeeper math, only collegetransferdegree‐seekingstudentswillbecounted.
Transfer The studentswas found in the enrollment file of the state’s four‐yearinstitutionsorwasfoundintheenrollmentfilesoffour‐yearinstitutionsthat report to the National Student Clearinghouse. If the state hascommunitycollegeswhoofferfour‐yeardegrees,theupperdivisionfilesof those institutions may also be examined and any students foundincluded. If a student is enrolled at two institutions at the same time,thestudentwillbecountedatthefirstinstitutiontheystartedin.
Trackingperiod The amount of time the cohort is followed. This time may vary fordifferentrunsandbeginswithafalltermandendswiththefinalterminareportingyear.Thismaybeeitherspringorsummerdependinguponthestateinvolved.Cohortswillnotbemeasuredpastyearsix.

ATD/DEIBenchmarksofStudentSuccess
5
BenchmarkDataElementDefinitions SupplementalDataDataElement DefinitionDevelopmentaleducationEnglishonly
ThosestudentswhoneededonlydevelopmentalEnglishorwriting,butnodevelopmentalmathematics.
Developmentalmathematicsbreakdown
Statesshouldclassifystudentswhotestintodevelopmentmathasupperlevel(i.e.moremoderatedevmathneed)orlowerlevel(i.e.,moresubstantialdevmathneed)byfirstcalculatingthemidpointofthescorerangeusedontheexam(s)toplacestudentsintodevmath,andthenclassifyingstudentswhoscoredabovethemidpointasupperleveldevmathandthosewhoscoredatorbelowthemidpointaslowerleveldevmath.Forexample,inFloridastudentswhoscorebetween20and71onthemathElementaryAlgebraAccuplacerexamareplacedintodevelopmentalmath.Tofurtherdividethesestudentsintoupper‐levelandlower‐leveldevmath,youwouldcalculatethemidpointscoreinthatrangeof20‐71,whichis45.5(71‐20=51.51/2=25.5.25.5+20=45.5)andclassifyallstudentswhoscoredabovethat(i.e.46‐71)asupper‐levelandthosewhoscoredbelowthat(i.e.20‐45)aslowerlevel.Statesshouldnotetheactualscorerangestheyusedforclassifyingstudentsaseitherupperorlowerinthefootnotereferenceincludedonthetemplate.Forstates,likeTexas,thatalreadyhaveamethodforclassifyingstudentsasupperorlowerdevmath(i.e.scorebelowonestandarddeviation),theyshouldusetheirexistingmethodandagainfootnotethescorerangesused.Forstudentswhoarenotrequiredtotakedevelopmentalmath(i.e.technicalprograms),amathequivalentshouldbemeasuredforthesestudents.
Lowincome–Pellreceived
ThosestudentswhowereawardedaPellgrant.Thisisnotallofthestudentswhowereeligible,butratherthosewhoactuallyreceivedtheaward.Statescanalsouseotherapplicablemeasuresthatmaybestandardwithintheirdefinitionof“low‐income”.
Nonlow‐income AllstudentsintheoriginalcohortwhodidnotreceiveaPellgrant.Race/ethnicity Therace/ethnicityreportedbytheinstitutionforthestudent. Thiswill
transitiontothesamequestionsusedbythecensusoverthenext fewyears.
Gender Thegenderreportedbytheinstitutionforthestudent.