Fall 2007 INSTITUTIONAL REPORT - University of Kentucky · Fall 2007 CLA Institutional Report 1...
19
Fall 2007 INSTITUTIONAL REPORT collegiatelearning assessment University of Kentucky
Transcript of Fall 2007 INSTITUTIONAL REPORT - University of Kentucky · Fall 2007 CLA Institutional Report 1...
Fall 2007 CLA Institutional Report 1
Fall 2007INSTITUTIONAL
REPORT
collegiatelearning assessment
University of Kentucky


Fall 2007 CLA Institutional Report 1
Contents
This interim Institutional Report presents Collegiate Learning Assessment (CLA) results for colleges and universities that tested entering students / freshmen in fall 2007. These students are hereinafter referred to simply as freshmen. Four sections follow this contents page:
I Institutional Executive Summary (page 2)
Summary results for your school
II Background (pages 3-5)
Description of CLA tests, scores and participating institutions and students
III Institutional Tables and Figures (pages 6-8)
Comprehensive and technical version of results at your school and all schools
IV Technical Appendix (pages 9-16)
Conversion tables, documentation of modeling procedures and score interpretation tables
A Standard ACT to SAT Conversion Table (page 9)
B Procedures for Converting Raw Scores to Scale Scores (page 10)
C Equations Used to Estimate CLA Scores on the Basis of Mean SAT Scores (page 11)
D Expected CLA Score for Any Given Mean SAT Score for Freshmen (page 12)
E CLA Scale and Deviation Scores by Decile Group (page 13)
F List of Participating Institutions (pages 14-15)
G CLA Student Data File (page 16)
Note to Readers
Sections I and III both present your institution’s CLA results. As such, there is some duplication of content. However, to reach multiple audiences, each section frames this content differently. Section I is non-technical and Section III is intended to provide comprehensive and technical information underpinning your results.
Section II is contextual and describes the CLA tests, scoring process and participants.
Section IV is designed to provide supplemental information for more technically-versed readers.
Fall 2007 CLA Institutional Report2
I. Institutional Executive Summary
For a number of reasons, we cannot measure performance by simply examining differences in average CLA scores across schools. The samples of freshmen tested at a school may not perfectly represent their respective classes at that college. For example, participating freshmen may have higher SAT scores than their classmates. In addition, colleges also differ in the entering abilities of their students. To address these concerns, an adjustment is needed.
To make this adjustment, we compare a school’s actual CLA score to its expected CLA score. Expected scores are derived from the typical relationship between a college’s average SAT score (or average ACT score converted to the SAT scale) and its average CLA score. We report differences between actual and expected scores in two ways: (1) “points” on the CLA scale and (2) standard errors. We use the latter to facilitate comparisons and define five performance levels as follows. Colleges with actual scores between -1.00 to +1.00 standard errors from their expected scores are categorized as being At Expected. Institutions with actual scores greater than one standard error (but less than two standard errors) from their expected scores are in the Above Expected or Below Expected categories (depending on the direction of the deviation). The schools with actual scores greater than two standard errors from their expected scores are in the Well Above Expected or Well Below Expected categories. Pages 6-7 provide more information.
Differences between expected and actual scores for freshmen could stem from several factors, such as differences in college admissions’ policies that result in students who perform at similar levels on standardized multiple choice tests (e.g., the SAT) but differently on constructed response tasks that require short answers and essays (e.g., the CLA).
This report addresses one primary question:
How did our freshmen score after taking into account their incoming academic abilities?
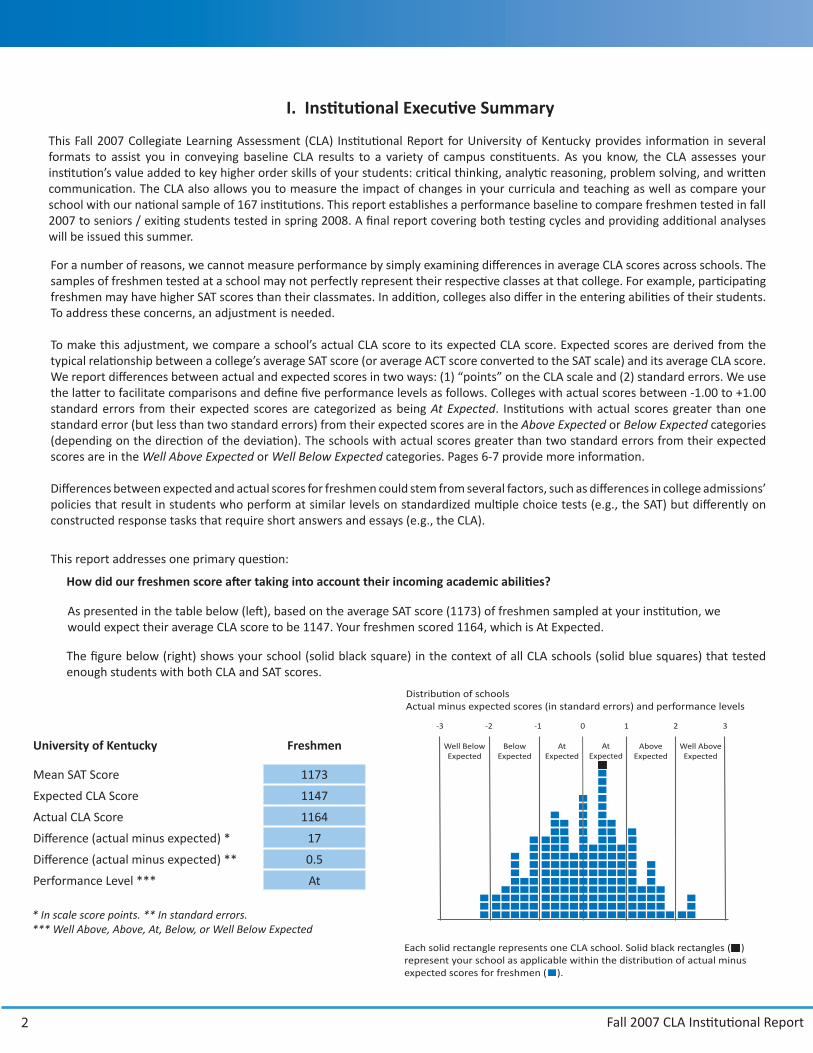
The figure below (right) shows your school (solid black square) in the context of all CLA schools (solid blue squares) that tested enough students with both CLA and SAT scores.
University of Kentucky Freshmen
Mean SAT Score 1173
Expected CLA Score 1147
Actual CLA Score 1164
Difference (actual minus expected) * 17
Difference (actual minus expected) ** 0.5
Performance Level *** At
* In scale score points. ** In standard errors. *** Well Above, Above, At, Below, or Well Below Expected
Each solid rectangle represents one CLA school. Solid black rectangles ( ) represent your school as applicable within the distribution of actual minus expected scores for freshmen ( ).
Distribution of schools Actual minus expected scores (in standard errors) and performance levels
0 1 2 3-1-2-3
AtExpected
AtExpected
BelowExpected
Well BelowExpected
AboveExpected
Well AboveExpected
This Fall 2007 Collegiate Learning Assessment (CLA) Institutional Report for University of Kentucky provides information in several formats to assist you in conveying baseline CLA results to a variety of campus constituents. As you know, the CLA assesses your institution’s value added to key higher order skills of your students: critical thinking, analytic reasoning, problem solving, and written communication. The CLA also allows you to measure the impact of changes in your curricula and teaching as well as compare your school with our national sample of 167 institutions. This report establishes a performance baseline to compare freshmen tested in fall 2007 to seniors / exiting students tested in spring 2008. A final report covering both testing cycles and providing additional analyses will be issued this summer.
As presented in the table below (left), based on the average SAT score (1173) of freshmen sampled at your institution, we would expect their average CLA score to be 1147. Your freshmen scored 1164, which is At Expected.

Fall 2007 CLA Institutional Report 3
II. Background
The CLA Tests and Scores
The CLA uses various types of tasks, all of which require students to construct written responses to open-ended questions. There are no multiple-choice questions.
Performance Task
Each Performance Task requires students to use an integrated set of critical thinking, analytic reasoning, problem solving, and written communication skills to answer several open-ended questions about a hypothetical but realistic situation. In addition to directions and questions, each Performance Task also has its own document library that includes a range of information sources, such as letters, memos, summaries of research reports, newspaper articles, maps, photographs, diagrams, tables, charts, and interview notes or transcripts. Students are instructed to use these materials in preparing their answers to the Performance Task’s questions within the allotted 90 minutes.
The first portion of each Performance Task contains general instructions and introductory material. The student is then presented with a split screen. On the right side of the screen is a list of the materials in the document library. The student selects a particular document to view by using a pull-down menu. On the left side of the screen are a question and a response box. There is no limit on how much a student can type. When a student completes a question, he or she then selects the next question in the queue. Some of these components are illustrated below:
Introductory Material: You advise Pat Williams, the president of DynaTech, a company that makes precision electronic instruments and navigational equipment. Sally Evans, a member of DynaTech’s sales force, recommended that DynaTech buy a small private plane (a SwiftAir 235) that she and other members of the sales force could use to visit customers. Pat was about to approve the purchase when there was an accident involving a SwiftAir 235. Your document library contains the following materi-als:
1. Newspaper article about the accident2. Federal Accident Report on in-flight breakups in single-engine planes3. Internal Correspondence (Pat's e-mail to you & Sally’s e-mail to Pat)4. Charts relating to SwiftAir’s performance characteristics5. Excerpt from magazine article comparing SwiftAir 235 to similar planes6. Pictures and descriptions of SwiftAir Models 180 and 235
Sample Questions: Do the available data tend to support or refute the claim that the type of wing on the SwiftAir 235 leads to more in-flight breakups? What is the basis for your conclusion? What other factors might have contrib-uted to the accident and should be taken into account? What is your preliminary recommendation about whether or not DynaTech should buy the plane and what is the basis for this recommendation?
No two Performance Tasks assess the same combination of abilities. Some ask students to identify and then compare and contrast the strengths and limitations of alternative hypotheses, points of view, courses of action, etc. To perform these and other tasks, students may have to weigh different types of evidence, evaluate the credibility of various documents, spot possible bias, and identify questionable or critical assumptions.
Performance Tasks also may ask students to suggest or select a course of action to resolve conflicting or competing strategies and then provide a rationale for that decision, including why it is likely to be better than one or more other approaches. For example, students may be asked to anticipate potential difficulties or hazards that are associated with different ways of dealing with a problem including the likely short- and long-term consequences and implications of these strategies. Students may then be asked to suggest and defend one or more of these approaches. Alternatively, students may be asked to review a collection of materials or a set of options, analyze and organize them on multiple dimensions, and then defend that organization.
Performance Tasks often require students to marshal evidence from different sources; distinguish rational from emotional arguments and fact from opinion; understand data in tables and figures; deal with inadequate, ambiguous, and/or conflicting information; spot deception and holes in the arguments made by others; recognize information that is and is not relevant to the task at hand; identify additional information that would help to resolve issues; and weigh, organize, and synthesize information from several sources.

Fall 2007 CLA Institutional Report4
All of the Performance Tasks require students to present their ideas clearly, including justifying their points of view. For example, they might note the specific ideas or sections in the document library that support their position and describe the flaws or shortcomings in the arguments’ underlying alternative approaches.
Analytic Writing Task
Students write answers to two types of essay prompts, namely: a “Make-an-Argument” question that asks them to support or reject a position on some issue; and a “Critique-an-Argument” question that asks them to evaluate the validity of an argument made by someone else. Both of these tasks measure a student’s ability to articulate complex ideas, examine claims and evidence, support ideas with relevant reasons and examples, sustain a coherent discussion, and use standard written English.
A “Make-an-Argument” prompt typically presents an opinion on some issue and asks students to address this issue from any perspective they wish, so long as they provide relevant reasons and examples to explain and support their views. Students have 45 minutes to complete this essay. For example, they might be asked to explain why they agree or disagree with the following:
There is no such thing as “truth” in the media.
The one true thing about the information media is that it exists only to entertain.
A “Critique-an-Argument” prompt asks students to critique an argument by discussing how well reasoned they find it to be (rather than simply agreeing or disagreeing with the position presented). For example, they might be asked to evaluate the following argument:
A well- respected professional journal with a readership that includes elementary school princi-pals recently published the results of a two- year study on childhood obesity. (Obese individuals are usually considered to be those who are 20 percent above their recommended weight for height and age.) This study sam-pled 50 schoolchildren, ages 5-11, from Smith Elementary School. A fast food restaurant opened near the school just before the study began. After two years, students who remained in the sample group were more likely to be overweight––relative to the national average. Based on this study, the principal of Jones Elementary School decided to confront her school’s obesity problem by opposing any fast food restaurant openings near her school.
Scores
To facilitate reporting results across schools, ACT scores were converted (using the ACT-SAT crosswalk in Appendix A) to the scale of measurement used to report SAT scores. At institutions where a majority of students did not have ACT or SAT scores (e.g., two-year institutions and open admission schools), we embedded the Scholastic Level Exam (SLE), a short-form cognitive ability measure, into the CLA testing. The SLE is produced by Wonderlic, Inc. SLE scores were converted to SAT scores using data from 1,148 students participating in spring 2006 that had both SAT and SLE scores. These converted scores (both ACT to SAT and SLE to SAT) are hereinafter referred to simply as SAT scores.
Students receive a single score on a CLA task because each task assesses an integrated set of critical thinking, analytic reasoning, problem solving, and written communication skills.
Both the Performance Tasks and Analytic Writing Tasks are scored by teams of professional graders trained and calibrated on the specific task type.
A student’s “raw” score on a CLA task is the total number of points assigned to it by the graders. However, a student can earn more raw score points on some tasks than on others. To adjust for these differences, the raw scores on each task were converted to “scale” scores using the procedures described in Appendix B. This step allows for combining scores across different versions of a given type of task as well as across tasks, such as for the purposes of computing total scores.

Fall 2007 CLA Institutional Report 5
Characteristics of Participating Institutions and Students
In the fall 2006 testing cycle, 167 institutions (“CLA schools”) tested enough freshmen to provide sufficiently reliable data for the school level analyses and results presented in this report. Table 1 groups CLA schools by Basic Carnegie Classification. The spread of schools corresponds fairly well with that of the 1,710 four-year institutions across the nation. Table 1 counts do not include two (2) four-year Special Focus Institutions, five (5) two-year Associates Colleges and one (1) international campus of an institution based in the United States.
Table 2 compares some important characteristics of colleges and universities across the nation with those of 159 four-year CLA schools and suggests that these CLA schools are fairly representative of institutions nationally.
With respect to entering ability levels, students participating in the CLA at a school appeared to be generally representative of their classmates, at least with respect to SAT scores. Specifically, across four-year CLA schools without open admission policies, the mean freshmen SAT score of the students who took the CLA tests (as verified by the school Registrar) was only thirteen (13) points higher than that of the entire freshmen class (as reported by the school Registrar): 1057 versus 1044. The correlation on the mean SAT score between freshmen who took the CLA and their classmates was high (r=0.91). These data suggest that as a group, the students tested in the CLA were similar to their classmates, which increases the confidence in inferences made from results of an institution’s CLA student sample to all its freshmen.
Table 1: Four-year institutions in the CLA and nation by Carnegie Classification
Nation CLA
Carnegie Classification Number Percentage Number Percentage
Doctorate-granting Universities 283 17% 31 19%
Master’s Colleges and Universities 690 40% 82 52%
Baccalaureate Colleges 737 43% 46 29%
1710 159
Source: Carnegie Foundation for the Advancement of Teaching, Carnegie Classifications
Data File, February 5, 2007.
Table 2: 4-year institutions in the CLA and nation by key school characteristics
School Characteristic Nation CLA
Percent public 36% 58%
Percent Historically Black College or University (HBCU) 6% 4%
Mean percentage of undergraduates receiving Pell grants 33% 32%
Mean four-year graduation rate 36% 33%
Mean six-year graduation rate 53% 52%
Mean first-year retention rate 74% 76%
Mean Barron’s selectivity rating 3.6 3.2
Mean estimated median SAT score 1068 1054
Mean number of FTE undergraduate students (rounded) 4430 7050
Mean student-related expenditures per FTE student (rounded) $12,710 $10,400
Source: College Results Online dataset, managed by and obtained with permission from the Education Trust, covers
most 4-year Title IV-eligible higher-education institutions in the United States. Data were constructed from IPEDS
and other sources. Because all schools did not report on every measure in the table, the averages and percentages
may be based on slightly different denominators.

Fall 2007 CLA Institutional Report6
III. Institutional Tables and Figures
Institutions participate in the CLA as either cross-sectional or longitudinal schools. Cross-sectional schools test samples of freshmen in the fall and seniors in the spring (of the same academic year). Longitudinal schools follow the same students as they progress at the college by testing them three times (as freshmen, rising juniors and seniors). Longitudinal schools in their first year follow the cross-sectional approach by testing a sample of seniors in the spring to gather comparative data.
Fall 2007 freshmen at longitudinal schools took both an Analytic Writing Task (i.e., Make-an-Argument and Critique-an-Argument) and a Performance Task. Fall 2007 freshmen at cross-sectional schools took either a Performance Task or an Analytic Writing Task. A cross-sectional school’s total scale score is the mean of its Performance Task and Analytic Writing Task scale scores. A longitudinal school’s total scale score is the mean total score for students who completed all CLA tasks. If fewer than 25 students at a longitudinal school took both tasks, then the total scale score was calculated in a similar manner as in the cross-sectional schools. Appendix A describes how ACT scores were converted to the same scale of measurement as used to report SAT scores. Appendix B describes how the reader-assigned “raw” scores on different tasks were converted to scale scores.
The analyses discussed in this section focus primarily on those schools where at least 25 students received a CLA score and also had an SAT score. This dual requirement was imposed to ensure that the results on a given measure were sufficiently reliable to be interpreted and that the analyses could adjust for differences among schools in the incoming abilities of the students participating in the CLA. Table 3 shows the number of freshmen at your school who completed a CLA measure in fall 2007 and also had an SAT score. The counts in this table were used to determine whether your school met the dual requirement. Counts for the Analytic Writing Task represent students who completed both the Make-an-Argument and Critique-an-Argument tasks.
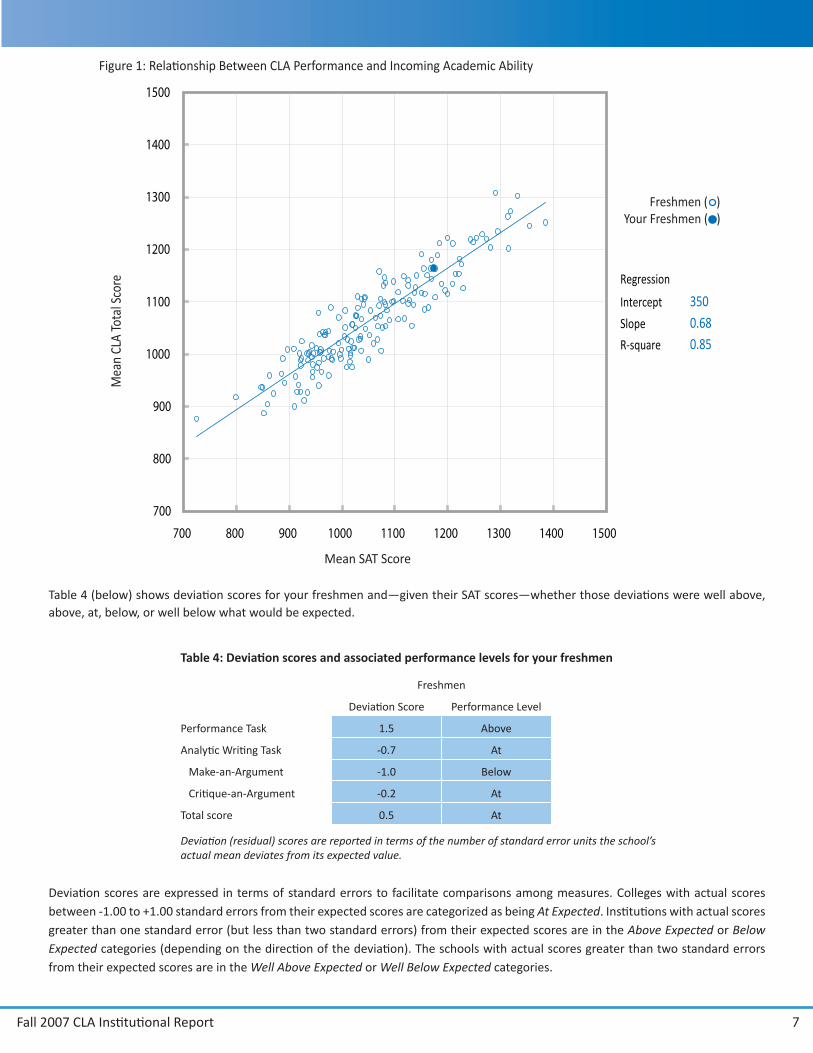
Figure 1 and Table 4 (next page) show whether your students did better, worse, or about the same as what would be expected given (1) their SAT scores and (2) the general relationship between CLA and SAT scores at other institutions. Specifically, Figure 1 shows the relationship between the mean SAT score of a college’s freshmen (on the horizontal x-axis) and their mean CLA total score (on the vertical y-axis). Each data point is a college that had at least 25 fall 2007 freshmen (blue circles) with both CLA and SAT scores.
The diagonal line running from lower left to upper right shows the typical relationship between an institution’s mean SAT score and its mean CLA score for freshmen. The solid blue circle corresponds to your school. Schools above the line scored higher than expected whereas those below the line did not do as well as expected. Small deviations from the line in either direction could be due to chance. Thus, you should only pay close attention to relatively “large” deviations as defined below. The difference between a school’s actual mean score and its expected mean score is called its “deviation” (or “residual”) score. Results are reported in terms of deviation scores because the freshmen who participated at a school were not necessarily a representative sample of all the freshmen at their school. For example, they may have been generally more or less proficient in the areas tested than the typical student at that college. Deviation scores adjust for such disparities.
Appendix C contains the equations that were used to estimate a school’s CLA score on the basis of its students’ mean SAT score. Appendix D contains the expected CLA score for a school’s freshmen for various mean SAT scores. Appendix E presents average scores across schools within 10 groups of roughly equal size. As such, it provides a general sense of where your school stands relative to the performance of all participating schools.
A school’s actual mean CLA score often deviated somewhat from its expected value (i.e., the actual value did not always fall right on the line). Differences between expected and actual scores for freshmen could stem from several factors, such as differences in college admissions’ policies that result in students who perform at similar levels on standardized multiple choice tests (e.g., the SAT) but differently on constructed response tasks that require short answers and essays (e.g., the CLA).
Table 3: Number of your freshmen with CLA and SAT scores
Number of Freshmen
Performance Task 307
Analytic Writing Task 303
Make-an-Argument 303
Critique-an-Argument 306
Total score 303
Fall 2007 CLA Institutional Report 7
Table 4 (below) shows deviation scores for your freshmen and—given their SAT scores—whether those deviations were well above, above, at, below, or well below what would be expected.
Deviation scores are expressed in terms of standard errors to facilitate comparisons among measures. Colleges with actual scores between -1.00 to +1.00 standard errors from their expected scores are categorized as being At Expected. Institutions with actual scores greater than one standard error (but less than two standard errors) from their expected scores are in the Above Expected or Below Expected categories (depending on the direction of the deviation). The schools with actual scores greater than two standard errors from their expected scores are in the Well Above Expected or Well Below Expected categories.
Freshmen ( )Your Freshmen ( )
Figure 1: Relationship Between CLA Performance and Incoming Academic Ability
Regression
Intercept 350Slope 0.68R-square 0.85
Mean SAT Score
Mea
n CL
A To
tal S
core
700
800
900
1000
1100
1200
1300
1400
1500
700 800 900 1000 1100 1200 1300 1400 1500
Table 4: Deviation scores and associated performance levels for your freshmen
Freshmen
Deviation Score Performance Level
Performance Task 1.5 Above
Analytic Writing Task -0.7 At
Make-an-Argument -1.0 Below
Critique-an-Argument -0.2 At
Total score 0.5 At
Deviation (residual) scores are reported in terms of the number of standard error units the school’s actual mean deviates from its expected value.

Fall 2007 CLA Institutional Report8
Table 5 below shows the mean scores for all schools where at least 25 students had both CLA and SAT scores, as well as your school if applicable. Values in the “Your School” column represent only those students with both CLA and SAT scores and were used to calculate deviation scores. An “N/A” indicates that there were not enough students at your school with both CLA and SAT scores to compute a reliable mean CLA score for your institution. Differences or similarities between the values in the “All Schools” and “Your School” columns of Table 5 are not directly interpretable because colleges varied in how their students were sampled to participate in the CLA. Consequently, you are encouraged to focus on the data in Table 4.
Tables 6-8 below provide greater detail on CLA performance, including the spread of scores at your school and all schools. These tables present summary statistics, including counts, means, 25th and 75th percentiles, and standard deviations. Units of analysis are students for Tables 6 and 7 and schools for Table 8. These CLA scale scores include students without SAT scores and thus may differ from those in Table 5, which only represents students with SAT scores.
Table 5: Mean scores for freshmen at all schools and your school
Freshmen
All Schools Your School
Performance Task 1050 1201
Analytic Writing Task 1071 1123
Make-an-Argument 1073 1109
Critique-an-Argument 1067 1136
Total score 1064 1164
SAT score 1051 1173
Table 6: Summary statistics for freshmen tested at your school
Number of Students
25th Percentile
Mean Scale Score
75th Percentile
Standard Deviation
Performance Task 308 1073 1200 1324 189
Analytic Writing Task 304 1041 1123 1202 138
Make-an-Argument 304 1005 1109 1205 161
Critique-an-Argument 307 1032 1136 1254 178
SAT score 307 1070 1171 1290 153
Table 7: Summary statistics for freshmen tested at all CLA schools
Number of Students
25th Percentile
Mean Scale Score
75th Percentile
Standard Deviation
Performance Task 12,253 915 1063 1184 194
Analytic Writing Task 10,761 968 1076 1171 150
Make-an-Argument 10,976 954 1074 1180 179
Critique-an-Argument 10,872 939 1074 1191 179
SAT score 19,440 930 1058 1180 180
Table 8: Summary statistics for schools that tested freshmen
Number of Schools
25th Percentile
Mean Scale Score
75th Percentile
Standard Deviation
Performance Task 166 977 1049 1121 98
Analytic Writing Task 162 1016 1070 1123 82
Make-an-Argument 164 1014 1072 1114 87
Critique-an-Argument 162 1008 1066 1121 84
Total score 174 1002 1064 1126 92
SAT score 173 958 1050 1134 123

Fall 2007 CLA Institutional Report 9
Appendix A
Standard ACT to SAT Conversion Table
To facilitate reporting results across schools, ACT scores were converted (using the standard table below) to the scale of measurement used to report SAT scores.
Sources:
“Concordance Between ACT Assessment and Recentered SAT I Sum Scores” by N.J. Dorans, C.F. Lyu, M. Pommerich, and W.M. Houston (1997), College and University, 73, 24-31; “Concordance between SAT I and ACT Scores for Individual Students” by D. Schneider and N.J. Dorans, Research Notes (RN-07), College Entrance Examination Board: 1999; “Correspondences between ACT and SAT I Scores” by N.J. Dorans, College Board Research Report 99-1, College Entrance Examination Board: 1999; ETS Research Report 99-2, Educational Testing Service: 1999.
ACT to SAT
36 1600
35 1580
34 1520
33 1470
32 1420
31 1380
30 1340
29 1300
28 1260
27 1220
26 1180
25 1140
24 1110
23 1070
22 1030
21 990
20 950
19 910
18 870
17 830
16 780
15 740
14 680
13 620
12 560
11 500
Fall 2007 CLA Institutional Report10
Appendix B
Procedures for Converting Raw Scores to Scale Scores
Each Performance and Analytic Writing task has a unique scoring rubric, and the maximum number of reader assigned raw score points differs across tasks. Consequently, a given reader-assigned raw score, such as 15 points, may be a relatively high score on one task but a low score on another task. To adjust for such differences, reader-assigned “raw” scores on the different tasks are converted to a common scale of measurement. This process results in “scale” scores that reflect comparable levels of proficiency across tasks. For example, a given CLA scale score indicates about the same percentile rank regardless of the task on which it was earned. This feature of the CLA scale scores allows combining scores from different tasks to compute a school’s mean scale score for each task type as well as a total scale score across types.
To convert the reader assigned raw scores to scale scores, the raw scores on a measure were transformed to a score distribution that had the same mean and standard deviation as the SAT scores of the freshmen who took that measure. This type of scaling maintains the relative standing of a student on a task relative to other students who took that task. For example, the student with the highest raw score on a task will also have the highest scale score on that task, the student with the next highest raw score will be assigned the next highest scale score, and so on.
This type of scaling generally results in the highest raw score earned on a task receiving a scale score of approximately the same value as the maximum SAT score of any freshman who took that task. Similarly, the lowest raw score earned on a task would be assigned a scale score value that is approximately the same as the lowest SAT score of any freshman who took that task. On very rare occasions, a student may achieve an exceptionally high or low raw score (i.e., well above or below the other students taking that task). When this occurs, it results in assigning a student a scale score that is outside of the normal SAT range. Prior to the spring of 2007, scores were capped at 1600 (the maximum allowable on the SAT). Capping was discontinued starting in fall 2007.
A final note. In the past, CAE revised its scaling equations each fall. However, many institutions would like to make year-to-year comparisons (i.e., as opposed to just fall to spring). To facilitate this activity, beginning in the fall of 2007, CAE will use the same scaling equations it developed for the fall 2006 administration. As a result of this policy, a given raw score on a task will receive the same scale score regardless of when the student took the task.
Fall 2007 CLA Institutional Report 11
Appendix C
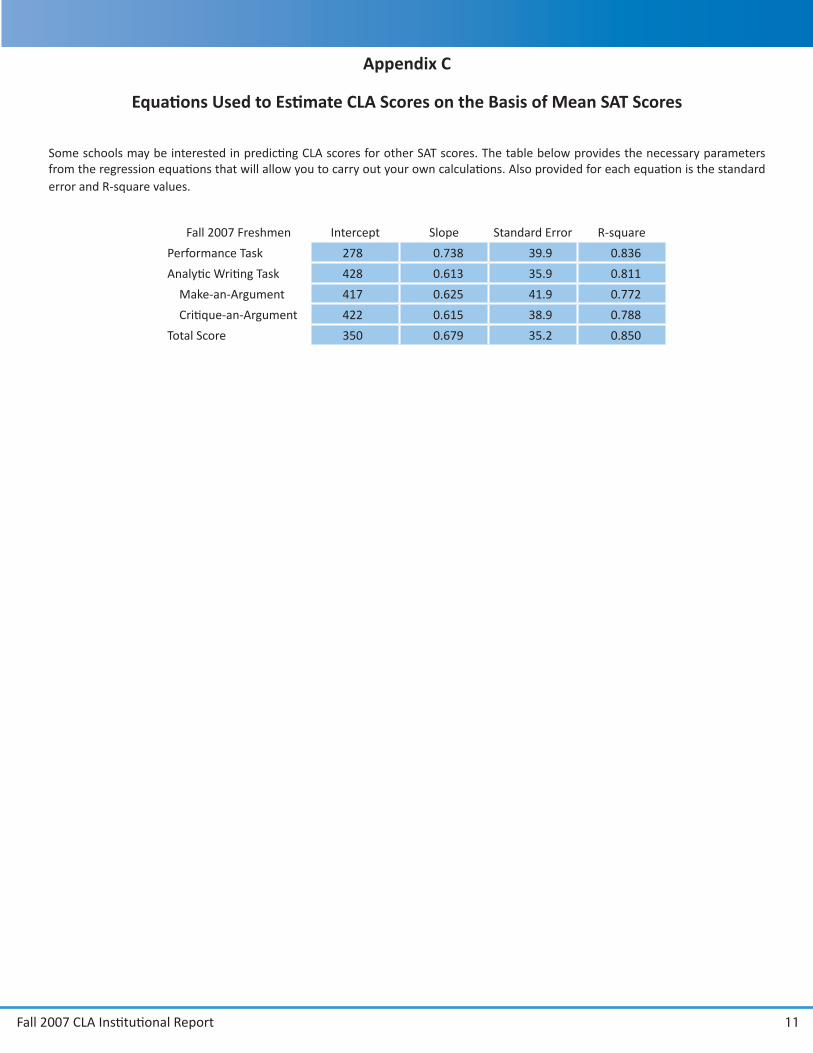
Equations Used to Estimate CLA Scores on the Basis of Mean SAT Scores
Some schools may be interested in predicting CLA scores for other SAT scores. The table below provides the necessary parameters from the regression equations that will allow you to carry out your own calculations. Also provided for each equation is the standard error and R-square values.
Fall 2007 Freshmen Intercept Slope Standard Error R-square
Performance Task 278 0.738 39.9 0.836
Analytic Writing Task 428 0.613 35.9 0.811
Make-an-Argument 417 0.625 41.9 0.772
Critique-an-Argument 422 0.615 38.9 0.788
Total Score 350 0.679 35.2 0.850

Fall 2007 CLA Institutional Report12
Appendix D
Expected CLA Score for Any Given Mean SAT Score for Freshmen
The table below presents the expected CLA score for a school’s freshmen for various mean SAT scores.
Mea
n SA
T Sc
ore
Perf
orm
ance
Tas
k
Ana
lytic
Wri
ting
Task
Mak
e-an
-Arg
umen
t
Criti
que-
an-A
rgum
ent
Tota
l Sco
re
Mea
n SA
T Sc
ore
Perf
orm
ance
Tas
k
Ana
lytic
Wri
ting
Task
Mak
e-an
-Arg
umen
t
Criti
que-
an-A
rgum
ent
Tota
l Sco
re
Mea
n SA
T Sc
ore
Perf
orm
ance
Tas
k
Ana
lytic
Wri
ting
Task
Mak
e-an
-Arg
umen
t
Criti
que-
an-A
rgum
ent
Tota
l Sco
re
Mea
n SA
T Sc
ore
Perf
orm
ance
Tas
k
Ana
lytic
Wri
ting
Task
Mak
e-an
-Arg
umen
t
Criti
que-
an-A
rgum
ent
Tota
l Sco
re
1600 1458 1409 1417 1406 1437 1290 1230 1219 1223 1216 1226 980 1001 1028 1029 1025 1016 670 772 838 836 834 805
1590 1451 1402 1411 1400 1430 1280 1222 1212 1217 1210 1219 970 994 1022 1023 1019 1009 660 765 832 829 828 798
1580 1444 1396 1404 1394 1423 1270 1215 1206 1211 1203 1213 960 986 1016 1017 1013 1002 650 757 826 823 822 792
1570 1436 1390 1398 1388 1416 1260 1208 1200 1204 1197 1206 950 979 1010 1011 1007 995 640 750 820 817 816 785
1560 1429 1384 1392 1382 1409 1250 1200 1194 1198 1191 1199 940 971 1004 1004 1000 988 630 743 814 811 810 778
1550 1422 1378 1386 1376 1403 1240 1193 1188 1192 1185 1192 930 964 998 998 994 982 620 735 808 804 804 771
1540 1414 1372 1379 1369 1396 1230 1185 1182 1186 1179 1185 920 957 992 992 988 975 610 728 802 798 798 764
1530 1407 1366 1373 1363 1389 1220 1178 1176 1179 1173 1179 910 949 986 986 982 968 600 720 796 792 791 758
1520 1399 1359 1367 1357 1382 1210 1171 1169 1173 1167 1172 900 942 979 979 976 961 590 713 789 786 785 751
1510 1392 1353 1361 1351 1375 1200 1163 1163 1167 1160 1165 890 934 973 973 970 955 580 706 783 779 779 744
1500 1385 1347 1354 1345 1369 1190 1156 1157 1161 1154 1158 880 927 967 967 964 948 570 698 777 773 773 737
1490 1377 1341 1348 1339 1362 1180 1148 1151 1154 1148 1151 870 920 961 961 957 941 560 691 771 767 767 730
1480 1370 1335 1342 1333 1355 1170 1141 1145 1148 1142 1145 860 912 955 954 951 934 550 684 765 761 761 724
1470 1363 1329 1336 1326 1348 1160 1134 1139 1142 1136 1138 850 905 949 948 945 927 540 676 759 754 754 717
1460 1355 1323 1329 1320 1342 1150 1126 1133 1136 1130 1131 840 898 943 942 939 921 530 669 753 748 748 710
1450 1348 1317 1323 1314 1335 1140 1119 1127 1129 1123 1124 830 890 937 936 933 914 520 661 746 742 742 703
1440 1340 1310 1317 1308 1328 1130 1112 1120 1123 1117 1117 820 883 930 929 927 907 510 654 740 736 736 696
1430 1333 1304 1311 1302 1321 1120 1104 1114 1117 1111 1111 810 875 924 923 921 900 500 647 734 729 730 690
1420 1326 1298 1304 1296 1314 1110 1097 1108 1111 1105 1104 800 868 918 917 914 893 490 639 728 723 724 683
1410 1318 1292 1298 1290 1308 1100 1089 1102 1104 1099 1097 790 861 912 911 908 887 480 632 722 717 718 676
1400 1311 1286 1292 1283 1301 1090 1082 1096 1098 1093 1090 780 853 906 904 902 880 470 625 716 711 711 669
1390 1303 1280 1286 1277 1294 1080 1075 1090 1092 1087 1084 770 846 900 898 896 873 460 617 710 704 705 663
1380 1296 1274 1279 1271 1287 1070 1067 1084 1086 1080 1077 760 839 894 892 890 866 450 610 704 698 699 656
1370 1289 1268 1273 1265 1280 1060 1060 1078 1079 1074 1070 750 831 887 886 884 859 440 602 697 692 693 649
1360 1281 1261 1267 1259 1274 1050 1053 1071 1073 1068 1063 740 824 881 879 877 853 430 595 691 686 687 642
1350 1274 1255 1261 1253 1267 1040 1045 1065 1067 1062 1056 730 816 875 873 871 846 420 588 685 679 681 635
1340 1267 1249 1254 1246 1260 1030 1038 1059 1061 1056 1050 720 809 869 867 865 839 410 580 679 673 675 629
1330 1259 1243 1248 1240 1253 1020 1030 1053 1054 1050 1043 710 802 863 861 859 832 400 573 673 667 668 622
1320 1252 1237 1242 1234 1246 1010 1023 1047 1048 1044 1036 700 794 857 854 853 825
1310 1244 1231 1236 1228 1240 1000 1016 1041 1042 1037 1029 690 787 851 848 847 819
1300 1237 1225 1229 1222 1233 990 1008 1035 1036 1031 1022 680 779 845 842 841 812

Fall 2007 CLA Institutional Report 13
Appendix E
CLA Scale and Deviation Scores by Decile Group
The table below was prepared to help you gain further insight into your school’s performance relative to other participating schools for freshmen. You are encouraged to compare the decile group scores in this table to your deviation scores in Table 4 and your mean (scale) scores in Table 5.
For each metric in the table, all schools were rank ordered and then divided into 10 groups of roughly equal size (“decile groups”). Only schools that successfully tested at least 25 students with ACT/SAT scores were included. For each metric, the average performance of the schools within each decile group was calculated. For example, a total scale score for freshmen of 1163 represents the average performance of schools in the 9th decile group (i.e., schools in the 81st to 90th percentile). If freshmen at your school achieved an average scale score of 1164, you could safely conclude that your school performed in the top 20 percent of participating schools on the CLA.
Freshmen (fall 2007)
Decile Performance Task Analytic Writing Task Total Score
Group Scale Score Deviation Score Scale Score Deviation Score Scale Score Deviation Score
10 1230 1.8 1234 1.7 1237 1.7
9 1161 1.2 1160 1.1 1163 1.1
8 1121 0.8 1122 0.7 1124 0.7
7 1093 0.5 1098 0.4 1098 0.4
6 1058 0.2 1071 0.2 1071 0.2
5 1027 -0.1 1049 -0.1 1039 -0.2
4 996 -0.5 1030 -0.4 1013 -0.5
3 978 -0.8 1017 -0.7 998 -0.8
2 951 -1.1 991 -1.1 976 -1.1
1 893 -1.6 940 -1.8 922 -1.7
Fall 2007 CLA Institutional Report14
Alaska Pacific UniversityAllegheny CollegeAppalachian State UniversityArkansas State UniversityAuburn UniversityAuburn University MontgomeryAurora UniversityAustin CollegeAverett UniversityBarton CollegeBethel UniversityBloomfield CollegeBluefield State CollegeBob Jones UniversityCabrini CollegeCalifornia Baptist UniversityCalifornia Maritime AcademyCalifornia Polytechnic State University - San Luis ObispoCalifornia State University, BakersfieldCalifornia State University, Channel IslandsCalifornia State University, ChicoCalifornia State University, Dominguez HillsCalifornia State University, East BayCalifornia State University, FresnoCalifornia State University, FullertonCalifornia State University, Long BeachCalifornia State University, Los AngelesCalifornia State University, Monterey BayCalifornia State University, NorthridgeCalifornia State University, SacramentoCalifornia State University, San BernardinoCalifornia State University, San MarcosCalifornia State University, StanislausCapital UniversityCecil Community CollegeCentenary CollegeCentral Connecticut State UniversityChamplain CollegeCharleston Southern UniversityClemson UniversityCollege of St. Benedict/St. John’s UniversityCollin County Community College DistrictColorado Mountain CollegeColorado State UniversityConcord University
Delaware State UniversityDominican University of CaliforniaDuke UniversityEast Carolina UniversityEckerd CollegeElizabeth City State UniversityEmory & Henry CollegeEndicott CollegeFairmont State UniversityFlorida State UniversityFort Hays State UniversityFranklin Pierce UniversityFurman UniversityGlenville State CollegeHannibal LaGrange CollegeHeritage UniversityHiram CollegeHoughton CollegeHoward Community CollegeHumboldt State UniversityIllinois CollegeIndiana University of PennsylvaniaIndiana Wesleyan UniversityJackson State UniversityJuniata CollegeLewis & Clark CollegeLynchburg CollegeMacalester CollegeMarian CollegeMarshall UniversityMarywood UnivesityMetropolitan State UniversityMillersville University of PennsylvaniaMisericordia UniversityMissouri Southern State University-JoplinMissouri State University - West PlainsMissouri Western State UniversityMonmouth UniversityMorehead State UniversityMount Saint Mary CollegeNicholls State UniversityNorth Carolina State UniversityNorth Dakota State UniversityNorth Park UniversityOklahoma State University
Appendix F
List of Participating Institutions

Fall 2007 CLA Institutional Report 15
Our Lady of the Lake UniversityPace UniversityPacific UniversityPeace CollegePepperdine UniversityPresbyterian CollegeRhode Island College Rhodes CollegeRichard Stockton College of New JerseyRollins CollegeSaint Louis University in MadridSan Diego State UniversitySan Francisco State UniversitySan Jose State UniversitySeton Hill UniversityShepherd UniversitySlippery Rock UniversitySonoma State UniversitySouthern Virginia UniversitySouthwestern UniversitySpelman CollegeSt. Cloud State UniversityStonehill CollegeTarleton State UniversityTexas A&M International UniversityTexas Lutheran UniversityTexas Tech UniversityThe College of IdahoThe College of New JerseyThe College of New RochelleThe College of St. ScholasticaThe Metropolitan Community CollegesThe University of Nebraska at OmahaToccoa Falls CollegeTowson UniversityTruman State UniversityUniversity of AlabamaUniversity of Arkansas Fort SmithUniversity of Central FloridaUniversity of CharlestonUniversity of EvansvilleUniversity of FindlayUniversity of Great FallsUniversity of KentuckyUniversity of Louisiana at Lafayette
University of MichiganUniversity of Missouri - St. LouisUniversity of Montana - MissoulaUniversity of North Carolina at AshevilleUniversity of North Carolina at Chapel HillUniversity of North Carolina at GreensboroUniversity of North Carolina at PembrokeUniversity of North Carolina at WilmingtonUniversity of PittsburghUniversity of South AlabamaUniversity of St. Thomas (MN)University of Texas at ArlingtonUniversity of Texas at AustinUniversity of Texas at BrownsvilleUniversity of Texas at DallasUniversity of Texas at El PasoUniversity of Texas at Pan AmericanUniversity of Texas at Permian BasinUniversity of Texas at San AntonioUniversity of Texas at TylerUniversity of the Virgin IslandsUniversity of Virginia’s College at WiseUniversity of Wisconsin La CrosseUpper Iowa UniversityUrsinus CollegeUrsuline CollegeWagner CollegeWalsh CollegeWarner Southern CollegeWartburg CollegeWashburn UniversityWashington and Jefferson CollegeWashington and Lee UniversityWeber State UniversityWesley CollegeWest Liberty State CollegeWest Virginia State UniversityWest Virginia University West Virginia University Institute of TechnologyWestern Carolina UniversityWestminster College (MO)Westminster College (UT)Wichita State UniversityWilliam Woods UniversityWofford College
Appendix F (continued)
List of Participating Institutions

Fall 2007 CLA Institutional Report16
Appendix G
CLA Student Data File
In tandem with this report, we provide a CLA Student Data File, which includes over 60 variables across three categories: (1) CLA scores and identifiers; (2) information provided/verified by the registrar; and (3) self-reported information from students in their CLA on-line profile. We provide student-level information for linking with other data you collect (e.g., from NSSE, CIRP, portfolios, local assessments, course-taking patterns, participation in specialized programs, etc.) to help you hypothesize about campus-specific factors related to overall institutional performance. Student-level scores are not designed to be diagnostic at the individual level and should be considered as only one piece of evidence about a student’s skills.
CLA Scores and Identifiers
CLA scores for Performance Task, Ana-• lytic Writing Task, Make-an-Argument, Critique-an-Argument, and Total CLA Score (depending on the number of tasks taken and completeness of responses):
CLA scale scores; -
Student Performance Level cat- -egories (i.e., well below expected, below expected, at expected, above expected, well above expected) if CLA scale score and SAT equivalent scores are available;
Percentile Rank in the CLA (among -students in the same class year; based on scale score); and
Percentile Rank at School (among -students in the same class year; based on scale score).
Unique CLA numeric identifiers •
Name (first, middle initial, last), E-mail • address, SSN/Student ID
Year, Administration (Fall or Spring), Type • of Test (90 or 180-minute), Date of test
Registrar Data
Class Standing •
Cumulative Undergraduate GPA •
Transfer Student Status •
Program ID and Name (for classifica-• tion of students into difference colleges, schools, fields of study, majors, pro-grams, etc.)
SAT Equivalent Score (SAT composite or • converted ACT composite)
SAT I - Math •
SAT I - Verbal / Critical Reading •
SAT Total (Math + Verbal) •
SAT I - Writing •
SAT I - Writing (Essay subscore) •
SAT I - Writing (Multiple-choice subscore) •
ACT - Composite •
ACT - English •
ACT - Reading •
ACT - Mathematics •
ACT - Science•
ACT - Writing•
Self-Reported Data
Student Class: Freshman/First-Year (1) • Sophomore (2) Junior (3) Senior (4) Un-classified (5) Other (6)
Age •
Gender •
Race/Ethnicity •
Primary and Secondary Academic Major • (34 categories)
Field of Study (6 categories; based on • primary academic major)
English as primary language•
Total years at school •
Attended school as Freshman, Sopho-• more, Junior, Senior