Writing engineering theses and reports - slides
47
Reports and Theses - W. Hallett - University of Ottawa Engineering Reports W. Hallett and Theses
-
Upload
natalie-baddour -
Category
Documents
-
view
222 -
download
1
description
Slides from Dr. William Hallett's presentation on writing Engineering theses and reports. Department of Mechanical Engineering, University of Ottawa.
Transcript of Writing engineering theses and reports - slides

Reports and Theses - W. Hallett - University of Ottawa
Engineering Reports
W. Hallett
and Theses
Reports and Theses - W. Hallett - University of Ottawa
1. Outline of Typical Report - I
Abstract (1-2 paragraph summary)
Table of Contents
List of Figures*
List of Tables*
Nomenclature (if you have many symbols oracronyms, otherwise define them in the text)
Title page
*not needed for short reports or reports with fewfigures and/or tables

Reports and Theses - W. Hallett - University of Ottawa
1. Outline of Typical Report - II
1. Introduction (brief - set context)
3. Methods and Procedures- experiments, analysis, design work as
appropriate - can be several chapters if needed
2. Literature Review, Background or Theory- show what has been done before and how your
work continues or complements this- highlight original contribution to be made by
your work
Reports and Theses - W. Hallett - University of Ottawa
1. Outline of Typical Report - III
4. Results and Discussion
6. References
5. Conclusions and Recommendations- conclusions are NOT the same as the summary- summarize what has been learned, what is new,
where to go from here- do NOT summarize methods, etc. again
Reports and Theses - W. Hallett - University of Ottawa
1. Outline of Typical Report - IVAppendices
- information to support report, but not needed byall readers
- examples - tables of data- construction drawings- detailed mathematical derivations- computer codes- instrumentation, calibrations
- identify as Appendix A, Appendix B, etc.- each must have a title
(e.g. Appendix A: Instrument Calibration)
Reports and Theses - W. Hallett - University of Ottawa
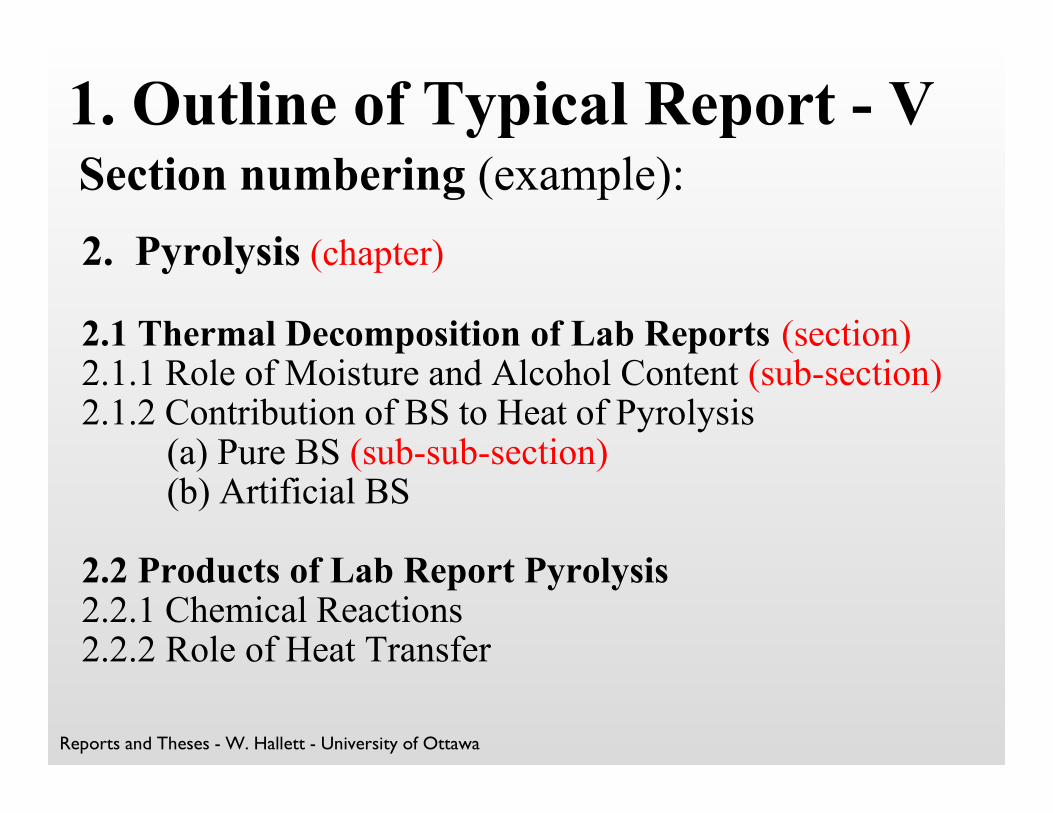
1. Outline of Typical Report - VSection numbering (example):
2. Pyrolysis (chapter)
2.1 Thermal Decomposition of Lab Reports (section)2.1.1 Role of Moisture and Alcohol Content (sub-section)2.1.2 Contribution of BS to Heat of Pyrolysis
(a) Pure BS (sub-sub-section)(b) Artificial BS
2.2 Products of Lab Report Pyrolysis2.2.1 Chemical Reactions2.2.2 Role of Heat Transfer
Reports and Theses - W. Hallett - University of Ottawa
1. Outline of Typical Report - VI
FGPS Thesis Format:
- must be double-spacedwhy? so examiners can add comments and
corrections- must be printed one side of paper only
why? to make it easier for examiners to lookat several pages at once
LMake your document as “user-friendly” aspossible.
Reports and Theses - W. Hallett - University of Ottawa
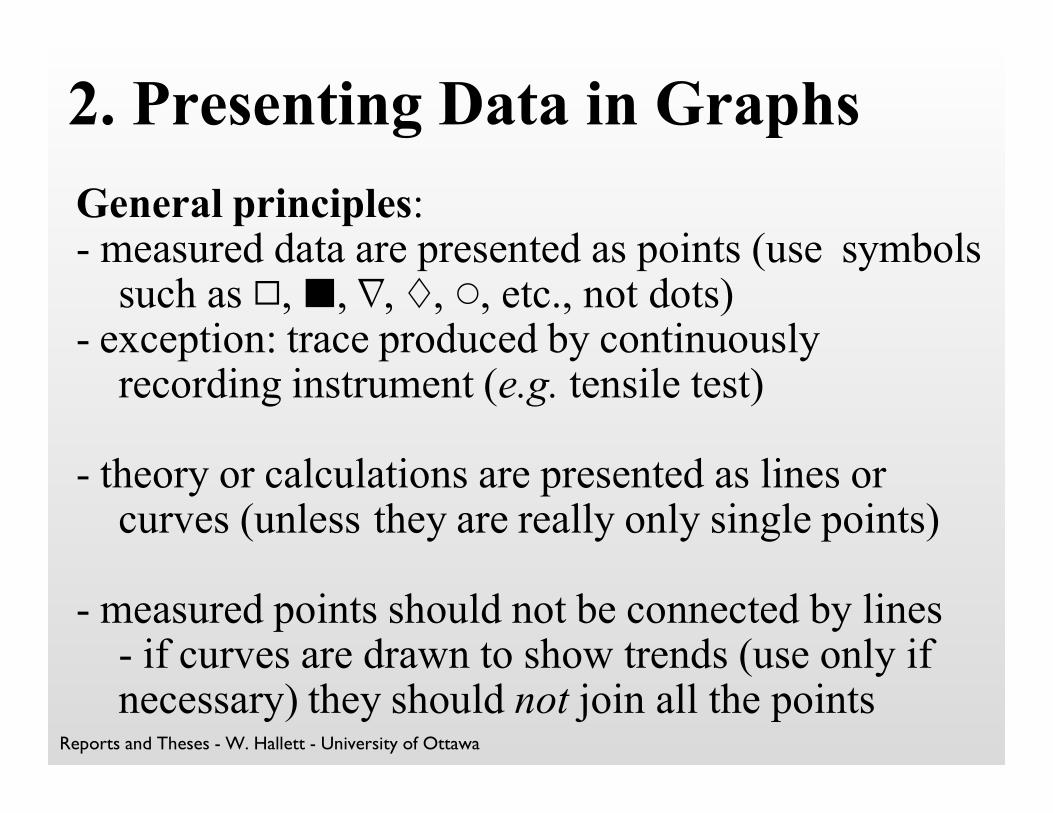
2. Presenting Data in Graphs
General principles:- measured data are presented as points (use symbols
such as Q, O, L, �, �, etc., not dots)- exception: trace produced by continuously
recording instrument (e.g. tensile test)
- theory or calculations are presented as lines orcurves (unless they are really only single points)
- measured points should not be connected by lines- if curves are drawn to show trends (use only ifnecessary) they should not join all the points
Reports and Theses - W. Hallett - University of Ottawa
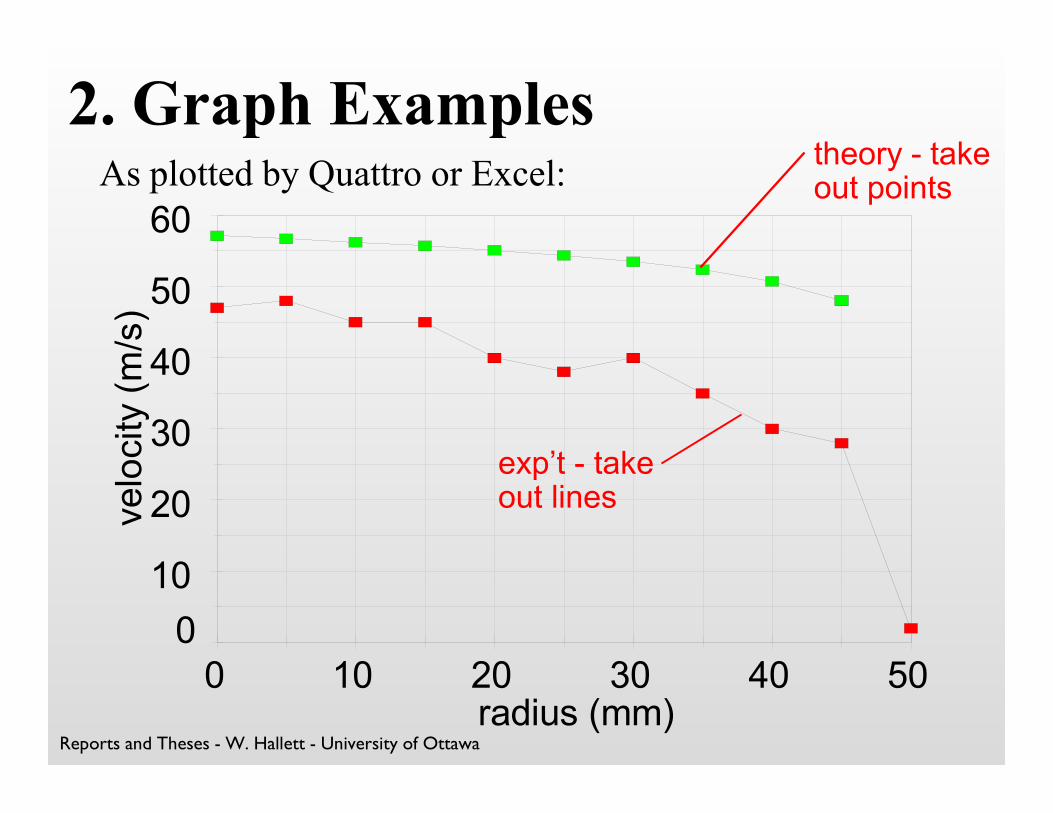
2. Graph Examples
0
10
20
30
40
50
60
0 10 20 30 40 50 radius (mm)
As plotted by Quattro or Excel:theory - takeout points
exp’t - takeout lines
Reports and Theses - W. Hallett - University of Ottawa
2. Graph Examples
0
20
40
60
0 10 20 30 40 50 radius (mm)
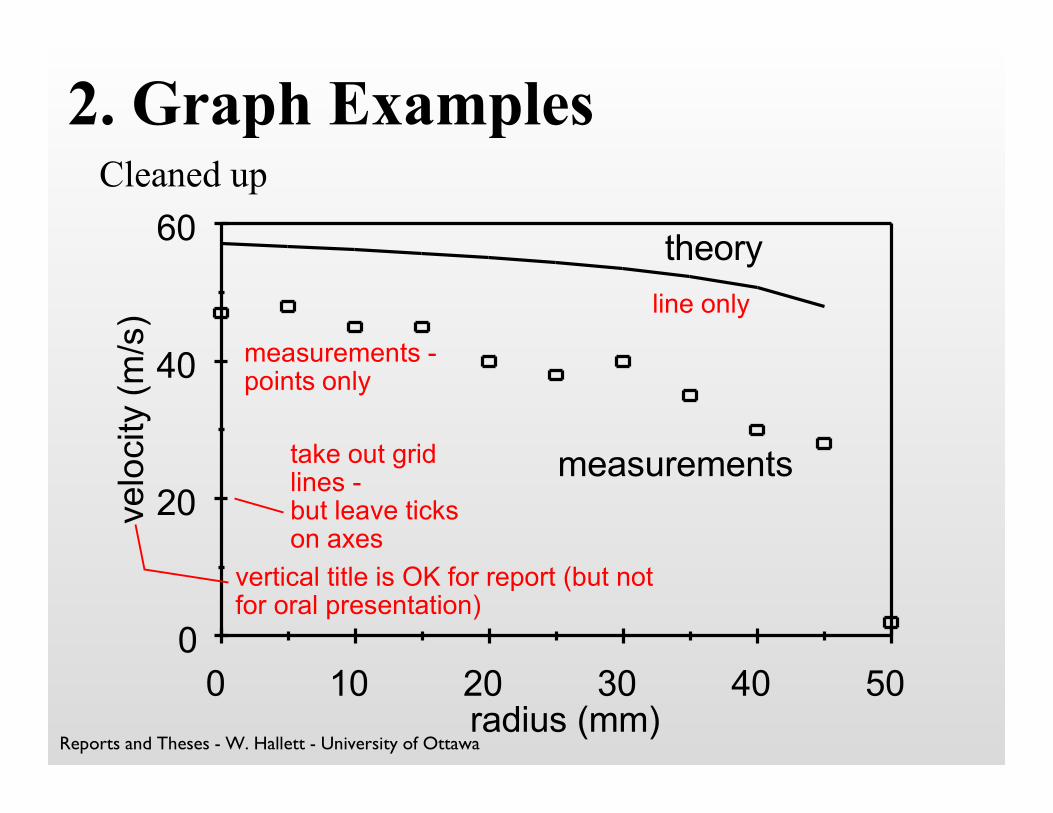
Cleaned up
theory
measurementstake out gridlines - but leave tickson axes
measurements -points only
line only
vertical title is OK for report (but notfor oral presentation)
Reports and Theses - W. Hallett - University of Ottawa
2. Graph Examples
0
20
40
60
0 10 20 30 40 50 radius (mm)
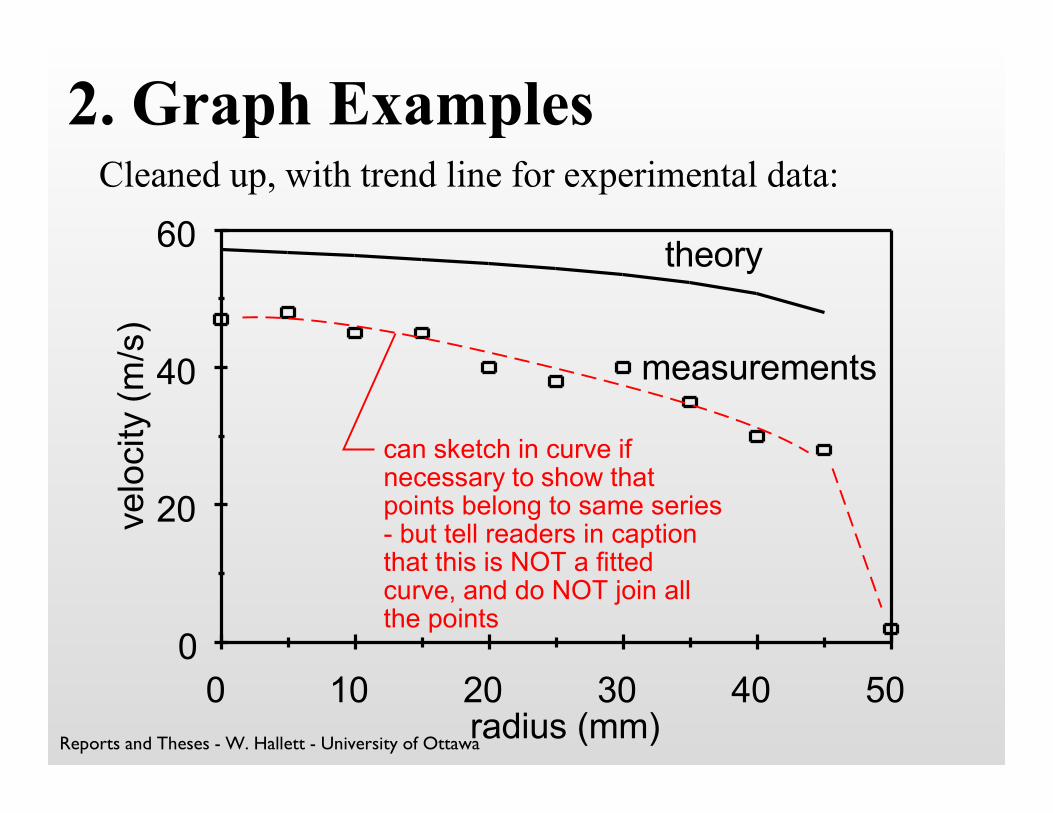
theory
measurements
can sketch in curve ifnecessary to show thatpoints belong to same series- but tell readers in captionthat this is NOT a fittedcurve, and do NOT join allthe points
Cleaned up, with trend line for experimental data:
Reports and Theses - W. Hallett - University of Ottawa
2. Graph Examples
0 80 160 240100
200
300
T (EC)
time (s)
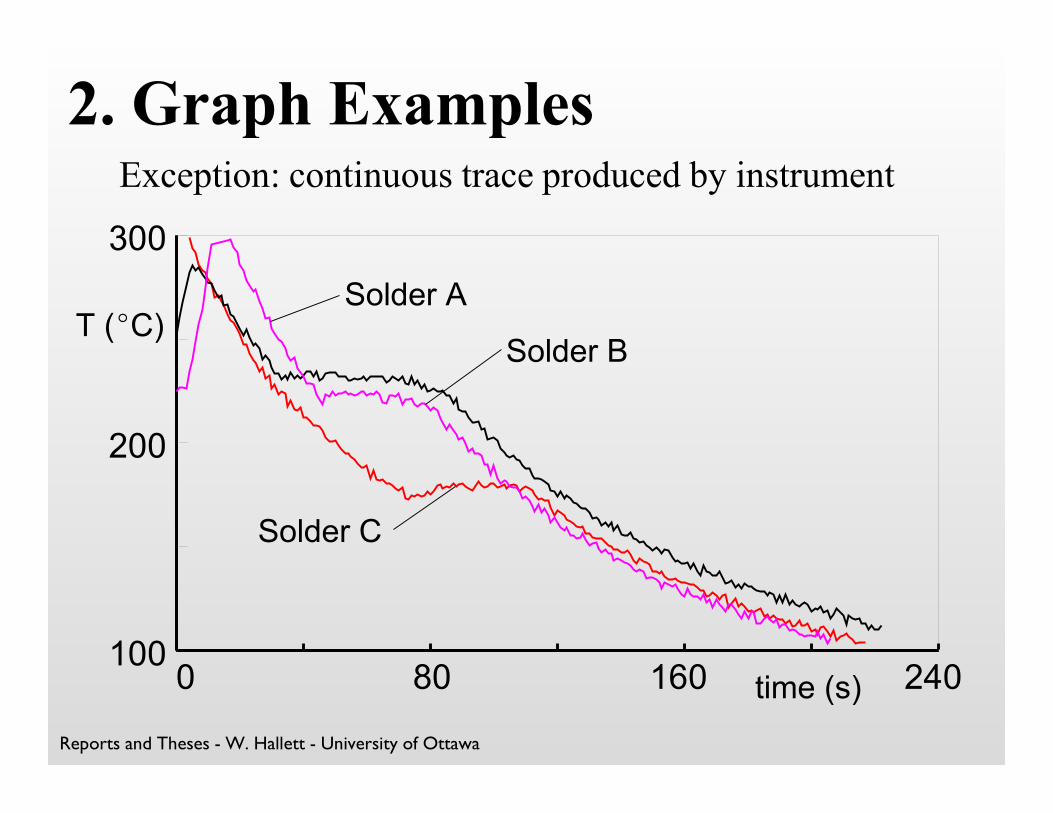
Exception: continuous trace produced by instrument
Solder A
Solder B
Solder C
Reports and Theses - W. Hallett - University of Ottawa
0
200
400
600
800
1000
1200
0 1 2 3 4 5 voltage (V)
2. Graph Examples
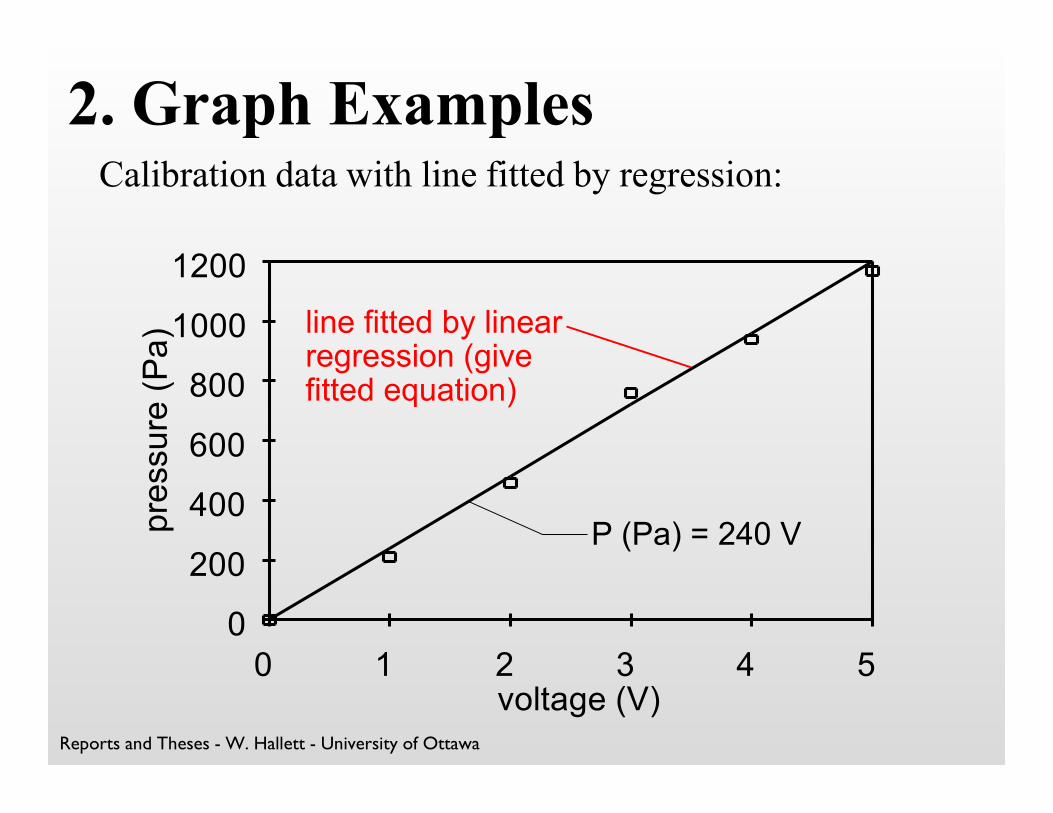
line fitted by linearregression (give fitted equation)
P (Pa) = 240 V
Calibration data with line fitted by regression:
Reports and Theses - W. Hallett - University of Ottawa
2. Graph Examples
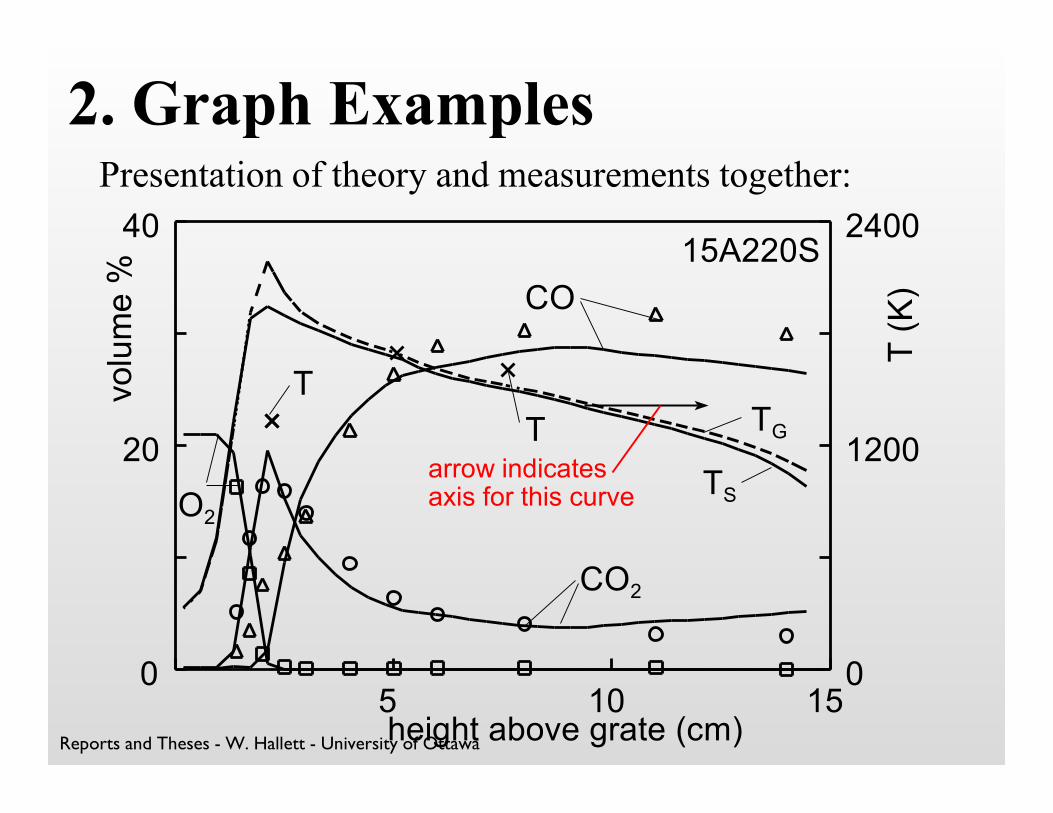
0
20
40
0
1200
2400
5 10 15 height above grate (cm)
TG
TS
CO2
CO
O2
T
15A220S
T
arrow indicatesaxis for this curve
Presentation of theory and measurements together:
Reports and Theses - W. Hallett - University of Ottawa
2. Graph Examples
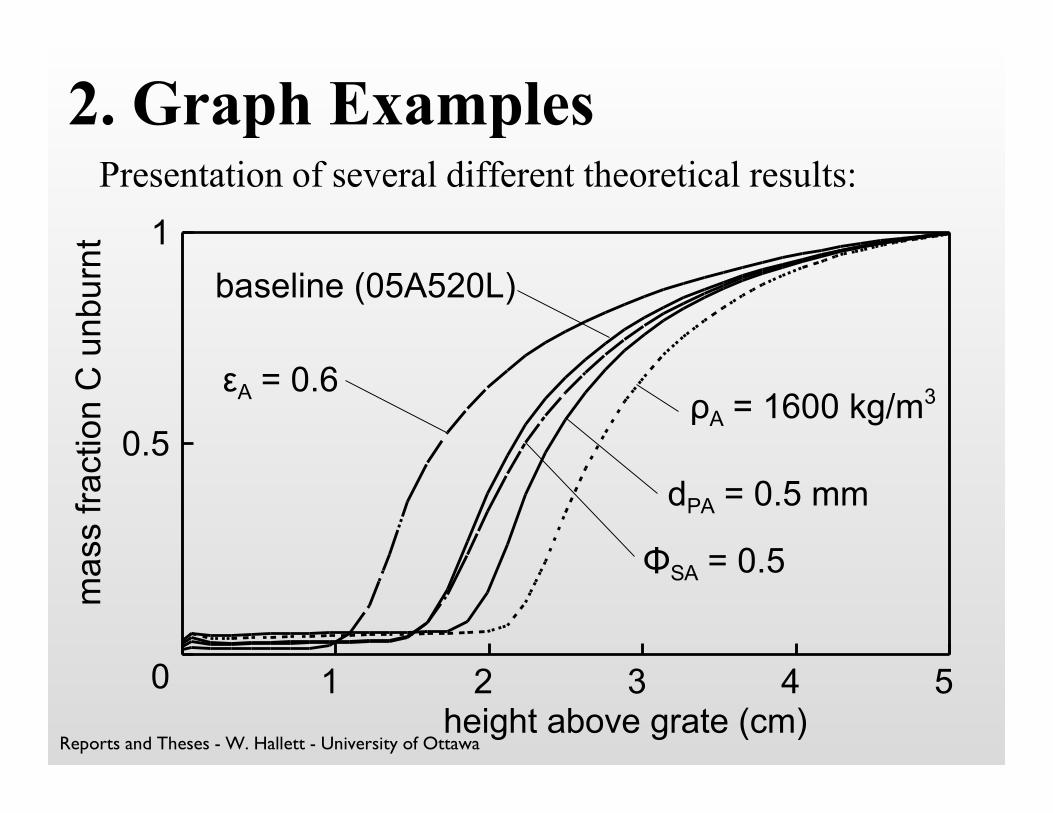
0
0.5
1
1 2 3 4 5 height above grate (cm)
ñA = 1600 kg/m3
dPA = 0.5 mm
ÖSA = 0.5
baseline (05A520L)
åA = 0.6
Presentation of several different theoretical results:
Reports and Theses - W. Hallett - University of Ottawa
2. Graph Examples
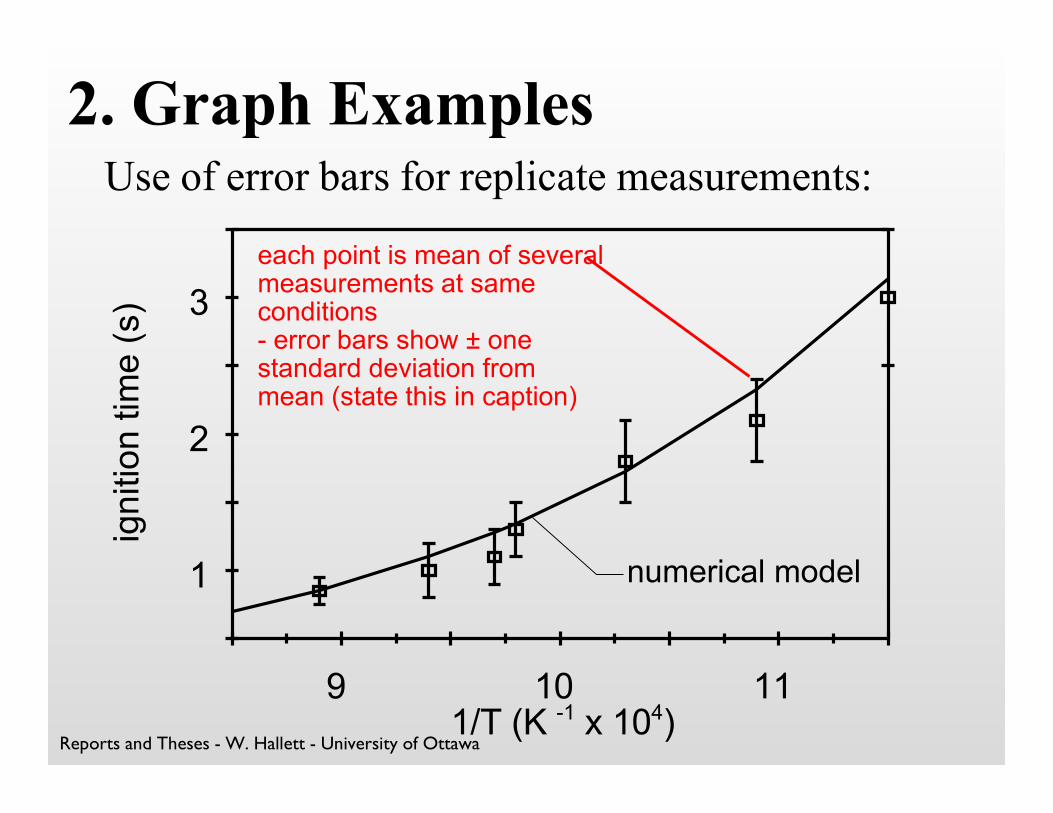
1
2
3
9 10 11 1/T (K -1 x 10⁴)
each point is mean of severalmeasurements at sameconditions- error bars show ± onestandard deviation frommean (state this in caption)
Use of error bars for replicate measurements:
numerical model

Reports and Theses - W. Hallett - University of Ottawa
2. Presenting Data in Graphs
General principles:- each graph or figure must have a detailed caption,
which should:- state what graph shows (e.g. velocity vs radius)- give conditions or values of variables (e.g. T, P,
etc.) for results shown- identify parts, special features
Caption and graph together should containenough information that they can be
understood without looking at the report text.

Reports and Theses - W. Hallett - University of Ottawa
2. Presenting Data in GraphsLogarithmic scales
1 10 100 1000 x:(log10 × 0 1 2 3)
- principle: - powers of 10 evenly spaced on scale- log of numbers on scale progress linearly - plot actual numbers - do not show log of numbers- no. of “cycles” = no. of powers of 10
- example: 3 cycle log scale
Reports and Theses - W. Hallett - University of Ottawa
2. Presenting Data in GraphsLogarithmic scales
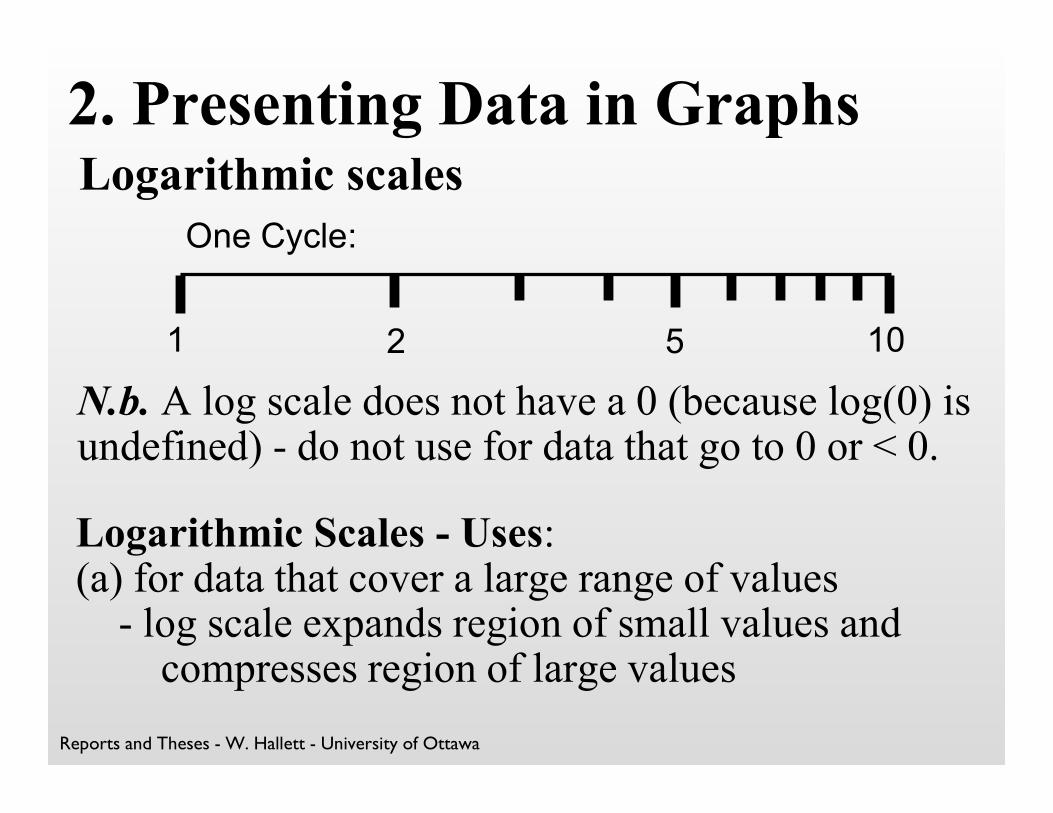
One Cycle:
1 10 2 5
Logarithmic Scales - Uses:(a) for data that cover a large range of values
- log scale expands region of small values andcompresses region of large values
N.b. A log scale does not have a 0 (because log(0) isundefined) - do not use for data that go to 0 or < 0.
Reports and Theses - W. Hallett - University of Ottawa
2. Graph Examples
0
20
40
60
80
100
0 20 40 60 80 100 120 ÄT (EC)
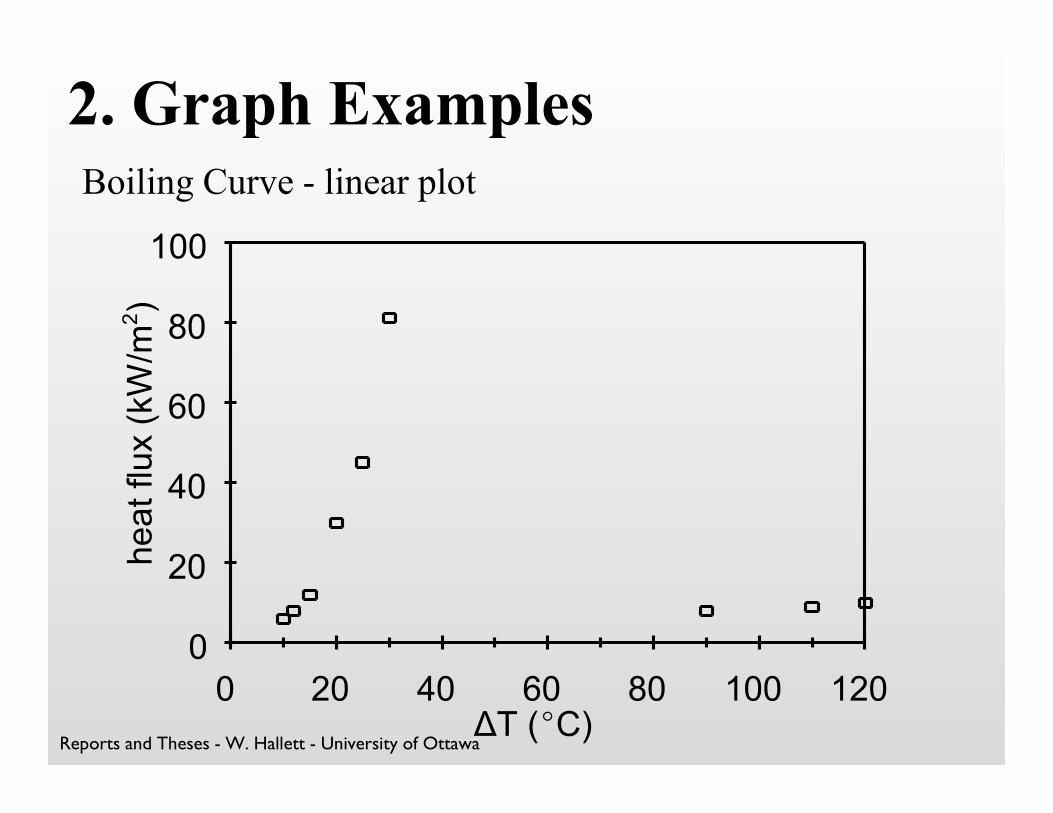
Boiling Curve - linear plot

Reports and Theses - W. Hallett - University of Ottawa
2. Graph Examples
1
10
100
10 100 1000 ÄT (EC)
can add connecting curve toshow relation of two groupsof points (in this casenucleate and film boilingregions)
Boiling Curve - log-log plot (i.e. both axes logarithmic)
Reports and Theses - W. Hallett - University of Ottawa
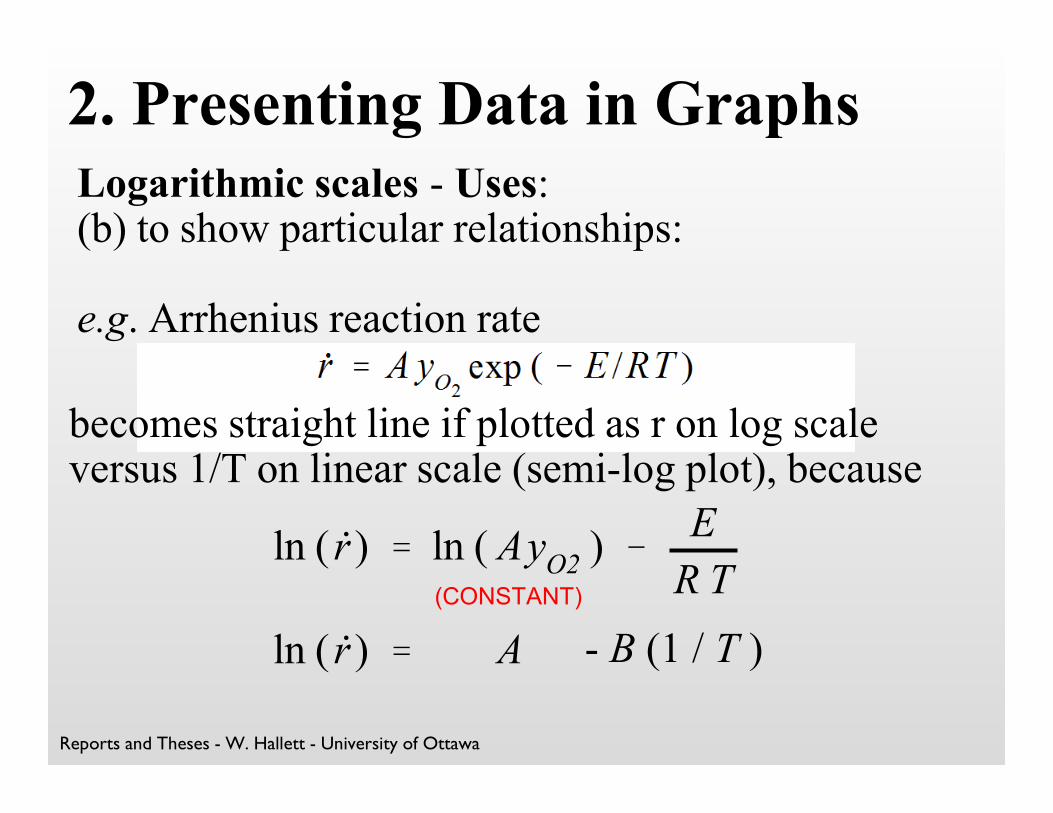
2. Presenting Data in GraphsLogarithmic scales - Uses: (b) to show particular relationships:
e.g. Arrhenius reaction rate
becomes straight line if plotted as r on log scaleversus 1/T on linear scale (semi-log plot), because
ln ( ÿr ) ' ln ( AyO2 ) &E
R T(CONSTANT)
ln ( ÿr ) ' A - B (1 / T )
Reports and Theses - W. Hallett - University of Ottawa
2. Graph Examples
1
2
3
9 10 11 1/T (K -1 x 10⁴)
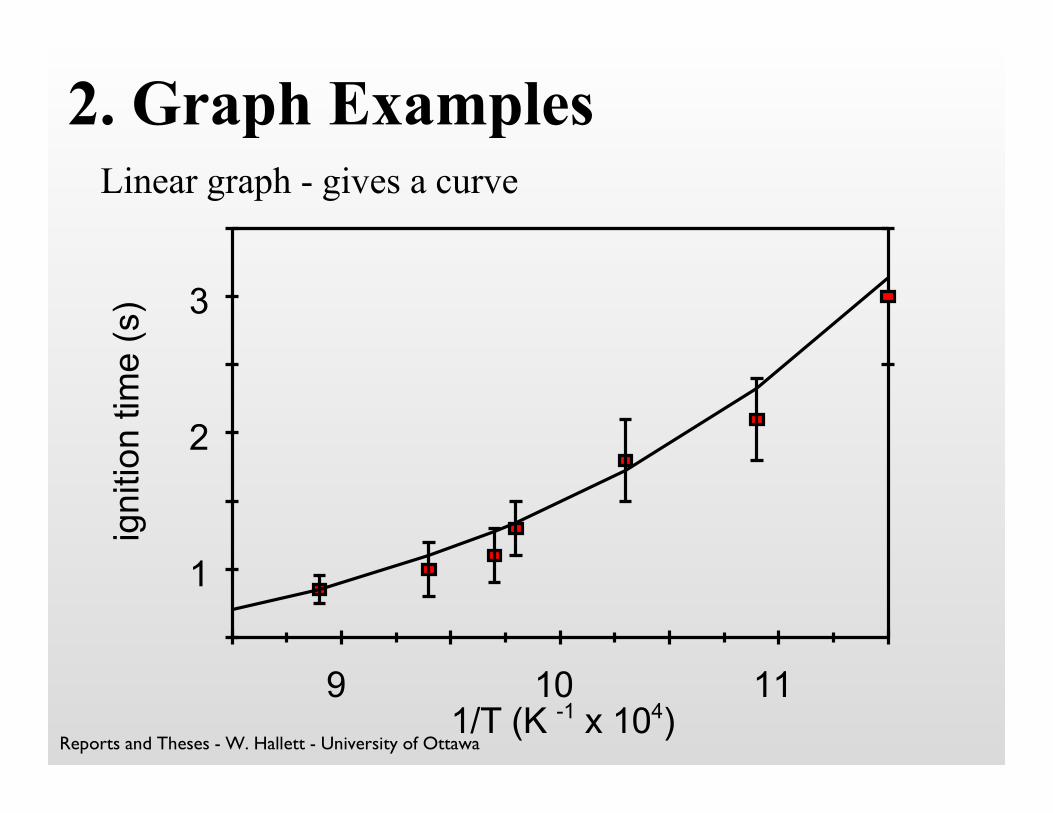
Linear graph - gives a curve
Reports and Theses - W. Hallett - University of Ottawa
2. Graph Examples
0.1
1
10
9 10 11 1/T (K -1 x 10⁴)
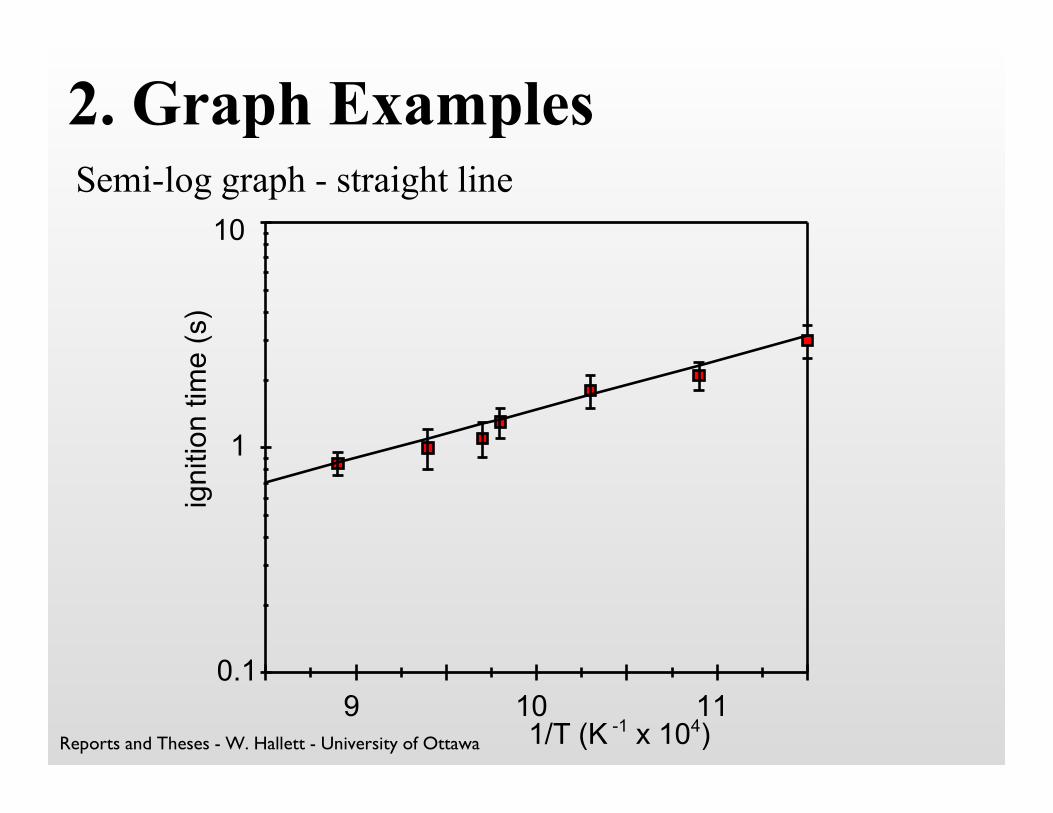
Semi-log graph - straight line

Reports and Theses - W. Hallett - University of Ottawa
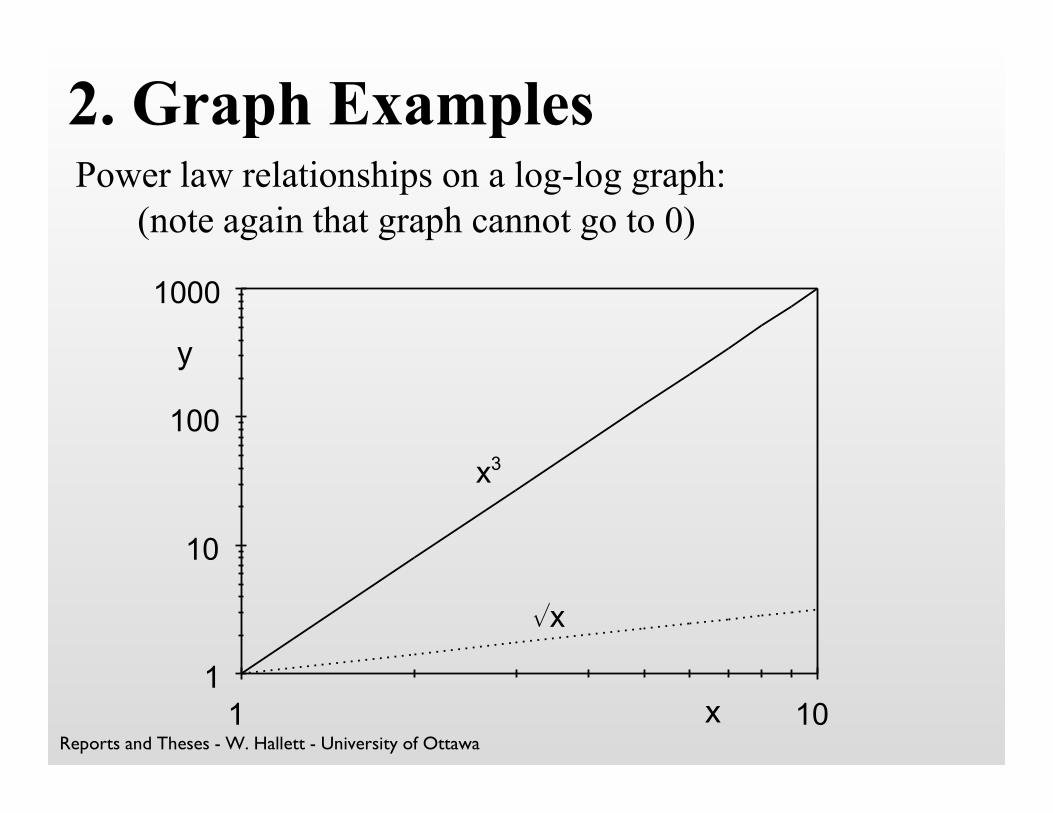
2. Presenting Data in Graphse.g. power law relationships in log-log graph:
take log of both sides:
therefore y = axb will plot as straight line with slopeb on log-log paper
(Note again: you do not have to take logarithms ofdata - just use log scale)
(CONSTANT)

Reports and Theses - W. Hallett - University of Ottawa
0
200
400
600
800
1000
0
1
2
3
4
0 2 4 6 8 10
%x
x3
2. Graph Examples
%xx3
x
Power law relationships on a linear graph:
Reports and Theses - W. Hallett - University of Ottawa
1
10
100
1000
1 10
x3
%x
2. Graph Examples
x
y
Power law relationships on a log-log graph:(note again that graph cannot go to 0)

Reports and Theses - W. Hallett - University of Ottawa
3. Experimental Errors
“accuracy” = how close measurements are to true value- established by calibration against known standard
“precision” = how reproducible measurements are- high precision = small degree of scatter
You must state honestly the precision and/oraccuracy of each instrument/measurement
Reports and Theses - W. Hallett - University of Ottawa
3. Experimental Errors
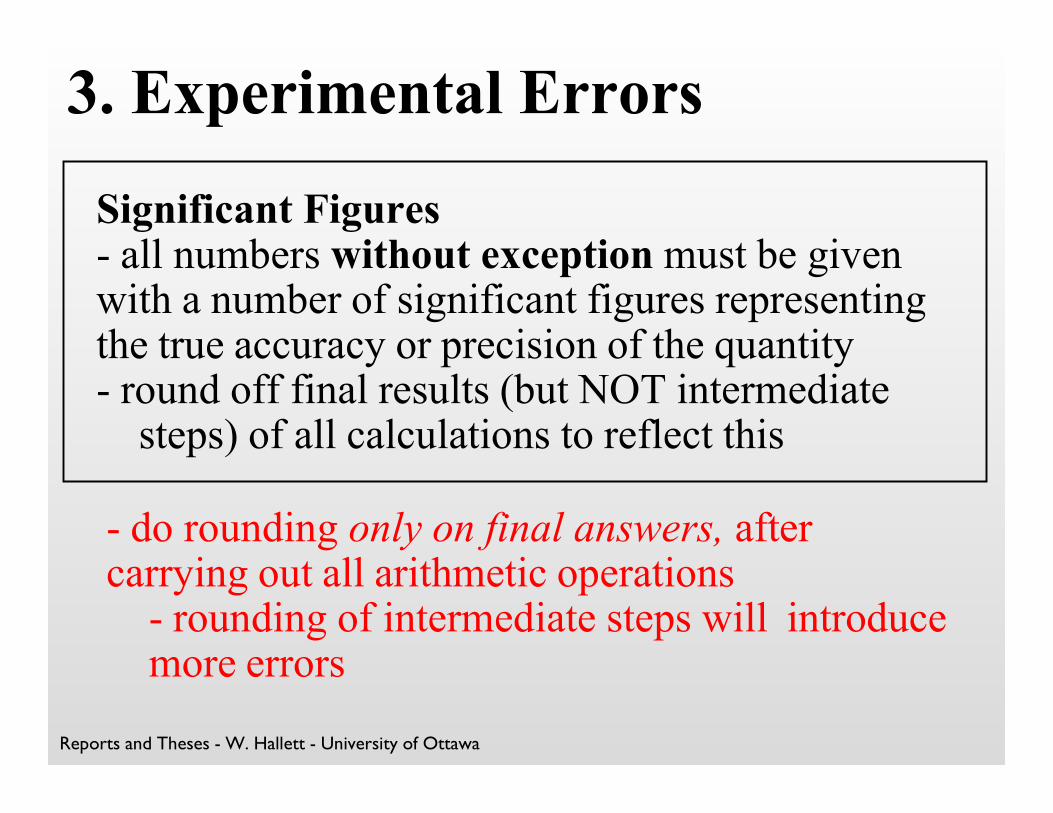
Significant Figures- all numbers without exception must be givenwith a number of significant figures representingthe true accuracy or precision of the quantity- round off final results (but NOT intermediate
steps) of all calculations to reflect this
- do rounding only on final answers, aftercarrying out all arithmetic operations
- rounding of intermediate steps will introducemore errors
Reports and Theses - W. Hallett - University of Ottawa
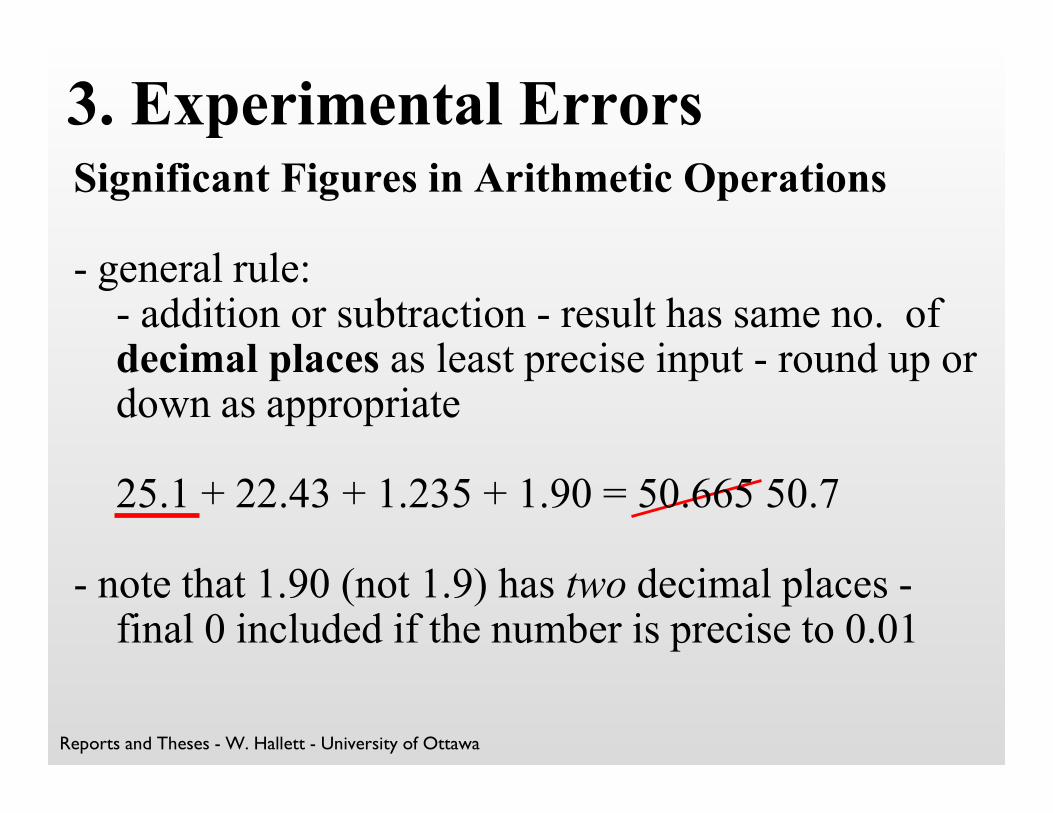
3. Experimental ErrorsSignificant Figures in Arithmetic Operations
- general rule:- addition or subtraction - result has same no. ofdecimal places as least precise input - round up ordown as appropriate
25.1 + 22.43 + 1.235 + 1.90 = 50.665 50.7
- note that 1.90 (not 1.9) has two decimal places -final 0 included if the number is precise to 0.01
Reports and Theses - W. Hallett - University of Ottawa
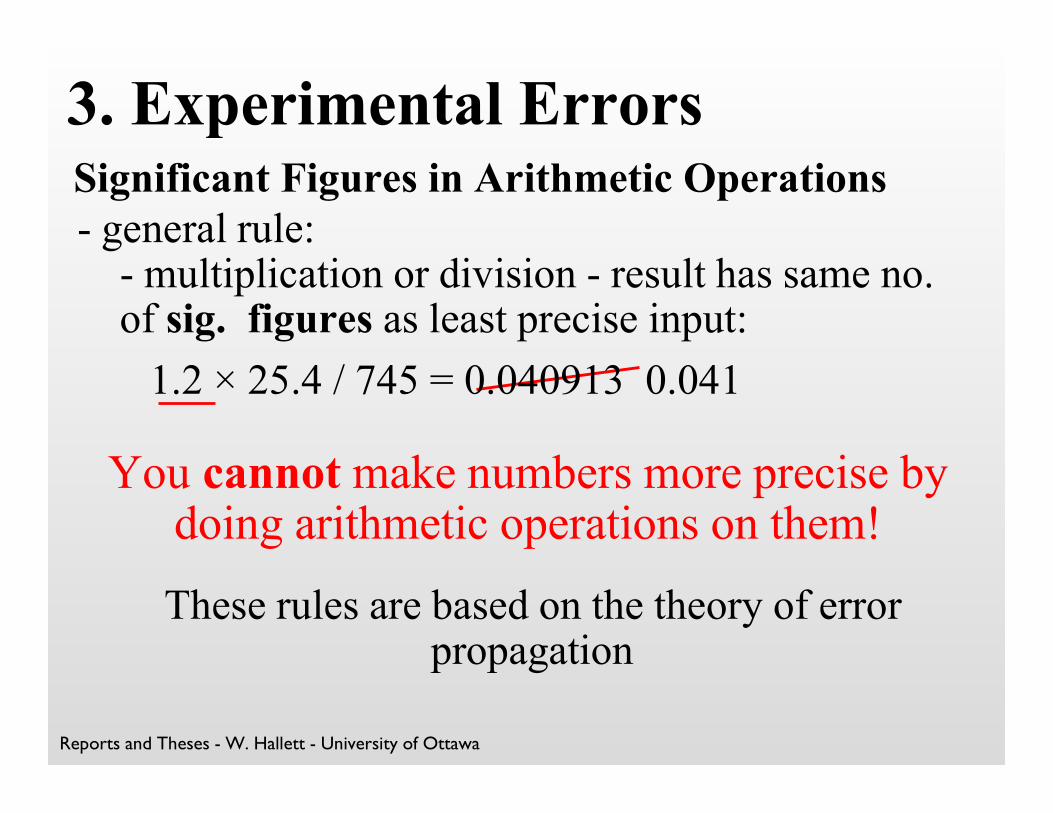
3. Experimental ErrorsSignificant Figures in Arithmetic Operations - general rule:
- multiplication or division - result has same no. of sig. figures as least precise input:
1.2 × 25.4 / 745 = 0.040913 0.041
You cannot make numbers more precise bydoing arithmetic operations on them!
These rules are based on the theory of errorpropagation
Reports and Theses - W. Hallett - University of Ottawa
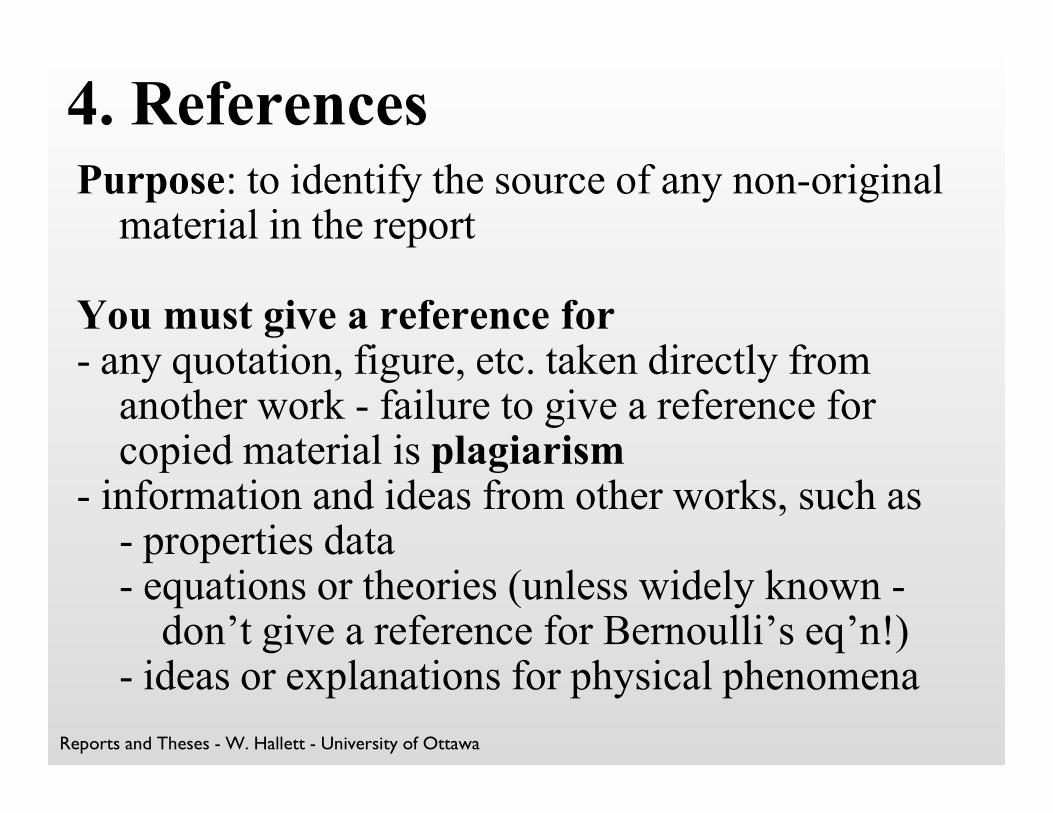
4. ReferencesPurpose: to identify the source of any non-original
material in the report
You must give a reference for - any quotation, figure, etc. taken directly from
another work - failure to give a reference forcopied material is plagiarism
- information and ideas from other works, such as- properties data- equations or theories (unless widely known -
don’t give a reference for Bernoulli’s eq’n!)- ideas or explanations for physical phenomena
Reports and Theses - W. Hallett - University of Ottawa
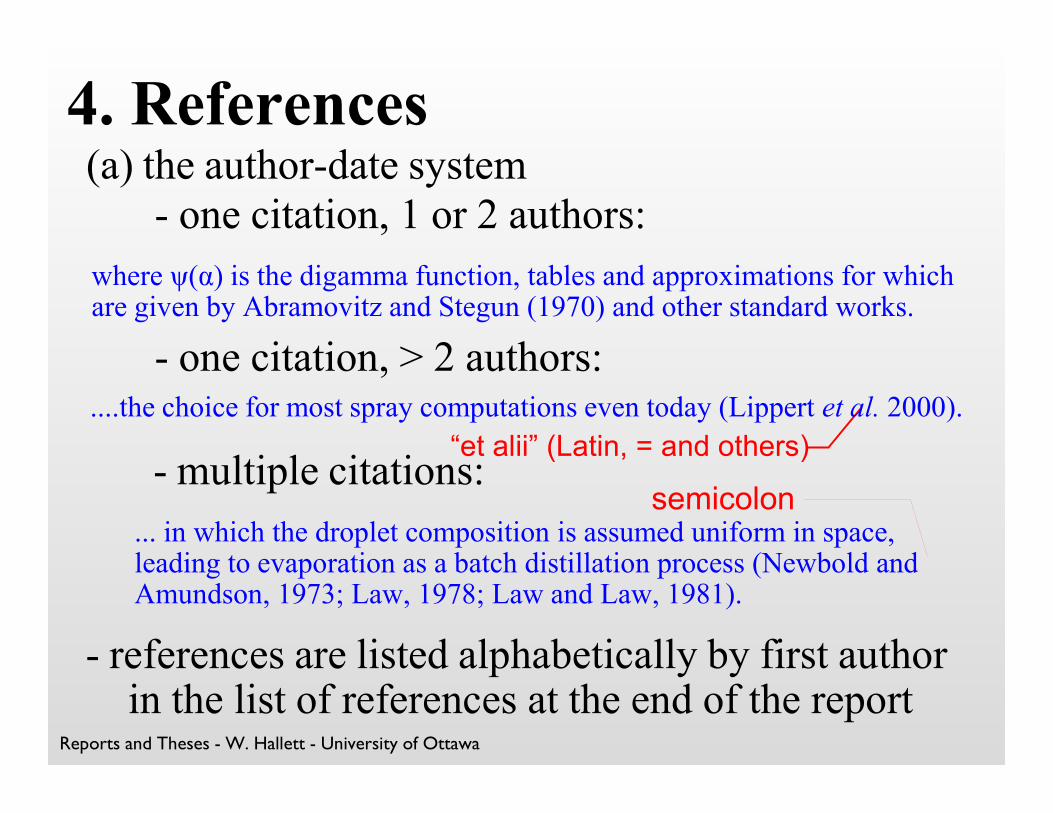
4. References(a) the author-date system
- one citation, 1 or 2 authors:
where ø(á) is the digamma function, tables and approximations for whichare given by Abramovitz and Stegun (1970) and other standard works.
- multiple citations:
... in which the droplet composition is assumed uniform in space,leading to evaporation as a batch distillation process (Newbold andAmundson, 1973; Law, 1978; Law and Law, 1981).
- references are listed alphabetically by first authorin the list of references at the end of the report
semicolon
- one citation, > 2 authors:....the choice for most spray computations even today (Lippert et al. 2000).
“et alii” (Latin, = and others)
Reports and Theses - W. Hallett - University of Ottawa
4. References
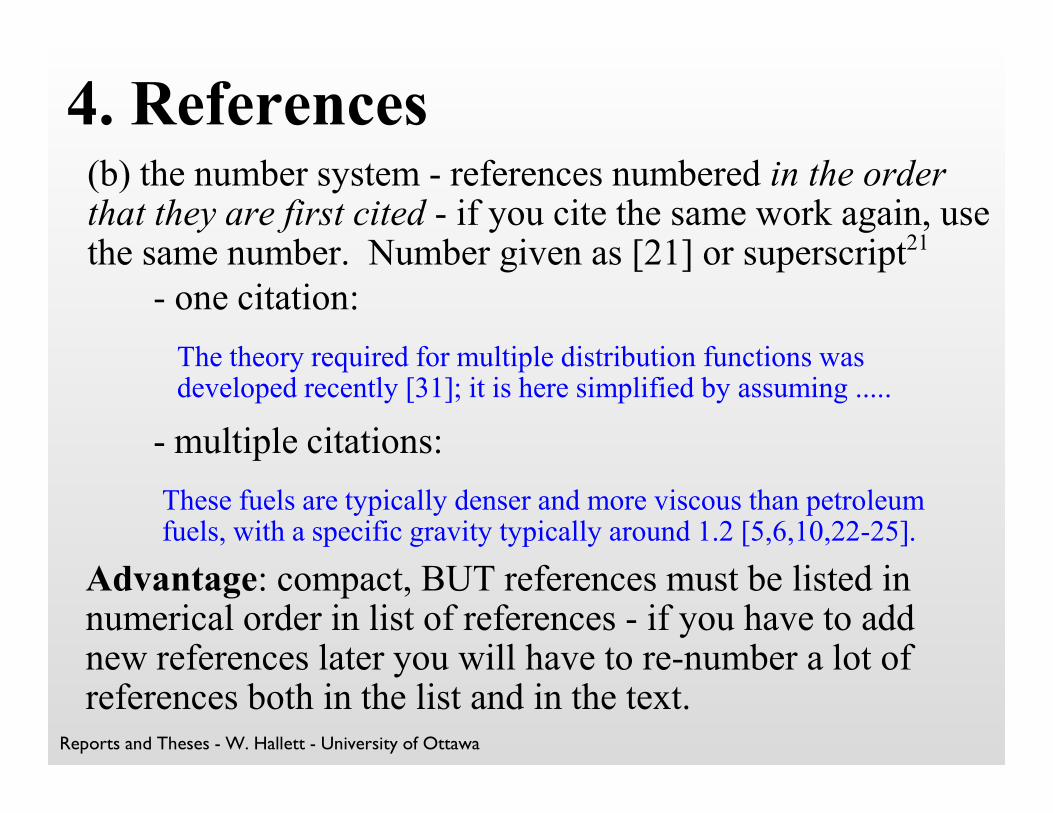
- one citation:
The theory required for multiple distribution functions wasdeveloped recently [31]; it is here simplified by assuming .....
- multiple citations:
Advantage: compact, BUT references must be listed innumerical order in list of references - if you have to addnew references later you will have to re-number a lot ofreferences both in the list and in the text.
These fuels are typically denser and more viscous than petroleumfuels, with a specific gravity typically around 1.2 [5,6,10,22-25].
(b) the number system - references numbered in the orderthat they are first cited - if you cite the same work again, usethe same number. Number given as [21] or superscript21
Reports and Theses - W. Hallett - University of Ottawa
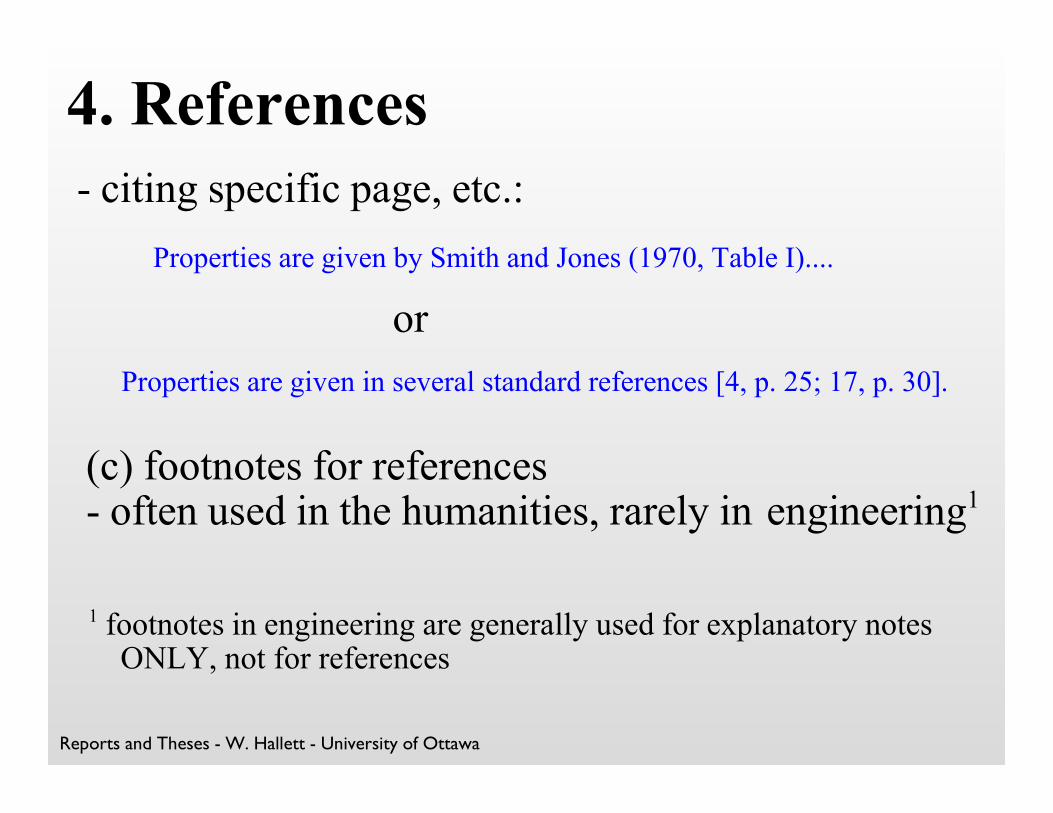
4. References- citing specific page, etc.:
Properties are given by Smith and Jones (1970, Table I)....
or
Properties are given in several standard references [4, p. 25; 17, p. 30].
(c) footnotes for references - often used in the humanities, rarely in engineering1
1 footnotes in engineering are generally used for explanatory notesONLY, not for references

Reports and Theses - W. Hallett - University of Ottawa
4. ReferencesList of references- list all references cited
- in alphabetical order (for author/date system); - or in numerical order (number system).
- ALL references listed must be cited in the text
Format- reference to paper in journal:
Smith, A., Jones, B., and Bloggs, W. (1993), High temperaturedecomposition of lab reports. Can. J. Chem. Eng 24, 36-44.
volume
pages
(exact format not critical - use that of a standardjournal in your area)
date
journal title - abbreviationssee Web of Science list

Reports and Theses - W. Hallett - University of Ottawa
4. ReferencesFormat- reference to paper in conference proceedings:
Blow, J., and Snow, M. (1996), Toxic emissions from incineration of labreports, Conference on Incineration, Toronto, p. 25-36.
- reference to manufacturer’s data:Standard Stoker Co. (1942), Instruction manual for the Standard BKstoker. New York.
Étudiante, A., and Schueler, M. (2001), Handbook of Lab ReportRecycling, University of Ottawa Press, Ottawa, Canada.
- reference to book:
- reference to verbal or private information:Mulroney, B. (1993), personal communication.
Reports and Theses - W. Hallett - University of Ottawa
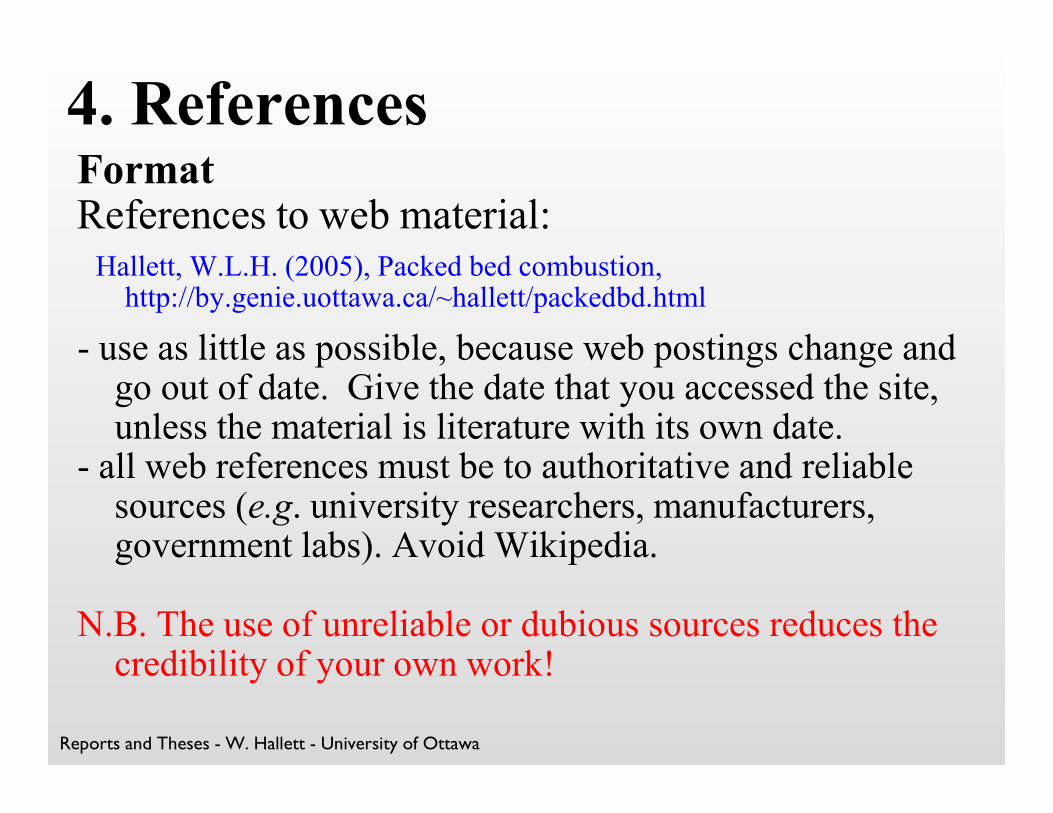
4. ReferencesFormatReferences to web material:
Hallett, W.L.H. (2005), Packed bed combustion,http://by.genie.uottawa.ca/~hallett/packedbd.html
- use as little as possible, because web postings change andgo out of date. Give the date that you accessed the site,unless the material is literature with its own date.
- all web references must be to authoritative and reliablesources (e.g. university researchers, manufacturers,government labs). Avoid Wikipedia.
N.B. The use of unreliable or dubious sources reduces thecredibility of your own work!
Reports and Theses - W. Hallett - University of Ottawa
4. References
The “bottom line” for references is that readers mustbe able to easily find all material you have used.
Note: References � Bibliography. A bibliography lists worksfor further reading, which may or may not have been cited inthe report. MS Word makes this error automatically.

Reports and Theses - W. Hallett - University of Ottawa
5. Language and Style
1. Use the passive voice (”something was done”), not theactive (“I did something”), in a formal report
I measured the pressure with a capacitive transducerThe pressure was measured
We believed that droplets of this fuel would show disruptive burning.It was believed
2. Keep your personality out of it
I feel that I did an excellent job of conducting the experiment
this is for others to decide! Stick tofacts such as % error
avoid personal reactions
Reports and Theses - W. Hallett - University of Ottawa
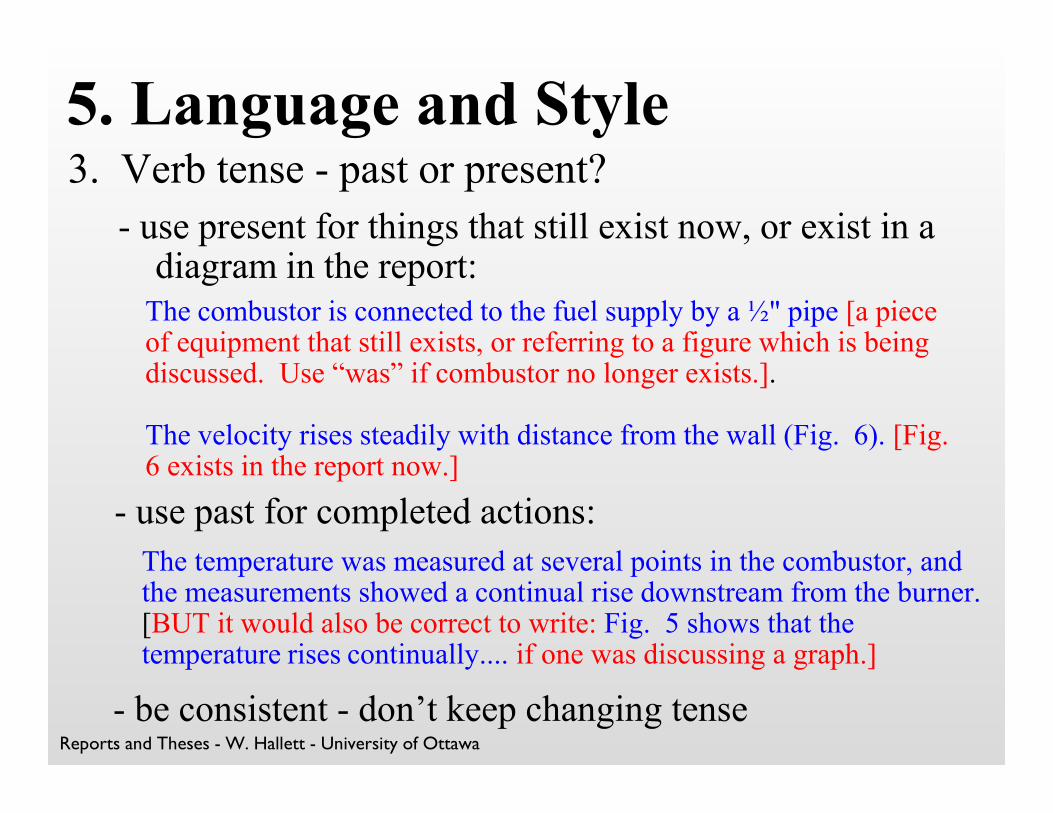
5. Language and Style3. Verb tense - past or present?
- use present for things that still exist now, or exist in adiagram in the report:
The combustor is connected to the fuel supply by a ½" pipe [a pieceof equipment that still exists, or referring to a figure which is beingdiscussed. Use “was” if combustor no longer exists.].
The velocity rises steadily with distance from the wall (Fig. 6). [Fig. 6 exists in the report now.]
- use past for completed actions:
The temperature was measured at several points in the combustor, andthe measurements showed a continual rise downstream from the burner.[BUT it would also be correct to write: Fig. 5 shows that thetemperature rises continually.... if one was discussing a graph.]
- be consistent - don’t keep changing tense

Reports and Theses - W. Hallett - University of Ottawa
5. Language and Style
4. Avoid excessive use of acronyms (unless veryfamiliar) and jargon. Define all acronyms in the textand in the nomenclature.
The output from the linear displacement transducer (LDT) went
through a low-pass filter (LPF) and a high frequency amplifier (HFA)
before being transmitted by coaxial shielded cable (CSC) to the data
acquisition system (DAQ). The LDT, LPF and HFA were designed
and built in-house, while the CSC and the DAQ were purchased from
Acme Circuits.
transducer, filter and amplifier
cable
Reports and Theses - W. Hallett - University of Ottawa
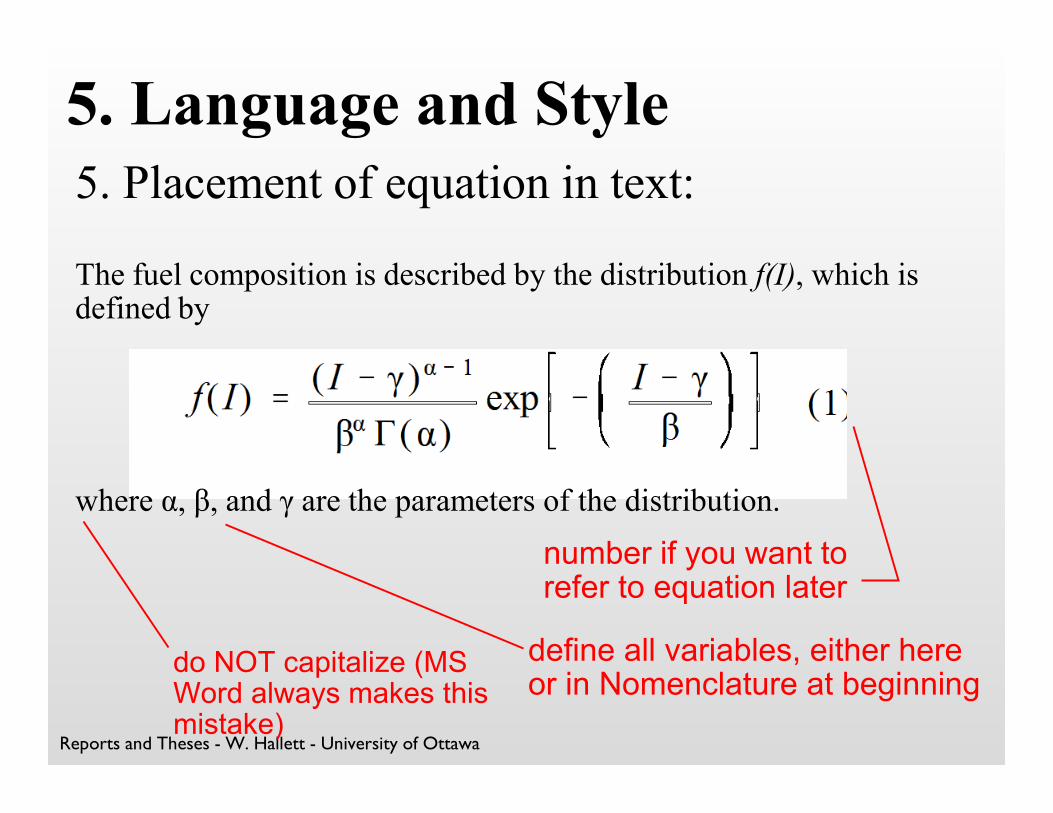
The fuel composition is described by the distribution f(I), which isdefined by
where á, â, and ã are the parameters of the distribution.
5. Placement of equation in text:
do NOT capitalize (MSWord always makes thismistake)
define all variables, either hereor in Nomenclature at beginning
number if you want torefer to equation later
5. Language and Style
Reports and Theses - W. Hallett - University of Ottawa
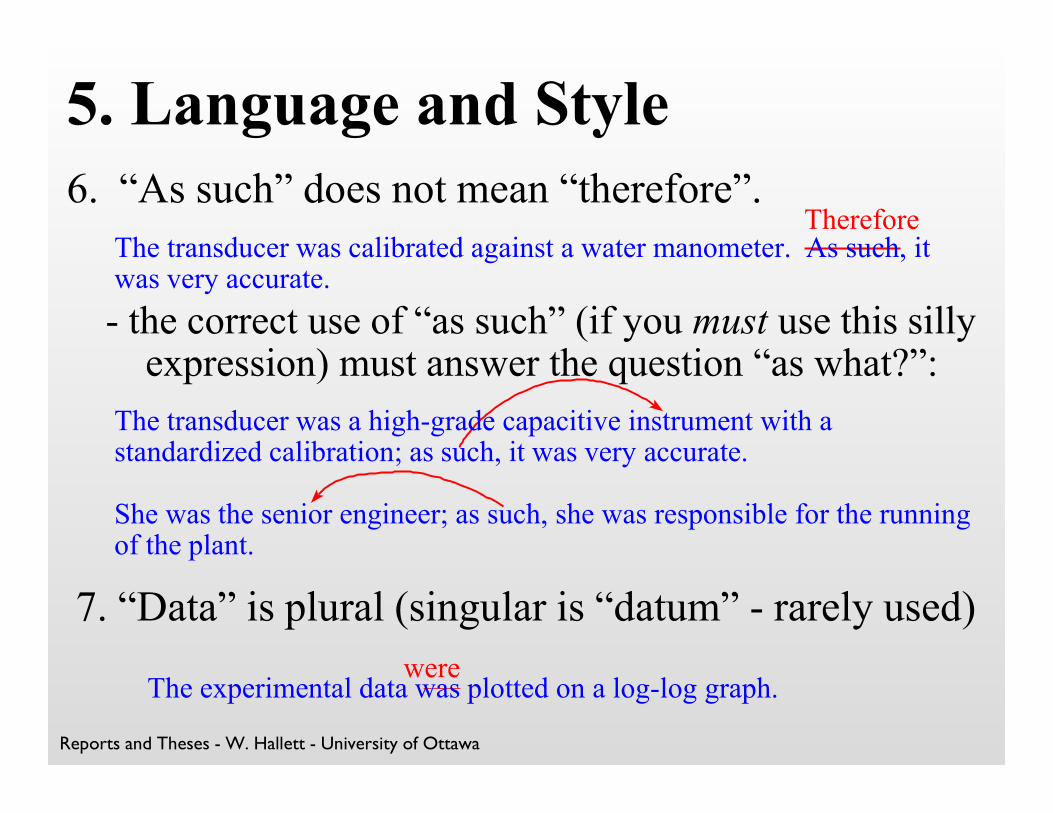
6. “As such” does not mean “therefore”.
The transducer was calibrated against a water manometer. As such, itwas very accurate.
Therefore
The transducer was a high-grade capacitive instrument with astandardized calibration; as such, it was very accurate.
- the correct use of “as such” (if you must use this sillyexpression) must answer the question “as what?”:
7. “Data” is plural (singular is “datum” - rarely used)
The experimental data was plotted on a log-log graph. were
She was the senior engineer; as such, she was responsible for the runningof the plant.
5. Language and Style
Reports and Theses - W. Hallett - University of Ottawa
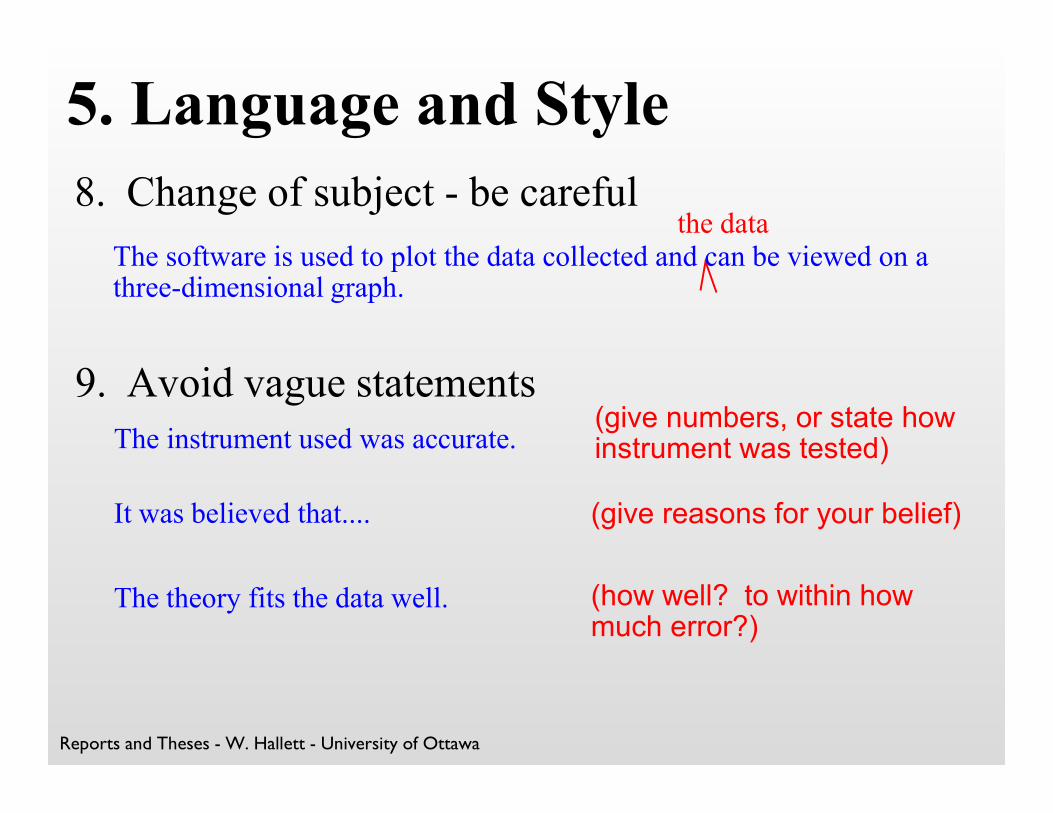
8. Change of subject - be careful
The software is used to plot the data collected and can be viewed on athree-dimensional graph.
the data
9. Avoid vague statementsThe instrument used was accurate.
(give numbers, or state howinstrument was tested)
5. Language and Style
It was believed that.... (give reasons for your belief)
The theory fits the data well. (how well? to within howmuch error?)

Reports and Theses - W. Hallett - University of Ottawa
5. Language and Style
10. Incorrect use of “like”
It looks like the transducer is defective.as if (“like” is not a conjunction, cannot be used to start a clause)
He was like ...He said...
It looks like a defective transducer.
but this is OK (used as a preposition):
For extensive discussion of style, see series in Can. J. Chem. Eng.: (2015), 93, 1889-1890, 2095-2097;
and (2016) 94, 3- 6, 205-208, 405-407, 713-715.

Reports and Theses - W. Hallett - University of Ottawa
Happy writing!
www.dilbert.com


![STYLE GUIDE FOR THESES, DISSERTATIONS AND RESEARCH REPORTS · FACULT Style Guide for Theses, Dissertations and Research Reports 10 11 DECLARATION I [Name of candidate] declare that](https://static.fdocuments.us/doc/165x107/5f10a4e67e708231d44a1ea0/style-guide-for-theses-dissertations-and-research-facult-style-guide-for-theses.jpg)