WP 151 - Belloni, Brugiavini, Meschi, Tijdens · Page 4 Michele Belloni, Agar Brugiavini, Elena...
46
University of Amsterdam AIAS Measurement error in occupational coding: an analysis on SHARE data Michele Belloni, Agar Brugiavini, Elena Meschi and Kea Tijdens Working Paper 151 November 2014 AIAS Amsterdam Institute for Advanced labour Studies
Transcript of WP 151 - Belloni, Brugiavini, Meschi, Tijdens · Page 4 Michele Belloni, Agar Brugiavini, Elena...
University of AmsterdamAIAS
Measurement error in occupational coding: an analysis on SHARE data
Michele Belloni, Agar Brugiavini, Elena Meschi and Kea Tijdens
Working Paper 151November 2014
AIASAmsterdam Institute for
Advanced labour Studies
Acknowledgments
This paper builds on research work done for the DASISH project (Data Service Infrastructure for Social Sciences and Humanities, funded by EU-FP7, Contract no. 283646) and the SHARE project (Survey of Health, Ageing and Retirement in Europe). The authors are grateful to researchers at CentERdata in the Netherlands for their coding efforts of Dutch job titles. The authors would like to thank Eric Balster, Peter Elias, Eric Harrison, Maurice Martens, Sue Westerman, and all participants of “CASCOT: Occupational Coding in Multi-national Surveys” Workshop in Venice (10-11 April 2014) for helpful suggestions on earlier draft of this work. This paper benefi ted from a research visit of Michele Belloni to the University of Am-sterdam, made possible through a visiting grant of the InGRID project (Inclusive Growth Infrastructure Diffusion Research Infrastructure, funded by EU-FP7, Contract no. 312691). The last author would like to acknowledge the contribution of WEBDATANET [COST Action IS1004].
This paper uses data from SHARE wave 1 release 2.5.0, as of August 23th 2011. The SHARE data collection has been primarily funded by the European Commission through the 5th Framework Programme (project QLK6-CT-2001-00360 in the thematic programme Quality of Life), through the 6th Framework Programme (projects SHARE-I3, RII-CT-2006-062193, COMPARE, CIT5-CT-2005-028857, and SHARELIFE, CIT4-CT-2006-028812) and through the 7th Framework Programme (SHARE-PREP, N° 211909, SHARE-LEAP, N° 227822 and SHARE M4, N° 261982). Additional funding from the U.S. National Institute on Aging (U01 AG09740-13S2, P01 AG005842, P01 AG08291, P30 AG12815, R21 AG025169, Y1-AG-4553-01, IAG BSR06-11 and OGHA 04-064)and the German Ministry of Education and Research as well as from various national sources is gratefully acknowledged (see www.share-project.org for a full list of funding institutions).”
November 2014© Michele Belloni, Agar Brugiavini, Elena Meschi and Kea Tijdens
General contact: [email protected]
Michele Belloni Agar BrugiaviniDepartment of Economics, Department of EconomicsUniversity Ca’ Foscari of Venice University Ca’ Foscari of VeniceS. Giobbe, Cannaregio, 873 S. Giobbe, Cannaregio, 87330121 Venice 30121 VeniceItaly [email protected] [email protected]
Elena Meschi Kea TijdensDepartment of Economics University of AmsterdamUniversity Ca’ Foscari of Venice Amsterdam Institute for Advanced Labour Studies (AIAS)S. Giobbe, Cannaregio, 873 Postbus 9402530121 Venice 1090 GA AmsterdamItaly The [email protected] [email protected] Tel + 31 20 525 4347Bibliographical informationBelloni, M., Brugiavini, A., Meschi, E. and Tijdens, K. (2014). Measurement error in occupational coding: an analysis on SHARE data. Universiteit van Amsterdam, AIAS Working Paper 151.
ISSN online: 2213-4980ISSN print: 1570-3185
Information may be quoted provided the source is stated accurately and clearly. Reproduction for own/internal use is permitted. This paper can be downloaded from our website www.uva-aias.net under the section: Publications/Working papers.
Measurement error in occupational coding:
an analysis on SHARE data
WEBDATANET working paper
WP 151
Michele Belloni
Department of Economics, University Ca’ Foscari of Venice
Agar Brugiavini
Department of Economics, University Ca’ Foscari of Venice
Elena Meschi
Department of Economics, University Ca’ Foscari of Venice
Kea Tijdens
University of Amsterdam / Amsterdam Institute for Advanced
Labour Studies (AIAS)

Page ● 4
Michele Belloni, Agar Brugiavini, Elena Meschi and Kea Tijdens
AIAS WP 151 ● www.uva-aias.net
Page ● 5
Measurement error in occupational coding: an analysis on SHARE data
AIAS WP 151 ● www.uva-aias.net
Table of contentsABSTRACT .....................................................................................................................................7
1 INTRODUCTION ........................................................................................................................9
2 CODING OCCUPATIONS IN SURVEY DATA: ALTERNATIVE METHODS .......................................................11
3 DATA AND EMPIRICAL STRATEGY ................................................................................................15
4 RESULTS ...............................................................................................................................19
4.1 Descriptive statistics .................................................................................................................................19
4.2 Multivariate analysis ................................................................................................................................25
5 CONCLUSIONS .......................................................................................................................29
REFERENCES ................................................................................................................................31
APPENDIX ...................................................................................................................................33
AIAS WORKING PAPERS ...............................................................................................................................................37

Page ● 6
Michele Belloni, Agar Brugiavini, Elena Meschi and Kea Tijdens
AIAS WP 151 ● www.uva-aias.net

Page ● 7
Measurement error in occupational coding: an analysis on SHARE data
AIAS WP 151 ● www.uva-aias.net
Abstract
This article studies the potential measurement errors when coding occupational data. The quality of oc-
cupational data is important but often neglected. We recoded open-ended questions on occupation for last
and current job in the Dutch SHARE data, using the CASCOT ex-post coding software. The disagreement
rate, defi ned as the percentage of observations coded differently in SHARE and CASCOT, is high even
when compared at ISCO 1-digit level (33.7% for last job and 40% for current job). This fi nding is striking,
considering our conservative approach to exclude vague and incomplete answers. The level of miscoding
should thus be considered as a lower bound of the “true” miscoding. This highlights the complexity of
occupational coding and suggest that measurement errors due to miscoding should be taken into account
when making statistical analysis or writing econometric models. We tested whether the measurement error is
random or correlated to individual or job-related characteristics, and we found that the measurement error
is indeed more evident in ISCO-88 groups 1 and 3 and is more pronounced for higher educated individuals
and males. These groups may be sorted in occupations that are intrinsically more diffi cult to be classifi ed, or
education and gender may affect the way people describe their jobs.
Keywords
Disagreement rate; ISCO; coding software; gender; education

Page ● 8
Michele Belloni, Agar Brugiavini, Elena Meschi and Kea Tijdens
AIAS WP 151 ● www.uva-aias.net

Page ● 9
Measurement error in occupational coding: an analysis on SHARE data
AIAS WP 151 ● www.uva-aias.net
1 Introduction
Knowledge of individuals’ occupation is an important information for many studies in social sciences.
For instance in economics, sociology, and other disciplines occupation is often considered, either itself or
as part of an index, as a proxy for socioeconomic status. In labour economics, occupation is a key variable
in a wide strand of studies, such as the “task approach” to labour markets and job polarization (e.g. Autor
2013; Autor, Kats and Kearney 2006; Goos and Manning 2007), the defi nition of skill mismatch and over-
education (for extensive overview of this literature e.g. Hartog 2000; Leuven and Oosterbeek 2011), and
analysis of the effect of occupation on health status (e.g. Fletcher et al. 2011; Ravesteijn et al. 2013).
In this literature the quality of occupational data is hardly discussed, despite the fact that measuring oc-
cupation in social surveys is a rather complex issue. Handbooks detail how to ask for occupation in Labour
Force Surveys and Censuses, among others by international organizations such as the International Labour
Organization (e.g. ILO, 2010). However, empirical research on best practices and on miscoding is little. The
diffi culty to provide researchers with an accurate measure of occupation fi rstly regards the choice of the
question(s) to include in the questionnaire and the related training to interviewers and then relates to the
conversion of job tiles, that are often recorded as open text fi eld into occupational codes.
The statistical agencies of 150 countries associated in the International Labour Organization (ILO),
a United Nations affi liate, have adopted the International Standard Classifi cation of Occupations (ISCO)
to harmonize the measurement of occupations. The fi rst classifi cation dates back to 1958, with updates
in 1968, 1988 and recently in 2008. The Commission of the European Communities (2009) has adopted
ISCO-08 as its occupational classifi cation, and the European statistical agency Eurostat has put effort in
supporting European countries in developing coding indexes for their occupation data collected in Labour
Force Surveys and similar surveys. In 2012 almost half of the 150 countries used ISCO with the other half
either not classifying occupations or maintaining an own classifi cation1.
The ILO provides a classifi cation and task descriptions for all 4-digit occupational units in ISCO2. The
task descriptions provide also a coding index, but only in English. Therefore, coding occupations becomes
particularly challenging in international surveys, such as the Survey of Health, Ageing and Retirement in Europe
(SHARE) and the European Social Survey (ESS), where the occupational codes should be fully comparable
across countries, because it is sometimes problematic for countries to map their specifi c occupations and
1 See http://unstats.un.org/unsd/cr/ctryreg/ctrylist2.asp2 For details, see http://www.ilo.org/public/english/bureau/stat/isco/
Page ● 10
Michele Belloni, Agar Brugiavini, Elena Meschi and Kea Tijdens
AIAS WP 151 ● www.uva-aias.net
job titles into the international ISCO categories. Researchers are often not aware of the complex prepara-
tory work behind occupational coding. They consider the published variable ‘occupation’ as free of error.
In this article we will fi rst point out that this might not be the case. In addition, we will test whether such
a measurement error in occupation is random or is instead correlated to some specifi c individual or job-
related characteristics. We suggest to take this potential measurement error in occupation into consideration
when making statistical analysis or writing econometric models.
To reach these aims, we conduct the following empirical analysis. We recode open-ended questions on
occupation for the Dutch sample of SHARE data using a well-known software for ex-post coding called
CASCOT. We then compare SHARE originally published with recoded occupational variables. Finally, we
analyse which individual characteristics (such as gender, education, or industry) are associated to the prob-
ability of different coding. The article proceeds as follows: Section 2 discusses the alternative methods used
to collect and code information on individuals’ occupations and describes the main features of CASCOT.
In section 3, we describe our empirical exercise and present the data and the methodology adopted. The
results of our analysis are presented and discussed in section 4. Finally, section 5 concludes and suggests
some directions for further research.
Page ● 11
Measurement error in occupational coding: an analysis on SHARE data
AIAS WP 151 ● www.uva-aias.net
2 Coding occupations in survey data: alternative methods
Most of occupational information in survey data is obtained from direct questions addressed to re-
spondents. The question about occupation is usually asked as an open text fi eld (e.g.: “What occupation did
you perform in your principal job during the week of … to … ?”) (see for an overview of survey questions
Tijdens 2014b). Occupation can also be asked using a tick list, where respondents have to self-classify in a
list of occupational titles. Depending on the survey mode, this list consists of a limited set of necessarily
broad occupational groups in mail surveys or lists of thousands of items in web surveys. The main advan-
tage with self-classifi cation (or self-coding) is that surveys do not need a costly and time-demanding coding
process. There are, however, many shortcomings with self-coding. A limited choice-set may result in lower
data quality, because it is diffi cult to assure consistency in how respondents fi t their own job titles into the
highly aggregated categories, thereby introducing aggregation bias (De Vries and Ganzeboom 2008). Both
the validity (correct categorization) and the reliability (same categorization made by different interviewers of
equivalent responses) of pre-coded occupational categories have been shown to be very poor. An extensive
look-up table with a search tree leads to drop-out in web-surveys, but this problem may be tackled in case
of text string matching (Tijdens 2014a). Promising attempts to code job titles during CAPI interviews are
being made, using a look-up table or coding index. SHARE is currently testing a semantic text string match-
ing algorithm developed by CentERdata (www.centerdata.nl/) for possible use in its future data collection.
Most surveys however still use an open-ended survey question with occupational coding (for question
design see Jackle 2008). In its handbook for the measurement of the active population in censuses the
ILO provides detailed instructions for the use of an open-ended questions and the ILO does not consider
self-coding as an alternative (ILO, 2010). Open-ended questions allow classifying occupations at a detailed
level of disaggregation, but the text fi elds require recoding afterwards (‘offi ce coding’). The classifi cation
of occupational information is in fact achieved through a coding process that converts the reported job
titles into a set of codes and that can be done manually or semi-automatically, using a computerised coding
system (‘computer assisted coding’) or by a combination of both. Manual coding requires a lot of training
for coders and coders supervisors (see Hoffmann, Elias, Embury and Thomas, 1995). Semi-automatic cod-
ing tools are becoming more and more reliable instruments using semantic matching with previously coded
occupations. Recently, machine learning algorithms appear to be a promising development, requiring a sub-

Page ● 12
Michele Belloni, Agar Brugiavini, Elena Meschi and Kea Tijdens
AIAS WP 151 ● www.uva-aias.net
stantial amount of manually coded occupations to be used as training data for the automatic classifi cation
(Bethmann et al 2014; Cheeseman Day 2014).
CASCOT is a software tool for coding text automatically or manually (http://www2.warwick.ac.uk/
fac/soc/ier/software/cascot/) developed at the Institute for Employment Research (IER) in 1993 and
since then continuously updated and used by over 100 organisations in the UK and abroad. The software
developed at IER is able to code job titles into UK various editions of Standard Occupational Classifi cation
(SOC) and International Standard Classifi cation of Occupations (ISCO)3. CASCOT software is coupled
with an editor which allows users to modify internal coding rules and allows the software to use alternative
occupational classifi cation structures.
A high quality coding requires high quality job descriptions. The recorded text should ideally contain
suffi cient information to distinguish it from alternative text descriptions which may be coded to other cat-
egories within the classifi cation, but it should not contain superfl uous words. This ideal will not always be
met but CASCOT has been designed to perform a complicated analysis of the words in the text, comparing
them to the words in the classifi cation, in order to provide a list of recommendations. If the input text is
not suffi ciently distinctive, it may not be the topmost recommendation that is the correct code. When CAS-
COT assigns a code to a piece of text, it also calculates a score from 1 to 100 which represents the degree
of certainty that the given code is the correct one. When CASCOT encounters a word or phrase that is de-
scriptive of occupation but lacks suffi cient information to distinguish it from other categories (i.e. without
any further qualifying terms) CASCOT will attempt to suggest a code but the score is limited to below 40
to indicate the uncertainty associated with the suggestion (for example cases like ‘Teacher’ or ‘Engineer’).
The performance of CASCOT has been compared to a selection of high quality manually coded data. The
overall results show that 80% of records receive a score greater than 40 and of these 80% are matched to
manually coded data. When using CASCOT one can expect this level of performance with similar data, but
the performance depends on the quality of input data. For more information about the software, see Elias
et al. (1992) and Jones and Elias (2004).
The user may run CASCOT in three different modes: fully automatic, semi-automatic, and manual or
one-by-one. The fully automatic mode does not require any human intervention once a list of job descrip-
tions is provided to the software: a series of corresponding codes plus the associated scores is produced;
if the software considers the quality of a given job description too low to be impossible for it to attribute
3 An international version of CASCOT, which will allow to code occupations in many languages and multi-national surveys, is under development within the EU fi nanced project DASISH (see www2.warwick.ac.uk/fac/soc/ier/software/cascot/inter-nat/).
Page ● 13
Measurement error in occupational coding: an analysis on SHARE data
AIAS WP 151 ● www.uva-aias.net
any reasonable code, it provides “no conclusion” for that specifi c text. The semi-automatic mode works by
setting a minimum score: in all cases in which CASCOT attributes a score greater than the minimum value,
it codes the text automatically; otherwise it asks for human intervention. The operator, in these cases, is
asked to choose manually between a list of recommendations. In manual mode, for each job description,
CASCOT provides a list of recommended codes with corresponding scores and leaves the fi nal choice of
the best code to the operator. Although time consuming, this mode ensures the maximum level of control
on the output. Obviously, the operator tends to choose the topmost recommendation when the score is high
and concentrates on the cases which show lower scores.
A Dutch version of CASCOT has been developed at Statistics Netherlands (CBS) building upon its
English version. Since 2012, this software (CASCOT-NL henceforth) has been used in the Netherlands to
code job titles in the most relevant social surveys including the Dutch Labor Force Survey. CASCOT-NL is
suitable for implementation in CAPI, CATI and CAWI-modes.
In this study, we use a version of CASCOT-NL which CBS used from 01-04-2012 until 01-04-2013 to
code job descriptions into 4-digits ISCO-08 in its Labour Force Survey. A noticeable difference between
CASCOT-UK and CASCOT-NL (so called “classifi cation fi le ISCO v1.1”) is that the latter includes a spe-
cial category for vague responses, called “99..”. This is because - once tagged in this way - these especially
problematic answers go through subsequent coding steps. These steps exploit information from additional
variables such as sector of work, individuals’ educational attainments and tasks and duties involved in the
job; fi nally, the most diffi cult cases are manually coded by a team of experts. See CBS (2012) and Westerman
(2014) for further details on CBS coding procedures.

Page ● 14
Michele Belloni, Agar Brugiavini, Elena Meschi and Kea Tijdens
AIAS WP 151 ● www.uva-aias.net
Page ● 15
Measurement error in occupational coding: an analysis on SHARE data
AIAS WP 151 ● www.uva-aias.net
3 Data and empirical strategy
Our analysis is based on SHARE data. SHARE is a cross-national longitudinal survey on health, socio-
economic status and social and family networks representative of the population aged 50 and over. Four
waves of SHARE are currently available. We focus on the fi rst wave of the data (collected in 2004-2005),
because this is the only one in which information on occupation was gathered through an open-ended ques-
tion. In particular, in SHARE wave 1 respondents were asked the following question: “What is your [main/
last] job called? Please give the exact name or title”. This question was asked to both employed/self-em-
ployed and retired/unemployed individuals (the latter conditional on having worked earlier in life). SHARE
also collects information on respondents’ second job, parents’ job and former partner’s job. Parents’ jobs are
intrinsically more diffi cult to code than respondents’ jobs because the former may have been excluded from
recent job classifi cations. There are very few observations for respondents’ second job and former partner’s
job. Thus, we exclude these additional variables from our analysis.
SHARE country teams manually coded the text strings on respondents job titles into ISCO-88 (COM)
- the International Standard Classifi cation of Occupations in place at that time. Each country team hired
and trained coders independently. Coders were asked to follow a protocol providing them with guidelines
on how to code “critical” jobs (e.g. managers in agriculture or teachers). These guidelines were partly com-
mon to all countries, and partly language-specifi c. SHARE coders made also use of ancillary information on
training and qualifi cations needed for the job (this last information was not included in the public release of
the data) and on the industry the respondent was working in, based on the question “What kind of business,
industry or services do you work in (that is, what do they make or do at the place where you work)?”. From
one side, SHARE coders were asked to code job descriptions at the maximum possible level of detail, i.e.
at 4-digit or ‘unit group’ ISCO-88 level. On the other side, they were suggested to code vague responses by
means of trailing zeros: this means that in case they were unsure if a given job description could have been
attributable to a given unit group, they should have attribute it to either a minor, sub-major or major group.
Two variables - one for “current main job” (ep016_) and one for “last job” (ep052_) - reporting generated
ISCO-88 codes were fi nally published (see p. 29 in http://www.share-project.org/fi leadmin/pdf_documen-
tation/SHARE_guide_release_2-6-0.pdf for further details).
Page ● 16
Michele Belloni, Agar Brugiavini, Elena Meschi and Kea Tijdens
AIAS WP 151 ● www.uva-aias.net
The fi rst wave of SHARE covers 11 European countries, plus Israel. Our recoding exercise exploits
only the Dutch sample of this wave, because CASCOT is currently available in two languages - English and
Dutch - and the English language is not present in SHARE data. To have more control over the recod-
ing process, we recoded job descriptions using CASCOT-NL in its manual mode with the assistance of a
Dutch-native language team of researchers at SHARE partner CentERdata (http://www.centerdata.nl/
en/home). As expected, disagreement rates with the topmost recommended code proposed by CASCOT
were almost negligible for highly scored job descriptions. For instance, for the last job variable, only 10 job
descriptions out of 968 to which CASCOT attributed a score higher than 80 were manually changed. Con-
sequently, had we run CASCOT in semi-automatic mode setting a minimum score equal to 80 would have
resulted in very similar codes.
Two main issues arise when comparing codes from SHARE and CASCOT-NL. The fi rst one is the
homogeneity of the classifi cation structure. SHARE Netherlands coded job descriptions in 3-digit ISCO-
88 (Note that all other countries coded jobs in ISCO-88 at 4-digit level, see above). CASCOT-NL codes, as
described earlier, to ISCO-08 4-digit level. We then homogenised the two sets of codes as follows. First, we
converted CASCOT-NL codes from ISCO-08 into ISCO-88 using offi cial correspondence table4. Unfortu-
nately, there is no one-to-one correspondence between ISCO-08 and ISCO-88, i.e. multiple ISCO-88 codes
are associated to the same 4-digit ISCO-08 code. In our data, this occurs for 220 individuals, i.e. 1/5 of the
sample. In these cases, we associate multiple ISCO-88 codes to the same job description. Considering the
issue of no one-to-one correspondence between different versions of ISCO, we state that a job description
has a “different code” if the ISCO-88 code attributed by SHARE coders is not equal to any of the ISCO-88
codes resulting from the conversion into ISCO-88 of the CASCOT-NL output. Otherwise, we state that
a job description has “same code”. Second, we only consider 3-digits. To sum up, we compare codes from
SHARE and CASCOT-NL in terms of 3-digit ISCO-88.
The second issue concerns coding vague and incomplete answers. As described earlier, SHARE coders
and CASCOT-NL follow two different approaches for these types of job descriptions: whereas CASCOT-
NL makes use of a separate category (“99..”), SHARE uses trailing zeros. As a result, vague and inadequate
responses could not be compared, and are excluded from the statistical analysis. We also exclude those an-
swers which were coded by CASCOT as “no conclusion”.
4 Available from http://www.ilo.org/public/english/bureau/stat/isco/isco08/index.htm
Page ● 17
Measurement error in occupational coding: an analysis on SHARE data
AIAS WP 151 ● www.uva-aias.net
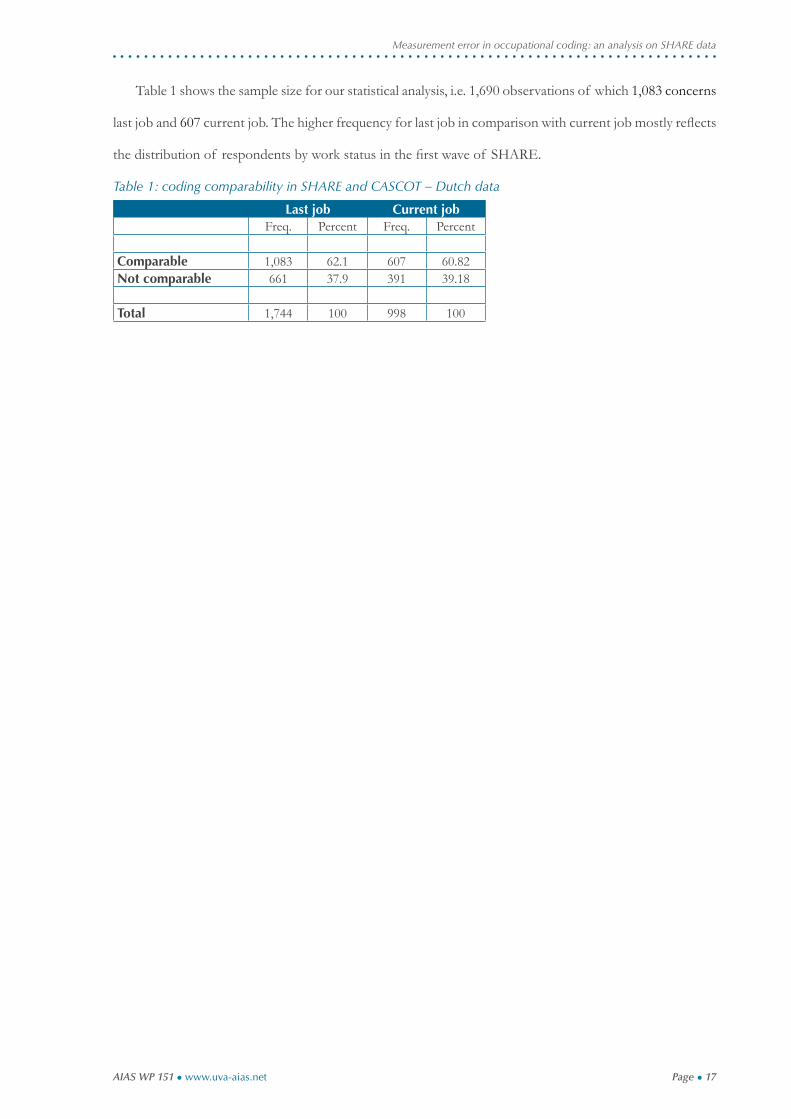
Table 1 shows the sample size for our statistical analysis, i.e. 1,690 observations of which 1,083 concerns
last job and 607 current job. The higher frequency for last job in comparison with current job mostly refl ects
the distribution of respondents by work status in the fi rst wave of SHARE.
Table 1: coding comparability in SHARE and CASCOT – Dutch data
Last job Current jobFreq. Percent Freq. Percent
Comparable 1,083 62.1 607 60.82Not comparable 661 37.9 391 39.18
Total 1,744 100 998 100

Page ● 18
Michele Belloni, Agar Brugiavini, Elena Meschi and Kea Tijdens
AIAS WP 151 ● www.uva-aias.net
Page ● 19
Measurement error in occupational coding: an analysis on SHARE data
AIAS WP 151 ● www.uva-aias.net
4 Results
4.1 Descriptive statistics
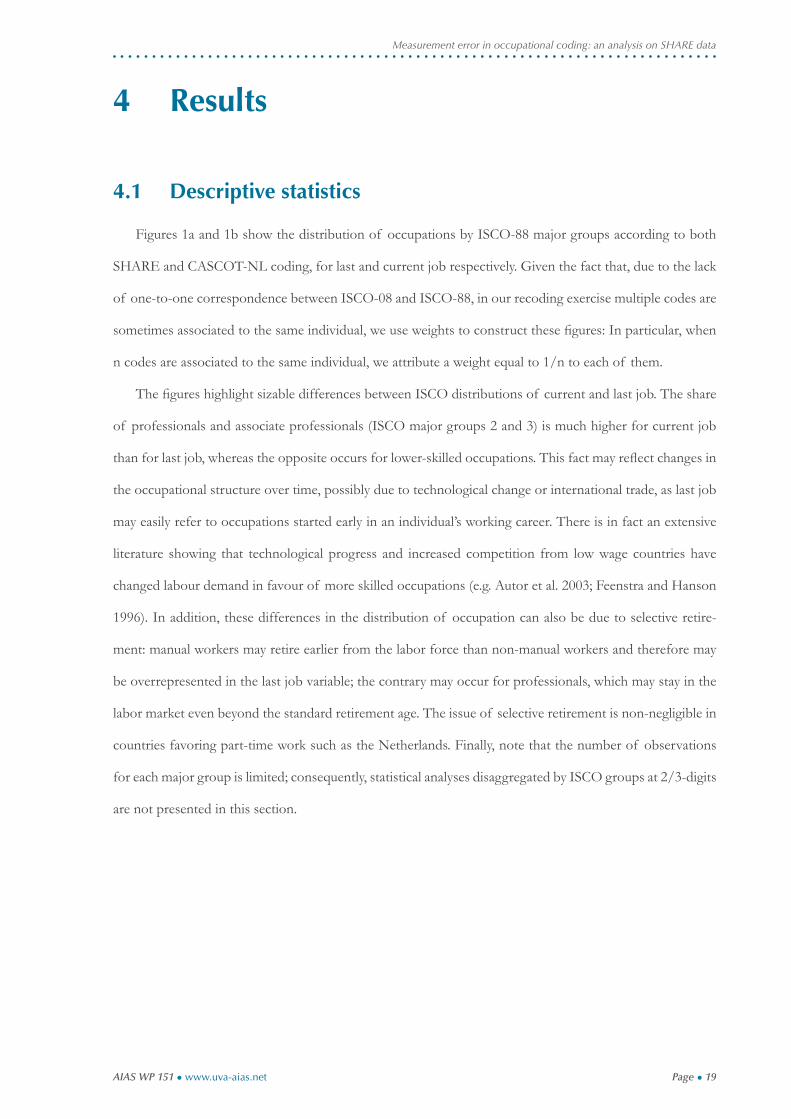
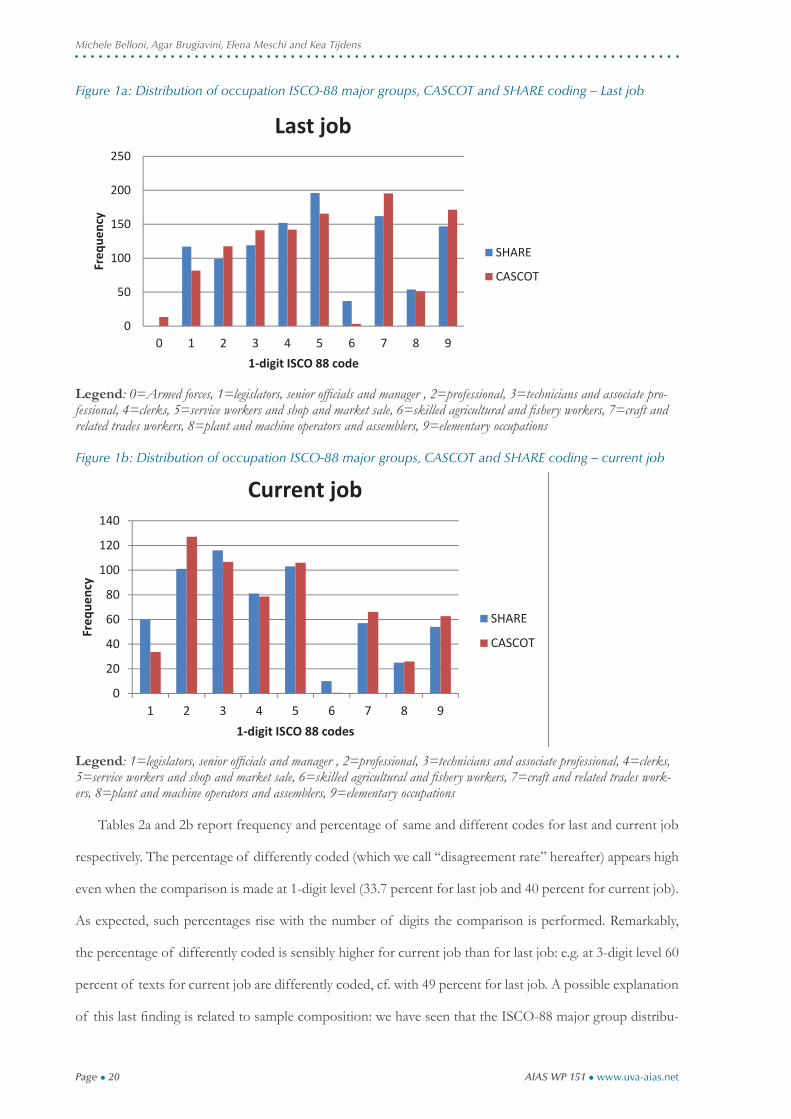
Figures 1a and 1b show the distribution of occupations by ISCO-88 major groups according to both
SHARE and CASCOT-NL coding, for last and current job respectively. Given the fact that, due to the lack
of one-to-one correspondence between ISCO-08 and ISCO-88, in our recoding exercise multiple codes are
sometimes associated to the same individual, we use weights to construct these fi gures: In particular, when
n codes are associated to the same individual, we attribute a weight equal to 1/n to each of them.
The fi gures highlight sizable differences between ISCO distributions of current and last job. The share
of professionals and associate professionals (ISCO major groups 2 and 3) is much higher for current job
than for last job, whereas the opposite occurs for lower-skilled occupations. This fact may refl ect changes in
the occupational structure over time, possibly due to technological change or international trade, as last job
may easily refer to occupations started early in an individual’s working career. There is in fact an extensive
literature showing that technological progress and increased competition from low wage countries have
changed labour demand in favour of more skilled occupations (e.g. Autor et al. 2003; Feenstra and Hanson
1996). In addition, these differences in the distribution of occupation can also be due to selective retire-
ment: manual workers may retire earlier from the labor force than non-manual workers and therefore may
be overrepresented in the last job variable; the contrary may occur for professionals, which may stay in the
labor market even beyond the standard retirement age. The issue of selective retirement is non-negligible in
countries favoring part-time work such as the Netherlands. Finally, note that the number of observations
for each major group is limited; consequently, statistical analyses disaggregated by ISCO groups at 2/3-digits
are not presented in this section.
Page ● 20
Michele Belloni, Agar Brugiavini, Elena Meschi and Kea Tijdens
AIAS WP 151 ● www.uva-aias.net
Figure 1a: Distribution of occupation ISCO-88 major groups, CASCOT and SHARE coding – Last job
0
50
100
150
200
250
0 1 2 3 4 5 6 7 8 9
Freq
uency
1 digit ISCO 88 code
Last job
SHARE
CASCOT
Legend: 0=Armed forces, 1=legislators, senior offi cials and manager , 2=professional, 3=technicians and associate pro-fessional, 4=clerks, 5=service workers and shop and market sale, 6=skilled agricultural and fi shery workers, 7=craft and related trades workers, 8=plant and machine operators and assemblers, 9=elementary occupations
Figure 1b: Distribution of occupation ISCO-88 major groups, CASCOT and SHARE coding – current job
0
20
40
60
80
100
120
140
1 2 3 4 5 6 7 8 9
Freq
uency
1 digit ISCO 88 codes
Current job
SHARE
CASCOT
Legend: 1=legislators, senior offi cials and manager , 2=professional, 3=technicians and associate professional, 4=clerks, 5=service workers and shop and market sale, 6=skilled agricultural and fi shery workers, 7=craft and related trades work-ers, 8=plant and machine operators and assemblers, 9=elementary occupations
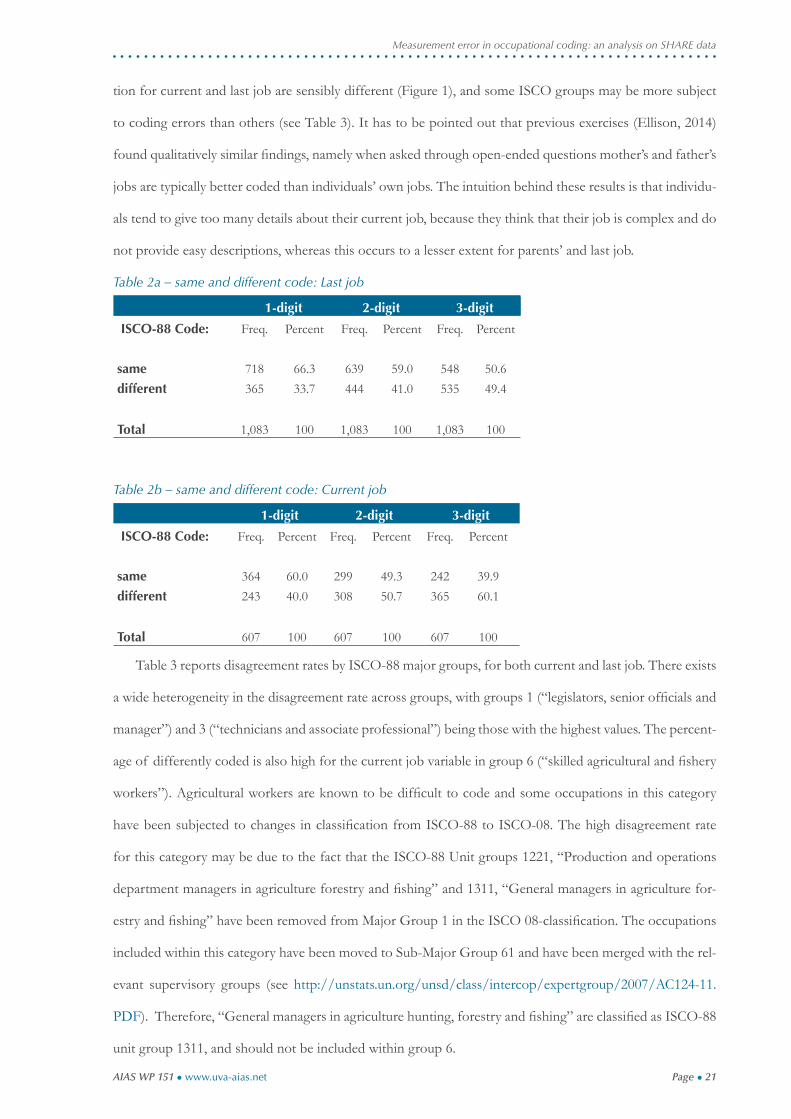
Tables 2a and 2b report frequency and percentage of same and different codes for last and current job
respectively. The percentage of differently coded (which we call “disagreement rate” hereafter) appears high
even when the comparison is made at 1-digit level (33.7 percent for last job and 40 percent for current job).
As expected, such percentages rise with the number of digits the comparison is performed. Remarkably,
the percentage of differently coded is sensibly higher for current job than for last job: e.g. at 3-digit level 60
percent of texts for current job are differently coded, cf. with 49 percent for last job. A possible explanation
of this last fi nding is related to sample composition: we have seen that the ISCO-88 major group distribu-
Page ● 21
Measurement error in occupational coding: an analysis on SHARE data
AIAS WP 151 ● www.uva-aias.net
tion for current and last job are sensibly different (Figure 1), and some ISCO groups may be more subject
to coding errors than others (see Table 3). It has to be pointed out that previous exercises (Ellison, 2014)
found qualitatively similar fi ndings, namely when asked through open-ended questions mother’s and father’s
jobs are typically better coded than individuals’ own jobs. The intuition behind these results is that individu-
als tend to give too many details about their current job, because they think that their job is complex and do
not provide easy descriptions, whereas this occurs to a lesser extent for parents’ and last job.
Table 2a – same and different code: Last job
1-digit 2-digit 3-digit
ISCO-88 Code: Freq. Percent Freq. Percent Freq. Percent
same 718 66.3 639 59.0 548 50.6different 365 33.7 444 41.0 535 49.4
Total 1,083 100 1,083 100 1,083 100
Table 2b – same and different code: Current job
1-digit 2-digit 3-digit
ISCO-88 Code: Freq. Percent Freq. Percent Freq. Percent
same 364 60.0 299 49.3 242 39.9different 243 40.0 308 50.7 365 60.1
Total 607 100 607 100 607 100
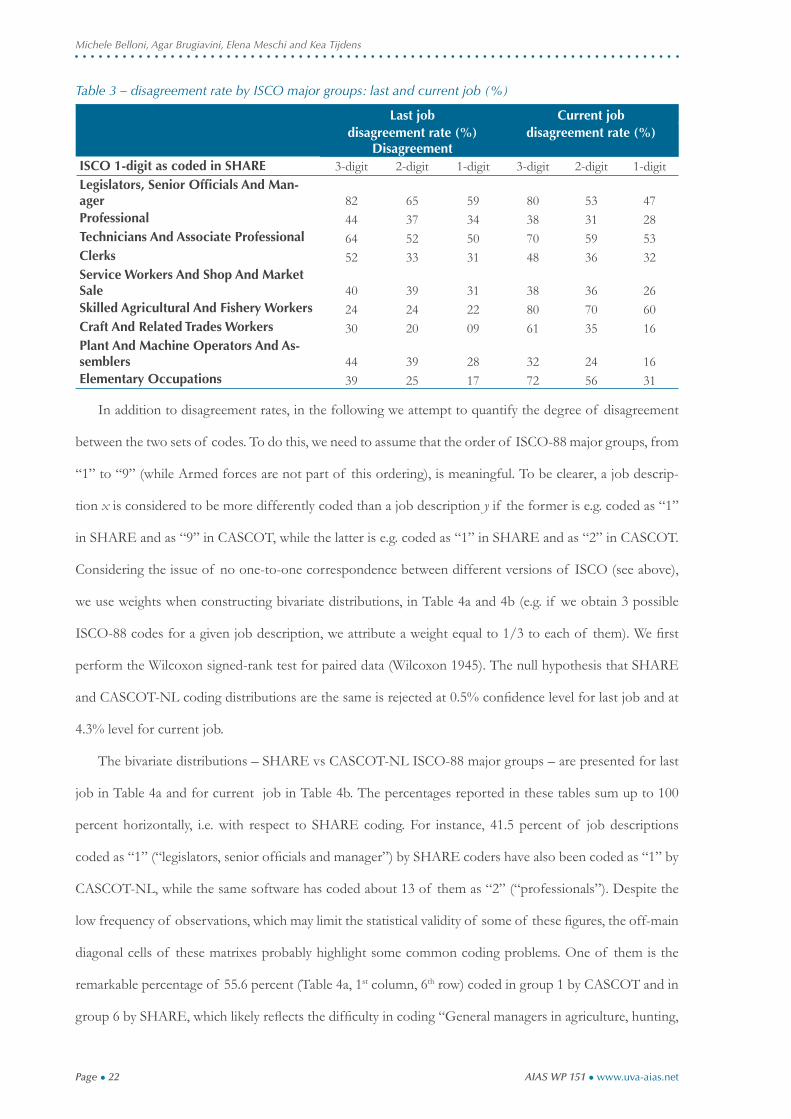
Table 3 reports disagreement rates by ISCO-88 major groups, for both current and last job. There exists
a wide heterogeneity in the disagreement rate across groups, with groups 1 (“legislators, senior offi cials and
manager”) and 3 (“technicians and associate professional”) being those with the highest values. The percent-
age of differently coded is also high for the current job variable in group 6 (“skilled agricultural and fi shery
workers”). Agricultural workers are known to be diffi cult to code and some occupations in this category
have been subjected to changes in classifi cation from ISCO-88 to ISCO-08. The high disagreement rate
for this category may be due to the fact that the ISCO-88 Unit groups 1221, “Production and operations
department managers in agriculture forestry and fi shing” and 1311, “General managers in agriculture for-
estry and fi shing” have been removed from Major Group 1 in the ISCO 08-classifi cation. The occupations
included within this category have been moved to Sub-Major Group 61 and have been merged with the rel-
evant supervisory groups (see http://unstats.un.org/unsd/class/intercop/expertgroup/2007/AC124-11.
PDF). Therefore, “General managers in agriculture hunting, forestry and fi shing” are classifi ed as ISCO-88
unit group 1311, and should not be included within group 6.
Page ● 22
Michele Belloni, Agar Brugiavini, Elena Meschi and Kea Tijdens
AIAS WP 151 ● www.uva-aias.net
Table 3 – disagreement rate by ISCO major groups: last and current job (%)
Last job Current jobdisagreement rate (%)
Disagreementdisagreement rate (%)
ISCO 1-digit as coded in SHARE 3-digit 2-digit 1-digit 3-digit 2-digit 1-digit Legislators, Senior Offi cials And Man-ager 82 65 59 80 53 47 Professional 44 37 34 38 31 28 Technicians And Associate Professional 64 52 50 70 59 53 Clerks 52 33 31 48 36 32 Service Workers And Shop And Market Sale 40 39 31 38 36 26 Skilled Agricultural And Fishery Workers 24 24 22 80 70 60 Craft And Related Trades Workers 30 20 09 61 35 16 Plant And Machine Operators And As-semblers 44 39 28 32 24 16 Elementary Occupations 39 25 17 72 56 31
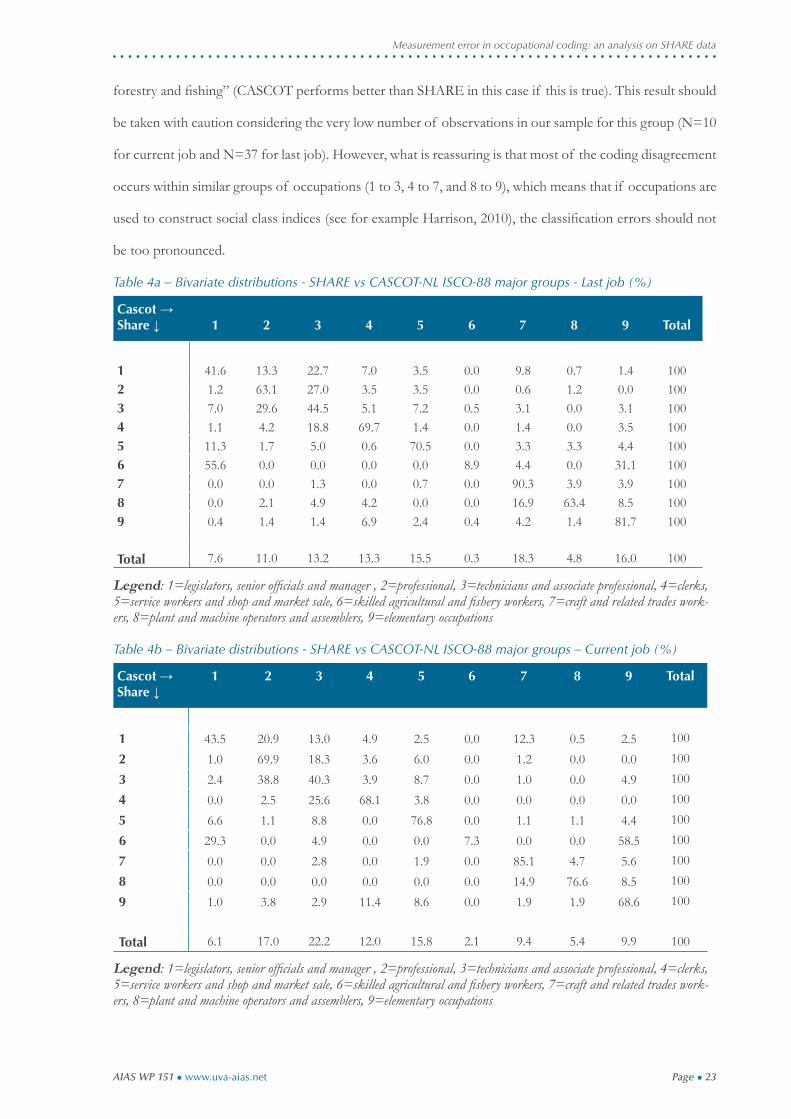
In addition to disagreement rates, in the following we attempt to quantify the degree of disagreement
between the two sets of codes. To do this, we need to assume that the order of ISCO-88 major groups, from
“1” to “9” (while Armed forces are not part of this ordering), is meaningful. To be clearer, a job descrip-
tion x is considered to be more differently coded than a job description y if the former is e.g. coded as “1”
in SHARE and as “9” in CASCOT, while the latter is e.g. coded as “1” in SHARE and as “2” in CASCOT.
Considering the issue of no one-to-one correspondence between different versions of ISCO (see above),
we use weights when constructing bivariate distributions, in Table 4a and 4b (e.g. if we obtain 3 possible
ISCO-88 codes for a given job description, we attribute a weight equal to 1/3 to each of them). We fi rst
perform the Wilcoxon signed-rank test for paired data (Wilcoxon 1945). The null hypothesis that SHARE
and CASCOT-NL coding distributions are the same is rejected at 0.5% confi dence level for last job and at
4.3% level for current job.
The bivariate distributions – SHARE vs CASCOT-NL ISCO-88 major groups – are presented for last
job in Table 4a and for current job in Table 4b. The percentages reported in these tables sum up to 100
percent horizontally, i.e. with respect to SHARE coding. For instance, 41.5 percent of job descriptions
coded as “1” (“legislators, senior offi cials and manager”) by SHARE coders have also been coded as “1” by
CASCOT-NL, while the same software has coded about 13 of them as “2” (“professionals”). Despite the
low frequency of observations, which may limit the statistical validity of some of these fi gures, the off-main
diagonal cells of these matrixes probably highlight some common coding problems. One of them is the
remarkable percentage of 55.6 percent (Table 4a, 1st column, 6th row) coded in group 1 by CASCOT and in
group 6 by SHARE, which likely refl ects the diffi culty in coding “General managers in agriculture, hunting,
Page ● 23
Measurement error in occupational coding: an analysis on SHARE data
AIAS WP 151 ● www.uva-aias.net
forestry and fi shing” (CASCOT performs better than SHARE in this case if this is true). This result should
be taken with caution considering the very low number of observations in our sample for this group (N=10
for current job and N=37 for last job). However, what is reassuring is that most of the coding disagreement
occurs within similar groups of occupations (1 to 3, 4 to 7, and 8 to 9), which means that if occupations are
used to construct social class indices (see for example Harrison, 2010), the classifi cation errors should not
be too pronounced.
Table 4a – Bivariate distributions - SHARE vs CASCOT-NL ISCO-88 major groups - Last job (%)
Cascot → Share ↓ 1 2 3 4 5 6 7 8 9 Total
1 41.6 13.3 22.7 7.0 3.5 0.0 9.8 0.7 1.4 1002 1.2 63.1 27.0 3.5 3.5 0.0 0.6 1.2 0.0 1003 7.0 29.6 44.5 5.1 7.2 0.5 3.1 0.0 3.1 1004 1.1 4.2 18.8 69.7 1.4 0.0 1.4 0.0 3.5 1005 11.3 1.7 5.0 0.6 70.5 0.0 3.3 3.3 4.4 1006 55.6 0.0 0.0 0.0 0.0 8.9 4.4 0.0 31.1 1007 0.0 0.0 1.3 0.0 0.7 0.0 90.3 3.9 3.9 1008 0.0 2.1 4.9 4.2 0.0 0.0 16.9 63.4 8.5 1009 0.4 1.4 1.4 6.9 2.4 0.4 4.2 1.4 81.7 100
Total 7.6 11.0 13.2 13.3 15.5 0.3 18.3 4.8 16.0 100
Legend: 1=legislators, senior offi cials and manager , 2=professional, 3=technicians and associate professional, 4=clerks, 5=service workers and shop and market sale, 6=skilled agricultural and fi shery workers, 7=craft and related trades work-ers, 8=plant and machine operators and assemblers, 9=elementary occupations
Table 4b – Bivariate distributions - SHARE vs CASCOT-NL ISCO-88 major groups – Current job (%)
Cascot →Share ↓
1 2 3 4 5 6 7 8 9 Total
1 43.5 20.9 13.0 4.9 2.5 0.0 12.3 0.5 2.5 1002 1.0 69.9 18.3 3.6 6.0 0.0 1.2 0.0 0.0 1003 2.4 38.8 40.3 3.9 8.7 0.0 1.0 0.0 4.9 1004 0.0 2.5 25.6 68.1 3.8 0.0 0.0 0.0 0.0 1005 6.6 1.1 8.8 0.0 76.8 0.0 1.1 1.1 4.4 1006 29.3 0.0 4.9 0.0 0.0 7.3 0.0 0.0 58.5 1007 0.0 0.0 2.8 0.0 1.9 0.0 85.1 4.7 5.6 1008 0.0 0.0 0.0 0.0 0.0 0.0 14.9 76.6 8.5 1009 1.0 3.8 2.9 11.4 8.6 0.0 1.9 1.9 68.6 100
Total 6.1 17.0 22.2 12.0 15.8 2.1 9.4 5.4 9.9 100
Legend: 1=legislators, senior offi cials and manager , 2=professional, 3=technicians and associate professional, 4=clerks, 5=service workers and shop and market sale, 6=skilled agricultural and fi shery workers, 7=craft and related trades work-ers, 8=plant and machine operators and assemblers, 9=elementary occupations
Page ● 24
Michele Belloni, Agar Brugiavini, Elena Meschi and Kea Tijdens
AIAS WP 151 ● www.uva-aias.net
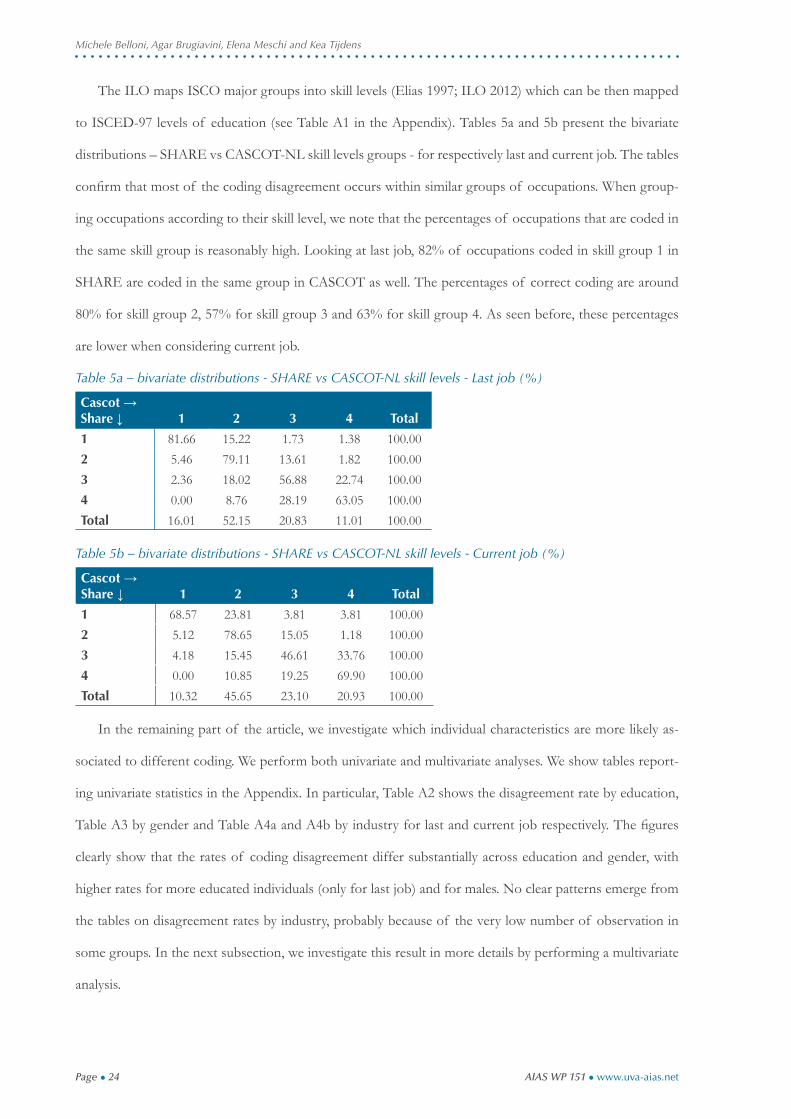
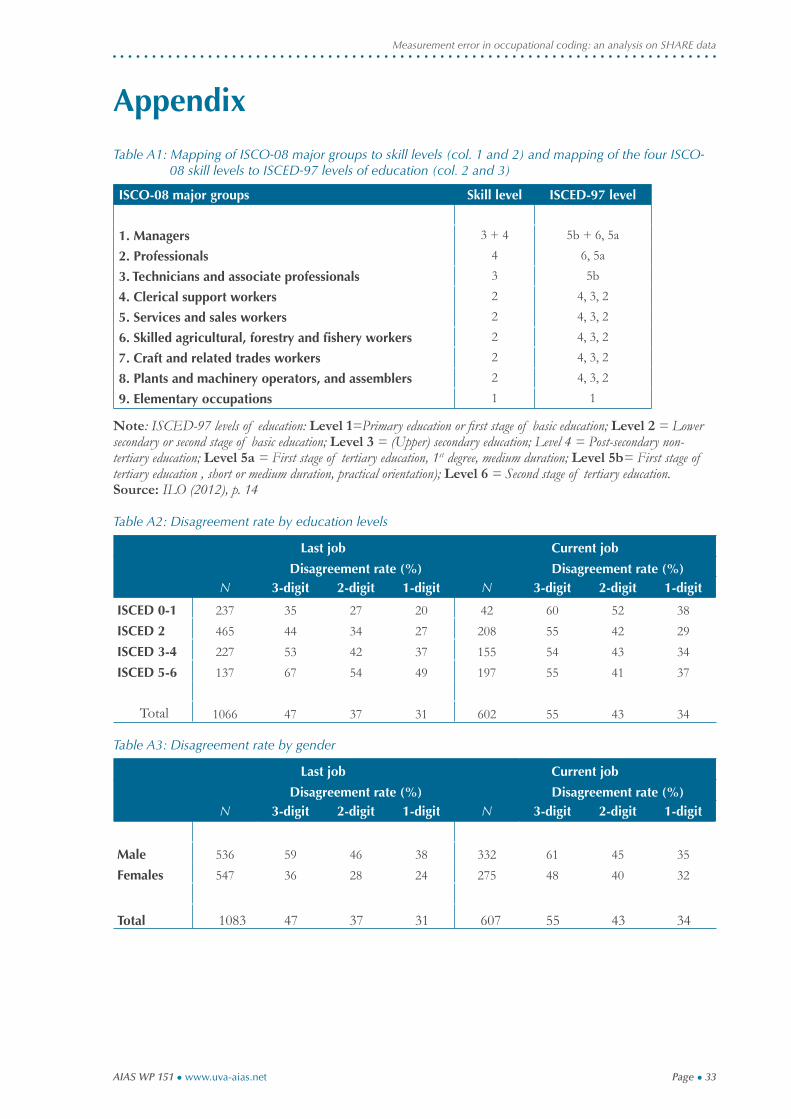
The ILO maps ISCO major groups into skill levels (Elias 1997; ILO 2012) which can be then mapped
to ISCED-97 levels of education (see Table A1 in the Appendix). Tables 5a and 5b present the bivariate
distributions – SHARE vs CASCOT-NL skill levels groups - for respectively last and current job. The tables
confi rm that most of the coding disagreement occurs within similar groups of occupations. When group-
ing occupations according to their skill level, we note that the percentages of occupations that are coded in
the same skill group is reasonably high. Looking at last job, 82% of occupations coded in skill group 1 in
SHARE are coded in the same group in CASCOT as well. The percentages of correct coding are around
80% for skill group 2, 57% for skill group 3 and 63% for skill group 4. As seen before, these percentages
are lower when considering current job.
Table 5a – bivariate distributions - SHARE vs CASCOT-NL skill levels - Last job (%)
Cascot →Share ↓ 1 2 3 4 Total
1 81.66 15.22 1.73 1.38 100.002 5.46 79.11 13.61 1.82 100.003 2.36 18.02 56.88 22.74 100.004 0.00 8.76 28.19 63.05 100.00Total 16.01 52.15 20.83 11.01 100.00
Table 5b – bivariate distributions - SHARE vs CASCOT-NL skill levels - Current job (%)
Cascot →Share ↓ 1 2 3 4 Total
1 68.57 23.81 3.81 3.81 100.002 5.12 78.65 15.05 1.18 100.003 4.18 15.45 46.61 33.76 100.004 0.00 10.85 19.25 69.90 100.00Total 10.32 45.65 23.10 20.93 100.00
In the remaining part of the article, we investigate which individual characteristics are more likely as-
sociated to different coding. We perform both univariate and multivariate analyses. We show tables report-
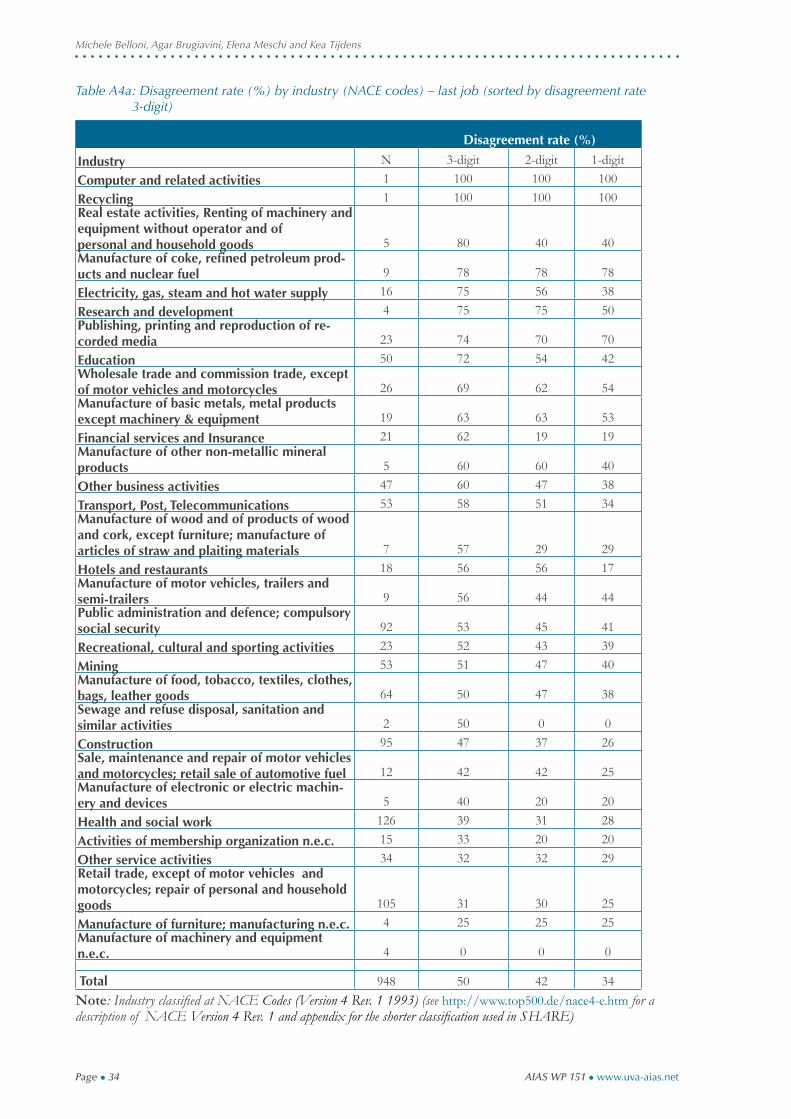
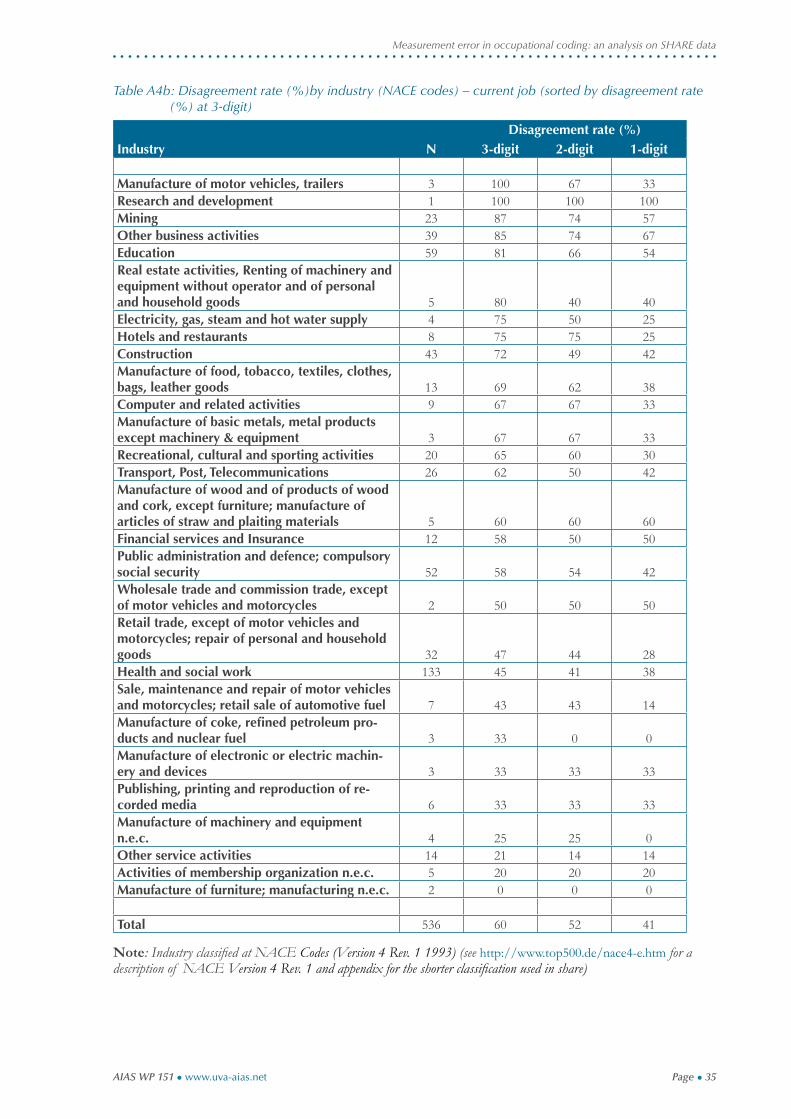
ing univariate statistics in the Appendix. In particular, Table A2 shows the disagreement rate by education,
Table A3 by gender and Table A4a and A4b by industry for last and current job respectively. The fi gures
clearly show that the rates of coding disagreement differ substantially across education and gender, with
higher rates for more educated individuals (only for last job) and for males. No clear patterns emerge from
the tables on disagreement rates by industry, probably because of the very low number of observation in
some groups. In the next subsection, we investigate this result in more details by performing a multivariate
analysis.
Page ● 25
Measurement error in occupational coding: an analysis on SHARE data
AIAS WP 151 ● www.uva-aias.net
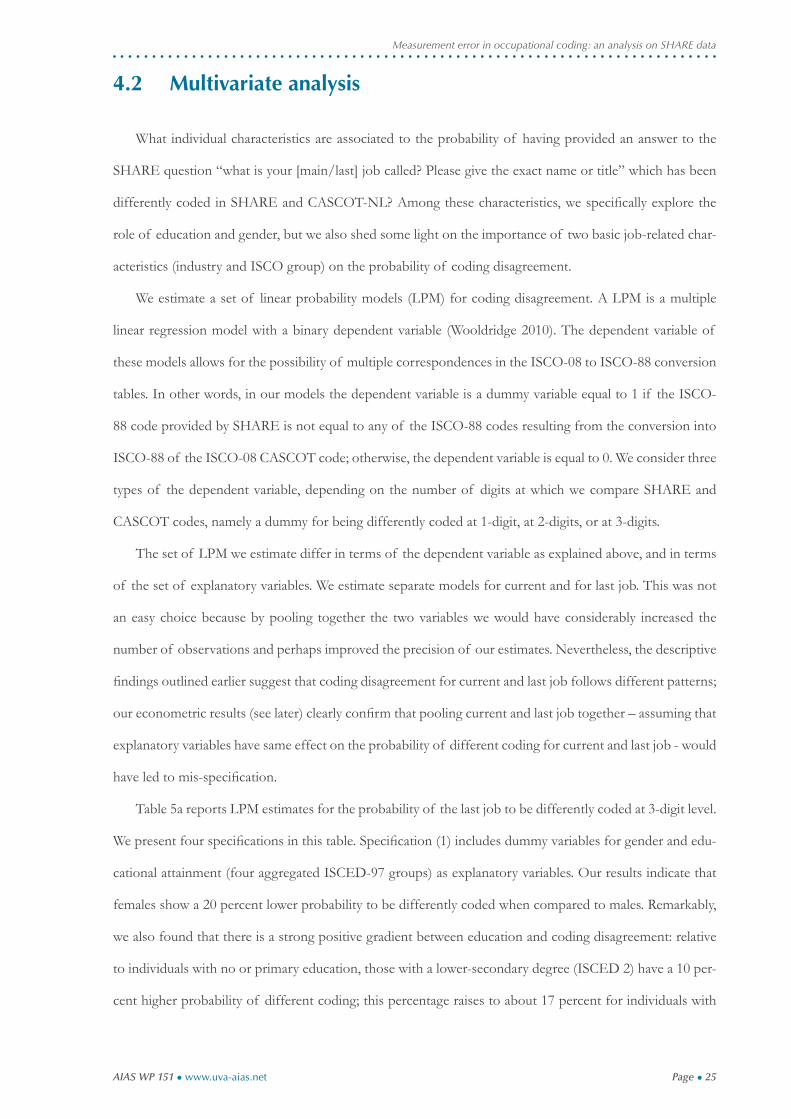
4.2 Multivariate analysis
What individual characteristics are associated to the probability of having provided an answer to the
SHARE question “what is your [main/last] job called? Please give the exact name or title” which has been
differently coded in SHARE and CASCOT-NL? Among these characteristics, we specifi cally explore the
role of education and gender, but we also shed some light on the importance of two basic job-related char-
acteristics (industry and ISCO group) on the probability of coding disagreement.
We estimate a set of linear probability models (LPM) for coding disagreement. A LPM is a multiple
linear regression model with a binary dependent variable (Wooldridge 2010). The dependent variable of
these models allows for the possibility of multiple correspondences in the ISCO-08 to ISCO-88 conversion
tables. In other words, in our models the dependent variable is a dummy variable equal to 1 if the ISCO-
88 code provided by SHARE is not equal to any of the ISCO-88 codes resulting from the conversion into
ISCO-88 of the ISCO-08 CASCOT code; otherwise, the dependent variable is equal to 0. We consider three
types of the dependent variable, depending on the number of digits at which we compare SHARE and
CASCOT codes, namely a dummy for being differently coded at 1-digit, at 2-digits, or at 3-digits.
The set of LPM we estimate differ in terms of the dependent variable as explained above, and in terms
of the set of explanatory variables. We estimate separate models for current and for last job. This was not
an easy choice because by pooling together the two variables we would have considerably increased the
number of observations and perhaps improved the precision of our estimates. Nevertheless, the descriptive
fi ndings outlined earlier suggest that coding disagreement for current and last job follows different patterns;
our econometric results (see later) clearly confi rm that pooling current and last job together – assuming that
explanatory variables have same effect on the probability of different coding for current and last job - would
have led to mis-specifi cation.
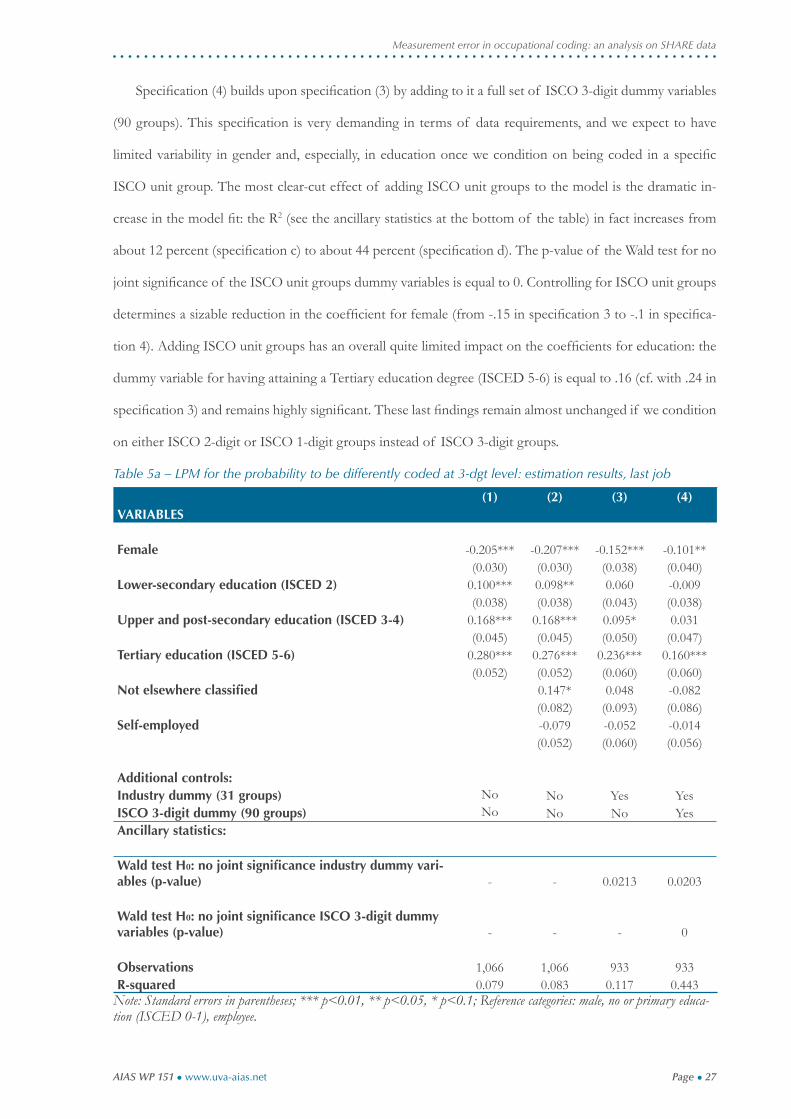
Table 5a reports LPM estimates for the probability of the last job to be differently coded at 3-digit level.
We present four specifi cations in this table. Specifi cation (1) includes dummy variables for gender and edu-
cational attainment (four aggregated ISCED-97 groups) as explanatory variables. Our results indicate that
females show a 20 percent lower probability to be differently coded when compared to males. Remarkably,
we also found that there is a strong positive gradient between education and coding disagreement: relative
to individuals with no or primary education, those with a lower-secondary degree (ISCED 2) have a 10 per-
cent higher probability of different coding; this percentage raises to about 17 percent for individuals with
Page ● 26
Michele Belloni, Agar Brugiavini, Elena Meschi and Kea Tijdens
AIAS WP 151 ● www.uva-aias.net
an upper and post-secondary degree (ICED 3-4), up to 28 percent for those holding a tertiary education
degree (ISCED 5-6).
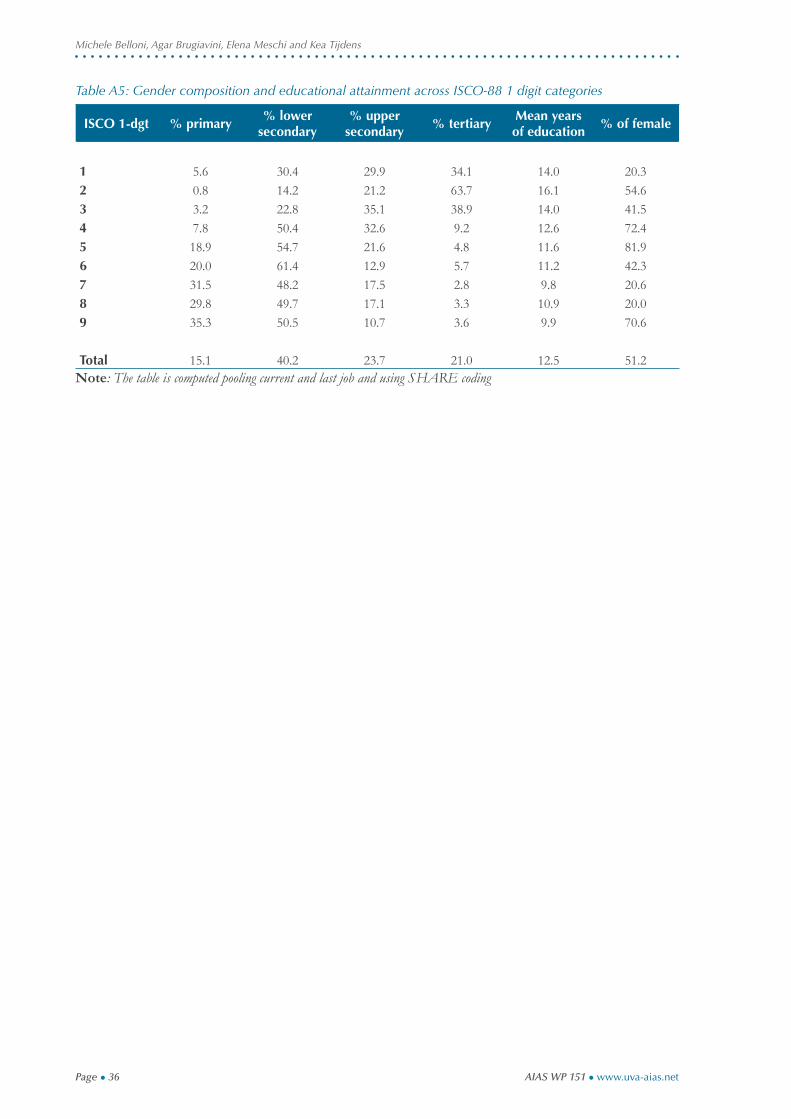
These results are particularly interesting, as they suggest that the probability of being miscoded is not
random, but is more pronounced for certain groups. In particular, it seems that more educated individuals
and males are more likely to be coded differently when using alternative coding systems. This may be due
the fact that males and more educated people are sorted in particular occupations that are intrinsically more
diffi cult to be classifi ed. In fact, for example, more educated individuals and males are likely to work in
high skilled occupations - as shown for the mean level of education and the percentage of females for each
1-digit group ISCO-88 in Table A5 in the appendix where the coding disagreement is higher according to
the results shown in Table 3. An alternative explanation could be that education and gender affect somehow
the way people are able to describe their jobs when asked in interviews.
Specifi cation (2) adds two right-hand-side variables to the model. A dummy for being coded as “not
elsewhere classifi ed (NEC)” was constructed by looking at the ISCO-88 4-digit codes, as coded by CAS-
COT software. This dummy is equal to 1 if the ISCO-88 fourth digit is equal to 9, which, according to
ILO’s guidance, refers to occupational categories that are not classifi ed to other specifi c categories within
the classifi cation. This variable includes ISCO categories which usually contain many types of clerical jobs.
We thus expect NEC jobs to be more likely differently coded. More important, since these jobs are typically
performed by females, including this variable is expected to affect the estimate for the gender variable. An-
other dummy was constructed for the self-employed. Being self-employed is also correlated with gender. As
expected, the variable “not elsewhere classifi ed” is positive and signifi cant at 10 percent level; however, the
coeffi cient for females is not affected by controlling for this confounding factor. The self-employed variable
turned out to be not signifi cant.
In specifi cation (3) we additionally control for industry by including in the model a set of 31 industry
dummy variables. Industry is classifi ed using NACE Codes, Version 4 Rev. 1 1993 (see http://www.top500.
de/nace4-e.htm for a description of NACE Version 4 Rev. 1 and the appendix for the shorter classifi cation
used in SHARE). They jointly affect the probability of different coding, as indicated by the result of the
Wald test reported at the bottom of the table (p-value 0.02). Once controlling for industry, the positive gra-
dient between coding disagreement and education attainment shown in the previous specifi cations becomes
less clear: only the tertiary education dummy variable remains strongly signifi cant. Moreover, the coeffi cient
for female reduces in size (from -.20 to -.15).
Page ● 27
Measurement error in occupational coding: an analysis on SHARE data
AIAS WP 151 ● www.uva-aias.net
Specifi cation (4) builds upon specifi cation (3) by adding to it a full set of ISCO 3-digit dummy variables
(90 groups). This specifi cation is very demanding in terms of data requirements, and we expect to have
limited variability in gender and, especially, in education once we condition on being coded in a specifi c
ISCO unit group. The most clear-cut effect of adding ISCO unit groups to the model is the dramatic in-
crease in the model fi t: the R2 (see the ancillary statistics at the bottom of the table) in fact increases from
about 12 percent (specifi cation c) to about 44 percent (specifi cation d). The p-value of the Wald test for no
joint signifi cance of the ISCO unit groups dummy variables is equal to 0. Controlling for ISCO unit groups
determines a sizable reduction in the coeffi cient for female (from -.15 in specifi cation 3 to -.1 in specifi ca-
tion 4). Adding ISCO unit groups has an overall quite limited impact on the coeffi cients for education: the
dummy variable for having attaining a Tertiary education degree (ISCED 5-6) is equal to .16 (cf. with .24 in
specifi cation 3) and remains highly signifi cant. These last fi ndings remain almost unchanged if we condition
on either ISCO 2-digit or ISCO 1-digit groups instead of ISCO 3-digit groups.
Table 5a – LPM for the probability to be differently coded at 3-dgt level: estimation results, last job
(1) (2) (3) (4)VARIABLES Female -0.205*** -0.207*** -0.152*** -0.101**
(0.030) (0.030) (0.038) (0.040)Lower-secondary education (ISCED 2) 0.100*** 0.098** 0.060 -0.009
(0.038) (0.038) (0.043) (0.038)Upper and post-secondary education (ISCED 3-4) 0.168*** 0.168*** 0.095* 0.031
(0.045) (0.045) (0.050) (0.047)Tertiary education (ISCED 5-6) 0.280*** 0.276*** 0.236*** 0.160***
(0.052) (0.052) (0.060) (0.060)Not elsewhere classifi ed 0.147* 0.048 -0.082
(0.082) (0.093) (0.086)Self-employed -0.079 -0.052 -0.014
(0.052) (0.060) (0.056)
Additional controls:Industry dummy (31 groups) No No Yes YesISCO 3-digit dummy (90 groups) No No No YesAncillary statistics:
Wald test H0: no joint signifi cance industry dummy vari-ables (p-value) - - 0.0213 0.0203
Wald test H0: no joint signifi cance ISCO 3-digit dummy variables (p-value) - - - 0
Observations 1,066 1,066 933 933R-squared 0.079 0.083 0.117 0.443
Note: Standard errors in parentheses; *** p<0.01, ** p<0.05, * p<0.1; Reference categories: male, no or primary educa-tion (ISCED 0-1), employee.
Page ● 28
Michele Belloni, Agar Brugiavini, Elena Meschi and Kea Tijdens
AIAS WP 151 ● www.uva-aias.net
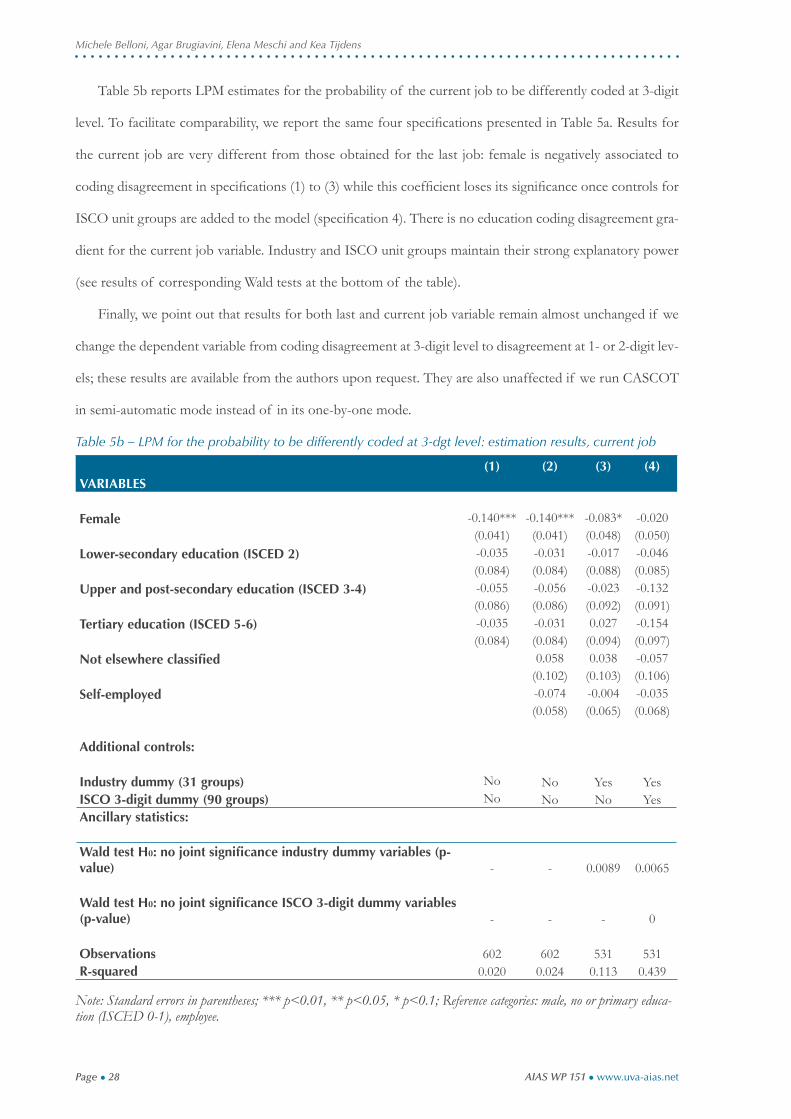
Table 5b reports LPM estimates for the probability of the current job to be differently coded at 3-digit
level. To facilitate comparability, we report the same four specifi cations presented in Table 5a. Results for
the current job are very different from those obtained for the last job: female is negatively associated to
coding disagreement in specifi cations (1) to (3) while this coeffi cient loses its signifi cance once controls for
ISCO unit groups are added to the model (specifi cation 4). There is no education coding disagreement gra-
dient for the current job variable. Industry and ISCO unit groups maintain their strong explanatory power
(see results of corresponding Wald tests at the bottom of the table).
Finally, we point out that results for both last and current job variable remain almost unchanged if we
change the dependent variable from coding disagreement at 3-digit level to disagreement at 1- or 2-digit lev-
els; these results are available from the authors upon request. They are also unaffected if we run CASCOT
in semi-automatic mode instead of in its one-by-one mode.
Table 5b – LPM for the probability to be differently coded at 3-dgt level: estimation results, current job
(1) (2) (3) (4)VARIABLES
Female -0.140*** -0.140*** -0.083* -0.020(0.041) (0.041) (0.048) (0.050)
Lower-secondary education (ISCED 2) -0.035 -0.031 -0.017 -0.046(0.084) (0.084) (0.088) (0.085)
Upper and post-secondary education (ISCED 3-4) -0.055 -0.056 -0.023 -0.132(0.086) (0.086) (0.092) (0.091)
Tertiary education (ISCED 5-6) -0.035 -0.031 0.027 -0.154(0.084) (0.084) (0.094) (0.097)
Not elsewhere classifi ed 0.058 0.038 -0.057(0.102) (0.103) (0.106)
Self-employed -0.074 -0.004 -0.035(0.058) (0.065) (0.068)
Additional controls:
Industry dummy (31 groups) No No Yes YesISCO 3-digit dummy (90 groups) No No No YesAncillary statistics:
Wald test H0: no joint signifi cance industry dummy variables (p-value) - - 0.0089 0.0065
Wald test H0: no joint signifi cance ISCO 3-digit dummy variables (p-value) - - - 0
Observations 602 602 531 531R-squared 0.020 0.024 0.113 0.439
Note: Standard errors in parentheses; *** p<0.01, ** p<0.05, * p<0.1; Reference categories: male, no or primary educa-tion (ISCED 0-1), employee.
Page ● 29
Measurement error in occupational coding: an analysis on SHARE data
AIAS WP 151 ● www.uva-aias.net
5 Conclusions
This article studied the potential measurement errors occurring when coding occupational data. Given
the growing use of information on occupation in labour economics research, the quality of occupational
data is of key importance and is often neglected by the economic literature.
In this analysis, we have recoded open-ended questions on occupation for the Dutch sample of SHARE
data using CASCOT, a well-known software for automatic ex-post coding. Our results show that the disa-
greement rate, defi ned as the percentage of observations coded differently in SHARE and CASCOT, is
high even when the comparison is made at 1-digit level (33.7 percent for last job and 40 percent for current
job). This fi nding is particularly striking, considering that our approach has been conservative, in the sense
that we only compare the “easiest” answers, because vague and incomplete answers are left out form the
analysis. The level of miscoding we fi nd should thus be considered as a lower bound of the “true” miscod-
ing. In our view our results highlight the complexity of occupational coding and suggest that the potential
measurement error due to miscoding should be taken into account when making statistical analysis or writ-
ing econometric models.
We have also tested whether such a measurement error in occupation is random or is instead correlated
to some specifi c individual or job-related characteristics. We found that the measurement error is indeed
more evident in certain ISCO-88 groups (ISCO-88 groups 1 and 3) and is more pronounced for more edu-
cated individuals and males. As discussed above, this may be due to the fact that males and more educated
people are sorted in particular occupations that are intrinsically more diffi cult to be classifi ed. Alternatively,
it could be that education and gender affect somehow the way people are able to describe their jobs when
asked in interviews. Understanding the reasons behind these results may constitute an interesting direction
for further investigation.

Page ● 30
Michele Belloni, Agar Brugiavini, Elena Meschi and Kea Tijdens
AIAS WP 151 ● www.uva-aias.net
Page ● 31
Measurement error in occupational coding: an analysis on SHARE data
AIAS WP 151 ● www.uva-aias.net
References
Autor, D. 2013. “The “task approach” to labour markets: an overview.” Journal of Labour Market Research 46: 185-199.
Autor D, L F Katz, and M S Kearney. 2006. “The Polarization of the US Labor Market.” American Economic Review 96: 189-194.
Autor, D., F. Levy and R.J. Murnane. 2003. “The Skill Content Of Recent Technological Change: An Em-pirical Exploration.” Quarterly Journal of Economics 118: 1279-1333.
Bethmann A., M. Schierholz, K. Wenzig, and M. Zielonka. 2014. Automatic Coding of Occupations Using Ma-chine Learning Algorithms for Occupation Coding in Several German Panel Surveys. Presentation VI European Congress of Methodology Utrecht University 24 July 2014.
CBS (Statistics Netherlands), 2012. Coding tool implemented in 2012 for coding occupations in social surveys, internal document. The Hague: Statistics Netherlands.
Cheeseman Day J. 2014. Using an Autocoder to Code Industry and Occupation in the American Community Survey. Presentation for the Federal Economic Statistics Advisory Committee Meeting June 13, 2014.
Commission of the European Communities. 2009. “Commission Regulation (EC) No 1022/2009 of 29 October 2009 amending Regulations (EC) No 1738/2005, (EC) No 698/2006 and (EC) No 377/2008 as regards the International Standard Classifi cation of Occupations (ISCO)”. Offi cial Journal of the Euro-pean Union, L 283/3, 30.10.2009.
De Vries J. and H.B.G. Ganzeboom. 2008. “Hoe meet ik beroep? Open en gesloten vragen naar beroep toegepast in een statusverwervingsmodel.” Mens & Maatschappij 83: 71-96 plus “Rectifi catie.” Mens & Maatschappij 83: 190-191.
Elias, P., K. Halstead and K. Prandy 1992. CASCOC: Computer-assisted Standard Occupational Coding. London: HMSO.
Elias, P. 1997. “Occupational Classifi cation (ISCO-88. Concepts, Methods, Reliability, Validity and Cross-National Comparability”. OECD Labour Market and Social Policy Occasional Papers, No. 20, OECD Pub-lishing. http://dx.doi.org/10.1787/304441717388.
Ellison, R. 2014. Demonstration of performance of CASCOT 5.0. Presentation at the CASCOT: Occupation-al Coding in Multi-national Surveys Workshop in Venice (10-11 April 2014), http://dasish.eu/dasi-shevents/cascotworkshop/programmepres/.
Feenstra, R. C. and G. H. Hanson. 1996. “Globalization, Outsourcing, and Wage Inequality.” American Eco-nomic Review 86: 240-245.
Fletcher, J. M., J. L. Sindelar and S.Yamaguchi. 2011. “Cumulative effects of job characteristics on health.” Health Economics 20: 553-570.
Goos, M. and A. Manning. 2007. “Lousy and lovely jobs: The rising polarization of work in Britain.” Review of Economics and Statistics 89: 118-133.
Harrison, E. 2010. Social Class in Europe: An Introduction to the European Socio-economic Classifi cation. London: Routledge.
Hartog, J. 2000. “Over-education and earnings: where are we, where should we go?” Economics of education review 19: 131–147.
Page ● 32
Michele Belloni, Agar Brugiavini, Elena Meschi and Kea Tijdens
AIAS WP 151 ● www.uva-aias.net
Hoffmann, E., P. Elias, B. Embury and R Thomas. 1995. What Kind Of Work Do You Do? Data collection and processing strategies when measuring “occupation” for statistical surveys and administrative records. Geneva: ILO working paper, N.95-1.
Jackle, A. 2008. “Dependent Interviewing: Effects on Respondent Burden and Effi ciency of Data Collec-tion.” Journal of Offi cial Statistics 24: 411-430.
Jones, R. and P. Elia.s 2004. ‘CASCOT: Computer-assisted Structured Coding Tool’, Coventry: Warwick Institute for Employment Research, University of Warwick, [Report].
Leuven, E. and H. Oosterbeek. 2011. Overeducation and mismatch in the labor market, in E. Hanushek, S. Machin & L.Woessmann, eds, ‘Handbook of the Economics of Education’, Vol. 4, Elsevier.
ILO 2012. International Standard Classifi cation of Occupations: Structure, group defi nitions and correspondence tables. Geneva: Volume 1.
ILO 2010. Measuring the Economically Active in Population Censuses: A Handbook. New York: ILO and UN, Stud-ies in Methods Series F, No. 102.
Ravesteijn, B., H. van Kippersluis and E. van Doorslaer. 2013. The Wear and Tear on Health: What is the Role of Occupation?. Amsterdam: Tinbergen Institute Discussion Paper 13-143.
Tijdens, K.G. 2014a. “Drop-out rates during completion of an occupation search tree in web-surveys”. Journal of Offi cial Statistics 30: 23–43.
Tijdens, K.G. 2014b. Reviewing the measurement and comparison of occupations across Europe. Amsterdam: Univer-sity of Amsterdam, AIAS Working Paper 149.
Westerman, S. 2014. CBS and CASCOT: tuning CASCOT for improved performance. Presentation at the CAS-COT: Occupational Coding in Multi-national Surveys Workshop in Venice (10-11 April 2014), http://dasish.eu/dasishevents/cascotworkshop/programmepres/.
Wilcoxon, F. 1945. “Individual comparisons by ranking methods.” Biometrics 1: 80–83.
Wooldridge, J.M. 2010. Econometric Analysis of Cross Section and Panel Data. Cambridge (MA): MIT press.
Page ● 33
Measurement error in occupational coding: an analysis on SHARE data
AIAS WP 151 ● www.uva-aias.net
Appendix
Table A1: Mapping of ISCO-08 major groups to skill levels (col. 1 and 2) and mapping of the four ISCO-08 skill levels to ISCED-97 levels of education (col. 2 and 3)
ISCO-08 major groups Skill level ISCED-97 level
1. Managers 3 + 4 5b + 6, 5a2. Professionals 4 6, 5a3. Technicians and associate professionals 3 5b4. Clerical support workers 2 4, 3, 25. Services and sales workers 2 4, 3, 26. Skilled agricultural, forestry and fi shery workers 2 4, 3, 27. Craft and related trades workers 2 4, 3, 28. Plants and machinery operators, and assemblers 2 4, 3, 29. Elementary occupations 1 1
Note: ISCED-97 levels of education: Level 1=Primary education or fi rst stage of basic education; Level 2 = Lower secondary or second stage of basic education; Level 3 = (Upper) secondary education; Level 4 = Post-secondary non-tertiary education; Level 5a = First stage of tertiary education, 1st degree, medium duration; Level 5b= First stage of tertiary education , short or medium duration, practical orientation); Level 6 = Second stage of tertiary education.Source: ILO (2012), p. 14
Table A2: Disagreement rate by education levels
Last job Current job
Disagreement rate (%) Disagreement rate (%) N 3-digit 2-digit 1-digit N 3-digit 2-digit 1-digit
ISCED 0-1 237 35 27 20 42 60 52 38 ISCED 2 465 44 34 27 208 55 42 29 ISCED 3-4 227 53 42 37 155 54 43 34 ISCED 5-6 137 67 54 49 197 55 41 37
Total 1066 47 37 31 602 55 43 34
Table A3: Disagreement rate by gender
Last job Current job
Disagreement rate (%) Disagreement rate (%)N 3-digit 2-digit 1-digit N 3-digit 2-digit 1-digit
Male 536 59 46 38 332 61 45 35 Females 547 36 28 24 275 48 40 32
Total 1083 47 37 31 607 55 43 34
Page ● 34
Michele Belloni, Agar Brugiavini, Elena Meschi and Kea Tijdens
AIAS WP 151 ● www.uva-aias.net
Table A4a: Disagreement rate (%) by industry (NACE codes) – last job (sorted by disagreement rate 3-digit)
Disagreement rate (%)
Industry N 3-digit 2-digit 1-digitComputer and related activities 1 100 100 100Recycling 1 100 100 100Real estate activities, Renting of machinery and equipment without operator and ofpersonal and household goods 5 80 40 40Manufacture of coke, refi ned petroleum prod-ucts and nuclear fuel 9 78 78 78Electricity, gas, steam and hot water supply 16 75 56 38Research and development 4 75 75 50Publishing, printing and reproduction of re-corded media 23 74 70 70Education 50 72 54 42Wholesale trade and commission trade, except of motor vehicles and motorcycles 26 69 62 54Manufacture of basic metals, metal products except machinery & equipment 19 63 63 53Financial services and Insurance 21 62 19 19Manufacture of other non-metallic mineral products 5 60 60 40Other business activities 47 60 47 38Transport, Post, Telecommunications 53 58 51 34Manufacture of wood and of products of wood and cork, except furniture; manufacture of articles of straw and plaiting materials 7 57 29 29Hotels and restaurants 18 56 56 17Manufacture of motor vehicles, trailers and semi-trailers 9 56 44 44Public administration and defence; compulsory social security 92 53 45 41Recreational, cultural and sporting activities 23 52 43 39Mining 53 51 47 40Manufacture of food, tobacco, textiles, clothes, bags, leather goods 64 50 47 38Sewage and refuse disposal, sanitation and similar activities 2 50 0 0Construction 95 47 37 26Sale, maintenance and repair of motor vehicles and motorcycles; retail sale of automotive fuel 12 42 42 25Manufacture of electronic or electric machin-ery and devices 5 40 20 20Health and social work 126 39 31 28Activities of membership organization n.e.c. 15 33 20 20Other service activities 34 32 32 29Retail trade, except of motor vehicles and motorcycles; repair of personal and household goods 105 31 30 25Manufacture of furniture; manufacturing n.e.c. 4 25 25 25Manufacture of machinery and equipment n.e.c. 4 0 0 0
Total 948 50 42 34Note: Industry classifi ed at NACE Codes (Version 4 Rev. 1 1993) (see http://www.top500.de/nace4-e.htm for a description of NACE Version 4 Rev. 1 and appendix for the shorter classifi cation used in SHARE)
Page ● 35
Measurement error in occupational coding: an analysis on SHARE data
AIAS WP 151 ● www.uva-aias.net
Table A4b: Disagreement rate (%)by industry (NACE codes) – current job (sorted by disagreement rate (%) at 3-digit)
Disagreement rate (%)Industry N 3-digit 2-digit 1-digit
Manufacture of motor vehicles, trailers 3 100 67 33Research and development 1 100 100 100Mining 23 87 74 57Other business activities 39 85 74 67Education 59 81 66 54Real estate activities, Renting of machinery and equipment without operator and of personal and household goods 5 80 40 40Electricity, gas, steam and hot water supply 4 75 50 25Hotels and restaurants 8 75 75 25Construction 43 72 49 42Manufacture of food, tobacco, textiles, clothes, bags, leather goods 13 69 62 38Computer and related activities 9 67 67 33Manufacture of basic metals, metal products except machinery & equipment 3 67 67 33Recreational, cultural and sporting activities 20 65 60 30Transport, Post, Telecommunications 26 62 50 42Manufacture of wood and of products of wood and cork, except furniture; manufacture of articles of straw and plaiting materials 5 60 60 60Financial services and Insurance 12 58 50 50Public administration and defence; compulsory social security 52 58 54 42Wholesale trade and commission trade, except of motor vehicles and motorcycles 2 50 50 50Retail trade, except of motor vehicles and motorcycles; repair of personal and household goods 32 47 44 28Health and social work 133 45 41 38Sale, maintenance and repair of motor vehicles and motorcycles; retail sale of automotive fuel 7 43 43 14Manufacture of coke, refi ned petroleum pro-ducts and nuclear fuel 3 33 0 0Manufacture of electronic or electric machin-ery and devices 3 33 33 33Publishing, printing and reproduction of re-corded media 6 33 33 33Manufacture of machinery and equipment n.e.c. 4 25 25 0Other service activities 14 21 14 14Activities of membership organization n.e.c. 5 20 20 20Manufacture of furniture; manufacturing n.e.c. 2 0 0 0
Total 536 60 52 41
Note: Industry classifi ed at NACE Codes (Version 4 Rev. 1 1993) (see http://www.top500.de/nace4-e.htm for a description of NACE Version 4 Rev. 1 and appendix for the shorter classifi cation used in share)
Page ● 36
Michele Belloni, Agar Brugiavini, Elena Meschi and Kea Tijdens
AIAS WP 151 ● www.uva-aias.net
Table A5: Gender composition and educational attainment across ISCO-88 1 digit categories
ISCO 1-dgt % primary% lower
secondary% upper
secondary% tertiary
Mean years of education
% of female
1 5.6 30.4 29.9 34.1 14.0 20.3 2 0.8 14.2 21.2 63.7 16.1 54.63 3.2 22.8 35.1 38.9 14.0 41.54 7.8 50.4 32.6 9.2 12.6 72.45 18.9 54.7 21.6 4.8 11.6 81.96 20.0 61.4 12.9 5.7 11.2 42.37 31.5 48.2 17.5 2.8 9.8 20.6 8 29.8 49.7 17.1 3.3 10.9 20.0 9 35.3 50.5 10.7 3.6 9.9 70.6
Total 15.1 40.2 23.7 21.0 12.5 51.2Note: The table is computed pooling current and last job and using SHARE coding
Page ● 37
Measurement error in occupational coding: an analysis on SHARE data
AIAS WP 151 ● www.uva-aias.net
AIAS Working Papers (€ 7,50)
Recent publications of the Amsterdam Institute for Advanced Labour Studies. They can be downloaded from our website www.uva-aias.net under the subject Publications.
150 Who has access to mobile devices in an online commercial panel? An analysis of potential respond- ents for mobile surveys November 2014 - Melanie Revilla, Daniele Toninelli, Carlos Ochoa, Germán Loewe
149 Reviewing the measurement and comparison of occupations across Europe August 2014 - Kea Tijdens
148 ‘Werkgeverskeuze en Pensioen: Een Institutionele Analyse September 2014 - Natascha van der Zwan
147 Why Dutch women work part-time: A Oaxaca-decomposition of differences in European female part-time work rates July 2014 - Nick Deschacht and Kea Tijdens
146 National Labour Rights for Women July 2014 - Janna Besamusca and Kea Tijdens
145 Labour-market institutions and the dispersion of wage earnings May 2014 - Wiemer Salverda and Danielle Checchi
144 Does desire for social status promote solidarity? Investigating the role of egalitarian versus inegalitarian societal contexts May 2014 - Marii Paskov
143 Big Data and virtual communities: methodological issues April 2014 - Mª Rocio Martínez-Torres, Sergio L. Toral and Nicoletta Fornara
142 Skills and occupational needs: labour market forecasting systems in Italy March 2014 - Giovanni Castiglioni and Kea Tijdens
141 Who should earn what? A Q methodological study on notions of justice of wage differences November 2013 - Wout Scholten and Margo Trappenburg
140 Who has an informal job and how is that job paid? A job-based informality index for nine sub-Saharan African countries November 2013 - Kea Tijdens, Janna Besamusca and Maarten van Klaveren
139 Positive Action in EU Gender Equality Law: Promoting More Women in Corporate Decision Making? October 2013 - Nuria Elena Ramos Martín
138 Multiple barriers and bridges to work October 2013 - Tomáš Sirovátka and Els Sol
137 Governance of EU labour law. EU’s working time directive and it’s implementation in the Nether- lands September 2013 - Els Sol, Nuria Ramos
136 Benchmark. Towards evidence-based work fi rst September 2013 - Els Sol, Julie Castonguay, Hanneke van Lindert, Yvonne van Amstel
135 De bevoegdheden van werkgevers en werknemers om een pensioenuitvoerder te kiezen October 2013 - Sijbren Kuiper
Page ● 38
Michele Belloni, Agar Brugiavini, Elena Meschi and Kea Tijdens
AIAS WP 151 ● www.uva-aias.net
134 Economic valuation in Web surveys; A review of the state of the art and best practices August 2013 - Angeliki, N. Menegaki, Konstantinos P. Tsagarakis
133 Do Spanish fi rms support initial vocational training? Company behaviour in low-coordinated institu- tional frameworks August 2013 - David Fernàndez Guerrero
132 Interactive applets on the Web for methods and statistics August 2013 - Ulf-Dietrich Reips, Gary McClelland131 Can creative web survey questionnaire design improve the response quality? July 2013 - Julijana Angelovska, Petroula M. Mavrikiou
129 Children, Elder Care and the Probabilities Spanish Women have of Holding Decent Works July 2013 - Alberto Villacampa González, Pablo de Pedraza García
128 Collectieve Zeggenschap in het Nederlandse Pensioenstelsel: De Beroepspensioenvereniging August 2013 - Natascha van der Zwan
127 More or less strangers. Social distance as refl ected in news media reporting on the young, the old and the allochthon December 2012 - Dorota Lepianka
126 Development of the public-private wage differential in the Netherlands 1979 – 2009 December 2012 - Ernest Berkhout and Wiemer Salverda
125 Solidarity in a multicultural neighbourhood. Results of a fi eld experiment December 2012 - Paul de Beer and Maarten Berg
124 Conditions and motives for voluntary sharing. Results of a solidarity game experiment December 2012 - Paul de Beer and Maarten Berg
123 “Gone Fishing” Modeling Diversity in Work Ethics October 2012 - Annette Freyberg-Inan and Rüya Gökhan Koçer
122 Skill-based inequality in job quality August 2012 - Haya Stier
121 Occupational segregation and gender inequality in job quality August 2012 - Haya Stier and Meir Yaish
120 The impact of attitudes and work preferences on Dutch mothers’ employment patterns April 2012 - Justine Ruitenberg and Paul de Beer
119 “He would never just hit the sofa” A narrative of non-complaining among Dutch Mothers. A qualitative study of the infl uences of attitudes on work preferences and employment patterns of Dutch mothers April 2012 - Justine Ruitenberg
118 Collective redress and workers’ rights in the EU March 2012 - Jan Cremers and Martin Bulla
117 Forthcoming: An individual level perspective on the concept of fl exicurity Antonio Firinu
116 Comparative study of labour relations in African countries December 2011 - Rüya Gökhan Koçer and Susan Hayter
115 More fl exibility for more innovation? December 2011 - Eva Wachsen and Knut Blind
Page ● 39
Measurement error in occupational coding: an analysis on SHARE data
AIAS WP 151 ● www.uva-aias.net
114 De loonkloof tussen mannen en vrouwen. Een review van het onderzoek in Nederland December 2011 - Kea G. Tijdens en Maarten van Klaveren
113 European social dialogue as multi-level governance. Towards more autonomy and new dependencies September 2011 - Paul Marginson and Maarten Keune
112 Flexicurity: a new impulse for social dialogue in Europe? September 2011 - Maarten Keune
11-111 Health workforce remuneration. Comparing wage levels, ranking and dispersion of 16 occupational groups in 20 countries August 2011 - Kea Tijdens and Daniel H. de Vries
11-110 Over- and underqualifi cation of migrant workers. Evidence from WageIndicator survey data July 2011 - Kea Tijdens and Maarten van Klaveren
11-109 Employees’ experiences of the impact of the economic crisis in 2009 and 2010 July 2011 - Kea Tijdens, Maarten van Klaveren, Reinhard Bispinck, Heiner Dribbusch and Fikret Öz
11-108 A deeper insight into the ethnic make-up of school cohorts: Diversity and school achievement January 2011 - Virginia Maestri
11-107 Codebook and explanatory note on the EurOccupations dataset about the job content of 150 occupations January 2011 - Kea Tijdens, Esther de Ruijter and Judith de Ruijter
10-106 The Future of Employment Relations: Goodbye ‘Flexicurity’ – Welcome Back Transitional Labour Markets? 2010 - Günther Schmid
11-105 Forthcoming: This time is different ?! The depth of the Financial Crisis and its effects in the Netherlands. Wiemer Salverda
11-104 Forthcoming: Integrate to integrate. Explaining institutional change in the public employment service - the one shop offi ce Marieke Beentjes, Jelle Visser and Marloes de Graaf-Zijl
11-103 Separate, joint or integrated? Active labour market policy for unemployed on social assistance and unemployment benefi ts 2011 - Lucy Kok, Caroline Berden and Marloes de Graaf-Zijl
10-102 Codebook and explanatory note on the WageIndicator dataset a worldwide, continuous, multilingual web-survey on work and wages with paper supplements 2010 - Kea Tijdens, Sanne van Zijl, Melanie Hughie-Williams, Maarten van Klaveren, Stephanie Steinmetz
10-101 Uitkeringsgebruik van Migranten 2010 - Aslan Zorlu, Joop Hartog and Marieke Beentjes
10-100 Low wages in the retail industry in the Netherlands. RSF project Future of work in Europe / Low-wage Employment: Opportunity in the Workplace in Europe and the USA 2010 - Maarten van Klaveren
10-99 Pension fund governance. The intergenerational confl ict over risk and contributions 2010 - David Hollanders
Page ● 40
Michele Belloni, Agar Brugiavini, Elena Meschi and Kea Tijdens
AIAS WP 151 ● www.uva-aias.net
10-98 The greying of the median voter. Aging and the politics of the welfare state in OECD countries 2010 - David Hollanders and Ferry Koster
10-97 An overview of women’s work and employment in Zimbabwe Decisions for Life Country Report 2010 - Maarten van Klaveren, Kea Tijdens, Melanie Hughie-Williams and Nuria Ramos
10-96 An overview of women’s work and employment in Belarus Decisions for Life Country Report 2010 - Maarten van Klaveren, Kea Tijdens, Melanie Hughie-Williams and Nuria Ramos
10-95 Uitzenden in tijden van crisis 2010 - Marloes de Graaf-Zijl and Emma Folmer
10-94 An overview of women’s work and employment in Ukraine Decisions for Life Country Report 2010 - Maarten van Klaveren, Kea Tijdens, Melanie Hughie-Williams and Nuria Ramos
10-93 An overview of women’s work and employment in Kazakhstan Decisions for Life Country Report 2010 - Maarten van Klaveren, Kea Tijdens, Melanie Hughie-Williams and Nuria Ramos
10-92 An overview of women’s work and employment in Azerbaijan Decisions for Life Country Report 2010 - Maarten van Klaveren, Kea Tijdens, Melanie Hughie-Williams and Nuria Ramos
10-91 An overview of women’s work and employment in Indonesia Decisions for Life Country Report 2010 - Maarten van Klaveren, Kea Tijdens, Melanie Hughie-Williams and Nuria Ramos
10-90 An overview of women’s work and employment in India Decisions for Life Country Report 2010 - Maarten van Klaveren, Kea Tijdens, Melanie Hughie-Williams and Nuria Ramos
10-89 Coordination of national social security in the EU – Rules applicable in multiple cross border situations 2010 - Jan Cremers
10-88 Geïntegreerde dienstverlening in de keten van Werk en Inkomen 2010 - Marloes de Graaf-Zijl, Marieke Beentjes, Eline van Braak
10-87 Emigration and labour shortages. An opportunity for trade unions in new member states? 2010 - Monika Ewa Kaminska and Marta Kahancová
10-86 Measuring occupations in web-surveys. The WISCO database of occupations 2010 - Kea Tijdens
09-85 Multinationals versus domestic fi rms: Wages, working hours and industrial relations 2009 - Kea Tijdens and Maarten van Klaveren
09-84 Working time fl exibility components of companies in Europe 2009 - Heejung Chung and Kea Tijdens
09-83 An overview of women’s work and employment in Brazil Decisions for Life Country Report 2009 - Maarten van Klaveren, Kea Tijdens, Melanie Hughie-Williams and Nuria Ramos
Page ● 41
Measurement error in occupational coding: an analysis on SHARE data
AIAS WP 151 ● www.uva-aias.net
09-82 An overview of women’s work and employment in Malawi Decisions for Life Country Report 2009 - Maarten van Klaveren, Kea Tijdens, Melanie Hughie-Williams and Nuria Ramos
09-81 An overview of women’s work and employment in Botswana Decisions for Life Country Report 2009 - Maarten van Klaveren, Kea Tijdens, Melanie Hughie-Williams and Nuria Ramos09-80 An overview of women’s work and employment in Zambia Decisions for Life Country Report 2009 - Maarten van Klaveren, Kea Tijdens, Melanie Hughie-Williams and Nuria Ramos
09-79 An overview of women’s work and employment in South Africa Decisions for Life Country Report 2009 - Maarten van Klaveren, Kea Tijdens, Melanie Hughie-Williams and Nuria Ramos
09-78 An overview of women’s work and employment in Angola Decisions for Life Country Report 2009 - Maarten van Klaveren, Kea Tijdens, Melanie Hughie-Williams and Nuria Ramos
09-77 An overview of women’s work and employment in Mozambique Decisions for Life Country Report 2009 - Maarten van Klaveren, Kea Tijdens, Melanie Hughie-Williams and Nuria Ramos
09-76 Comparing different weighting procedures for volunteer web surveys. Lessons to be learned from German and Dutch Wage indicator data 2009 - Stephanie Steinmetz, Kea Tijdens and Pablo de Pedraza
09-75 Welfare reform in the UK, the Netherlands, and Finland. Change within the limits of path dependence. 2009 - Minna van Gerven
09-74 Flexibility and security: an asymmetrical relationship? The uncertain relevance of fl exicurity policies for segmented labour markets and residual welfare regimes 2009 - Aliki Mouriki (guest at AIAS from October 2008 - March 2009)
09-73 Education, inequality, and active citizenship tensions in a differentiated schooling system 2009 - Herman van de Werfhorst
09-72 An analysis of fi rm support for active labor market policies in Denmark, Germany, and the Netherlands 2009 - Moira Nelson
08-71 The Dutch minimum wage radical reduction shifts main focus to part-time jobs 2008 - Wiemer Salverda
08-70 Parallelle innovatie als een vorm van beleidsleren: Het voorbeeld van de keten van werk en inkomen 2008 - Marc van der Meer, Bert Roes
08-69 Balancing roles - bridging the divide between HRM, employee participation and learning in the Dutch knowledge economy 2008 - Marc van der Meer, Wout Buitelaar
08-68 From policy to practice: Assessing sectoral fl exicurity in the Netherlands October 2008 - Hesther Houwing / Trudie Schils
08-67 The fi rst part-time economy in the world. Does it work? Republication August 2008 - Jelle Visser
08-66 Gender equality in the Netherlands: an example of Europeanisation of social law and policy May 2008 - Nuria E.Ramos-Martin
Page ● 42
Michele Belloni, Agar Brugiavini, Elena Meschi and Kea Tijdens
AIAS WP 151 ● www.uva-aias.net
07-65 Activating social policy and the preventive approach for the unemployed in the Netherlands January 2008 - Minna van Gerven
07-64 Struggling for a proper job: Recent immigrants in the Netherlands January 2008 - Aslan Zorlu
07-63 Marktwerking en arbeidsvoorwaarden – de casus van het openbaar vervoer, de energiebedrijven en de thuiszorg July 2007 - Marc van der Meer, Marian Schaapman & Monique Aerts
07-62 Vocational education and active citizenship behaviour in cross-national perspective November 2007 - Herman G. van der Werfhorst
07-61 The state in industrial relations: The politics of the minimum wage in Turkey and the USA November 2007 - Ruÿa Gökhan Koçer & Jelle Visser
07-60 Sample bias, weights and effi ciency of weights in a continuous web voluntary survey September 2007 - Pablo de Pedraza, Kea Tijdens & Rafael Muñoz de Bustillo
07-59 Globalization and working time: Work-Place hours and fl exibility in Germany October 2007 - Brian Burgoon & Damian Raess
07-58 Determinants of subjective job insecurity in 5 European countries August 2007 - Rafael Muñoz de Bustillo & Pablo de Pedraza
07-57 Does it matter who takes responsibility? May 2007 - Paul de Beer & Trudie Schils
07-56 Employement protection in dutch collective labour agreements April 2007 - Trudie Schils
07-54 Temporary agency work in the Netherlands February 2007 - Kea Tijdens, Maarten van Klaveren, Hester Houwing, Marc van der Meer & Marieke van Essen
07-53 Distribution of responsibility for social security and labour market policy Country report: Belgium January 2007 - Johan de Deken
07-52 Distribution of responsibility for social security and labour market policy Country report: Germany January 2007 - Bernard Ebbinghaus & Werner Eichhorst
07-51 Distribution of responsibility for social security and labour market policy Country report: Denmark January 2007 - Per Kongshøj Madsen
07-50 Distribution of responsibility for social security and labour market policy Country report: The United Kingdom January 2007 - Jochen Clasen
07-49 Distribution of responsibility for social security and labour market policy Country report: The Netherlands January 2007 - Trudie Schils
06-48 Population ageing in the Netherlands: demographic and fi nancial arguments for a balanced approach January 2007 - Wiemer Salverda
Page ● 43
Measurement error in occupational coding: an analysis on SHARE data
AIAS WP 151 ● www.uva-aias.net
06-47 The effects of social and political openness on the welfare state in 18 OECD countries, 1970-2000 January 2007 - Ferry Koster
06-46 Low pay incidence and mobility in the Netherlands - Exploring the role of personal, job and employer characteristics October 2006 - Maite Blázques Cuesta & Wiemer Salverda
06-45 Diversity in work: The heterogeneity of women’s labour market participation patterns September 2006 - Mara Yerkes
06-44 Early retirement patterns in Germany, the Netherlands and the United Kingdom October 2006 - Trudie Schils
06-43 Women’s working preferences in the Netherlands, Germany and the UK August 2006 - Mara Yerkes
05-42 Wage bargaining institutions in Europe: a happy marriage or preparing for divorce? December 2005 - Jelle Visser
05-41 The work-family balance on the union’s agenda December 2005 - Kilian Schreuder
05-40 Boxing and dancing: Dutch trade union and works council experiences revisited November 2005 - Maarten van Klaveren & Wim Sprenger
05-39 Analysing employment practices in western european multinationals: coordination, indus- trial relations and employment fl exibility in Poland October 2005 - Marta Kahancova & Marc van der Meer
05-38 Income distribution in the Netherlands in the 20th century: long-run developments and cyclical properties September 2005 - Emiel Afman
05-37 Search, mismatch and unemployment July 2005 - Maite Blazques & Marcel Jansen
05-36 Women’s preferences or delineated policies? The development of part-time work in the Netherlands, Germany and the United Kingdom July 2005 - Mara Yerkes & Jelle Visser
05-35 Vissen in een vreemde vijver: Het werven van verpleegkundigen en verzorgenden in het buitenland May 2005 - Judith Roosblad
05-34 Female part-time employment in the Netherlands and Spain: an analysis of the reasons for taking a part-time job and of the major sectors in which these jobs are performed May 2005 - Elena Sirvent Garcia del Valle
05-33 Een functie met inhoud 2004 - Een enquête naar de taakinhoud van secretaressen 2004, 2000, 1994 April 2005 - Kea Tijdens
04-32 Tax evasive behavior and gender in a transition country November 2004 - Klarita Gërxhani
04-31 How many hours do you usually work? An analysis of the working hours questions in 17 large- scale surveys in 7 countries November 2004 - Kea Tijdens

Page ● 44
Michele Belloni, Agar Brugiavini, Elena Meschi and Kea Tijdens
AIAS WP 151 ● www.uva-aias.net
04-30 Why do people work overtime hours? Paid and unpaid overtime working in the Netherlands August 2004 - Kea Tijdens
04-29 Overcoming marginalisation? Gender and ethnic segregation in the Dutch construction, health, IT and printing industries July 2004 - Marc van der Meer
04-28 The work-family balance in collective agreements. More female employees, more provi- sions? July 2004 - Killian Schreuder
04-27 Female income, the ego effect and the divorce decision: evidence from micro data March 2004 - Randy Kesselring (Professor of Economics at Arkansas State University, USA) was guest at AIAS in April and May 2003
04-26 Economische effecten van Immigratie – Ontwikkeling van een Databestand en eerste analyses Januari 2004 - Joop Hartog & Aslan Zorlu
03-25 Wage Indicator – Dataset Loonwijzer Januari 2004 - Kea Tijdens
03-24 Codeboek DUCADAM dataset December 2003 - Kilian Schreuder & Kea Tijdens
03-23 Household consumption and savings around the time of births and the role of education December 2003 - Adriaan S. Kalwij
03-22 A panel data analysis of the effects of wages, standard hours and unionisation on paid overtime work in Britain October 2003 - Adriaan S. Kalwij03-21 A two-step fi rst-difference estimator for a panel data tobit model December 2003 - Adriaan S. Kalwij
03-20 Individuals’ unemployment durations over the business cycle June 2003 - Adriaan Kalwei
03-19 Een onderzoek naar CAO-afspraken op basis van de FNV cao-databank en de AWVN-database December 2003 - Kea Tijdens & Maarten van Klaveren
03-18 Permanent and transitory wage inequality of British men, 1975-2001: Year, age and cohort effects October 2003 - Adriaan S. Kalwij & Rob Alessie
03-17 Working women’s choices for domestic help October 2003 - Kea Tijdens, Tanja van der Lippe & Esther de Ruijter
03-16 De invloed van de Wet arbeid en zorg op verlofregelingen in CAO’s October 2003 - Marieke van Essen
03-15 Flexibility and social protection August 2003 - Ton Wilthagen
03-14 Top incomes in the Netherlands and the United Kingdom over the Twentieth Century September 2003 - A.B.Atkinson & dr. W. Salverda
03-13 Tax evasion in Albania: An institutional vacuum April 2003 - Klarita Gërxhani
03-12 Politico-economic institutions and the informal sector in Albania May 2003 - Klarita Gërxhani
Page ● 45
Measurement error in occupational coding: an analysis on SHARE data
AIAS WP 151 ● www.uva-aias.net
03-11 Tax evasion and the source of income: An experimental study in Albania and the Nether- lands May 2003 - Klarita Gërxhani
03-10 Chances and limitations of “benchmarking” in the reform of welfare state structures - the case of pension policy May 2003 - Martin Schludi
03-09 Dealing with the “fl exibility-security-nexus: Institutions, strategies, opportunities and barriers May 2003 - Ton Wilthagen & Frank Tros
03-08 Tax evasion in transition: Outcome of an institutional clash -Testing Feige’s conjecture March 2003 - Klarita Gërxhani
03-07 Teleworking policies of organisations- The Dutch experiencee February 2003 - Kea Tijdens & Maarten van Klaveren03-06 Flexible work - Arrangements and the quality of life February 2003 - Cees Nierop
01-05 Employer’s and employees’ preferences for working time reduction and working time differentia- tion – A study of the 36 hours working week in the Dutch banking industry 2001 - Kea Tijdens
01-04 Pattern persistence in europan trade union density October 2001 - Danielle Checchi & Jelle Visser
01-03 Negotiated fl exibility in working time and labour market transitions – The case of the Netherlands 2001 - Jelle Visser
01-02 Substitution or segregation: Explaining the gender composition in Dutch manufacturing industry 1899 – 1998 June 2001 - Maarten van Klaveren & Kea Tijdens
00-01 The fi rst part-time economy in the world. Does it work? 2000 - Jelle Visser
Amsterdam Institute for Advanced labour Studies
University of Amsterdam
Postal address: PO Box 94025 ● 1090 GA Amsterdam ● The Netherlands
Visiting address: Nieuwe Prinsengracht 130 ● 1018 VZ Amsterdam ● The Netherlands
Tel +31 20 525 4199 ● Fax +31 20 525 4301
[email protected] ● www.uva-aias.net
Information about AIASIASAIAS is an institute for multidisciplinary research and tear multidisciplinary research and t aching at tt the University ofAmsterdam. Founded in 1998, it brings together the Univered in 1998, it brings together the Univversity’s expexpertise in labourstudies.
AIAS research focuses on the analysis of labour markets, social secufocuses on the analysis of labour markets, socin the analysis of labour mae analysis of labour security andgovernance. It combines various disciplinary approaches along three perspcombines various disciplinary approaches alongs various disciplinary approacrious disciplinary appr perspectives:Societal regulations & coordination of markets, Individual transactions in markets and tions & coordination of markets, Individual tranoordination of markets, Indivdination of markets, In markets andSocietal and individual effects. Some of our research programmes are:ndividual effects. Some of our research programmeffects. Some of our research cts. Some of our resea● GINI Growowing Ineququalitiities’ Impacts● Equalsoc network of Excellence (Economic Changes, Quality of Life and Social etwork of Excellence (Economic Changes, QuExcellence (Economic Cellence (Econom
Cohesion)● Solidarity in the he 21st Centuryt
● Flex Work Researchrch Centre● WageIndicator
AIAS offers various in-company courses in the fi eld of HRM, inequality and solidarity,labour market development, labour relations etc.
Annually AIAS organizes conferences about ongoing research and current trendnds.Furthermore, several (lunch) seminars and workshops take place during the yeyear, offeffering interesting opportunities for the exchange and deliberation of research on lababour iissues from all over the world. AIAS has a major collection of academic socio-econnomicc data inthe fi eld of labour relations, labour organizations, employment and workingg condditions inthe Netherlands and abroad. AIAS and its staff contribute to society on manny subbjects,for different audiences and in varying formats (articles, books, reports, interviviews, ppresen-tations etc...). Next to this Working Paper Series, we also have the series ‘Labourur markerketsand industrial relations in the Netherlands’ and the GINI Discussion Papers whichich alsoaddresses a great variety of topics.
AIAS Working Paper Series
The AIAS working paper series consists of several publiccations of Af AIAS staff and AIASguests on a wide variety of subjects in the fi elds of labouour economomics, sociology of work, labour law, and health and safety.
ISSN online 2213-4980ISSN print 1570-3185