WorldLink Diligence Update December 2, 2008. 1 Executive Summary WorldLink is a leading independent...
14
WorldLink Diligence Update December 2, 2008
-
Upload
russell-lindsey -
Category
Documents
-
view
219 -
download
2
Transcript of WorldLink Diligence Update December 2, 2008. 1 Executive Summary WorldLink is a leading independent...

WorldLink Diligence Update
December 2, 2008

2
Executive Summary
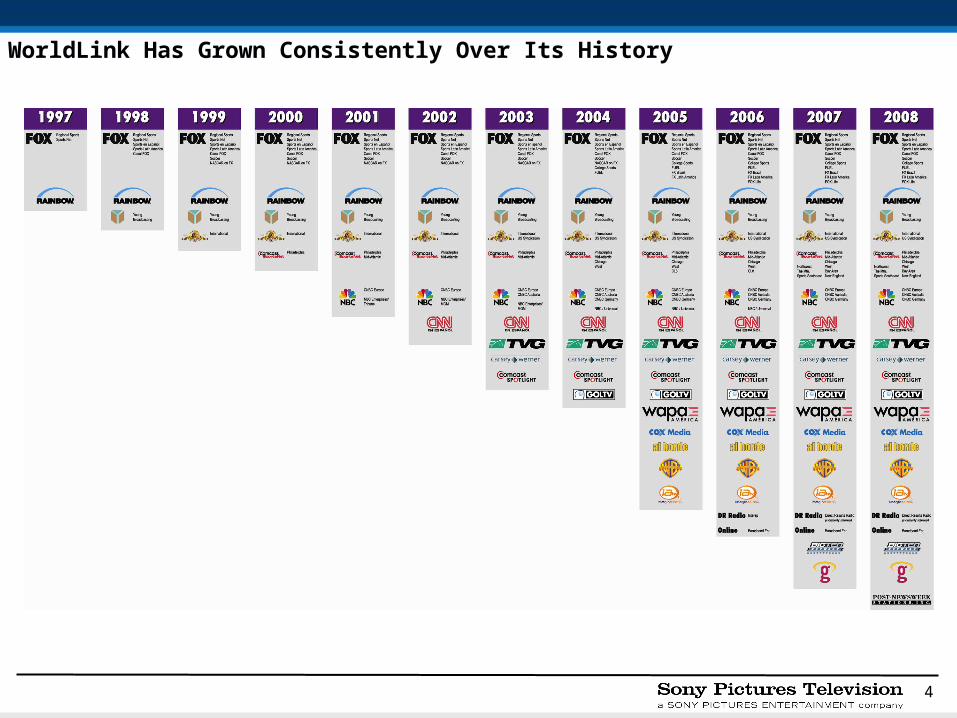
WorldLink is a leading independent representation firm specializing in the direct response market
• WorldLink was founded by Toni Knight in 1997
• The company operates across 8 media outlets including Regional Sports Networks, National Cable, National Broadcast, National Syndication, and U.S. Spanish Language
• Infomercials and Short-Form Direct Response advertising account for 97% of WorldLink revenue
WorldLink is profitable and has demonstrated consistent growth over its recent history
• EBITDA increased by an 8% CAGR over the last three years reaching $3.3MM for CY 2007
• However, WorldLink is forecasting a 15% decline in CY 2008 EBITDA
Initial diligence suggests that WorldLink would be an attractive acquisition for SPT
• WorldLink’s direct response capability complements SPT’s existing ad sales business
• Potential for synergies with SEL (Sony DR)
We propose a deal structure that enables SPT to acquire 51% of WorldLink for $8.2MM against a $16MM valuation
• Purchase price based on preliminary SPT Base case valuation
• 51% stake grants SPT control and will likely make the transaction EBIT neutral
• Structure a put/call (or buy/sell) that provides founder with some upside [discuss approvals required with put/call]
Assuming SPE management support, this deal structure must be discussed with WorldLink’s owner
• Owner seeking upside potential in the “high $20MMs” and a significant portion of cash at close

3
WorldLink Is A Leading Independent Representation Firm Specializing In The Direct Response Market
Overview/Business Model
Market Trends
WorldLink % of Gross Receipts by Media Outlet
WorldLink % Gross Receipts by Inventory Type
29%
17%14%
12%
12%
11%5%
Regional
Broadcast
Local
Espanol
National
Syndication
International
54%43%
3%
Infomercial
DirectResponse
Other
• Provides direct representation services to a cross-platform network of media outlets
• Average commission of 6.6% on gross receipts
• Offers fulfillment services to D.R. vendors and accounting services to network clients via a proprietary platform
• Media outlets serviced include regional sports networks, broadcast, local, espanol, national, syndication, and international
• Television direct response was a $200B industry as of the beginning of 2007
• In 2007, 1,592 short and long-form infomercials ran on cable and network television
• Analysts project weakening in the overall advertising market, although the impact on D.R. is uncertain
– ROI based business model suggests advertisers could increasingly use D.R. in a down market
– Declining consumer confidence may reduce the number of products and services in need of D.R.
4
WorldLink Has Grown Consistently Over Its History

5
# of Active Clients1 Renewal Clauses
Summary of Customer Contracts by Market
National
Regional
Syndication
International
4.6
U.S. Spanish Language
Local
Avg. Remaining Contract Term (months)
14
5.1 20
6.8 12
3.8 10
3.8 14
5.5 10
• Most contracts subject to 1 – 2 year evergreen renewals
• Renewal provisions N/A; 10 additional clients currently in the renewal process
• Most contracts 1 year or less; significant number of opt out provisions
• Most contracts subject to 1 – 2 year evergreen renewals
• Most contracts subject to 1 – 3 year evergreen renewals
• Most contracts subject to 1 – 3 year evergreen renewals
16
13
38
10
14
13
Avg. Client Retention to Date (years)
1) # of active clients represents contracts not in the process of renewal; including potential renewals, active client totals are National (18), Local (23), Regional (39), Syndication (14), U.S. Spanish Language (16), and International (15). Total active clients excluding renewals is 104 and including potential renewals is 125.
6
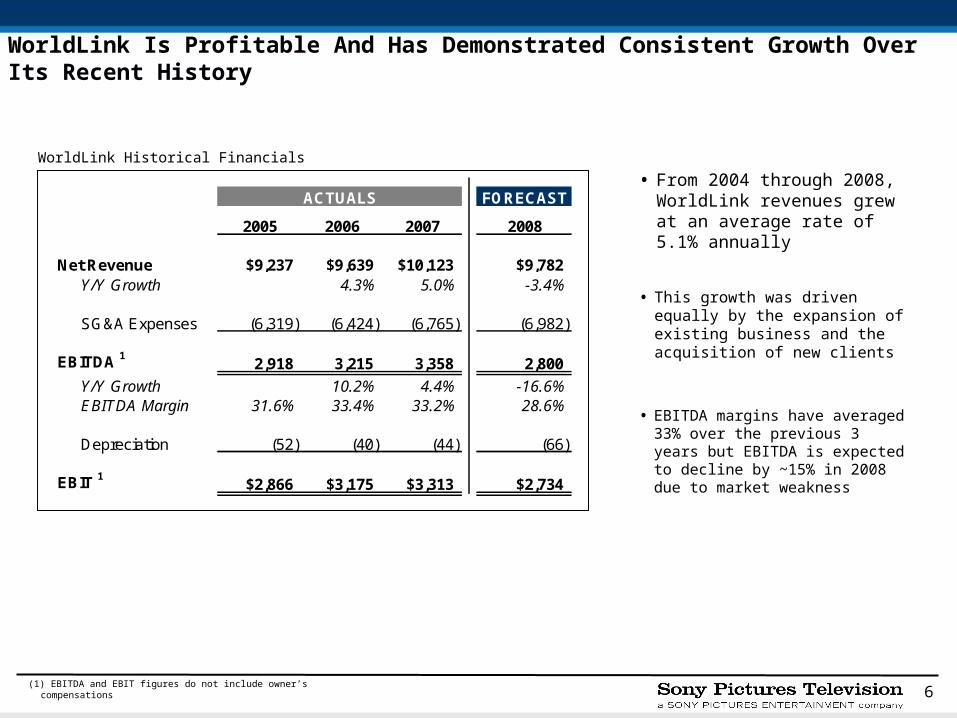
WorldLink Is Profitable And Has Demonstrated Consistent Growth Over Its Recent History
• This growth was driven equally by the expansion of existing business and the acquisition of new clients
WorldLink Historical Financials
• EBITDA margins have averaged 33% over the previous 3 years but EBITDA is expected to decline by ~15% in 2008 due to market weakness
• From 2004 through 2008, WorldLink revenues grew at an average rate of 5.1% annually
(1) EBITDA and EBIT figures do not include owner’s compensations
ACTUALS FORECAST
2005 2006 2007 2008
Net Revenue $9,237 $9,639 $10,123 $9,782Y/Y Growth 4.3% 5.0% -3.4%
SG&A Expenses (6,319) (6,424) (6,765) (6,982)
EBITDA 1 2,918 3,215 3,358 2,800
Y/Y Growth 10.2% 4.4% -16.6%EBITDA Margin 31.6% 33.4% 33.2% 28.6%
Depreciation (52) (40) (44) (66)
EBIT 1 $2,866 $3,175 $3,313 $2,734

7
However, We Must Monitor Q4 2008 Performance to Validate Feasibility of 2009 Forecast
• Q3 2008 declining performance was the result of significant backroom issues with a large client prompting WorldLink to suspend booking associated revenue – management expects issue to be resolved for Q4 2008
• 2009 revenue forecast of $11.3MM based on annualized Q4 2008 performance (note: fair to annualize based on limited business seasonality), increased 3% Y/Y, as well as incremental revenue from a new client valued at approximately $850K
• If Q4 2008 forecast is achieved, 2009 is feasible. We must monitor 2008 performance and the new customer contract for 2009
1) Figures for Q4 2008 represent WorldLink Management low case projections; Q4 high case projections increase CY 2008 EBITDA to $3MM
2) Represents Y/Y growth for CY totals
3) EBITDA and EBIT figures do not include owner’s compensations
WorldLink Quarterly Financial Summary 2007 - 2008
Management Explanation of
Financial Results
NOTE: In diligence received from WorldLink, 2007 quarterly data does not include $270K in costs and as a result does not tie to the full year detailed 2007 model
(000s) 2007 2008 2008 2009
Q1 Q2 Q3 Q4 CY Q1 Q2 Q3 Q4 1 CY Q4 Annualized CY Forecast
Net Revenue $2,565 $2,496 $2,532 $2,529 $10,123 $2,566 $2,464 $2,216 $2,536 $9,782 $10,143 $11,300
Q/Q Growth 2 0.5% -2.7% 1.5% -0.1% 5.0% 1.4% -4.0% -10.1% 14.4% -3.4% 0.2% 15.5%
SG&A Expenses (1,734) (1,932) (1,869) (1,501) (7,035) (1,807) (1,842) (1,757) (1,576) (6,982) (6,303) (7,600)
EBITDA 3 831 564 664 1,028 3,088 758 623 459 960 2,800 3,840 3,700
Q/Q Growth 2 -6.5% -32.1% 17.6% 54.9% -4.0% -26.3% -17.9% -26.3% 109.1% -9.3% 24.3% 32.1%
D&A (10) (10) (11) (13) (44) (16) (19) (13) (18) (66) (72) (66)
EBIT 3 $822 554 653 $1,015 $3,043 $742 $604 $446 $942 $2,734 $3,768 $3,634
EBIT Margin 32.0% 22.2% 25.8% 40.1% 30.1% 28.9% 24.5% 20.1% 37.1% 28.0% 37.1% 32.2%
8
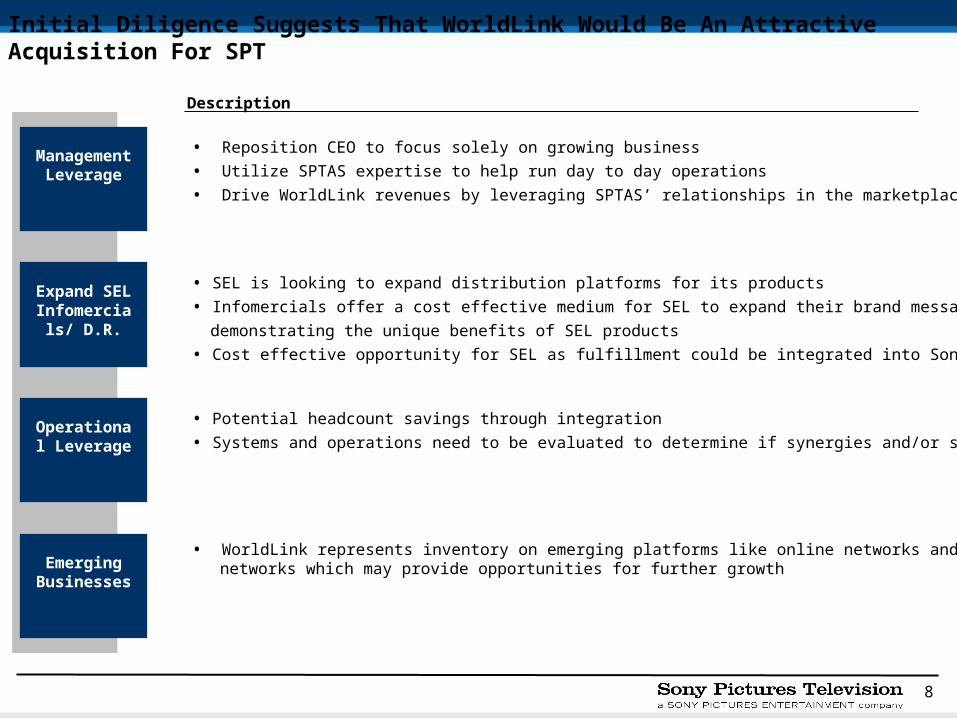
Initial Diligence Suggests That WorldLink Would Be An Attractive Acquisition For SPT
Management Leverage
Expand SEL Infomercials/
D.R.
Operational Leverage
Description
Emerging Businesses
• Reposition CEO to focus solely on growing business
• Utilize SPTAS expertise to help run day to day operations
• Drive WorldLink revenues by leveraging SPTAS’ relationships in the marketplace
• SEL is looking to expand distribution platforms for its products
• Infomercials offer a cost effective medium for SEL to expand their brand messaging by
demonstrating the unique benefits of SEL products
• Cost effective opportunity for SEL as fulfillment could be integrated into Sony Style
• Potential headcount savings through integration
• Systems and operations need to be evaluated to determine if synergies and/or savings exist
• WorldLink represents inventory on emerging platforms like online networks and Hispanic networks which may provide opportunities for further growth

9
Valuation by Case
NOTE: WorldLink valuation based on EBITDA forecast 2009 – 2016 with a 16.5% pre-tax discount rate and 8X terminal value. Reference the Appendix for model assumptions by case.
ACTUALS / FORECAST MANAGEMENT CASE SPT BASE CASE FLAT CASE TEMPLATE
2005 2006 2007 2008 2009 2010 2011 2009 2010 2011 2009 2010 2011
Net Revenue $9,237 $9,639 $10,123 $9,782 $11,300 $12,030 $12,815 $10,484 $11,189 $11,948 $9,782 $9,782 $9,782
SG&A Expenses (6,319) (6,424) (6,765) (6,982) (7,600) (7,890) (8,114) (8,056) (8,528) (8,939) (7,186) (7,186) (7,186)
Adjusted EBITDA $2,918 $3,215 $3,358 $2,800 $3,700 $4,140 $4,700 $2,428 $2,661 $3,009 $2,596 $2,596 $2,596
Purchase Amortization TBD TBD TBD TBDDepreciation (52) (40) (44) (66) (66) (66) (66) (66) (66) (66) (66) (66) (66)
Adjusted EBIT $2,866 $3,175 $3,313 $2,734 $3,634 $4,075 $4,635 $2,362 $2,595 $2,943 $2,530 $2,530 $2,530
VALUATION SCENARIO # 1 - 100% SPT OWNERSHIP
ASSUMES $8.2MM UPFRONT PAYMENT (51%) BASED ON $16MM VALUATION FOR MANAGEMENT CASE AND SPT BASE CASE ASSUMES ADDITIONAL $9.8MM PAYMENT (49%) IN 2012 BASED ON $20MM VALUATION FOR FLAT CASE ASSUMES ADDITIONAL $7.8MM PAYMENT (49%) IN 2012 BASED ON $16MM VALUATION
PV EBITDA (Yrs 2009 - 2016) $13,955 $8,691 $7,223
PV Terminal Value @ 8X 13,132 8,123 5,658
Worldlink Valuation 27,088 16,814 12,882
Less: PV SPT Investment (13,480) (13,480) (12,416)
NPV - Net SPT Investment $13,607 $3,334 $466
VALUATION SCENARIO # 2 - 51% SPT OWNERSHIP
ASSUMES $8.2MM UPFRONT PAYMENT (51%) BASED ON $16MM VALUATION FOR ALL CASES ASSUMES NO ADDITIONAL INVESTMENT AND SPT SALE OF 51% OWNERSHIP IN 2016
PV EBITDA (Yrs 2009 - 2016) $10,076 $6,317 $5,455
PV Terminal Value @ 8X 6,697 4,143 2,886
Worldlink Valuation 16,773 10,459 8,340
Less: PV SPT Investment (8,160) (8,160) (8,160)
NPV - Net SPT Investment $8,613 $2,299 $180

10
An Initial Review Of Potential Purchase Price Amortization Suggests A WorldLink Acquisition Could Be EBIT Positive In Year 1
2009 SPT EBIT Sensitivity Table
EBIT Calculation Methodology:
1) Consolidate EBITDA 100% of WorldLink EBITDA
(1) Resulting EBITDA for each revenue growth scenario based on SG&A expenses increasing 10% 2008 – 2009.
(2) SPT to pay an $8.2MM upfront payment (51% of total purchase price) based on a total valuation of $16MM; amortization based on SPT’s 51% share of the fair value of WorldLink’s assets / liabilities.
2) Recognize SPT share of deal amortization (51%)
3) Recognize SPT EBIT
4) Subtract Minority Interest EBITDA (49%)
5) Recognize SPT Net Income
• Subject to further review by SPE accounting
PURCHASE PRICE: $16MMFair Value of Assets / Liabilities Acquired by SPT 2
$4,000,000 $5,000,000 $5,500,000 $6,000,000 $7,000,000
Resulting AmortizationRevenue Resulting $1,000,000 $1,250,000 $1,375,000 $1,500,000 $1,750,000Growth EBITDA 1
15.5% $3,026,545 $1,961,017 $1,711,017 $1,586,017 $1,461,017 $1,211,0176% $2,094,733 $1,029,205 $779,205 $654,205 $529,205 $279,2055% $1,996,917 $931,388 $681,388 $556,388 $431,388 $181,3884% $1,899,100 $833,572 $583,572 $458,572 $333,572 $83,5723% $1,801,284 $735,755 $485,755 $360,755 $235,755 ($14,245)2% $1,703,467 $637,939 $387,939 $262,939 $137,939 ($112,061)
4 YEAR AMORTIZATION

11
Potential Deal Structure
• High-level structure– Acquire 51% at close for $8.2MM ($16MM valuation) – At Year 3, Sony has a call option on 49% of the company at a discount to market– Market value mechanism to be discussed (e.g. exit multiple or 3rd party firm)
• Critical points to communicate– Valuation requires strong performance in Q4’08 and Q1’09 (e.g., $2.5MM in quarterly revenue)– Close is expected in April 2009
• Structural details to consider– Discount mechanism for the call option
• If Knight been with business for the next 3 years, Sony “call” is at a total value of Closing value + [75%] of the growth in value• If Knight has left company, Sony “call” is at a total value of Closing value + [50%] of the growth in
value
– Knight may ask for a mechanism to force a liquidity decision• For example, a “Russian Roulette” mechanism would force the issue. If Sony does not exercise its call, owner can buy at 80% of market
value
The below structure could address SPE’s concerns but has not yet been reviewed by WorldLink’s owner

12
Next Steps
• S. Mosko to discuss deal feasibility with M. Lynton; J. Underwood to give Calkins a heads-up
• Assuming reasonable likelihood of deal approval, J. Underwood to discuss deal structure with WorldLink owner; including potential of a post-March deal close
• Proceed to LOI

13
APPENDIX

14
Model Assumptions
REVENUE
Existing Business Growth 2009 2010 2011 2012 2013 2014 2015 2016Management Case 3.0% 3.0% 3.0% 3.0% 3.0% 3.0% 3.0% 3.0%SPT Base 3.0% 3.0% 3.0% 3.0% 3.0% 3.0% 3.0% 3.0%Flat Case 0.0% 0.0% 0.0% 0.0% 0.0% 0.0% 0.0% 0.0%
New ClientsManagement Case 3.0 1.0 1.0 SPT Base Case 1.0 1.0 1.0 Flat Case - - -
SALARY EXPENSE
Salary GrowthManagement Case 3.0% 3.0% 3.0% 3.0% 3.0% 3.0% 3.0% 3.0%SPT Base Case 3.0% 3.0% 3.0% 3.0% 3.0% 3.0% 3.0% 3.0%Flat Case 0.0% 0.0% 0.0% 0.0% 0.0% 0.0% 0.0% 0.0%
New Employee HiresManagement Case 7 - - SPT Base Case 2 2 2 Flat Case - - -
Other Cost GrowthManagement Case 1.5% 1.5% 1.5% 1.5% 1.5%SPT Base Case 1.5% 1.5% 1.5% 1.5% 1.5%Flat Case 0.0% 0.0% 0.0% 0.0% 0.0%
Taxes / Benefits % of Salary Expense 27.0%
Management Case Forecast