WORLD E NERGY Trilemma Index
68
In partnership with Oliver Wyman WORLD ENERGY Trilemma Index 2021
Transcript of WORLD E NERGY Trilemma Index

In partnership with Oliver Wyman
WORLD ENERGY
Trilemma Index
2021

2
WO
RLD
EN
ERG
Y C
OU
NC
IL
The World Energy Council is the principal impartial network of energy leaders and practitioners promoting an affordable, stable and environmentally sensitive energy system for the greatest benefit of all. Formed in 1923, the Council represents the entire energy spectrum, with over 3,000 member organisations in over 80 countries, drawn from governments, private and state corporations, academia, NGOs and energy stakeholders. We inform global, regional and national energy strategies by hosting high-level events including the World Energy Congress and publishing authoritative studies, and work through our extensive member network to facilitate the world’s energy policy dialogue. Further details at www.worldenergy.org and @WECouncil Published by the World Energy Council 2021 Copyright © 2021 World Energy Council. All rights reserved. All or part of this publication may be used or reproduced as long as the following citation is included on each copy or transmission: ‘Used by permission of the World Energy Council’ World Energy Council Registered in England and Wales No. 4184478 VAT Reg. No. GB 123 3802 48 Registered Office 62–64 Cornhill London EC3V 3NH United Kingdom
The World Energy Council’s definition of energy sustaina-bility is based on three core dimensions: Energy Security, Energy Equity, and Environmental Sustainability of Energy Systems.
Balancing these three goals constitutes a ‘Trilemma’ and balanced systems enable prosperity and competitiveness of individual countries.
The World Energy Trilemma Index has been prepared annually since 2010 by the World Energy Council in partnership with global consultancy Oliver Wyman, along with Marsh McLennan Advantage of its parent Marsh McLennan Companies. It presents a comparative ranking of 127 countries’ energy systems, and provides an assessment of a country’s energy system performance, reflecting balance and robustness in the three Trilemma dimensions.
Access the complete Index results, national Trilemma pro-files and the interactive Trilemma Index tool to find out more about countries’ Trilemma performance and what it takes to build a sustainable energy system can be found at: https://trilemma.worldenergy.org
World Energy Trilemma Index 2021, published by the World Energy Council in partnership with OLIVER WYMAN.
WORLD ENERGY TRILEMMA INDEX 2021
ABOUT

5658
ANNEX A: FREQUENTLY ASKED QUESTIONS
ANNEX B: INDEX RANKINGS & POLICIES
65ACKNOWLEDGMENTS
TABLE OF CONTENTS
040711121316202530
37
60
FOREWORD
2021 TRILEMMA RESULTS
REGIONAL ENERGY PROFILES
ANNEX C: INDEX METHODOLOGY
EXECUTIVE SUMMARY
2021 TOP PERFORMERS AND IMPROVERS
2021 WORLD ENERGY TRILEMMA INDEX
INTRODUCTION
TRENDS IN ENERGY SECURITY
TRENDS IN ENERGY EQUITY
TRENDS IN SUSTAINABILITY
AFRICA
ASIA
EUROPE
MIDDLE EAST AND GULF STATES
NORTH AMERICA
LATIN AMERICA AND THE CARIBBEAN

4
WO
RLD
EN
ERG
Y C
OU
NC
IL
FOREWORD
4
WO
RLD
EN
ERG
Y C
OU
NC
IL
MAKING (COMMON) SENSE OF OUR CHANGING RELATIONSHIPS WITH ENERGY
The world needs more sustainable energy and our relationship with energy and, consequently, with each other, is shifting and transforming. The need to involve more people and diverse communities in being better able to appreciate and navigate the role of energy in everyday life has never been greater.
Today’s energy leadership landscape is crowded, competitive, often confusing, and increasingly costly. Confrontation and extreme polarisation have become commonplace.
In my role as the Secretary General and CEO of the World Energy Council, I am often asked to make sense of world energy developments by increasingly diverse energy interests – incumbent energy producers, new power suppliers, investors and academics, regulators and journalists, climate and poverty activists. I do not have a crystal ball, but I can harness the wisdom of the crowd.
Building new energy bridges for another centuryIt is not easy to be impartial and impactful, but it is what we are and have been for nearly 100 years. As a charity, our work and insights are non-proprietary and, as such, are well used, which we take as a huge compliment, and as the
6th Secretary General and CEO, I can assure you that our prime focus is on increasing our impact in driving a step change in global energy transitions.
There are several areas where we continue to excel in forging new common sense and leveraging our ‘built in’ scale to progress better energy for all people and a healthy planet.
Our self-organising, locally deep and globally networked energy community is open to all and second to none. Our membership base connects diverse energy interests across all corners of the planet, different spheres of government, civil society, academia and business, and reaches beyond the energy industry. Our investment for over 40 years in Future Energy Leaders and our more recent championing of Start-up Energy Transition Entrepreneurs, is our antidote to the institutional curse of ‘pale, male, stale’. We are refreshingly old and arguably one of the world’s first ‘phone a friend’ energy communities
We understand that context matters and that that ‘no one size fits all’ when it comes to energy transitions and power transformations. The depth and breadth of our network ena-bles us to support societies to appreciate the scope and scale of the global energy transition challenge and to learn with and from the increasing diversity in energy solutions.
The triannual World Energy Congress and annual World Energy Week provide a rare venue for honest dialogue, productive disagreement, and networked collaboration. We are excited to be marking the start of our centenary year with the St Petersburg 25th World Energy Congress, Russia, in October 2022. It will be a moment to remember – an important checkpoint for our Humanising Energy vision and its impact, and a chance to add our voices to the global call for action on sustainable development and climate neutrality at the start of a pivotal decade of delivery.

5
TRIL
EMM
A IN
DEX
202
1
5
TRIL
EMM
A IN
DEX
202
1
The technocratic race to zero…The proliferation of net zero targets and roadmaps in the run up to the COP26 UNFCC meeting is a promising start, but success will be determined by people and practicalities, not political promises and plans.
Energy literacy remains poor across many stakeholder groups. Not in the sense of profes-sional knowhow and engineering expertise, although capabilities are unevenly spread. But rather in the general lack of appreciation and understanding that, for all of us, our relation-ship with energy is changing.
Energy agendas meanwhile remain technocratic, supply-centric, and highly territorial. Some advocates wrangle over the colour of new fuel types, whilst billions of people have no connection to electricity or lack access to quality energy for clean cooking, better health, and new livelihoods. Some voices are powerful, yet many remain literally power-less.
No wonder, silent majorities often appear disinterested or paralysed. Who is not confused by the overwhelming analysis of the problem, the different roadmaps, and the multitude of ‘high level’ summits and proclamations?
Energy ‘citizens’ across all geographies are staring into a thick fog of uncertainty. They seek greater clarity about their role. Some are hoping ‘someone’ else will fix the system so that their behaviours don’t need to change. Others are looking for new ways to self-organise and play their part.
In driving forward action with many more hands on the wheel, it is also important to take a good hard look in the rear-view mirror to understand whether we are heading in the right direction.
Where the World Energy Trilemma Index fits inThis is where the annual World Energy Trilemma Index, now in its 11th year, fits in. It seeks to provide a comprehensive and comprehensible rear-view mirror.
Before travel became restricted, the World Energy Trilemma Index was often the first thing mentioned by Council stakeholders upon my arrival. After ‘hello and welcome’, a usual question was why aren’t we higher in the global ranking!
The World Energy Trilemma Index was one of the first energy policy decision-support tools to recognise that binary trade-offs are not sufficient and a new integrated policy framework is essential in designing sustainable energy systems that meet the connected challenges of energy security, energy equity and affordability and environmental sustainability. As the name suggests, the World Energy Trilemma Index, enables us to look at new energy realities and policy design challenges through three lenses.

6
WO
RLD
EN
ERG
Y C
OU
NC
ILW
OR
LD E
NER
GY
CO
UN
CIL
Dr Angela Wilkinson Secretary General
& CEO
6
The World Energy Trilemma Index is the only retrospective tool in the unique World Energy Transition Leaders Toolkit. The other tools support forward pathfinding:
• The World Energy Transition Radar detects real time signals of recovery and transition actions to clarify the speed and direction of global energy transition.
• The annual World Energy Issues Monitor takes a snapshot of the present risk and opportunity landscape.
• The World Energy Scenarios provide new and alternative stories of the future of world energy, which have been co-created by members across the world.
Societies everywhere are searching for new and better ways to address globally connected challenges in an era of energy for people and planet, peace and prosperity. New energy developments are changing all our relationships as we recover from crisis, repair the planet, renew the wellbeing of whole societies, and better prepare for future shocks by building in resilience now.
The World Energy Trilemma Index is a trusted tool used by stakeholders across the energy spectrum and can play a vital role in convening impact-orientated conversations around energy.
Humanising Energy – A better way to build forward together!As the world learns how to navigate the emerging energy–cyber–climate stress nexus and avoid a global winner–takes–all technology race to zero, the World Energy Trilemma framework will continue to evolve into a flexible tool that can
be used to improve the quality of policy design at all levels of society and global energy governance matters.
Societies have never built back better. By humanising energy societies can build forward together!
Sir Phillip Lowe Chair
World Energy Trilemma

7
TRIL
EMM
A IN
DEX
202
1
EXECUTIVE SUMMARYThis is the second year that the Council has published the World Energy Trilemma Index during the COVID-19 pandemic, which continues to threaten health and disrupt the global economy. The Trilemma is an annual measurement of national energy systems that relies upon historic data to assess historic past energy policy performance and, as such, the impact of the pandemic is not yet fully reflected in the data. While further insights into the effect of the pandemic on energy are becoming visible, such as depressed demand and fragmented local recoveries, the longer-term implications for energy systems and transition remain unclear.
National context is critical to how countries develop their different energy policies, based upon their domestic circumstances with varying natural resources, geographies, and socio-economic systems. These differing contexts lead to a divergence of systems that means that there can be no single path for a successful energy transition; instead, each country must determine its own best energy policy pathway with respect to its national situation and priorities. Such diversity means that direct comparisons between the rankings and scores of countries in the Trilemma are less informative, but instead should help provide an opening for a dialogue, with countries learning from and with each other about what policies work in what circumstances and why. The Energy Trilemma Index can help countries and energy stakeholders to prioritise those areas of energy policy to improve most and explore which options might be more appropriate.
2021 RESULTSThis year, 127 countries have been ranked into 101 places, as some have achieved the same scores. The overall top ten ranks for the 2021 Trilemma continue to be dominated by OECD countries, with European countries performing particularly strongly, reiterating the importance of having longstanding active energy policies. The top three ranking countries remain the same as in 2020, with Sweden just overtaking Switzerland to the top spot, and Denmark remaining in third place. All three countries have overall scores of 83 and above. Canada, New Zealand and the United States break the OECD European monopoly (Table 1).
Table 1: 2021 Top Trilemma performers
Source: World Energy Council Source: World Energy Council
Table 2: 2021 Top Trilemma improvers
United Kingdom AAAa 4
Rank Grade
TOP 10 RANK OVERALL PERFORMERS
Sweden AAAa 1Switzerland AAAa 2
Denmark AAAa Finland AAAa 4
France AAAa 5Austria AAAa 5
Canada AABa 6Germany AAAa 7
Norway BAAa 8
United States AABa 9New Zealand AAAa 9
Spain ABAa10Luxembourg CAAa10
WORLD ENERGYTRILEMMA INDEX
2021
3
TOP 10 COUNTRIES OVERALL IMPROVERS
57%
34%
33%
33%
31%
28%
26%
26%
25%
25%
Cambodia
Myanmar
Dominican Republic
Kenya
Ethiopia
Honduras
Thailand
Nicaragua
Sri Lanka
China
CDDd
BDCd
DCBc
BDBc
DDCd
CDBd
CCCb
CDBd
CCBc
BBDb
Rank
51
60
53
76
88
80
59
83
82
78
Grade Improvement since 2000
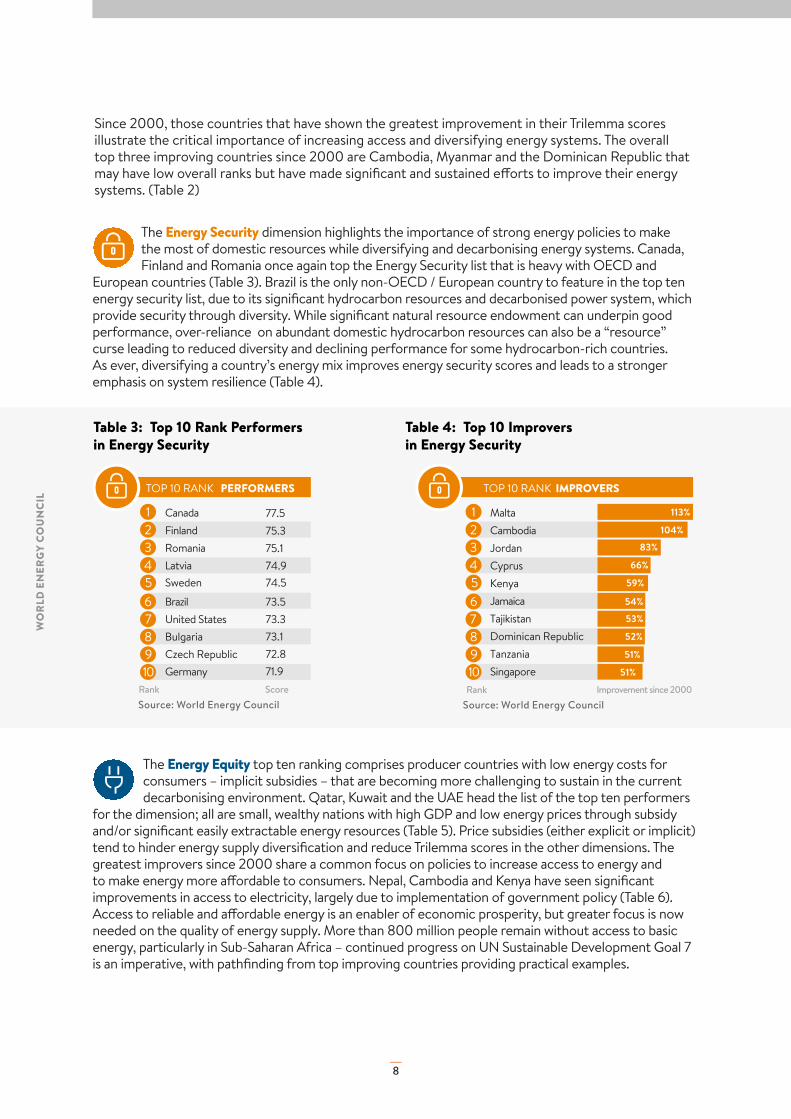
The Energy Security dimension highlights the importance of strong energy policies to make the most of domestic resources while diversifying and decarbonising energy systems. Canada, Finland and Romania once again top the Energy Security list that is heavy with OECD and
European countries (Table 3). Brazil is the only non-OECD / European country to feature in the top ten energy security list, due to its significant hydrocarbon resources and decarbonised power system, which provide security through diversity. While significant natural resource endowment can underpin good performance, over-reliance on abundant domestic hydrocarbon resources can also be a “resource” curse leading to reduced diversity and declining performance for some hydrocarbon-rich countries. As ever, diversifying a country’s energy mix improves energy security scores and leads to a stronger emphasis on system resilience (Table 4).
8
WO
RLD
EN
ERG
Y C
OU
NC
IL
Table 3: Top 10 Rank Performers in Energy Security
Table 4: Top 10 Improvers in Energy Security
Sweden 74.5 5
Rank Score
TOP 10 RANK
PERFORMERS
Canada 77.51 Finland 75.3 2Romania 75.1 3Latvia 74.9 4
Brazil 73.5 6United States 73.3 7Bulgaria 73.18Czech Republic 72.8 9Germany 71.9 10
Improvement since 2000
Kenya5
Rank
Malta1 Cambodia2Jordan3Cyprus4
Jamaica6Tajikistan7Dominican Republic8Tanzania9Singapore10
113%
104%
83%
66%
59%
54%
53%
52%
51%
51%
Improvement since 2000
Panama 83.7 5
Rank Score
Switzerland 88.21 Sweden 86.3 2Uruguay 85.4 3Norway 84.4 4
Brazil 83.4 6Denmark 82.9 7France 82.7 8Albania 82.5 9United Kingdom 81.3 10
Thailand5
Rank
Denmark1 Azerbaijan2Ukraine3Myanmar4
China6Ireland7Panama8Malta9Serbia10
30%
28%
22%
22%
22%
21%
20%
20%
20%
19%
Improvement since 2000Rank Score
Qatar 99.91 Kuwait 99.8 1UAE 99.8 1
Bahrain 99.6 2Oman 99.6 2
Iceland 99.2 3Luxembourg 99.0 4Ireland 98.4 5Switzerland 98.0 6
Israel 97.37United States 97.18United Kingdom 96.89Denmark 96.410Austria 96.410
Saudi Arabia 97.4 7
Rank
Nepal1 212%
Cambodia2 134%
Kenya3 129%
Benin4 121%
Ethiopia5 108%
Bangladesh6 102%
Sri Lanka7 80%
Iraq8 80%
Mongolia9 78%
Nigeria10 73%
TOP 10 RANK IMPROVERS
TOP 10 RANK PERFORMERS TOP 10 RANK IMPROVERS
TOP 10 RANK PERFORMERS TOP 10 RANK IMPROVERS
Source: World Energy Council Source: World Energy Council
Since 2000, those countries that have shown the greatest improvement in their Trilemma scores illustrate the critical importance of increasing access and diversifying energy systems. The overall top three improving countries since 2000 are Cambodia, Myanmar and the Dominican Republic that may have low overall ranks but have made significant and sustained efforts to improve their energy systems. (Table 2)
The Energy Equity top ten ranking comprises producer countries with low energy costs for consumers – implicit subsidies – that are becoming more challenging to sustain in the current decarbonising environment. Qatar, Kuwait and the UAE head the list of the top ten performers
for the dimension; all are small, wealthy nations with high GDP and low energy prices through subsidy and/or significant easily extractable energy resources (Table 5). Price subsidies (either explicit or implicit) tend to hinder energy supply diversification and reduce Trilemma scores in the other dimensions. The greatest improvers since 2000 share a common focus on policies to increase access to energy and to make energy more affordable to consumers. Nepal, Cambodia and Kenya have seen significant improvements in access to electricity, largely due to implementation of government policy (Table 6).Access to reliable and affordable energy is an enabler of economic prosperity, but greater focus is now needed on the quality of energy supply. More than 800 million people remain without access to basic energy, particularly in Sub-Saharan Africa – continued progress on UN Sustainable Development Goal 7 is an imperative, with pathfinding from top improving countries providing practical examples.

9
TRIL
EMM
A IN
DEX
202
1
Table 5: Top 10 Performers in Energy Equity
Table 7: Top 10 Performers in Environmental Sustainability
Table 6: Top 10 Improvers in Energy Equity
Table 8: Top 10 Improvers in Environmental Sustainability
Sweden 74.5 5
Rank Score
TOP 10 RANK
PERFORMERS
Canada 77.51 Finland 75.3 2Romania 75.1 3Latvia 74.9 4
Brazil 73.5 6United States 73.3 7Bulgaria 73.18Czech Republic 72.8 9Germany 71.9 10
Improvement since 2000
Kenya5
Rank
Malta1 Cambodia2Jordan3Cyprus4
Jamaica6Tajikistan7Dominican Republic8Tanzania9Singapore10
113%
104%
83%
66%
59%
54%
53%
52%
51%
51%
Improvement since 2000
Panama 83.7 5
Rank Score
Switzerland 88.21 Sweden 86.3 2Uruguay 85.4 3Norway 84.4 4
Brazil 83.4 6Denmark 82.9 7France 82.7 8Albania 82.5 9United Kingdom 81.3 10
Thailand5
Rank
Denmark1 Azerbaijan2Ukraine3Myanmar4
China6Ireland7Panama8Malta9Serbia10
30%
28%
22%
22%
22%
21%
20%
20%
20%
19%
Improvement since 2000Rank Score
Qatar 99.91 Kuwait 99.8 1UAE 99.8 1
Bahrain 99.6 2Oman 99.6 2
Iceland 99.2 3Luxembourg 99.0 4Ireland 98.4 5Switzerland 98.0 6
Israel 97.37United States 97.18United Kingdom 96.89Denmark 96.410Austria 96.410
Saudi Arabia 97.4 7
Rank
Nepal1 212%
Cambodia2 134%
Kenya3 129%
Benin4 121%
Ethiopia5 108%
Bangladesh6 102%
Sri Lanka7 80%
Iraq8 80%
Mongolia9 78%
Nigeria10 73%
TOP 10 RANK IMPROVERS
TOP 10 RANK PERFORMERS TOP 10 RANK IMPROVERS
TOP 10 RANK PERFORMERS TOP 10 RANK IMPROVERS
Source: World Energy Council
Source: World Energy Council
Source: World Energy Council
Source: World Energy Council
In the Environmental Sustainability dimension, the top ten rank showcases strong policy efforts to decarbonise and diversify energy systems with Switzerland, Sweden and Uruguay heading the list (Table 7). A diversified energy system, supported by strong policy instruments to reduce
greenhouse gas emissions significantly, coupled with energy efficiency measures, deliver a strong performance in the environmental sustainability dimension. Driving down energy intensity can assist countries yet to decarbonise their energy mix. However, ensuring an inclusive decarbonisation that leaves no communities behind will be essential to humanise energy transition. The greatest improvers since 2000 show continued policy efforts together with some anomalies – Ukraine reduced imports and increased nuclear generation since 2015 (Table 8).

10
WO
RLD
EN
ERG
Y C
OU
NC
IL
Figure 1: World Energy Trilemma Index dimensions
ENVIRONMENTALSUSTAINABILITY
ENERGYEQUITY
ENERGYSECURITY
MEASURES:
Ability to meet currentand future energy demand
Withstand and respondto system shocks
MEASURES:
Ability to provide universalaccess to reliable,
energy for domesticand commercial use
MEASURES:
Ability to mitigateand avoidenvironmentaldegradation andclimate change impacts
COVERS:
of domestic/externalenergy sources
Reliability and resilienceof energy infrastructure
COVERS:
Basic access to electricityand clean cooking fuelsand technologies
Access to prosperity-enabling
COVERS:
generation,transmission
Distribution, decarbonisation,and air quality
ENVIRONMENTALSUSTAINABILITY
ENERGY EQUITY
ENERGY SECURITY
MEASURESAbility to meet currentand future energy demand
Withstand and respondto system shocks
Ability to provide universalaccess to reliable,
energy for domesticand commercial use
Ability to mitigateand avoidenvironmentaldegradation andclimate change impacts
COVERS
MEASURES COVERS
of domestic/external energy sources
Reliability and resilienceof energy infrastructure
Basic access to electricity and cleancooking fuels and technologies
Access to prosperity-enabling
generation, transmission
Distribution, decarbonisation,and air quality
MEASURES COVERS
Source: World Energy Council
The global energy sector is facing unprecedented change as countries strive to decarbonise and shape a more inclusive energy transition as they seek to recover from the economic shocks generated by the pandemic.
Energy policies and regulations tend to lag the market changes and generally move forward in incremental steps, but they can occasionally leap-forward to reframe energy markets to enable new technologies and business models. As a result, the Energy Trilemma Index also must evolve continually to ensure that it remains relevant by including the indicators that best reflect the evolving energy sector and by modifying data sources or indicator coverage.
In addition, we must not lose sight of the impact of the COVID-19 pandemic. We anticipate that the challenges and opportunities presented by post-pandemic recovery will reshape energy policies and the agenda for energy transition. Here the Trilemma can help the dialogue as a pathfinding tool to a more equitable, sustainable and affordable energy future.

2021 TRILEMMA RESULTS
2021 Trilemma score against the difference of 2000 score
Cambodia
Kenya
DominicanRepublic
Myanmar
Ethiopia
Honduras
Nicaragua
Sri LankaThailand
China
Change since 2000 (%)
-10% 0% +10% +20% +30% +40% +50% +60%
2021
Trile
mm
a sc
ore
30
40
50
60
70
80
85
The top improvers made significant strides in access to modern energy and electrification, many of which are consistently
seeing improvement in these indicators.
Top 10 countries OVERALL IMPROVERS
Top 10 ranks OVERALL PERFORMERS
SwitzerlandSweden
DenmarkAustria
GermanyUnited States
FinlandCanada
United Kingdom
New ZelandNorway
France
Luxembourg Spain
World Energy Trilemma Index
ENERGYEQUITY75 /100
ENVIRONMENTALSUSTAINABILITY
66/100
ENERGYSECURITY
58/100
Reflects a nation’s capacity to meet current and future energy demandreliably, withstand and bounce back swiftly from system shocks with minimal disruption to supplies.
Assesses a country’s ability to provide universal access to a�ordable, fairly priced and abundant energy for domestic and commercial use.
Represents the transition of a country’s energy system towards mitigating and avoiding potential environmental harm and climate change impacts.
Source: World Energy Council
Source: World Energy Council

0%
-10%
-20%
+10%
+20%
+30%
+40%
+50%
+60%
% D
i�er
ence
cha
nge
in Tr
ilem
ma
scor
e
2000 2005 2010 2015 2021
NicaraguaSri LankaChina
ThailandHonduras
Kenya
Myanmar
Ethiopia
Cambodia
Dominican Rep.
LuxembourgSwitzerlandSweden
France
United KingdomFinlandCanadaNew ZealandNorway
United States
Germany
Denmark
Spain
Austria
Improvement is incremental for top performing countries.
Significant improvements in performance are typically seen in countries further down the ranking.
Top improversTop performersOther countries
2021 TOP PERFORMERS AND IMPROVERS
2021 Trilemma Indexed trends since the baseline of 2000
Source: World Energy Council
Source: World Energy CouncilScore is rounded to one decimal point. Countries share a rank if difference in their score is less than 0.1.
United Kingdom AAAa 81.7 4
Rank Grade Score
ENERGYEQUITY96 /100
ENVIRONMENTALSUSTAINABILITY
78/100
ENERGYSECURITY
69/100
TOP
10 R
AN
K O
VERA
LL P
ERFO
RMER
S
Sweden AAAa 84.2 1 Switzerland AAAa 83.8 2Denmark AAAa 83.0 3Finland AAAa 81.7 4
France AAAa 81.1 5Austria AAAa 81.0 5Canada AABa 80.6 6Germany AAAa 80.4 7Norway BAAa 79.6 8
United States AABa 79.0 9New Zealand AAAa 79.1 9
Luxembourg CAAa 76.910Spain ABAa 76.910
57%
34%
33%
33%
31%
28%
26%
26%
25%
25%
Cambodia
Myanmar
Dominican Rep.
Kenya
Ethiopia
Honduras
Thailand
Nicaragua
Sri Lanka
China
CDDd
BDCd
DCBc
BDBc
DDCd
CDBd
CCCb
CDBd
CCBc
BBDb
47.5
47.4
60.7
50.7
42.1
52.5
62.7
51.7
60.1
64.0Rank
51
60
53
76
88
80
59
83
82
78
Grade Score
ENERGYEQUITY39 /100
ENVIRONMENTALSUSTAINABILITY
65/100
ENERGYSECURITY
54/100
TOP
10 C
OU
NTR
IES
OVE
RALL
IMPR
OVE
RS
Improvement since 2000

2021 WORLD ENERGY TRILEMMA INDEXCountry Rank
Score0 20 40 60 80 Grade
Sweden 1 AAAaSwitzerland 2 AAAaDenmark 3 AAAaUnited Kingdom 4 AAAaFinland 4 AAAaFrance 5 AAAaAustria 5 AAAaCanada 6 AABaGermany 7 AAAaNorway 8 BAAaNew Zealand 9 AAAaUnited States 9 AABaLuxembourg 10 CAAaSpain 10 ABAaIreland 11 CAAaBelgium 12 BAAaHungary 12 ABBbUruguay 13 BBAbLithuania 14 BBAaPortugal 14 BBAaIceland 15 CABaItaly 15 ABAbNetherlands 16 BABaJapan 16 BAAaSlovenia 17 ABAaAustralia 18 AACaCzech Republic 19 ABBaLatvia 20 ABBaEstonia 20 ABBaMalta 21 DAAaRomania 21 ABAbSlovakia 22 ABAbCroatia 23 ABAbBulgaria 24 ABBbMalaysia 25 BBCaBrazil 26 ACAcIsrael 27 CABaRussia 28 ABCcArgentina 29 ABBdPoland 30 BBCbCosta Rica 30 CBAbQatar 31 AADaKorea (Rep.) 32 BBCaUnited Arab Emirates 33 BADaSingapore 34 DABaEcuador 34 ACAdHong Kong 35 DABaColombia 36 ACAcChile 37 BBBaBrunei 38 CACbAzerbaijan 39 ABCcGreece 39 CBAcKazakhstan 40 ABDcSaudi Arabia 41 BADbBahrain 42 BADcCyprus 42 DABaUkraine 43 ACBdMexico 43 BBBcPeru 44 ACAbGeorgia 44 CCBbKuwait 45 CADbEl Salvador 46 BCAdAlbania 47 CCAcTurkey 47 BBBdIran (Islamic Republic) 48 ABDdOman 48 CADbPanama 49 DCAbMauritius 50 DBBaChina 51 BBDbParaguay 52 CCAdArmenia 53 CCBcTrinidad & Tobago 53 CADcThailand 53 CCCbEgypt 54 BBDdMontenegro 55 CCBcSerbia 55 BCCcAlgeria 56 CBCdGabon 57 BCBdNorth Macedonia 57 CCCcTunisia 58 CCCc
EnergySecurity
EnergyEquity
EnvironmentalSustainability
CountryContext
WO
RLD
EN
ERG
Y CO
UN
CIL
Energy Security
Energy Equity
Environmental Sustainability
Country Context

What does the country’s performance show?
Range of values: A (best), B, C, D (worst) Example: AAAa, ABAc, BCDb, DCDdMeaning: A grade is given for performance in three main dimensions (1st letter for Security, 2nd Equity, 3rd Sustainability) which cover 90% of the overall grade and an additional dimension (4th letter for Country Context) which covers the remaining 10%. The value of the grade depends on which quartile the country’s score falls into:• Grade A: top 25% countries• Grade B: between top 25% and 50%• Grade C: between 50% and 75%• Grade D: between 75% and 100%
Range of values: 1 (best) ... 101 (worst)Example: Shared rank 4 determined by the 4th best score value of 81.7Meaning: The rank only provides a short and limited information about a country’s performance – it only informs where the country lies in the full Index, therefore the grade, the score, the context and especially the full indexed history of the country’s performance should be taken into account when comparing with other countries.We have used a dense ranking approach because some scores are tied at one decimal place.
Range of values: 100 (best) ... 0 (worst) Example: 84.3, 53.4, 32.1Meaning: A score value is given for overall performance as well as for each dimension (Security, Equity, Sustainability, Country Context) determined by country’s performance in the indicators. The score can change even if the underlying data did not change, reflecting performance changes of other countries, who may have improved in a given indicator.
Please note that because the Methodology has evolved direct comparisons of ranking, grades and scores to previous reports is not possible. Historical performance has been recalculated using the same revised Methodology back to the Index year 2000.
GRADE RANK SCOREAAAa
Paraguay 52 CCAdArmenia 53 CCBcTrinidad & Tobago 53 CADcThailand 53 CCCbEgypt 54 BBDdMontenegro 55 CCBcSerbia 55 BCCcAlgeria 56 CBCdGabon 57 BCBdNorth Macedonia 57 CCCcTunisia 58 CCCcIndonesia 58 ACCcBosnia and Herzegovina 59 BCDdDominican Republic 59 DCBcSri Lanka 60 CCBcVietnam 61 BCDcMorocco 61 CCCcAngola 62 ADAdBolivia 63 BCCdSouth Africa 64 CCDbLebanon 65 DACdJordan 66 DCCcGuatemala 67 BDCdMoldova 68 DCDcIraq 69 DBDdPhilippines 70 BDCcNamibia 71 DDAcJamaica 72 DCCcMongolia 73 DCDcTajikistan 74 DCCdIndia 75 BDDcHonduras 76 CDBdEswatini 77 DDBdNicaragua 78 CDBdBotswana 79 DCDbKenya 80 BDBcCote dIvoire 81 BDCdGhana 81 CDCcCambodia 82 CDDdMyanmar 83 BDCdCameroon 84 CDCdZambia 85 DDCdMauritania 86 CDDdBangladesh 87 DDDdEthiopia 88 DDCdTanzania 89 DDCdPakistan 90 DDDdMozambique 91 DDCdZimbabwe 92 DDDdNigeria 93 CDDdSenegal 94 DDDcMadagascar 95 DDCdNepal 96 DDDdMalawi 97 DDCdChad 98 DDDdCongo (Democratic Rep.) 99 DDCdBenin 100 DDDdNiger 101 DDDd
Country RankScore
0 20 40 60 80 Grade
TRIL
EMM
A IN
DEX
202
1

As significant energy producers and consumers, energy is a critical component of North American economies, with energy transition therefore pos-ing big challenges alongside major opportunities.Federal and national policy disparities in the US and Canada can hinder energy transition, impact-ing particularly on Energy Sustainability, which shows the greatest variation across the continent. 2021 marked the return of the US to the Paris Agreement, and the earmarking of substantial funds to support environmental and energy infrastructure investment. Canada enacted its Net Zero Accountability Act, setting legal require-ments to achieve net-zero emissions by 2050, whilst Mexico has prioritised energy self-sufficien-cy above sustainability.Energy Security is considered a strength, with continued resource diversification a characteristic of all three nations.Energy Equity is considered a low-profile policy is-sue with widespread access to energy and energy services across the continent, but quality access and cost concerns are emerging.
NORTH AMERICA
NORTH AMERICA
EUROPE
EUROPE LATIN AMERICA & THE CARIBBEAN
LATIN AMERICA & THE CARIBBEAN
CHALLENGES AND OPPORTUNITIES FOR ENERGY TRANSITION
ASIA
ASIA
MIDDLE EAST AND GULF STATES
MIDDLE EAST AND GULF STATES
AFRICA
AFRICA
TOP 25% BOTTOM 25%>25%-50% >50%-75% N/A
(G.9) RegionalTrilemma Balances
(G.9) RegionalTrilemma Balances
(G.9) RegionalTrilemma Balances
(G.9) RegionalTrilemma Balances
(G.9) RegionalTrilemma Balances
(G.9) RegionalTrilemma Balances
15
Source: World Energy Council
Europe continues to show leadership in balanc-ing the Trilemma, occupying eight of the top 10 places in this year’s Index. Whilst the effects of the pandemic continue to be felt, the region’s overall energy agenda is firmly geared towards sustainability. Fossil fuels continue to play a declining role, with low carbon energy gener-ation driven by renewables rising to 38% of EU electricity in 2020, overtaking coal and gas as the main electricity source for the first time. For the countries of the EU, the Green Deal provides a robust framework for achieving am-bitious climate-neutrality goals. And outside the EU27, decarbonisation is also firmly on the policy agenda. Progress in Energy Security is being achieved through diversification and intercon-nection, but further pressure to phase-out coal is required.The region scores highly in Energy Equity, improving scores this year, but the pandemic has exposed some societal vulnerability and heightened concerns over energy affordability and accessibility.
SUSTAINABILITY AT THE HEART OF THE ENERGY AGENDA
The deployment of renewables continues to keep pace with rising energy demand as oil and gas demand declines, with renewables firmly set to shape the future of energy across the region as countries seek to diversify.
The region scores well on the Sustainability dimension due to its significant hydro resource and the opportunities presented for hydrogen production using low-cost renewable energy for export. But, for some countries, the reliance on oil exports continues to be a major issue.
Energy equity scores have improved across the region, primarily through subsidies, but the lack of comprehensive regulatory frameworks, economic uncertainty and political stability continues to hamper balanced energy transition.
RENEWABLES SET TO SHAPE THE FUTURE
Covering a large and diverse region, Asia spans the 2021 Trilemma ranking with countries at the top and bottom of the index. While strides continue to be made in terms of Energy Equity, primarily through technology advances in 5G, Internet of Things and AI, as well as the develop-ment of energy storage systems, the region as a whole still struggles with Energy Security and Sustainability.Energy Security is an issue for many countries with overall scores generally below the global average. Many rely heavily on energy imports to meet exponential growth in energy demand. Low levels of interconnectivity pose an addition-al challenge, which is difficult to overcome due to low levels of inter-governmental trust.Environmental Sustainability remains flat, but an increasing number of governments have announced net-zero targets by 2050 and China has committed to net-zero by 2060. With these ambitious goals, and coordinated specific action plans, significant improvements are anticipated for future years.
INNOVATION THE KEY TO EQUITY IMPROVEMENTS
Energy Equity remains a strength across the region, with near-universal, affordable energy available in most countries. However, resource distribution is uneven and although moves to improve the interconnec-tivity of gas and electricity grids are becoming apparent, Energy Security performance is lower that would be expected for such a resource-rich region.
Energy Sustainability still lags, but several Middle Eastern countries have set ambitious targets for renewables for 2030 and 2050 as part of energy diversification strategies. Concepts around creating a circular carbon economy are gaining traction, though the cost is inhibiting large-scale carbon capture and storage initiatives. Hydrogen production is considered an oppor-tunity for the region, with Saudi Arabia and the UAE both investing in hydrogen projects.
ENERGY DIVERSIFICATION AND INTERCONNECTIVITY BECOMING APPARENT
Despite wide geographical, demographic and eco-nomic disparities, significant progress in Energy Eq-uity has been made across the continent. Although overall Energy Equity scores remain low, a steady year-on-year increase is apparent. But much still remains to be achieved, with access to clean, afforda-ble and reliable energy urgently required to improve livelihoods and lifestyles. Further progress on Africa’s Energy Equity challenge requires bold action to improve infrastructure, promote regional energy integration and improve public sector governance.Environmental Sustainability has been the focus for the top five performers in the region, all of which have developed and implemented national climate action plans. However, sustainability is still a challenge for most of the region.Energy security remains poor in many countries due to lack of investment, unreliable power generation, resource shortage, etc. but slight improvements have been seen in some areas. Top performers are focusing on energy diversification, energy efficiency and infrastructure investments to improve this dimension.
PROGRESS IN ENERGY EQUITY CONTINUES BUT ENERGY SECURITY REMAINS CHALLENGING

16
WO
RLD
EN
ERG
Y C
OU
NC
IL
INTRODUCTION
This is the second report on the World Energy Trilemma Index that the Council has produced during the COVID-19 pandemic. As a metric that relies upon historic data the Trilemma is a useful framework with which to assess past energy policy performance and to help explore what policies work best in which contexts, and why.
The necessary lags in data reporting, however, mean that the full impact of the pandemic is yet to be represented in the Trilemma. While the most recent data used in calculation comes from Joint Organisations Data Initiative (JODI) for oil / gas stocks for the year ending in the first quarter of 2021, the majority of the data used to calculate Trilemma scores relate to the pre-pandemic time period. The Trilemma relies upon using globally comparable data, so can only move as fast as the slowest reporting countries. Although, as the pandemic is still ongoing, even in countries with good energy data systems, the full impact of the global health crisis on their energy systems will not be evident for some time yet.
To date, the pandemic appears to have accelerated or decelerated pre-existing trends that could reshape energy use. The lock-downs in many countries have reduced economic activities and significantly curtailed commuting, resulting in reduced oil consumption (Figure 2). The widespread roll out of vaccinations is leading richer countries to a gradual return to previous energy consumption patterns, but the recovery for other countries and sectors is likely to be slower. Already some analysts are reporting that oil demand is rebounding, perhaps due to a greater shift to private transportation, but challenges remain for the aviation sector where the recovery looks more distant and uncertain.
It is doubtful that the COVID-19 pandemic will change energy policy making itself, but it has exposed or re-exposed some deeper inequalities and created an increased appetite to build back better for a more sustainable and equitable transition. This desire for a more inclusive transition is likely to lead to some reprioritisation of existing objectives.
While the world remains in the midst of the COVID-19 pandemic, other influences are affecting energy policy. In particular, countries are increasingly focusing on the need to address climate concerns, with the forthcoming COP26 discussion acting as a focal point for many to revise their energy policies, with new announcements at the event anticipated. The negotiations at the 2021 United Nations Climate Change Conference (COP26) are also expected to act as a catalyst for revising energy policies further as countries seek to meet the goals of the 2015 Paris Agreement.
Figure 2: The pandemic and its effects
0
200
400
600
800
1000
New daily cases, thousands
Jan2020
JulApr Jan2021
MayOct
Evolution of the pandemic
WorldEMDEsAdvanced economies
Gas/Diesel oil
Jet fuel
2020 20212019
Index, 100 = Jan 2019Change in fuel demand
50
25
75
100
125Goods
Services
Travel
Jan2019
Apr Mar2021
Aug Dec0
40
60
80
100
120
Index, 100 = 2019World trade
Source (Change in fuel demand): Joint Organisations Data Initiative, July 2021.Source (Evolution of the pandemic, World trade): World Bank. 2021. Global Economic Prospects, June 2021.Washington, DC: World Bank. doi: 10.1596/978-1-4648-1665-9. License: Creative Commons Attribution CC BY 3.0 IGO.This is an adaptation of an original work by The World Bank. Views and opinions expressed in the adaptation are the sole responsi-bility of the author or authors of the adaptation and are not endorsed by The World Bank.

17
TRIL
EMM
A IN
DEX
202
1
Figure 3: Emissions target announcements covering most of global emissions
Source: Climate Action Tracker. Warming Projections Global Update, May 2021
Source: McWilliams, B. and G. Zachmann (2020) ‘Bruegel electricity tracker of COVID-19 lockdown effects’, Bruegel Datasets, first published 25 March, available at https://www.bruegel.org/2020/03/covid-19-crisis-electricity-demand-as-a-real-time-indicator/
For example, many countries plan to ban the sale of new internal combustion engine vehicles in the next 10-20 years. The implementation of this policy will start to reshape energy consumption patterns and society more broadly, with, for example, implications on taxation.
These changes will reshape how we need to define the Trilemma dimensions for security, equity and sustainability as we seek to ensure that the Index can continue to monitor energy policy performance. This will be more than the ongoing re-evaluation of existing sub-indicators that may no longer be fit for purpose and will require the adoption of new performance measures to represent an evolving and decarbonising energy system in transition.
However, it remains to be seen whether many of the initial shocks to the energy system experienced in 2020 will be long lasting, or will continue to fluctuate in the short term (See Figure 4, which illustrates fluctuating electricity consumption in different regions during 2020). We will continue to monitor the effect of the pandemic on energy transitions and make all the changes required for future editions of the Trilemma Index to best reflect the evolution of energy systems.
An increasing number of countries have already set net-zero targets in their national legislation. While the details of how countries intend to meet the target are, in many cases, limited, various policies are emerging that will change our energy usage (Figure 3).
April 2020 June 2020 September 2020 December 2020 March 2021 May 2021
Change in electricity consumptionCountry averages relative to same week in 2019
Australia
India
JapanUSA
Europe
-20%
-30%
-10%
10%
0%
Figure 4: National changes in 2020 electricity consumption relative to 2019 illustrating fluctuations

18
WO
RLD
EN
ERG
Y C
OU
NC
IL
OVERALL TRILEMMA RANKING 2021The countries in the overall Trilemma Top Ten for 2021 are similar to previous years. All are in the OECD, with European countries with well-established energy policies and diverse energy systems dominating the ranking. The top three of Sweden, Switzerland and Denmark perform well across all three Trilemma dimensions and have well-established energy policies promoting diverse and decarbonising energy systems (Figure 5). Of the three, only Denmark has indigenous hydrocarbon resources, but the country has passed peak production and has focused heavily on using its off-shore experience to establish off-shore wind. Denmark now has some of the highest levels of variable renewable generation, supported by strong grid integration with its neighbours. All three countries at the top of the ranking have universal access to energy and clean cooking, but score marginally less well in the energy equity dimension due to higher than average fuel prices.
The Council surveyed its global community three times over the past 18 months to explore the significant and uneven impacts of the COVID-19 pandemic across societies, economies and businesses. The survey results illustrated that regions and energy companies were adopting diverse approaches to recovery to reflect their differing contexts and ambitions. One clear theme that has emerged is that there will not be a return to a pre-pandemic normal, with about half of respondents expecting a new normal, with a stronger desire to build back better for more inclusive and just energy transitions.
Three non-European countries, Canada, New Zealand and the United States, make the top 10 listing (Figure 6), with Uruguay, Japan and Australia also featuring in the top 20 overall rank. Uruguay is the only non-OECD/non-EU country in the top 20, with its strong performance attributable to a highly decarbonised electricity system.
10%
0%
20%
30%
-10%
10%
0%
20%
30%
-10%
10%
0%
20%
30%
-10%
Base year 2000% Di�erence in Energy Security
Switzerland10%
Denmark4%
Sweden12%
Base year 2000% Di�erence in Enviro. Sustainability
Switzerland8%
Denmark30%
Sweden9%
Base year 2000% Di�erence in Energy Equity
2000 2010 20212000 2010 20212000 2010 2021
Switzerland-2%
Denmark-1%
Sweden-5%
0%
5%
10%
15%
-5%
0%
5%
10%
15%
-5%
0%
5%
10%
15%
-5%
Base year 2000% Di�erence in Energy Security
Base year 2000% Di�erence in Enviro. Sustainability
Base year 2000% Di�erence in Energy Equity
Canada6%
New Zealand-5%
United States9%
Canada-3%
New Zealand-3%
United States-2%
Canada4%
New Zealand6%
United States12%
2000 2010 20212000 2010 20212000 2010 2021
Figure 5: TOP 3 ranking countries in 2021 WE Trilemma Index and their historical performance
Figure 6: Non-European countries in the TOP10 following roughly the same trends as the TOP 3
Source: World Energy Council
Source: World Energy Council

19
TRIL
EMM
A IN
DEX
202
1
The top ten overall improvers have increased their Trilemma scores by at least 25% since 2000 (Figure 7). The list includes five Asian countries, three from Latin America and two from Africa. All are characterised by historically low levels of energy access, but have made significant efforts to extend their grids and increase energy access in recent years. Notably, China ranks as the 10th biggest improver since 2000, with increased energy access contributing to its unprecedented economic growth, which has seen it rise to be the world’s second largest economy. There is no room for complacency, however, as it is not clear whether these strategies will be the most appropriate/effective in transition – other countries, particularly in the LAC region, have strongly decarbonised electricity systems that may be better placed moving forward.
Figure 7: 2021 Top performers and Top improvers
Source: World Energy Council Source: World Energy Council
United Kingdom AAAa 81.7 4
Rank Grade Score
ENERGYEQUITY96 /100
ENVIRONMENTALSUSTAINABILITY
78/100
ENERGYSECURITY
69/100
TOP
10 R
AN
K O
VERA
LL P
ERFO
RMER
S
Sweden AAAa 84.2 1 Switzerland AAAa 83.8 2Denmark AAAa 83.0 3Finland AAAa 81.7 4
France AAAa 81.1 5Austria AAAa 81.0 5Canada AABa 80.6 6Germany AAAa 80.4 7Norway BAAa 79.6 8
United States AABa 79.0 9New Zealand AAAa 79.1 9
Luxembourg CAAa 76.910Spain ABAa 76.910
57%
34%
33%
33%
31%
28%
26%
26%
25%
25%
Cambodia
Myanmar
Dominican Rep.
Kenya
Ethiopia
Honduras
Thailand
Nicaragua
Sri Lanka
China
CDDd
BDCd
DCBc
BDBc
DDCd
CDBd
CCCb
CDBd
CCBc
BBDb
47.5
47.4
60.7
50.7
42.1
52.5
62.7
51.7
60.1
64.0Rank
51
60
53
76
88
80
59
83
82
78
Grade Score
ENERGYEQUITY39 /100
ENVIRONMENTALSUSTAINABILITY
65/100
ENERGYSECURITY
54/100
TOP
10 C
OU
NTR
IES
OVE
RALL
IMPR
OVE
RS
Improvement since 2000

Germany 71.910
Canada
Rank Country Energy Security Score
77.5
Finland 75.3
Romania 75.1
Latvia 74.9
Sweden 74.5
Brazil 73.5
United States 73.3
Bulgaria 73.1
Czech Republic 72.8
Malta
Rank Country % Score Improvement
+113%
Cambodia +104%
Jordan +83%
Cyprus +66%
Kenya +59%
Jamaica +54%
Tajikistan +53%
Dominican Rep. +52%
Tanzania +51%
Singapore +51%
1
2
3
4
5
6
7
8
9
2000 2005 2010 2015 2021
1
2
3
4
5
6
7
8
9
10
Change
100%
80%
60%
40%
20%
0%
-20%
ENERGY SECURITYSUMMARY
Figure 8: Top 10 Performers in Security
Figure 9: Historical Performance of 10 Top Improvers in Security Figure 10: Top 10 Improvers in Security
The Energy Security dimension aims to assess the ability of a country to meet its evolving energy demand, while being able to withstand and respond to supply shocks to minimise disruption to economic activity and consumers. In determining an energy security score, the dimension considers various sub-indicators that cover the effectiveness of management of domestic and external energy sources, along with the reliability and resilience of energy infrastructure.
Source: World Energy Council
Source: World Energy Council
• Canada, Finland and Romania once again top the list of best performers in the energy security dimension, which is dominated by OECD countries.
• Significant natural resource endowment, coupled with diversification and close energy integration with neighbouring countries underpins a strong performance in this dimension. But attention should be paid to decarbonisation as well as diversification to ensure a balanced overall Trilemma score.
• Brazil is the only non-OECD country in the top 10 ranking. Its diverse energy system and decarbonised power generation underlie its strong performance, but water stresses need to be managed to create resilience.
• European Union membership and the accession process, particularly for smaller countries, has proved to be a significant catalyst for improvements in energy security.
• Increasing digitalisation of energy systems means critical attention should be paid to cybersecurity to ensure system resilience.
• Diversifying a country’s energy mix improves energy security scores.
SUMMARY

21
TRIL
EMM
A IN
DEX
202
1
Energy security traditionally focused on oil but the Trilemma has always considered a broader definition, taking into account other energy vectors and resiliency issues that arise from energy systems becoming more decentralised, digitalised, decarbonised and disrupted by demand (with the other “Ds” combining to affect demand patterns). There is also an implicit recognition that this definition needs to keep evolving with the new challenges and opportunities afforded by energy transition. While the definition of energy security evolves, many of the key underlying concepts such as diversity remain important but need to be reflected within new Trilemma sub-indicators. For example, as new energy vectors or clean molecules become increasing relevant in the energy system, there will also need to be some reflection upon the most suitable security sub-indicators for them that may include other aspects beyond diversity of supply and stocks / storage levels. Experience from the pandemic is also likely to reshape how countries think about energy security and accentuate the importance placed upon resilience. In simple terms, the energy sector has proved to be resilient during the pandemic keeping the “lights on” and fuel supplies flowing, but there is now a greater recognition of resilience that extends from beyond physical systems to include people, contractors and supply chains. While the current resiliency sub-indicators for SAIDI / SAIFI1 measuring electricity system disruptions and durations remain useful, we need to explore new measures to assess increasingly important aspects such as flexibility. The trend in increasing digitalisation has been accelerated to alleviate the economic impact of the pandemic, enabling remote working and the proliferation of digital meetings. But it has also increased focus on cyber security, with this topic entering the list of top Critical Uncertainties in the Council’s World Energy Issues Monitor for the first time globally in 2021. The recent Colonial Pipeline ransomware attack has highlighted the potential to disrupt energy supply systems and the need to consider how it might be possible to develop suitable and measurable cybersecurity performance indicators.
TRENDS IN ENERGY SECURITY
Figure 11: Top performers in Energy Security in 2021 illustrating their diverse energy mix
Canada Finland Romania
Coal Natural gas Nuclear Hydro Solar & Wind Biofuels & Waste
Other Other Other
60%
15%
35%
19%20% 18%
27%
11%
23%
11%7% 6% 9%
14%
6%
15%
Electricity generation source:
ENERGYEQUITY96/100
ENVIRONMENTALSUSTAINABILITY
69/100
ENERGYSECURITY
77 /100
ENERGYEQUITY93 /100
ENVIRONMENTALSUSTAINABILITY
77 /100
ENERGYSECURITY
75 /100
ENERGYEQUITY76 /100
ENVIRONMENTALSUSTAINABILITY
75 /100
ENERGYSECURITY
75 /100
Source (Electricity generation): Natural Resources Canada (NRCan), Energy Fact Book 2020-2021; EUROSTAT; EIA, August 2021.Source (Trilemma Balances): World Energy Council.
1 SAIDI: System average interruption duration index; SAIFI: System average interruption frequency index

22
WO
RLD
EN
ERG
Y C
OU
NC
IL
The top 10 ranking countries for the energy security dimension are very similar to last year, with Canada, Finland and Romania heading the list, but each taking different routes to secure higher scores (Figure 11). Canada and Romania both benefit from being hydrocarbon producers that have focused on diversifying their energy systems and economies. Canada has more significant and diverse natural resources, while Romania has benefitted from its European Union membership improving its energy policies and interconnections. Finland is perhaps the most interesting of the top three given that it benefits less from its natural resource endowment but has focused heavily on decarbonising its energy systems, reducing fossil fuel generation and increasing solar and wind to diversify its generation mix. One aspect that is not covered by the security dimension sub-indicators is that all three countries benefit from close energy market integration with their respective neighbours. Greater interconnectivity with neighbouring grids can improve system resilience and address weather variability, but does create new dependencies and security challenges where disruptions in adjacent countries can cascade cross-border. Brazil is the only non-OECD/non-EU country in the top 10 energy security ranks. While it is also a significant hydrocarbon producer, Brazil has a diverse energy system with a substantially decarbonised power system reliant upon hydropower and a longstanding focus on biofuels for transport. Brazil has poor water management and has always need to manage drought periods, which affect its hydropower generation. To address increasing concerns about longer periods of water stress, Brazil's senate has approved the New Gas Law, which unbundles the vertically integrated gas market to increase capacity and leverage the country's indigenous natural gas resources for power generation. This will increase the diversity of electricity generation capacity and provide greater resilience to power supplies, but will negatively impact the country’s sustainability dimension score.
Figure 12: Recent droughts (2019-2021) as shown on the NASA Earth Observatory images highlight the stresses placed on Brazil’s hydropower-dependent energy system. The significant data lag on water stress (3 years) and water withdrawal (5 years) creates further challenges for the development of relevant counter measures.
Fossil fuels
Nuclear
Hydroelectricity
Solar & Wind & Other
Biofuels & Waste
Evaporative Stress Index
Water Stress
Water Withdrawal Freshwater withdrawal as a proportionof available freshwater resources (%)
Service sector Agriculture, forestry and fishing
% of total w. w. (2016)Mining and quarrying, manufacturing, constructions and energy
Drier-3.5 3.5-1.75 1.750
Wetter
100
0
201920101980 1990 2000
201820102000
Hydroelectricity
Fossil fuels
200
300
400
500
600bilion kWh
26% 18% 56% 3%
Source (Map): NASA Earth Observatory images by Joshua Stevens, using Landsat data from the U.S. Geological Survey andEvaporative Stress Index data from SERVIR. Data acquired June 2019 - June 2021. June 2021.Source (Electricity generation): U.S. Energy Information Administration, August 2021.Source (Water stress, Water withdrawal): UN-Water SDG 6 Data Portal, August 2021.

23
TRIL
EMM
A IN
DEX
202
1
Countries that have significantly improved their energy security scores have all increased the diversity of their energy systems in power generation and total energy supply.
European Union membership and the accession process has been a significant catalyst for a number of smaller countries to improve their energy systems and liberalise their energy markets. In the 2020 Trilemma Report, we highlighted how Malta and Cyprus had liberalised their energy markets and increased their energy stocks, but this year’s chart also shows substantial improvements in the security dimension from other new EU countries such as Estonia and Latvia. At same time, some of the EU’s founding members have also made strides to improve their energy security, with Italy and Luxembourg both improving the diversity of their power generation. Increased generation capacity for Angola, Cambodia and Kenya has increased electricity generation diversity and while this could be having a positive impact on equity with more people having access, there could also be detrimental impact on sustainability if the additional generation capacity comes from a more carbon intensive source. For example, Angola and Cambodia are both planning to further expand their generation capacity with both renewables and carbon-intensive power plants.2
Figure 13: The improvers in Energy Security enhanced their diversity of electricity generation and supply
2000 2002 2004 2006 2008 2010 2012 2014 2016 2018 2020
Averaged Indexed scores of Diversity of TES and Diversity of Electricity generation of Top Security ImproversBase year 2000
500%
400%
300%
200%
100%
0%
CyprusJordan
CambodiaTanzaniaSingapore
Jamaica
KenyaTajikistan
Dominican Republic
Africa Asia Europe Middle East and Gulf StatesLatin America and Caribbean
SIGNIFICANT IMPROVERS IN ENERGY SECURITY
Source: World Energy Council
2 Cambodia’s power development plan; Angola’s Recommended long-term power development plan

24
WO
RLD
EN
ERG
Y C
OU
NC
IL
RESOURCE ENDOWMENT NO GUARANTEE OF ENERGY SECURITYDespite countries like Canada, Brazil and US demonstrating that resource-rich countries can score well for energy security, a substantial number of hydrocarbon producers score lower than might be anticipated. This tends to result from these countries focusing on making best use of their domestic resource bounty at the expense of over-concentrating their energy systems on typically more carbon-intensive fuels. Abundant and indigenous energy resource can lessen the economic incentives to explore other energy options that will frequently be substantially more expensive. Yet, at the same, many hydrocarbon producers are aware of the risks to their economies and are actively seeking to diversify both their economies and their energy systems from over-reliance on hydrocarbons. For example, the UAE has recently commissioned its first nuclear power plant to diversify its power generation mix alongside exploring renewables. The traditional oil producers can also be well placed financially to afford to diversify their energy systems.
AUSTRIA & SLOVAKIACOUNTRY PROFILE
This year’s Trilemma highlights an interesting point about the significance of country context when developing energy policies. European neighbours Austria and Slovakia score the same on the energy security dimension, but have followed different approaches that take into account their very different socio-economic contexts. Neither country has particularly strong domestic energy endowments – Austria has more hydropower opportunities and has used this to diversify its energy mix. Slovakia is less wealthy and uses more coal, but makes substantive use of nuclear power generation, which is considered politically unacceptable in Austria.
Austria and Slovakia share cross-border connections with all of their neighbours except between each other (Figure 14), although their capitals, the most populous cities, being less than a hundred kilometers apart. Both countries face challenges of decarbonisation of the electricity generation, as coal is still a big part of their mix.
Figure 14: Cross-border connections illustrated with countries' electricity mix and Trilemma balances
Vienna Bratislava
Austria Slovakia
ENERGYEQUITY96/100
ENVIRONMENTALSUSTAINABILITY
79 /100
ENERGYSECURITY
69/100
ENERGYEQUITY79 /100
ENVIRONMENTALSUSTAINABILITY
75 /100
ENERGYSECURITY
69/100
20192010
Electricity generation by sourceElectricity generation by source
20192010
Fossil fuels NuclearHydro Solar & Wind & Other Biofuels & WasteElectricity generation by source
Maps and cross-borderconnections only illustrative,
not depicting the precise locations
Source (Maps): d-maps (Austria , Slovakia ), August 2021. Source (Cross-border connections): ENTSOE, August 2021.Source (Electricity generation): U.S. Energy Information Administration, August 2021;Source (Trilemma Balances): World Energy Council.

25
Nepal
Rank Country % Score Improvement
+212%
Cambodia +134%
Kenya +129%
Benin +121%
Ethiopia +108%
Bangladesh +102%
Sri Lanka +80%
Iraq +80%
Mongolia +78%
Nigeria +73%2000 2005 20152010 2021
1
2
3
4
5
6
7
8
9
10
150%
200%
100%
50%
0%
-50%
Change
Qatar
Rank Country Energy Equity Score
99.9
Kuwait 99.8
UAE 99.8
Oman 99.6
Bahrain 99.6
Iceland 99.2
Luxembourg 99.0
Ireland 98.4
Switzerland 98.0
Saudi Arabia 97.4
Israel 97.3
United States 97.1
United Kingdom 96.8
Denmark 96.4
1
1
1
2
2
3
4
5
6
7
7
8
9
10
Austria 96.410
ENERGY EQUITYSUMMARY
Figure 15: Top10 Performers in Energy Equity
Figure 17: Top10 Improvers in Equity Figure 16: Historical Performance of Top Improvers
The Energy Equity dimension assesses a country’s performance in providing reliable access to affordable energy – two asynchronous inputs which must be tackled in tandem to help support economic development and prosperity. Reliable energy access is assessed both from a binary basic measure aligned to UN Sustainable Development Goal 7 (SDG7) plus, increasingly, on the more nuanced metric of quality energy access required to enable economic growth. Energy affordability is determined by a combination of energy prices and broader socio-economic improvements, which influence how affordable a commodity like energy really is.
• Persian Gulf countries continue to dominate the top 10 Energy Equity performers for 2021, with Qatar, Kuwait and the UAE sharing top billing. Small, wealthy nations with high GDP, strong interconnections, low energy prices through subsidy and/or significant easily extractable energy resources characterise the countries at the head of the list.
• Progress is being made on reducing subsidies, with the aim of stimulating energy supply diversification.
• New entrants to the top 10 include several Northern European countries that have been successfully exploited their own ‘natural energy resources’ and interconnectedness to a pan-European energy system.
• Kenya, Ethiopia, Bangladesh and Nepal have made continued and consistent improvements in their energy equity scores since 2000. A focus on large urban and rural electrification schemes, in combination with rising GDP per capita and decreasing energy prices have been key to energy equity success.
• India, Morocco and El Salvador join the list of top improving countries for energy equity, but have taken different pathways on their journey.
• But more than 700 million people still do not have access to basic energy, or clean fuels and technology, particularly in Sub-Saharan Africa – continued progress on SDG7 is an imperative.
SUMMARY
Source: World Energy Council
Source: World Energy Council

26
TRIL
EMM
A IN
DEX
202
1
Nepal
Rank Country % Score Improvement
+212%
Cambodia +134%
Kenya +129%
Benin +121%
Ethiopia +108%
Bangladesh +102%
Sri Lanka +80%
Iraq +80%
Mongolia +78%
Nigeria +73%2000 2005 20152010 2021
1
2
3
4
5
6
7
8
9
10
150%
200%
100%
50%
0%
-50%
Change
Qatar
Rank Country Energy Equity Score
99.9
Kuwait 99.8
UAE 99.8
Oman 99.6
Bahrain 99.6
Iceland 99.2
Luxembourg 99.0
Ireland 98.4
Switzerland 98.0
Saudi Arabia 97.4
Israel 97.3
United States 97.1
United Kingdom 96.8
Denmark 96.4
1
1
1
2
2
3
4
5
6
7
7
8
9
10
Austria 96.410
The top Energy Equity ranked countries for 2021 are dominated by nations that are rich in natural resources –the hydrocarbon rich countries of the Persian Gulf, which traditionally rank amongst the top performers in this dimension, and also new entrants, including several Northern European countries that have been increasingly looking to exploit their own ‘natural energy resources’. Persian Gulf countries continue to dominate the top Energy Equity performers, with Qatar, Kuwait and UAE all sharing the top ranking this year, closely followed by Oman and Bahrain in second place. These smaller Middle Eastern countries, along with larger neighbour Saudi Arabia, traditionally perform well in this dimension due to the abundance of relatively accessible (and thus lower extraction cost) oil and gas reserves, which form the cornerstone of their economies. Coupled with the social norms that these resources and revenues are used to subsidise domestic socio-economic development, consumers in these countries benefit both from consistently cheap and affordable transport fuel and electricity prices. That said, many of these Persian Gulf countries are implementing economic reforms to diversify their hydrocarbon-based economies, including reforms to the energy sector. Recent reforms have seen a gradual reduction in energy subsidies, and many are investing in zero-carbon technologies to increase diversity of supply. Amongst the top ranked Energy Equity countries in 2021 a ‘North West Europe’ cluster is emerging. The countries making up this cluster undoubtedly benefit from their interconnectedness to a comprehensive pan-European energy system and networks. Luxembourg, in particular, benefits from this connectivity; the country is energy-import dependent, but some of the lowest fuel duties in EU, coupled with the highest GDP per capita, helps keep energy relatively affordable.
The other North West European countries in the cluster have taken policy decisions to invest in harnessing their own ‘natural energy resources’. For decades, the primary source of electricity generation in Iceland, Switzerland and Austria has been hydroelectricity, with each country making historical investments to take advantage of their topographical environment. In more recent decades, coastal countries like Denmark, UK and Ireland have taken advantage of their natural geographies and invested heavily in wind power (Figure 18).
Denmark
Ireland
United Kingdom
0%
50%
40%
30%
20%
10%
2014 2015 2016 2017 2018 2019
Wind shareElectricity generation
2014 2015 2016 2017 2018 2019
0
Euros/kWhBand DC: 2500 kWh < Consumption < 5000 kWh
0.2
0.1Denmark
Ireland
United Kingdom
TRENDS IN ENERGY EQUITY QUALITY OF ACCESS RISING IN IMPORTANCE
Figure 18: Wind Share of Generation Mix
Figure 19: Residential Electricity Prices
Source: Eurostat, August 2021.
Source: Eurostat, August 2021.

27
WO
RLD
EN
ERG
Y C
OU
NC
IL
Over the past five years, the UK and Ireland have increased wind generation by almost 100%, and Denmark by ~25%, resulting in a 10%-14% increase in wind power’s share of total power generation in these countries over that period. As far back as 2017 Denmark recorded its first full day on wind power alone (there have been many more since) and in 2020, the UK managed 67 days straight without coal-fired generation – the longest period since the industrial revolution – with wind and renewables estimated to contribute ~36% of demand during that period. At the same time, retail electricity prices in the countries mentioned above have remained predominantly flat over the period, somewhat counteracting the hypothesis that increasing renewables penetration results in higher consumer prices (Figure 19). Amongst several factors, the dramatic decrease in levelised cost of electricity (LCOE) of wind has likely offset some of the forecasted price increases, helping to balance the Energy Trilemma of equity, sustainability and security for these countries.
While the scores of the top Energy Equity performers change very little, with relatively minor improvements sufficient for already highly ranked nations to displace another in the top group, a very different story emerges when looking further down the rankings to assess the top Energy Equity improvers since 2000, (Figure 20). Over the past two decades, many developing countries have made remarkable improvements in both energy access and energy affordability; in particular, improving reliable access to quality energy, which has helped boost economic growth and prosperity. As with previous years, the top Energy Equity improvers are dominated by developing sub-Saharan and South East Asian countries – albeit each with very different improvement trajectories. Four countries – Kenya, Ethiopia, Bangladesh and Nepal – have consistently improved since 2000, each appearing in the top improvers during every five-year time window, whereas for a country like Iraq, which is still recovering from a war that has ravaged the country for most of the century, Energy Equity improvement is understandably more erratic. For the consistent improvers, the improvement has been driven by significant increases in energy access through massive urban and rural electrification schemes, plus a combination of increasing GDP per capita and real decreases in fuel and electricity prices (where comparable data exists) to improve energy affordability.
ENERGY EQUITY TOP 10 IMPROVERS
2000 2005 20152010 2021
150%
200%
100%
50%
0%
-50%
Change, Base year 2000Nepal
Cambodia
BeninKenya
BangladeshEthiopia
Sri Lanka
MongoliaIraq
Nigeria
AfricaAsiaMiddle East and Gulf States
Figure 20: Energy Equity Top Improvers in 2021
Source: World Energy Council

28
TRIL
EMM
A IN
DEX
202
1
The three ‘new’ countries on the top 10 Energy Equity improvers since 2015 – India, Morocco and El Salvador – have very different characteristics, each with very different economies and energy systems, and each has taken different paths to get into the top improvers list. In terms of the UNSDG7.1 goal of universal access to affordable, reliable and modern energy services, all have made improvements towards the 100% target since 2015. Morocco has seen a 3% increase in both
the proportion of population with access to electricity and access to clean fuels and technology – achieving 100% electricity access and 99% clean fuels access. El Salvador has increased both metrics
by 5% – achieving 100% electricity access and 89% coverage for clean fuels and technology. India has increased both metrics by ~20% – reaching 97% electricity access and 56% coverage for
clean fuels and technology; but there is still some room to continue improvement. While Morocco’s 3% and El Salvador’s 5% improvement may look small in comparison to India’s ~20%, the Energy Equity scoring is weighted to account for the additional effort required to continue to make incremental improvements when nearing the 100% target. Morocco and El Salvador started from a higher base and have continued to push to ensure universal access to even their most difficult to reach citizens. Morocco, El Salvador and India also diverge on the economic drivers behind the energy affordability metrics: India’s affordability improvement is driven by wider economic growth and increased GDP per
capita. As one of the fastest growing major economies, India’s GDP per capita has increased 45% since 2015, which has been mirrored by increased electrification and energy investments in multiple generation types; particularly renewables, which have seen 100% increase in capacity over the past five years. Over the same period, real electricity and diesel fuel prices have increased modestly, but at a much lower rate than GDP; hence the improvement in relative affordability. El Salvador’s affordability improvement is driven both by a ~20% growth in GDP per capita,
coupled with a ~25% decrease in the real price of fuels to further enhance the affordability balance.
Morocco’s affordability improvement, by contrast, has been less influenced by wider economic factors – growth in GDP per capita is modest over the period, but at the same time electricity prices have remained flat and the real price of fuels has dropped ~20%.
2000–2021 2015–2021
Cambodia Mongolia
Kenya Kenya
Benin El Salvador
Ethiopia Ethiopia
Bangladesh Sri Lanka
Sri Lanka Bangladesh
Iraq Cambodia
Mongolia Morocco
Nigeria Nepal
Nepal India
Table 9: Top 10 Energy Equity improvers 2000-21 vs Top 10 Energy Equity improvers 2015-21
The introduction of UNSDG7 in 2015 has certainly helped these countries maintain their Energy Equity performance improvement (on average, an additional >20% of their populations have achieved electricity access since then), with seven of the top improvers since 2000 also featuring in the top ten improvers since 2015 (Table 9).
Source: World Energy Council

29
WO
RLD
EN
ERG
Y C
OU
NC
IL
Switzerland
Rank Country Sustainability Score
88.2
Sweden 86.3
Uruguay 85.4
Norway 84.4
Panama 83.7
Brazil 83.4
Denmark 82.9
France 82.7
Albania 82.5
United Kingdom 81.3
Denmark
Rank Country Score Improvement
+30%
Azerbaijan +28%
Ukraine +22%
Myanmar +22%
Thailand +22%
China +21%
Ireland +20%
Panama +20%
Malta +20%
Serbia +19%
1
2
3
4
5
6
7
8
9
10
2000 2005 20152010 2021
1
2
3
4
5
6
7
8
9
10
Change
60%
40%
20%
0%
-10%
While it is important to celebrate the improvers and recognise the great progress that continues to be made to extend reliable and affordable quality energy access, it is also noted that >700m people still lack basic access to any electricity or clean fuels and technology. Electrification rates are increasing, but progress must continue to be made on all fronts, particularly in sub-Saharan Africa, where over a third of countries have <10% access to clean fuels and technology. Common to all Energy Equity improvement and high-scoring countries are progressive energy strategies and regulatory regimes that encourage investment in resilient energy and electricity infrastructure, and increasingly in diversifying energy sources as countries try to balance changing demand with affordability and sustainability. The top performing Energy Equity countries are all developed nations with established, resilient and complex energy systems and infrastructure – which are becoming more complex and require additional investments as they continue to diversify their energy mixes and shift increasingly towards zero-carbon sources. This shift is gaining momentum for the obvious sustainability benefits, but also increasingly for energy security reasons as countries seek to exploit their own ‘natural energy resources’, and for economic reasons the levelized cost of zero-carbon energy continues to fall. For top performing Energy Equity countries, the key challenge is on the balance of sustainable affordability and improving affordable equality across all sections of society. For the top improving countries, or any country that needs to improve energy access and affordability, deploying the strategies and supporting the right investments to deliver both reliable and sustainable quality energy is key. Much like for the top performing Energy Equity countries, the improving countries are significantly investing in zero-carbon technologies that harness their local energy resources, as well as in some carbon-intensive options in order to meet the energy demand growth to support rapidly growing economies. It is important that going forward, this balance is tipped towards a sustainable footing to ensure an equitable Trilemma balance is maintained.

30
TRIL
EMM
A IN
DEX
202
1
Switzerland
Rank Country Sustainability Score
88.2
Sweden 86.3
Uruguay 85.4
Norway 84.4
Panama 83.7
Brazil 83.4
Denmark 82.9
France 82.7
Albania 82.5
United Kingdom 81.3
Denmark
Rank Country Score Improvement
+30%
Azerbaijan +28%
Ukraine +22%
Myanmar +22%
Thailand +22%
China +21%
Ireland +20%
Panama +20%
Malta +20%
Serbia +19%
1
2
3
4
5
6
7
8
9
10
2000 2005 20152010 2021
1
2
3
4
5
6
7
8
9
10
Change
60%
40%
20%
0%
-10%
ENVIRONMENTAL SUSTAINABILITYSUMMARY
Figure 21: Top 10 Performers in Sustainability
Figure 22: Historical Performance of Top 10 Improvers Figure 23: Top 10 Improvers in Sustainability
• Switzerland, Sweden and Uruguay head the top ten in the Environmental Sustainability dimension.
• Uruguay’s significant progress is the result of energy diversification into wind and solar to complement its existing hydropower resource.
• Denmark, Azerbaijan and the Ukraine once again lead the top improvers in a list that sees few changes from 2020.
• A rapid shift away from coal must be made if Paris Agreement goals are to remain within reach.
SUMMARY
Environmental sustainability measures the performance of a country’s energy system in avoiding environmental damage and mitigating climate change.
The dimension evaluates efficiency in terms of energy use, generation and transmission and distribution; decarbonization performance; and pollution in terms of carbon dioxide, methane and particulate matter.
Source: World Energy Council
Source: World Energy Council
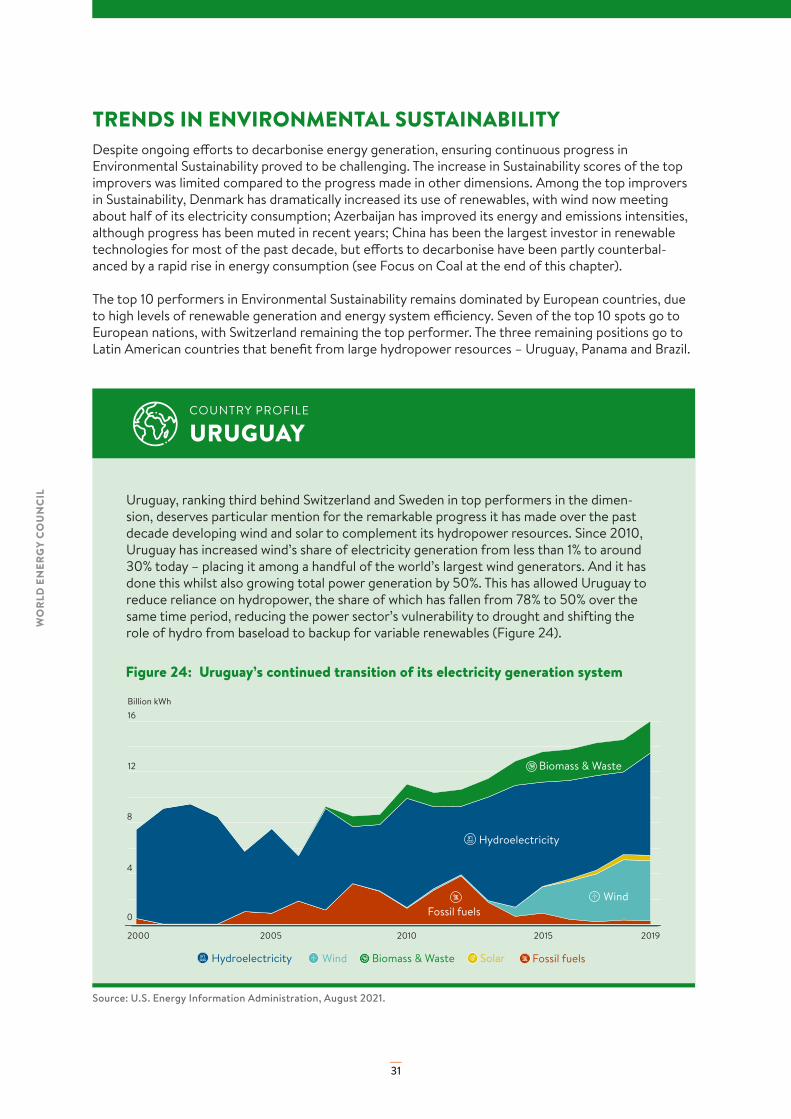
31
WO
RLD
EN
ERG
Y C
OU
NC
IL
Despite ongoing efforts to decarbonise energy generation, ensuring continuous progress in Environmental Sustainability proved to be challenging. The increase in Sustainability scores of the top improvers was limited compared to the progress made in other dimensions. Among the top improvers in Sustainability, Denmark has dramatically increased its use of renewables, with wind now meeting about half of its electricity consumption; Azerbaijan has improved its energy and emissions intensities, although progress has been muted in recent years; China has been the largest investor in renewable technologies for most of the past decade, but efforts to decarbonise have been partly counterbal-anced by a rapid rise in energy consumption (see Focus on Coal at the end of this chapter). The top 10 performers in Environmental Sustainability remains dominated by European countries, due to high levels of renewable generation and energy system efficiency. Seven of the top 10 spots go to European nations, with Switzerland remaining the top performer. The three remaining positions go to Latin American countries that benefit from large hydropower resources – Uruguay, Panama and Brazil.
TRENDS IN ENVIRONMENTAL SUSTAINABILITY
Source: U.S. Energy Information Administration, August 2021.
URUGUAYCOUNTRY PROFILE
Uruguay, ranking third behind Switzerland and Sweden in top performers in the dimen-sion, deserves particular mention for the remarkable progress it has made over the past decade developing wind and solar to complement its hydropower resources. Since 2010, Uruguay has increased wind’s share of electricity generation from less than 1% to around 30% today – placing it among a handful of the world’s largest wind generators. And it has done this whilst also growing total power generation by 50%. This has allowed Uruguay to reduce reliance on hydropower, the share of which has fallen from 78% to 50% over the same time period, reducing the power sector’s vulnerability to drought and shifting the role of hydro from baseload to backup for variable renewables (Figure 24).
Figure 24: Uruguay’s continued transition of its electricity generation system
2000 2010 2015 2019
0
Billion kWh
4
12
8
16
2005
Hydroelectricity
Hydroelectricity
Fossil fuels
Fossil fuels
Biomass & Waste
Biomass & Waste
Wind
Wind Solar

32
TRIL
EMM
A IN
DEX
202
1
Figure 25: Fastest Improvers in Environmental Sustainability since Paris
2018 2019 2020 2021
Mozambique
Panama
DR CongoCote dIvoire
Angola
Tanzania
Country Average
Brazil
Ecuador
Botswana
Niger
85
Score
80
75
70
65
60
55
50
45
40
35
30
Africa Latin America and Caribbean
PROGRESS SINCE PARISThis year’s COP26 meeting in Glasgow marks a crucial moment for international progress on climate change. It is the first COP since Paris in 2015 at which governments have the opportunity to update their emissions reduction pledges (formally referred to as Nationally Determined Contributions, or NDCs) with a view to closing the gap between the targets governments have set themselves, and what is collectively needed to meet the Paris Agreement’s goals. Since Paris, the world has continued to make strong progress in decarbonising the global energy system. Worldwide renewable capacity has grown from 1,847 GW to 2,799 GW – an increase of over 50% – with renewables now accounting for over 80% of new capacity additions. However, global carbon dioxide emissions have continued to rise (the COVID-19 related drop in 2020 excepted) whilst the average national Environmental Sustainability score from the Trilemma Index has not improved. Of course, stagnation at the international level masks significant improvements and declines at the national level. Developing countries dominate the list of strongest improvers on Environmental Sustainability since Paris, with the biggest score increases coming from Sub-Saharan African countries (Mozambique, Tanzania, Niger, Angola, Botswana, Cote d’Ivoire and DRC). Though typically starting from a low baseline, these countries have still achieved significant emissions reductions and increased their shares of low-carbon generation since 2015 (Figure 25).
Source: World Energy Council
A more diverse group of countries has experienced the worst declines in Environmental Sustainability score since Paris. Increasing fossil fuel use is a common trend among these countries, whilst energy intensity among developing countries has also risen as they industrialize and their economies become more energy intensive (Figure 26).
Figure 26: Biggest declines in Environmental Sustainability since Paris
Africa Asia Europe Latin America and Caribbean
2018 2019 2020 2021
80Score
0
10
20
30
40
50
60
70
Benin
Hungary
Slovakia
NepalNigeria
Bosnia and Herzegovina
Country Average
North Macedonia
Serbia
Paraguay
Jamaica
Source: World Energy Council

33
WO
RLD
EN
ERG
Y C
OU
NC
IL
Figure 27: High share of coal in Primary Energy Supply signals high emitting enegy system
0
20
40
60
80
100
0% 20% 40% 60% 80%
% of Coal in Primary Energy Supply
CO2 intensity score
Source (CO2 intensity score): World Energy Council.Source (Share of coal in PES): Our World In Data, August 2021.
FOCUS ON COALAs the most carbon-intensive form of power generation, the global energy system must make a rapid shift away from coal if the Paris Agreement’s goals are to remain within reach. Data from the Trilemma clearly reveals that countries with high coal use have higher emitting energy systems (Figure 27).
The IPCC’s sixth assessment report found that global warming of 1.5°C and 2°C will be exceeded during the 21st century unless deep reductions in carbon dioxide (CO2) and other greenhouse gas emissions occur in the coming decades.3 Limiting global temperature increase to 1.5ºC requires carbon dioxide emissions to decline to net-zero by 2050. A review of modelled pathways consistent with the 1.5ºC goal indicates that emissions from coal generation need to decline by around 80% over the next decade. However, the world is nowhere near this kind of pathway. Since Paris, the share of coal in global total primary energy supply has declined by less than two percent (Figure 28). And although global coal use declined sharply in 2020 as demand contracted in response to the COVID-19 pandemic, it has rebounded again in 2021 as the global economy has recovered.
Figure 28: Share of coal in global primary energy supply has not significantly declined
Source: BP Statistical Review of World Energy, 2021.This is an adaptation of an original work by BP. Views and opinions expressed are the sole responsibility of the authors of the adaptation and are not endorsed by BP.
2000 2016 2019
0%
10%
20%
30%
Paris agreement
Oil
Natural gas
Hydroelectric
NuclearRenewables
Coal27.1%
3 https://www.ipcc.ch/report/ar6/wg1/downloads/report/IPCC_AR6_WGI_Full_Report.pdf

34
TRIL
EMM
A IN
DEX
202
1
Figure 29: China’s power generation and its Sustainability score
Hydro Other BioenergyWind Solar
2000 2005 2010 2015 2019
2019
0
5k
6k
7k
TWh Sustainability Score
4k
3k
2k
1k
60
35
40
45
50
55
Coal GasNuclear
62% 18% 6% 5% 3% 3% 2% 2%
Source (Generation mix): Ember (China data from China Electricity Council). August, 2021;Source (Sustainability Score): World Energy Council.
The IEA recently found that achieving the 1.5°C goal would require no new final investment decisions for unabated coal plants and the phasing out of less efficient coal plants by 2030, with any remaining assets retrofitted with carbon capture and storage (CCS) by 2040.4 However, although appetite for new thermal coal projects has been in decline since Paris, a significant number of coal plants are still being commissioned. Globally, annual commissioning of thermal coal capacity has fallen by more than half since 2015, to 50.3GW in 2020 – equivalent to around 100 average sized coal plants. This decline has been driven by the US, Europe and much of Asia, but appetite remains robust in China – the world’s largest consumer of coal, which accounted for 85% of new coal plant proposals in 2020. Over the years, China has sustained improvement in its Environmental Sustainability score despite its growing coal use thanks to significant investments in renewables and progress in energy efficiency (Figure 29). However, it will not be possible to maintain this trend indefinitely while continuing to commission around 40GW of new coal capacity per year.
4 https://www.iea.org/reports/net-zero-by-2050
Historically, China has also played an active role financing coal projects beyond its borders. Public finance is increasingly vital for thermal coal projects because coal is becoming less and less compet-itive relative to wind and solar. Renewables are now generally cheaper than even the most efficient new coal plants, and the same will soon be true of renewables with battery back-up. It is already cheaper simply to shut down the least efficient 39% of the global coal fleet and replace it with new renewables with battery storage – the construction and operating costs of the new technology being less than the running costs of the coal plants. On current cost trends, this share is expected to rise to 78% by 2025. This creates the risk of stranded coal assets, which private capital is increas-ingly unwilling to bear.

35
WO
RLD
EN
ERG
Y C
OU
NC
IL
But as policymakers have sought to curb emissions growth, governments and public finance institu-tions have been stepping back from coal financing. This year, for example, South Korea announced an immediate end to coal financing, as did the G7 shortly after. And in September, China announced its intention to do the same, throwing into question 56GW of new coal capacity in its overseas pipeline.5
The major destinations for future coal financing are in the Asia Pacific region and Southeast African (Figure 30). Among them are a number of developing countries with low Energy Equity scores that are focused on increasing energy access, such as Bangladesh, Zimbabwe, Cambodia, Mozambique, and Pakistan.
However, as renewable costs continue to fall, the case for coal as the cheapest source of electricity is becoming harder and harder to make. What is more, as Figure 31 shows, these countries need to improve not only their Equity performance, but also their Environmental Sustainability. Given coal’s cost relative to renewables and its detrimental impacts on the climate and public health, it looks less and less attractive when viewed through the lens of the energy Trilemma.
Figure 30: Receiving countries share of Total future financed capacity
Bangladesh 24.5%
Vietnam 20.8%
Others 14.0%
Cambodia 2.3%
Pakistan 2.9%
Australia 3.2%
Mozambique 4.1%
Turkey 4.1%
Zimbabwe 5.1%
South Africa 5.9%
Indonesia 13.2%
5 https://endcoal.org/finance-tracker/
Source: End Coal, August 2021

36
TRIL
EMM
A IN
DEX
202
1
Figure 31: Trilemma performance of developing country destinations for future coal finance
Turkey 2,525
Indonesia 8,120
Vietnam 12,830
South Africa 3,630
Cambodia 1,400
Bangladesh 15,150
Pakistan 1,810
Mozambique 2,500
Zimbabwe 3,150
Country
#47
#58
#61
#64
#82
#87
#90
#91
#92
Rank
BBBd
ACCc
BCDc
CCDb
CDDd
DDDd
DDDd
DDCd
DDDd
GradeFuture Financed
Capacity (MW)Score
65.6
61.1
60.0
58.0
47.5
42.3
41.7
41.1
40.7
EnergyEquity
75.9
57.0
67.5
64.7
36.1
34.5
31.4
14.0
25.0
14.0
25.0
EnergySecurity
60.1
64.4
58.6
53.7
50.0
41.1
43.1
45.6
44.3
EnvironmentalSustainability
66.8
63.9
55.9
55.8
56.7
51.3
50.4
64.7
53.2
Current Financed Capacity (MW)
1,320
16,429
14,625
9,564
100
5,785
7,590
0
670
Source: World Energy Council; End Coal, August 2021

37
WO
RLD
EN
ERG
Y C
OU
NC
IL
REGIONAL ENERGY PROFILES
AFRICAFigure 32: Africa Trilemma BalanceThe WE Trilemma index report
covers the whole African continent, a vast geographic
and populous area, with an estimated population of more than 1.3 billion people, representing around 17% of the world’s population. There are large disparities amongst countries, in terms of demographics, energy and mineral resources, economic development, industrialisation, energy consumption and energy performance, amongst others. 29 African countries have been assessed for this year’s WE Trilemma Index. Figure 32 shows the overall scores of the Africa region across the three dimensions of Energy Security, Energy Equity and Environment Sustainability. Overall, all African countries are still in the bottom half of the global Trilemma rankings. Although, the low ranks reflect the lower starting points of individual countries, it does
Source: World Energy Council
(G.9) RegionalTrilemma Balances
not mean that they are not improving their energy policy performance. Many countries are making substantive improvements, particularly in access to modern energy and energy efficiency under the UN Sustainable Development Goal 7 (UNSDG7) objectives and the African Union 2063 vision6. Figure 33 shows the countries’ rankings and each country measured score indexes with regard to Energy Security (orange), Energy Equity (blue), Environmental Sustainability (green) and County Context (grey).
6 Agenda 2063: The Africa We Want.

38
TRIL
EMM
A IN
DEX
202
1
Figure 33: Country performances of Africa
Mauritius 50 DBBaEgypt 54 BBDdAlgeria 56 CBCdGabon 57 BCBdTunisia 58 CCCcMorocco 61 CCCcAngola 62 ADAdSouth Africa 64 CCDbNamibia 71 DDAcEswatini 77 DDBdBotswana 79 DCDbKenya 80 BDBcCote dIvoire 81 BDCdGhana 81 CDCcCameroon 84 CDCdZambia 85 DDCdMauritania 86 CDDdEthiopia 88 DDCdTanzania 89 DDCdMozambique 91 DDCdZimbabwe 92 DDDdNigeria 93 CDDdSenegal 94 DDDcMadagascar 95 DDCdMalawi 97 DDCdChad 98 DDDdCongo (Democratic Rep.) 99 DDCdBenin 100 DDDdNiger 101 DDDd
Country RankScore
0 20 40 60 Grade
Source: World Energy Council
Overall, the following outcomes can be highlighted for the three dimensions of the Trilemma: Energy Security has slightly improved this year with some progress for a few countries. Analysis of
the regional historical performance of the Energy Security dimension since 2000 shows substantial increases in the indicator from 2000 to 2021, achieving 40% growth in the period, while the historical scores indexed to base year 2000 show little progress in this dimension from 2000–2007 and sub-stantial increases since 2016. The past three years (2019 to 2021) have brought a clear consolidation of the growth rates (+16% for each year). Energy Security in Africa could be improved substantially by further developing and exploiting the region’s abundant energy resources cost-effectively, and by enhancing the energy infrastructure to secure a more reliable energy supply. Energy Equity has made progress for the whole continent, although the scores remain quite low for
the region overall; however, the situation is mixed, with North Africa having higher levels of access to electricity and clean cooking fuels, while in Sub-Saharan Africa, energy affordability and quality access still remain quite challenging. Analysis of the regional historical performance of the Energy Equity indicator since 2000 shows a steady increase in the scores from 2000 to 2021 reaching +16% in the period, while the historical scores indexed to base year 2000 reveal negative trends in the period 2002–2007, followed by substantial growth rates since 2013; and the period 2019–2021 seems to have brought substantial consolidation (+38% / +40%). Energy Sustainability is Africa’s strongest dimension, with many countries and accompanying
institutions (for example, the African Development Bank and United Nations Economic Commission for Africa) acting upon the Paris Climate Change Agreement and looking forward to COP26 in Glasgow, with the aim of supporting African countries to revise their Nationally Determined Commitments (NDCs) and boosting the overall continental commitments by raising global climate change ambitions. Alongside these objectives, Africa is continuing to integrate climate resilience into national sustainable development plans, as well as increasing investments in climate action.

39
WO
RLD
EN
ERG
Y C
OU
NC
IL
The analysis of the regional historical performance of the Energy Sustainability indicator since 2000 shows overall maintenance of energy sustainability scores. The historical scores indexed to base year 2000 show contrasted variations in the whole period, with a decrease in scores over the period 2013 – 2019, followed by very slight growth rates in the past two years. Assessing the trends and performances of the three Trilemma Energy indexes in the region, highlights the following points: For the Energy Security dimension, the top five African performers are Angola, Kenya, Gabon, Côte d’Ivoire, and Egypt, with Nigeria dropping out of the list of top performers this year. Angola has been amongst the top ten global performers for the past three years and is continuing on its positive trajectory. Angola is a major oil producing and oil-exporting country and a member of OPEC, and oil revenues continue to dominate the economy. The country is exploiting its oil reserves, while maintain-ing a low-carbon generation mix that includes 58% hydro, and has developed an integrated transmis-sion network to improve electricity supply across the country. All top five performing countries have developed their energy resources to meet their domestic energy demands while also establishing energy efficiency programmes and increasing deployment of renewable energies that have improved the reliability of their energy systems. A number of countries in the region have shown substantial progress in their energy security scores since 2000, including: Kenya (+59%), Tanzania ( +51%), Ghana (+40), Senegal (37%), Eswatini (+37%), Cameroon (+35%). However, three countries fell back over the same period: Egypt (-5%), Algeria (-4%), and Mauritius (-2%). Many African countries scored C or D for Energy Security in 2021. This low performance is generally caused by a lack of capacity to develop a reliable and secure energy supply, but also relates to a number of cumulative factors depending on the countries’ specific circumstances. The most relevant factors contributing to a low energy security score include: lack of adequate investment; significant energy infrastructure gap; shortage of energy supply and energy services; insufficient power genera-tion capacities; inadequate T&D networks; non-reliability of the power supply with increased power shortages; substantial technical and commercial electricity loses; terror attacks and sabotages of pipelines, political and social instability, etc. The implementation of centralised and decentralised grids offers a promising opportunity to provide access to electricity in a sustainable way to rural areas. Accordingly, many countries in the region need to promote these technologies (including micro-grids for off-grid and grid-connected), and innovative and disruptive distributed generation adoption (pay-as-you-go solar power systems and product bundles). For the Energy Equity dimension, although some progress has been made since 2000, the region continues to be challenged with the world’s lowest level of access to electricity and clean cooking fuels. Around 600 million Africans, mostly in Sub-Saharan Africa, are still lacking the most basic access to electricity, while another billion Africans are lacking clean cooking facilities. Clean, affordable and reliable energy is urgently required to improve livelihoods and lifestyles. In addition, quality energy access and energy affordability remain significant challenges. The top five performing countries this year are: Egypt, Algeria, Mauritius, Tunisia, Morocco, while most African countries (including the five high-need and most populated countries: Nigeria, Ethiopia, DR Congo, Tanzania and Kenya), which together represent 94% of the total African population, score D for energy equity, as in 2020. In terms of dimension comparison (% of change from 2000), it is worth mentioning that significant progress has been made over the period by some countries, substantially increasing their scores – Kenya (+129%), Benin (+121%), Ethiopia (+108%), Nigeria (+73%), Tanzania (+64%), Morocco (+51%).

40
TRIL
EMM
A IN
DEX
202
1
Addressing Africa’s Energy Equity challenge requires bold action that includes improving infrastructure with more power generation and better transmission/distribution capacity, promoting regional energy integration and supporting viable cross-border projects across the continent, undertaking suitable energy policy reforms and regulatory frameworks, improving public sector governance, and increasing electricity affordability. Macro-policies that help reduce poverty and boost poor people incomes will also play a crucial role. For the Environmental Sustainability dimension, the top five performers (Angola, Namibia, Mauritius, Kenya, Gabon), have all developed and implemented national climate action plans (Intended Nationally Determined Contributions, or INDCs) further to the Paris Agreement of COP21, promoting the deployment of renewable energy, committing to reduce carbon emissions in electricity generation and in the transportation sector, and supporting the development of UN SDG7 in their respective coun-tries. Angola performed well this year in the Environmental Sustainability dimension and surpassed Namibia. However, environment sustainability remains very challenging for the other 23 countries (including the largest fossil fuels users in transportation and/or power generation): Algeria, Nigeria, South Africa, Morocco, Egypt, DR Congo, Ethiopia and Zimbabwe all achieved either a ‘C’ or ‘D’ ranking. When tracking % of change from 2000, it is worth noting that some countries have made significant progress in this dimension, including: Angola (+18%), Ethiopia (+17%), Senegal (+13%), Namibia (+9%), Eswatini (+8); however, others have regressed, including: Niger (-23%), Zambia (-21%), Zimbabwe (-12%), and Benin (-11%). Despite some national and sub-regional focus on clean energy deployment and actions to protect the local and global environment, there are still environmental challenges, which require better govern-ance of energy resources, infrastructure investments, access to appropriate technologies and policies to improve the overall energy systems management and development in a more sustainable way. Renewable energy has so far been the most resilient energy source despite the COVID-19 outbreak. Accelerated deployment of renewable energy can mitigate energy challenges, while creating jobs, advancing industrial development and more generally contributing to promoting human welfare and enhancing humanising energy. Substantial use of renewable resources including hydropower would help Africa improve its Environmental Sustainability performance. However, due to the current pandemic, the deployment of renewable projects might slow down or have to be delayed, due to a number of factors including disrupted supply chains, rarefaction of investments and less available financing in the short term. It is expected that if the post-pandemic environment normalises, the industry will move forwards again strongly with plans for sustainable, clean energy deployment.

41
WO
RLD
EN
ERG
Y C
OU
NC
IL
ASIA
Figure 34: Asia Trilemma Balance
Asia Pacific is one of the largest and most diverse regions in the world. The report illustrates this regional diversity by covering 23 economies comprising advanced ones such as Japan, Australia, New Zealand, Hong Kong, South Korea and
Singapore, struggling ones like Bangladesh, Pakistan and Myanmar, and rapidly growing ones such as China, India and Vietnam. In our latest 2021 Trilemma rankings, New Zealand still tops the regional rankings, holding within top 10 world position, followed by Japan and Australia in the top 20. Nine of the 23 countries rank above 50% overall, while at the other end of the scale, countries such as Pakistan and Nepal trail towards the bottom of the index, reflecting the diversity of the region. While strides continue to be made in terms of Energy Equity (68), the region as a whole still struggles with Energy Security (58) and Environmental Sustainability (61). Asia continues to maintain significant strides with respect to Energy Equity, with successful progress toward deployment of modern and affordable energy across the region. Despite the economic toll from the COVID-19 pandemic, which has left a significant number of people in Asia unable to afford
electricity, top performing countries such as Singapore, Australia, New Zealand, Japan, Hong Kong and Malaysia maintain their high standards with a consistently high overall score of over 90. Rising recognition of the importance of a decentralised energy system, supported by the implementation of new technologies such as 5G, Internet of Things and Artificial Intelligence, as well as the development of energy storage systems gives optimism for making energy more accessible for people in remote areas. However, as the negative impact of the COVID-19 pandemic continues into 2021, resulting in reduced energy demand and lower investment in new technologies, countries in Asia are required to make more efforts to enhance existing market design and regulatory frameworks in order to make the economics more favorable for investors and end consumers.Source: World Energy Council
(G.9) RegionalTrilemma Balances
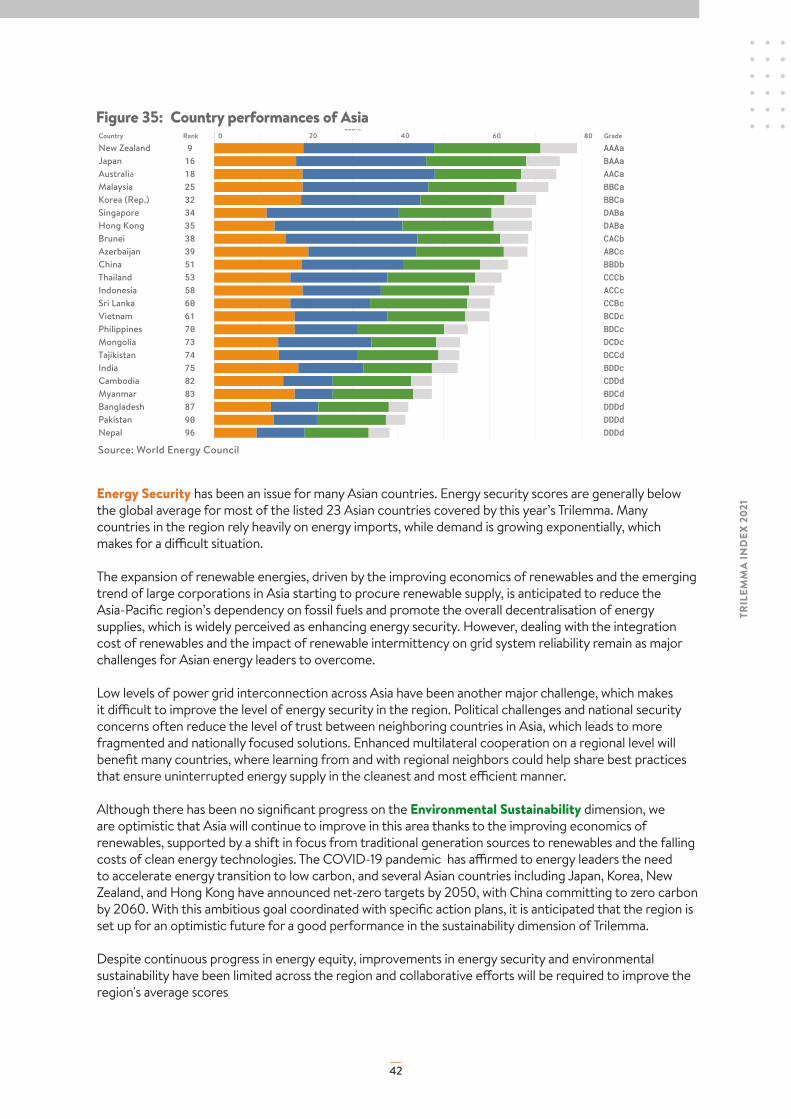
42
TRIL
EMM
A IN
DEX
202
1
Figure 35: Country performances of Asia
(G.43) Index - Asia region
New Zealand 9 AAAaJapan 16 BAAaAustralia 18 AACaMalaysia 25 BBCaKorea (Rep.) 32 BBCaSingapore 34 DABaHong Kong 35 DABaBrunei 38 CACbAzerbaijan 39 ABCcChina 51 BBDbThailand 53 CCCbIndonesia 58 ACCcSri Lanka 60 CCBcVietnam 61 BCDcPhilippines 70 BDCcMongolia 73 DCDcTajikistan 74 DCCdIndia 75 BDDcCambodia 82 CDDdMyanmar 83 BDCdBangladesh 87 DDDdPakistan 90 DDDdNepal 96 DDDd
Country RankScore
0 20 40 60 80 Grade
Source: World Energy Council
Energy Security has been an issue for many Asian countries. Energy security scores are generally below the global average for most of the listed 23 Asian countries covered by this year’s Trilemma. Many countries in the region rely heavily on energy imports, while demand is growing exponentially, which makes for a difficult situation. The expansion of renewable energies, driven by the improving economics of renewables and the emerging trend of large corporations in Asia starting to procure renewable supply, is anticipated to reduce the Asia-Pacific region’s dependency on fossil fuels and promote the overall decentralisation of energy supplies, which is widely perceived as enhancing energy security. However, dealing with the integration cost of renewables and the impact of renewable intermittency on grid system reliability remain as major challenges for Asian energy leaders to overcome. Low levels of power grid interconnection across Asia have been another major challenge, which makes it difficult to improve the level of energy security in the region. Political challenges and national security concerns often reduce the level of trust between neighboring countries in Asia, which leads to more fragmented and nationally focused solutions. Enhanced multilateral cooperation on a regional level will benefit many countries, where learning from and with regional neighbors could help share best practices that ensure uninterrupted energy supply in the cleanest and most efficient manner. Although there has been no significant progress on the Environmental Sustainability dimension, we are optimistic that Asia will continue to improve in this area thanks to the improving economics of renewables, supported by a shift in focus from traditional generation sources to renewables and the falling costs of clean energy technologies. The COVID-19 pandemic has affirmed to energy leaders the need to accelerate energy transition to low carbon, and several Asian countries including Japan, Korea, New Zealand, and Hong Kong have announced net-zero targets by 2050, with China committing to zero carbon by 2060. With this ambitious goal coordinated with specific action plans, it is anticipated that the region is set up for an optimistic future for a good performance in the sustainability dimension of Trilemma. Despite continuous progress in energy equity, improvements in energy security and environmental sustainability have been limited across the region and collaborative efforts will be required to improve the region's average scores

43
WO
RLD
EN
ERG
Y C
OU
NC
IL
As many governments in Asia are proactively drafting energy policies with a specific focus on decarbonisation, key pressures such as increasing transparency and accountability in balancing social, environmental and security aspects are emerging. Now, more than ever, it is critical that all energy leaders in the region incorporate the Trilemma Index Tool into their new policy and strategy, with the aim of enhancing their nation’s standing on each dimension. The Trilemma will have an important role to play in guiding regional energy policy makers and business decision makers dealing on how to maintain balance across the three dimensions of Trilemma while achieving decarbonisation. The Council’s initiative of pursuing Humanising Energy will be very timely and welcome initiative for all stakeholders in Asia to share specific measures of “how to” make the energy transition easier and beneficial to all, while securing energy and climate neutrality.

44
TRIL
EMM
A IN
DEX
202
1
EUROPE
Figure 36: Europe Trilemma Balance
As in previous years, European countries continue to perform strongly in the Trilemma Index, occupying eight of the Top 10 places in this year’s edition, and 16 of the Top 20.
The European region has been, and continues to be, hit hard by the global COVID-19 pandemic and the economic and societal impacts of the crisis are severe and deeply disrupting. The energy sector has also been strongly affected. In the first half of 2020, energy demand in Europe dropped significantly as a result of the pandemic and the measures governments took to contain the virus. Overall electricity demand in Europe was down 13% in April at the height of the lockdown, but with big differences between countries. The demand reductions were strongest in Italy (-21%), France (-19%) and Spain (-17%), while Denmark and Sweden hardly experienced a demand reduction.7 Demand recovered somewhat towards the end of 2020 -recording an overall drop of 4% over 2020 as a whole - but fell again in the beginning of 2021 as new COVID restrictions were introduced. With the COVID situation a continuous uncertainty for the remainder of 2021, it is unclear whether energy demand will recover to pre-pandemic levels. A number of countries also reported that the pandemic caused delays in investments in major energy projects as governments were forced to direct spending to managing the health emergency and mitigating the economic effects of prolonged lockdown periods. Member States of the European Union have therefore welcomed the recovery package of €750 billion for 2021-2024 as an instrument to boost ‘green recovery’.
PANDEMIC CONTEXT
(G.9) RegionalTrilemma Balances
Source: World Energy Council
7 Source: The European Power Sector in 2020, Report by Agora Energiewende and Ember, published January 2021.

45
WO
RLD
EN
ERG
Y C
OU
NC
IL
Figure 37: Country performances of Europe
(G.44) Index - Europe region
Sweden 1 AAAaSwitzerland 2 AAAaDenmark 3 AAAaUnited Kingdom 4 AAAaFinland 4 AAAaFrance 5 AAAaAustria 5 AAAaGermany 7 AAAaNorway 8 BAAaLuxembourg 10 CAAaSpain 10 ABAaIreland 11 CAAaBelgium 12 BAAaHungary 12 ABBbLithuania 14 BBAaPortugal 14 BBAaIceland 15 CABaItaly 15 ABAbNetherlands 16 BABaSlovenia 17 ABAaCzech Republic 19 ABBaLatvia 20 ABBaEstonia 20 ABBaMalta 21 DAAaRomania 21 ABAbSlovakia 22 ABAbCroatia 23 ABAbBulgaria 24 ABBbRussia 28 ABCcPoland 30 BBCbGreece 39 CBAcKazakhstan 40 ABDcCyprus 42 DABaUkraine 43 ACBdGeorgia 44 CCBbAlbania 47 CCAcTurkey 47 BBBdArmenia 53 CCBcMontenegro 55 CCBcSerbia 55 BCCcNorth Macedonia 57 CCCcBosnia and Herzegovina 59 BCDdMoldova 68 DCDc
Country RankScore
0 20 40 60 80 Grade
Source: World Energy Council
ENVIRONMENTAL SUSTAINABILITY
While the COVID-19 pandemic continues to keep countries in Europe in its grip, the region’s overall energy agenda is firmly focused on sustainability (decarbonisation). The share of fossil fuels in overall energy generation is declining across the continent, while the share of low carbon energy generation has been steadily rising, largely driven by increased use of renewables in electricity production (causing that Trilemma indicator to rise by 15 points between 2011 and 2021). Measures to increase energy efficiency and reduce the CO2 footprint in transport and mobility are also prioritised by many countries. For the 27 EU Member States, 2020 was a landmark year as renewables generated 38% of the EU’s electricity in 2020, overtaking coal and gas to become the main source of electricity for the first time. Both wind and solar generation increased capacity in 2020, producing 14% and 5% of the EU’s electricity, respectively. Together, they generated a fifth of the EU’s electricity.7
This stands in stark contrast to coal-fired power production, which fell 20% in 2020 and has halved since 2015. Coal generation fell in almost every country, continuing a trend that was already in place before COVID-19. Not surprisingly, this has had a positive impact on the EU’s CO2 emissions, but there is no room for complacency.

46
TRIL
EMM
A IN
DEX
202
1
Although coal-fired generation supplied just 13% of Europe’s electricity in 2020, coal would need to fall to near-zero by 2030 to reach the EU’s 55% emissions target. Since half of the drop in 2020 is estimated to be the result of the overall drop in energy demand, and half from additional wind and solar generation, it remains to be seen if the recent fall in coal will be sustained, as electricity demand is expected to bounce back in 2021.7 Multiple countries have, however, announced plans to phase-out coal generation altogether in the coming years. For the countries in the European Union, the ‘Green Deal’ provides a robust framework for the EU’s ambitious climate neutrality goals and the basis for accelerating the energy transition. The block’s focus on sustainability will be stepped up further in the years and decades to come, as 2021 saw the adoption of major new legislative initiatives in support of the ‘Green Deal’ framework. First, the European Climate Law, adopted by the Council of the European Union in June, enshrines into legislation the objective of a climate-neutral EU by 2050. The EU Institutions and the Member States are bound to take the necessary measures at EU and national level to meet the target. The Climate Law also includes a new EU target for 2030 of reducing greenhouse gas emissions by at least 55% compared to levels in 1990. The adoption of the European Climate Law was followed by the adoption by the European Commission of the so-called ‘Fit for 55’ package, presenting the legislative tools to deliver on the targets agreed in the European Climate Law. Taken together, the package contains a fundamental transformational change of European economies, societies and industries on the way to a climate-neutral future. The proposed measures include application of emissions trading to new sectors and a tightening of the existing EU Emissions Trading System; increased use of renewable energy; greater energy efficiency; a faster roll-out of low emission transport modes; and measures to prevent carbon leakage. It is to be expected that the proposed ‘Fit for 55’ package will be intensely debated in the coming period. Outside the EU27, decarbonisation is also on the policy agenda. Turkey, for example, reports that 98.4% of the additional energy production capacity commissioned in the past year and a half comes from renewables. The Russian Federation is also adopting a Strategy for the long-term development with low greenhouse gas emissions. Planned measures under this strategy, which has a time horizon to 2050, include the establishment of next-generation smart heat, electric power and natural gas grids, energy storage, demand response, e-mobility, energy losses decrease, increasing efficiency of energy consumption and smart metering. Energy efficiency and environmental projects according to the Strategy are expected to reduce Russian GDP carbon intensity by 8-10% to 2030 and by 40-50% to 2050. An important role in the decarbonised energy system – and especially for certain hard-to-abate sectors – is foreseen for hydrogen. The EU 2030 targets contain an ambition of 40GW of renewable hydrogen electrolysers in the EU and 10 million tonnes of renewable hydrogen produced in the EU. Multiple European countries have published a dedicated hydrogen strategy. A study coordinated by several member committees of the World Energy Council in Europe finds that import of decarbonised hydrogen will very likely be necessary to meet projected demand and that a clear regulatory framework will be crucial to ensure that the necessary investments in infrastructure and production will be driven in a timely manner.8 According to the Russian Government’s Actions Plan for hydrogen energy to 2024, Russia sees a major goal for itself to become a world leader in the production and export of decarbonised hydrogen due to proximity to European and Asia-Pacific markets. While the energy transition targets are clearly set, plenty of challenges remain in practical implementation. Adoption and harmonisation of appropriate regulatory frameworks and market designs continue to cause challenges. Countries are, for example, implementing various support mechanisms to increase the deployment of renewables into the energy system, ranging from direct subsidies to instruments such as auctions. Getting the design right of such schemes remains important as unbalanced or protracted use may lead to unwanted distortive effects. Adequate regulatory frameworks and efficient market designs are also essential for mobilising necessary investments for the energy transition. In the UK for example, the 2020 Energy White Paper envisages that by 2050, clean electricity could meet over half of the country’s final energy demand, with increased use of light vehicles and home heating that will require a new approach to how the energy market would be designed, managed and regulated.
8 Source: Decarbonised hydrogen imports into the European Union: challenges and opportunities, a study coordinated by member committees of the World Energy Council in Europe (forthcoming)
47
WO
RLD
EN
ERG
Y C
OU
NC
IL
ENERGY SECURITY
Of the Trilemma indicators, the Europe region historically performs worst in energy security. The overall trend in energy security is however upwards, mainly due to an increase in the use of energy storage and diversification of electricity generation. The main ‘energy security indicator’ where Europe continues to score below global median is import dependence. Since 2013, all 27 Member States of the EU are net importers of energy, with Luxembourg, Malta and Belgium as the largest net importers relative to population size in 2019. The EU’s dependency rate on energy imports has increased from 56% in 2000 to 61% in 2019, with the EU’s dependency on non-member countries for supplies of natural gas growing significantly faster compared to solid fossil fuels and crude oil during the same period.9 Roughly 55% of the EU’s imports of natural gas in 2018 came from only three non-EU suppliers: Russia, Norway and Qatar, while four suppliers (Russia, Iraq, Nigeria and Saudi Arabia) accounted for roughly half of imports of crude oil. The increased penetration of renewable energies will likely lessen the import dependence in many countries. Italy, for example, reported that the growth in use of renewables has enabled the country both to lower CO2 emissions per capita and, at the same time, diversify its final energy mix, thereby managing to reduce its energy imports dependence by a third in the past decade. A number of countries that traditionally rely on domestic fossil fuel production, notably coal, for a significant portion of their overall energy demand, nevertheless expect challenges in the short- to medium term. With large-scale renewable energy production taking time to be developed and coal production being phased out to meet CO2 reduction targets, this creates some concerns about energy security and the potentially increasing dependence on energy imports (notably for natural gas) from non-EU countries in the foreseeable future. An example is Serbia, where two-thirds of electricity is generated by burning domestic lignite resources. With most hydro potential already being used and large-scale wind and solar still under development, Serbia expects to become increasingly dependent on natural gas imports from abroad in the short- to medium term. It is in this context that one of the pillars under the EU Energy Union is to enhance interconnection capacity to facilitate cross-border energy flows. By connecting demand, supply and storage capacities over large geographical areas, interconnectors will facilitate the uptake of renewable energy sources while, at the same time, contributing to security of supply.
There are also growing concerns about balance between electricity demand and supply in the EU. The long term price signal needed for investment is currently blurred. There is a need for a market design evolution in order to provide long term prices and remuneration mechanisms necessary for new decarbonized production capacity to reinforce electricity security of supply in Europe. Energy source diversification, another indicator under ‘energy security’, has improved in the Europe region. The growth in the use of renewables has contributed to this, but it should also be noted that nuclear energy remains an important part of a low-carbon energy mix in multiple countries, including Bulgaria, Finland, France, Hungary, Romania, Russia, Slovenia and Turkey, with nuclear generation capacity being increased in some places.
9 Source: Eurostat, Energy Production and Imports, https://ec.europa.eu/eurostat/statistics-explained/index.php?title=Energy_production_and_imports#The_EU_and_its_Member_States_are_all_net_importers_of_energy

48
TRIL
EMM
A IN
DEX
202
1
ENERGY EQUITY
Although the Europe region scores highly on ‘energy equity’ and even improved its score compared to last year’s Trilemma index, the COVID-19 pandemic has exposed some societal vulnerabilities and augmented concerns over energy affordability and ensuring the whole of society can benefit from energy transition. With many poorer households hit harder financially by the pandemic, energy leaders are increasingly aware of the importance of addressing energy poverty among European households. Portugal mentioned, for example that, due to the COVID-19 pandemic, there has been an increase in energy awareness and the need to ‘humanise’ the energy transition. When presenting the ‘Fit for 55’ package, the European Commission recognised that while in the medium- to long-term, the benefits of EU climate policies outweigh the costs of this transition, in the short run, climate policies may risk putting extra pressure on vulnerable households, micro-enterprises and transport users. A new Social Climate Fund was therefore proposed to provide dedicated funding to Member States (€144,4 bn) to help citizens finance investments in energy efficiency, new heating and cooling systems, and cleaner mobility. This facility comes in addition to the already existing Just Transition Mechanism, which provides targeted support of some €150 bn in the period 2021-2027 in the most affected EU regions to alleviate the socio-economic impacts of the transition. The importance of ensuring an energy transition that is also “socially just, inclusive and in the interest of workers, women, youth, vulnerable citizens and local communities” was also expressed by the Contracting Parties to the Energy Community – Albania, Bosnia and Herzegovina, Georgia, Kosovo, Moldova, Montenegro, North Macedonia, Serbia and Ukraine – when they recently launched the first Energy Community Just Transition Forum. A separate initiative, in which the European Bank of Reconstruction and Development, the World Bank, the Energy Community Secretariat and the European Commission are joining efforts, seeks to support coal regions in the Western Balkans and Ukraine transition away from coal on the basis of ‘just transition’ principles. More generally, the World Energy Council’s Third Covid Update published earlier this year found that European respondents considered that the role of consumers and consumer behaviour will be fundamental in managing the energy transition going forward. Digitisation of the energy system will only work if consumers are willing to apply new technologies at the household level. ‘Not in my backyard’ attitudes are impacting the large-scale rollout of onshore wind power and solar power development. Debates about affordability and burden-sharing can make or break societal support for the energy transition. The need to put people at the centre of the energy transition underlines the importance of providing them with the necessary skills, literacy and capabilities. For all these reasons, Humanising Energy will be a key aspect of the energy transition in the years to come.

49
WO
RLD
EN
ERG
Y C
OU
NC
IL
Countries in the Middle East face common environmental challenges, though they are not homogeneous with respect to energy resource distribution and economic diversifi-cation. After falling significantly in 2020, oil prices have recovered and the expected rise
in global oil demand, as the world eases restrictions and lockdowns, is expected to benefit oil exporting nations in the region, which faced strains over the past 24 months. Economic reforms undertaken by several countries in the region remain tied to oil and gas revenues to stimulate growth in the non-oil sector and encourage private sector investment. The economic recession brought about by COVID-19 had a negative impact on sectors that were expected to contribute to non-oil growth, particularly aviation, hospitality, and services. To kick-start post-COVID recovery many countries provided significant fiscal stimuli with spending on infrastructure, health, and digitalisation.
For the energy-importing nations in the Middle East, economic recovery in the resource-rich Gulf states has resulted in a rebound of remittances – starting from the third quarter of 2020 – from expatriate workers who rely on jobs provided in the wealthier Gulf states. Iran stands out as an outlier, despite its vast oil and gas wealth, as its economy has been hit hard by US sanctions that have choked its oil condensate exports.
Figure 38: Middle East Trilemma BalanceThe average Trilemma scores for the region as a whole remain unchanged from the previous year (Figure 38 and 39). The Middle East scores highly in Energy Equity as most countries in the region provide affordable and near-universal energy to their respective populations. With resources not spread evenly, the Energy Security performance is lower than would be expected for a region that contains roughly 50% of global oil reserves and 40% of natural gas reserves. This is due to lower performance on indicators measuring diversity of primary energy supply and electricity generation across the region, but also energy storage capaci-ties of (net) oil importers like Lebanon, Jordan, or Israel. There are signs, however, that this is being addressed with moves to improve interconnectivity of gas and electricity grids. The greatest opportu-nity for improvements remains with Environmental Sustainability, partly because of the uneven deployment of renewable energy and the belated execution and implementation of energy efficiency measures by many countries.
MIDDLE EAST
Figure 39: Country performances of Middle East
(G.46) Index - MEGS region
Israel 27 CABaQatar 31 AADaUnited Arab Emirates 33 BADaSaudi Arabia 41 BADbBahrain 42 BADcKuwait 45 CADbIran (Islamic Republic) 48 ABDdOman 48 CADbLebanon 65 DACdJordan 66 DCCcIraq 69 DBDd
Country RankScore
0 20 40 60 Grade
Source: World Energy Council
Source: World Energy Council
(G.9) RegionalTrilemma Balances

50
TRIL
EMM
A IN
DEX
202
1
Several Middle Eastern countries have set ambitious renewable energy targets to be reached by 2030 and 2050, while also committing to reducing emissions from the hydrocarbon industry. In 2021, Saudi Arabia announced the Saudi and Middle East Green Initiatives, the scope of which covers a spectrum of climate and energy-related plans aimed at addressing both development and environment and illustrates the need to take a "whole systems" approach in tackling societal and environmental issues. Furthermore, the con-cept of creating a circular carbon economy is gaining traction, though cost is still preventing large-scale implementation of technologies to extract, store and utilise carbon dioxide in the effort to decarbonise the energy and industrial sectors. Saudi Arabia and the UAE have some of the largest carbon capture storage and utilisation projects in the world, with the Uthmaniyah facility in Saudi Arabia and Reyadah in the UAE capturing each around 800,000 mt/year of CO2, used mainly for enhanced oil recovery (EOR), and potentially to produce blue hydrogen. The UAE remains the leader in diversifying its energy mix and has the highest percentage of installed renewable energy capacity. The UAE’s large-scale solar projects have drawn record-breaking bids, the latest being a 2GW solar plant that is slated to become the world’s largest solar installation. In 2020, the UAE became the first Arab country to operate a nuclear power plant when it started commissioning the Barakah nuclear power station. At full capacity, the plant will meet 25% of the UAE’s electricity. Saudi Arabia, meanwhile, has stepped up its renewable energy programme and launched several tenders for solar and wind projects. The first phase of Dumat Al Jandal, the country’s first wind project with 99 turbines, is halfway complete, with expected commercial operation by 2022. The Kingdom has recently set targets to increase the share of renewables in the energy mix to approximately 50% by 2030. In Bahrain, one of the pillars of the Economic Vision 2030 is sustainability, with an important goal linked to affordable clean energy. A renewable energy target of 5% by 2025 and 10% by 2035 has been set, with major projects in solar power initiatives underway. The renewable energy sector is in early stages in Kuwait. The targets set are ambitious and look to meet 15% of energy requirements from renewable resources by 2030. The major force behind Kuwait’s renew-ables program is energy security and diversification of the energy mix. The transition to a low-carbon economy brings many additional benefits to the country, including the opportunity to reduce carbon and ecological footprints, economic growth, and societal development. In Lebanon, the ambitious target of 30% of its energy consumption from renewables by 2030 has been severely impeded by the economic crisis that has struck the country since late 2019. A depreciating currency, coupled with a default on foreign debt payments, the pandemic, and last year’s Beirut port incident, have all halted major anticipated solar and wind projects in the country. Moreover, Lebanon has been recently exposed to a fuel shortage that crippled its power sector and economy even further. Saudi Arabia and the UAE have also started to explore the potential for hydrogen production. Saudi Arabia dispatched the world’s first shipment of blue ammonia to Japan in September 2020. In parallel, construction is underway in the Kingdom for the world’s largest green hydrogen project, esti-mated at $5 billion in the NEOM region, with the aim of producing 650 mt/day of green hydrogen and exporting it through green ammonia to global markets. The first green hydrogen production in the UAE is in the commissioning stage at Dubai’s solar park. The project aims to test and showcase an integrated megawatt-scale plant to produce green hydrogen using renewable energy, store the gas, then deliver it for use in electricity generation, transportation, and other industrial uses.

51
WO
RLD
EN
ERG
Y C
OU
NC
IL
NORTH AMERICAAs significant energy producers and consumers, energy plays a critically important and highly valued part in the North American economies. The transition to clean energy therefore creates both large challenges and major opportunities. Various opportunities to accelerate energy transition are being actively pursued and include: expanding
clean continental-scale electricity generation through further development of large-scale hydropower; replacement of coal and fuel oil for power generation; aggressive development of the continent’s rich endowment of wind, solar, and small-scale hydro resources; development of low-carbon alternate energy carriers; and leadership in innovation to manage and optimise the electricity grid at both regional and local scale (Figure 40 and 41). When assessing the North American energy picture, two important contextual factors need to be considered. First, the responsibility for energy is divided in the United States and Canada between national and state or provincial governments, while energy remains a federal responsibility in Mexico. This division of power means that a full assessment needs to reflect the energy policies of both levels of government. Second, while elections of new governments can result in sudden shifts or reversals in policy directions, the situation in the United States and Canada is compounded by election dates for national and sub-national governments typically being out-of-phase. Even so, energy policies that are encoded in law remain much more persistent across administrations. Given the capital-intensive, long-term nature of investments in the energy sector, changes in a country’s administration or sudden policy reversals can undermine the effectiveness of existing cross-border agreements or previous policies and potentially discourage energy investment.
Figure 40: North America Trilemma Balance
(G.9) RegionalTrilemma Balances
Figure 41: Country performances of North America
Source: World Energy Council
Source: World Energy Council
(G.47) Index - N.America region
Canada 6 AABaUnited States 9 AABaMexico 43 BBBc
Country RankScore
0 20 40 60 80 Grade
Diversity amongst the three North American countries is greatest in Environmental Sustainability policy. With the US officially returning to the Paris Agreement in early 2021, earmarking US$1 trillion worth of transportation, digital, disaster, environmental and energy infrastructure investment over the next five years, and setting a target to cut 2030 US greenhouse gas emissions by 50-52% compared to 2005 levels, global efforts to cap the rise in global temperatures below 2ºC saw a boost. Nevertheless, the US remains polarised on the energy transition discussion. Some US states, such as California, have adopted ambitious targets to achieve carbon neutrality by 2045, while others have minimal plans. The Council’s 2021 Issues Monitor highlighted that North American energy leaders continue to identify “Carbon Abatement” and “Climate Adaptation” as having potential for both significant impact and uncertainty.

52
TRIL
EMM
A IN
DEX
202
1
In Canada, perspectives on energy transition differ between the federal government, which is support-ive of action on climate change, and First Nations who want to stop new pipelines across their territo-ries, while provinces with oil production are keen to maintain employment. In mid-2021 the Canadian Net-Zero Emissions Accountability Act became law, setting legal requirements on the current govern-ment and future governments to plan, report, and course correct on the path to net-zero emissions by or before 2050. As investors and consumers increasingly support low-carbon, climate-resilient projects, the bill is expected to decrease uncertainty and secure the necessary long-term investment to achieve net-zero emissions by 2050. New federal incentives for low-carbon investment as part of a COVID-19 recovery plan are also expected to play a part in avoiding the worst impacts of climate change, scale the clean energy industry, and drive a sustainable and inclusive economic recovery in Canada. Mexico remains a party to the Paris Agreement, however, the current administration has yet to pres-ent its programme on climate change required by national law in 2019. This differs to the practices of the previous administration, which set up a cross-ministerial committee to coordinate climate change policies and actively promoted energy efficiency and renewable electricity generation to help decou-ple economic growth and energy intensity. The Mexican government has prioritised energy self-suf-ficiency above environmental sustainability, increasing the budget allocation to the modernisation of fossil-fueled power plants and the construction of oil refineries, at the expense of displacing renewable electricity and challenging its electricity supply security. This has polarised perspectives within Mexico with the private energy sector and local government supportive of energy transition aligned to the climate change agenda. Energy Security in North America is widely seen as a positive continental strength, based on a long track record of developing abundant and diverse energy resources. The large energy trade flows between the three countries further enhances energy security through supply diversity and the redun-dancy inherent in the continental transmission networks, with mutual aid cooperative arrangements in place to restore supply in times of regional outages or supply interruptions. Canada has been joined by the US as a net exporter of energy, due to the US becoming the biggest global oil producer during 2020, and fifth in natural gas production, while Mexico is a net energy importer to meet its energy demand. Ever-falling costs for renewables has led to continued growth within the North American energy systems. But the situation is not universal, with Mexico moving in a different direction by using more of its domestically produced oil in its power system while reducing renewables. Furthermore, Mexico has increased its dependency on imported natural gas coming from a single field in the US, and the country has recently experienced risks associated to this dependency, which affects the country’s energy security. In addition, the country has not only seen declining oil production but also well declin-ing reserves affecting Mexico’s position in the global oil market and posing a challenge for the country in the medium term. Reinforcing cooperation within the North American region remains crucial to improving the Trilemma scores for the three countries in the Energy Security dimension. Energy Equity generally remains a relatively low-profile policy issue for North America. With wide-spread access to energy and energy services, there is a perception that prices are highly competitive. However, there are energy cost concerns for some remote Canadian communities due to the high transportation cost for supplying fuel and power. In urban areas, energy price increases can lead to difficulties for poor households especially in a pandemic context. In the US, there is growing recog-nition that some American consumers are having difficulty paying their energy bills and are being disconnected despite nearly universal access, historically low energy prices and, a recovering economy and unemployment decreasing. Mexico still faces some challenges to guarantee access to “modern” energy to vulnerable households in rural areas. In previous years, the government tried to tackle this through energy safety nets, although the effectiveness of these policies was uncertain with the schemes not being properly evaluated before being further revised.

53
WO
RLD
EN
ERG
Y C
OU
NC
IL
The impact of the COVID-19 pandemic in North America has been significant. On the human level, substantial numbers of people and families have been affected, while energy systems have successfully managed the sharp fluctuations in energy demand with lockdown restrictions. As an energy exporter region, fluctuations in the global energy demand have affected the revenues of the countries with lower export levels compounded by reduced oil prices. In the absence of strong cash flows amid low commodity prices, investors’ pressure on value creation and higher returns, is forcing oil companies to reduce costs, improve internal efficiencies, boost share repurchases and increase returns, leading energy entities looking for expansion and synergy derivations to consolidation. With the Biden administration established and again part of the Paris Agreement, and all three countries emerging from the pandemic and economic lockdowns with post-pandemic economic recovery plans in implementation, the region appears to be more aligned on a coherent regional energy transition perspective.

54
TRIL
EMM
A IN
DEX
202
1
LATIN AMERICA AND CARIBBEANIn recent years, the renewable energy market in Latin America has undergone seismic changes. Political risk factors, investment trends, technological progress and external shocks have affected the energy industry in many ways. As the COVID-19 pandemic has brought unprecedent damage to the worlds’ economy, trends in the Latin American
market have shifted and so has the future of the industry. Nevertheless, the power industry is showing resilience amid slowing infrastructure. The region’s dependence on oil exports continues to be a major issue and leading to uncertainty, particularly in countries such as Colombia, Bolivia, Argentina and Brazil that are highly dependent on oil revenues. Meanwhile, the region is calculating the economic costs of COVID-19 in order to develop a recovery plan (Figure 42 and 43). Turning to the demand side, while governments seek to overcome the impacts of the pandemic, ongoing infrastructure projects have been delayed and project pipelines canceled. Restrictions and regulations are still in force in several countries and economic uncertainty is holding back the private sector from investing. In contrast, with economic activity dependent on the use of electricity and energy access, the power sector has become a priority for the region. Renewables demand keeps increasing side-by-side with energy demand, in contrast to oil and gas demand, which has plunged due to falling demand. We anticipate that renewables will shape the future of energy in the region while technological advances will drive the costs down. The attractiveness of LATAM is the low cost of renewables, which are continuing to show a downward pricing trend. Brazil, Chile, Colombia and Mexico have issued regulations that facilitate bilateral Power Purchase Agreements and spot markets, offering an economic advantage for investors, including long-term price forecasts. These investment and energy policies supporting the transition could work as a driver for an economic recovery of the region. The region still has a high percentage of electricity from hydropower as baseload. This has led to lower greenhouse gas emissions as a consequence of the abundance of the natural resource. In addition, there are many policies and regulations to work on in LATAM, especially in the energy efficiency sector. Regarding Energy Equity, scores have improved across the region, mainly due to subsidies, but there is still much work to do in energy security and environmental sustainability. Ongoing efforts to diversify the energy mix, and trying to reduce the regions dependence on fossils, has meant that renewable energy sources are beginning to gain the attention of international investors, focusing on solar PV and wind.
Figure 42: LAC Trilemma Balance
(G.9) RegionalTrilemma Balances
Source: World Energy Council

55
WO
RLD
EN
ERG
Y C
OU
NC
IL
Figure 43: Country performances of LAC
Source: World Energy Council
(G.45) Index - LAC region
Uruguay 13 BBAbBrazil 26 ACAcArgentina 29 ABBdCosta Rica 30 CBAbEcuador 34 ACAdColombia 36 ACAcChile 37 BBBaPeru 44 ACAbEl Salvador 46 BCAdPanama 49 DCAbParaguay 52 CCAdTrinidad & Tobago 53 CADcDominican Republic 59 DCBcBolivia 63 BCCdGuatemala 67 BDCdJamaica 72 DCCcHonduras 76 CDBdNicaragua 78 CDBd
Country RankScore
0 20 40 60 Grade
The main drivers for a favourable investment climate are the high load factors and low levelised costs of energy, making Latin America an interesting opportunity for renewable energy projects. This may also help to reactivate the economy, which was severely impacted by COVID-19, presenting an opportunity for countries to strengthen their policies and stimulus plans. The factors mentioned above also provide opportunities for establishing hydrogen production, which is currently included on the government agendas of Brazil, Chile, Argentina and Uruguay. All of the roadmaps presented to date mention interest in producing hydrogen from low cost renewable electricity for export. The main challenge for most countries in the region continues to be the lack of comprehensive regulatory frameworks, economic uncertainty and political stability. When it comes to policies, the region should consider straightforward and transparent regulations, promoting sustainable targets that could help decarbonise the region’s energy mix. This also includes considering new opportunities for distributed generation and energy storage, where again there are several opportunities for decentralising hydrogen production through renewable electricity. Collaboration with the private sector should be stimulated to enable the development of a robust and secure energy infrastructure.

56
TRIL
EMM
A IN
DEX
202
1
The Energy Trilemma Index aims to support an informed dialogue about improving energy policy by providing decision-makers with an objective relative ranking of countries’ energy system per-formance across three core dimensions of Energy Security, Energy Equity and the Environmental Sustainability of energy systems. The 2021 Index is based on an evolved methodology and focuses on a historical index of progress. This means that while the results cannot be directly compared with previous report iterations, the Index builds upon last year’s new time-series analysis capability that has calculated Trilemma performance back to 2000.
FREQUENTLY ASKED QUESTIONS
The World Energy Trilemma Index is a quantification of the Energy Trilemma, which is defined by the World Energy Council as the triple challenge of providing secure, equitable and affordable, environmentally sustainable energy. Balancing these priorities is challenging but is also the foundation for the prosperity and competitiveness of individual countries. The Energy Trilemma Index assesses current and past performance across the three dimensions of Energy Security, Energy Equity, and Environmental Sustainability. A fourth dimension of Country Context is also included within the calculations, to capture important differences in countries’ institutional and macroeconomic contexts.
Energy Security measures a nation’s capacity to meet current and future energy demand reliably, withstand and bounce back swiftly from system shocks with minimal disruption to supplies. The dimension covers the effectiveness of management of domestic and external energy sources, as well as the reliability and resilience of energy infrastructure.
Energy Equity assesses a country’s ability to provide universal access to reliable, affordable, and abundant energy for domestic and commercial use. The dimension captures basic access to electricity and clean cooking fuels and technologies, access to prosperity-enabling levels of energy consumption, and affordability of electricity, gas, and fuel.
Environmental Sustainability of energy systems represents the transition of a country’s energy system towards mitigating and avoiding potential environmental harm and climate change impacts. The dimension focuses on productivity and efficiency of generation, transmission and distribution, decarbonisation, and air quality.
WHAT IS THE WORLD ENERGY TRILEMMA INDEX?Country Context focuses on elements that enable countries to develop and implement energy policy effectively and achieve energy goals. The dimension describes the underlying macroeconomic and governance conditions, reports on the strength and stability of the national economy and government, the country’s attractiveness to investors, and capacity for innovation. The Energy Trilemma Index has been prepared annually by the World Energy Council in partnership with global consultancy Oliver Wyman and Marsh McLennan Advantage since 2010. The goal of the Index is to provide insights into a country’s relative energy performance with regards to Energy Security, Energy Equity and Environmental Sustainability. In doing so, the Index highlights a country’s challenges in balancing the Energy Trilemma and opportunities for improvements in meeting energy goals now and in the future. The Index aims to inform policy makers, energy leaders, and the investment and financial sector. Index rankings provide comparisons across countries on each of the three dimensions, whilst historical indexed scores provide insights into the performance trends of each country over time.
WHERE CAN I FIND THE FULL RESULTS?
- The results are published once a year. Results can be downloaded for free from the Council’s website. - The online tool, presenting full results: https://trilemma.worldenergy.org/ - The full report with insights and regional profiles: https://www.worldenergy.org/transition-toolkit/world-energy-trilemma-index
ANNEX A

57
WO
RLD
EN
ERG
Y C
OU
NC
IL
WHAT IS THE SCOPE OF THE INDEX?
WHAT TIME PERIOD DOES THE 2021 INDEX CAPTURE?
HOW ARE THE INDEX RESULTS PRESENTED?
The Index tracks 133 countries, 84 of which are member countries of the World Energy Council. However, rankings have only been produced for 127 countries, with five countries not being ranked due to political instability and/or poor data coverage. The countries that are tracked but not ranked are: Chad, Chinese Taipei, Libya/GSPLAJ, Syria (Arab Republic), Yemen, Barbados and Venezuela.
The Index aggregates around 60 datasets into 31 indicators to create a snapshot energy profile for each country. Furthermore, it calculates a historical index for each dimension back to a baseline year of 2000, see Figure 44.
The 2021 Index ranking reflects data from 1998 to 2020 using the most recent available data at global levels. The online Trilemma Tool presents Index performance since 2000 using longitudinal data with individual country pro-files. Particular indicators feature some data delays, which mean recent world events or the most recent transitions in the energy sector that could affect the Index’s outcomes may not be fully captured (for example, the COVID-19 pandemic as well as geopolitical or social issues).
Countries are provided with an overall Index ranking from #1 to #127, as well as rankings for each dimension of Energy Security, Energy Equity and Energy Sustainability of their energy systems. The top performing country is awarded a #1 ranking, while the lowest ranking country is assigned rank #127 (for 2021, a number of countries tied in their scores, so that the lowest rank illustrated is #101). In addition, scores for the three dimensions of Energy Security, Energy Equity, and Environmental Sustainability are distributed into four balance grades (A, B, C and D).
Every country is thus assigned a set of balanced grades (e.g. ‘ABC’). Each letter reflects one dimension of the Energy Trilemma: the first letter refers to Energy Security; the second letter to Energy Equity and the third letter to Environmental Sustainability. The mean and standard deviation of the scores in each dimension is calculated; balance grades for each dimension are then assigned using bands based on the mean and standard deviation. High performance across all three dimensions is awarded ‘AAA’. Sets of grades such as ‘ABC’ or ‘CBD’, highlight the balance or imbalance across a country’s energy performance. An imbalance in energy performance suggests current or future challenges in the country’s energy policy. Index results and analysis are also complemented by regional overviews as well as individual country profiles with expert commentary form the Council’s national Member Committees.
Figure 44: Differences between index trends for a stable improver and a falling performer
Energy Security Energy Equity Environmental Sustainabiltiy
INDEX TRENDS FOR A STABLE IMPROVER INDEX TRENDS FOR A FALLING PERFORMERBase year 2000 = 100 Base year 2000 = 100
150
125
100
75
50
25
0
150
125
100
75
50
25
02000 2005 2010 2015 2020 2000 2005 2010 2015 2020

58
TRIL
EMM
A IN
DEX
202
1
INDEX RANKINGS & POLICIES
The Index shows how well each country is performing on the Energy Trilemma and captures the aggregate effect of energy policies imple-mented over time. Because the Index shows aggregate policy effects, it does not identify the effectiveness of a particular policy; each policy interacts with a set of policy-specific and contex-tual factors unique to that country over different periods. Nonetheless, by broadly measuring aggregate policy outcomes, the Index provides important insights into the efficacy of energy policies and choices.
Historical calculations for each of the three energy dimensions indexed to the year 2000 provide performance trends for Security, Equity and Sustainability, which can be compared to policies and exogenous factors over time, provid-ing potential insights on the effects of different factors on energy outcomes.
The Index is weighted in favour of energy performance (Energy Security, Energy Equity and Environmental Sustainability dimensions) versus contextual performance (Country context dimension). Therefore, changes in energy perfor-mance will have a greater effect on a country’s ranking than changes in its macroeconomic and governance conditions.
Few countries manage to perform well across all three energy dimensions, just 9 out of 127 countries managed to achieve AAA grades across the energy Trilemma dimensions in 2021. Currently, many countries achieve stronger performance in two dimensions but falter in
WHAT DOES THE INDEX TELL US ABOUT THE COUNTRY’S ENERGY
PERFORMANCE AND POLICY?
WHAT WILL AFFECT A COUNTRY’S RANKING IN THE INDEX?
one, suggesting trade-offs between energy dimensions. For example, the abundance of oil in some energy-exporting countries means that they enjoy highly secure and affordable energy. However, low prices limit incentives to reduce energy consumption and to engage in energy efficiency programs affecting their performance in Environmental Sustainability due to higher greenhouse gas emissions.
It is important to note that the Index is a compara-tive ranking and shows the performance of a coun-try relative to all other countries. To move up in the Index, a country must improve its overall score. For example, a country’s ranking on the indicator “Diversity of electricity generation” will depend on how its diversity of electricity generation (from hydroelectricity, biomass and waste, geothermal, solar and wind) ranks against other countries.
Similarly, if a country’s score remains stable, but those of its peers improve, it will move down in the rankings. Put differently, a country’s underlying indicator data can remain the same year-on-year, but its Index position can move due to changes within other countries. Thus, performance stagna-tion could impact the Index position in the same way as retrograde motion of the energy perfor-mance data.
In 2021, the World Energy Council, in partner-ship with Oliver Wyman and Marsh McLennan Advantage, used a revised methodology from 2019 to calculate indicator scores. This has resulted in a new set of relative performance rankings, strengthened by historical trend analyses. It should however be stressed that the results published in 2019 or 2020 are not directly comparable to those published in 2021 due to the changes in methodology.
HOW CAN A COUNTRY MOVE UP OR DOWN THE INDEX?
ANNEX B

59
WO
RLD
EN
ERG
Y C
OU
NC
IL
It has been challenging to compare Trilemma rankings across years due to the historical methodology used, which comparatively ranked countries solely on that year’s Trilemma calcula-tion. Using the rankings alone, it was not possible to judge whether a country had improved its own performance or not, and instead only whether a country’s ranking had improved in comparison to others in that year.
The inability to provide insight into country performance year-on-year was a key driver in evolving the methodology to include indexation so that direct comparison with earlier years’ per-formance could be made. While direct compari-son with between 2020 and 2021 Index rankings is not possible given changes in methodology, the indexation illustrates now how performance by key dimension indicators has evolved for each country.
HOW DOES THIS YEAR’S RANKING COMPARE WITH PREVIOUS YEARS?
A country’s overall score is determined by the weighted average of dimensions A to D scores. A country with triple-A balance grades highlights their superiority within a dimension compared to other countries which do not have A grades. However, they may not fall into the top 10 as the values on which the grades are assigned may be at the lower threshold for the specific grade category. A country’s triple-A grades may be composed of relatively ‘lower-score’ As. In practice, this could result in a lower overall weighted average score than an AAB country where the A grades and B grade are well beyond the threshold levels.
WHAT POLICIES WILL AFFECT A COUNTRY’S SCORE AND POSITION ON THE INDEX?
WHY ARE SOME COUNTRIES WITH TRIPLE-A BALANCE GRADES NOT INCLUDED
IN THE TOP 10 COUNTRIES WHILE OTHERS, WHICH DO NOT HAVE TRIPLE-A BALANCE GRADES ARE?
Policies can affect multiple data points aggre-gated by the Index such that their effects are not exclusive to a single indicator or even a dimension. Thus, it is often difficult to pinpoint how any single policy affects a country’s per-formance against an indicator or dimension. For example, policies to increase penetration of renewable energy could affect security (by diversifying energy mix and reducing demand for imports) and sustainability (by reducing carbon dioxide emissions). If the policies contributed to higher electricity prices, the policies could also impact the equity dimension. External factors like technological change (e.g. changes in renewables technology) can also have an impact, and are not directly measured by the Index.
Those factors noted, countries that implement a range of clear and predictable energy policies resulting in an overall framework that addresses the three aspects of Energy Trilemma typically rank higher in the Index.

60
TRIL
EMM
A IN
DEX
202
1
INDEX METHODOLOGY
Each indicator category is composed of a set of carefully selected indicators that meet our selection criteria and are highly relevant to the World Energy Council’s understanding of the Energy Trilemma.
It is also critical that the indicators can be consistently and readily derived from reputable sources and cover a high proportion of the World Energy Council’s member countries; some potential indicators were excluded from the Index due to low member country coverage.
The key data sources for the Energy Trilemma Index model are: IEA World Energy Balances, Indicators,
World Energy Prices, and Emissions World Bank/UN SDG 7 tracking data
World Bank Doing Business report
JODI and IGU data
World Resources Institute
Global Competitiveness Index, WEF
HOW ARE INDICATORS SELECTED FOR THE INDEX?
Indicator selection criteria includes: Coverage: The World Energy Council includes indicators that are critical to the Index’s methodology and strives to ensure that each indicator possesses a strong coverage of data (more than 75% coverage across the 133 tracked countries). Comparability: Data to calculate indicator scores are derived from as unique and compre-hensive sources as possible, focusing on a single source per indicator as far as practical, to ensure comparability between countries. Relevance: Indicators are chosen or developed to provide insight into country situations in the context of the project goals and in line with the narrative. Distinctiveness: Each indicator focuses on a different aspect of the issue being explored and avoids overlaps or redundancy with other indicators.
Contextual sensitivity: Indicators capture dif-ferent country situations (e.g. wealth, size) and, where appropriate, indicators are normalised by GDP (PPP), GDP (PPP) per capita, population, or other relevant metrics. Robustness: Indicator scores are computed from data made available by reputable sources with the most current information available at sufficient coverage. Balance: Indicators within each dimension (and dimensions across the Index) exhibit coverage of different issues.
ANNEX C

61
WO
RLD
EN
ERG
Y C
OU
NC
IL
WHAT IS THE 2021 INDEX BASED ON?
Each country’s overall Index ranking is based on the calculation of 31 underlying indicators which aggregate up to 11 categories across the four dimensions (including country context). Some of these indicator calculations are based on multiple datasets, others rely on just one. For example, the category “Affordability” is measured using four indicators, each of which is supported by
multiple datasets. Two additional indicators (A2d. System resilience and C2c. Transport sector decarbonisation) and one sub-indicator (A2b.c. Energy storage – electricity) were not included in the model due to lack of available data, and remain placeholders for future Trilemma iter-ations. Figure 45 provides an overview of the indicators and their weighting.
Figure 45: 2021 Energy Trilemma Index structure and weighting of the indicators
Affordability ofelectricity forresidents
Natural gasprices
B3c
B3d
3%
3%
ENER
GY
EQU
ITY
Access toelectricity
Gasoline anddiesel prices
Access toclean cooking
Electricityprices
B1a
B1b
B3a
B3b
Access to“modern”energy
%6 a2B
6%
6%
ENER
GY
SEC
UR
ITY
Diversity ofprimary energy supply
Energystorage
Importindependence
Diversity ofelectricity generation
A1a
A1b
A2a
A2b
System stabilityand recoverycapacity
A2c6%
6%
6%
6%
6%
3%
3%
ENVI
RO
NM
ENTA
LSU
STAI
NAB
ILIT
Y
A1 SECURITY OF SUPPLYAND DEMAND
A2 RESILIENCE OFENERGY SYSTEMS
B1 ENERGYACCESS
B2 QUALITYENERGY ACCESS
B3 ENERGYAFFORDABILITY
C1 RESOURCE PRODUCTIVITY C2 DECARBONISATION C3 EMISSIONS AND POLLUTION
Final energyintensity
C1a 5%
Low carbonelectricity generation
C2a 5%
C2b
Efficiency of powergeneration and T&D
C1b
CO
UN
TRY
CO
NTEXT
Effectivenessof government
Politicalstability
Ruleof law
Regulatoryquality
Macroeconomicstability
Foreign directinvestmentnet inflows
Easeof doingbusiness
D3
STAB
ILIT
Y FO
R IN
VEST
MEN
T AN
D IN
NO
VATI
ON
Innovationcapacity
D1
MAC
RO
ECO
NO
MIC
ENVI
RO
NM
ENT
D1a
2%
D2a
1%
D2b
1%
D2c
1%
D2d
1%
D3a
1%
D3b
1%
D3c.5%
D3d.5%
D3e.5%
D3f.5%
Intellectualpropertyprotection
Efficiency oflegal frameworkin challengingregulation
Perceptionof corruption
A1 SECURITY OF SUPPLYAND DEMAND
A2 RESILIENCE OFENERGY SYSTEMS
B1 ENERGYACCESS
B2 QUALITYENERGY ACCESS
B3 ENERGYAFFORDABILITY
C1 RESOURCE PRODUCTIVITY C2 DECARBONISATION C3 EMISSIONS AND POLLUTION
D2
GO
VER
NAN
CE
Trend of GHGemissions from energy
5%
5%
5%C3d
CO2 per capita
C3b
C3a
CO2 intensity
2%
C3c CH4 emissionsfrom energy per ktoe
2%
1%
PM2.5 meanannual exposure

62
TRIL
EMM
A IN
DEX
202
1
WHY WAS THE INDEX METHODOLOGY REFINED IN 2021?
WHAT ARE THE KEY DESIGN AND METHODOLOGY CHANGES TO THE 2021 INDEX?
The Trilemma Index has been gradually refined since its introduction and now ranks 127 countries. The original methodology has been revised throughout the years with the aim of improving transparency and offering stakeholders better insights to help improve their energy policies. Until 2019, the Energy Trilemma had been a comparative ranking of about 130 coun-tries assessed across the dimensions of security, sustainability and equity. A comparative ranking is a great way to start a conversation about energy policy by tapping into competitive instincts and highlighting which dimension might need the most focus. A comparative ranking is less helpful in providing guidance on how to improve a country’s energy policy. One could look at the top-ranking countries for the different dimensions to under-stand the reasons for their better performance, although whether or not their policies would be relevant to other countries would require further
The 2021 Index is based on the significantly updated 2019 Methodology, with some additional methodological refinements aimed at strengthening the data coverage. The resulting analysis provides a richer view of a country’s energy performance, incorporating contemporary indicators and datasets that better represent the current world energy context. The most significant changes to the Methodology are in Energy Equity. We revised how the grades are allocated to address longstanding issues with the skewed distributions of 3 sub-indicators (B1a. Access to electricity, B1b. Access to clean cooking, B2a. Access to “modern” energy). In technical terms, the grading assumes a normal distribution of the indicator so that each letter gets 25% of the scores. But this approach does not work with the heavily skewed distributions and leads to over-representation of A & B grades, and too few C & D grades. We have switched to a simpler approach where the first 33 countries get A, the next 33 get B, the next 33 get C and the final 33 get D in order to better align with the grading distribution for the Security and Sustainability dimensions. There has also been a new approach with banding of the scores for the 3 sub-indicators to reflect that the final couple of percentage for energy
analysis of the differing domestic contexts. The main criticism of comparative rankings comes from the fact that improving performance by one country may not be recognised if other countries have improved more, which is where time-series or longitudinal analysis can be more insightful.
A time-series analysis enables performance to be assessed over time to understand whether a policy intervention has made a positive contribution or if further refinement might be necessary. Presenting a dynamic picture of the performance over time also helps to identify the most effective policy interventions and enables the Energy Trilemma to become a policy pathfinding tool. By seeing performance at a country level over time, it becomes easier to identify where a policy intervention might be best targeted and subse-quently to track its impact. This follows the usual evidence-based policy assessment approach.
access / clean cooking are the hardest to address. Previously we simply used the percentages that extenuated the distribution skew. The second change was in the Sustainability dimension, where we revised data sources to address data collection changes and improve data coverage with better focus on the energy sector. We dropped the sub-indicator for exposure to PM10 as this data series is no longer available and redistributed its weight across the Sustainability sub-indicators. For C2b., we have been able to stop using CO2 as proxy because the World Resources Institute now provides a more timely data series for greenhouse gas emissions. We have also revised the sub-indicator C3c. indicator to be Methane emissions from the energy sector using emissions data again from the World Resources Institute. This indicator was always intended to focus on the energy sector emissions but originally had to consider all methane emissions as globally comparable data was not available. The WRI data is now used and we have revised the indicator accordingly with the scores standardised on the basis of hydrocarbons in the primary energy supply.
The final change was in the Energy Security dimension, with a minor update to the name of the A1b. indicator that has changed to

63
WO
RLD
EN
ERG
Y C
OU
NC
IL
WHY ARE CATEGORY AND INDICATOR WEIGHTS GIVEN UNIQUE WEIGHTS INSTEAD OF EQUAL WEIGHTS?
WHY IS THE RESCALING RANGE DETERMINED BY CALCULATED AND/OR DERIVED VALUES?
WHY ARE SCORES NORMALISED? WHAT IS THE BENEFIT OVER STANDARDISATION USED WITH NORMALISATION?
Unique weights are assigned for indicator categories and indicators in the 2021 World Energy Trilemma Index to account for their relative importance, while balancing scientific robustness and transparency. The indicator categories have been set up to provide a comprehensive picture of each dimension. Their weights are determined by the number of
When using actual minimum and maximum values for normalising, outliers can cause the distribution of normalised data to be skewed. Furthermore, actual minimum and maximum values may not be meaningful and/or accurate in representing the indicator if there is a theoretical minimum and maximum involved, or it does not consider the nature and significance of the indi-cator in relation to the status quo and goals of the energy system. By contrast, using calculated or derived values help to mitigate the effects of outliers. For example, taking the average of the bottom and top five performing countries for the indicator C2c. CH4 emissions per capita as
Aggregating scores using normalisation res-cales them to the range 0 to 100. Scores with different ranges of values are thus adjusted to a common scale for comparison, allowing for a more accurate reflection of the data within
the minimum and maximum values mitigates the impacts of countries with extremely high or low values. Additionally, such values help to better represent indicator scores with a theoretical minimum and maximum. For example, indicator B1a. Access to electricity, which is represented as a percentage of total population has a natural minimum value of 0% and a maximum value of 100%. Moreover, it helps indicators to accurately depict the status quo and goals of the energy system. For example, indicator C3a. CO2 inten-sity uses a minimum score calculated by the global average CO2 intensity targets to reach the 2030 1.5ºC IPCC target.
indicators included in it and its relevance to the dimension.
The individual indicators reside at a level under dimension categories; they serve as the build-ing blocks of the dimension categories. Their weights are determined by their relevance to the indicator category.
Index results. As analogous results can be obtained by applying both standardisation and normalisation, an approach involving normal-isation only is preferable as it is simpler and increases transparency.
Import independence to avoid confusion about interpreting the result, while the calculation remains as before. The changed Methodology has been applied to all countries and to the full back-series of historic index performance going back to the index base year of 2000 so that comparisons need to be against the time-series and not last year's publication. We have also kept the shared rankings so if countries' overall scores differ to less than 0.1,
they share the rank position. We have used a dense ranking approach because some scores are tied at one decimal place. As such, comparisons between 2020 and 2021 rankings are not comparing like with like. Updated data sources have also been introduced. Typically, changes in a country’s energy performance evolve slowly over several years, which will be reflected in a gradual upward or downward trend in the Index graph, which can be tracked via the online tool.

64
TRIL
EMM
A IN
DEX
202
1
WHY ARE GATE CRITERIA USED?
WHAT ARE THE LIMITATIONS OF THE INDEX?
WHY IS MISSING DATA REPLACED BY THE COUNTRY GROUP AVERAGE?
Gate criteria were introduced to address heavily skewed data and address the differences in coun-tries’ natural endowments and macroeconomic positions. This is to ensure that cross- country comparisons across the three dimensions are meaningful. For example, a gate criterion for electrification rate was introduced for the indicator B3d. Affordability of electricity for residents. Only countries with more than 90% access to electricity are assigned a score for this affordability indicator, as it is mostly relevant for countries that are already largely electrified. A gate criterion helps group similar countries (e.g. those with a high rate of electricity access) and thereby prevents the skewed data from excessively influencing outcomes.
The Index cannot capture real-time Energy Trilemma performance due to the challenges of capturing large volumes of reliable data for a wide range of countries. The Index cannot isolate the impact of a single policy. The Index uses 76 data sets. In a few instances, data for specific countries is not available
The country group average is a good represent-ative of countries in the same region in terms of economic development, social situation, political conditions, etc. This representativeness renders missing values less likely to distort country outcomes6. The groups are based (jointly) on economic groups and geographic region. Economic groups are defined as depending on the value of GDP per capita in USD: GDP Group I: greater than 33,500 GDP Group II: between 14,300 and 33,500 GDP Group III: between 6,000 and 14,300 GDP Group IV: lower than 6,000
Which (sub)-indicators are subject to a gate criterion? The following indicators and sub-indi-cator are subject to a gate criterion: A1a. Diversity of primary energy supply A1b. Import dependence A2b.b Energy storage (gas) B3c. Natural gas prices B3d. Affordability of electricity for residents Please refer to the section Indicators descrip-tion in the Index Methodology document for a detailed explanation of the gate criteria and the rationale behind the gate criteria for each of the indicators and sub-indicator.
(i.e. the data set has missing data), in which case missing data is replaced by the country group mean. Full details on the Index Methodology, including the sources of all datasets and how each indica-tor is calculated and treated, are provided in the comprehensive Methodology document that is available to the Council’s Community.
Geographic regions are defined as: Asia Europe Latin America and Caribbean (LAC) Middle East and North Africa (MENA) North America Sub-Saharan Africa (SSA) For example, if Gabon lacks PM2.5 data, it will be given a PM2.5 score equal to the average score of the countries in the country group with similar GDP and geographic location, which would be more reflective of the economy and energy profile.
6 Please note that only the A2b. Energy storage sub-indicator Crude oil production uses proxy or estimated values for missing data as these provide better accuracy, considering the general low coverage of Energy storage indicator.

65
WO
RLD
EN
ERG
Y C
OU
NC
IL
ACKNOWLEDGEMENTS The project team would like to thank the individuals who informed the project’s approach, supplied information, provided ideas and reviewed drafts. Their support and insight have provided an invaluable contribution to the report. We also thank our Council’s national Member Committees for the reviewed and updated Country Profile contributions.
WORLD ENERGY COUNCIL STUDY GROUP – PRINCIPAL CONTRIBUTORS
WORLD ENERGY COUNCIL STUDIES COMMITTEE
Sir Philip Lowe (Executive Chair) - Abdulaziz Beayeyz, Saudi Arabia - Abdullah Al-Subaie, Saudi Arabia - Abdullah Sultan, Saudi Arabia - Abubakar Sani Sambo, Nigeria - Adeliya Bulatova, Russian Federation - Alexandru Sandulescu, Romania - Ana Sousa, Portugal - Anastasia Belostotskaya, Russian Federation - Andrea Bonzanni, United Kingdom - Andrey Logatkin, Russian Federation - Ardit Cami, Belgium - Betty Muthoka, Kenya - Brian Statham, South Africa - Burkhard Von Kienitz, Germany - Carlos Toro, Chile - Charles Chibambo, Malawi - Chimaobi Nna, Nigeria - Dana Declaro, Singapore - David Hardie, Canada - Egor Kvyatkovsky, Russian Federation - Elizabeth Njoki Wanjiru, Kenya - Emiliano Battazzi, Italy - Gabriella De Maio, Italy - George Constantin, Romania - Gheorghe Indre, Romania - Gintaras Adzgauskas, Lithuania - Hasmik Barseghyan, Armenia - Hector Natera, Argentina - Hiroyuki Takeuchi, Japan - Horst Brandlmaier - Hugo Forero, Colombia - Ilya A. Platonov, Russian Federation - Ilya Platonov, Russian Federation - Ionut Purica, Romania - Ivar Baldvinsson, Iceland - Jean-Eudes Moncomble, France - Joan Chahenza, Kenya - Jose Caceres Blundi, Switzerland - Josip Dolic, Bosnia and Herzegovina - Joy Eze, Trinidad and Tobago - Juan Celis, Colombia - Kevin Enongene, Cameroon - Klaus Hammes, Sweden - Learta Hollaj, Kosovo - Leo Jansons, Latvia - Liza Van der Merwe, New Zealand - Majed Al-Swaileim, Saudi Arabia - Manuel Quijano, Spain - Merve Rabia Gurluk, Turkey - Mohamed Al-Huzaym, Saudi Arabia - Mohammed Abdelhak Chibani, Algeria - Mohammed Al-Aqeel, Saudi Arabia - Nabil Bouraoui, Tunisia - Nabil Jedaira, Morocco - Namejs Zeltins, Latvia - Nevin Alija, Portugal - Nicole Kaim-Albers, Germany - Nii Ahele Nunoo, United States of America - Nikita Bashkatov, Russian Federation - Nikola Tomasovic, Serbia - Nishant Kumar Sharma, India - Noura Mansouri, Saudi Arabia - Olawole Oyewole, Nigeria - Olga Bogdanova, Latvia - One Nkoane, Botswana - Patrick Lees, Finland - Pedro Ernesto Ferreira, Portugal - Priit Mändma, Estonia - Rahul Sharma, India - Rajnish Wadehra, India - Randika Wijekoon, Sri Lanka - Ricardo Hernan Pacheco Chavez, Bolivia - Salihe Kaya, Turkey - Salisu Isihak, Nigeria - Sara Jaber, Lebanon - Sergey Ivakhin, Russian Federation - Sogo Mayokun Abolarin, Nigeria - Soumya Prakash Nayak, India - Susan Wacuka, Kenya - Tanvi Rajput, India - Tina Schirr, New Zealand - Toby Stevenson, New Zealand - Tom Walker, Australia - Urbain Nzotcha, Cameroon - Uzair Baig, Canada - Vanty Tang, Australia - Vesa Vuolle, Finland - Vivek Taneja, India - Wassim Ballout, France - William D'haeseleer, Belgium - Yana Popkostova, France - Yena Chae, Korea (Rep. of) - Yose Ardhani Farasi, Indonesia - Zlata Sergeeva, Russian Federation
Dr Leonhard Birnbaum (Chair, Germany) - Martin Young (Secretary, World Energy Council) - Alejandro Perroni (Uruguay) - Andrea Heins (Argentina) - Andrea Maria Quaggia (Italy) - Andrey Logatkin (Russian Federation) - Atul Sobti (India) - Barış Sanlı (Turkey) - Berardo Guzzi (Italy) - Burkhard Von Kienitz (Germany) - Claudio Huepe Minoletti (Chile) - Edouard Sauvage (France) - François Dassa (France) - Hans-Wilhelm Schiffer (Germany) - Herwig Klima (Austria) - Jean-Baptiste Galland (France) - Jeanne Chi Yun Ng (Hong Kong) - Joseph Al Assad (Lebanon) - Juan Benavides (Colombia) - Kambiz Rezapour (Iran, Islamic Republic of) - Katerin Osorio Vera (Colombia) - Klaus Hammes (Sweden) - Lawrence Ezemonye (Nigeria) - Mamadou Diarra (Niger) - Mehdi Sadeghi (Iran, Islamic Republic of) - Miguel Perez de Arce (Chile) - Muna Ahmad Almoodi (United Arab Emirates) - Nalin Shinghal (India) - Rebecca Yuen (Hong Kong) - Stefan Gheorghe (Romania) - Tina Schirr (New Zealand) - Tom Kober (Switzerland) - William D'haeseleer (Belgium) - Yanbing Kang (China) - Yongping Zhai (China) - Yuji Matsuo (Japan)
TRILEMMA STUDIES COMMITTEE REVIEWERS AND ADVISORS Sir Philip Lowe (Chair) - Alejandro Perroni (Uruguay) - Andrea Maria Quaggia (Italy) - Claudio Huepe Minoletti (Chile) - François Dassa (France) - Hans-Wilhelm Schiffer (Germany) - Jean-Baptiste Galland (France) - Jeanne Chi Yun Ng (Hong Kong) - Juan Benavides (Colombia) - Katerin Osorio Vera (Colombia) - Klaus Hammes (Sweden) - Mamadou Diarra (Niger) - Tina Schirr (New Zealand) - William D'haeseleer (Belgium) - Yongping Zhai (China) - Yuji Matsuo (Japan)

66
TRIL
EMM
A IN
DEX
202
1
OLIVER WYMAN / MARSH MCLENNAN COMPANIES PRINCIPAL CONTRIBUTORS
PROJECT TEAM
AUTHORS / PROJECT MANAGEMENT
SECTION AUTHORS AND CONTRIBUTORS
TRILEMMA COUNTRY COMMENTARIES
Francois Austin (Partner and Global Head of Energy Practice, Oliver Wyman) - David DesRoches (OW Digital) - Guy D’Annolfo (OW Digital) - Gregory Bylenok (OW Digital) - Andrew George (Global Head, Energy & Power, Marsh JLT Specialty) - Lucy Nottingham (Director, Marsh McLennan Advantage)
Dr Angela Wilkinson (Secretary General, World Energy Council) - Sir Phillip Lowe (Executive Chair, World Energy Council) - Dr Leonhard Birnbaum (Chair, Studies Committee, World Energy Council) - Martin Young (Senior Director, Insights, World Energy Council)
Rob Bailey (Director, Marsh McLennan Advantage) - James Sutherland (Director, Marsh McLennan Advantage) - Claudio Saffioti (Research Manager, Marsh McLennan Advantage) - Toshin Sequeira (Research Analyst, Marsh McLennan Advantage) - Lucia Kocincova (Senior Manager, Quantitative Analysis, World Energy Council) - Martin Young (Senior Director, Insights, World Energy Council)
Haydee Jimenez, Anna Urrutia (Regional Managers for Latin America and The Caribbean, World Energy Council) - Cristina Morales (Senior Manager, Regional Activation and Start Ups) – Massimiliano A. Cervo (Director Of Business Development, H2helium) - Sjoerd Ammerlaan (Regional Manager for Europe, World Energy Council) - Latsoucabé Fall (Regional Manager for Africa, World Energy Council) - Suji Kang (Regional Manager for Asia, World Energy Council) - Sandra Winkler (Director, Member Networks and Institutional Relations, World Energy Council) - Andrew Vickers (Special Advisor, Communications, World Energy Council) - Lucila Galtieri (Designer) - Dr Fiona Watson (Director, Afion Media) - James Sutherland (Director, Marsh McLennan Advantage) - Rob Bailey (Director, Marsh McLennan Advantage) - Claudio Saffioti (Research Manager, Marsh McLennan Advantage) - Toshin Sequeira (Research Analyst, Marsh McLennan Advantage) - Cheryl Lai Kar Yean (Designer, Oliver Wyman) - Lucia Kocincova (Senior Manager, Quantitative Analysis, World Energy Council) - Martin Young (Senior Director, Insights, World Energy Council).
Ardit Cami - Randolph Brazier - Bart Kolodziejczyk - Walter Starik - Jose da Costa Carvalho Neto - Talita Covre - Angel Nikolaev - Mariya Trifonova - Barbara Eguigueren - Richard Mao - Daniel Díaz - Alejandro Castañeda - Louise Sengeløv - Andrea Espinosa - Harri Laurikka - Kostama Jari - Jenni Patronen - Jean-Eudes Moncomble - Haris Doukas - Rebecca Yuen - Baldur Petursson - Soumya Prakash Nayak - Nishant Kumar Sharma - Clive Bowers - Piyush Verma - Ruth Kedar - Paolo Storti - Mirko Armiento - Paolo D'Ermo - Ilaria Danesi - Sandro Furlan - Gita Actina - Vytautas Rimas - Gintarė Gaidelionytė - Mantas Mikalajūnas - Christian Diendorfer - Henry Debattista - Sandro Lauri - Jose Valenzuela Robles Linares - Thaddeus Anim-Somuah - Tina Schirr - Emily Calvert - Jessica Guevara - Victor Andres Martinez - Bento de Morais Sarmento - Pedro Ernesto Ferreira - Ana Sousa - João Gomes - Adeliya Bulatova - Miodrag Mesarović - Ivan Šmon - Karina Medved Bregar - Wendy Poulton - David Wright - Kiren Maharaj - Ana Belén Padilla Moreno - Pablo Dejuan - Randika Wijekoon - Klaus Hammes - Célien Fitoussi - Benjamin Teufel - Abdullah Buğrahan Karaveli - Katarzyna Waker - Fatma Khalid Al Falasi - Dina Ibrahim Almannaee - Naser Alhammadi - Nawal Yousif Ibrahim Al-Hanaee - Dhaen Obaid Ali Almehairi - Sami Fikree

67
WO
RLD
EN
ERG
Y C
OU
NC
IL
TRUSTEES WORLD ENERGY COUNCIL PARTNERS California ISO EDF ENGIE Gazprom Oliver Wyman PwC Rosseti Rosatom Tokyo Electric Power Co
JEAN-MARIE DAUGER Chair
OLEG BUDARGIN Vice Chair – Congress, 2022
KLAUS-DIETER BARBKNECHT Vice-Chair – Finance
SHIGERU MURAKI Vice Chair – Asia Pacific/South Asia
MIKE HOWARD Vice Chair – Innovation
CLAUDIA CRONENBOLD Vice Chair – Latin America/Caribbean
LEONHARD BIRNBAUM Chair – Studies Committee
IBRAHIM AL-MUHANNAVice Chair – Gulf States/Middle East
ELHAM MAHMOUD IBRAHIM Vice Chair – Africa
ALEXANDRE PERRA Vice Chair – Europe
JOSÉ ANTONIO VARGAS LLERAS Chair – Programme Committee
OMAR ZAAFRANI Chair – Communications & Strategy Committee
DR ANGELA WILKINSON Secretary General & CEO

68
TRIL
EMM
A IN
DEX
202
1
62–64 CornhillLondon EC3V 3NH United KingdomT (+44) 20 7734 5996F (+44) 20 7734 5926E [email protected]
www.worldenergy.org | @WECouncil
WORLD ENERGY COUNCIL
Algeria
Argentina
Armenia
Austria
Bahrain
Belgium
Bolivia
Bosnia-Herzegovina
Botswana
Bulgaria
Cameroon
Chile
China
Colombia
Congo (Dem. Rep.)
Côte d'Ivoire
Croatia
Cyprus
Dominican Republic
Ecuador
Egypt (Arab Rep)
Estonia
eSwatini (Swaziland)
Ethiopia
Finland
France
Germany
Greece
Hong Kong, China
Hungary
Iceland
India
Indonesia
Iran (Islamic Rep)
Ireland
Italy
Japan
Jordan
Kazakhstan
Kenya
Korea (Republic)
Kuwait*
Latvia
Lebanon
Lithuania
Malta
Mexico
Monaco
Mongolia
Morocco
Namibia
Nepal
Netherlands
New Zealand
Niger
Nigeria
Norway
Pakistan
Panama
Paraguay
Poland
Portugal
Romania
Russian Federation
Saudi Arabia
Senegal
Serbia
Singapore
Slovenia
Spain
Sri Lanka
Sweden
Switzerland
Thailand
Trinidad & Tobago
Tunisia
Turkey
United Arab Emirates
Uruguay
USA
Vietnam
*awaiting membership approval