World Bank Documentdocuments.worldbank.org/curated/en/793471537214192071/pdf/FY1… · This...
67
FY19 World Bank Budget August 31, 2018 INTERNATIONAL BANK FOR RECONSTRUCTION AND DEVELOPMENT INTERNATIONAL DEVELOPMENT ASSOCIATION Public Disclosure Authorized Public Disclosure Authorized Public Disclosure Authorized Public Disclosure Authorized
Transcript of World Bank Documentdocuments.worldbank.org/curated/en/793471537214192071/pdf/FY1… · This...

FY19 World Bank Budget
August 31, 2018
INTERNATIONAL BANK FOR RECONSTRUCTION AND DEVELOPMENT
INTERNATIONAL DEVELOPMENT ASSOCIATION
Pub
lic D
iscl
osur
e A
utho
rized
Pub
lic D
iscl
osur
e A
utho
rized
Pub
lic D
iscl
osur
e A
utho
rized
Pub
lic D
iscl
osur
e A
utho
rized


i
CONTENTS1
OVERVIEW AND RECOMMENDATIONS ...................................................................................... 1
1.1 OVERVIEW ....................................................................................................................................... 1
1.2 FY19 BUDGET RECOMMENDATIONS ......................................................................................... 4
STRATEGIC DIRECTIONS AND BUSINESS OUTLOOK ............................................................. 6
2.1 STRATEGIC CONTEXT ................................................................................................................... 6
2.2 LENDING OUTLOOK ...................................................................................................................... 8
2.3 COST OF DOING BUSINESS......................................................................................................... 10
2.4 EFFICIENCY ................................................................................................................................... 11
FY19 EXPENDITURE FRAMEWORK ............................................................................................ 15
3.1 AGGREGATE BANK BUDGET ..................................................................................................... 15
3.2 EXTERNAL FUNDS OUTLOOK ................................................................................................... 18
3.3 AGGREGATE BANK BUDGET AND EXTERNAL FUNDS ....................................................... 19
FY19 BUDGET ..................................................................................................................................... 20
4.1 ADMINISTRATIVE BUDGET PROPOSAL .................................................................................. 20
4.2 ADJUSTMENTS TO THE BUDGET .............................................................................................. 21
4.3 STRATEGIC ALIGNMENT BY WORK PROGRAM ................................................................... 23
4.4 OPERATIONAL WORK PROGRAM ............................................................................................. 27
4.5 GRANT-MAKING FACILITIES ..................................................................................................... 39
4.6 IG&A UNITS.................................................................................................................................... 40
4.7 CENTRALLY-MANAGED ACCOUNTS ....................................................................................... 43
4.8 EXPENSE FUNCTIONAL VIEW .................................................................................................. 45
CAPITAL BUDGET ............................................................................................................................. 48
5.1 FACILITIES ..................................................................................................................................... 48
5.2 TECHNOLOGY AND SYSTEMS ................................................................................................... 49
ANNEXES
ANNEX I: PROGRAM COST SUMMARY .............................................................................................. 51
ANNEX II. INDICATORS OF BUDGET SUSTAINABILITY, STRATEGIC ALIGNMENT, AND
BUDGET EFFICIENCY ......................................................................................................................... 56
1 In the tables, charts, and text, the totals have been rounded to the nearest whole number. Numbers may not sum due to rounding.

ii
TABLES
Table 2.1: Growth in IBRD/IDA Lending Portfolio ..................................................................................... 9
Table 3.1: Bank Budget (US$ million) ....................................................................................................... 15
Table 3.2: FY19 Bank Budget and External Funds (US$ million) ............................................................. 19
Table 4.1: FY19 WB Budget (US$ million) .............................................................................................. 20
Table 4.2: Incremental Additions to the Budget (US$ million) .................................................................. 22
Table 4.3. Claw-backs from Budget (US$ million) .................................................................................... 23
Table 4.4: FY18-19 Budget by Work Program & Funding Source (US$ million) ..................................... 23
Table 4.5: 18-19 Budget Share by Work Program and Funding Source..................................................... 24
Table 4.6: FY19 Operational Budget Envelopes (US$ million) ................................................................. 29
Table 4.7: Grant-Making Facilities Budgets (US$ million) ........................................................................ 39
Table 4.8: FY19 IG&A Budget Envelopes (US$ million) .......................................................................... 42
Table 4.9: FY18 and FY19 ED and IEG Budgets (US$ million) ............................................................... 43
Table 4.10: Centrally-Managed Accounts (US$ million) ........................................................................... 44
Table 4.11: FY18 and FY19 Functional Expense View of Administrative Expenses (US$ million) ......... 45
Table I.1: FY19 Funding for WB Work Program and Unit (US$ million) ................................................. 52
Table I.2: Overview of External Funds Projected Revenues FY19 by Unit (US$ million) ........................ 55
FIGURES
Figure 2.1: Growth in IBRD/IDA Supervision Portfolio (Pre-Capital Increase) .......................................... 9
Figure 2.2: Growth in IBRD/IDA Portfolio Volume vs. Administrative Budget (Percentage Growth from
FY14) .......................................................................................................................................................... 12
Figure 3.1: IBRD Budget Anchor ............................................................................................................... 16
Figure 3.2: IDA Budget Anchor ................................................................................................................. 16
Figure 3.3: Total Admin BB per Lending Project Approved (FY18US$ million) ..................................... 17
Figure 3.4: Total Admin BB per Project under Supervision (FY18US$ million) ...................................... 17
Figure 3.5: Total Admin BB per US$ Billion of Loans Approved (US$ million) ...................................... 17
Figure 3.6: Total Admin BB per US$ Billion Portfolio Under Supervision (US$ million)........................ 18
Figure 3.7: Share of External Funds to Total Funds ................................................................................... 19
Figure 4.1: Operational Share of Unit Budgets ........................................................................................... 24
Figure 4.2: Client Engagement Share of Operational Unit Budgets (including Country Engagement and
Global Engagement) ................................................................................................................................... 25
Figure 4.3: Evolution of the Country Engagement Bank Budget from FY18 to FY19 (US$ million) ....... 30

iii
Figure 4.4: Country Engagement Bank Budget Allocations by Business Process for FY17-19 (US$
million) ........................................................................................................................................................ 31
Figure 4.5: Country Engagement Bank Budget Allocation Shares by Business Process for FY17-19 ...... 32
Figure 4.6: CE Spending on Fiduciary and Safeguards for FY16-19 ......................................................... 33
Figure 4.7: FY19 Country Engagement Allocation Shares by Practice Group .......................................... 33
Figure 4.8: Country Engagement Bank Budget Allocations for FCV and FCV at Risk Countries for FY16-
19 (US$ million) ......................................................................................................................................... 34
Figure 4.9: Country Engagement Bank Budget Allocations to Small States for FY16-19 (US$ million) 35
Figure 4.10: FY19 Global Engagement by Practice Group and Category ................................................. 38
Figure 4.11: Full-time Bank Staff on Payroll (percentage growth since FY14) ........................................ 47
BOXES
Box 4.1: Administrative Budget Envelopes ................................................................................................ 26

iv

v
ACRONYMS
AFR Africa Region
AIP Annual Investment Plan
ASA Advisory Services and Analytics (former AAA - Analytical and Advisory Activities)
BB Bank Budget
BETF Bank Executed Trust Fund
BPS Budget, Performance Review, and Strategic Planning
CCAP Climate Change Action Plan
CE Country Engagement
CGIAR Consultative Group for International Agricultural Research
CMA Centrally Managed Accounts
CMU Country Monitoring Unit
COGAM Committee on Governance and Executive Directors' Administrative Matters
COMO Country Monitoring
CPF Country Partnership Framework
CPI Consumer Price Index
CRO Chief Risk Officer
DEC Development Economics
DGF Development Grant Facility
EAP East Asia and Pacific Region
ECA Europe and Central Asia Region
ECR External and Corporate Relations
EFO Externally Financed Output
E/L Equity to Loan Ratio
ESF Environment and Social Framework
ER Expenditure Review
FCV Fragility, Conflict and Violence
FIAS Facility for Investment Climate Advisory Services
GMF Grant-Making Facility
GP Global Practice
GPSA Global Partnership for Social Accountability
GT Global Themes
GSD General Services Department
HRD Human Resources Development
IBRD International Bank for Reconstruction and Development
IAD Internal Audit Department
IDA International Development Association
IDF Institutional Development Fund
IEG Independent Evaluation Group
IFC International Finance Corporation
IMF International Monetary Fund
IG&A Institutional, Governance, and Administrative Units
ITS Information Technology Solutions

vi
LCR Latin America and Caribbean Region
LEG Legal Department
LIC Low Income Countries
LLP Loan Loss Provision
MFD Maximizing Finance for Development
MIC Middle Income Countries
MIGA Multilateral Investment Guarantee Agency
MNA Middle East and North Africa Region
O&M Operations and Maintenance
OPCS Operations Policy and Country Services
PPM Program and Practice Management
PSW Private Sector Window
QBRR Quarterly Business and Risk Review
RAS Reimbursable Advisory Service
RAMP Reserves Advisory and Management Program
RETF Recipient Executed Trust Fund
SAR South Asia Region
SBO Strategy and Business Outlook
SDG Sustainable Development Goals
SEC Corporate Secretariat
SME Small and Medium Enterprises
SMI Salary Merit Increase
SPA Salary Progression Adjustment
SPF State and Peace-Building Fund
STC Short Term Consultant
TRE Treasury
UN United Nations
WB World Bank
WBG World Bank Group
WPA Work Program Agreement

1
OVERVIEW AND RECOMMENDATIONS
This document presents the FY19 World Bank Budget for Board approval. This budget proposal
reflects close consultations between Executive Directors and Management throughout the Strategic
Planning, Budgeting and Performance Management process for the World Bank Group.
1.1 OVERVIEW
1. The WBG has
developed a vision to
help translate the
ambitions of the 2030
Agenda into successes
for development.
The World Bank Group (WBG) is in the unique position to
combine knowledge and financing with global reach, and a strong
representation in the field to find solutions for today’s complex
development challenges. To continue to fulfill its role as a leading
development institution and help to translate the ambitions of the
2030 Agenda into successes for development, the WBG developed
a vision to become a stronger institution. This vision, articulated
in the Forward Look paper2 endorsed by Governors at the 2016
Annual Meetings, sets a transformational path for a “better” and
“stronger” WBG to help its members address today’s complex
development challenges and meet their rising demand for
innovative services.
2. Significant steps have
been taken toward the
Forward Look’s
objective of a “better”
and “stronger” World
Bank Group.
With the successful completion of the IDA-18 replenishment,
which includes the unprecedented transformation of IDA’s
financial model and historical capital market access, the capacity
of the WBG to support Low Income Countries (LICs), especially
countries facing fragility, conflict and violence and small states, has
been significantly strengthened. The recent landmark decision to
support the IBRD/IFC transformative package of capital measures
and integrated policy reforms will enable the WBG to better
support all clients, including new IDA graduates and blend
countries. The launch and roll-out of the Cascade Approach (an
approach to maximizing finance for development (MFD)) across
the WBG, supported by the IDA-18 IFC-MIGA Private Sector
Window (PSW), will leverage these resources by crowding-in
private sector investment to further scale up development finance.
The WBG is also breaking new ground promoting innovative
responses to issues where coordinated global action is critical. Key
areas include crisis management and fragility, conflict and
2 Forward Look – A Vision for the World Bank Group in 2030 (DC 2016-0008).

2
violence, climate change, gender, knowledge and convening, and
regional integration. Actions taken in these areas, in collaboration
with development partners and the private sector, support the
achievement of the SDGs.
Progress has been made in improving the WBG’s effectiveness and
operational model. The new Environmental and Social Framework
(ESF) is being rolled out to help improve the sustainability of
investments. Procurement reforms make it easier to implement
projects, while building the capacity of borrowers. Efforts are
underway through the “Agile” initiative to promote a culture of
continuous improvement and problem solving, and accelerate the
pace of project processing, ensuring that staff have more face time
with clients. Through the Administrative Simplification efforts,
Management is pursuing a range of reforms that include
simplifying expenditure approval processes, trust fund reform,
intranet modernization, implementing a shared services strategy,
HR process initiatives, and leveraging technology such as robotics.
Significant progress has also been made to strengthen the WBG
financial position, by (i) balance sheet optimization by lowering the
policy minimum for the Equity to Loans (E/L) ratio to reflect
improved portfolio credit quality, (ii) adoption of an income-based
formula approach for IBRD transfer to IDA-18, linking IDA
transfer to IBRD’s allocable net income level, (iii) implementation
of a new external funds cost recovery framework, and (iv)
establishment of budget anchors for IBRD and IDA. These were
supported by a series of expenditure and revenue measures,
including loan pricing increases, an ambitious Expenditure Review
which generated over US$300 million in Bank Budget (BB)
savings and an additional US$40 million of savings in Bank-
Executed Trust Funds (BETFs).

3
3. Business plans are
affected by a growing
portfolio, rising cost of
doing business and
offsetting savings from
efficiency measures.
Business plans are affected by cost pressures arising from a
growing portfolio and rising cost of doing business that will
continue to put pressure on Bank’s resources. At the same time,
Management plans several efficiency efforts that will help
strengthen lending capacity and fund new priorities – which will be
complemented by economies of scale as IBRD lending is scaled-
up. Strengthened revenues arising from pricing measures, a
constrained budget in an environment where the costs of doing
business are rising, and a willingness to implement further cost
reductions (after successful implementation of the Expenditure
Review program) demonstrate management commitment to the
institution’s financial sustainability and greater efficiency.
4. Despite rising costs,
Management is
proposing a FY19 Bank
administrative budget
of US$2,611 million
which will be flat in
real terms, and a
capital budget of
US$190 million for
FY19.
Considering strategic priorities but recognizing the need to
maintain budget discipline, Management is proposing a FY19
budget that is flat in real terms and that represents a 2.4 percent
nominal increase on the FY18 budget. Management is also
proposing a capital budget of US$190 million for FY19,
comprising US$105 million for Facilities investments and US$85
million for IT investments. Section 4 provides details underlying
the administrative budget proposal and further details on the capital
budget proposal are set out in Section 5.
5. As agreed with the
Board, Management
will draw on the
flexibility band to
support incremental
costs for implementing
the capital package in
FY19.
The recent decision of Shareholders to endorse the IBRD capital
package presents Management with an opportunity to engage with
clients on strengthening and recalibrating country programs, which
will have a budgetary impact. It also involves new policy
commitments, some of which will add to cost of doing business. It
is too early to determine the full budgetary implications of the
capital increase and Management therefore presents in this
document an administrative budget based on a pre-capital increase
scenario. As agreed with the Board, Management will draw on the
standard 2 percent flexibility band to support any incremental costs
for implementation of the capital package in FY19. If any
additional administrative budget funding is required in FY19 for
the IBRD scale-up above the 2 percent flexibility band,
Management will seek Board approval.

4
6. The FY19 budget aligns
with the WBG strategic
directions and
demonstrates
consistency with the
principles of financial
sustainability and
efficiency.
Management has built its budget plans ensuring strategic alignment
with the priorities agreed in the Forward Look and confirmed
during the planning and budgeting process. Key priorities over the
next few years include remaining engaged with all client groups;
working in partnership with the IFC and MIGA to mainstream the
MFD approach into operational work; strengthening global
leadership and impact in a range of areas, notably in climate
change, fragility, gender, human capital, and technological change;
and strengthening our business model.
The FY19 budget will support financial sustainability with a budget
that allows the Bank to maintain the discipline of budget anchors
in FY19 with administrative expenses that are held within target
zones below revenues from operations. It is important that we
adequately fund operational delivery and supervision, supported by
strong analytics and institutional, governance and administrative
services. At the same time, every dollar the World Bank does not
spend is a dollar it can leverage to support development financing
for its clients.
Building on the gains of the Expenditure Review successfully
completed in FY18, Management has identified opportunities for
further efficiencies over the coming years in areas including
corporate procurement, project portfolio management, workforce
management, travel and real estate. In addition, as part of the
rolling Business Reviews of VPUs, Management plans to complete
reviews of IG&A units and start reviews of operational units.
1.2 FY19 BUDGET RECOMMENDATIONS
7. Management seeks
Board approval of the
FY19 Budget.
Management seeks Board approval of the following FY19 Budget
recommendations:
• That the total administrative budget (Bank Budget) be set at
US$2,611 million, managed within a range of +/- 2 percent.
This includes:
o An indicative budget of US$87.4 million for Executive
Directors. This is subject to a separate endorsement
process by COGAM.

5
o US$29.7 million for the Independent Evaluation Group.
This is subject to a separate endorsement process by
CODE.
• That the capital budget be set at US$190 million.

6
STRATEGIC DIRECTIONS AND BUSINESS OUTLOOK
This section outlines the strategic context and business outlook for FY19 and reviews the cost
pressures arising from increasing cost of doing business as well as the efficiency efforts and
compensation reform necessary to offset additional costs. Together with section 1, it sets the stage
for the FY19 budget, which is detailed in sections 3-5.
2.1 STRATEGIC CONTEXT
8. Management has
identified key focus
areas for the FY19
planning and
budgeting process to
align resources with
the Forward Look
vision.
Ending extreme poverty and boosting shared prosperity by 2030
requires that the WBG scale up efforts to deliver on the ambitious
Forward Look vision. Four strategic focus areas have informed the
FY19 planning and budgeting process for the World Bank,
consistent with the Forward Look vision:
• serving all clients;
• creating markets;
• leading on global issues; and
• continually improving the business model.
Across these areas, Management aims to foster greater partnership
across the World Bank Group to enhance complementarities and
leverage synergies for greater development impact. Achievement
of the twin goals will require the Bank to scale up progress made
across several fronts.
9. Serving all clients:
The recent
endorsement by
Shareholders of the
capital package will
build on the IDA-18
replenishment and
enable the Bank to
expand its services
across all client
groups.
IDA-18 has enabled the Bank to expand its services for low income
countries, double assistance to countries affected by fragility,
conflict and violence, triple assistance to small states, as well as
expand IFC and MIGA services in these countries through the
Private Sector Window (PSW). IDA-18 implementation got off to
a robust start with strong delivery. Sustaining this trend is a key
priority for FY19.
The recently endorsed IBRD/IFC capital package will enable the
WBG to channel more resources to countries at the lower to middle
range of the client income spectrum – many of which are recent
IDA graduates and host large populations of extremely poor people
– while at the same time continuing to engage with all clients across
the income spectrum. In addition, through capital strengthening
measures at the IFC, the package will also strengthen WBG support
to FCV countries and small states. The nature of engagements will

7
be adapted to specific development needs in all countries and
interventions coordinated across WBG institutions to leverage each
other and maximize WBG impact.
10. Creating markets:
WBG entities are
working in partnership
to “Maximize
Financing for
Development.”
A strong focus on “Maximizing Finance for Development” (MFD),
by crowding-in available private finance, is crucial to go from the
billions to the trillions needed to achieve the ambitions of the 2030
Agenda and the Twin Goals. The Bank, IFC and MIGA have
worked in close partnership to develop and implement the MFD
approach, including in the most challenging development contexts.
Going forward, the focus will be on scaling up this approach,
through firmly anchoring MFD in Country Partnership
Frameworks, joint implementation plans and deep dives at the
regional level, strengthening of internal processes such as
incentives, training and advisory, analytical and financial tools for
clients to operationalize the MFD effectively.
11. Leading on global
issues: The Bank
continues to enhance
its engagement and
focus on issues that
transcend national
boundaries.
The Bank is uniquely positioned to lead on global issues given its
global footprint and ability to adapt to a changing development
landscape, invest in knowledge products and adopt innovative
financing mechanisms. The focus will be on the following strategic
priorities in support of the SDGs: (1) employ a range of innovative
financing solutions and analytical capacities to address crisis risks
and enhance crisis response capacity; (2) scale up efforts to tackle
the climate agenda through policy advice, global advocacy and
lending/investment operations; (3) step up financing to help close
gender gaps; (4) increase the WBG knowledge and convening role
to support the design and sharing of development solutions for
greater impact; (5) continue support to help strengthen regional
cooperation and the needed connective and institutional
infrastructure; (6) improve access to technology and related
innovative solutions as well as responding effectively to the jobs
challenges that these innovations will present; and (7) develop a
new human capital index to inform policy and investment
decisions. In pursuing these priorities, the Bank will support South-
South cooperation so that development experiences can be readily
transferred and scaled up in other countries/regions.

8
12. Improving the
business model: The
Bank will continue to
improve its
effectiveness by
promoting operational
agility and
administrative
simplification,
enhancing its financial
sustainability, and by
implementing the new
Procurement and
Environmental and
Social Frameworks.
The Bank’s ability to respond to growing demand across all client
segments and to increased development ambitions calls for
continuous innovation, operational flexibility and agility. Through
the Agile Bank program, a community of staff has been put in place
to promote a culture of continuous improvement and problem
solving. Efforts are also ongoing to speed up implementation of the
Administrative Simplification program through a range of
initiatives, including simplifying expenditure approval processes,
trust fund reform, intranet modernization, implementing a shared
services strategy, HR process initiatives, and leveraging
technology such as robotics. As part of the capital package, a new
financial sustainability framework will be implemented to ensure
that IBRD’s lending trajectory is aligned with long-term
sustainable financial capacity and incorporates a crisis response
buffer. These achievements are being complemented by the roll-
out of the new Procurement and the Environmental and Social
Frameworks which will ensure that Bank-financed projects are
delivered to the highest standards. The new Procurement
Framework was introduced last year. The new Environmental and
Social Framework (ESF) will become operational in FY19.
2.2 LENDING OUTLOOK
13. The IBRD capital
package endorsed at
the Spring Meetings
has altered the lending
outlook.
At the Spring Meetings, the World Bank Group’s shareholders
endorsed an ambitious package of measures that include both
internal measures and a US$13 billion paid-in capital increase for
the World Bank Group, alongside a series of internal reforms, and
a set of policy measures that greatly strengthen the WBG’s ability
to deliver on its mission. For IBRD, the paid-in capital increase
will be US$7.5 billion.

9
14. The FY19 proposed
budget assumes IBRD
lending to decline, in
line with the pre-
capital increase
scenario.
Based on the pre-capital increase scenario, IBRD lending is
assumed to decline from US$24 billion in FY18 to US$22 billion
in FY19. However, following the approval of the capital increase,
this would increase to US$25 billion in FY19. IDA lending is
assumed to be US$25 billion (see Table 2.1).
Table 2.1: Growth in IBRD/IDA Lending Portfolio
15. The IBRD/IDA
portfolio under
supervision is
projected to grow
substantially – even in
the pre-capital
increase scenario.
In the pre-capital increase scenario, the IBRD/IDA portfolio under
supervision is projected to grow by a further 3 percent, from
US$213 billion in FY17 to US$220 billion in FY19; and, more
significantly, by 9 percent from 1,460 operations in FY17 to 1,589
in FY19 (see Figure 2.1). This reflects long term portfolio
dynamics (timing of exits versus entries to the stock of projects
under supervision, in particular the IDA-18 scale up) and an
increase in the number of small projects due to our enhanced focus
on FCV countries and small states. In the higher lending scenario,
post capital increase, portfolio growth would increase further.
Figure 2.1: Growth in IBRD/IDA Supervision Portfolio (Pre-Capital Increase)
FY17 FY18 FY19
Actual Projection Projection
IBRD Pre-Capital Increase 22.6 24.0 22.0
IBRD Post Capital Increase 22.6 24.0 25.0
IDA1 19.5 25.0 25.0
IBRD and IDA Pre-Capital Increase 42.1 49.0 47.0IBRD and IDA Post-Capital Increase 42.1 49.0 50.0
IBRD and IDA post Capital Increase 42.1 49.0 50.0Notes:1The IDA FY19 US$25 billion lending projection is subject to some exchange rate
volatility, and includes the Crisis Response Window and Private Sector Window.
$169 $183
$192 $207 $213
$221 $220
1,3371,386 1,402 1,398
1,460
1,519
1,589
1,200
1,300
1,400
1,500
1,600
1,700
1,800
$-
$50
$100
$150
$200
$250
FY13 FY14 FY15 FY16 FY17 FY18P FY19P
IBRD/IDA Net Commitment (US$ billion) No. of IBRD/IDA Projects
Net
Co
mm
itm
ent
Vo
lum
e
(US$
bill
ion
)
No
. of P
rojects

10
2.3 COST OF DOING BUSINESS
16. The World Bank is
asked to expand its
activity in ways which
increase the cost of
doing business.
The planning and budgeting process has been informed by a Cost
of Doing Business analysis that examined the cost dynamics of the
Bank’s activities. The analysis shows that above average efforts
and costs are incurred in several areas and countries. This is
expected to lead to overall higher costs as the Bank’s mix of
business increases in these areas and countries.
17. The Bank is
significantly
expanding its services
to countries where the
cost of doing business
is higher.
The Cost of Doing Business analysis shows that lending operations
tend to be more expensive to deliver in low and lower-middle
income countries including fragile, more challenging, and smaller
countries. The growth in the number of lending operations to these
countries is outpacing that of upper-middle income countries. This
trend is expected to continue as per the strategic directions
discussed in sections 2.1 and 2.2. Furthermore, as the Bank
expands its footprint into more complex and riskier environments,
cost pressures are also rising. Ramping up the work in FCV
locations has significant cost implications. Increasing our global
footprint also requires increased resources, mainly due to related
assignment benefits for staff decentralized to the field, and rising
facilities and IT resource needs.
18. The Bank’s business
mix is shifting to more
complex and riskier
operations which are
also costlier to
prepare.
The Bank’s business mix is also shifting towards more complex
and riskier lending operations, which the Cost of Doing Business
analysis has shown to be costlier to prepare and supervise. Demand
from clients for projects for sustainable development (mainly
infrastructure) is also increasing, and these projects are also costlier
to prepare. The Bank is increasingly being asked to finance projects
in riskier and more complex environments.
19. Fiduciary and
safeguard budget
allocations have
increased in recent
years and are expected
to grow further with
implementation of the
new frameworks.
The new Environmental and Social Framework (ESF) expands the
scope of related safeguards by including new topical areas,
engaging borrowers more than before, and introducing expanded
processes, instruments, and systems. To support the roll-out, new
guidance and procedures are being developed, training of staff and
familiarization of borrowers are being implemented, and an
enhanced helpdesk and support infrastructure are being put in
place. Implementation of the new Procurement Framework is
ongoing with several supporting activities being implemented.

11
20. The finance units face
additional
responsibilities to
address the increased
complexity of the
hybrid IDA-18
financial model.
The introduction of market leverage of the IDA balance sheet, with
successful bond issuance at capital markets this spring and
corresponding changes to the IDA financial risk framework such
as the asset-liability management framework and liquidity policy,
has resulted in additional responsibilities for the Bank’s finance
units. Additional requirements have also been introduced because
of the increased number and complexity of IDA financing
instruments.3 The introduction of the IBRD financial sustainability
framework will further add new responsibilities for the finance
units.
2.4 EFFICIENCY
21. The Bank has a track
record of strong
budget management
over the past years.
Through a period of budget transformation, Management has been
able to deliver significantly more in an environment of rising costs
and with a flat nominal budget. In addition to meeting the
Expenditure Review (ER) targets, the Bank has significantly
improved strategic planning, performance monitoring and
budgeting through a coordinated WBG process. It has strengthened
resource management systems, reports and accountabilities. The
FY18 budget is expected to close within the flexibility band and
with no major structural imbalances by business area. More
importantly, we have moved to a culture where Management and
staff seek to systematically align resources with WBG priorities in
a way that is sustainable and delivers value for money.
Because of its strong commitment to efficiency measures,
Management has been able to keep the budget at a flat nominal
level for the past five years, despite IBRD and IDA operations
growing by some 21 percent since FY14 (see Figure 2.2).
3 The Private Sector Window and the IDA Scale-up Facility have been established to provide increased non-concessional financing
for transformational projects, and transitional support for IDA graduates.

12
Figure 2.2: Growth in IBRD/IDA Portfolio Volume vs. Administrative Budget
(Percentage Growth from FY14)
22. The Bank achieved
US$340 million of
sustainable savings
through the
Expenditure Review.
As part of the WBG approach to foster a culture of efficiency
through the US$400 million Group-wide Expenditure Review
program, the Bank realized savings of about US$340 million
(US$300 million clawed-back from Bank Budget and US$40
million benefiting External Funds) by FY18 against the agreed
“Everything Else Being Equal” budget. Sustainable efficiency
gains have been achieved mainly in areas related to organizational
changes, travel, workforce, technology, and facilities – an effort
which was made more challenging as changes in our business
model increased the costs of doing business.
23. Management has
continued the rolling
program of Business
Reviews to identify
opportunities for
greater efficiency and
strategic alignment.
Business Reviews have identified significant savings. Examples to
date include the following:
• Efficiencies in the operating model: A US$20 million
reduction in annual IT capital investment in FY18 (compared
to the previous four-year average) will help contain
depreciation costs over the coming years. Additionally,
reforms to ITS operations and maintenance management
resulted in a budget reduction of US$10 million that would
have otherwise increased ITS’s budget from FY19.
• Lean services and staffing: DEC, LEG and ECR tightened staff
complement with exit programs targeted at higher level staff
while maintaining focus on supporting the front line. ECR has
also focused its efforts on delivering core services, eliminating
its publishing and knowledge unit.

13
• Organizational realignment: HRD off-shored more work to
Chennai. Communications staff from other parts of the World
Bank have been remapped to ECR which will enable it to
achieve synergies and efficiencies.
24. Management is
continuing its drive for
efficiencies and
productivity
improvement.
In addition to operational agility and administrative simplification
initiatives and Business Reviews cited in Section 2.1 and paragraph
23, Management has identified specific efficiencies resulting from
productivity improvements, savings and cost avoidance for the
planning horizon in consultation with the Board. Some of these
measures are being pursued in coordination with IFC and MIGA as
was done during the Expenditure Review. They include the
following:
• Corporate procurement: Management is enhancing efforts to
achieve savings and cost avoidance in the
procurement/negotiation of corporate contracts by better
benchmarking, targeting and tracking of savings at the contract
level, by clawing-back savings achieved from unit budgets, and
by introducing more transparent pricing/more economical
standards for goods and services through the introduction of
service catalogues.
• Workforce structure and compensation: Changes in staff
compensation methodology will result in downward budget
adjustments. Other workforce measures being planned include
controlling numbers and optimizing grade mix through a
combination of workforce planning, natural attrition, and
enhance performance management.
• Project portfolio management: Efforts will be made to further
strengthen portfolio management and enhance consolidation of
new operations in the pipeline to reduce fragmentation
whenever feasible.
• Travel expenditures: Savings will be sought through tighter
oversight of travel policy exceptions; roll-out of a mandatory
global travel credit card to travelling staff; use of an external
vendor to negotiate better hotel rates; rebidding the HQ travel
agency contract; and tighter control over number of Bank
participants in global events and conferences.

14
• Real estate expenditures: Key HQ efficiency measures planned
include more efficient space standards; creation of in-house
conference space to accommodate large meetings currently
held externally; and reduction of leased footprint. In country
offices, we are exploring options to purchase rather than lease,
where feasible and economical; to increase space sharing with
IFC; to consolidate country office facilities depreciation; as
well as additional measures to optimize the use of office space
around the world.
• Other measures: Management intends to reduce discretionary
spending on food services. It is also looking at opportunities to
rationalize use of external contractors – particularly in IT.
Finally, it will continue to implement recommendations
identified through the Business Reviews.

15
FY19 EXPENDITURE FRAMEWORK
This section sets out the aggregate funding budget (Bank Budget and External Funds) for World Bank
expenditures and demonstrates the budget’s consistency with the principles of financial sustainability
and efficiency.
3.1 AGGREGATE BANK BUDGET
25. In line with
the Bank’s
current
financial
position and
funding
availability,
Management
proposes a
FY19 budget
which would
be flat in real
terms.
Consistent with the need to maintain budget discipline and considering (i)
strategic priorities, (ii) increasing costs of doing business, and (iii) savings
that would derive from efficiencies and the impact of the revised
compensation methodology, Management proposes a FY19 budget which
would be flat in real terms. More specifically, Management is proposing to
limit the increase of the budget for FY19 to 2.4 percent. This represents a
zero increase in real terms, and a budget below the one in FY14 in real terms.
(See Table 3.1 and Figure 2.2.)
As agreed with the Board, Management will draw on the standard 2 percent
flexibility band to fund any incremental cost of implementation of the capital
package in FY19. If any additional budget funding is required in FY19 for
the IBRD scale-up above the 2 percent flexibility band, Management will
seek Board approval.
Table 3.1: Bank Budget (US$ million)
FY18 FY19
Current Trajectory (FY18-FY19 as per FY18 WB Budget Document) 2,550 2,632
Revision to Trajectory (21)
Revised Trajectory 2,550 2,611
IBRD Anchor 88% 80%
Available for IBRD net income retention/transfer 150 294
IDA Anchor 104% 91%
Available for other uses of IDA income - 147

16
26. The proposed
FY19 budget
will maintain
budget
sustainability
and contribute
to the Bank’s
financial
strengthening.
Based on a pre-capital increase scenario, the IBRD anchor (the ratio of IBRD
expenses over IBRD loan spread revenue) under the planned budget is
projected to decline from 107 percent in FY17 to below 100 percent in FY18
and FY19 —thus strengthening financial capacity.
IDA’s budget anchor (the ratio of IDA expenses over IDA net revenue) is
estimated to be around 104 percent in FY18, falling below 100 percent in
FY19.
Figure 3.1: IBRD Budget Anchor
Figure 3.2: IDA Budget Anchor
27. In developing
the FY19
budget,
Management
sought to
maintain
aggregate
budget
efficiency.
As illustrated in Figures 3.3-3.6, comparing the FY19 budget envelope with
the expected commitments and the size of the portfolio demonstrates the
Bank’s continued aggregate efficiency despite the growing volume and
scope of our work. Annex II provides a detailed breakdown of these
indicators for IBRD and IDA respectively.
• The ratio of administrative budget to number of projects approved is
expected to remain flat. On the other hand, the Administrative Budget
per US$ billions of loans approved has been heavily influenced by two
factors. Firstly, this indicator has shown a declining trend as lending
176%189%
158%160%
155%147% 148%
135%
107%
88%80%
0
200
400
600
800
1,000
1,200
1,400
1,600
FY09 FY10 FY11 FY12 FY13 FY14 FY15 FY16 FY17 FY18 FY19
0%
40%
80%
120%
160%
200%
Exp
en
ses/
Re
ven
ues
US$
mill
ion
Bu
dge
t A
nch
or
%
IBRD Loan Spread Revenue IBRD-funded Expenses IBRD Budget Anchor
90% 93%98% 96% 98%
102% 100%94%
97%104%
91%
0
200
400
600
800
1,000
1,200
1,400
1,600
1,800
FY09 FY10 FY11 FY12 FY13 FY14 FY15 FY16 FY17 FY18 FY19
0%
20%
40%
60%
80%
100%
120%
Exp
en
ses/
Re
ven
ue
US$
mill
ion
Bu
dge
t A
nch
or
%
IDA Revenue IDA-funded Expenses IDA Budget Anchor

17
volumes have surged (FY08-FY10) and as a result of cost efficiency
drives (FY13-16). Over the FY18-19 period, the increase in the dollar
based indicator is attributable to rising costs of doing business, as well as
a decline in IBRD lending under the pre-capital increase scenario.
• The ratio of administrative budget to number of projects supervised is
expected to slightly improve. However, the total administrative budget
per US$ billions of portfolio under supervision rises only slightly in
FY18-19, reflecting the combination of growing and more challenging
portfolio and budget restraint.
Figure 3.3: Total Admin BB per Lending Project Approved (FY18US$ million)
Figure 3.4: Total Admin BB per Project under Supervision (FY18US$ million)
Figure 3.5: Total Admin BB per US$ Billion of Loans Approved (US$ million)
1.4 1.6
1.7 1.7 1.6 1.6 1.6 1.6 1.5 1.6 1.7 1.7 1.6 1.6
1.5 1.7 1.6
-
0.5
1.0
1.5
2.0
2.5
3.0
FY03 FY04 FY05 FY06 FY07 FY08 FY09 FY10 FY11 FY12 FY13 FY14 FY15 FY16 FY17 FY18(P) FY19(P)
IBRD+IDA
88 92 90 88
83 85
46 39
53
67
79
62 59 54
59 53 57
-
20
40
60
80
100
120
FY03 FY04 FY05 FY06 FY07 FY08 FY09 FY10 FY11 FY12 FY13 FY14 FY15 FY16 FY17 FY18(P) FY19(P)
IBRD+IDA
10 11
10 10 9 9 9
8 7
11 10
8 9 9
7 7 7
-
2
4
6
8
10
12
14
16
FY03 FY04 FY05 FY06 FY07 FY08 FY09 FY10 FY11 FY12 FY13 FY14 FY15 FY16 FY17 FY18(P) FY19(P)
IBRD+IDA

18
Figure 3.6: Total Admin BB per US$ Billion Portfolio Under Supervision (US$ million)
3.2 EXTERNAL FUNDS OUTLOOK
28. External Funds have
grown significantly as
a source of funds in
recent years but this
share is expected to
stabilize.
Most of the Bank Executed Trust Funds (BETFs) that will be drawn
on during FY19 have already been paid in. Cash contributions to
trust funds have slowed during FY16-18 and, as a result, the
double-digit BETF growth of the last few years is not expected to
continue and growth in FY19 (compared to FY18 projections) is
expected to be around 4 percent.
Reimbursable Advisory Services (RAS) is a key element of ASA,
with revenues of US$89 million in FY17 expected to reach about
US$115 million by FY19. A revised set of directives and guidelines
will be issued to equip the Bank with a more flexible and
responsive operational framework for RAS.
29. By FY19, Management
will complete
implementation of a
program of measures
to ensure that Trust
Fund cost recovery
arrangements better
reflect the actual cost
of administering these
funds.
Arising from concerns that a significant share of the costs of
administering external funds were being borne by the
administrative budget, the Board approved the Trust Fund (TF)
cost recovery framework in FY15 which included several measures
totaling US$100 million designed to redress this imbalance. The
new framework became operational on July 1, 2015. All new trust
funds are established under the new cost recovery framework.
Further steps were taken in FY18 by adjusting the benefit recovery
rate on HQ-appointed staff from 50 percent, the previous rate,
which had resulted in an under recovery of actual costs that had to
be borne instead by the Bank budget, to the actual 70 percent rate.
In addition, a 45 percent rate for Country Office-appointed staff
was introduced in FY18 but will be applied to external funds from
FY19.
17.4
20.1 21.6 22.4
21.0 20.2
16.6 14.8
13.8 14.2 14.7 13.9 13.1
11.9 11.7 11.6 12.0
-
5.0
10.0
15.0
20.0
25.0
30.0
FY03 FY04 FY05 FY06 FY07 FY08 FY09 FY10 FY11 FY12 FY13 FY14 FY15 FY16 FY17 FY18(P) FY19(P)
IBRD+IDA

19
Progress continues in aligning external funds with strategic
priorities. Forecasting of external funds usage is being improved
through their earlier integration into work programming
agreements and the roll out of new budget planning and reporting
systems.
30. External Funds share
of total administrative
spending plans is
expected to remain
flat.
Under the base case scenario, External Funds as a share of total
administrative spending plans are currently forecast to stabilize at
around 38 percent (see Figure 3.7).
Figure 3.7: Share of External Funds to Total Funds
3.3 AGGREGATE BANK BUDGET AND EXTERNAL FUNDS
31. An aggregate resource
envelope for FY19 has
emerged from the
discussion on the
strategic framework
and the External
Funds outlook.
Resources for both the Bank Budget (BB) and “All Funds”
(including BETFs, RASs and EFOs) show a growth of 3.5 percent
in FY19.
Table 3.2: FY19 Bank Budget and External Funds (US$ million)
27.3%
29.1%
30.5%31.0%
32.8%33.8%
35.4% 35.8%
38.2%
20%
25%
30%
35%
40%
F Y 10 F Y 11 F Y 12 F Y 13 F Y 14 F Y 15 F Y 16 F Y 17 F Y 18 F Y 19
37.0%
FY18
WB Budget
FY18
ProjectionFY19
Bank Budget Trajectory 2,550 2,550 2,611
External Funds Projections 1,496 1,535 1,616
Total All Funds 4,046 4,085 4,226
* Totals have been rounded to the nearest whole number.

20
FY19 BUDGET
This section presents specific details of the FY19 administrative budget proposal and indicates how
resources are allocated between main budget categories, demonstrating how this aligns with the
WBG strategic directions. It provides details on allocations for operational programs, IG&A units,
other non-unit specific budgets, as well as an estimated expense line view.
4.1 ADMINISTRATIVE BUDGET PROPOSAL
32. Management is
proposing a Bank
Budget of US$2,611
million for FY19, as
part of a broader total
funds estimate of
US$4,226 million.
The proposed Budget for FY19 is US$2,611 million as set out in
Table 4.1 below. The proposed budget, based on the “no capital
increase” scenario, limits the increase over FY18 to 2.4 percent,
which is in line with inflation. The “All Funds” FY19 envelope is
expected to be around US$4,226 million (see Table 3.2).
As agreed with the Board, Management will draw on the standard
2 percent flexibility band to fund any incremental cost of
implementation of the capital package in FY19. If any additional
budget funding is required in FY19 for the IBRD scale-up above
the 2 percent flexibility band, Management will seek Board
approval.
Table 4.1: FY19 WB Budget (US$ million)
FY18 FY19
Proposed FY18-19 Budget Trajectory (Nominal) 2,550 2,611
% Change YOY 2.4%
Proposed FY18-19 Budget Trajectory (in FY18$) 2,550 2,547
% Change YOY -0.1%

21
4.2 ADJUSTMENTS TO THE BUDGET
33. Adjustments to the
budget were needed to
address rising cost of
doing business with
offsetting adjustments
resulting from
efficiency measures
and productivity gains.
Adjustments impacting the budget presented in the FY18 Budget
Document come from (1) selected incremental additions to unit
budget trajectories associated with rising business volumes and
rising cost of doing business; and (2) new claw-backs from unit
budget trajectories resulting from efficiency measures and the
impact of the revised compensation methodology. It should be
noted that incremental additions to the budget reflect only a small
part of the cost of doing business – some of the rising costs were
already included in the budget presented in the FY18 Budget
Document; other costs are being absorbed through efficiency
measures, internal redeployments or trade-offs within/across VPUs,
or minimized through cost avoidance and productivity measures. It
should also be noted that new claw-backs more than offset the
incremental additions to result in the flat real budget; and that these
claw-backs are in addition to budget claw-backs to FY19 made in
previous budget cycles.
During the planning process, Management considered options for
funding incremental requests through three mechanisms: (1)
internal reallocations and trade-offs; (2) efficiency measures and
productivity gains; and (3) prioritization of incremental funding as
per the strategic priorities discussed in Section 2. VPUs were asked
to present options for trade-offs and reductions in administrative
budget spend. In addition, savings from efficiency measures and
adjustments resulting from the revised compensation methodology
were reflected in each VPU budget.
34. Incremental funding
additions to unit
budget trajectories
have been prioritized
for FY19, with strong
emphasis on client-
facing operational
priorities, reflecting
increased business
volumes and to ease
selective rising costs of
doing business.
The following funding additions to unit budget trajectories have
been identified:
• Supervising an expanding portfolio with more complex and
risky projects, including enhanced supervision in FCV
countries and small states.
• Sustaining engagement with all clients with an appropriate
level of analytical and advisory services at the country level.
• Rolling out the new Environmental and Social Framework and
implementing the Gender-Based Violence Action Plan.

22
• Performing additional responsibilities to address the increased
complexity of the hybrid IDA-18 financial model and risk
management measures, and reinvestment for efficiencies.
• Addressing a range of cost pressures that are building up across
the institution that cannot be offset by redeployments.
Table 4.2: Incremental Additions to the Budget (US$ million)
As usual, a central contingency (US$10 million) will also be
available to add to unit trajectories during FY19 for unforeseen
priorities and cost pressures.
35. Unit budget
trajectories were then
adjusted to reflect
efficiency measures
and associated claw-
backs.
Management has identified claw-backs for efficiency measures that
more than exceed these cost pressures, with additional savings
identified which have resulted in reduction in growth spending
levels to flat real. Claw-backs include:
• Reductions to budget predicated on declining IBRD lending in
the “pre-capital increase” scenario.4
• Reductions to budget to off-set subsidies previously paid to
World Bank VPUs in lieu of full cost recovery of World Bank
staff benefits for staff time spent providing shared services to
IFC (IFC has agreed to cost Shared Service Agreements at the
full benefit rates effective FY19).
• Adjustments to the budget for Executive Directors in line with
the recent endorsement by COGAM.
• Reduction in the budget of the Board of Governors.
4 They are predicated on a reduction of IBRD lending from US$24 billion in FY18 to the “pre-capital increase” projections of US$22
billion in FY19.
FY19
Supervising an expanding portfolio, including in FCV and
small states
2
Sustaining Client engagement, including through ASA 5
Gender Based Violence Action Plan and additional
funding for the Environmental and Social Framework
17
Increased complexity of IDA 18 financial model, risk
management and reinvestment for efficiencies
6
Depreciation -
Other cost pressures 1
Total Incremental Additions 31

23
Reductions to budget resulting from: (i) impact of the revised
compensation methodology – this is applied across units using a
restated price factor; and (ii) savings from efficiency measures,
including efficiencies in corporate procurement, workforce
structure and other measures.
Table 4.3. Claw-backs from Budget (US$ million)
4.3 STRATEGIC ALIGNMENT BY WORK PROGRAM
36. The FY19 budget
distribution
demonstrates
increased strategic
alignment of
resources with front-
line operational
delivery.
Table 4.4 presents the FY19 budget distribution by main programs
and funding sources. In line with Management’s commitment to
the Board, the share of Bank Budget (BB) resources to Operations
and front-line services will increase from 55 percent in FY16 to 59
percent in FY19. The share of Operations in the “All Funds” unit
budget is projected to increase from 60 percent in FY16 to around
two-thirds of unit trajectories in FY19.
Table 4.4: FY18-19 Budget by Work Program & Funding Source (US$ million)
FY19
Savings due to lower IBRD lending volumes 3
IFC – MIGA full Benefit recovery from SLAs 8
Savings from Board of Governors Budget 1
Savings from Executive Directors Budget 2
Reductions from Compensation Review 12
Efficiency savings 25
Reductions/Clawbacks from Unit Trajectories 52
FY18 1 FY19 FY18 FY19
TOTAL OPERATIONAL UNITS (Excl GMF) 1,494 1,566 2,509 2,678
Client Engagement 820 871 1,745 1,888
Country Engagement 732 781 1,460 1,578
Global Engagement 88 90 285 310
Program & Practice Management 674 695 764 790
Grant Making Facilities 35 35 35 35
TOTAL OPERATIONS 1,529 1,601 2,544 2,713
IG&A PROGRAMS 1,086 1,084 1,402 1,410
Institutional Services 404 412 595 614
Governance Services 219 216 236 234
Administrative Services 463 456 571 562
TOTAL: ALL UNITS 2,614 2,685 3,945 4,123
CENTRALLY MANAGED ACCOUNTS 100 103 101 103
o/w Corporate Contingency 10 10 10 10
TOTAL TRAJECTORY 2,714 2,788 4,046 4,226
o/w Funded by External Funds (164) (177) (1,496) (1,616)
Net Trajectory Funded by IBRD/IDA 2,550 2,611 2,550 2,611
INDICATIVE BUDGET TRAJECTORIESBANK BUDGET ALL FUNDS

24
Table 4.5: 18-19 Budget Share by Work Program and Funding Source
In addition, a greater share of these resources will be allocated to Client
Engagement. The current program shows an increase of the share of BB
Client Engagement (Country Engagement plus Global Engagement) in
operational unit trajectories from 53.7 percent in FY16 to 55.6 percent
in FY19. The Client Engagement share on an “All Funds” basis is
projected to rise from 67.4 percent in FY16 to 70.5 percent in FY19.
Figure 4.1: Operational Share of Unit Budgets
FY18 FY19 FY18 FY19
Total Operational Units 57.9% 59.1% 64.2% 65.5%
Client Engagement 31.8% 32.9% 44.6% 46.2%
Country Engagement 28.4% 29.5% 37.3% 38.6%
Global Engagement 3.4% 3.4% 7.3% 7.6%
Program & Practice Management 26.1% 26.2% 19.5% 19.3%
IG&A Programs 42.1% 40.9% 35.8% 34.5%
Institutional Services 15.7% 15.5% 15.2% 15.0%
Governance Services 8.5% 8.2% 6.0% 5.7%
Administrative Services 17.9% 17.2% 14.6% 13.8%
TOTAL: ALL UNITS (excl. GMFs) 100% 100% 100% 100%
Share of Budget TrajectoryBB ALL FUNDS
54.9%
56.8%57.9%
59.1%60.4%
62.8%64.2%
65.5%
52.0%
54.0%
56.0%
58.0%
60.0%
62.0%
64.0%
66.0%
68.0%
FY16 FY17 FY18 FY19
BB All Funds
Note: FY16-18 BB restated to reflect the new arrangements for RAMP and other asset management services
(original BB operational share of unit budgets were: 54.3%, 56.2%, and 57.2% for FY16, FY17, and FY18,
respectively).

25
Figure 4.2: Client Engagement Share of Operational Unit Budgets (including Country
Engagement and Global Engagement)
53.7% 54.1%54.9% 55.6%
67.4% 67.7%69.6%
70.5%
52.0%
57.0%
62.0%
67.0%
72.0%
FY16 FY17 FY18 FY19
BB All Funds
26
Box 4.1: Administrative Budget Envelopes
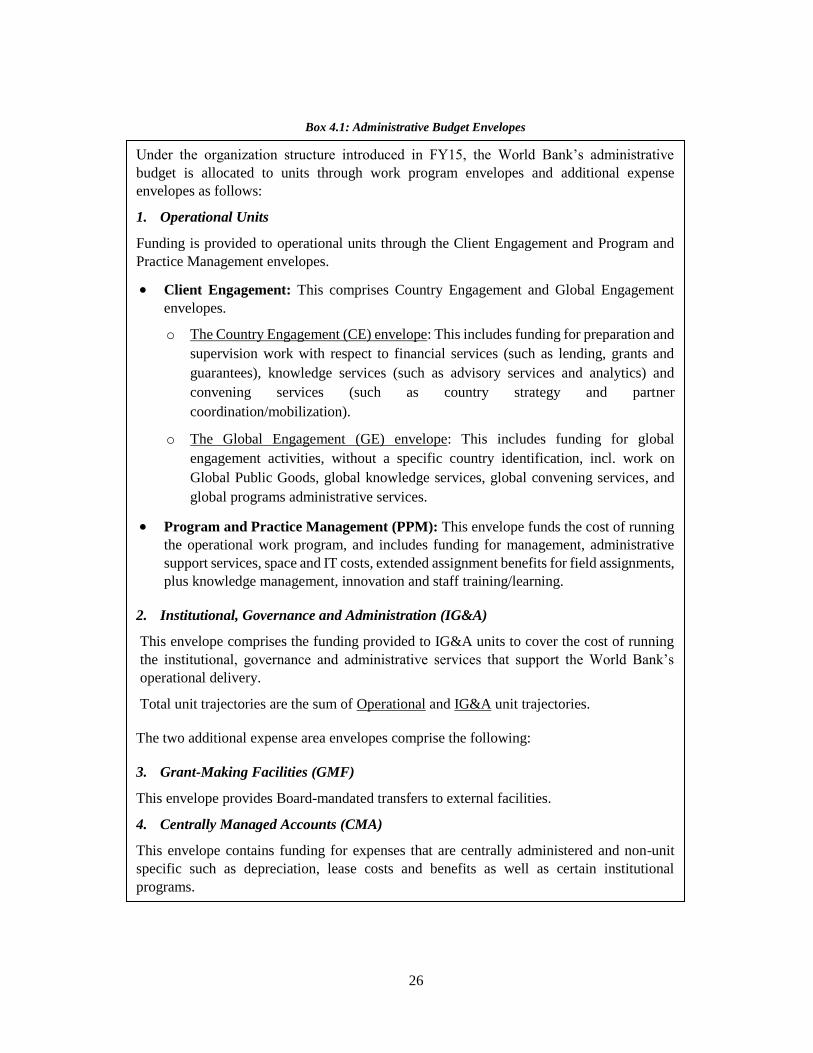
Under the organization structure introduced in FY15, the World Bank’s administrative
budget is allocated to units through work program envelopes and additional expense
envelopes as follows:
1. Operational Units
Funding is provided to operational units through the Client Engagement and Program and
Practice Management envelopes.
• Client Engagement: This comprises Country Engagement and Global Engagement
envelopes.
o The Country Engagement (CE) envelope: This includes funding for preparation and
supervision work with respect to financial services (such as lending, grants and
guarantees), knowledge services (such as advisory services and analytics) and
convening services (such as country strategy and partner
coordination/mobilization).
o The Global Engagement (GE) envelope: This includes funding for global
engagement activities, without a specific country identification, incl. work on
Global Public Goods, global knowledge services, global convening services, and
global programs administrative services.
• Program and Practice Management (PPM): This envelope funds the cost of running
the operational work program, and includes funding for management, administrative
support services, space and IT costs, extended assignment benefits for field assignments,
plus knowledge management, innovation and staff training/learning.
2. Institutional, Governance and Administration (IG&A)
This envelope comprises the funding provided to IG&A units to cover the cost of running
the institutional, governance and administrative services that support the World Bank’s
operational delivery.
Total unit trajectories are the sum of Operational and IG&A unit trajectories.
The two additional expense area envelopes comprise the following:
3. Grant-Making Facilities (GMF)
This envelope provides Board-mandated transfers to external facilities.
4. Centrally Managed Accounts (CMA)
This envelope contains funding for expenses that are centrally administered and non-unit
specific such as depreciation, lease costs and benefits as well as certain institutional
programs.

27
4.4 OPERATIONAL WORK PROGRAM
37. As a greater share of
resources is directed to
operational activities
in FY19 and
allocations to all
regions grow,
additional funding
will be made available
for the Bank’s key
strategic priorities.
As more resources are directed toward front-line activities,
additional funding will be made available for the Bank’s key
strategic priorities: (i) ensuring delivery of IDA-18 scale up, (ii)
enhancing engagement in FCV countries and small states, (iii)
continued engagement with IBRD clients, (iv) supporting
implementation of the new ESF, and (v) harnessing collaboration
across the WBG in maximizing finance for development in
developing client solutions.
Specifically, as set out in Table 4.6, additional resources have been
directed towards the two largest IDA regions, namely AFR and
SAR, for the preparation and delivery of the pipeline for IDA and
FCV scale-up as well as related supervision needs. The AFR
Region’s FY19 Country Engagement (CE) budget would increase
by 8 percent (or US$20 million) over FY18. Similarly, the SAR
Region’s FY19 CE budget would increase by 4 percent (or US$5
million) over FY18.
To avoid crowding out of other country programs due to cost
pressures in delivering on small states, additional resources have
been allocated to the two regions with the largest IDA allocations
for these countries – the EAP Region (with an increase of 4 percent
or US$4 million over its FY18 CE budget) and the LCR Region (an
increase of 1 percent or US$1 million over its FY18 CE budget).
The MNA and ECA Regions were allocated an increase to support
continuing client engagement demands.
As shareholders endorsed the IBRD capital package during the
Work Program Agreement (WPA) process, Management has
started consulting externally with clients and internally with
business units on the specific lending volumes, policy commitments
and budgetary implications of this package, which are not yet
reflected in the WPA outcomes discussed in this section. Any
incremental funding needs for FY19 emerging from this analysis
will be absorbed within the 2 percent flexibility band and, if above
that, Management will seek Board approval. FY20-21 budget
needs will be assessed as part of the next year’s Strategic Planning
and Budgeting cycle.

28
Management has recently aligned the Sustainable Development
Practice Group and the Global Themes Vice-Presidency to balance
the distribution of responsibility over the World Bank program. The
budget of these two Vice Presidencies will be re-apportioned
according to the new structure as the details are finalized and will
be updated in the FY19 Q1 Quarterly Business and Risk Review
(QBRR).

29
Table 4.6: FY19 Operational Budget Envelopes (US$ million)
FY18 FY19 FY18 FY19
AFR
CE 266 286 489 528
PPM 119 123 123 127
Total 385 409 612 654
EAP
CE 105 109 232 247
PPM 61 61 66 65
Total 167 171 298 312
ECA
CE 86 87 188 194
PPM 54 55 55 56
Total 140 142 243 250
LCR
CE 96 97 151 156
PPM 56 57 57 58
Total 152 154 207 213
MNA
CE 60 61 166 189
PPM 36 36 37 38
Total 95 97 203 227
SAR
CE 120 125 235 249
PPM 52 55 54 57
Total 172 180 289 306
Other Operational Units' Allocations1
CE - 16 - 16
All Regions
CE 732 781 1,460 1,578
PPM 378 387 393 400
Total for Regions 1,111 1,168 1,853 1,978
GP/GT GE
GE 88 90 285 310
GP/GT PPM
Equitable Growth, Finance and Institutions 77 80 89 92
Human Development 37 40 43 46
Sustainable Development 106 105 164 168
Other Operational Support2 62 64 62 64
Global Themes 13 18 13 19
Total GP/GT PPM 295 308 371 390
Total GP/GT 383 398 656 700
Total Operational Units 1,494 1,566 2,509 2,678
INDICATIVE BUDGET TRAJECTORIESBB ALL FUNDS
1CE funded to GPs for FCV enhanced supervision pilot, and additional funding for GBV Action
Plan and the new ESF implementation. The latter is complemented by US$6 million
additional funding to OPCS in FY19 to support the new ESF roll-out.
2Includes Extended Assignment Benefits (EAB) for operational staff and funding to support
Agile Bank initiative, and aspects of the work on FCV Supervision Pilot and Gender-based
Violence (GBV) Action Plan.
30
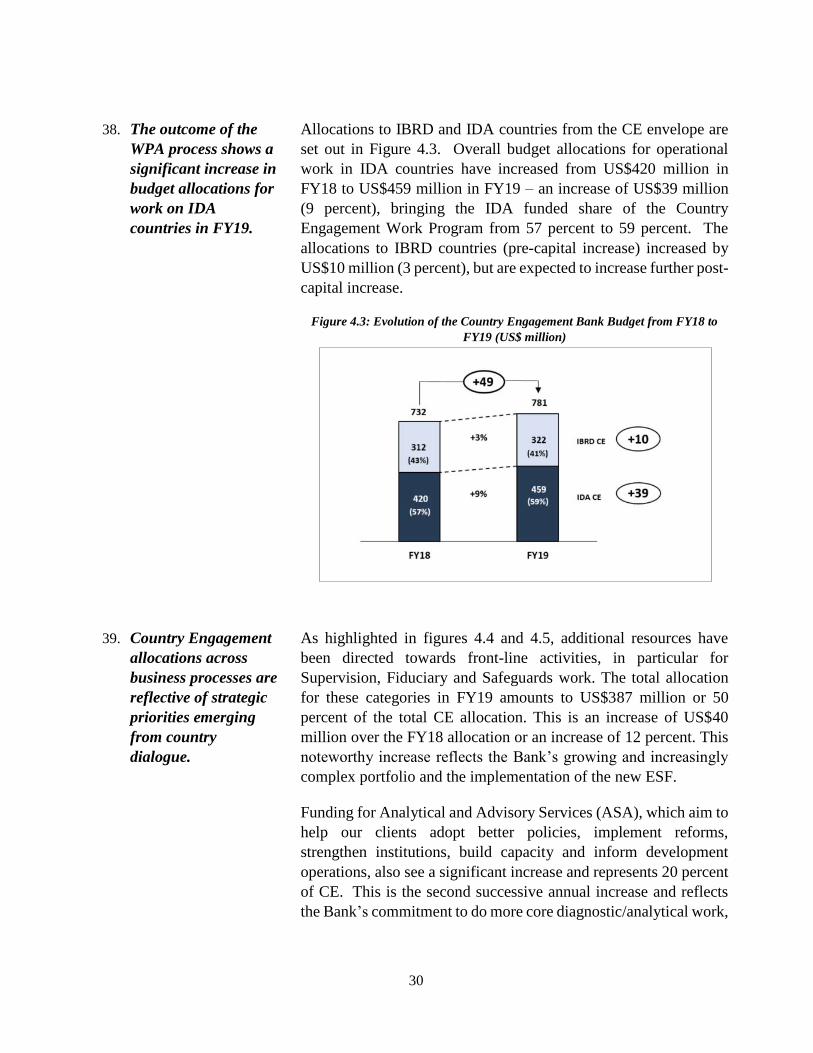
38. The outcome of the
WPA process shows a
significant increase in
budget allocations for
work on IDA
countries in FY19.
Allocations to IBRD and IDA countries from the CE envelope are
set out in Figure 4.3. Overall budget allocations for operational
work in IDA countries have increased from US$420 million in
FY18 to US$459 million in FY19 – an increase of US$39 million
(9 percent), bringing the IDA funded share of the Country
Engagement Work Program from 57 percent to 59 percent. The
allocations to IBRD countries (pre-capital increase) increased by
US$10 million (3 percent), but are expected to increase further post-
capital increase.
Figure 4.3: Evolution of the Country Engagement Bank Budget from FY18 to
FY19 (US$ million)
39. Country Engagement
allocations across
business processes are
reflective of strategic
priorities emerging
from country
dialogue.
As highlighted in figures 4.4 and 4.5, additional resources have
been directed towards front-line activities, in particular for
Supervision, Fiduciary and Safeguards work. The total allocation
for these categories in FY19 amounts to US$387 million or 50
percent of the total CE allocation. This is an increase of US$40
million over the FY18 allocation or an increase of 12 percent. This
noteworthy increase reflects the Bank’s growing and increasingly
complex portfolio and the implementation of the new ESF.
Funding for Analytical and Advisory Services (ASA), which aim to
help our clients adopt better policies, implement reforms,
strengthen institutions, build capacity and inform development
operations, also see a significant increase and represents 20 percent
of CE. This is the second successive annual increase and reflects
the Bank’s commitment to do more core diagnostic/analytical work,

31
remain engaged in dialogue across all client groups, as well as
underpin future lending including in FCV/FCV-risk countries.
Resources for Lending preparation (pre-capital increase),
representing 17 percent of CE, on the other hand, have slightly
declined from previous years reflecting an explicit effort to
consolidate tasks and reduce fragmentation in the pipeline
whenever feasible. Given the IDA-18 envelope that is 50 percent
larger than IDA-17, the doubling of IDA resources in FCV, and a
tripling in resources for small states, as well as new windows, the
Bank will need to be more agile and innovative in finding synergies
in consolidating lending tasks and reducing fragmentation.
Figure 4.4: Country Engagement Bank Budget Allocations by Business Process
for FY17-19 (US$ million)

32
Figure 4.5: Country Engagement Bank Budget Allocation Shares by Business
Process for FY17-19
40. Fiduciary and
Safeguards allocations
will increase
significantly for the
third year in a row.
The roll-out of the new Procurement Framework and
Environmental and Social Framework have been designed to ensure
that Bank-financed projects are delivered to the highest standards.
The recently introduced Procurement Framework is designed to
increase the flexibility, efficiency and transparency of the
procurement process, and the new Environmental and Social
framework (ESF), which will become operational in FY19, will
enhance the sustainability of financing by deepening protections of
people and the environment from adverse impacts. Going beyond
individual projects, the framework aims to strengthen national
systems and institutions in client countries.
As the Bank’s portfolio grows, and the Bank’s footprint expands
into more challenging environments, Fiduciary and Safeguard
allocations will increase by an additional 12 percent in FY19, or 62
percent since FY16. Following a significant increase in FY17 and
FY18 to support the implementation of the new procurement
framework and the IDA-18 scale up, resources for fiduciary work
will increase by an additional 4 percent to US$70 million in FY19.
Equally, following large increases in FY17 and FY18, allocations
for Safeguards work will increase by 23 percent to US$64 million
in FY19. This includes an additional allocation of US$10 million
provided in response to an estimate of the incremental costs of
9% 9% 10%4% 3% 4%
21% 20% 20%
7% 7% 8%8% 9% 9%
31% 31% 32%
20% 20% 17%
FY17 FY18 FY19
Other COMO ASA Safeguards Fiduciary Supervision Lending

33
project safeguard requirements expected under the new ESF
effective October 2018.
Figure 4.6: CE Spending on Fiduciary and Safeguards for FY16-19
41. Country Engagement
allocations across
Practice Groups
reflect strategic
priorities emerging
from country
dialogue.
FY19 WPAs, driven by client demands, have resulted in increased
resources in all GP Practice Groups. The increases across Practice
Groups are broadly equal in percentage terms and consequently the
FY19 CE allocations show Sustainable Development, including
Safeguards, holding the largest share, followed by Equitable
Growth, Finance and Institutions, followed in turn by Human
Development.
Figure 4.7: FY19 Country Engagement Allocation Shares by Practice Group

34
42. Country Engagement
allocations for
fragility, conflict, and
violence (FCV)
affected countries will
increase by 9 percent
in FY19, which is a 35
percent increase since
FY16.
As illustrated in Figure 4.8, the CE allocation to FCV and FCV at
risk countries (IDA and IBRD) increased by US$13 million (9
percent) from US$142 million in FY18 to US$155 million in FY19.
Of the total FY19 CE increase (US$49 million), some 27 percent
(US$13 million) was directed to FCV/FCV-Risk countries. The
increase in allocations on FCV and FCV at risk countries since
FY16 amounts to US$40 million or 35 percent.
The Bank is meeting its IDA-18 commitment to add staff in FCV
locations during the IDA-18 three-year cycle. In the area of mobility
and careers for FCV staff, the Bank’s focus is on: a) emphasizing
FCV experience in selections and assignment to senior positions; b)
strengthening next assignment planning; and c) monitoring
recruitment, deployment, development, promotion and careers. A
number of leadership, learning and mentoring programs for FCV
staff and managers have been developed, such as an onboarding
program customized for FCV staff and delivered in Cairo in
December 2017. Hazard and Fragility Pay was introduced in
October 2017, benefitting over 700 country office appointed staff
in 27 hazardous and/or FCV locations. Another area of focus is staff
health and wellbeing, with several initiatives underway to support
FCV staff.
Figure 4.8: Country Engagement Bank Budget Allocations for FCV and FCV at
Risk Countries for FY16-19 (US$ million)

35
43. Country Engagement
allocations to Small
States will increase by
8 percent in FY19,
which is a 51 percent
increase since FY16.
As illustrated in Figure 4.9, the CE allocation to Small States
increased by 8 percent from US$45 million in FY18 to US$48
million in FY19. The increase in spending on Small States since
FY16 amounts to US$16 million or 51 percent.
Figure 4.9: Country Engagement Bank Budget Allocations to Small States for
FY16-19 (US$ million)
44. The Bank is
continuing to make
progress on the goals
set out in the WBG
Climate Change
Action Plan.
Continued ambitious attention to, and global leadership on, climate
change is critical to meeting the development mission of the World
Bank Group (WBG). To this end, the WBG is expected to reach at
least 26 percent climate co-benefits in total commitments by the end
of FY18 and will meet its 28 percent target by 2020. This continues
the strong upward trend from 18 percent in FY15.
The World Bank will continue to support transformational policies
needed to deliver climate actions, mobilize private sector
investment and inform the global discussion on the climate agenda.
Funding for such efforts will be directed through: (1) the Country
Engagement budget envelope in support of the preparation and
supervision of projects that generate climate co-benefits and of
climate related analytical and advisory work (both projects and
analytical/advisory tasks are “climate tagged” during the FY as their
content and design are defined); (2) the Global Engagement and
PPM budgets in support of the Global Themes VPU (see Table 4.6);
and (3) research work done by DEC.

36
45. Narrowing the gender
gap features
prominently in the
World Bank Group’s
FY19 work program.
The World Bank Group Gender Strategy (FY 2016-2023) outlines
the support to countries and companies to (i) close gaps in health
and education, (ii) remove constraints to women’s labor force
participation, (iii) work to increase women’s ownership and control
of assets, and (iv) enhance women’s voice and agency, including
addressing gender-based violence. In addition, following the report
of an independent Task Force in the Fall of 2017, an action plan has
been adopted by Management and shared with the Board detailing
measures to help prevent and respond to sexual exploitation and
abuse or gender-based violence, improve monitoring systems, and
empower teams to report any cases as they emerge in the projects
the Bank supports.
To operationalize the Bank’s gender goals, gender issues will be
included in the Country Partnership Frameworks (CPF) and other
diagnostic instruments. Bank tasks are becoming increasingly
gender informed reflecting the mainstreaming of Gender in to the
Bank’s work program. Accordingly, funding for gender work will
be directed through: (1) the Country Engagement budget envelope
in support of the preparation and supervision of projects and of
analytical and advisory work that address gender gaps (both
projects and analytical/advisory tasks are “gender tagged” during
the FY as their content and design are defined); (2) the Global
Engagement and PPM budgets in support of the Global Themes
VPU; (3) the Practice and Program Management budget in the two
regions (AFR and EAP) where staff work on gender issues in the
Gender Innovation Labs; and (4) research work done by DEC.
46. Global Engagement
funding from BB
sources is expected to
increase in FY19 to
US$90 million and is
complemented by
external funds
provided by various
partners.
The Bank’s Global Engagement work program supports non-
country-specific priorities, including (i) fulfilling corporate
commitments; (ii) supporting innovation and product development
to support evidence-based policy making by developing global
databases, tools and evaluations and to maintain WBG leadership
in global public goods, (iii) sustaining partnerships and global
engagements, and (iv) providing operational support to leverage
knowledge services and enable rapid and flexible operational
response.

37
Bank funding has been allocated based on the following categories:
• Corporate Commitments (US$40 million). Priorities include
work on data quality and production in support of both the Twin
Goals and the SDGs (Data for Goals), support to the G20, and
contributions to the Global Partnership for Social
Accountability (US$1.5 million) and Facility for Investment
Climate Advisory Services (US$2.0 million). Other
engagements include work on the Human Capital Project, debt
relief, sustainability and management, jobs, Universal Financial
Access, support to the Financial Stability Board (FSB), products
design to support MFD, and the Stolen Asset Recovery (StAR)
initiative.
• Global Themes (US$26 million). This category supports the
Bank’s efforts to better deliver on cross-cutting commitments
that involve multiple Global Practices, and in many cases
IBRD/IDA, IFC and MIGA. These commitments comprise
Fragility, Conflict and Violence (FCV), Gender,
Infrastructure/PPPs/Guarantees, Knowledge Management as
well as addressing key climate change mitigation and adaptation
priorities in partner countries and to enable delivery of the
Climate Change Action Plan. Priorities include delivering on
IDA-18 commitments and the MFD approach.
• Operational Support (US$24 million). This includes allocations
to Global Practices to support on-going and new strategic
engagements, innovation, product development and
partnerships, and to facilitate knowledge services. New
engagements in FY19 are expected to include work on trade,
poverty and inequality; Jobs Country implementation and
analysis; adult learning and literacy; Schools of the Future;
Disruptive Technologies for Development; pollution-smart
interventions; and innovative financing for city development
and infrastructure.

38
Figure 4.10: FY19 Global Engagement by Practice Group and Category
47. The Program and
Practice Management
(PPM) budget will
increase by 3 percent
(see Table 4.4), with
units targeting
efficiencies to address
rising cost pressures.
The PPM budget for operational units will continue to support the
operational work program, including for priorities like
decentralization and staff learning. Rising cost pressures in this
area (notably for country office facilities, security and extended
assignment benefits resulting from continuous decentralization)
will be addressed through efficiencies measures – keeping focus on
how best to optimize organizational and management structure,
grade mix and facilities management, and applying agile and
simplification in approaching our work. Within the PPM budget,
units continue to redeploy resources toward priorities, for example
staff learning (including for the new ESF implementation learning
requirements) and span of control of Practice Managers. PPM in
FY19 also includes allocations toward aspects of work under FCV
supervision pilot and the Gender Based Violence (GBV) Action
Plan, and for the implementation of the Knowledge Management
Action Plan.

39
4.5 GRANT-MAKING FACILITIES
48. While significant
progress has been
made in phasing out,
mainstreaming or
reducing Bank
funding for Grant-
Making Facilities,
alternative financing
for CGIAR has not
been forthcoming.
As part of the budget reforms in recent years, the Bank changed its
practice from funding grant-making activities “below the line” to
allocating grant-making funds as part of the planning process. In
some cases, Bank funding has been phased out (e.g., Institutional
Development Fund (IDF) and Development Grant Facility (DGF));
in others, it was decided to mainstream the activity into a Bank
program and subject it to contestability (e.g., Global Partnership for
Social Accountability (GPSA)), or reduce funding (e.g., State and
Peace-Building Fund (SPF) and Consultative Group for
International Agricultural Research (CGIAR)). Table 4.7 below sets
out the progress made to date in meeting these objectives.
Table 4.7: Grant-Making Facilities Budgets (US$ million)
Management has explored alternative sources of funding for
CGIAR and SPF. In the case of SPF, funding levels have been
reduced in recent years to US$5 million and are expected to remain
at this level. Management responded in June 2017 to a request from
some Board members to provide a briefing on CGIAR, including
details of alternative funding models. Despite much effort on the
part of the Agriculture Global Practice over many years, no
additional external funding for CGIAR has been forthcoming to
replace World Bank funding.
FY14 FY15 FY16 FY17 FY18 FY19
State and Peace-Building Fund (SPF) - 25 21 14 5 5
Institutional Development Fund (IDF) 9 - - - - -
Development Grant Facility (DGF) 51 33 12 - - -
Global Partnership for Social Accountability
(GPSA)1 5 5 5 - - -
Consultative Group for International Agricultural
Research (CGIAR)50 47 30 30 30 30
Total Operational Activities Related to Grants 115 110 68 44 35 35
1The activities of the GPSA have now been mainstreamed into the GE work program.

40
4.6 IG&A UNITS
49. Allocations to IG&A
units will remain
broadly flat despite
increasing mandates,
with IG&A units
achieving savings
through
administrative
simplification; and
with increases being
limited to critical
needs or to fund
efficiency initiatives.
Allocations to IG&A units have been assessed against their
contribution to key priorities, namely:
• Support to finance units for the IDA-18 scale up, in particular
arising from the leveraging of the IDA balance sheet, supporting
delivery of a higher lending envelope, support to the IDA-18
mid-term review and IDA-19 replenishment, and facilitating the
expansion of the Bank’s field presence in priority locations.
• Strengthening the IBRD financial position, through measures to
enhance IBRD financial capacity. Additional resources will
also be considered as part of the incremental funding for the
implementation of the capital package to support
implementation of its financial commitments.
• Implementation of the Environmental and Social Framework
(ESF), for OPCS to support the roll-out of the new
Environmental and Social Framework and strengthening
oversight.
• Supporting other operational priorities including Maximizing
Finance for Development (MFD), Climate commitments,
Fragility and Gender.
• Supporting the WBG delivery including the People Strategy,
security, knowledge, data and statistical capacity work,
communication and stakeholder engagement, enhanced risk
management and innovative financial products.
• Enhancing the business model through administrative
simplification measures.
Management has made continuous efforts to seek efficiencies,
productivity improvements and cost avoidance in IG&A VPUs.
IG&A units have pursued such efficiencies through the
administrative simplification initiative and Business Reviews (see
Section 2.4), both of which have played a critical role in this
realignment of resources. As already detailed in Section 2,
Management will continue to seek greater efficiencies from these
VPUs by pursuing more innovative and simpler ways of doing
business that conform with external best practice. In FY19,
incremental funding for IG&A units have been limited to fund

41
critical needs, namely to support the implementation of the new ESF
Framework and support to Treasury and risk management
functions, as well as investments to improve the business model.
Management has recently informed the Board of its intention to
create a data compliance function. The budget implications of this
new function are being assessed.

42
Table 4.8: FY19 IG&A Budget Envelopes (US$ million)
FY18 FY19 FY18 FY19
1.0 Institutional Services
1.1 Budget, Performance & Strategy 74 76 74 76
1.2 Financing for Development - 1 - 1
1.3 Chief Risk Office 117 16 18 17
1.4 Development Economics 52 52 107 106
1.5 Development Finance 2 28 24 65 65
1.6 External & Corporate Relations 50 54 53 57
1.7 Global Environment Fund - - 33 37
1.8 Legal Services 39 39 41 41
1.9 Operational Policy & Country Services 351 58 52 58
1.10 Strategy, Performance, and Admin. 9 11 12 14
1.11 Treasury 4 38 36 86 89
1.12 WBG Finance & Accounting 46 46 53 53
Sub-Total 404 412 595 614
2.0 Governance Services
2.1 Administrative Tribunal 2 2 2 2
2.2 EDs 88 87 88 87
2.3 Board of Governors 7 6 7 6
2.4 DC Secretariat 2 2 2 2
2.5 Conflict Resolution System 5 5 6 6
2.6 Corporate Secretariat 17 16 18 17
2.7 Independent Evaluation Group 29 30 38 39
2.8 Integrity Vice Presidency 21 21 21 21
2.9 Internal Audit 9 9 11 11
2.10 Inspection Panel 4 4 4 4
2.11 Office of Ethics and Business Conduct 7 7 9 9
2.12 Office of the President 7 7 7 7
2.13 Office of Suspension & Debarment 2 2 2 2
2.14 Office of the CEO 4 4 4 4
2.15 Office of the MD and CAO 3 3 3 3
2.16 Office of the MD and CFO 3 3 3 3
2.17 Office of the SVPMM 5 6 6 6 6
2.18 Sanctions Board 2 2 2 2
2.19 Strategic Initiatives Unit 1 1 1 1
Sub-Total 219 216 236 234
3.0 Administrative Services
3.1 General Services and Facilities 153 152 193 192
3.2 Human Resources 6 68 63 84 78
3.3 Information & Technology Solutions 241 241 293 292
Sub-Total 463 456 571 562
1,086 1,084 1,402 1,410
3OPCS: Reflects in FY19 staff transfers to ECR and incremental funds to support the ESF roll-out.
5Office of the SVPMM includes New York and Geneva Offices. 6HR: Reflects in FY19 adjustment to the staff benefit rate compensation allocation in FY18 and staff
transfers to ECR.
1CRO: Reflects the cessation in FY18 of timebound allocations for work on IDA-18 and the IBRD capital
package.
INDICATIVE BUDGET TRAJECTORIESBB All Funds
TOTAL INSTITUTIONAL, GOVERNANCE & ADMIN.
2DFI: Reflects in FY19 the move from DFI of Financing for Development as a stand-alone unit, staff
transfers to other units, in particular to ECR, and adjustment to the staff benefit rate compensation
allocation in FY18.
4 TRE: FY18 BB restated to reflect the new arrangements for RAMP and other asset management
services; also reflects adjustment to the staff benefit rate compensation allocation in FY18.

43
50. The FY19 WBG
budget for the
Executive Directors
and IEG amount to
US$117 million.
The FY19 budgets for the Executive Directors Offices (EDs) and
the Independent Evaluation Group (IEG) amount to US$117
million – a small increase in the budget of IEG and a reduction in
the budget of Executive Directors.
Although the Bank’s share of these budgets is authorized as part
of this document, and included in the total administrative budget
approval, the sizing of these budgets is not determined by
Management.
Table 4.9: FY18 and FY19 ED and IEG Budgets (US$ million)
4.7 CENTRALLY-MANAGED ACCOUNTS
51. Centrally-Managed
Accounts (CMAs) will
increase by US$3 million
in FY19 due to higher
depreciation costs and
staff separations offset
by trust fund recoveries.
Centrally Managed Accounts (CMAs) contain funding for
expenses that are either not easily attributed to specific units, or
institutional programs that are managed by units but for which
Management maintains discretion over the budget. The net
change in the budget for the CMAs between FY18 and FY19 is
US$3 million, as explained below:
• Depreciation is expected to increase by US$12 million (12
percent) over FY18 primarily due to increases in Centrally-
Managed IT depreciation. Further details are provided in
section 5. This reflects the downstream impact of the
significant ramp up of IT investment over the past decade.
• Corporate Contingency is set at US$10 million in FY19 to
support unforeseen priorities and cost pressures (same as
FY18).
• Funding for Institutional Programs will remain flat at FY18
levels.
• Staff Benefits and Allowances are budgeted at US$894
million in FY19 and shown net of an estimated US$914
million of recoveries from units and external funds collected
through the 70 percent and 45 percent staff benefit rate for
HQ-appointed and Country Office-appointed staff. While
FY18 FY19
Executive Directors (EDs) 88 87
IEG 29 30
Total 117 117

44
overall net staff benefits increase by US$2 million, this is
due to a US$53 million increase in gross benefits and a
US$51 million increase in recoveries. Gross benefits are
expected to increase faster than salary expense growth due
to certain benefits, such as medical costs, rising at a faster
rate. The budget for recoveries includes an expected
additional US$10 million due to the introduction of the 45
percent Country Office staff benefit rate on external funds
in FY19.
• Other Budget Recoveries comprise the recovery of indirect
costs from BETFs and other external funds as well
miscellaneous rebates and internal recoveries. The increase
of US$11 million in this category is principally due to an
anticipated increase in recoveries from the 17 percent
personnel charge on BETFs.
Table 4.10: Centrally-Managed Accounts (US$ million)
FY18 WB
Budget FY19 % Change $ Change
A B (B/A) (B-A)
Depreciation1 102 114 12% 12
Corporate Contingency 10 10 0% -
Institutional Programs 84 84 0% -
Staff Separations 14 21 48% 7
Washington Real Estate Costs 32 28 -12% (4)
Business Continuity1 18 15 -16% (3)
Awards Programs 4 4 0% -
Corporate Insurance 4 4 0% -
Community Connections 3 3 0% -
Evacuation Costs 2 2 0% -
Other Programs 7 7 0% -
Net Staff Benefits & Allowances (22) (20) -7% 2
Gross Staff Benefits & Allowances 841 894 6% 53
HRD-managed Staff Benefits 251 273 9% 22
Tax Allowances 129 136 6% 7
Staff Retirement and PCRF 462 485 5% 24
Institutional Benefits Recovery (863) (914) 6% (51)
Other Budget Recoveries (74) (85) 15% (11)
Total 100 103 2% 3
1Includes a US$3 million transfer in FY19 from the Business Continuity allocation to
Depreciation for the centralization of related IT depreciation costs.

45
52. The Post-Retirement
Contribution Reserve
Fund (PCRF) was
established in FY13 with
the objective of reducing
budget volatility
resulting from the
Bank’s contributions to
the staff post-retirement
plans.
The Bank’s contributions to the staff post-retirement benefit
plans remain at the established 35 percent of net salaries, which
is higher than the FY19 contribution rate of 28.43 percent
calculated by actuaries. The excess (the difference between the
actual rate determined by PFC and the 35 percent fixed
contribution rate) is added to the PCRF to build up the Reserve
Fund. The balance of the Fund is projected to be US$357
million at the end of FY19. A review of the PCRF, led by
Treasury, is scheduled for FY19.
4.8 EXPENSE FUNCTIONAL VIEW
53. The Bank follows a
dollar budget
approach which allows
budget holders
flexibility to vary
inputs as long as they
stay within workforce
planning affordability
parameters and their
authorized budgets.
The Bank does not set specific budgets by expense category, for
example, staff salaries, short term consultants or travel.
Accordingly, the functional expense line view presented in
Table 4.11 below is an illustrative decomposition of the
administrative budget by expense line item. Nevertheless, as the
shares of the expense items have remained relatively stable over
the years, the estimates below represent the current view of the
most likely outcome. The actual outcome may differ because
work programs vary during the year, and decisions are made to
respond to changing business needs that may entail trade-offs
between different expense categories.
Table 4.11: FY18 and FY19 Functional Expense View of Administrative
Expenses (US$ million)
US$m% of
TotalUS$m
% of
TotalUS$m
% of
TotalUS$m
% of
Total
Fixed Expenses 2,300 76% 2,728 67% 2,372 76% 2,818 67%
Of which:
Staff Salaries and Benefits 1,919 64% 2,286 56% 1,971 63% 2,355 56%
Other Fixed Expenses 1/ 381 13% 442 11% 401 13% 464 11%
Variable Expenses 710 24% 1,322 33% 738 24% 1,373 33%
Of which:
ST/ET Consultants & Temporaries 215 7% 647 16% 226 7% 676 16%
Travel Costs 229 8% 349 9% 238 8% 363 9%
Contractual Services 224 7% 273 7% 230 7% 279 7%
Other Variable Expenses 2/ 42 1% 52 1% 44 1% 54 1%
Total Unit Gross Expenses 3,009 100% 4,050 100% 3,110 100% 4,191 100%
Grant Making Facilities (GMFs) 35 35 35 35
Total Gross Admin Expenses (incl. GMFs) 3,044 4,085 3,145 4,226
Reimbursable Revenues and Fee income (495) (534)
Total Net Admin Expenses (incl. GMFs) - BB Only3/ 2,550 2,611 1/ Other fixed expenses include Communications & IT, Equipment & Building, Depreciation, and TF Indirect costs.
Expenses by Type of Expense
FY18
Projections
FY19
Projections
BB+Reimb. All Funds
2/ Other variable expenses include Supplies, Printing, and other indirects costs.
* Numbers may not add up due to rounding.
BB+Reimb. All Funds

46
FY19 projected gross administrative expenses on an All Funds
view are expected to be higher than FY18 projections by US$141
million or 3.5 percent. This increase is driven by an increase in
Bank Budget funded expenditures of US$61 million or 2.4
percent, and externally funded expenditures of US$80 million or
5 percent.
54. The functional
expense view shows
staff costs to be the
main expense
category.
Staffing is the main expense category representing about 56
percent of total unit gross expenses on an All Funds view (63
percent of Bank Budget).

47
55. Management considers
that the staff
remuneration increase
proposed in the 2018
Review of Staff
Compensation paper to
the Board is affordable
within the proposed
budget.
Staff costs across all funds are projected to increase by 3.0 percent
(US$69 million) in FY19 due to the proposed structure adjustment
of 1.1 percent for Washington-appointed staff and the country-by-
country structure adjustments covering country office-appointed
staff. Management considers the projected increase in staff costs
to be affordable and manageable within the overall budget
framework.
56. Staffing counts are
below FY14 levels.
In terms of staff count, the number of full-time Bank staff in FY18
is projected to be around 2.5 percent above that in FY17 but, from
a longer perspective, Bank budget-funded FTE staff is 4 percent
below the level in FY14 (1 percent below on an All Funds view),
despite the significantly increased IBRD/IDA portfolio (20.8
percent over FY14) with a flat nominal budget over the same
period (see Figure 4.11 below).
Figure 4.11: Full-time Bank Staff on Payroll (percentage growth since FY14)
57. Variable expenses are
estimated to grow in
FY19 by 4 percent
across all funds.
In terms of other expense categories, FY19 projections reflect a
stable share of major line items to total costs, driven by the needs
of operational units and travel costs. The re-introduction of the
Extended Term (ET) category of consultants/temporaries under
Variable Expenses may have some impact on this cost category.
Expenses on the contingent work force will be monitored as the
reintroduction of ET consultants/temporaries moves forward.
4.8%
13.2%
16.0%
20.8%
0.0%
1.1%
-0.7% -0.9%0.1%
-7.4%-3.5%
-1.1%
-3.0%
-7.9%-6.3%
-4.0%
-8%
-4%
0%
4%
8%
12%
16%
20%
24%
FY14 FY15 FY16 FY17 FY18P*
% Growth in IBRD/IDA Net Commit (US$ billion)
% Growth in Admin. Budget (BB) US$ million
% Growth in Full-time WB Staff Count on Payroll (All Funds)
% Growth in Full-time Equiv. (FTE) WB Staff Count on Payroll (BB+)
*Projected

48
CAPITAL BUDGET
This section includes an outline of the Bank’s FY19 Capital Budget.
5.1 FACILITIES
58. The proposed
Facilities Capital
Budget for FY19 is
US$105 million.
The proposed FY19 Facilities investment of US$105 million
comprises:
• Country office construction, purchases, relocations, and
upgrades (US$53 million or 50 percent). These investments
aim to accommodate an increasing presence in the field,
prioritize FCV needs, and to move from expensive leasehold
properties to Bank owned properties in select countries.
• HQ facilities repairs, renovations and upgrades (US$30
million or 29 percent) represent ongoing maintenance and
upgrades as well as efforts to increase efficiency of space
usage. Key investments include replacements of lighting
system, air handling unit, roof, chiller plant, and video
conferencing equipment.
• Security in HQ and country offices (US$22 million or 21
percent) mainly for country office security equipment
upgrades in medium and high priority offices, integrating and
upgrading country office access systems, fire alarm and other
system upgrades in Washington, and deployment of
defibrillators and trauma kits. The planned increase in security
spending from prior years reflects the Bank’s expanded
footprint in more challenging and less secure environments, as
well as the deterioration in the global security environment
generally.

49
5.2 TECHNOLOGY AND SYSTEMS
59. The proposed Capital
Budget for Technology
and Systems in FY19
is US$85 million.
The FY19 Technology and Systems investment plan of US$85
million is spread across three segments, as follows:
• IT Infrastructure Services (US$26 million or 31 percent)
aimed at (i) ensuring the reliability, continuity, and resiliency
of IT infrastructure and WBG global network, (ii) replacing
and upgrading end-of-life infrastructure, and (iii) safeguarding
information based on business value and risk.
• Modern Operations (US$16 million or 19 percent) which will
be used to enhance systems and enable operational staff to
deliver better and faster results. These enhancements will
enable simpler processing of projects, ensure robust
compliance, strengthen data analytics and collaboration,
strengthen mobile access to key operations solutions, and
deliver standard reports and dashboards.
• Finance, Accounting and Budget Systems (US$15 million or
18 percent) which will allow the Bank to meet compliance
with current market practices and expanding regulatory
requirements (IBRD), and compliance with the Financial
Accounting Standards Board’s (FASB’s) directive for
implementation of the new accounting standards for lease. In
addition, systems enhancements will also automate corporate
re-organizations which are conducted at least twice annually
and involve many manual interventions.
• Information, Knowledge and Learning (US$9 million or 11
percent) which will simplify and centralize our knowledge
repositories, provide easier contextual access to information,
leverage information, learning, and data in client solutions,
and promote collaboration and knowledge sharing.
• Digital Workspace (US$9 million or 10 percent) which will
provide safe and secure end points, enabling easy and
appropriate access and functionality to Bank IT systems
anytime and anywhere, and across all devices.
• Risk Management (US$5 million or 6 percent) which will
upgrade systems capabilities to handle valuation of capital
market issuances and IBRD liquidity management.

50
• Modern HR (US$5 million or 5 percent) which will be
directed at consolidating HR IT platforms to take advantage
of the most efficient HR technologies, as well as allow
systems to provide agile solutions for contextual, data-driven
decision making.

51
ANNEX I: PROGRAM COST SUMMARY
1. Table I.1 Program Cost Summary (PCS) shows the FY19 budget by: work program and
unit, Bank Budget, and external funds. Table I.2 further classifies external funds into
coupled reimbursable revenues (refer to definition below) and BETFs. All budget figures
are reported in nominal terms.
2. The PCS reflects framework adjustments since FY15 and takes another step towards a
unified approach to planning for revenues and expenditures. As was done since FY16 this
budget is constructed using holistic revenue and expense budgeting with respect to
reimbursable revenues and IBRD/IDA funding. Reimbursable revenues have been
classified as either:
• Coupled Reimbursable Revenues (CRR) which are earned by the Bank for services
that are directly related to the underlying expense incurred by a unit; revenue is not
earned unless there is a corresponding expense, similar to BETF; or
• Decoupled Reimbursable Revenues (DRR), on the other hand, which are earned by the
Bank for services that are not directly driven by the underlying expenses incurred by
the managing unit. Examples of these revenues include: Trust Funds fee income,
Health Services Department services, and revenues from sub-letting office space to
third parties.
3. Since the FY16 Budget Framework, expenditure authorization previously given as
reimbursables expense budget associated with DRR is now allocated to units or programs
as regular Bank Budget (i.e., it is “budgetized” and is now no different from a unit’s other
BB allocations). This facilitates better medium-term planning for the units, while
allowing flexibility at the corporate level. All changes in BB allocation are now subject
to the annual planning process as they are no longer linked to the revenue earned.

52
Table I.1: FY19 Funding for WB Work Program and Unit (US$ million)
FY18 FY19 FY18 FY19 FY18 FY19
1.0 Country Engagement
1.1 AFRVP 265.7 286.0 223.6 241.5 489.2 527.5
1.2 EAPVP 105.5 109.3 126.6 137.3 232.0 246.6
1.3 ECAVP 85.6 87.1 102.0 107.0 187.7 194.1
1.4 LCRVP 95.9 97.0 54.6 58.8 150.5 155.8
1.5 MNAVP 59.6 60.6 106.4 128.4 166.0 189.0
1.6 SARVP 120.0 125.3 114.9 123.7 234.9 249.0
1.7 Other Operational Units' Allocations1 - 15.8 - - - 15.8
Sub-Total 732.3 781.2 728.1 796.8 1,460.4 1,578.0
2.0 Global Engagement
2.1 GP/GT 87.7 89.6 196.9 220.7 284.7 310.3
Sub-Total 87.7 89.6 196.9 220.7 284.7 310.3
A TOTAL CLIENT ENGAGEMENT 820.0 870.8 925.0 1,017.5 1,745.0 1,888.3
3.0 Region PPM
3.1 AFRVP 119.4 122.9 3.4 3.7 122.8 126.6
3.2 EAPVP 61.1 61.3 5.2 3.7 66.3 65.0
3.3 ECAVP 54.1 55.1 1.3 1.0 55.4 56.1
3.4 LCRVP 55.7 56.6 0.9 1.0 56.6 57.6
3.5 MNAVP 35.8 36.2 1.4 1.5 37.1 37.7
3.6 SARVP 52.2 54.9 2.2 2.3 54.4 57.2
Sub-Total 378.3 387.0 14.3 13.2 392.6 400.2
4.0 GP/GT PPM
4.1 Equitable Growth, Finance and Institutions 76.9 79.8 12.2 12.6 89.1 92.4
4.2 Human Development 37.3 40.4 5.4 5.7 42.7 46.1
4.3 Sustainable Development 105.9 105.4 57.8 62.1 163.7 167.5
4.4 Other Operational Support2 62.2 64.4 - - 62.2 64.4
4.5 Global Themes 12.9 17.9 0.4 1.2 13.3 19.1
Sub-Total 295.3 307.9 75.8 81.6 371.1 389.5
B TOTAL PROGRAM & PRACTICE MGMT. 673.6 694.9 90.1 94.8 763.7 789.8
C TOTAL OPERATIONAL UNITS 1,493.6 1,565.7 1,015.1 1,112.3 2,508.7 2,678.1
5.0 Operational Grant Making Facilities
5.1 CGIAR 30.0 30.0 - - 30.0 30.0
5.2 State and Peace Building Fund 5.0 5.0 - - 5.0 5.0
Sub-Total 35.0 35.0 - - 35.0 35.0
D TOTAL OPERATIONS 1,528.6 1,600.7 1,015.1 1,112.3 2,543.7 2,713.1
INDICATIVE BUDGET TRAJECTORIESBB External Funds All Funds

53
Table I.1: FY19 Funding for WB Work Program and Unit (US$ million) (Cont’d.) / 2 of 3
FY18 FY19 FY18 FY19 FY18 FY19
6.0 Institutional Services
6.1 Budget, Performance & Strategy 74.0 76.1 - - 74.0 76.1
6.2 Financing for Development - 0.9 - - - 0.9
6.3 Chief Risk Office 17.2 16.2 0.9 0.9 18.0 17.1
6.4 Development Economics 52.4 52.0 54.7 54.2 107.1 106.2
6.5 Development Finance 27.8 23.6 37.3 41.0 65.1 64.6
6.6 External & Corporate Relations 50.0 53.5 3.1 3.7 53.0 57.2
6.7 Global Environment Fund - - 33.0 36.6 33.0 36.6
6.8 ICSID - - - - - -
6.9 Legal Services 38.8 39.2 2.4 1.7 41.2 40.9
6.10 Operational Policy & Country Services 51.4 57.9 0.5 0.5 51.9 58.4
6.11 Strategy, Performance, and Admin. 8.9 10.5 3.2 3.2 12.1 13.7
6.12 Treasury3 37.7 35.5 48.0 53.8 85.8 89.3
6.13 WBG Finance & Accounting 46.0 46.2 7.4 7.1 53.4 53.3
Sub-Total 404.1 411.6 190.6 202.8 594.6 614.4
7.0 Governance Services
7.1 Administrative Tribunal 1.9 1.9 0.5 0.5 2.4 2.4
7.2 EDs 87.7 87.4 - - 87.7 87.4
7.3 Board of Governors 7.3 6.2 - - 7.3 6.2
7.4 DC Secretariat 1.7 1.8 - - 1.7 1.8
7.5 Conflict Resolution System 5.0 4.5 1.5 1.5 6.4 6.0
7.6 Corporate Secretariat 17.1 15.8 1.2 1.4 18.4 17.2
7.7 Independent Evaluation Group 29.2 29.7 9.0 8.9 38.2 38.6
7.8 Integrity Vice Presidency 21.0 20.9 0.4 0.4 21.4 21.3
7.9 Internal Audit 8.6 8.6 2.7 2.8 11.3 11.4
7.10 Inspection Panel 4.0 4.1 - - 4.0 4.1
7.11 Office of Ethics and Business Conduct 7.2 6.8 2.1 2.1 9.3 8.9
7.12 Office of the President 7.4 7.2 - - 7.4 7.2
7.13 Office of Suspension & Debarment 1.8 1.8 - - 1.8 1.8
7.14 Office of the CEO 4.3 4.1 - - 4.3 4.1
7.15 Office of the MD and CAO 2.7 2.8 - - 2.7 2.8
7.16 Office of the MD and CFO 3.2 3.3 - - 3.2 3.3
7.17 Office of the SVPMM46.3 6.4 - 0.0 6.3 6.4
7.18 Sanctions Board 1.9 1.9 - - 1.9 1.9
7.19 Strategic initiatives unit 1.0 1.0 - - 1.0 1.0
Sub-Total 219.1 216.1 17.4 17.5 236.5 233.7
8.0 Administrative Services
8.1 General Services and Facilities 152.7 151.7 40.3 40.2 193.0 191.9
8.2 Human Resources 68.4 63.4 15.9 14.7 84.4 78.1
8.3 Information & Technology Solutions 241.4 241.3 51.8 50.9 293.2 292.2
Sub-Total 462.5 456.4 108.1 105.8 570.6 562.2
INDICATIVE BUDGET TRAJECTORIES
BB External Funds All Funds

54
Table I.1: FY19 Funding for WB Work Program and Unit (US$ million) (Cont’d) / 3 of 3
FY18 FY19 FY18 FY19 FY18 FY19
E TOTAL INSTITUTIONAL, GOVERNANCE & ADMIN. 1,085.7 1,084.2 316.0 326.1 1,401.7 1,410.3
F TOTAL: ALL UNITS 2,614.3 2,684.9 1,331.2 1,438.4 3,945.5 4,123.4
9.0 Centrally Managed Accounts & Programs
9.1 Budget recovery5(936.9) (999.5) - - (936.9) (999.5)
9.2 Corporate Contingency 10.0 10.0 - - 10.0 10.0
9.3 Depreciation 102.4 114.4 - - 102.4 114.4
9.4 Institutional Programs 83.8 83.7 0.4 0.5 84.2 84.2
9.5 Staff Benefits & Retirement 840.8 894.0 - - 840.8 894.0
Total Centrally-Managed Accounts & Programs 100.1 102.6 0.4 0.5 100.5 103.1
G TOTAL ALL FUNDS EXPENDITURE ENVELOPE 2,714.4 2,787.6 1,331.6 1,438.9 4,046.0 4,226.5
H o/w Funded by External Funds DRR (164.4) (176.6) - - (164.4) (176.6)
I o/w Funded by External Funds CRR - - (356.4) (357.3) (356.4) (357.3)
J o/w Funded by External Funds BETF - - (975.2) (1,081.6) (975.2) (1,081.6)
K o/w Admin Budget Funded by IBRD/IDA 2,550.0 2,611.0 - - 2,550.0 2,611.0
2Include Extended Assignment Benefits (EAB) for Operational staff and funding to support Agile Bank initiative, and aspects of the 3FY18 BB restated to reflect the new arrangements for RAMP and other asset management services.4Office of the SVPMM includes New York and Geneva Offices. 5Includes staff benefits recoveries from internal transfer pricing, rebates, TF recoveries, and Corporate Services.
INDICATIVE BUDGET TRAJECTORIES
BB
1CE funded to GPs for FCV enhanced supervision pilot, and additional funding for GBV Action Plan and the new ESF implementation.
The latter is complemented by US$6 million additional funding to OPCS in FY19 to support the new ESF roll-out.
External Funds All Funds

55
Table I.2: Overview of External Funds Projected Revenues FY19 by Unit (US$ million)
FY18
WB Budget FY19 FY18
WB Budget FY19 FY18
WB Budget FY19
1.0 Country Engagement
1.1 AFRVP 22.2 18.1 201.4 223.4 223.6 241.5
1.2 EAPVP 6.7 4.4 119.9 133.0 126.6 137.3
1.3 ECAVP 32.6 30.0 69.5 77.1 102.0 107.0
1.4 LCRVP 9.4 8.7 45.2 50.1 54.6 58.8
1.5 MNAVP 53.0 69.2 53.4 59.2 106.4 128.4
1.6 SARVP 7.3 4.4 107.6 119.3 114.9 123.7
Sub-Total 131.1 134.7 597.0 662.0 728.1 796.8
2.0 Global Engagement
2.1 GP/GT 10.1 13.5 186.8 207.2 196.9 220.7
Sub-Total 10.1 13.5 186.8 207.2 196.9 220.7
A TOTAL CLIENT ENGAGEMENT 141.2 148.2 783.8 869.2 925.0 1,017.5
3.0 Region PPM
3.1 AFRVP 1.5 1.6 1.9 2.1 3.4 3.7
3.2 EAPVP 3.6 2.0 1.6 1.8 5.2 3.7
3.3 ECAVP 1.3 1.0 0.0 0.0 1.3 1.0
3.4 LCRVP 0.2 0.2 0.7 0.8 0.9 1.0
3.5 MNAVP 0.5 0.6 0.9 1.0 1.4 1.5
3.6 SARVP 0.7 0.6 1.5 1.7 2.2 2.3
Sub-Total 7.6 5.9 6.6 7.4 14.3 13.2
4.0 GP/GT PPM
4.1 Equitable Growth, Finance and Institutions 2.8 2.2 9.4 10.4 12.2 12.6
4.2 Human Development 0.9 0.8 4.5 5.0 5.4 5.7
4.3 Sustainable Development 5.3 3.9 52.5 58.2 57.8 62.1
4.4 Global Themes 0.1 0.8 0.3 0.4 0.4 1.2
Sub-Total 9.1 7.6 66.7 74.0 75.8 81.6
B TOTAL PROGRAM & PRACTICE MGMT. 16.8 13.5 73.3 81.3 90.1 94.8
C TOTAL OPERATIONS 158.0 161.7 857.1 950.6 1,015.1 1,112.3
5.0 Institutional Services
5.1 Chief Risk Office 0.9 0.9 - - 0.9 0.9
5.2 Development Economics 7.1 1.4 47.6 52.8 54.7 54.2
5.3 Development Finance 6.1 6.0 31.2 35.0 37.3 41.0
5.4 External & Corporate Relations 0.7 1.1 2.3 2.6 3.1 3.7
5.5 Global Environment Fund - - 33.0 36.6 33.0 36.6
5.6 Legal Services 1.8 1.7 0.6 - 2.4 1.7
5.7 Operational Policy & Country Services - - 0.5 0.5 0.5 0.5
5.8 Strategy, Performance, and Admin. 3.2 3.2 - - 3.2 3.2
5.9 Treasury 47.4 52.3 0.7 1.5 48.0 53.8
5.10 WBG Finance & Accounting 7.4 7.1 - - 7.4 7.1
Sub-Total 74.7 73.8 115.9 129.0 190.6 202.8
6.0 Governance Services
6.1 Administrative Tribunal 0.5 0.5 - - 0.5 0.5
6.2 Conflict Resolution System 1.5 1.5 - - 1.5 1.5
6.3 Corporate Secretariat - - 1.2 1.4 1.2 1.4
6.4 Independent Evaluation Group 8.3 8.5 0.7 0.4 9.0 8.9
6.5 Integrity Vice Presidency 0.4 0.4 - - 0.4 0.4
6.6 Internal Audit 2.7 2.8 - - 2.7 2.8
6.7 Office of Ethics and Business Conduct 2.1 2.1 - - 2.1 2.1
Sub-Total 15.5 15.8 1.9 1.8 17.4 17.5
7.0 Administrative Services
7.1 General Services and Facilities 40.3 40.2 - - 40.3 40.2
7.2 Human Resources 15.7 14.4 0.2 0.3 15.9 14.7
7.3 Information & Technology Solutions 51.8 50.9 - - 51.8 50.9
Sub-Total 107.8 105.5 0.2 0.3 108.1 105.8
D TOTAL INSTITUTIONAL, GOVERNANCE & ADMIN. 198.0 195.1 118.1 131.0 316.0 326.1
E TOTAL: ALL UNITS 356.0 356.8 975.2 1,081.6 1,331.2 1,438.4
8.0 Centrally Managed Accounts & Programs
8.1 Other Centrally Managed Accounts 0.4 0.5 - - 0.4 0.5
Total Centrally-Managed Accounts & Programs 0.4 0.5 - - 0.4 0.5
F TOTAL EXTERNAL FUNDS 356.4 357.3 975.2 1,081.6 1,331.6 1,438.9
Coupled
Reimbursable Funds
(CRR)
Bank Executed Trust
Funds (BETF) External Funds

56
ANNEX II. INDICATORS OF BUDGET SUSTAINABILITY, STRATEGIC ALIGNMENT, AND
BUDGET EFFICIENCY
Focus Indicator Definition Trend
IBRD Anchor Administrative expenses as a
share of operational revenues
(loan spread revenue) (percent)
IDA Anchor Administrative expenses as a
share of operational revenues
(IDA net revenues) (percent)
External Funds Ratio External funds as a share of
total administrative spending
plans (percent)
Bu
dget
Su
stain
ab
ilit
y
90% 93%98% 96% 98%
102% 100%94%
97%104%
91%
0
200
400
600
800
1,000
1,200
1,400
1,600
1,800
FY09 FY10 FY11 FY12 FY13 FY14 FY15 FY16 FY17 FY18 FY19
0%
20%
40%
60%
80%
100%
120%
Exp
en
ses/
Re
ven
ue
US$
mill
ion
Bu
dge
t A
nch
or
%
IDA Revenue IDA-funded Expenses IDA Budget Anchor
176%189%
158%160%
155%147% 148%
135%
107%
88%80%
0
200
400
600
800
1,000
1,200
1,400
1,600
FY09 FY10 FY11 FY12 FY13 FY14 FY15 FY16 FY17 FY18 FY19
0%
40%
80%
120%
160%
200%
Exp
en
ses/
Re
ven
ues
US$
mill
ion
Bu
dge
t A
nch
or
%
IBRD Loan Spread Revenue IBRD-funded Expenses IBRD Budget Anchor
27.3%
29.1%
30.5%31.0%
32.8%33.8%
35.4% 35.8%
38.2%
20%
25%
30%
35%
40%
F Y 10 F Y 11 F Y 12 F Y 13 F Y 14 F Y 15 F Y 16 F Y 17 F Y 18 F Y 19
37.0%

57
Focus Indicator Definition Trend
Operational Share of Unit
Budgets
Total share of unit
Administrative Budget (BB
and All Funds) allocated to
Operational Units excluding
GMFs (percent)
Client Engagement
Share of Operational
Unit Budgets
Share of Operational Unit
Budget (BB and All Funds)
Allocated to Country
Engagement (CE) and
Global Engagement (GE)
excluding GMFs (percent)
FCV Share of Country
Engagement Budgets
CE (BB) budget share for
FCV and FCV at Risk
Countries over Total CE
Envelope (percent)
Str
ate
gic
Ali
gn
men
t54.9%
56.8%57.9%
59.1%60.4%
62.8%64.2%
65.5%
52.0%
54.0%
56.0%
58.0%
60.0%
62.0%
64.0%
66.0%
68.0%
FY16 FY17 FY18 FY19
BB All Funds
53.7% 54.1%54.9% 55.6%
67.4% 67.7%69.6%
70.5%
52.0%
57.0%
62.0%
67.0%
72.0%
FY16 FY17 FY18 FY19
BB All Funds
18.3% 18.3%
19.4%
19.8%
15.0%
16.0%
17.0%
18.0%
19.0%
20.0%
FY16 FY17 FY18 FY19

58
Focus Indicator Definition TrendA
dm
inis
tra
tiv
e B
ud
get
Eff
icie
ncy
Bank Budget to
Lending Volume Ratio
Total Administrative
Budget (BB) per US$
billion of loans approved
(US$ million)
Total Administrative
Budget (BB) per lending
project approved
(FY18 US$ million)
Bank Budget per
Project Approved
Ratio
88 92 90 88
83 85
46 39
53
67
79
62 59 54
59 53 57
-
20
40
60
80
100
120
FY03 FY04 FY05 FY06 FY07 FY08 FY09 FY10 FY11 FY12 FY13 FY14 FY15 FY16 FY17 FY18(P) FY19(P)
IBRD+IDA
111
101
115 108
87 91
72 75 70
78 77
58 65
73 68
59 61
-
20
40
60
80
100
120
FY03 FY04 FY05 FY06 FY07 FY08 FY09 FY10 FY11 FY12 FY13 FY14 FY15 FY16 FY17 FY18(P) FY19(P)
IDA
74
85
74 74 80 81
35 27
43
59
80
68
54
44 52
47 52
-
20
40
60
80
100
120
FY03 FY04 FY05 FY06 FY07 FY08 FY09 FY10 FY11 FY12 FY13 FY14 FY15 FY16 FY17 FY18(P) FY19(P)
IBRD
10 11
10 10 9 9 9
8 7
11 10
8 9 9
7 7 7
-
2
4
6
8
10
12
14
16
FY03 FY04 FY05 FY06 FY07 FY08 FY09 FY10 FY11 FY12 FY13 FY14 FY15 FY16 FY17 FY18(P) FY19(P)
IBRD+IDA
12
15
12 12 12
14
11
9 10
15 15 15
12 12
9 9 9
-
2
4
6
8
10
12
14
16
FY03 FY04 FY05 FY06 FY07 FY08 FY09 FY10 FY11 FY12 FY13 FY14 FY15 FY16 FY17 FY18(P) FY19(P)
IBRD
8 8 8 8 7
6 7 7 6
8 8
6 7
8
6 6 6
-
2
4
6
8
10
12
14
16
FY03 FY04 FY05 FY06 FY07 FY08 FY09 FY10 FY11 FY12 FY13 FY14 FY15 FY16 FY17 FY18(P) FY19(P)
IDA

59
Focus Indicator Definition TrendA
dm
inis
tra
tiv
e B
ud
get
Eff
icie
ncy
(C
on
t'd
.)Bank Budget to
Porfolio Volume
Ratio
Total Administrative
Budget (BB) per US$
billion portfolio under
supervision
(US$ million)
Total Administrative
Budget (BB) per project
under supervision (FY18
US$ million)
Bank Budget per
Project under
Supervision Ratio
17.4
20.1 21.6 22.4
21.0 20.2
16.6 14.8
13.8 14.2 14.7 13.9 13.1
11.9 11.7 11.6 12.0
-
5.0
10.0
15.0
20.0
25.0
30.0
FY03 FY04 FY05 FY06 FY07 FY08 FY09 FY10 FY11 FY12 FY13 FY14 FY15 FY16 FY17 FY18(P) FY19(P)
IBRD+IDA
14.5
17.9 18.6 19.8 18.9 19.4
15.7 12.9 11.8 12.4 12.8 12.8 12.8 12.0 11.0 10.3 10.9
-
5.0
10.0
15.0
20.0
25.0
30.0
FY03 FY04 FY05 FY06 FY07 FY08 FY09 FY10 FY11 FY12 FY13 FY14 FY15 FY16 FY17 FY18(P) FY19(P)
IBRD
21.9 23.1
25.8 25.8 23.6
21.2
17.9 17.7 16.4 16.7 17.1
15.2 13.3
11.9 12.5 12.8 12.9
-
5.0
10.0
15.0
20.0
25.0
30.0
FY03 FY04 FY05 FY06 FY07 FY08 FY09 FY10 FY11 FY12 FY13 FY14 FY15 FY16 FY17 FY18(P) FY19(P)
IDA
1.4 1.6
1.7 1.7 1.6 1.6 1.6 1.6 1.5 1.6 1.7 1.7 1.6 1.6
1.5 1.7 1.6
-
0.5
1.0
1.5
2.0
2.5
3.0
FY03 FY04 FY05 FY06 FY07 FY08 FY09 FY10 FY11 FY12 FY13 FY14 FY15 FY16 FY17 FY18(P) FY19(P)
IBRD+IDA
1.5 1.8
2.0 2.0 2.0 2.1 2.1 2.1 2.0
2.2 2.2 2.2 2.2 2.2 1.9
2.0 1.9
-
1.0
2.0
3.0
FY03 FY04 FY05 FY06 FY07 FY08 FY09 FY10 FY11 FY12 FY13 FY14 FY15 FY16 FY17 FY18(P) FY19(P)
IBRD
1.3 1.4 1.5 1.5 1.4 1.3 1.2 1.3 1.3 1.3 1.4 1.4 1.3 1.2 1.3
1.5 1.4
-
0.5
1.0
1.5
2.0
2.5
3.0
FY03 FY04 FY05 FY06 FY07 FY08 FY09 FY10 FY11 FY12 FY13 FY14 FY15 FY16 FY17 FY18(P) FY19(P)
IDA