
Workshop Number 9 Introduction to Asset Management Planning John Champion
56
Leaders in the design, implementation and operation of markets for electricity, gas and water. Workshop Number 9 Introduction to Asset Management Planning John Champion 27 th August 2008
-
Upload
emily-jenkins -
Category
Documents
-
view
26 -
download
0
description
Workshop Number 9 Introduction to Asset Management Planning John Champion. 27 th August 2008. John Champion - Background. Over 20 years experience of asset management Extensive experience of capital maintenance planning worldwide including Europe, Asia and the Middle East - PowerPoint PPT Presentation
Transcript of Workshop Number 9 Introduction to Asset Management Planning John Champion
Leaders in the design, implementation and operation of markets for electricity, gas and water.
Workshop Number 9
Introduction toAsset Management Planning
John Champion
27th August 2008

2
John Champion - Background
• Over 20 years experience of asset management
• Extensive experience of capital maintenance planning worldwide including Europe, Asia and the Middle East
• Last 9 months preparing business plans for two UK water companies

3
Structure of the Presentation
TWO PRESENTATIONS:
1. ASPECTS OF ASSET MANAGEMENT
2. ASSET MANAGEMENT AND BUSINESS PLANS
4
Aspects of Asset Management
Contents:
1. Introduction2. What is asset management?3. The importance of measurement4. The concept of “serviceability”

5
The Purpose of Our Business
To provide water and remove effluent for customers:
• in the correct amounts;• in the correct places; • at the correct times and• of the right quality;• with minimum impacts and• in a financially sustainable manner

6
How Are These Objectives Achieved?
By effective management of:− Water resources− Physical assets− Human assets (workforce)− Financial assets− Customers− The environment

7
What is an asset management plan?
“The part of the Business Plan that deals with a Company’s physical assets”
Includes:• Capital maintenance• Capital investment for growth• Capital investment for new obligations• Capital investment for improvement

8
What is Asset Management Planning?
Having knowledge about:− The asset inventory (what the company has)− Condition and performance− Risk− Costs at asset level− Future requirements and obligations
So that:− Shortfalls in present service can be determined− Future risks and challenges can be identified − Options for mitigation can be tested
To:− Make rational choices between practical investment options
to produce a robust business plan
9
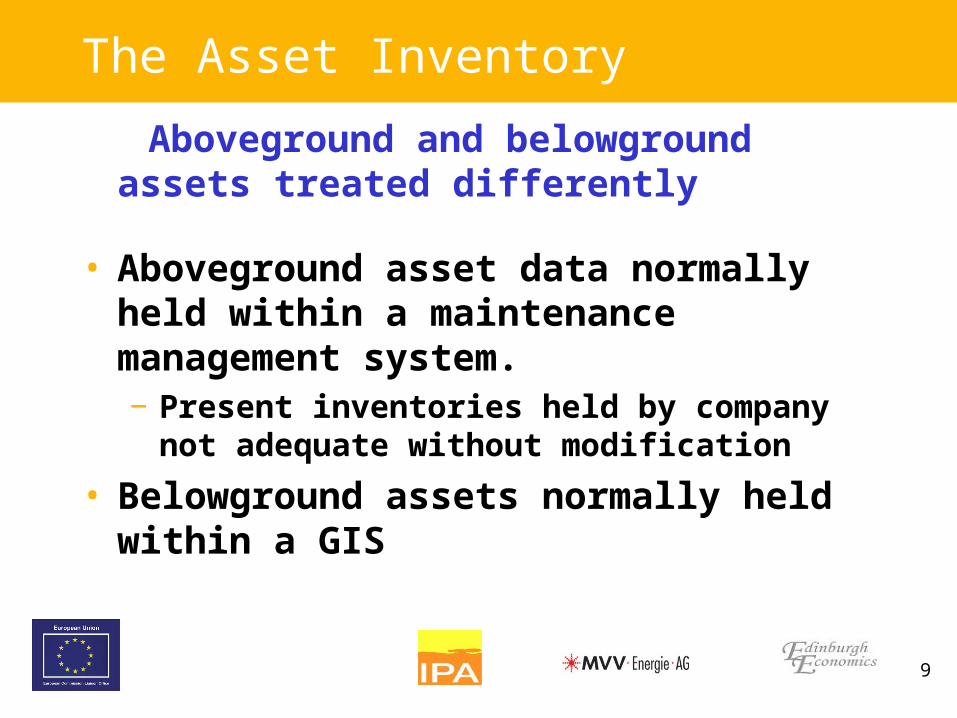
The Asset Inventory
Aboveground and belowground assets treated differently
• Aboveground asset data normally held within a maintenance management system.− Present inventories held by company not
adequate without modification
• Belowground assets normally held within a GIS
10
AMP as Part of the Business Process
Asset management planning need not be complicated
− It’s not rocket science
− Simple, “common sense” and pragmatic
− Systematic
− Integrated into day-to-day activity
− No need to be computerised

11
The Importance of Measurement
Inventory & Performance
Issues & Risks
Analysis & Conclusions
Strategy & Plan
DATA
INFORMATION
KNOWLEDGE
WISDOM

12
Measurement
As measurement is the foundation of all business processes it must be:
− Relevant
− Accurate
− Up to date
− Transparent to auditing
Inventory & Performance
Issues & Risks
Analysis & Conclusions
Strategy & Plan
DATA
INFORMATION
KNOWLEDGE
WISDOM
Inventory & Performance
Issues & Risks
Analysis & Conclusions
Strategy & Plan
DATA
INFORMATION
KNOWLEDGE
WISDOM
DATA
INFORMATION
KNOWLEDGE
WISDOM

13
Examples of Performance MeasurementCustomers:• Numbers in each zone (survey)Customer service:• Poor pressure (connections per year)• Interruptions to supply > 3hrs (unplanned)Asset performance:• “Serviceability” of above ground assets
(graded 1 to 25)• Numbers of water mains failures/km/yr

14
Asset “Serviceability” 1
“Serviceability”:
“The capability of a system of assets to deliver a reference level of service to customers and to the environment now and into the future”.
(UK Regulator’s official definition)
Condition:•Integrity•Safety•Durability
Performance:•Capability•ReliabilityX
“Serviceability”
Not the same as written down value

15
Condition Grading – General Approach1. No faults and negligible deterioration
2. Minor faults &/or observed deterioration, neither affecting performance
3. Faults and deterioration observed but not significantly affecting performance currently or in the short-term
4. Significant faults observed or developing that are likely to affect performance in the short-term (requires refurbishment/replacement )
5. Critical condition preventing required performance or unserviceable (requires immediate replacement)

16
Performance Grading – General Approach1. Specified and designed to modern standards, fully
capable of delivering the required service with no reliability issues
2. Designed to outdated standards &/or exhibits minor reliability issues but provides the required service
3. Faults with design and efficiency of operation that do not hamper normal operations
4. Exhibits reliability or capability problems that impact on normal operations
5. Fails to meet capability or reliability requirements rendering the asset incapable of delivering the necessary service

17
“Serviceability” Grading – General Approach
2520151055
201612844
15129633
1086422
543211
54321
Condition
Pe
rform
ance

18
Serviceability Grade 1

19
Serviceability Grade 3

20
Serviceability Grade 5

21
Serviceability Grade 5 - Structures

22
Management Information
Measurement• Of asset “serviceability”;• of customer service and• measurement of costsAnalysis• Of trends and• performance against internal targetsManagement• Action based on measurement and analysis

23
Management information
GISWORKS
MANAGEMENT
CUSTOMER SERVICE
ACCOUNTING
Asset ManagementPlanning
Contacts &
complaints
Asset data,
performance and
analysis
Loca
tions
,P
ress
ure,
inte
rrup
tions
Operations and maintenance data
Ope
ratio
ns a
nd
mai
nten
ance
dat
a
Unit costs

24
Examples 1 “Whole Life Costs”
• Used to when comparing investment options
• Ensures that OPEX implications of CAPEX solutions are properly accounted for− Example: Skenderaj treatment plant

25
“Whole-Life Costs”
The full cost of ownership over the life of the asset (normally expressed as net present values):
Capital Operating DowntimeMaintenance Disposal
Including:
SpecificationDesignInstallationCommissioningAcquisition
Including:
LabourMaterialsEnergyServices
Including:
LabourMaterialsRefurbishment
Including:
LossesCost oftemporaryreplacement
Including:
Residual valuelessdisposal cost
+ + + +

26
Examples 2 - Justification
Water main renewal schemes• Practical application of AMP
principles• Produces transparent justification
for projects• Facilitates ranking by importance

Application of a Water Mains Renewal Policy
Collect failure data
Allocate failures to mains
Calculate failure rates per main
Allocate customersto mains
Collect customerdata
Collect Cost Data
Calculate UnitRates (€/m)
Calculate impact
(Failures * Customers/year)
Calculate Remedial Cost for Each Main
Rank Mains by €/(Failures*Customers/year)
Schemes Justified by Service ImprovementAnd Value For Money
G I S Accounting
Business
Plan
A M P
27

28
Aspects of Asset Management
Summary
1. Customer service is the primary objective
2. Why we need to manage assets in a formal way to achieve this
3. Why measurement is so important4. “Serviceability” as a means of selecting
assets for replacement5. Examples of how AMP principles can be
applied in practice

29
Break

30
Asset Management and Business Plans
Contents:
1. AMP within the business process2. Business plans3. Regulatory reporting

31
AMP as part of the business process
Asset management planning need not be complicated
− It’s not rocket science
− Simple “common sense” pragmatic
− Systematic
− Integrated into day-to-day activity
− No need to be computerised

32
Key Elements of AMP
Asset Management Planning
Business Plans
Obligations
Requirements & Standards
Customer Service Standards
Risks
Strategic Planning
Risk Assessment
Climate Change
Assets
Inventory
Asset Value (RCV)
Activity & Cost Data
“Serviceability”
Financial Support
Government Subsidies
Donor Funding
Commercial Loans

33
Key elements of AMP
Asset Management Planning
Business Plans
Obligations
Requirements & Standards
Customer Service Standards
Risks
Strategic Planning
Risk Assessment
Climate Change
Assets
Inventory
Asset Value (RCV)
Activity & Cost Data
“Serviceability”
Financial Support
Government Subsidies
Donor Funding
Commercial Loans
34
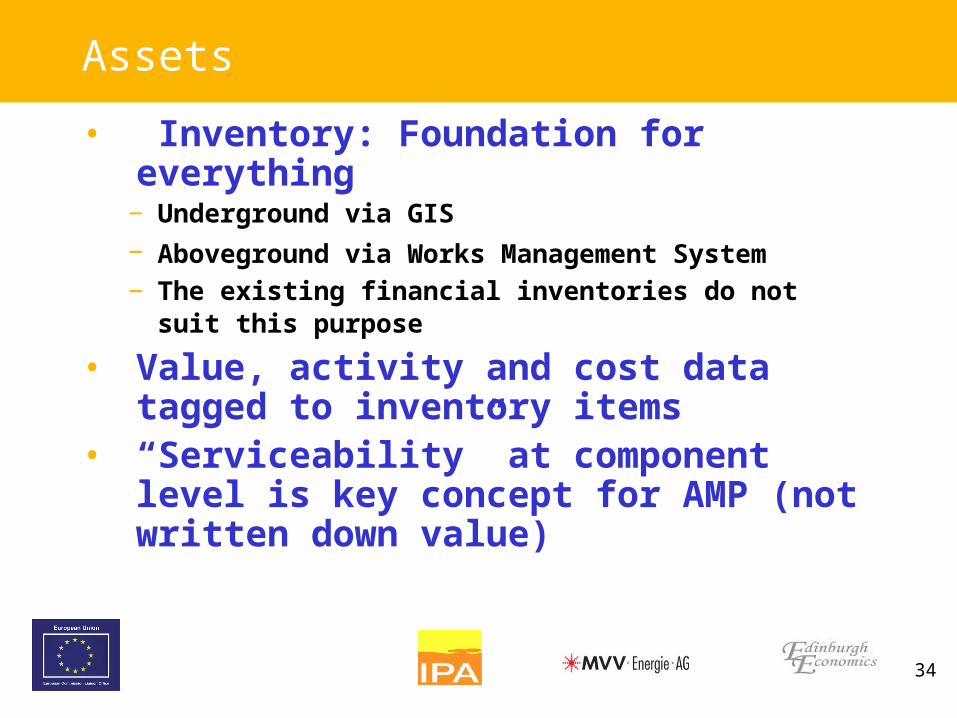
Assets
• Inventory: Foundation for everything− Underground via GIS
− Aboveground via Works Management System − The existing financial inventories do not suit this
purpose
• Value, activity and cost data tagged to inventory items
• “Serviceability” at component level is key concept for AMP (not written down value)

35
Key elements of AMP
Asset Management Planning
Business Plans
Obligations
Requirements & Standards
Customer Service Standards
Risks
Strategic Planning
Risk Assessment
Climate Change
Assets
Inventory
Asset Value (RCV)
Activity & Cost Data
“Serviceability”
Financial Support
Government Subsidies
Donor Funding
Commercial Loans

36
Obligations
Government Policy & Directives
WWRO Requirements:• Interpret Govt. policy and directives
Customer Service Targets:• Crucial to the process• Demonstrate improvement
Operational Targets:• Closely linked to obligations

37
Key elements of AMP
Asset Management Planning
Business Plans
Obligations
Requirements & Standards
Customer Service Standards
Risks
Strategic Planning
Risk Assessment
Climate Change
Assets
Inventory
Asset Value (RCV)
Activity & Cost Data
“Serviceability”
Financial Support
Government Subsidies
Donor Funding
Commercial Loans

38
Risks
Strategic Planning• Accounts for present and future risks• Forecasts performance and service over
the planning period• Looks forward at least 5 years• Includes:
− Climate change;− Supply / demand balance etc.

39
Key elements of AMP
Asset Management Planning
Business Plans
Obligations
Requirements & Standards
Customer Service Standards
Risks
Strategic Planning
Risk Assessment
Climate Change
Assets
Inventory
Asset Value (RCV)
Activity & Cost Data
“Serviceability”
Financial Support
Government Subsidies
Donor Funding
Commercial Loans

40
Financial Support
• Rational project justification is increasingly required by government, donors and banks to secure funding.
• Performance measurement linked to demonstrable improvements in customer service will be key drivers for successful proposals
− Links between investment and improvements in service will enhance applications for grants and loans
− Future loan requests to banks such as the present EBRD application will require project justification which AMP can provide

41
Key elements of AMP
Asset Management Planning
Business Plans
Obligations
Requirements & Standards
Customer Service Standards
Risks
Strategic Planning
Risk Assessment
Climate Change
Assets
Inventory
Asset Value (RCV)
Activity & Cost Data
“Serviceability”
Financial Support
Government Subsidies
Donor Funding
Commercial Loans

42
Business Plans
• Required by each company’s Board of Directors to authorise strategy and expenditure over the planning period
• Show how companies propose to meet their obligations and mitigate risks in a financially sustainable way
• Provide forecasts of measurable performance and benefit over the planning period
• Used by the Regulator (WWRO) to enable tariffs to be set
− In the future WWRO will be issuing guidelines on format and content to ensure consistency across companies
− Clarity and transparency are important
• Provide a basis for annual reporting and performance monitoring

43
Overview of Business PlansStatement of strategy
Impact on averagebills
Service commitments
Key drivers fortariff change
Summary ofExpenditureneeds

44
“Monitoring Plans”
Once tariffs are set:
• Companies can produce “monitoring plans” that state the service improvements that will be derived from investment
− Statements of investments (what and when)
− Statements of service improvements
• This allows customers and WWRO to monitor progress against business plan commitments
• If these are not met then the Regulator can ensure that customers get their money back through the tariff review process

45
Example of Monitoring Plan
Service forecasts
Sales &Supply/demand forecasts
Asset serviceability
Definedoutputs

46
Regulatory Reporting
Asset Performance• Measures performance against obligations
• Identifies trends over time
• Supports tariff submissions
• Demonstrates benefit to customers− Increases willingness to pay
Provides a means of demonstrating an adequate level of capital maintenance investment
• Companies produce annual reports to the Regulator on performance

47
WWRO performance Reports
• WWRO produces a report each year
• This has been made public in last 2 years
• Suggested additions:− Underground asset “serviceability” (failures)
− Aboveground asset “serviceability” (% by grade)
− Numbers of customers subject to poor pressure or less than continuous supply
− Introduction of confidence grading for data
48
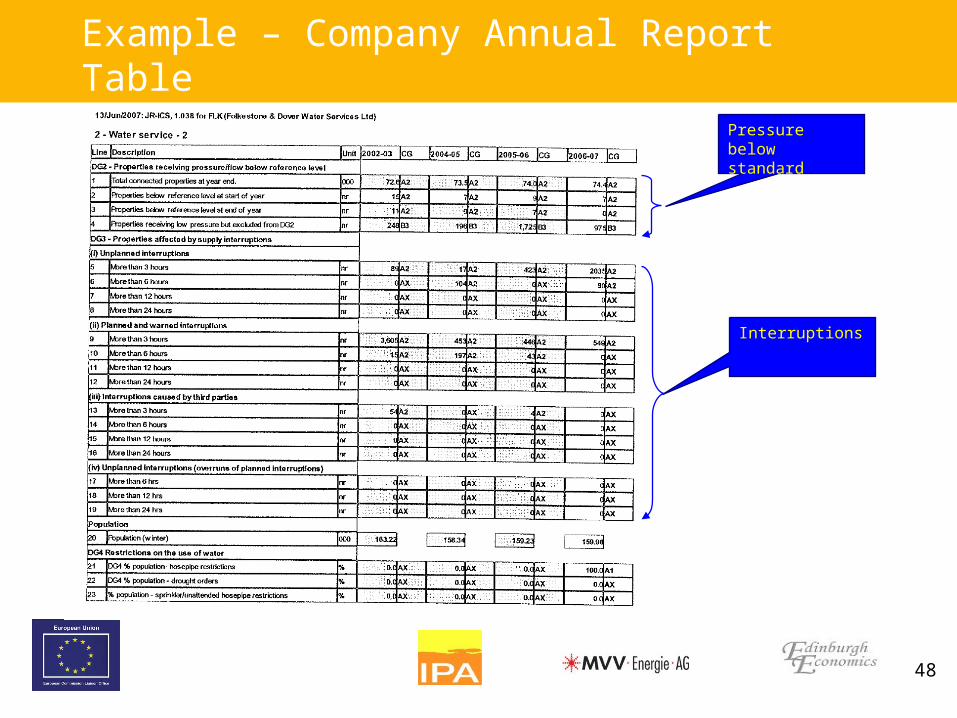
Example – Company Annual Report Table
Pressure belowstandard
Interruptions

49
Reporting Water Main “Serviceability”
Tendring Hundred Water Services - Water Main Serviceability
0
20
40
60
80
100
120
140
1997 1998 1999 2000 2001 2002 2003 2004 2005 2006 2007 2008 2009 2010 2011 2012 2013 2014 2015
Reporting Year
Bu
rsts
/1,0
00
km
/yr
DETERIORATING
IMPROVING
REPORTEDFAILURE RATE
UPPER STABLE BAND
LOWER STABLE BAND

50
Public InformationJune Return 2007 Public Domain Folkestone Boards Overview, Table A Water Service - Key Outputs and Service Delivery
Description Units 2002-03 2003-04 2004-05 2005-06 2006-07
SERVICE AND PERFORMANCE
1 DG2 Percentage of properties receiving low water pressure % 0.02 0.01 0.01 0.01 0.00 2 DG3 Overall performance score nr 0.00 0.00 0.14 0.00 0.11 3 DG4 % population - hosepipe restrictions % 0.0 0.0 0.0 0.0 100.0 4 DG4 % population - drought orders % 0.0 0.0 0.0 0.0 0.0 5 DG6 Percentage dealt with within 5 working days % 100.0 100.0 100.0 98.8 96.0 6 DG7 Percentage dealt with within 10 working days % 100.0 100.0 100.0 98.5 100.0 7 DG8 bills for metered customers - performance % 100.0 100.0 100.0 100.0 100.0 8 DG9 percentage of calls abandoned % 1.6 1.9 1.9 1.8 1.8 9 DG9 percentage of calls receiving the engaged tone % 0.5 0.6 0.5 0.9 0.0 10 Text 0.00 11 Text 0.00 DRINKING WATER QUALITY OUTPUTS
12 Percentage mean zonal compliance with drinking water regulations % 99.95 99.95 13 Percentage mean zonal compliance with PCV for iron at the tap % 100.00 97.92 14 Water treatment works improvements nr 0.00 0.00 15 Distribution mains renovated for quality km 0.70 0.00 16 Distribution mains cleaned for quality km 0.00 0.00 ENVIRONMENTAL WATER OUTPUTS
17 Environmental impact - number of investigations nr 0 0 18 Environmental impact - number of options appraisals nr 0 0 19 Other environmental improvements nr 0 0 SERVICEABILITY
20 Mains bursts per 1000km nr 110 126 103 80 70 21 Water treatment work coliform non-compliance % 0.00 0.06 0.00 0.06 0.06 22 Water infrastructure band STABLE STABLE STABLE IMPROV'G IMPROV'G 23 Water non-infrastructure band STABLE STABLE STABLE STABLE STABLE DEFINED OUTPUTS FOR MAINTAINING BASE SERVICES
24 Water infrastructure (1) Text None 25 Water infrastructure (2) Text None 26 Water non infrastructure (1) Text None 27 Water non infrastructure (2) Text None
CUSTOMER SERVICEPERFORMANCE
WATER QUALITYPERFORMANCE
ASSETPERFORMANCE

51
AMP and Business Plans
Summary:
• Asset Management Planning is simple• We have examined elements of AMP within the
business planning process• Business plans are required equally by
companies and WWRO• Business plans provide basis for reporting and
demonstrating benefits to customers• Annual reporting should identify asset
performance as well as customer service trends
52
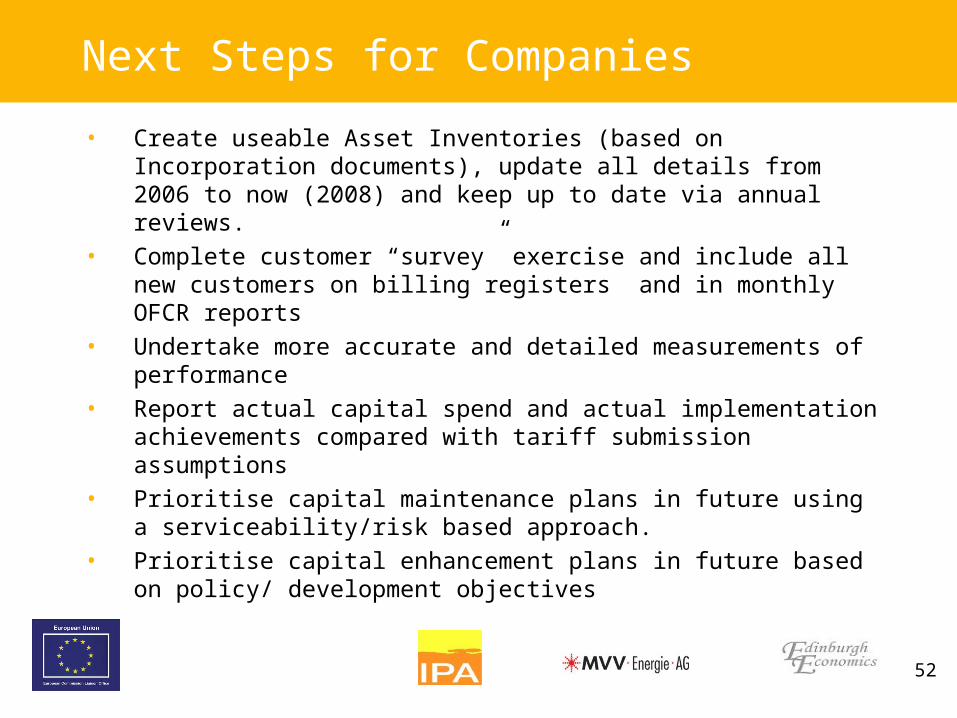
Next Steps for Companies
• Create useable Asset Inventories (based on Incorporation documents), update all details from 2006 to now (2008) and keep up to date via annual reviews.
• Complete customer “survey” exercise and include all new customers on billing registers and in monthly OFCR reports
• Undertake more accurate and detailed measurements of performance
• Report actual capital spend and actual implementation achievements compared with tariff submission assumptions
• Prioritise capital maintenance plans in future using a serviceability/risk based approach.
• Prioritise capital enhancement plans in future based on policy/ development objectives

53
Next Steps for WWRO
• Update OFCR to be more responsive to new tariff regime by including further indicators e.g. monthly reporting of mains burst rate (bursts/km/yr)
• Increase customer focus by expressing measures as numbers of customers affected where possible (e.g. continuity of supply)
• Develop Annual Reporting guidelines for companies including:− Monitoring actual compared to tariff submission for capital spend
and operating costs via annual reports by companies
• Prepare regulatory accounting system guidelines for companies
• Prepare revised Business Plan contents requirements for
water companies to support future tariff applications
54
The End
THANK YOU FOR LISTENING

55
Annual Asset Report

56
Annual Water Balance Report