CEEP Working Paper Series Working Paper Number 18 August 2021

Working Paper No. 880
The Great Recession and Racial Inequality: Evidence from Measures of Economic Well-Being*
by
Thomas Masterson,† Ajit Zacharias, Fernando Rios-Avila, and Edward N. Wolff Levy Economics Institute of Bard College
January 2017
Draft Only: Do Not Cite
* We gratefully acknowledge the financial support from the Alfred P. Sloan Foundation for the production of some of the estimates used in this paper. The estimates used in the analysis in this paper were partly the product of the work of Selçuk Eren, Melissa Mahoney, and Hyunsub Kum. Travis Bostick and Devon Scarlett contributed research assistance. † Corresponding author: [email protected]
The Levy Economics Institute Working Paper Collection presents research in progress by Levy Institute scholars and conference participants. The purpose of the series is to disseminate ideas to and elicit comments from academics and professionals.
Levy Economics Institute of Bard College, founded in 1986, is a nonprofit, nonpartisan, independently funded research organization devoted to public service. Through scholarship and economic research it generates viable, effective public policy responses to important economic problems that profoundly affect the quality of life in the United States and abroad.
Levy Economics Institute
P.O. Box 5000 Annandale-on-Hudson, NY 12504-5000
http://www.levyinstitute.org
Copyright © Levy Economics Institute 2017 All rights reserved
ISSN 1547-366X

1
ABSTRACT
The Great Recession had a tremendous impact on low-income Americans, in particular black and
Latino Americans. The losses in terms of employment and earnings are matched only by the
losses in terms of real wealth. In many ways, however, these losses are merely a continuation of
trends that have been unfolding for more than two decades. We examine the changes in overall
economic well-being and inequality as well as changes in racial economic inequality over the
Great Recession, using the period from 1989 to 2007 for historical context. We find that while
racial inequality increased from 1989 to 2010, during the Great Recession racial inequality in
terms of the Levy Institute Measure of Economic Well-Being (LIMEW) decreased. We find that
changes in base income, taxes, and income from nonhome wealth during the Great Recession
produced declines in overall inequality, while only taxes reduced between-group racial
inequality.
Keywords: LIMEW; United States; Great Recession; Race; Distribution of Wealth; Distribution
of Income
JEL Classifications: D31, D63, I31, J15

2
INTRODUCTION
Economic disparities between racial groups in the United States have in some ways undergone
profound transformations over the last half-century, while in other ways things remain the same.
The Great Recession and especially the housing bubble, the collapse of which precipitated the
financial crisis and recession, had decidedly unequal effects on different racial groups. In this
paper we trace racial economic inequality over the last two decades, with particular emphasis on
the period between 2007 and 2010. This period includes the official beginning and end of the
Great Recession (measured as usual in terms of economic growth), the election of the first Black
President of the United States, and the enactment of a very large fiscal stimulus aimed at
reversing the downturn in employment.
Unlike the previous two recessions, the Great Recession was long (lasting one-and-a-half years)
and deep (with real gross domestic product per capita falling by 5.5 percent; see figure 1).
Recovery has been slow as well. It took over four years to recover to the level achieved in the
fourth quarter of 2007. Four years after both the 1990 and 2000 recessions, the real GDP per
capita had grown by more than 8 percent; however, real GDP per capita is not necessarily the
best indicator of the trend in household economic well-being. Changes in employment are much
more important for individual households than overall economic growth.

Figure 1.
Source: USFRED, Fede
As we ca
prerecess
October o
recession
participat
percent in
since the
the unem
October 2
much of
populatio
employm
Real GDP p
S Bureau of Econeral Reserve Ban
an see in figu
sion level. In
of 2009 at 1
n (June 2009
tion also cha
n November
official end
mployment ra
2013. In July
this decline
on (Aaronson
ment rate, wh
per Capita, 19
nomic Analysis, nk of St. Louis (
ure 2, below
n December
0 percent, de
9), and has si
anged little b
r 2007 and 6
d of recession
ate: the parti
y 2015, it wa
may be stru
n et al. 2014
hich had been
989–2015
Real Gross Domhttps://research.
, the headlin
2007, US un
eclined only
ince dropped
between the
65.7 in June 2
n delivers a c
cipation rate
as little chan
ctural, with
4). Whatever
n 63 percent
3
mestic Product pstlouisfed.org/fr
ne unemploy
nemploymen
y slightly to 9
d to 5.3 perc
official begi
2009). Howe
contrasting p
e fell drastica
nged at 62.6
much of tha
r the reason f
t in Novemb
per Capita [A939red2/series/A939
yment rate ha
nt stood at 4
9.5 percent b
ent by July 2
inning and e
ever, the tren
picture to tha
ally, reachin
percent. Rec
at coming fro
for the declin
ber 2007, wa
9RX0Q048SBEA9RX0Q048SBEA
as still not re
.7 percent. It
by the officia
2015. Labor
end of the rec
nd in the par
at suggested
ng a level of
cent analysis
om the aging
ne in partici
as 59.4 perce
A], retrieved fromA/), August 7, 2
ecovered to i
t peaked in
al end of the
r force
cession (66
rticipation ra
d by the trend
62.8 percen
s suggests th
g of the
pation, the U
ent by the sec
m 015.
its
e
ate
d in
nt in
hat
US
cond

quarter o
economic
Figure 2.
Source: USof St. LouisLabor Force(https://rese
Of course
below, pr
consisten
rising du
remainin
of 2015. To t
c well-being
US Unemplo
S Bureau of Labo(https://research
e Participation Rarch.stlouisfed.o
e, if we inclu
resents the e
nt gap betwe
uring and sho
ng at or abov
he extent tha
g, this declin
oyment and
or Statistics, Civh.stlouisfed.org/
Rate [CIVPART]org/fred2/series/C
ude race, the
employment-
en Black ind
ortly after rec
e 5 percent f
at labor inco
e in employm
Labor Force
vilian Unemploymfred2/series/UN], retrieved fromCIVPART/), Au
e employmen
-population r
dividuals and
cessions and
for most of t
4
ome is an imp
ment will ha
e Participatio
ment Rate [UNRRATE/), August
m FRED, Federal ugust 7, 2015.
nt picture be
rates by race
d everyone e
d eventually
the last two d
mportant dete
ave a negativ
on Rate, 1989
RATE], retrievedt 7, 2015. US Bu Reserve Bank o
ecomes more
e over the la
else. The siz
falling again
decades.
rminant of h
ve impact.
9–2015
d from FRED, Fureau of Labor Sof St. Louis
e complicate
ast two decad
ze of the gap
n, but it neve
household
Federal Reserve BStatistics, Civilia
ed. Figure 3,
des. There is
is cyclical,
er disappear
Bank an
s a
s,

5
Figure 3. Employment-Population Ratio by Race, 1989–20161
Source: US Bureau of Labor Statistics, Employment-Population Ratio [LNS12300003, LNS12300006, LNS14000009, and LNU12332183], retrieved from Bureau of Labor Statistics (http://www.bls.gov/data/#employment), July 22, 2016.
Interracial disparities have moved in different directions in recent years. Despite the dismal gap
in employment experience, income gaps between White and Nonwhite households have
diminished over time. Wealth gaps, however, remain almost unchanged. Public expenditures—
both direct transfers and spending on other services, such as education or health—have had an
important role in ameliorating racial disparities. In order to accurately measure all these changes,
the choice of the measure of economic well-being is critical in attempting to assess changes in
racial disparities, as well as the impact of public policy changes over time.
Gross money income (MI) is the official measure of household economic well-being in the
United States. But because it omits other sources of income, such as noncash transfers (which
1 Seasonally adjusted.
40
45
50
55
60
65
70Qtr1 1989
Qtr1 1990
Qtr1 1991
Qtr1 1992
Qtr1 1993
Qtr1 1994
Qtr1 1995
Qtr1 1996
Qtr1 1997
Qtr1 1998
Qtr1 1999
Qtr1 2000
Qtr1 2001
Qtr1 2002
Qtr1 2003
Qtr1 2004
Qtr1 2005
Qtr1 2006
Qtr1 2007
Qtr1 2008
Qtr1 2009
Qtr1 2010
Qtr1 2011
Qtr1 2012
Qtr1 2013
Qtr1 2014
Qtr1 2015
Qtr1 2016
White Black Hispanic Asian

6
have become increasingly important over time) and because it is a pretax income measure (thus
ignoring the distributional impact of tax policy), MI does not adequately reflect households’
command over, or access to, the products and services available in a market economy over a
given period of time. A broader measure is needed.
The Levy Institute Measure of Economic Well-Being (LIMEW) is just such a measure (see table
1 for a comparison between the LIMEW and MI). In addition to including taxes and noncash
transfers, it treats wealth as an economic resource, rather than using property income reported in
the survey. We annuitize a household’s nonhome net worth and assign an imputed rent to home
value. We refer to the annuitized value of nonhome assets minus the annuitized value of all debt
other than mortgage debt as income from nonhome wealth and the difference between imputed
rent and the annuitized value of mortgage debt as income from home wealth. The LIMEW also
includes the value of publicly provided services and household production. Thus, the LIMEW is
a much more comprehensive measure of household economic well-being than the official
measures.
Table 1. Comparison of MI and LIMEW
LIMEW
Money income (MI)
Less: Property income and government cash transfers
Equals: Base money income
Plus: Income from wealth
Annuity from nonhome wealth
Imputed rent on owner‐occupied housing
Less: Taxes
Income taxes a
Payroll taxes a
Property taxes a
Plus: Cash transfers a
Plus: Noncash transfers a,b
Plus: Public consumption
Plus: Household production
Equals: LIMEW Note: (a) Aligned with the NIPA estimates. (b) The government-cost approach is used.

7
Racial economic inequality has generated a wide range of research in economics, sociology, and
other social sciences. Much of the literature on racial economic inequality focuses on disparities
in labor market outcomes (Altonji and Blank 1999). The bulk of the early literature studying
economic disparities between races focused on earnings and income and took a critical stand on
the question of human capital differences as the primary source for racial disparity (Wright 1978;
Smith and Welch 1979; Darity Jr. 1982; Kaufman 1983). This thread in the study of racial
economic inequality ultimately addresses inequalities in household income. While money
income is important, the LIMEW, as a more comprehensive measure of household economic
well-being, is better suited to examining the relative impact of money income, wealth,
government policy, and household production on racial economic inequality, as well as the
impact of changes in these components over time.
Some early attention was paid to wealth inequality (Parcel 1982; Brimmer 1988; Blau and
Graham 1990; Wolff 1992). Black Wealth/White Wealth (Oliver and Shapiro 1995) focused on
wealth disparities, while outlining the root causes of wealth inequality in racist policies and
institutions. A more recent edition (Oliver and Shapiro 2005) makes the case that wealth
inequality had not diminished in the flowering of financial wealth that occurred in the previous
decades. However clear it may be that this wealth disparity is a disadvantage, the magnitude of
this disadvantage in comparison to that deriving from disparities in money income and other
sources of household economic well-being remains unclear. Thus a measure of economic well-
being that incorporates wealth directly, such as the LIMEW, gives us a better picture of the
impact of racial wealth inequality on overall economic inequality. In terms of measuring wealth
disparity by race category, the Survey of Consumer Finances (SCF, the source of the wealth data
in the LIMEW) does have limitations, including the oversampling of White households implicit
in the oversampling of wealthy households and consequent undersampling of Nonwhite
households, as well as only collecting race information for the reference person (Leigh 2006).
This is an important caveat for the analysis here of racial wealth inequality and its contribution to
the inequality of well-being.
Less effort has been expended in examining the impact of public expenditures on racial
inequality in household economic welfare. The largest components of government transfers are

8
Social Security, Medicare, and Medicaid, most of which affect the elderly. As far as Social
Security is concerned, as originally created in the 1930s, it did not cover agricultural workers or
domestic servants, which left out many African-American and Latino/a workers until reforms
included all workers other than agricultural workers. In addition, greater rates of working “under
the table” for African-American and Latino/a workers means that earnings inequalities translate
into even greater inequalities in Social Security income in retirement (Hogan, Kim, and Perrucci
1997). Although Medicare is universally available for the elderly, this does not necessarily imply
inequality reduction. The quantity of care for Nonwhites appears to be lower than for Whites
(Gornick et al. 1996). The quality of care for Nonwhites under the Medicare Managed Care
programs appears to be worse than that for Whites (Schneider, Zaslavsky, and Epstein 2002).
Medicaid is no worse than private insurance in terms of racial equity, but this is faint praise:
racial inequality in access to health care is endemic (Hall 1998; Lillie-Blanton et al. 2009). In
terms of income support programs for low-income households, the impact of the Earned Income
Tax Credit has been studied, and although it has been shown to at least reduce poverty for
African-American women (Ajilore 2008), its impact on racial inequality is less clear. The largest
component of public consumption (i.e., publicly provided services) is education. Spending on
education is thought to be unequal along racial lines. For example, in urban areas, segregation
leads to unequal spending on education (La Ferrara and Mele 2006). While all of these studies
are important in illuminating pieces of the racial inequality puzzle, the LIMEW brings all of
these components together into a comprehensive measure that we can then use to determine their
differential impacts on racial inequality at several points over the last fifty years, as well as on
the change in racial inequality over time.
In previous work (Wolff, Zacharias, and Masterson 2012), we outlined broad trends in economic
well-being between 1959 and 2007. In this paper, we examine trends in differences in economic
well-being in the United States by race and focus on the period between 1989 and 2010, with
emphasis on changes during the Great Recession (2007 to 2010). Due to data limitations, only
comparisons of non-Hispanic Whites (hereafter referred to as “Whites”) and Nonwhites
(everyone other than non-Hispanic Whites) are possible for the LIMEW for many years in the
9
series of estimates.2 The method of statistical matching (Kum and Masterson 2008) used to
assemble the LIMEW data set is sensitive to the representativeness of the source data sets. So,
for example, the 1989 LIMEW data set comprises information from the 1990 March supplement
to the Current Population Survey (CPS) and the 1989 SCF. Neither data set contains sufficient
numbers of records to use detailed race and ethnicity in the matching process, so that only White
and Nonwhite racial categorizations were used. As a result, the LIMEW data set for 1989 can
only claim to accurately represent the distribution of economic well-being among Whites and
Nonwhites. While we report trends over the whole period by more detailed racial groupings, the
most confidence in these trends is reserved for the estimates from 2004 and onwards. Some of
the components of LIMEW (for example, government cash transfers) are amenable to
comparison between Whites, Blacks, Hispanics, and Others for all years, since they are
contained in a single data set that is nationally representative of these racial groups.
The remainder of the paper is organized as follows. The next section details trends in the
distribution of wealth overall and by race between 1983 and 2013, using SCF data. The
following section traces trends in economic well-being and its components using LIMEW and
household income. The fourth section analyzes trends in inequality by source of income/well-
being and by racial categories. A final section summarizes the findings.
RACE AND WEALTH
Although most of the paper will focus on the impact of the Great Recession on racial inequality
using broader measures of economic well-being, wealth is worth considering first for two
reasons. First, the last two economic downturns in the United States have been the direct result of
the bursting of asset bubbles, first in 2000 with the bursting of the high–tech stock market bubble
and second in 2007 with the bursting of the housing bubble and the ensuing financial collapse.
These recessions thus had important implications for the distribution of wealth. Secondly, the
distribution of wealth has been more on the minds of many economists since the publication of
2 Nonwhites includes households headed by Asian, Black, and Hispanic people.

10
Thomas Piketty’s Capital in the 21st Century. The discussion of the book even made the
mainstream media for a short while. As Piketty documents, the distribution of wealth has grown
more concentrated everywhere since the 1970s and nowhere more so than in the United States
(Piketty 2014). Therefore we begin with an examination of overall trends in the distribution of
wealth over the last three decades and then move on to examine the changes in the racial
distribution of wealth.
To begin with the evolution of the concentration of wealth3 in the United States, figure 4 (below)
traces the evolution of the share of the top decile of households by wealth since 1983 using data
from the SCF.4 As we can see, there has been a (mostly) slow increase of the top decile’s share.
The share of the total household net worth held by the top decile of households was 69 percent in
the 1980s and began increasing in the mid-1990s. It stood at 73 percent in 2007 and jumped to
77 percent in the aftermath of the Great Recession, with the largest increase occurring between
2007 and 2010.
3 Our definition of wealth consists of: homes, equity in real estate and (noncorporate) business, liquid assets, financial assets, retirement assets (defined-contribution pension plans), mortgage debt, and all other debt (mainly consumer debt). 4 The 1983 survey also oversampled the wealthiest households, though the sample design was different than in later years.

11
Figure 4. Shares of Net Worth of the Top 10 Percent of Households by Net Worth, 1983–2013
The bottom 90 percent of households have borne the brunt of the increased concentration of
wealth in the United States. The share of the bottom 50 percent of households was between 1 and
3 percent of total wealth up until 2007. After the Great Recession, their share is zero (in fact, in
2013, it is slightly negative). The share of the 50th to the 90th percentile, Piketty’s “middle
class,” had decreased from 29 percent in the 1980s to about 25 percent in 2007. The Great
Recession reduced their share to just under 23 percent by 2013. So the increase in the share of
the top decile had come mostly from the middle before the Great Recession, but afterwards it
was drawn from both the middle and the bottom.
To tie this analysis to the question of racial inequality, we can first observe that the top 10
percent of households by net worth is almost exclusively White (figure 5 shows the distribution
64%
66%
68%
70%
72%
74%
76%
78%
1983 1989 1992 1995 2001 2004 2007 2010 2013
12
of households in the top 10 percent of households by race).5 White-headed households make up
no less than 89 percent of the top 10 percent in any of the survey years. As we can see, Black and
Latino households make up very small portions of the top 10 percent (between 1 percent and 4
percent), while the share of Others (primarily Asian-headed households) has risen to more than 6
percent. Over the same period, the share of households headed by Whites in the overall
population dropped from 82 percent to 70 percent. If we look at the top 1 percent, the picture
does not get significantly more unequal in terms of representation. Of course, this pattern is also
reflected in the pattern of racial inequality in terms of net worth as well.
5 The racial categories employed here and throughout the paper refer to the race of the household reference person. The reference person is identified differently in the Federal Reserve’s Survey of Consumer Finances (SCF) used for the analysis of wealth in this section and the Bureau of Labor Statistics’ Annual Social and Economic Supplement (ASEC) used as the basis for the LIMEW estimates in the later sections of the paper. In the SCF, the reference person is the household head of the primary economic unit (PEU), “taken to be the single core individual in a PEU without a core couple; in a PEU with a central couple, the head is taken to be either the male in a mixed-sex couple or the older individual in the case of a same-sex couple” (Federal Reserve Board 2014). In the ASEC, the reference person is the householder, defined as “the person (or one of the people) in whose name the housing unit is owned or rented (maintained) or, if there is no such person, any adult member, excluding roomers, boarders, or paid employees. If the house is owned or rented jointly by a married couple, the householder may be either the husband or the wife” (US Census Bureau 2015). In the process of matching the two surveys for the creation of the LIMEW data set, we take these differences into account.

13
Figure 5. Race of Households in the Top 10 Percent of the Wealth Distribution, 1983–2013
Looking at mean household net worth by race over the last three decades, we see no
improvement in the relative position of Black and Latino households compared to White
households (figure 6).6 If anything, we see a slight deterioration. While Latino households had
improved their net worth relative to White households—from 16 percent in 1989 to 26 percent in
2007—in the aftermath of the Great Recession, mean Latino net worth has dropped to 15 percent
that of Whites. For Black households, 1992 was the peak year when their average net worth was
at 20 percent that of the White households. The ratio fell steadily throughout the 1990s, reaching
14 percent in 2001. By 2007, the ratio had recovered to nearly 19 percent, but the Great
Recession pushed it back down to 12.4 percent by 2013. So in 2013, White households had, on
the average, $8 in net worth for every dollar Black households had on the average. The reason
the gap widened between 2007 and 2013 is that despite a 12 percent drop in average net worth
6 If we look at the ratio of median net worth of Nonwhite to White households, we see that Black households’ median net worth was at 1 or 2 percent of White median net worth for every year of the SCF. In 2013, however, that ratio stood at only 0.2 percent, the lowest measured by this survey. Median Hispanic net worth as a percentage of White median net worth has usually been even lower than Black net worth, but not by much. The median net worth of Other households as a share of White median net worth has fluctuated quite a bit: less than 10 percent in 2001, it climbed to 24 percent in 2004, and fell to 10.3 percent in 2013.
80%
82%
84%
86%
88%
90%
92%
94%
96%
98%
100%
1983 1989 1992 1995 2001 2004 2007 2010 2013
White Black Latino Other

among W
divide ne
differenc
years) are
Latino ho
encourag
of the 19
percent a
Figure 6. Race, 198
Overall, w
househol
the impo
0%
20%
40%
60%
80%
100%
120%
140%
White househ
et worth into
ce between th
e larger than
ouseholds). T
ging. Their ra
80s, decreas
and 85 perce
Ratio of Me83–2013
when Black
lds, for that m
rtance of thi
1983
1989
1992
1995
H
holds, averag
o home and n
he two being
n those for no
The picture f
atio of avera
sed steadily t
nt. Of cours
ean Home W
and Hispani
matter) racia
is in terms of
2001
2004
2007
2010
Home
ge Black net
nonhome we
g that home w
onhome wea
for Other ho
age net worth
to under 70 p
e, there is a
ealth, Nonho
ic household
al wealth ine
f its impact o
2010
2013
1983
1989
1992
Black
14
worth shran
ealth, we see
wealth ratios
alth (always
ouseholds, pr
h to White h
percent by 2
great deal of
ome Wealth,
ds are compa
equality since
on overall ho
1992
1995
2001
2004
Non‐Home
Hispanic
nk even mor
similar dyn
s (between 2
less than 20
redominantly
households g
2004, and the
f diversity w
and Net Wo
ared to Whit
e the 1980s
ousehold eco
2007
2010
2013
1983
Other
e, by 42 perc
namics, with
20 and 40 pe
0 percent for
y Asian, has
grew to 90 pe
en has varied
within the “O
orth to White
te household
has increase
onomic well
1983
1989
1992
1995
2001
Net W
cent. When
the notable
ercent for mo
Black and
s been more
ercent by the
d between 82
Other” catego
e Households
ds (or to Oth
ed. We will s
l-being when
2001
2004
2007
2010
Worth
we
ost
e end
2
ory.
s by
er
see
n we
2013

15
analyze trends in racial inequality with the LIMEW in the following sections. First we will
compare trends in racial inequality of the LIMEW to that of MI, then move on to look in more
detail at the changes in the LIMEW inequality by race.
LIMEW AND MONEY INCOME
Turning now to the impacts of the Great Recession on racial inequality in household economic
well-being, we first look at the overall trends in household economic well-being for the two
decades between 1989 and 2013.7 Table 2 provides median values for the LIMEW and
household income (MI). Of course, by construction, the LIMEW is larger than MI. The LIMEW
also has a different trajectory than MI over this period (and earlier periods as well). While both
the LIMEW and MI grew during the 1990s, the LIMEW grew during the 2000s as well, while
MI declined to below its 1989 level. During the 1990s, the median LIMEW grew twice as fast as
MI, while in the 2000s, the median LIMEW stagnated during the recoveries and grew during the
recession periods; median MI has done the opposite.8 For household income, the explanation is
simple: the bulk of MI is earned income and earned income tends to fall during recessions. In
addition, real wages have been stagnant, reducing the growth during recoveries. To see the
reasons for the different trend in the LIMEW, below we decompose the changes by components
of the LIMEW.
Table 2. Median Economic Well-Being and Work, 1989–2010 (2013 US$)
1989 2000 2004 2007 2010
Measures
LIMEW 83,100 92,122 94,905 97,400 99,114
MI 54,340 56,820 54,527 56,178 52,632
In table 3, the changes in the mean value of the LIMEW for the middle quintile are broken down
into the contributions of each component. We use the mean of the middle quintile since the
7 Benchmark estimates of the LIMEW for the United States have been prepared for the years 1959, 1972, 1982, 1989, 1992, 1995, 2000, 2004, 2007, 2010, and 2013. We use the years 1989, 2000, 2004, 2007, and 2010 to give a sense of the recent historical context for the Great Recession. 8 These trends are evident in the equivalence scale–adjusted measures as well.

16
median cannot be decomposed in this way. The mean LIMEW of the middle quintile is within
one-third of 1 percent of the median in each of our benchmark years. Comparing the changes in
the 1990s to those in the 2000s (the first and fifth columns, respectively), we see that the
contribution of base income tracks the trend in MI. The growth in base income in the 1990s
accounts for 58 percent of the growth in the LIMEW, while the growth in net government
expenditures (the difference in the amount that the government spends for the households—
transfers plus public consumption—and the amount that households pay in taxes) in the 2000s
more than offsets the overall drop in base income. The same pattern holds true for the Great
Recession: base income reduces the LIMEW by 2.7 percent, while net government expenditures,
especially transfers, more than offsets this drop. In fact, net government expenditures is the only
component of the LIMEW that contributes substantially to the LIMEW growth of the middle of
the distribution, and most of this growth comes from transfers.
Table 3. Contribution of Components to Percentage Change in the Mean LIMEW of the Middle Quintile
1989–2000 2000–04 2004–07 2007–10 2000–10 1989–2010
Base Income 6.5 ‐2.8 1.1 ‐2.7 ‐4.5 1.5
Income from Wealth 2.1 ‐0.2 0.6 ‐0.6 ‐0.2 1.8
Income from Home Wealth 0.1 0.0 0.1 0.5 0.6 0.8
Income from Nonhome Wealth 2.0 ‐0.2 0.5 ‐1.1 ‐0.9 1.0
Net Government Transfers 0.6 3.9 1.8 6.1 12.3 14.2
Transfers 2.1 2.7 1.3 3.2 7.5 10.4
Public Consumption 1.6 0.7 0.7 1.1 2.6 4.6
Taxes 3.2 ‐2.7 2.3 ‐1.8 ‐2.2 0.8
Value of Household Production 1.9 2.0 ‐0.9 ‐0.9 0.2 2.2
LIMEW 11.2 2.9 2.6 1.9 7.7 19.7
Let us now begin to examine patterns of change in economic well-being by race by considering
first the estimates of the median LIMEW and MI in table 4, below. By both measures, the racial
ranking of median values is the same in every year—Other, White, Hispanic, and Black—from
highest to lowest. But in terms of the LIMEW, Hispanic households move closer to White and
Other households by the end of the period. Looking at the changes in median MI for the whole
period, we see that only Black households are better off in 2010 than in 1989, though only by a
small amount. Nonwhite households as a whole gained a greater percentage due to the increase
in the share of the relatively more well-off Other households. In terms of the LIMEW, however,

17
while every group is better off in 2010 than in 1989, Black households made the least progress,
with only a 15.3 percent increase. White households saw the next slowest growth in LIMEW,
with 20.3 percent, while Other households gained 24.5 percent, and Hispanic households saw
their median LIMEW increase by 27.9 percent, nearly double the relative increase of Black
households. Nonwhite households overall gained 25.6 percent in median LIMEW. Looking at
the period of the Great Recession (from 2007 to 2010), while all groups lost ground in terms of
MI, Black households suffered the worst decline (over 10 percent), while the other three groups
lost around 6 percent each. Only Black households lost ground in terms of LIMEW, though the
drop was small; White, Hispanic, and Other households all gained some ground (2.3 percent, 3.5
percent, and 4.2 percent, respectively). Nonwhite households as a whole saw a small increase of
1.2 percent.
Table 4. Median LIMEW and MI by Race, 1989–2010 ($US 2013)
White Black Hispanic Other Nonwhite
LIMEW MI LIMEW MI LIMEW MI LIMEW MI LIMEW MI
1989 86,353 58,240 66,327 33,755 74,478 41,116 90,114 59,865 71,436 38,701
2000 96,409 61,427 72,603 40,089 85,944 44,644 103,329 67,642 81,710 45,320
2004 99,853 60,429 72,499 36,997 86,642 41,932 105,629 63,759 83,656 43,016
2007 101,571 61,796 76,590 38,100 91,987 43,215 107,595 64,043 88,617 44,270
2010 103,884 58,224 76,479 34,187 95,239 40,529 112,151 59,859 89,705 40,597
Similar patterns emerge when looking at the ratios of the median LIMEW and MI by race (see
figure 7, below). The ratios of median MI for all groups of households to White households
increased during the 1990s but have fallen since 2000. However, for the median LIMEW,
Hispanic and Other households gained ground on White households in the 1990s, while Black
households lost ground. Nonwhite households as a whole gained ground in the 1990s. Hispanic
and Other households fell slightly further behind (in the case of Hispanic households) or saw
their advantage shrink (in the case of Other households) during the 2001 recession and since then
have slowly recovered, with the median Hispanic household exceeding its relative position in
2000 despite the Great Recession. Black households gained after the 2001 recession, but lost
most of their gains in the Great Recession. If anything, the Great Recession was remarkable for

18
the severity of the impact it had on Black households, especially relative to White households.
Next we move on to examine these trends in more detail by unpacking the components of the
LIMEW and their changes over time by race categories.
Figure 7. Ratio of Median LIMEW and MI to White Households, 1989–2010
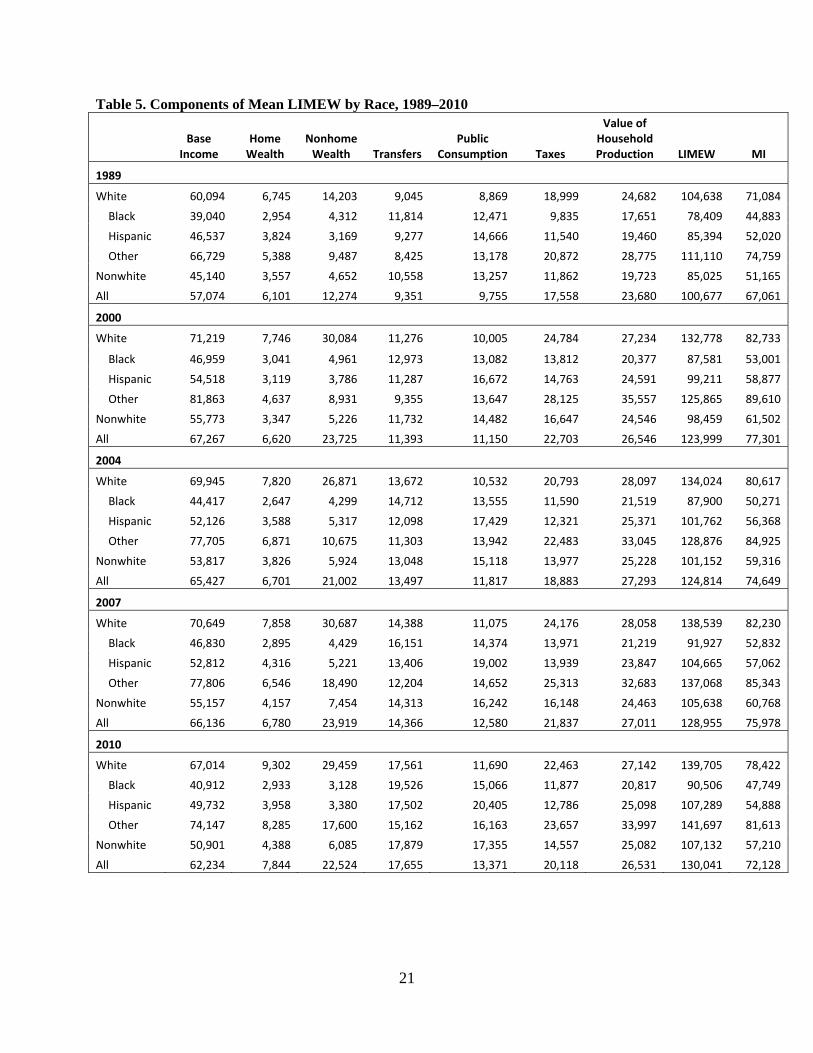
Table 5 gives the mean values of the components of LIMEW for White, Black, Hispanic, Other,
all Nonwhite, and all households. Again, base income consists mostly of earnings. We can see
that all groups lost substantially in terms of base income during the Great Recession, although
Black households lost the greatest amount, both in absolute (almost $6,000 compared to between
$3,000 and $3,700 for other groups) and relative (12.6 percent, compared to between 4.7 and 5.8
percent for other groups) terms. Nonwhite households lost 7.7 percent ($4,300) compared to
White households’ 5.9 percent loss ($3,600). Over the whole period from 1989 to 2010, Black
households had the smallest absolute gain ($1,900), while Other households had the greatest
0.00
0.20
0.40
0.60
0.80
1.00
1.20
LIMEW MI LIMEW MI LIMEW MI LIMEW MI
Black Hispanic Other Non‐white
1989 2000 2004 2007 2010

19
($7,400). Every group was worse off in terms of base income in 2010 than in 2000: White
households lost $4,200; Hispanic households lost $4,800; Black households lost $6,000; and
Other households lost $7,700. Income from home wealth is the smallest component of the
LIMEW for all groups in all years. The changes over time are relatively small as well. Over the
1990s, White households gained $1,000 over the decade, while Black households remained
unchanged. Other households lost $800, while Hispanic households lost $700. In the 2000s,
Other households more than made up their losses: their income from home wealth increased by
$3,600. White and Hispanic households were up $1,600 and $800, respectively, while Black
households lost $100. After the Great Recession, almost all groups had gained ground. For White
households this was the only period in the 2000s during which they gained income from home
wealth ($1,400). For Hispanic households, half of their gains in the 2000s came during this
period ($200), while for Other households most of their gains did ($1,500). So again, we see that
the housing crisis did not have a dominant impact on households’ economic well-being during
the Great Recession. We address this question later in this section.
Income from nonhome wealth has played a large part in the growth of racial inequality and
inequality over all, as we have already seen. Income from nonhome wealth more than doubled in
the 1990s for White households, while increasing by only 13 percent for Nonwhite households.
Although it decreased for every group in the Great Recession, White households lost the least
($400), while the other groups lost three to four and more times as much ($1,200, $1,300 and
$1,700 for Other, Black, and Hispanic households, respectively).
The public sector, mostly absent from MI (except for cash transfers), was by far the most
important factor in stabilizing the LIMEW for each group during the Great Recession, though the
ranking was different for each component. Hispanic households saw their transfers increase the
most ($4,100), followed by Black ($3,400), White ($3,200), and Other ($3,000) households.
Nonwhite households as a whole saw a $3,600 rise in transfers, $300 more than the overall mean
increase. Other households gained most from public consumption ($1,500), followed by
Hispanic ($1,400), Black ($700), and White ($600) households. Nonwhite households again had
a larger increase ($1,100) than the average for all households ($800). Taxes dropped most for
Black households ($2,100), followed by White ($1,700), Other ($1,700), and Hispanic ($1,200)

20
households. Of course, the fact that households paid lower taxes is partly an indication of lower
household incomes. Net government expenditures were the only thing preventing most
households from experiencing LIMEW decreases during the Great Recession. For Black
households, the second-highest increase ($6,200) was not enough to overcome the losses
elsewhere (see figure 8, below). For all other groups, the increase in net government
expenditures more than offset their losses in the other components of LIMEW during the Great
Recession (by $1,200, $2,600, and $4,600 for White, Hispanic, and Other households,
respectively). For Black households, the increase in net government expenditures was $1,400
lower than the drop in the rest of LIMEW. During the 1990s, net government expenditures
decreased substantially for all groups but Hispanic households. During the early 2000s, net
government expenditures increased across the board, a result of the Bush tax cuts and the
addition of drug coverage to Medicare. But the increase in net government expenditures during
the Great Recession was comparable in scale to the early 1990s. Finally, the value of household
production increased significantly during the 1990s, but was flat during the 2000s except for in
Other households. This is due partly to some increase in the replacement cost of household
production in the 1990s and stagnation in the 2000s, and partly to the reduction in the hours
spent on household production in the 2000s.
21
Table 5. Components of Mean LIMEW by Race, 1989–2010
Base
Income Home Wealth
Nonhome Wealth Transfers
Public Consumption Taxes
Value of Household Production LIMEW MI
1989
White 60,094 6,745 14,203 9,045 8,869 18,999 24,682 104,638 71,084
Black 39,040 2,954 4,312 11,814 12,471 9,835 17,651 78,409 44,883
Hispanic 46,537 3,824 3,169 9,277 14,666 11,540 19,460 85,394 52,020
Other 66,729 5,388 9,487 8,425 13,178 20,872 28,775 111,110 74,759
Nonwhite 45,140 3,557 4,652 10,558 13,257 11,862 19,723 85,025 51,165
All 57,074 6,101 12,274 9,351 9,755 17,558 23,680 100,677 67,061
2000
White 71,219 7,746 30,084 11,276 10,005 24,784 27,234 132,778 82,733
Black 46,959 3,041 4,961 12,973 13,082 13,812 20,377 87,581 53,001
Hispanic 54,518 3,119 3,786 11,287 16,672 14,763 24,591 99,211 58,877
Other 81,863 4,637 8,931 9,355 13,647 28,125 35,557 125,865 89,610
Nonwhite 55,773 3,347 5,226 11,732 14,482 16,647 24,546 98,459 61,502
All 67,267 6,620 23,725 11,393 11,150 22,703 26,546 123,999 77,301
2004
White 69,945 7,820 26,871 13,672 10,532 20,793 28,097 134,024 80,617
Black 44,417 2,647 4,299 14,712 13,555 11,590 21,519 87,900 50,271
Hispanic 52,126 3,588 5,317 12,098 17,429 12,321 25,371 101,762 56,368
Other 77,705 6,871 10,675 11,303 13,942 22,483 33,045 128,876 84,925
Nonwhite 53,817 3,826 5,924 13,048 15,118 13,977 25,228 101,152 59,316
All 65,427 6,701 21,002 13,497 11,817 18,883 27,293 124,814 74,649
2007
White 70,649 7,858 30,687 14,388 11,075 24,176 28,058 138,539 82,230
Black 46,830 2,895 4,429 16,151 14,374 13,971 21,219 91,927 52,832
Hispanic 52,812 4,316 5,221 13,406 19,002 13,939 23,847 104,665 57,062
Other 77,806 6,546 18,490 12,204 14,652 25,313 32,683 137,068 85,343
Nonwhite 55,157 4,157 7,454 14,313 16,242 16,148 24,463 105,638 60,768
All 66,136 6,780 23,919 14,366 12,580 21,837 27,011 128,955 75,978
2010
White 67,014 9,302 29,459 17,561 11,690 22,463 27,142 139,705 78,422
Black 40,912 2,933 3,128 19,526 15,066 11,877 20,817 90,506 47,749
Hispanic 49,732 3,958 3,380 17,502 20,405 12,786 25,098 107,289 54,888
Other 74,147 8,285 17,600 15,162 16,163 23,657 33,997 141,697 81,613
Nonwhite 50,901 4,388 6,085 17,879 17,355 14,557 25,082 107,132 57,210
All 62,234 7,844 22,524 17,655 13,371 20,118 26,531 130,041 72,128

22
Figure 8. Changes in Components of Net Government Expenditures and Rest of LIMEW by Race, 2007–2010
The breakdown presented in figure 9, below, shows that the 1990s were characterized by fairly
even growth in base income among households differentiated by race. The contribution of base
income to overall mean LIMEW growth was highest for Other households at 13.6 percent, while
its contribution to LIMEW growth for White, Black, and Hispanic households was 10.6, 10.1,
and 9.3 percent, respectively. Nonwhite households as a whole saw a greater contribution (12.5
percentage points) than the overall average contribution to growth (10.1 percentage points). Of
course the most glaring difference by race category in the 1990s is the 15.2 percent contribution
of income from nonhome wealth to the growth in the LIMEW of White households.9 This
component added almost nothing to the growth of the LIMEW for Nonwhite households in the
1990s. The contribution of home wealth was negligible for White households, and slightly
9 This trend mirrors the evolution of the racial wealth gap that we saw in figure 6.
$(8,000)
$(6,000)
$(4,000)
$(2,000)
$‐
$2,000
$4,000
$6,000
$8,000
White Black Hispanic Other Non‐white All
Transfers Public Consumption Taxes Rest of LIMEW
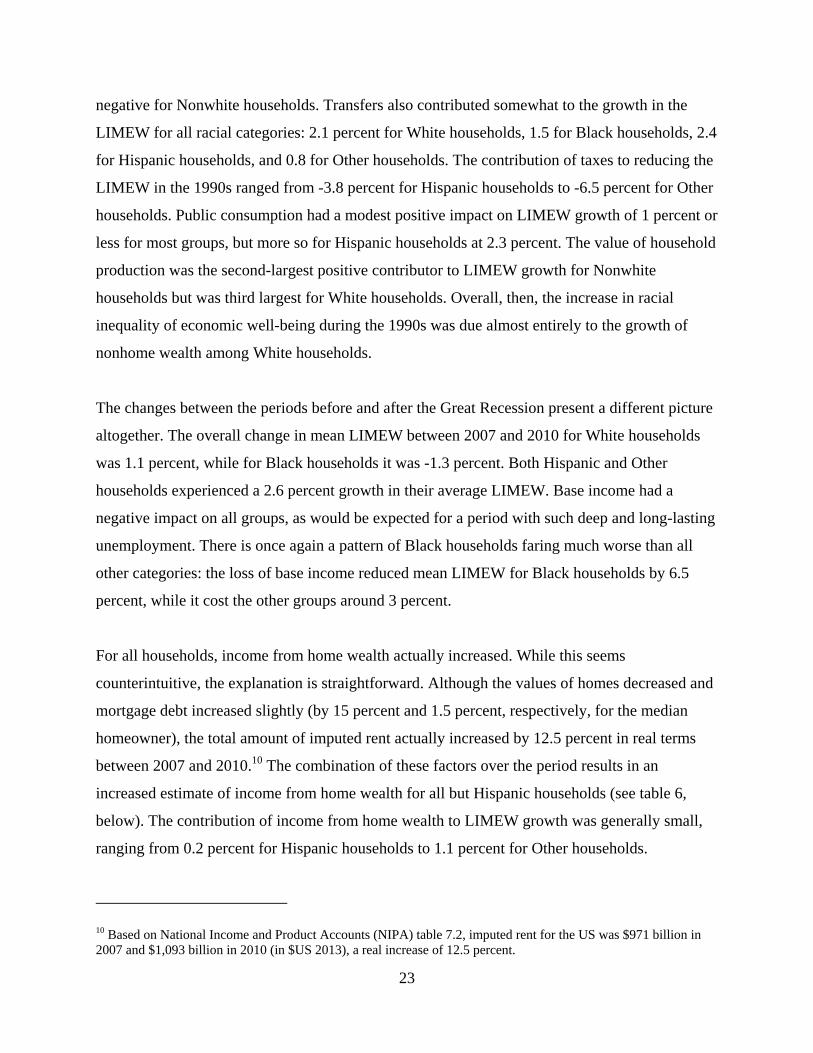
23
negative for Nonwhite households. Transfers also contributed somewhat to the growth in the
LIMEW for all racial categories: 2.1 percent for White households, 1.5 for Black households, 2.4
for Hispanic households, and 0.8 for Other households. The contribution of taxes to reducing the
LIMEW in the 1990s ranged from -3.8 percent for Hispanic households to -6.5 percent for Other
households. Public consumption had a modest positive impact on LIMEW growth of 1 percent or
less for most groups, but more so for Hispanic households at 2.3 percent. The value of household
production was the second-largest positive contributor to LIMEW growth for Nonwhite
households but was third largest for White households. Overall, then, the increase in racial
inequality of economic well-being during the 1990s was due almost entirely to the growth of
nonhome wealth among White households.
The changes between the periods before and after the Great Recession present a different picture
altogether. The overall change in mean LIMEW between 2007 and 2010 for White households
was 1.1 percent, while for Black households it was -1.3 percent. Both Hispanic and Other
households experienced a 2.6 percent growth in their average LIMEW. Base income had a
negative impact on all groups, as would be expected for a period with such deep and long-lasting
unemployment. There is once again a pattern of Black households faring much worse than all
other categories: the loss of base income reduced mean LIMEW for Black households by 6.5
percent, while it cost the other groups around 3 percent.
For all households, income from home wealth actually increased. While this seems
counterintuitive, the explanation is straightforward. Although the values of homes decreased and
mortgage debt increased slightly (by 15 percent and 1.5 percent, respectively, for the median
homeowner), the total amount of imputed rent actually increased by 12.5 percent in real terms
between 2007 and 2010.10 The combination of these factors over the period results in an
increased estimate of income from home wealth for all but Hispanic households (see table 6,
below). The contribution of income from home wealth to LIMEW growth was generally small,
ranging from 0.2 percent for Hispanic households to 1.1 percent for Other households.
10 Based on National Income and Product Accounts (NIPA) table 7.2, imputed rent for the US was $971 billion in 2007 and $1,093 billion in 2010 (in $US 2013), a real increase of 12.5 percent.

24
It must also be noted that the housing crisis also caused drops in homeownership rates (see table
6, below) between 2007 and 2010 (and even more between 2010 and 2013).
Changes in income from nonhome wealth, on the other hand, contributed to decreases in the
LIMEW for all groups. White households were the least affected, with a 0.3 percent decrease in
LIMEW as a result of loss of income from nonhome wealth, while Other households lost 0.9
percent, Black households lost 1.5 percent, and Hispanic households lost 1.7 percent. So despite
the headline-grabbing nature of the financial crisis, its direct impact on household economic
well-being was fairly modest compared to the direct impact of losses in earnings reflected in
base income.11
Turning to the government sector, we see that the largest contribution to average LIMEW growth
comes from transfers. For White and Other households the contribution was about 2.25 percent,
while for Black and Hispanic households the contribution was 3.7 and 4 percent, respectively.
Given the larger employment impacts on the latter two groups, this is unsurprising. However,
while for White and Other households, transfers nearly cancelled out the reduction in base
income during the Great Recession, for Black households transfers fell almost 3 percentage
points short. For Hispanic households however, the positive contribution of transfers exceeded
their losses from base income by 1 percentage point. Public consumption and taxes added
between another 1.4 (for White households) and 2.6 (for Black households) percent to the overall
LIMEW growth. Because taxes fell on average for all groups, the contribution of taxes to
LIMEW growth was positive. The highest contribution was for Blacks (1.8 percentage points).
The groups Others and Whites experienced comparable help from the tax cuts (a little under 1
percentage point), while Hispanics had the lowest boost (0.6 percentage points). The combined
impetus of transfers and taxes to LIMEW growth fell short of the setback from the earnings
decline only for Blacks, while for all others it overwhelmed the setback.
While public services (e.g., highways) are not substitutable for commodities, it is interesting to
note that even adding in the contribution of public consumption, the positive contribution of net
11 While overall mean nonhome wealth declined by 16 percent, average income from nonhome wealth fell much less, by only 3.6 percent.

25
government expenditures was not enough to offset the negative contribution of base income for
Blacks. The sum of the contributions from net government expenditures and base income to the
change in economic well-being during the Great Recession was -0.2 percentage points for
Blacks, while for other groups it was positive: around 1 percentage point to the benefit of White
and Other households and 3 percentage points for Hispanic households.
The value of household production had mixed influences on the trajectory of the average
LIMEW by race during the Great Recession. Whites and Blacks saw reductions in the LIMEW
as a result of value of household production decreasing, while Hispanic and Other households
experienced increases. For the latter two groups, household production accounted for 40 to 45
percent of their LIMEW growth. To sum up then, while for all groups of households base income
fell and net government expenditures offset that to a greater or lesser degree, White and Hispanic
households needed increases in income from wealth and the value of household production,
respectively, to see their LIMEW increase while Other households saw increases in both
components. Black households, on the other hand, saw additional losses in both income from
wealth and the value of household production resulting in an overall decrease in average
LIMEW.

26
Figure 9. Contributions to Growth in LIMEW by Race, 1989–2010 (percentage points)
Table 6. Changes in Homeownership Rates, Mean Home Value, Mortgage Debt, and Imputed Rent by Race, 2007–2010
Home Ownership
Rate Home Value
Mortgage Debt
Imputed Rent
White ‐0.2% ‐15.3% 3.3% 14.0%
Black ‐1.0% ‐31.4% ‐36.4% ‐10.7%
Hispanic ‐1.9% ‐34.9% ‐20.2% ‐10.2%
Other ‐4.8% ‐13.0% ‐6.9% 18.4%
Total ‐1.4% ‐17.9% ‐3.0% 10.7%
The changes in average income from home wealth discussed above mask the impact of the
housing bubble on households. As we have seen, the average home value dropped considerably
for all homeowners but especially for Black and Hispanic homeowners. The same is true of
homeownership rates. While there was substantial growth in homeownership for all groups
between 1989 and 2007, this was clearly a period of some convergence in rates of
‐15‐10‐50510152025303540
White
Black
Hispanic
Other
Non‐w
hite
All
White
Black
Hispanic
Other
Non‐w
hite
All
White
Black
Hispanic
Other
Non‐w
hite
All
1989 ‐ 2000 2007 ‐ 2010 1989 ‐ 2010
Base Income Home Wealth
Non‐home Wealth Transfers
Public Consumption Taxes
Value of Household Production

27
homeownership by race (see table 7, below). The gap in homeownership rates between White
and Black households shrank from 28 percent to 26 percent, while that between White and
Hispanic households narrowed from 28.5 percent to 25.6 percent. The Other households enjoyed
the greatest increase in homeownership, adding nearly 10 percentage points over the period. The
Great Recession’s impact on homeownership appears to be still unfolding. For most groups, the
drop in homeownership between 2007 and 2010 was modest; however, by 2013, all groups had
seen considerable losses. White households’ drop was notably the smallest (just under 2
percentage points), while Black and Hispanic households’ homeownership rates dropped quite a
bit (4.7 and 5.2 percentage points, respectively). Only Other households experienced an increase
in homeownership rates between 2010 and 2013, though this still left them down by 3.4
percentage points from 2007.
Table 7. Homeownership Rates by Race, 1989–2013 1989 2001 2004 2007 2010 2013
White 70.5 74.1 75.8 74.8 74.6 73.1
Black 42.4 47.4 50.1 48.6 47.7 44.0
Hispanic 41.9 44.3 47.7 49.2 47.3 43.9
Other 53.9 53.0 57.5 63.4 58.5 60.0 Source: Authors’ calculations based on 1989, 2001, 2004, 2007, 2010, and 2013 Survey of Consumer Finances
INEQUALITY
Overall income inequality has increased over the last two decades, especially during the 1990s.
However, at least part of the measured inequality increase during the 1990s is due to a change in
the method the BLS used to top-code incomes in the CPS in the early 1990s (see table 8,
below).12 It is likely that the reporting changes had a smaller impact on the inequality of the
LIMEW primarily because, as discussed below, those at the top of the LIMEW distribution are
there by virtue of their massive wealth holdings rather than earnings. So, despite the relative
12 Both changes made in the survey design and the raising of thresholds for reported earnings, introduced in 1994, raised the measured inequality in money income. One estimate is that these changes accounted for half of the increase in the inequality in household money income between 1992 and 1993 or about one Gini point (Ryscavage 1995). In addition, top-coding of property income items (such as dividends) also underwent changes (Burkhauser et al. 2011).

28
underestimation of inequality prior to 1994, there is still evidence of a trend of increasing
inequality since the 1980s. However, inequality in both MI and LIMEW (as measured by the
Gini ratio) has remained stable since 2000, including during the period of the Great Recession.
Table 8. Gini Coefficients for LIMEW and MI, 1989–2010
LIMEW MI
1989 36.1 41.8
1995 38.4 45.0
2000 41.9 46.0
2004 41.0 46.5
2007 41.7 46.2
2010 41.2 46.9
Turning to inequality by race, we can first observe that in 1989, LIMEW inequality was the
highest within the group Other (36.9). Inequality among White households was nearly as high
(36.1), while inequality was notably lower among Blacks (34.3) and lowest among Hispanics
(32.1) (table 9, below). Inequality increased among all groups during the 1990s, but the increase
was small for Nonwhite households, ranging from a 0.8 Gini point increase for Hispanic
households to a 1.5 Gini point increase for Black households. Among White households, there
was a 7 Gini point increase. The result was a widening in the level of inequality within
racial/ethnic groups.13
Table 9. LIMEW Inequality by Race, 1989–2010 (Gini)
White Black Hispanic Other
1989 36.1 34.3 32.1 36.9
2000 43.1 35.8 32.9 38.0
2004 42.1 36.4 33.2 37.2
2007 43.1 35.6 33.1 39.5
2010 42.5 35.6 32.4 39.8
Decomposition analysis suggests that the surge in inequality among Whites during the 1990s
primarily reflects the huge contribution made by income from nonhome wealth to LIMEW
inequality (table 10). This is due both to the increasing share of income from nonhome wealth in
13 A similar trend is apparent for MI, with the Gini for Whites increasing by 5 points during the 1990s. Changes in labor market conditions account for some, but not all, of the increase in LIMEW inequality.

29
the LIMEW among Whites during this period (see table 5, above) and to the rising concentration
of income from nonhome wealth among White households.14 By contrast, income from nonhome
wealth contributed almost nothing to LIMEW growth among Nonwhite households, as we noted
above (see figure 8). Its share in the total LIMEW is also much lower for Nonwhite groups
compared to Whites as a result of the comparatively low levels of nonwealth holdings among
them—a reflection of the highly unequal division of nonhome wealth among racial groups (see
figure 6, above). The only Nonwhite group that showed a notable change in inequality was Black
households and here the main contributors were household production and government transfers.
In both cases, the increase in the contribution was due to the increase in its concentration.15 Since
2000, LIMEW inequality showed hardly any change within all groups except Other. The latter
saw a small decline in inequality between 2000 and 2004 (0.8 Gini points) followed by an
increase of 2.6 Gini points between 2004 and 2010, with most of the increase occurring between
2004 and 2007.16 The Great Recession seems to have been accompanied by no appreciable
change in the level of inequality. Thus, while for the 1990s, the standout fact is the increase of
nonhome wealth inequality among White households, no such dramatic impact is evident during
the Great Recession.
14 The concentration coefficient of income from nonhome wealth for Whites increased from 0.73 in 1989 to 0.79 in 2000. 15 The concentration coefficient of household production rose from 0.37 to 0.41 and that of government transfers grew from 0.11 to 0.19 between 1989 and 2000. However, because the increase in inequality among Blacks was rather small, we do not investigate this further here. 16 We estimated that the increase in inequality among Others during this period was driven by the drastic rise in the contribution of income from nonhome wealth, but the small sample size for this group in the SCF makes it difficult to put much confidence in its analysis.

30
Table 10. Decomposition of Changes in LIMEW Inequality by Race and Source, 1989–2010 1989–2000 White Black Hispanic Other All
Base Income 0.3 0.4 0.4 3.9 0.4
Income from Home Wealth ‐0.2 ‐0.1 ‐1.2 ‐0.5 ‐0.3
Income from Nonome Wealth 7.9 ‐0.2 ‐0.2 ‐1.9 6.1
Net Government Expenditures ‐0.3 0.3 0.2 ‐2.7 ‐0.2
Government Transfers 0.7 1.1 0.6 0.4 0.7
Public Consumption ‐0.1 0.3 0.4 ‐0.4 0.0
Taxes ‐0.9 ‐1.1 ‐0.9 ‐2.7 ‐1.0
Value of Household Production ‐0.7 1.2 1.2 2.0 ‐0.3
Total 7.0 1.6 0.4 0.8 5.8
2007–10
Base Income ‐0.7 ‐1.5 ‐0.8 ‐0.4 ‐0.7
Income from Home Wealth 0.5 ‐0.1 ‐0.5 0.6 0.4
Income from Nonhome Wealth ‐0.5 ‐0.6 ‐1.3 ‐0.7 ‐0.6
Net Government Expenditures 0.0 1.4 0.8 ‐0.5 0.1
Government Transfers 0.5 1.4 1.0 0.1 0.6
Public Consumption 0.1 0.4 0.2 ‐0.1 0.1
Taxes ‐0.6 ‐0.4 ‐0.4 ‐0.4 ‐0.6
Value of Household Production 0.0 0.6 0.9 1.0 0.2
Total ‐0.8 ‐0.2 ‐0.9 0.1 ‐0.7
We use the analysis of Gini (ANOGI) technique proposed by Frick et al. (2006) to decompose
changes in racial LIMEW inequality. ANOGI decomposes the Gini coefficient by groups into
within-group and between-group components and the effect of overlapping on both components.
Intragroup inequality is the weighted average of the Gini coefficient of each subgroup. Between-
group inequality (the between-group Gini assuming perfect stratification minus the overlapping
component) is a small component of overall LIMEW inequality.17 Figure 9 shows the
contribution of these two components to the change in the Gini coefficient for the LIMEW, using
racial categories for the decomposition. In the 1990s, 98 percent of the large increase in overall
inequality was due to an increase in intragroup inequality, although there was also an increase in
intergroup inequality. This large increase in intragroup inequality is due, as we have shown
above, to the increase in inequality among White households due to the explosion of income
from nonhome wealth in the 1990s. The 2000s saw a net reduction in the overall LIMEW
17 In 2010, the between-group component of the Gini coefficient accounted for 2.8 percent of the total LIMEW inequality.

31
inequality, but there was again a very slight increase in intergroup inequality. The changes
during the Great Recession look very much like the changes for the 2000–04 period and for the
decade overall.
Figure 10. Changes in the Racial Decomposition of LIMEW Inequality Due to Between-Group and Within-Group Inequality, 1989–2010
Between-group inequality is similarly small for all of the components of LIMEW, with one
notable exception. The between-group component of inequality of income from nonhome wealth
was 8.3 percent in 2010. Figure 11 tracks the changes in the level of inequality of base income,
income from home wealth, and income from nonhome wealth due to between- and within-group
inequality. The 1990s saw an increase in within-group inequality for base income, but no change
in between-group inequality, leading to a large increase in inequality in base income. For income
from home wealth, between-group inequality increased by about 2 Gini points, while intragroup
inequality decreased by 3.5, leading to a reduction in inequality overall. For income from
‐2
‐1
0
1
2
3
4
5
6
7
1989 ‐ 2000 2000 ‐ 2004 2004 ‐ 2007 2007 ‐ 2010 2000 ‐ 2010
Between‐Group Within‐group

32
nonhome wealth, although the overall change in inequality was small, between-group inequality
increased, while within-group inequality increased so that within-group inequality fell from 94
percent to 91 percent of inequality in income from nonhome wealth. The overall changes were
less than 5 Gini points for all three components.
The changes in the 2000s were quite different. Between-group inequalities were slightly higher
for base income, while there was a reduction in terms of income from home wealth and income
from nonhome wealth. The within-group inequality for base income was smaller than for the
1990s. The within-group inequality of both income from nonhome wealth and income from
home wealth were inequality increasing. The changes in both intragroup and intergroup
inequality of base income in the two subperiods between 2000 and 2007 essentially cancelled
each other out, leaving the period between 2007 and 2010 to determine the change in inequality
of base income. In terms of income from nonhome wealth, the one period between 2000 and
2004 was exceptional in that the small increase in inequality was driven by an increase in
intragroup inequality and held back by declines in intergroup inequality. Although for the decade
overall, both between- and within-group inequality increased, the latter only increased in the first
subperiod. The Great Recession actually reduced the overall trend of rising inequality of income
from home wealth. Prior to the Great Recession the increase in intragroup inequality of income
from home wealth was over 3.9 Gini points, afterwards it decreased by 1.8 points. The
contribution of between-group inequality in income from home wealth fell by 0.9 Gini points
between 2000 and 2007, but rose by 1.2 points between 2007 and 2010. While the housing
bubble clearly inflated overall inequality in home wealth without appreciably increasing racial
inequality, the bursting of the bubble did not undo half of the damage, at least by 2010.18
18 Given the continued declining trend in homeownership rates through 2013, it is hard to imagine additional decreases in inequality of income from home wealth.

33
Figure 11. Decomposition of Changes in Inequality of Components of LIMEW Due to Between-Group and Within-Group Inequality by Race Groups, 1989–2010
To deepen our understanding of the changes in wealth that drive the changes in inequality of
income from wealth, we turn again to the SCF (figure 12). In the 1990s, the growth of average
net worth for White households was driven by the growth of their financial assets ($100,600),
home value ($93,500), and nonfinancial assets ($89,400), each of which by themselves were
larger than the gains in total assets made by Black or Hispanic households during the same
period ($68,800 and $76,900, respectively). The largest gain for the Other group was in
nonfinancial assets, which includes closely held businesses and real estate other than the primary
residence. For Other households, both the increase in home value and other nonfinancial assets
($115,000 and $124,700, respectively) was larger than the total gains in assets for Black and
Hispanic households. Clearly the explanation for the increase in the between-group inequality in
income from both home and nonhome wealth in the 1990s is due to the much greater average
gains made by White and Other households when compared to Black and Hispanic households.
‐4
‐3
‐2
‐1
0
1
2
3
4Base Income
Home Wealth
Nonhome Wealth
Base Income
Home Wealth
Nonhome Wealth
Base Income
Home Wealth
Nonhome Wealth
Base Income
Home Wealth
Nonhome Wealth
Base Income
Home Wealth
Nonhome Wealth
1989 ‐ 2000 2000 ‐ 2004 2004 ‐ 2007 2007 ‐ 2010 2000 ‐ 2010
Between‐Group Within‐group

34
The fact that within-group inequality in nonhome income was falling while between-group
inequality was rising indicates increasing stratification between the White and Other households
and the Black and Hispanic households during the 1990s.
The first decade of the 2000s reveals substantially different patterns. Overall growth in assets
was less than half that of the 1990s ($124,900 compared to $301,000 growth in average total
assets), while the increase in debt was comparable. Interestingly, there is a substantial difference
in the distribution of growth in assets between White and Other households, which saw similar
increases in average assets ($173,800 and $194,000, respectively). For White households, growth
was concentrated in home values and nonfinancial assets ($64,300 and $66,700, respectively),
while for Other households it was home values and financial assets ($60,200 for both) that
contributed the most for 2000–10. All four of these changes exceeded the total growth in average
assets for Black and Hispanic households in the 2000s ($36,900 and $41,400, respectively). For
the 2000s as a whole, almost all of the increase in inequality in income from home and nonhome
wealth was due to intragroup inequality increases. Although the gap between the White and
Other households and the Black and Hispanic households was growing in the 2000s, it grew
more slowly than during the 1990s. Meanwhile, increased inequality within groups, especially in
income from home wealth, was reducing stratification.
The period following the Great Recession stands out in that it shows the only drop in home value
and nonfinancial assets for all race groups. There was no group that was a net gainer in assets in
the 2007–2010 period, but Hispanic households lost the most ($92,500), followed by Other
($65,600), Black ($49,700), and White ($42,600). Because Black households saw their average
debt decrease (by $15,300) while the average White household debt increased ($6,400), their
positions are reversed if we consider the change in net worth. Another significant difference in
changes by racial group during the Great Recession was the increase in both financial and
retirement assets for Other households ($41,100 and $36,700, respectively). The increases in
these asset classes helped to offset their losses in home and other nonfinancial assets. The latter,
at $109,100, was more than twice the loss of any other group and the sum of the two was almost
twice the losses for Hispanic households for the two categories.

35
Figure 12. Changes in Components of Net Worth by Race Groups, 1989–2010
We turn now to examine the changes in inequality in government expenditures and taxes (figure
13). With few exceptions, inequality in the distribution of these components of the LIMEW has
declined over time, if on a smaller scale than that of income from home wealth. During the
1990s, however, both transfers and public consumption experienced increases in their intragroup
inequality, while the reduction in the inequality of taxes was driven by a substantial reduction in
the intragroup inequality component. Between-group inequality changed very little for any of the
three parts of net government transfers. Once again, the 2000s are a different story. All three
components of net government expenditures experienced decreases in their within-group
component, especially transfers. Between-group inequality increased for public consumption but
decreased for transfers and taxes. The magnitude is much larger for public consumption and
taxes, as well. Most of this impact occurred during the Great Recession. The intragroup
$(200,000)
$(100,000)
$‐
$100,000
$200,000
$300,000
$400,000
White
Black
Hispanic
Other
Nonwhite
Total
White
Black
Hispanic
Other
Nonwhite
Total
White
Black
Hispanic
Other
Nonwhite
Total
White
Black
Hispanic
Other
Nonwhite
Total
White
Black
Hispanic
Other
Nonwhite
Total
1989 ‐ 2001 2001 ‐ 2004 2004 ‐ 2007 2007 ‐ 2010 2001 ‐ 2010
Home Other Nonfinancial Liquid Financial Retirement Mortgage Other Debt

36
component of inequality of transfers also shrank during the recession of the early 2000s, but
increased again during the recovery.
Figure 13. Decomposition of Changes in Inequality of Components by Race Groups, 1989–2010
Racial inequality and overall inequality were slightly reduced by the Great Recession. It remains
to be seen what the impact of the turn towards fiscal austerity after the 2010 midterm elections
will have been. Given the importance of transfers in increasing measured inequality and of taxes
in reducing it, the story may be more complicated than we might have predicted.
CONCLUSIONS
The Great Recession, though officially lasting a year and a half, in many ways is still very much
with us. Employment rates have not fully recovered to their prerecession levels, though much of
‐8.0
‐7.0
‐6.0
‐5.0
‐4.0
‐3.0
‐2.0
‐1.0
0.0
1.0
2.0
Transfers
Public Cons.
Taxes
Transfers
Public Cons.
Taxes
Transfers
Public Cons.
Taxes
Transfers
Public Cons.
Taxes
Transfers
Public Cons.
Taxes
1989 ‐ 2000 2000 ‐ 2004 2004 ‐ 2007 2007 ‐ 2010 2000 ‐ 2010
Between‐Group Within‐group

37
this may be due to the aging of the population. Earnings have certainly not recovered, remaining
below their 2000 level. Homeownership rates have dropped off even more sharply after 2010. As
we have demonstrated, all of these trends have been experienced quite differently by different
racial subgroups in the United States.
In terms of wealth, Black and Hispanic households remain far behind White households, with
their average net worth amounting to 12 and 15 percent, respectively, of the average net worth of
White households in 2013. The ratio of median Black and Hispanic household net worth to
White households is just below 2 percent. This is down from 6.6 and 5.2 percent in 2007,
respectively. Black households’ mean home equity is a quarter of that of White households’ and
Hispanic households’ is one-third. Black and Hispanic households’ median home equity is zero.
In terms of employment rate, Black adults remain far behind every other group. These trends
have their implications for household economic well-being, measured either by MI or the
LIMEW.
While all groups lost ground during the Great Recession in terms of money income (MI), only
Black households lost in terms of the LIMEW, while each of the other groups gained $2,000 to
$3,000. Unfortunately, this is not an aberration caused by the Great Recession but a continuation
of a decades-long trend. In the 1990s, this trend was mainly the result of the increase in White
households’ income from nonhome wealth. Between 2000 and 2010, and certainly during the
Great Recession, the increased gap between White and Black households has been due to the
greater loss of base income for Black households than for any other group. Only slightly greater
increases in transfers for Black households kept the gap from increasing even further by 2010.
This fact makes the prospects for the period since 2010 even gloomier, given the turn towards
fiscal austerity, especially in terms of cuts in spending.
Measured racial inequality remains very much a function of intragroup inequality, as opposed to
between-group inequality. Inequality remains highest among White households, driven by the
increase in the concentration of wealth since the 1980s among the White households at the top of
the LIMEW distribution. The between-group component of inequality in income from wealth has
increased by 3 Gini points (or 62 percent) since 1989 and it features the largest between-group

38
inequality of any component of LIMEW, but in 2010 the overall Gini coefficient for income
from nonhome wealth stood at 93.2. The implication is that racial economic inequality remains
very much a function of the intersection of race and class in the United States.
39
REFERENCES
Aaronson, Stephanie, Tomaz Cajner, Bruce Fallick, Felix Galbis-Reig, Christopher L. Smith, and William Wascher. 2014. “Labor Force Participation: Recent Developments and Future Prospects.” Federal Reserve Board Finance and Economics Discussion Series 2014–64 (September).
Ajilore, Olugbenga. 2008. “The Impact of the Earned Income Tax Credit on Poverty: Analyzing
the Dimensions by Race and Immigration.” The Review of Black Political Economy 35 (4): 117–27. doi:10.1007/s12114-008-9030-2.
Altonji, Joseph G., and Rebecca M. Blank. 1999. “Race and Gender in the Labor Market.” In
Handbook of Labor Economics, edited by Orley Ashenfelter and David Card, 3C:3143–3259. Amsterdam: Elsevier Science.
Blau, Francine D., and John W. Graham. 1990. “Black-White Differences in Wealth and Asset
Composition.” The Quarterly Journal of Economics 105 (2): 321–39. doi:10.2307/2937789.
Brimmer, Andrew F. 1988. “Income, Wealth, and Investment Behavior in the Black
Community.” The American Economic Review 78 (2): 151–55. doi:10.2307/1818114. Burkhauser, Richard V., Shuaizhang Feng, Stephen P. Jenkins, and Jeff Larrimore. 2011.
“Estimating Trends in US Income Inequality Using the Current Population Survey: The Importance of Controlling for Censoring.” Journal of Economic Inequality 9 (3): 393–415.
Darity Jr., William A. 1982. “The Human Capital Approach to Black-White Earnings Inequality:
Some Unsettled Questions.” The Journal of Human Resources 17 (1): 72–93. Federal Reserve Board. 2014. “Codebook for 2010 Survey of Consumer Finances.”
http://www.federalreserve.gov/econresdata/scf/files/codebk2010.txt. Frick, Joachim R, Jan Goebel, Edna Schechtman, Gert G Wagner, and Shlomo Yitzhaki. 2006.
“Using Analysis of Gini (ANOGI) for Detecting Whether Two Subsamples Represent the Same Universe: The German Socio-Economic Panel Study (SOEP) Experience.” Sociological Methods & Research 34 (4): 427–68.
Gornick, M.S., Marian E., Paul W. Eggers, Ph.D., Thomas W. Reilly, Ph.D., Renee M.
Mentnech, M.S., Leslye K. Fitterman, Ph.D., Lawrence E. Kucken, M.P.A., and Bruce C. Vladeck, Ph.D. 1996. “Effects of Race and Income on Mortality and Use of Services among Medicare Beneficiaries.” New England Journal of Medicine 335 (September): 791–99.

40
Hall, Allyson G. 1998. “Medicaid’s Impact on Access to and Utilization of Health Care Services among Racial and Ethnic Minority Children.” Journal of Urban Health 75 (4): 677–92. doi:10.1007/BF02344498.
Hogan, Richard, Meesook Kim, and Carolyn C. Perrucci. 1997. “Racial Inequality in Men’s
Employment and Retirement Earnings.” The Sociological Quarterly 38 (3): 431–38. doi:10.1111/j.1533-8525.1997.tb00486.x.
Kaufman, Robert L. 1983. “A Structural Decomposition of Black-White Earnings Differentials.”
The American Journal of Sociology 89 (3): 585–611. La Ferrara, Eliana, and Angelo Mele. 2006. “Racial Segregation and Public School
Expenditure.” CEPR Discussion Paper 5750 (July). http://ideas.repec.org/p/cpr/ceprdp/5750.html.
Lillie-Blanton, Marsha, Julia Paradise, Megan Thomas, Paul Jacobs, and Bianca DiJulio. 2009.
“Racial/Ethnic Disparities in Access to Care Among Children: How Does Medicaid Do in Closing the Gaps?” Washington, D.C.: The Henry J. Kaiser Family Foundation. http://kff.org/medicaid/racialethnic-disparities-in-access-to-care-among/.
Oliver, Melvin L., and Thomas Shapiro. 1995. Black Wealth/ White Wealth: A New Perspective
on Racial Inequality. 1sted. Routledge. ———. 2005. Black Wealth/ White Wealth: A New Perspective on Racial Inequality. 2nded.
Routledge. Parcel, Toby L. 1982. “Wealth Accumulation of Black and White Men: The Case of Housing
Equity.” Social Problems 30 (2): 199–211. Piketty, Thomas. 2014. Capital in the Twenty-First Century. Cambridge, MA: Harvard
University Press. http://www.hup.harvard.edu/catalog.php?isbn=9780674430006. Ryscavage, Paul. 1995. “A Surge in Growing Income Inequality?” Monthly Labor Review 118
(8): 51–61. Schneider, Eric C., Alan M. Zaslavsky, and Arnold M. Epstein. 2002. “Racial Disparities in the
Quality of Care for Enrollees in Medicare Managed Care.” JAMA: The Journal of the American Medical Association 287 (10): 1288–94. doi:10.1001/jama.287.10.1288.
Smith, James P., and Finis Welch. 1979. “Inequality: Race Differences in the Distribution of
Earnings.” International Economic Review 20 (2): 515–26. doi:10.2307/2526497. U. S. Census Bureau, Demographic Internet Staff. 2015. “Current Population Survey (CPS) -
Definitions.” http://www.census.gov/cps/about/cpsdef.html.

41
Wilhelmina A. Leigh. 2006. “Wealth Measurement: Issues for People of Color in the United States.” In Wealth Accumulation and Communities of Color in the United States: Current Issues, edited by Jessica Gordon Nembhard and Ngina Chiteji, 23–66. Ann Arbor: The University of Michigan Press. http://search.ebscohost.com/login.aspx?direct=true&db=ecn&AN=0972251&site=ehost-live.
Wolff, Edward N. 1992. “Changing Inequality of Wealth.” The American Economic Review 82
(2): 552–58. doi:10.2307/2117460. Wolff, Edward N., Ajit Zacharias, and Thomas Masterson. 2012. “Trends in American Living
Standards and Inequality, 1959–2007.” Review of Income and Wealth 58 (2): 197–232. doi:10.1111/j.1475-4991.2012.00503.x.
Wright, Erik Olin. 1978. “Race, Class, and Income Inequality.” The American Journal of
Sociology 83 (6): 1368–97.