WORKGROUP REPORT: F006 BENCHMARKING STUDY · September 1998 2 F006 Benchmarking Study Appendix D:...
151
WORKGROUP REPORT: F006 BENCHMARKING STUDY September 1998
Transcript of WORKGROUP REPORT: F006 BENCHMARKING STUDY · September 1998 2 F006 Benchmarking Study Appendix D:...

WORKGROUP REPORT: F006 BENCHMARKING STUDY
September 1998


TABLE OF CONTENTS
EXECUTIVE SUMMARY . . . . . . . . . . . . . . . . . . . . . . . . . . . . . . . . . . . . . . . . . . . . . . . . . . . . 3
I. BACKGROUND . . . . . . . . . . . . . . . . . . . . . . . . . . . . . . . . . . . . . . . . . . . . . . . . . . . . . . 8A. What is the Common Sense Initiative? . . . . . . . . . . . . . . . . . . . . . . . . . . . . . . . . 8B. The Metal Finishing Industry and Electroplating Wastewater Treatment Sludges
. . . . . . . . . . . . . . . . . . . . . . . . . . . . . . . . . . . . . . . . . . . . . . . . . . . . . . . . . . . . 10C. F006 Sludge Generation and Management . . . . . . . . . . . . . . . . . . . . . . . . . . . . 10D. Basis for Listing F006-Electroplating Wastewater Treatment Sludges as a RCRA
Hazardous Waste in 1980 . . . . . . . . . . . . . . . . . . . . . . . . . . . . . . . . . . . . . . . . . 12E. Reasons this Study was Conducted . . . . . . . . . . . . . . . . . . . . . . . . . . . . . . . . . . 16F. Worker Health and Safety. . . . . . . . . . . . . . . . . . . . . . . . . . . . . . . . . . . . . . . . . . .
17
II. NATIONAL F006 BENCHMARKING STUDY APPROACH . . . . . . . . . . . . . . . . . . 20A. Overview . . . . . . . . . . . . . . . . . . . . . . . . . . . . . . . . . . . . . . . . . . . . . . . . . . . . . 20B. Methodology . . . . . . . . . . . . . . . . . . . . . . . . . . . . . . . . . . . . . . . . . . . . . . . . . . 20
1. Regional Benchmarking Study . . . . . . . . . . . . . . . . . . . . . . . . . . . . . . . . . . . 212. National Benchmarking Study . . . . . . . . . . . . . . . . . . . . . . . . . . . . . . . . . . . 233. Statistical Analysis of the Regional and National Benchmarking Data . . . . . 234. Survey of Commercial Recyclers . . . . . . . . . . . . . . . . . . . . . . . . . . . . . . . . . 245. Survey of Community Environmental Groups . . . . . . . . . . . . . . . . . . . . . . . 24
III. RESULTS OF THE F006 BENCHMARKING STUDY . . . . . . . . . . . . . . . . . . . . . . . 24A. Summaries of Regional and National Benchmarking F006 Waste Characterization
Data . . . . . . . . . . . . . . . . . . . . . . . . . . . . . . . . . . . . . . . . . . . . . . . . . . . . . . . . . 241. Benchmarking Summary Tables . . . . . . . . . . . . . . . . . . . . . . . . . . . . . . . . . . 242. Statistical Analysis: Does this Data Come from “Typical” Metal Finishers?
. . . . . . . . . . . . . . . . . . . . . . . . . . . . . . . . . . . . . . . . . . . . . . . . . . . . . . . 243. Results of Commercial Recyclers and Citizen Group Surveys . . . . . . . . . . . . 25
B. Detailed Results of the Regional and National Benchmarking Studies . . . . . . . . . . . 291. The Milwaukee Benchmarking Study . . . . . . . . . . . . . . . . . . . . . . . . . . . . . . 292. Chicago Benchmarking Study . . . . . . . . . . . . . . . . . . . . . . . . . . . . . . . . . . . 473. Phoenix Benchmarking Study . . . . . . . . . . . . . . . . . . . . . . . . . . . . . . . . . . . 644. Detailed Results of the National Benchmarking Study . . . . . . . . . . . . . . . . . 79
Appendix A:Summary of the 10 Issue Areas Identified for the Metal Finishing Sector . . . . . . . . . . . 99
Appendix B:F006 Management Contained in EPA’s 1995 Biennial Report Database . . . . . . . . . . . 101
Appendix C:Observed F006 Handling Practices at Metal Finishing Facilities and List of Worker Healthand Safety Regulations . . . . . . . . . . . . . . . . . . . . . . . . . . . . . . . . . . . . . . . . . . . . . . . . 105

September 1998 2 F006 Benchmarking Study
Appendix D:Checklist Used to Identify Pollution Prevention Technologies at Metal Finishing Facilities
. . . . . . . . . . . . . . . . . . . . . . . . . . . . . . . . . . . . . . . . . . . . . . . . . . . . . . . . . . . . . . . . . 114
Appendix E:Laboratory Analysis Information: Constituents, Methods, and Detection Limits Used inthe Benchmarking Studies . . . . . . . . . . . . . . . . . . . . . . . . . . . . . . . . . . . . . . . . . . . . . 117
Appendix F:Regional Benchmarking Survey . . . . . . . . . . . . . . . . . . . . . . . . . . . . . . . . . . . . . . . . . 125
Appendix G:National Benchmarking Survey . . . . . . . . . . . . . . . . . . . . . . . . . . . . . . . . . . . . . . . . . 132
Appendix H:National Benchmarking Commercial Recyclers Survey . . . . . . . . . . . . . . . . . . . . . . . . 140
Appendix I:Responses to Citizen Group Phone Survey . . . . . . . . . . . . . . . . . . . . . . . . . . . . . . . . . 143
Appendix J: Statistical “Representativeness” of the National Benchmarking Study . . . . . . . . . . . . . 146

Borst, Paul A. U.S. EPA, Office of Solid Waste. Recycling of Wastewater Treatment Sludges from1
Electroplating Operations, F006. 1997.
September 1998 3 F006 Benchmarking Study
EXECUTIVE SUMMARY
This report presents current information about the metal finishing industry in the U.S., andis the result of a two year effort of the Metal Finishing workgroup of the Common Sense Initiative(CSI). The CSI was begun by the Environmental Protection Agency (EPA) in 1994 to explore“cleaner, cheaper, and smarter” environmental strategies beyond those required by regulation. Using the special authorities of the Federal Advisory Committee Act (FACA), EPA broughttogether representatives from federal, state, and local governments, industry, community-basedand national environmental interest groups, environmental justice groups and organized labor toexplore opportunities for managing environmental issues in new ways. Six industry sectors werechosen for the initial CSI efforts, including petroleum refining, automobile manufacturing, ironand steel production, electronics, printing and metal finishing.
Overview of the Metal Finishing Industry and Hazardous Waste Management.
Metal finishing refers to processes which deposit or “plate” a thin layer of metal and/orapply an additional organic topcoat as an outer coating on products received from othermanufacturing operations. Metal finishing is performed for either functional or decorativepurposes and affects many products we use everyday. For example, hard chrome plating is afunctional plating process that increases the hardness and durability of engine parts. Chromeplating automobile bumpers is an example of a decorative plating process.
EPA estimated that there were approximately 13,400 metal finishing establishments in theUnited States. Of the total, approximately 10,000 metal finishing facilities are estimated to be“captive” shops contained inside a larger manufacturing operation. The balance of 3,400 metalfinishing facilities are “job shops” or “independent” metal finishing operations that operate on ajob-specific contract basis. The total number of plating shops has decreased significantly since1
the 1970's, mainly as a result of increasing regulations and competition.
As in many manufacturing processes, some portion of the materials used in production orin the product itself are not totally captured as salable product, and exit the process inwastewater, solid waste, airborne emissions, scrap metal, or off-spec products. Prior to 1980,there were no federal regulations covering the discharge or disposal of wastes from metalfinishing operations, and the wastes, which contained metals as well as other substances, wereoften directly discharged to surface waters or disposed of in landfills or lagoons.
In 1980, EPA issued the Nation’s first hazardous waste management regulations, which“listed” sludges from electroplating wastewater treatment as a hazardous waste (F006), and setstandards for the storage, transportation, treatment and disposal of these sludges. EPAsimultaneously developed regulations that require metal finishers to significantly reduce oreliminate pollutants in wastewaters discharged to publically owned wastewater treatment systems

Borst, Paul A. U.S. EPA, Office of Solid Waste. Recycling of Wastewater Treatment Sludges from2
Electroplating Operations, F006. 1997.
September 1998 4 F006 Benchmarking Study
(final “pretreatment regulations were issued in 1986).
As a result of the strengthening of the federal regulations, the metal finishing industryimplemented many improvements in material use, production processes and waste managementmethods.
Metals contained in F006 have commercial value if they are present in sufficientconcentrations and if other analytes in the sludge are below levels which would interfere with themetal recovery process. There may be other materials contained in the sludge which do notinterfere with metals recovery, but which could be hazardous if improperly managed. Theeconomics of hazardous waste management is a strong determinant of whether metal finisherssend sludges for land disposal or to recycling facilities. Estimates of the amounts of sludge thatare recycled or land disposed vary widely. One source estimates that between 10 and 20 percentis recycled and between 80 and 90 percent is treated and land disposed.2
Why was this study conducted?
The CSI Metal Finishing Subcommittee focused on the metal finishing industry’s beliefthat process improvements made by many metal finishers during the past 20 years havesignificantly changed the composition of the F006 material that was listed and regulated in 1980,and it is the industry’s belief that modification of EPA’s hazardous waste regulations for F006could increase the metal finishing industry’s ability to recover and recycle more commerciallyvaluable metals from F006 than they currently recover, and simultaneously decrease the amountof metal finishing wastes disposed of in regulated landfills.
In order to evaluate the current status of the industry, the Subcommittee formed aworkgroup to complete a characterization of F006 and to report on the results as the foundationfor any further discussions regarding potential modifications to F006 regulations.
This report simply presents the data collected during the F006 Benchmarking Study as afoundation for further evaluation of F006. The CSI Workgroup did not attempt to analyze thedata to determine the extent to which the characteristics of F006 have changed based on industrypollution prevention practices or other factors. In Phase 2 of this effort, the Workgroup willanalyze the information presented in this report, and examine whether potential modifications ofthe current regulations applicable to F006 should be considered by EPA.
Worker Health and Safety
As part of the benchmarking study, the workgroup collected information on F006 handlingpractices, identified the potential hazards to workers, and described possible hazard control

September 1998 5 F006 Benchmarking Study
methods. In addition, the workgroup developed a list of the current worker health and safetyregulations and policies that may apply to on-site and off-site management of F006. Thisinformation is presented in Appendix C of this report. Beyond this information, the workgroupdid not attempt to complete a comprehensive review of worker health and safety issues associatedwith F006 management.
As indicated above, in Phase II of this effort the workgroup will examine whether possiblemodifications of the current regulations for F006 should be considered based on the informationin this study. As part of this effort, the workgroup will consider potential worker health andsafety issues when examining possible regulatory changes for F006.
The F006 Benchmarking Study Approach
The workgroup focused on three analytical questions to guide its work on characterizingcurrent practices in the metal finishing industry, and the composition and management of F006:
1) What are the characteristics of F006?2) What can metal finishers do to make F006 more recyclable, while optimizing
pollution prevention? What pollution prevention practices are in place at metalfinishing facilities?
3) What are the environmental impacts of F006 recycling?
While not an initial focus in this effort, the workgroup also examined worker health andsafety impacts in this study.
To answer these questions, the workgroup designed a five part “benchmarking study” togather current information on the metal finishing industry. This approach carefully balances theneed to gather detailed information from a diverse industry with funding and schedule limitations. The workgroup believes the study approach and the data presented in this report provide a veryuseful characterization of a cross section of “typical” metal finishing facilities and a strong sensefor the environmental awareness of many metal finishing companies. The workgroup alsorecognizes that there are facilities in the metal finishing industry which do not fit within the rangeof activities and practices characterized in this report, and that discussion of the data presented inthis report should take that into account. The workgroup also discussed the possibility that,despite the usefulness of the data gathered in the Benchmarking study, additional data might beneeded if subsequent discussions of policy options and/or regulatory options analysis warrantedmore data.
The study components summarized below, which are discussed in detail in the report,include:
A Regional Benchmarking Study that involved site visits to 29 metal finishing shops inthree cities to gather detailed data on plating processes, pollution prevention practices,F006 chemical analysis and F006 handling and management practices;

September 1998 6 F006 Benchmarking Study
A National Benchmarking Study that used a mail survey to gather less detailed data onmetal finishing operations, pollution prevention practices, F006 characteristics andmanagement practices from a broad range of metal finishers;
An Analysis of Statistical Representation to determine the extent to which the companiesparticipating in the regional and national benchmarking studies represent the universe ofmetal finishers.
A Commercial Recycling Company Mail Survey to gather data on the amount andchemical composition of F006 accepted for recycling by commercial recycling companies,and
A Community Interest Group Phone Survey to assess whether community groups in thevicinity of commercial recycling companies believe those companies are goodenvironmental and economic neighbors.
Results of the National F006 Benchmarking Study
The results of the five components of the study are presented in the main body of thereport. The results of the Regional and National Benchmarking Studies are presented in summaryform and in detail. The data describe the range of production, pollution prevention and wastemanagement practices employed by the facilities studied and the present information about thequantity and composition of F006 wastes produced. For example, the minimum, mean, median,and maximum values of F006 laboratory analyses are provided in a format that allows the readerto compare regional and national data. Detailed data for each of the 29 facilities that participatedin the Regional study, and detailed results from the National study are also presented.
The workgroup’s statistical analysis examined the extent to which the data gathered in theRegional and National Benchmarking studies represents the metal finishing universe, keeping inmind that the Regional and National Benchmarking studies were designed to give the workgroupdescriptive data for facilities which operate the most commonly used metal finishing processes. The Benchmarking study was not designed to capture data on the full range of metal finishingoperations. In short, the statistical analysis that was completed indicates that the BenchmarkingStudy results can not be assumed to statistically represent the entire metal finishing universe. Thisresult does not diminish the value of the Benchmarking study data. The Benchmarking Studydoes provide substantial additional data characterizing the F006 wastestream and provides asound starting point for further discussion.
The workgroup was not able to obtain enough data to complete the commercial recyclingstudy, therefore no results are presented. Results of the community group survey, which wasdesigned to accompany the results of the commercial recycling survey, are summarized eventhough the commercial recycling study was not completed.
The Appendices of this report contain further details supporting various aspects of thestudy.

September 1998 7 F006 Benchmarking Study
Project participants:
The following people participated in this project:
John Linstedt (Artistic Plating, Inc.), Diane Cameron (Natural Resources Defense Council),Bill Sonntag, Al Collins, and participating members of the American Electroplaters and Surface Finishers Society, National Association of Metal Finshers, and the Metal FinishingSuppliers Association, Andy Comai (United Auto Workers),Tom Wallin (Illinois EPA),Doreen Sterling (US EPA), Mike Flynn (US EPA),Jim Lounsbury (US EPA), Jeff Hannapel (US EPA)John Lingelbach (facilitator, Decisions and Agreements, LLC) and,the SAIC Contractor Support Team.

September 1998 8 F006 Benchmarking Study
I. BACKGROUND
A. What is the Common Sense Initiative?
In 1994, the Administrator of the Environmental Protection Agency, Carol Browner,launched the Common Sense Initiative (CSI), describing it as a “fundamentally different system"to explore industry-specific strategies for environmental protection. The program is designed topromote "cleaner, cheaper, and smarter" environmental performance, using a non-adversarial,stakeholder consensus process to test innovative ideas and approaches. Six industry sectors wereselected to participate in CSI: Petroleum Refining, Auto Manufacturing, Iron and Steel, MetalFinishing, Printing, and Computers and Electronics.
In January of 1995, the Environmental Protection Agency (EPA) chartered the MetalFinishing Sector Subcommittee of the Common Sense Initiative under the Federal AdvisoryCommittee Act. The Metal Finishing Subcommittee includes representatives of EPAHeadquarters and Regional offices, the metal finishing industry and its suppliers, stategovernment, Publicly Owned Treatment Works (POTWs), national and regional environmentalorganizations, the environmental justice community, and organized labor.
The CSI Metal Finishing Sector was challenged by Administrator Carol Browner todevelop a consensus package of “cleaner, cheaper, and smarter” policy actions for the industry asa whole, based on the lessons learned from the Sector's projects and dialogue. Based on thischallenge the Subcommittee established a workgroup to develop a strategic policy and programframework for the industry.
The Metal Finishing Strategic Goals Program, designed by this multi-stakeholder group,establishes a set of voluntary National Performance Goals for the industry that represent "betterthan compliance" environmental performance for metal finishers. The Metal Finishing GoalsProgram, summarized in Table 1, includes facility-based numerical performance targets whichtrack the CSI themes of cleaner, cheaper, and smarter performance.
The goals program also includes a detailed Action Plan that addresses nine important issueareas (listed in Appendix A) for the metal finishing industry. By implementing the Action Plan,stakeholders provide incentives, create tools, and remove barriers for metal finishers to achievethe National Performance goals. Today’s report presents the results of the first phase of theWaste Minimization and Recovery issue area.
The Waste Minimization and Recovery Issue examines the metal finishing industry’s beliefthat process improvements made by many metal finishers during the past 20 years havesignificantly changed the nature of the industry’s wastewater treatment sludges, which areregulated as a hazardous waste known as F006 under the Resource Conservation and RecoveryAct (RCRA). The metal finishing industry also believes that modification of EPA’s hazardouswaste regulations for F006 could increase the metal finishing industry’s ability to recover morecommercially valuable metals (contained in F006) than they currently recover, and simultaneouslydecrease the amount of metal finishing wastes disposed of in regulated landfills.

September 1998 9 F006 Benchmarking Study
Table 1: National Metal Finishing Performance Goals (By Year 2002)
(1) Improved Resource Utilization (“Smarter”)
(a) 98% of metals ultimately utilized on product. (b) 50% reduction in water purchased/used (from 1992 levels). (c) 25% reduction in facility-wide energy use (from 1992 levels)
(2) Reduction in Hazardous Emissions and Exposures (i.e.,“Cleaner”)
(a) 90% reduction in organic TRI emissions and 50% reduction in metals emissions to air and water (from 1992 levels). (b) 50% reduction in land disposal of hazardous sludge and a reduction in sludge generation (from 1992 levels). (c) Reduction in human exposure to toxic materials in the facility and the surrounding community, clearly demonstrated by action selected and taken by the facility. Such actions may include, for example, pollution prevention, use of state-of the-art emission controls and protective equipment, use of best recognized industrial hygiene practices, worker training in environmental hazards, or participation in the Local Emergency Planning Committees.
(3) Increased Economic Payback and Decreased Costs (“Cheaper”)
(a) Long-term economic benefit to facilities achieving Goals 1 and 2. . (b) 50% reduction in costs of unnecessary permitting, reporting, monitoring, and related activities (from 1992 levels), to be implemented through burden reduction programs to the extent that such efforts do not adversely impact environmental outcomes.
(4) Industry-Wide Achievement of Facility Goals.
(a) 80% of facilities nationwide achieve Goals 1 - 3.
(5) Industry-Wide Compliance with Environmental Performance Requirements.
(a) All operating facilities achieve compliance with Federal, State, and local environmental performance requirements. (b) All metal finishers wishing to cease operations have access to a government sponsored “exit strategy” for environmentally responsible site transition. (c) All enforcement activities involving metal fishing facilities are conducted in a consistent manner to achieve a level playing field, with a primary focus on those facilities that knowingly disregard environmental requirements.
Note: At facilities where outstanding performance levels were reached prior to 1992, the percentage-reductiontargets for Goals 1 (b) and (c), and 2 (a) and (b) may not be fully achievable, or the effort to achieve them maynot be the best use of available resources. In these instances, a target should be adjusted as necessary to make itboth meaningful and achievable.
The group formed to address this issue is the Metal Finishing F006 BenchmarkingWorkgroup, comprised of representatives from the metal finishing, the recycling industry,environmental interests, organized labor, local government and the EPA. The workgroup hascompleted a two year effort to gather new information on the generation, characteristics and

USEPA, Office of Policy, Planning and Evaluation. SUSTAINABLE INDUSTRY: Promoting3
Environmental Protection in the Industrial Sector, Phase 1 Report. June 1994.
Borst, Paul A. U.S. EPA, Office of Solid Waste. Recycling of Wastewater Treatment Sludges from4
Electroplating Operations, F006. 1997.
Kirk-Othmer. Encyclopedia of Chemical Technology (4th ed.), 199--888, v.95
USEPA, Office of Solid Waste, Hazardous Waste F006 Listing Background Document, p.107.6
September 1998 10 F006 Benchmarking Study
management of electroplating wastewater treatment sludges (F006). The workgroup’s approachand results are described in detail in the remainder of this report.
B. The Metal Finishing Industry and Electroplating Wastewater Treatment Sludges
EPA estimated that there were approximately 13,400 metal finishing establishments in theUnited States. Of the total, approximately 10,000 metal finishing facilities are estimated to be3
“captive” shops where the metal finishing operation is contained inside a larger manufacturingoperation. The balance of 3,400 metal finishing facilities are “job shops” or “independent” metalfinishing operations. Job shops are usually small businesses that operate on a job-specific contractbasis. The total number of plating shops has decreased since the 1970's, mainly as a result of4
increasing regulatory burden and competition. One source estimates that the number of metalfinishers decreased to as low as 7,200 in 1992. 5
Metal finishing refers to processes which deposit or “plate” a thin layer of metal and/or anadditional organic topcoat as an outer coating on products received from other manufacturingoperations. Metal finishing is performed for either functional or decorative purposes and affectsmany products we use everyday. A large percentage of all metal or metalized products requiresurface finishing before the product is ready for final use. Some examples of functional usesinclude: hard chrome plating to increase hardness and durability in engine parts; zinc plating toincrease the corrosion resistance of fasteners; tin and silver plating electrical contacts in electricaldistribution switches for electrical enhancement and corrosion resistance; and gold plating in highquality communications applications. Chrome plating automobile bumpers is an example of adecorative plating process. 6
Metal plating involves a sequence of steps, including metal surface preparation andcleaning, metal deposition, rinsing, and wastewater treatment. The electroplating step involvesimmersing an object into a solution of metal ions and applying an external reductive source. Control of the electrical current, solution temperature, pH, and solution chemistry determines thethickness of the deposit. Other forms of metal finishing and plating are used by some shops, e.g.,electroless plating, however, they are not the focus of this study. Table 2, below, lists frequentlyused metals and their applications.
C. F006 Sludge Generation and Management

September 1998 11 F006 Benchmarking Study
As in many manufacturing processes, some portion of the materials used in production orin the product itself are not totally captured as salable product, and exit the process inwastewater, solid waste, airborne emissions, scrap metal, or off-spec products. Captive shops,which repeat the same plating operations over time, use a relatively homogeneous mix of
Table 2. Frequently Used Metals and Their Applications
Property/Function Principal Plating Metals
Decorative Chromium, copper, nickel, brass, bronze, gold, silver, platinum, zinc
Corrosion resistance Nickel, chromium, electroless nickel, zinc, cadmium, copper, copperalloys, silver, tin, gold
Wear, lubricity, hardness Chromium, electroless nickel, bronze, nickel, cadmium, silver, tin, metalcomposites
Bearings Copper, bronze, silver, silver alloys, lead-tin
Joining, soldering, brazing, electrical Nickel, electroless nickel, electroless copper, copper, cadmium, gold,contact resistance, conductivity silver, lead-tin, tin, cobalt
Barrier coatings, anti-diffusion, heat- Nickel, cobalt, iron, copper, bronze, tin-nickel, palladium treatment
Electromagnetic shielding Copper, electroless copper, nickel, electroless nickel, zinc
Paint/lacquer base, rubber bonding Zinc, tin, chromium, brass
Electroforming manufacturing Copper, nickel
Electronics manufacturing Electroless copper, copper, electroless nickel, nickel, gold, palladium
Dimensional buildup, salvage of wornparts
Chromium, nickel, electroless nickel, iron, silver
Source: Electroplating Engineering Handbook, 1996.
chemicals and, consequently, generate a relatively contant mix of wastes. Job shops are morelikely to change processes to meet the demand of a range of customers, which changes the mix ofmaterials used to plate products and the mix and concentration of wastes generated. Thisdifference in operations drives differences in the wastes generated by these shops.
F006 sludge is formed by adding precipitation chemicals in electroplating wastewatertreatment systems. The precipitation chemicals are used to remove toxic metals and otherhazardous constituents from the wastewater, a large portion of which settle to the bottom assludge. The sludge (F006) is a very wet metal hydroxide mixture that is removed from thetreatment tank and usually “dewatered” in large presses, leaving a wet mud that is generally 25percent solids by weight. Sludges are sometimes dried to further reduce moisture content andweight. The sludge is stored in containers, such as, “super sacks,” or larger “roll off boxes,” andis sent by truck or rail to RCRA permitted treatment and disposal facilities, or to hazardous waste

Borst, Paul A. U.S. EPA, Office of Solid Waste. Recycling of Wastewater Treatment Sludges from7
Electroplating Operations, F006. 1997.
op. cit.8
Prior to land disposal, F006 must be treated to meet the treatment standards specified in EPA’s Land9
Disposal Restrictions regulations, 40 CFR Part 268, to immobilize toxic constituents, mainly metals. Stabilization isone technology that may be utilized, however, other technologies may be used.
The Biennial Reporting System is not designed to provide “treatment train” (e.g., stabilization followed by10
landfilling) information. Therefore, in an effort to avoid double counting, these quantities were calculated from facilitiesreporting F006 management as either recycling or landfilling. In other words, the majority of the wastes go throughsome interim management steps (e.g., stabilization, blending) not accounted for in these calculations. It would bevirtually impossible to account for the final management of sludge going through offsite treatment prior to finaldisposition. In this case, only about 25% of the volume generated is accounted for.
September 1998 12 F006 Benchmarking Study
permitted recycling facilities, which recover economically valuable metals from the sludge andland dispose the remaining material.
The metals contained in F006 have commercial value if they are present in sufficientconcentrations and if other analytes in the sludge are below levels which would interfere with themetal recovery process. There may be other materials contained in the sludge which do notinterfere with metals recovery, but which could be hazardous if improperly managed. Recyclingfacilities generally blend F006 shipments from several generators to meet recycling specificationsfor a particular target metal in the sludge. Secondary smelting, which is the most frequently usedrecovery technology, “melts” a target metal (e.g., copper) from mixtures of F006, scrap copper,and other copper containing secondary materials. Often multiple metals are captured. Smeltingwastes are generally land disposed.
Estimates of the amounts of sludge that are recycled or land disposed vary widely. Onesource estimates that between 10 and 20 percent is recycled and between 80 and 90 percent ofF006 is treated and disposed of through stabilization and placement in RCRA hazardous wastelandfills. In 1993, the National Association of Metal Finishers estimated that approximately 15 to7
20 percent of F006 is recycled for metal recovery. EPA’s Biennial Reporting System (BRS)8
indicates that 824 metal finishers which are large quantity (more than 1,000 kg/month) generatorsof hazardous waste) recycled 282,000 tons of F006 in 1995, and 283 large quantity metalfinishing generators treated and disposed of 99,000 tons of F006 in RCRA regulated landfills per9
year. The results contained in today’s report are inconclusive and do not narrow the widevariation in recycling estimates. These figures are explained in more detail in Appendix B.10
D. Basis for Listing F006-Electroplating Wastewater Treatment Sludges as a RCRAHazardous Waste in 1980
In the early 1970's, the U.S. enacted legislation to reduce discharges of pollutants to U.S.waters. In subsequent years, EPA, States and local governments developed wastewaterpretreatment regulations which require industry, including metal finishers, to significantly reduceor eliminate pollutants from their wastewater before sending their wastewater to publicly owned

A solid waste may be classified as a hazardous wastes if: 1) it exhibits a characteristic for ignitability,11
corrosivity, reactivity, or toxicity (40 CFR Part 261 Subpart C), or 2) if, classified as a listed waste (40 CFR Subpart D).
September 1998 13 F006 Benchmarking Study
sewer treatment systems (40 CFR Part 413). Final Federal standards were promulgated July,1986(at 40 CFR §§413 and 433).
Solid waste legislation in 1976, i.e., RCRA, required EPA to designate categories ofindustrial waste which are “hazardous,” and to issue regulations which ensure safe generation,storage, transportation, treatment and disposal of these wastes. Metal finishers were among thefirst industries to be regulated under the hazardous waste regulations in 1980.
EPA “listed” the wastewater treatment sludges from certain electroplating operations as ahazardous waste (hazardous waste code F006) under Subtitle C of RCRA in 1980 based on a11
variety of factors (45 F.R. 74884, November 12, 1980). Key to this decision were typically highlevels of cadmium, nickel, hexavalent chromium and complexed cyanides in the sludge that couldpose a substantial present or potential hazard to human health and the environment if improperlymanaged. The Extraction Procedure Toxicity Characteristic (or EP) test used at that time (at 43FR 58956-58957); and the ASTM distilled water leaching test, showed that these metals leachedout of the sludge in significant concentrations, which increased the possibility of groundwatercontamination if these wastes were improperly disposed. Leaching tests run by the AmericanElectroplaters’ Society (AES) under an EPA grant yielded cyanide leach concentrations of 0.5 to170 mg/l, cadmium levels of non-detectable to 268 mg/l, and chromium levels of 0.12 to 400mg/l.
At that time, EPA also estimated that a majority of metal finishers discharged theirwastewater to POTWs without treating the wastewater. The remainder discharged to waters ofthe U.S., on-site lagoons, or surface impoundments. Based upon data collected from 48 facilitiesthat did not treat their waste in 1976, EPA estimated that 20 percent disposed of their solid wasteon-site while 80 percent sent their solid waste off-site for disposal in a municipal or commerciallandfill.
Prior to the issuance of RCRA hazardous waste regulations in 1980, there were no Federal requirements for management of metal finishing sludges. Disposal practices includedlandfilling, lagooning, drying beds and drum burial. These sites frequently lacked leachate andrunoff control practices, which increased the risk of percolation of heavy metals and cyanides intosoils, groundwater and surface waters. Numerous damage incidents (e.g., contaminated wells,destruction of animal life) attributable to improper electroplating waste disposal were reported,indicating that mismanagement was an actual, rather than a perceived or potential threat. Thelong term persistence of heavy metals in the environment increased the potential for risk. Thedata EPA used for its listing determination came from various sources. Some of the data wasover 20 years old while other data used in the determination was current at that time.
Tables 3a and 3b are taken from EPA’s F006 listing regulatory support documents (1980). Table 3a summarizes the chemical composition of typical electroplating baths used in the 1970's. Table 3b summarizes information on heavy metal concentrations in sludges.

September 1998 14 F006 Benchmarking Study
Table 3a: Typical Electroplating Baths and Their Chemical Composition
Plating Compound Constituents Concentration (g/l)
1. Cadmium Cyanide Cadmium oxide 22.5Cadmium 19.5Sodium cyanide 77.9Sodium hydroxide 14.2
2. Cadmium Fluoborate Cadmium fluoborate 251.2Cadmium (metal) 94.4Ammonium fluoborate 59.0Boric acid 27.0Licorice 1.1
3. Chromium Electroplate Chromic acid 172.3Sulfate 1.3Fluoride 0.7
4. Copper Cyanide Copper cyanide 26.2Free sodium cyanide 5.6Sodium carbonate 37.4Rochelle salt 44.9
5. Electroless Copper Copper nitrate 15Sodium bicarbonate 10Rochelle salt 30Sodium hydroxide 20Formaldehyde (37%) 100 ml/l
6. Gold Cyanide Gold (as potassium gold cyanide) 8Potassium cyanide 30Potassium carbonate 30Depotassium phosphate 30
7. Acid Nickel Nickel sulfate 330Nickel chloride 45Boric acid 37
8. Silver Cyanide Silver cyanide 35.9Potassium cyanide 59.9Potassium carbonate 15.0Metallic silver 23.8Free cyanide 41.2
9. Zinc Sulfate Zinc sulfate 374.5Sodium sulfate 71.5Magnesium sulfate 59.9
Source: EPA F006 Listing Background Document, 1980

September 1998 15 F006 Benchmarking Study
Table 3b: Heavy Metal Content for Chromium and Cadmium in Electroplating Sludges (Dry Weight ppm)
Primary Plating Process Chromium Cadmium
Segregated Zinc 200 <100
Segregated Cadmium 62,000 22,000
Zinc Plating and Chromating 65,000 1,100
Copper-Nickel-Chromium on Zinc 500 ND
Aluminum anodizing (chromic process) 1,700 ND
Nickel-Chromium on steel 14,000 --
Multi-process job 25,000 1,500
Electroless Copper on Plastic, Acid Copper, Nickel Chromium 137,000 ND
Multi-process with Barrel or Vibratory Finish 570 --
Printed Circuits 3,500 <100
Nickel-Chromium on Steel 79,200 <100
Cadmium-Nickel-Copper on Brass and Steel 48,900 500
Source: EPA F006 Listing Background Document, 1980
Only certain metal finishing sludges were listed as hazardous wastes. Others studied weredetermined to not pose a substantial hazard. Regulated F006 includes:
Wastewater treatment sludges from electroplating operations except from the followingprocesses: (1) sulfuric acid anodizing of aluminum; (2) tin plating on carbon steel; (3)zinc plating (segregated basis) on carbon steel; (4) aluminum or zinc-aluminum platingon carbon steel; (5) cleaning/stripping associated with tin, zinc, and aluminum plating oncarbon steel; and (6) chemical etching and milling of aluminum. (see 40 CFR 261.31)
The promulgation of effluent guidelines for the metal finishing industry in 1986significantly increased the quantities of wastewater treatment sludge generated. This increaseoccurred because the guidelines required metal finishers to treat their wastewater to remove orreduce pollutants prior to discharge to either a publicly owned treatment works (POTW) ordirectly to waters of the U.S. To comply with the effluent guidelines, metal finishers added iron,lime and other chemicals to precipitate out or destroy pollutants such as chrome, zinc, copper andcyanide. The precipitate formed F006 sludge, which was then filtered and managed in compliancewith RCRA regulations.
Current estimates of annual F006 generation in the United States range from 360,000 tonsdry weight equivalent (F006 industry estimate) to 500,000 tons dry weight equivalent 1,252,072

Borst, Paul A. U.S. EPA, Office of Solid Waste. Recycling of Wastewater Treatment Sludges from12
Electroplating Operations, F006. 1997.
September 1998 16 F006 Benchmarking Study
tons/wet weigth (1989 EPA estimate). Most of this material is in the physical form of metalhydroxide sludges.12
F006 is subject to the full set of RCRA hazardous waste regulations (e.g., manifestingburden, training, emergency response plans). Metal finishers are also subject to OSHA and EPAworker health and safety regulations to protect workers from the potential effects of any toxicmaterials or other hazards in the workplace. Appendix C provides a list of the worker health andsafety regulations and their applicability to metal finishers.
E. Reasons this Study was Conducted
The metal finishing industry believed that many metal finishers have significantly changedthe way they operate since 1980, and that the chemical makeup of F006 is more amenable torecycling than it was in 1980. The strengthening of wastewater pretreatment, hazardous wastemanagement, and hazardous waste minimization requirements since 1980 have had a positiveimpact on materials used, improved process operations, and better waste management practices inthe metal finishing. These improvements have reduced the pollutants contained in F006.The industry also believed that these changes may be substantial enough to warrant modificationof regulatory controls. This report provides current information about the metal finishingindustry in the U.S. and presents data characterizing F006.
The metal finishing industry responded to the strengthening of wastewater and hazardouswaste regulations with improvements in alternative plating chemistries, production managementpractices, equipment, and waste management technology. For example, the installation ofcountercurrent flow, spray rinsing and drag out reduction methods are examples of techniquesthat reduce wastewater volumes and the amount of metals and other chemicals used. Some metalfinishing companies installed pollution prevention methods which are targeted at further reducingor eliminating the use of specific toxic materials. The most notable have been: the replacement oftraditional cyanide-based plating solutions (e.g., for zinc and copper plating) with alkaline-basedplating solutions; the substitution of trivalent chromium for highly toxic hexavalent chromium forsome applications; and the replacement of some single metal systems with alloy systems (e.g.,replacing cadmium with zinc-nickel).
In 1980, EPA published regulations which set standards for permitting hazardous wasteland disposal facilities, and in 1988, EPA promulgated land disposal restrictions regulations whichrequire metal finishers to treat F006 to meet the treatment standards specified in this rule. Therule requires F006 to be treated to immobilize toxic constituents, mainly metals. Stabilization isone technology that may be utilized, however, other technologies may be used. methods beforedisposing of the waste in landfills.
The economics of waste disposal result in most F006 being land disposed rather thanrecycled because recycling is typically more expensive. This means potentially recoverable metals

NCMS/NAMF. Pollution Prevention and Control Technology for Plating Operations. 1994.13
September 1998 17 F006 Benchmarking Study
(i.e., those which are land disposed) are no longer available for commerce. Several of the moreprominent metals (e.g., nickel and chromium) are strategic metals which are not available in theU.S.
The results of a 1993 study by the National Center for Manufacturing Sciences (NCMS)and the National Association of Metal Finishers (NAMF) show that 90 percent of the 318facilities that responded (16% response rate of 1,971 facilities queried) use pollution preventionmethods and benefitted from them. Water conservation and in process recycling techniques werenoted to be more frequently used than chemical recovery. Approximately 60 percent ofrespondents attempted material substitution to reduce or eliminate one or more of the followingmaterials: cadmium, chromium (hexavalent), cyanide, and chlorinated solvents. 13
Some metal finishers recover precious or other metals on site (the number of facilities thatconduct on-site recovery is not available). Other facilities ship F006 to recycling facilities torecover commercially valuable metals, or to RCRA permitted treatment and disposal facilities. Table 4 summarizes an array of pollution prevention measures that may be used in metal finishingoperations.
Worker Health and Safety
As part of the benchmarking study, the workgroup collected information on F006 handlingpractices, identified the potential hazards to workers, and described possible hazard controlmethods. In addition, the workgroup developed a list of the current worker health and safetyregulations and policies that may apply to on-site and off-site management of F006. Thisinformation is presented in Appendix C of this report. Beyond this information, the workgroupdid not attempt to complete a comprehensive review of worker health and safety issues associatedwith F006 management.
This report presents data collected during the F006 Benchmarking Study as a foundationfor further evaluation of F006. The CSI Workgroup did not attempt to analyze the data todetermine the extent to which the characteristics of F006 have changed based on industrypollution prevention practices or other factors. In Phase 2 of this efort, the Workgroup willanalyze the information presented in this report, and examine whether potential modifications ofthe current regulations applicable to F006 should be considered by EPA.
Table 4: Examples of Pollution Prevention Measures
Method Pollution Prevention Benefits
Improved Operating Practices

Table 4: Examples of Pollution Prevention Measures
Method Pollution Prevention Benefits
September 1998 18 F006 Benchmarking Study
Remove cadmium and zinc anodes from bath • Eliminates cadmium/zinc buildup causing decanting ofwhen it is idle. Anodes baskets can be placed on solution due to galvanic cell set up between steel anode basketremovable anode bars that are lifted from tank by and cadmium/zinc anodesan overhead hoist • Maintains bath within narrow Cd/Zn concentration providing
more predictable plating results
Eliminate obsolete processes and/or unused or • Reduces risks associated with hazardous chemicalsinfrequently used processes • Creates floor space to add countercurrent rinses or other P2
methods• Creates safer and cleaner working environment
Waste stream segregation of contact and non- • Eliminates dilution of process water prior to treatment whichcontact wastewaters can increase treatment efficiency
• Reduces treatment reagent usage and operating costs
Establish written procedures for bath make-up • Prevents discarding process solutions due to incorrectand additions. Limit chemical handling to trained formulations or contaminationpersonnel. Keep tank addition logs • Improves plating solution and work quality consistency
•Improves shop safety
Install overflow alarms on all process tanks to • Minimizes potential for catastrophic loss of process solutionprevent tank overflow when adding water to make via overflowup for evaporative losses • Prevents loss of expensive chemicals
Conductivity and pH measurement instruments • Identifies process solution overflows and leaks before totaland alarm system for detecting significant loss occurschemical losses • Alerts treatment operators to potential upset condition
• Reduces losses of expensive plating solutions
Control material purchases to minimize obsolete • Reduces hazardous waste generationmaterial disposal • Reduces chemical purchases
Use process baths to maximum extent possible • Prevents discarding of solutions prematurelybefore discarding. Eliminate dump schedules. • Reduces chemical costsPerform more frequent chemical analysis • Chemical adjustments of baths will improve work quality
Reduce bath dumps by using filtration to remove • Extends bath lifesuspended solids contamination • Reusable filter cartridges reduce solid waste generation
• Improves bath performance
Deburring containment • Segregates waste
Ultrafiltration, oil removal • Removes contaminants from cleaning wastes, promotes recycling
Process/Chemical Substitution
Substitute cyanide baths with alkaline baths when • Eliminates use of CNpossible
Substitute trivalent chromium for hexavalent • Reduces/eliminates use of hexavalent chromiumchromium when product specifications allow.

Table 4: Examples of Pollution Prevention Measures
Method Pollution Prevention Benefits
September 1998 19 F006 Benchmarking Study
Eliminate use of cadmium plating if product • Eliminates the use of cadmiumspecifications allow
Eliminate cyanide copper • Eliminates use of CN
Introduce deposit substitutes: e.g., Zn-Ni alloy • Eliminates use of Cdreplaces cadmium
Drag-Out Reduction Methods that Reduce Waste Generation
Install fog rinses or sprays over process tanks to • Can inexpensively recover a substantial portion of drag outremove drag out as rack/part exits bath and does not require additional tankage
Minimize the formation of drag out by: •Reduces pollutant mass loading on treatment processes,redesigning parts and racks/barrels to avoid cup treatment reagent usage, and resultant sludge generationshapes, etc. that hold solution; properly racking • May improve treatment operation/removal efficiencyparts; and reducing rack/part withdraw speed • Reduces chemical purchases and overall operating costs
Introduction of barrel spray rinsing • Reduces pollutant mass loading on treatment processes,treatment reagent usage, and resultant sludge generation
Automation control • Reduces process error and process waste
Rinse Water Reduction Methods that Reduce Waste Generation
Install flow restrictors to control the flow rate of • Reduces water use and aids in reducing variability inwater wastewater flow
• Very inexpensive to purchase and install
Install conductivity or timer rinse controls to • Coordinates water use and production when properlymatch rinse water needs with use implemented
• Provides automatic control of water use
Use counter-current rinse arrangement with two • Major water reduction can be achievedto four tanks in series depending on drag out rate • High impact on water bills
• May reduce the size of needed recovery/treatment equipment
Track water use with flow meters and • Identifies problem areas including inefficient processes oraccumulators. Keep logs on water use for personnelindividual operations • Helps management to determine cost for individual plating
processes.
Install pulsed spray rinsing • Reduced wastewater generation
Source: NCMS/NAMF. Pollution Prevention and Control Technology for Plating Operations. 1994

USEPA, Office of Solid Waste. Quality Assurance Project Plan For the Metal14
Finishing Industry. October, 1997.
September 1998 20 F006 Benchmarking Study
II. NATIONAL F006 BENCHMARKING STUDY APPROACH
A. Overview
The workgroup focused on three analytical questions to guide its work on characterizingcurrent practices in the metal finishing industry, and the composition and management of F006:
1) What are the characteristics of F006?2) What can metal finishers do to make F006 more recyclable, while optimizing pollution prevention? What pollution prevention measures are in place at metal finishingfacilities?3) What are the environmental impacts of F006 recycling?
While not an initial focus in this effort, the workgroup also examined worker health andsafety impacts in this study.
The workgroup then designed a two year study methodology to address the threeanalytical objectives. The study methodology is discussed below.
The technical work required for this study was completed by Science ApplicationsInternational Corporation under contract to EPA. The contract work was managed by an EPAworkgroup member working in close coordination with the workgroup. The workgroupmonitored progress and critiqued results throughout the analysis process.
B. Methodology
The workgroup designed a five part “benchmarking” study approach to address the threeanalytical questions identified above. A Quality Assurance Project Plan was developed andapproved for this study and is available in a separate report . The five portions of the study are14
summarized below and discussed in more detail in the remainder of this section. The five studyportions include:
D. A “Regional Benchmarking Study” that involved site visits to 29 metal finishingshops in three cities to gather detailed data on plating processes, pollutionprevention practices, F006 chemical analysis and F006 handling and managementpractices;
E. A “National Benchmarking Study” that used a mail survey to gather less detailed
data on metal finishing operations, pollution prevention practices, F006characteristics and management practices from a broad range of metal finishers;

September 1998 21 F006 Benchmarking Study
C An analysis which evaluates the extent to which the regional and nationalbenchmarking studies represent the universe of metal finishers.
C A Survey of Commercial Recycling Companies to gather data on the amount ofF006 recycled and the chemical composition of F006 accepted for recycling, and
C A “Community Interest Group Phone Survey” to assess whether communitygroups in the vicinity of commercial recycling companies believe those companiesare good environmental and/or economic neighbors.
Each of the above components of the study involved a series of analytical steps. Theapproach used to complete each study component is described below. The results are presentedin Section III of this report.
1. Regional Benchmarking Study
The workgroup developed a method for identifying and gathering information from metalfinishing companies that are judged to be “typical” facilities in the metal finishing universe.
The workgroup identified ten cities that are known to have high populations of metalfinishing facilities. Milwaukee, Chicago, and Phoenix were chosen as cities which arerepresentative of the metal finishing industry in terms of the processes they use and the industriesthey serve.
The workgroup agreed on a list of criteria for selecting facilities, and tried to include, asmuch as possible, a balanced distribution of the following criteria in making facility selections:
C Type of shop: captive/job,C Size: number of employees,C Type of deposition process in use,C Pollution prevention technologies in use,C In-house metal recovery technologies:
-- counterflow rinse,-- ultrafiltration/microfiltration,-- other ion exchanges,-- electrolytic metal recovery,-- electrodialysis, or-- reverse osmosis; and
C F006 treatment technology: -- alkaline precipitation,-- offsite metals recovery,-- landfilling of F006,-- other.
The workgroup developed additional information regarding the third criteria listed above,“type of deposition process in use. The workgroup identified five plating processes which areamong the most frequently used processes in the metal finishing industry. Studying facilities that

September 1998 22 F006 Benchmarking Study
operate these processes would provide the workgroup with key information about these commonprocesses. The five processes included:
-Zinc (Zn) plated on steel,-Nickel (Ni)/chromium (Cr) plated on steel, followed by plated on steel,-Cu/Ni/Cr on non-ferrous alloys, -Cu plating/stripping in the printed circuit industry, and-Cr on steel.
These five processes are among the 25 most common processes identified in theNCMS/NAMF study (1994), and were the main criteria in selecting facilities in Milwaukee. Facility selection in Chicago began using the five processes, but resulted in a principal focus onfacilities that operate copper/nickel/chromium electroplate on nonferrous processes, a platingprocess used by one-half of Chicago platers. Facility selection in Phoenix focused on obtainingdata from metal finishers that serviced the printed circuit board and aerospace industries.
The workgroup identified a Point of Contact (POC) in each city. The POC and theworkgroup identified 10 facilities and several alternates located in or near each of the threebenchmarking cities that fit the criteria sought for each city and were willing to participate in thestudy. At their request, facilities remained anonymous to the workgroup throughout theselection and information gathering process. Facilities are identified as F1, F4, F11, etc.
A facility selection table was completed for each city (see Section IV), and the workgroupmade its selections based on the criteria discussed above. An overview of facility selection foreach city is discussed below.
Milwaukee: The POC gathered information on 15 facilities, from which the workgroupselected 10 facilities and three alternates. Each of the 10 facilities and three alternates wascontacted to schedule a site visit for completing a profile of operations and waste sampling andanalysis. Three of the 10 facilities were eliminated during the site visits because it was determinedthat their sludges are not F006, and the three alternates were added. The third alternate wassubsequently eliminated because their sludge is excluded from the definition of F006. Consequently, only nine facilities were included in the Milwaukee benchmarking study.
Chicago: The POC in Chicago identified 14 metal finishers willing to participate in thestudy, from which the workgroup selected 10 and three alternates. Each of the ten facilities andalternates was contacted to schedule site visits.
Phoenix: The POC in Phoenix identified 13 metal finishers, from which the workgroupselected 10 facilities and three alternates. One facility was eliminated during the site visit becauseit plated every two months as a batch operation and no F006 sludge was available during the timeof the study. An alternate site was added.
A survey was mailed to each facility to gather basic data from facility records (Appendix Fcontains a copy of the Regional Benchmarking Survey). On-site visits were completed to gatherdetailed data on metal finishing processes, pollution prevention practices, recycling practices,

September 1998 23 F006 Benchmarking Study
F006 quantities, and F006 handling and management practices (handling practices were recordedonly in Chicago and Phoenix). The site visit information collection protocol is provided inAppendix D.
In addition to gathering information on plating processes, pollution prevention methods,F006 generation quantities and F006 management, a total of 46 composite samples of F006 werecollected from the 29 facilities and transported to an EPA certified laboratory for chemicalanalysis and quality assurance methods. Two samples of F006 sludge were collected at somefacilities (selected at random) as spot checks for variability in chemical content. All samples wereanalyzed for total concentrations of metals, TCLP metals, and general chemistry analytes. Four ofthe samples collected in Milwaukee were also analyzed for total volatile and semivolatile organicconstituents, and TCLP volatile and semivolatile organic constituents, but since the results of theorganic analysis in Milwaukee showed nondetectable levels in nearly all cases, no further organicstesting was completed in the remaining two cities. See Appendix E for a list of all chemicalsanalyzed. The laboratory results were reviewed for accuracy and completeness and provided toeach facility for review and comment.
2. National Benchmarking Study
The workgroup developed a survey for gathering data on metal finishing operations,pollution prevention practices, F006 characteristics and sludge management practices from a largesample of the universe of metal finishers. The data categories contained in the survey are similarto the regional benchmarking protocol, but less detailed. Appendix G contains the survey usedfor the National Benchmarking Study.
Nearly 2,000 surveys were distributed by mail using the mailing list of NAMF and AESF,and by hand at a metal finishers national technical conference. 186 responses (9 percent) werereceived. The data was compiled into a computer data base.
3. Statistical Analysis of the Regional and National Benchmarking Data
A chi-squares analysis was completed to determine the extent to which the facilitiesincluded in the regional and national benchmarking studies represent the universe of metalfinishers for demographic parameters. Benchmarking results were compared to the universe ofF006 generators in the Dunn & Bradstreet and EPA 1995 Biennial Report national databases. The results are presented in Section III.
4. Survey of Commercial Recyclers
The workgroup developed a survey to gather data from six commercial recyclingcompanies believed to be representative of the commercial F006 recycling industry. The surveyrequested data on the amount and chemical composition of F006 they recycle. Few data werereceived. The results were inclusive and are not provided in this report. A copy of the Recyclers’Survey is contained in Appendix H.
5. Survey of Community Environmental Groups

September 1998 24 F006 Benchmarking Study
A “community interest group phone survey” was developed by the workgroup to make apreliminary assessment of whether ten community groups community groups in the vicinity ofcommercial recycling companies believe those companies are good environmental and/oreconomic neighbors. In order to promote candid responses, the workgroup agreed thatrespondents could remain anonymous. Each group was asked the following questions:
C Is the group aware of environmental impacts from the recycling facility?C Is the group aware of economic impacts from the recycling facility?C Is the facility considered a “good neighbor?”
A summary of responses is provided in Section IV. Individual responses are provided inAppendix I.
III. RESULTS OF THE F006 BENCHMARKING STUDY
The Regional and National Benchmarking Studies produced a large body of current dataconcerning facility operations, pollution prevention activities, F006 generation and management,and F006 composition. Section A below presents summaries of the data. Section B presents thedata in detail.
A. Summaries of Regional and National Benchmarking F006 Waste CharacterizationData
1. Benchmarking Summary Tables
Table 5 summarizes the minimum, mean, median, and maximum analytical results for eachchemical analyzed for each of the three cities. The values presented represent only clearlymeasurable laboratory results. Non-detected samples (i.e., samples below laboratory detectionlimits) and samples detected but below the laboratory quantitation limit (below the limit foraccurate chemical measurement) are not included. Table 6 compares same statistics for the threecities to F006 waste composition data received in the National Benchmarking Survey. Table 7summarizes the results of the National Survey.
2. Statistical Analysis: Does this Data Come from “Typical” Metal Finishers?
Statistical analyses are often used to determine the extent to which a sample selected froma population represents the larger population from a statistical perspective, require carefullydesigned sample selection and testing procedures, and are generally time consuming andexpensive. Because of its specialized design (i.e., to provide the workgroup with a highlydescriptive set of data from metal finishing facilities which run the most “typical” platingprocesses in the industry), the workgroup was limited in its abililty to compare Benchmarkingdata to other databases which contain information on the metal finishing universe. Notwithstanding the specialized design of the Benchmarking study, the workgroup completed astatistical comparison of Benchmarking results to two national databases which contain someinformation on the metal finishing universe.

September 1998 25 F006 Benchmarking Study
The analysis used a chi-squares statistical method to compare the only three parameters(facility size and location, and the amount of F006 waste generated) contained in thebenchmarking studies and in other national databases which contain information on metal finishingfacilities, i.e., the Dun & Bradstreet (D&B) business/economic database and EPA’s 1995 BiennialReporting System (BRS) database. The analysis results show that the facilities participating arenot necessarily representative of the universe of metal finishers. It is possible that a largernumber of participants in the Benchmarking Studies or a different mix of participants could haveprovided results that show a more direct relationship between Benchmarking and national data(D&B and BRS). This result does not diminish the value of the Benchmarking study. TheBenchmarking Study provides substantial additional data characterizing the industry’swastestream and provides a sound starting point for further discussion.
3. Results of Commercial Recyclers and Citizen Group Surveys
The workgroup received too few responses to the commercial recyclers survey to drawany conclusions. Responses to the citizen group brief phone interviews received nearly completeresponses and revealed no significant adverse opinions regarding whether these facilities areperceived as good environmental and economic neighbors. The results of the citizen group phonesurvey is summarized Appendix I.

September 1998 26 F006 Benchmarking Study
This page and the next page become large fold out tables 5& 6. Pull this double sidedpage and insert tables 5/6 here.

September 1998 27 F006 Benchmarking Study

September 1998 28 F006 Benchmarking Study
Table 7: F006 Analytical Data from the National Survey: Excludes non-detects and includes onlyvalues above method quantitation limit. 70 of 186 respondents submitted characterization data.
Constituent # of Reported Minimum Mean Median MaximumDetections
Total Metals (mg/kg)
Aluminum (Al) 34 0.59 13,387.89 1,725.00 76,100.00
Antimony (Sb) 22 1.80 2,188.23 67.40 34,800.00
Arsenic (As) 35 2.00 489.67 10.00 8,780.00
Barium (Ba) 38 6.00 199.27 73.70 1,080.00
Beryllium (Be) 20 0.59 12.55 8.50 37.00
Bismuth (Bi) 7 2.10 50.86 29.00 398.00
Cadmium (Cd) 39 2.10 6,122.32 22.00 71,300.00
Calcium (Ca) 28 682.00 37,239.28 17,250.00 143,000.00
Chromium (Cr) 60 10.00 39,601.20 13,900.00 206,000.00
Copper (Cu) 51 33.60 55,474.35 10,620.00 631,000.00
Iron (Fe) 38 364.00 82,420.74 48,950.00 560,000.00
Lead (Pb) 47 5.00 5,754.10 346.00 175,000.00
Magnesium (Mg) 14 187.00 48,798.09 10,800.00 336,000.00
Manganese (Mn) 28 13.00 830.91 563.00 3,300.00
Mercury (Hg) 30 0.05 0.39 0.30 2.00
Nickel (Ni) 44 51.00 23,456.33 5,935.00 180,000.00
Selenium (Se) 35 1.900 7.86 6.50 16.60
Silver (Ag) 30 1.50 169.64 87.50 1,190.00
Sodium (Na) 9 25.00 18,458.37 11,000.00 89,200.00
Tin (Sn) 28 9.00 20,906.06 1,100.00 467,000.00
Zinc (Zn) 48 57.00 88,692.44 24,600.00 460,000.00
TCLP (mg/l)
Arsenic (As) 17 ND ND ND ND
Barium (Ba) 16 0.26 1.29 1.45 2.20
Cadmium (Cd) 18 0.02 8.36 0.11 144.00
Chromium (Cr) 20 0.02 9.48 0.92 56.20
Lead (Pb) 18 0.06 113.97 0.13 1,630.00
Mercury (Hg) 15 0.001 0.005 0.005 0.011
Selenium (Se) 16 0.08 0.08 0.08 0.08
Silver (Ag) 17 0.01 0.67 0.06 3.80
General Chemistry (mg/kg)
Chloride (Cl) 20 64 8,035.09 2,225.00 70,100.00
Fluoride (F) 13 1.2 719.06 161.00 4,240.00
Chromium, hex 15 0.1 108.89 11.00 1,190.00
Cyanide, Total (CN) 25 0.8 692.47 114.50 3,920.00
Cyanide, Am (CN) 11 2.6 609.56 51.00 5,340.00
Percent Solids 13.5 37.65 30.80 94.10

September 1998 29 F006 Benchmarking Study
B. Detailed Results of the Regional and National Benchmarking Studies
This section provides the detailed results of data gathering for the Regional and NationalBenchmarking Studies.
1. The Milwaukee Benchmarking Study
This section provides a detailed presentation of data gathered in the MilwaukeeBenchmarking Study (MBS), including a characterization of plating processes, pollutionprevention and recycling practices, F006 characteristics, and site specific variations in thegeneration and management of F006 for nine facilities in Milwaukee. Table 8 is the facilityselection matrix used to select 10 facilities from 13 candidates. Table 9 presents informationcollected for each facility in the study. Table 10 summarizes the results of the laboratory analysesof F006 data and Table 11 presents detailed laboratory analysis results for each facility.
Six of the nine facilities reported waste generation rates. The total reported wastequantity for Milwaukee is approximately 590.5 tons/year. Four facilities reported landfilling theirF006 waste while four facilities reported recycling their F006 wastes. One facility sent half of itsF006 waste to landfills, and the other half to commercial recycling. Sixteen laboratory sampleswere gathered from nine facilities. Four of these samples were for organic chemicals.

September 1998 30 F006 Benchmarking Study
Table 8: Milwaukee Metal Finishing Facility Selection Matrix
Selection Criteria Fac 1* Fac 2* Fac 3* Fac 4 Fac 5 Fac 6 Fac 7 Fac 8 Fac 9(Selected) (Selected) (Alternate) (Selected) (Selected) (Selected) (Selected)
Type: Captive/Job Job Job Job Captive Job Captive Job Job Job
Size 16 152 95 2000/20 50 900/30 160 35 180
Main Treatment Technology Alk/ PPT Other - Al Alk/ PPT Alk/ PPT Alk/ PPT Alk/ PPT Alk/ PPT Alk/ PPT Alk/ PPTreuse Off IX
Treatment Technology CFR CFR EMR CFR CFR CFR CFR CFR Other Other CFRVacuum & IX
Evp.
Onsite Recycle No No No 25% No No 60% No 95%
Landfill 100% No 100% Yes Yes 5% 40% 100% 5%
Main Mgmt. Method LF Recycle LF LF LF 95% Rec Recycle LF Recycle
Finishing Processes Zn/Fe Cu Zn/Fe Zn/Fe HCr Zn/Fe Zn/Fe HCr & EN Zn/Fe NiCrHCr/Al Cu/Ni/Cr Zn/Br Cu/Ni/Cr/F Cu/Ni/CrNi/Cr Ni/Cr e HCr
Zn/Fe
* Eliminated because they do not generate F006. ED ElectrodialysisKey: RO Reverse osmosisAlk/PPT Alkaline precipitation Zn/Fe Zinc electroplate on steelIX Ion exchanges Ni/Cr Nickel chromium Electroplate on steelUltra Ultrafiltration/Microfiltration Cu/Ni/Cr Copper nickel chromium on nonferrousCFR Counterflow rinse Cu Copper/PC bandsEMR Electrolytic metal recovery HCr Hard chromium on steel

September 1998 31 F006 Benchmarking Study
Milwaukee Metal Finishing Facility Selection Matrix (cont.)
Selection Criteria Fac 10* Fac 11 Fac 12 Fac 13 Fac 14 Fac 15 Fac 16 Fac 17 Fac 18 (Alternate) (Alternate) (Selected) (Selected) (Selected) (Selected)
Type: Captive/Job Job Job Job Job Job Captive Captive Captive Job
Size 40 50-60 15 70 110 700/14 500/90 1550/37 35
Main Treatment Technology Alk/PPT Alk/PPT Offsite Offsite Alk/PPT Alk/PPT Alk/PPT Alk/PPT Alk/PPTother other offsite
Treatment Technology CFR other CFR Evap CFR CFR CFR other CFR EMR IX CFR CFR RO CFR IXIX IX Ultra IX EMR
other other Other
Onsite Recycle No Yes Yes Yes 95% Yes No Yes 20%
Landfill Yes No No No 5% Yes Yes Yes 20%
Main Mgmt. Method LF Recycle Recycle Recycle Recycle LF LF LF 80% Rec
Finishing Processes Zn/Fe Cu Ni Cr Zn Ni/Cr Ni/Cr Zn/Fe Dupl Ni Ni/Cr /Br Zn/Fe HCr NiSn Ag Brite Ni
Hex Cr
* Eliminated because they do not generate F006. ED ElectrodialysisKey: RO Reverse osmosisAlk/PPT Alkaline precipitation Zn/Fe Zinc electroplate on steelIX Ion exchanges Ni/Cr Nickel chromium Electroplate on steelUltra Ultrafiltration/Microfiltration Cu/Ni/Cr Copper nickel chromium on nonferrousCFR Counterflow rinse Cu Copper/PC bandsEMR Electrolytic metal recovery HCr Hard chromium on steel

September 1998 32 F006 Benchmarking Study
Table 9: Facility-Specific Information for Milwaukee FacilitiesFacility F4
Plating Process F006 Quantity and Management Sample Description
Nickel-chrome on Aluminum 146 tons/yr F1-01 - Sludge sample collectedZinc (non-CN) on Steel directly from drop binDecorative nickel-chrome on Steel Landfill F1-02 - Sludge collected from
supersack dated the previous month
Pollution Prevention Practices Sample Characteristics (Dry wt.)
SPENT PLATING SOLUTIONSImplementation of high temperature zinc baths to eliminate partial bath Total (mg/kg) Total (mg/kg)dumps Al - 31,200 Al - 17,300Replaced hexavalent Cr with Trivalent Cr on decorative Cr line Sb - 5.5 Sb - 1.8Elimination of all cyanide plating baths As - 9.9 As - 9.3Substitution of chromate and dichromate seal with non-chrome sealer Ba - 41.9 Ba - 34.3Constant development of alternative plating technologies Be - ND Be - NDFiltration on nickel recovery unit Bi - 2.7 Bi - 3.3Electrolytic dummying Cd - 7.5 Cd - 9.6Precipitation and monitoring of spent plating solutions Ca - 24,800 Ca - 17,500Uses purer anodes and bags Cr - 59,500 Cr - 64,900Tooling attention/maintenance on scrubbers Hex. Cr - 0.6 Hex. Cr - 0.6Evaporation techniques on nickel portion of chrome line Cu - 130 Cu - 1,480Chemical usage reduction through substitution - replaced hard chrome with Fe - 25,000 Fe - 27,700decorative chrome Pb - 297 Pb - 366Oil removal techniques Mg - 15,800 Mg - 17,400
DRAG-OUT REDUCTION Hg - 2 Hg - NDEnhanced product hang times Ni - 19,900 Ni - 18,200Uses wetting agents occasionally Se - 16.6 Se - 16Drainage boards Ag - 267 Ag - 97.9Strategic workpiece positioning Na - 8,360 Na - 21,700Withdrawal and drainage time Sn - 404 Sn - 582Diking Zn - 336,000 Zn - 335,000
RINSEWATERCounter-current flow rinse systems for 1 plating line TCLP (mg/l) TCLP (mg/l)Flow restrictors done with weirs As - ND As - NDUse conductivity meters to monitor the quality of final rinses Ba - 0.3 Ba - 1.4Reuse electrocleaner rinse water as dilute plating bath solution Cd - 0.04 Cd - 0.1Reuse acid rinse waters for rinsing racks exiting soak cleaner Cr - 40.6 Cr - 56.2Evaporative recovery of Ni rinse waters Pb - ND Pb - 0.1Closed-loop wastewater systems on Ni and Hex. Cr lines Hg - ND Hg - ND
OTHER Ag - 0.05 Ag - NDChemical inventory and controlConducts annual plant assessments and housekeepingPreventive maintenance systemsIncreased temperature of bathProduct longevity through specification alteration
F1 - 01 F1 - 02
Mn - 1,710 Mn - 399
CN - ND CN - ND
Se - ND Se - ND
September 1998 33 F006 Benchmarking Study
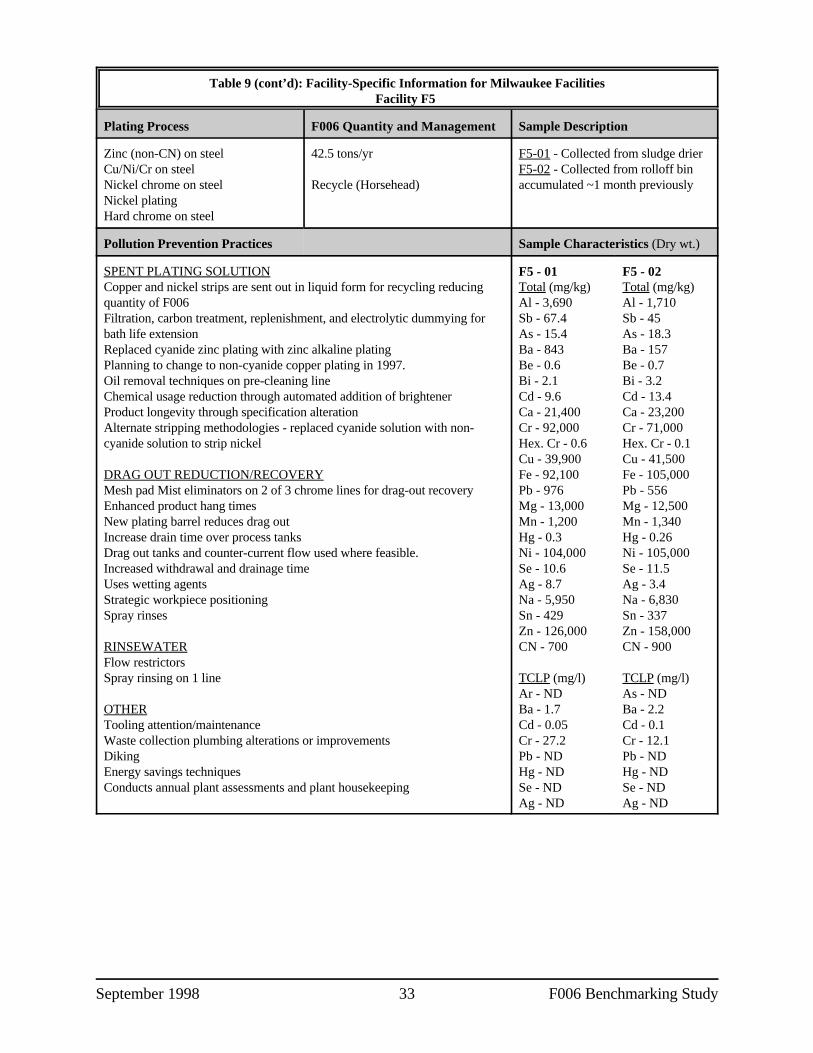
Table 9 (cont’d): Facility-Specific Information for Milwaukee FacilitiesFacility F5
Plating Process F006 Quantity and Management Sample Description
Zinc (non-CN) on steel 42.5 tons/yr F5-01 - Collected from sludge drierCu/Ni/Cr on steel F5-02 - Collected from rolloff binNickel chrome on steel Recycle (Horsehead) accumulated ~1 month previouslyNickel platingHard chrome on steel
Pollution Prevention Practices Sample Characteristics (Dry wt.)
SPENT PLATING SOLUTIONCopper and nickel strips are sent out in liquid form for recycling reducing Total (mg/kg) Total (mg/kg)quantity of F006 Al - 3,690 Al - 1,710Filtration, carbon treatment, replenishment, and electrolytic dummying for Sb - 67.4 Sb - 45bath life extension As - 15.4 As - 18.3Replaced cyanide zinc plating with zinc alkaline plating Ba - 843 Ba - 157Planning to change to non-cyanide copper plating in 1997. Be - 0.6 Be - 0.7Oil removal techniques on pre-cleaning line Bi - 2.1 Bi - 3.2Chemical usage reduction through automated addition of brightener Cd - 9.6 Cd - 13.4Product longevity through specification alteration Ca - 21,400 Ca - 23,200Alternate stripping methodologies - replaced cyanide solution with non- Cr - 92,000 Cr - 71,000cyanide solution to strip nickel Hex. Cr - 0.6 Hex. Cr - 0.1
DRAG OUT REDUCTION/RECOVERY Fe - 92,100 Fe - 105,000Mesh pad Mist eliminators on 2 of 3 chrome lines for drag-out recovery Pb - 976 Pb - 556Enhanced product hang times Mg - 13,000 Mg - 12,500New plating barrel reduces drag out Mn - 1,200 Mn - 1,340Increase drain time over process tanks Hg - 0.3 Hg - 0.26Drag out tanks and counter-current flow used where feasible. Ni - 104,000 Ni - 105,000Increased withdrawal and drainage time Se - 10.6 Se - 11.5Uses wetting agents Ag - 8.7 Ag - 3.4Strategic workpiece positioning Na - 5,950 Na - 6,830Spray rinses Sn - 429 Sn - 337
RINSEWATER CN - 700 CN - 900Flow restrictorsSpray rinsing on 1 line TCLP (mg/l) TCLP (mg/l)
OTHER Ba - 1.7 Ba - 2.2Tooling attention/maintenance Cd - 0.05 Cd - 0.1Waste collection plumbing alterations or improvements Cr - 27.2 Cr - 12.1Diking Pb - ND Pb - NDEnergy savings techniques Hg - ND Hg - NDConducts annual plant assessments and plant housekeeping Se - ND Se - ND
F5 - 01 F5 - 02
Cu - 39,900 Cu - 41,500
Zn - 126,000 Zn - 158,000
Ar - ND As - ND
Ag - ND Ag - ND

September 1998 34 F006 Benchmarking Study
Table 9 (cont’d): Facility-Specific Information for Milwaukee FacilitiesFacility F8
Plating Process F006 Quantity and Management Sample Description
Hard Chrome on Steel unreported F8-01 - Collected from supersack
Landfill F8-02 - Collected from supersackdated that week
dated the previous month
Pollution Prevention Practices Sample Characteristics (Dry wt.)
SPENT PLATING SOLUTIONIon exchange resin system - echo-tec Total (mg/kg) Total (mg/kg)
DRAG OUT REDUCTION/RECOVERY Sb - 161 Sb - 110Strategic workpiece positioning As - 5.5 As - 11.8
OTHER Be - ND Be - NDAnnual plant assessments Bi - ND Bi - NDDiked tanks Cd - 10.1 Cd - 42.7High efficiency lighting Ca - 67,400 Ca - 50,800Plant Housekeeping Cr - 193,000 Cr - 91,500Preventive Maintenance systems Hex. Cr - 0.4 Hex. Cr - 0.2Installed waste collection hard piping to control chemicals Cu - 24,500 Cu - 41,100Tooling maintenance once per year Fe - 110,000 Fe - 279,000
F8-01 F8-02
Al - 19,300 Al - 8,560
Ba - 83.4 Ba - 33.3
Pb - 858 Pb - 231Mg - 9,710 Mg - 11,100Mn - 1,360 Mn - 1,080Hg - ND Hg - 1.2Ni - 1,130 Ni - 744Se - ND Se - NDAg - ND Ag - NDNa - 19,600 Na - 49,400Sn - 129 Sn - 96.3Zn - 3,790 Zn - 9,610CN - ND CN - ND
TCLP (mg/l) TCLP (mg/l)As - ND As - NDBa - 0.3 Ba - 0.7Cd - 0.01 Cd - 0.3Cr - 54.1 Cr - 12.8Pb - 0.1 Pb - NDHg - N D Hg - 0.005Se - ND Se - NDAg - ND Ag - ND

September 1998 35 F006 Benchmarking Study
Table 9 (cont’d): Facility-Specific Information for Milwaukee FacilitiesFacility F9
Plating Process F006 Quantity and Management Sample Description
Chrome on aluminum 150 tons/yr F9-01 - Collected from supersackBright dip on brass loaded that dayCopper, nickel, chrome on steel Recycle (Encycle/Horsehead 97%) F9-02 - Collected by facility about 2Hard chrome on steel Landfill (3%) weeks laterNickel chrome on nonferrousZinc (non-CN) on steel
Pollution Prevention Practices Sample Characteristics (Dry wt.)
SPENT PLATING SOLUTIONEliminated cadmium plating line Total (mg/kg) Total (mg/kg)Replace some hexavalent chrome lines with trivalent chrome Al - 27,000 Al - 13,200Utilizes filtration carbon treatment, replenishment, and electrolytic Sb - 5.4 Sb - 13.5dummying for general bath life extension As - 4.8 As - 3.1Uses precipitation, monitoring, carbonate agitation, and electrowinning on Ba - 298 Ba - 257spent solutions Be - ND Be - NDUses evaporative techniques on nickel plating bath Bi - 72.5 Bi - 31.5Chemical usage reduction through automation and substitution Cd - 2.1 Cd - 17.3Increased temperature of bath Ca - 87,000 Ca - 70,000
DRAG OUT REDUCTION/RECOVERY Hex. Cr - 29 Hex. Cr - 1,000Drag out and counter-current flow rinse systems Cu - 20,700 Cu - 15,000Ion exchange systems Fe - 105,000 Fe - 80,800Evaporation and Mesh pad mist eliminators for drag-out recovery Pb - 439 Pb - 410Spray rinsing and drag-out tankage Mg - 44,300 Mg - 30,300Enhanced product hang times Mn - 1,070 Mn - 1,170Withdrawal and drainage time Hg - 0.35 Hg - 0.6Uses wetting agents and drainage boards Ni - 14,800 Ni - 18,700Spray rinses only on nickel boards Se - 1.9 Se - NDUtilizes strategic workpiece positioning Ag - 65 Ag - 230
RINSEWATER Sn - 1,100 Sn - 681Implemented a strict control program for monitoring incoming water to each Zn - 67,200 Zn - 83,900separate production line CN - 46 CN - 74Company-wide water conservation program (e.g., spray rinses, flowrestrictors water meters, etc.) TCLP (mg/l) TCLP (mg/l)Use spent acid bath for pH adjustment in WWT As - ND As - NDReuse treated wastewater in production lines Ba - 1.1 Ba - 0.8Replaced solvent-based washers with aqueous systems (increasing sludge Cd - ND Cd - NDgeneration) Cr - 0.9 Cr - 13.1Flow restrictors Pb - ND Pb - ND
OTHER Se - ND Se - 0.04Use sludge dryer to reduce sludge volume and transportation costs Ag - ND Ag - NDReduced cyanide use by 80%Conduct annual training for waste treatment operators on chemical use andhow this affects sludge volumesTooling attention/maintenanceChemical inventory and controlWaste collection plumbing alterations or improvementsDikingIncorporated energy savings techniquesConducts annual plant assessments and housekeepingUses preventive maintenance systems
F9-01 F9-02
Cr - 28,200 Cr - 94,000
Na - 15,900 Na - 39,000
Hg - ND Hg - ND

September 1998 36 F006 Benchmarking Study
Table 9 (cont’d): Facility-Specific Information for Milwaukee FacilitiesFacility F11
Plating Process F006 Quantity and Management Sample Description
Zinc (non-CN) on steel unreported F11-01 - Collected from sludge drierTin on non-ferrous and steel F11-02 - Collected from supersackNickel-chrome plating Recycle (Encycle) dated the previous monthCopper-nickel on steel
Pollution Prevention Practices Sample Characteristics (Dry wt.)
SPENT PLATING SOLUTIONEliminated cyanide cadmium plating Total (mg/kg) Total (mg/kg)Replaced zinc cyanide plating with zinc alkaline plating Al - 1,800 Al - 1,650Spent alkaline baths are used for pH adjustment Sb - 14.2 Sb - 11.1Oil removal techniques As - 13 As - 6.5Chemical usage reduction through substitution Ba - 227 Ba - 159Utilizes filtration, carbon treatment, replenishment, and electrolytic Be - ND Be - NDdummying Bi - 1.7 Bi - 1.8
DRAG OUT REDUCTION/RECOVERY Ca - 16,100 Ca - 14,800Drag out recovery on chrome and nickel lines Cr - 31,100 Cr - 48,100Enhanced product hang times Hex. Cr - 26 Hex. Cr - 0.4Installed atmospheric evaporators on automatic chrome line for drag out Cu - 8,980 Cu - 11,300recovery Fe - 58,800 Fe - 69,300Wetting agents and drainage boards Pb - 527 Pb - 230Strategic workpiece positioning Mg - 13,500 Mg - 13,700Increase in withdrawal and drainage time Mn - 557 Mn - 707
RINSEWATER Ni - 180,000 Ni - 84,600Counter-current flow rinse systems Se - 7.3 Se - 5Monitors solutions and uses purer anodes and bags Ag - 163 Ag - 657Utilizes exit spray rinse Na - 22,700 Na - 84,300Uses atmospheric and simple evaporation techniques Sn - 3,550 Sn - 8,070Flow restrictors Zn - 129,000 Zn - 94,400Conductivity controls CN - 16 CN - 6.6
OTHER TCLP (mg/l) TCLP (mg/l)Installed sludge drier to reduce sludge volume As - ND As - NDTrain staff on causes of increase in hazardous waste production Ba -1.3 Ba - 0.11Tooling attention/maintenance Cd - 0.1 Cd - 0.64Chemical inventory and control Cr - 3.1 Cr - NDWaste collection alterations or improvements Pb - ND Pb - NDDiking Hg - ND Hg - NDProduct longevity through specification alteration Se - ND Se - NDEnergy saving techniques Ag - ND Ag - 0.08Plant housekeeping and annual plant assessmentAutomatic leak detection systemPreventive maintenance system
F11 - 01 F11-02
Cd - 12.5 Cd - 7.3
Hg - ND Hg - 0.3

September 1998 37 F006 Benchmarking Study
Table 9 (cont’d): Facility-Specific Information for Milwaukee FacilitiesFacility F13
Plating Process F006 Quantity and Management Sample Description
Nickel chrome on steel 15 tons/yr F13-01 - did not meet the regulatory
Recycle (Inmetco) F13-02 - Collected from sludgedefinition of F006
supersack
Pollution Prevention Practices Sample Characteristics (Dry wt.)
SPENT PLATING SOLUTIONOil removal and filtration techniques Total (mg/kg)Promote product longevity through specification alteration Al - 311Uses alternate stripping methodologies - switched from cyanide to non- Sb - 0.6cyanide stripping As - 2.3Evaporation to concentrate plating by-products Ba - 6Substituted hexavalent chrome with trivalent chrome Be - NDSet up pilot line to evaluate a liquid addition agent for cleaning Bi - NDRequire operators to log plating parameters daily which improves their Cd - NDcontrol Ca - 855Uses purer anodes and bags and fume suppressors Cr - 193
DRAG OUT REDUCTION/RECOVERY Cu - 33.6Enhanced product hang times Fe - 3,350Wetting agents Pb - 0.6Air knives Mg - 355Spray or fog rinses Mn - 3.8Drainage boards Hg - NDIncreased withdrawal and drainage time Ni - 76,000Strategic workpiece positioning Se - ND
RINSEWATER Na - 16,400Other than cooling water and water used to process incoming water, this is a Sn - 9.0zero discharge facility (from the process units) Zn - 6.1Rinse water is recycled through filtration, carbon absorption in waste CN - 2.0treatment section, replenishment and ion exchangeCounter-current flow rinse systemsUtilizes electrocoagulation for cleaning (and reusing) rinse watersFlow restrictorsReverse osmosis utilized on incoming water
OTHERTooling attention/maintenance, preventive maintenance systemsImproved record keeping demonstrates areas to be considered forimprovementInstalled filter press and sludge drier to reduce sludge volumeChemical inventory and controlWaste collection plumbing alterations or improvementsDikingHigh efficiency lightingConducts annual plant assessments and plant housekeeping
F13-02
Hex. Cr - 0.5
Ag - ND

September 1998 38 F006 Benchmarking Study
Table 9 (cont’d): Facility-Specific Information for Milwaukee FacilitiesFacility F14
Plating Process F006 Quantity and Management Sample Description
Zinc (CN) on Steel 196 tons/yr F14-01 - Sludge from drier output
Recycle (Horsehead 58%)Landfill (42%)
Pollution Prevention Practices Sample Characteristics (Dry wt.)
SPENT PLATING SOLUTIONSSeparated the process chemistry and wastewater treatment departments Total (mg/kg) TCLP (mg/l)Cyanide bath carbonate freezing to prolong life Al -2,320 As - NDUtilize bags on 1 chloride bath Sb - 2 Ba - 1.3Oil removal techniques on 1 barrel As - 13.4 Cd - 0.03
DRAG-OUT REDUCTION Be - ND Pb - NDWorkpiece positioning Bi -ND Hg - NDIncrease dwell (rinse) cycles Cd - 3.9 Se - NDWetting Agents Ca -18,000 Ag - NDProlonged withdrawal and drainage time Cr -26,900Drainage boards Hex. Cr - 2.6
RINSEWATER Fe - 194,000Counter-current flow rinse systems Pb - 64.8Flow restrictors Mg - 9,990Spray rinse and multiple rinses Mn - 979Evaporators and filters on 3 of 4 baths Hg - NDLarger hole barrels Ni - 57.1Use alkaline cleaner baths for wastewater pH adjustment Se - 5.7Sludge dryer reduces volume by 65%. Ag - 4.4Assessed source by source water use to eliminate major changes in flow Na - 3,830which upsets WWT performance Sn - 19.5Employed an environmental engineering company to assist in water control Zn - 277,000and reduction. CN - 200
OTHEREliminated several plating services: cadmium, nickel, hard chrome, tin,copper, and brass plating and aluminum anodizingReplacing CN baths with alkaline baths by end of 1997.Diking of all 4 production linesPlant Housekeeping Annual plant assessmentsHazardous waste leak detection systemPreventive maintenance systemInstalled waste collection hard plumbing on every machine
F14 - 01
Ba -29.2 Cr - 0.2
Cu - 54.6

September 1998 39 F006 Benchmarking Study
Table 9 (cont’d): Facility-Specific Information for Milwaukee FacilitiesFacility F16
Plating Process F006 Quantity and Management Sample Description
Nickel chrome on non-ferrous 41 tons/yr F16-01 - Collected from supersackGold plating dated that day
Landfill F16-02 - Collected by facility about 2 weeks later
Pollution Prevention Practices Sample Characteristics (Dry wt.)
SPENT PLATING SOLUTIONFiltration Total (mg/kg) Total (mg/kg)Improved SOPs by tracking water flow reducing the level of chrome in the Al - 3,940 Al - 1,210hot rinse >90% Sb - 3.5 Sb - 2.7Leak detection systems on plating bath As - 9.4 As - 7Metals recovery system via ion exchange reclaims Cr and Ni from rinse Ba - 73.7 Ba - 24.5waters Be - ND Be - NDOil removal techniques on pre-cleaning line Bi - 5.4 Bi - 2.2
DRAG OUT REDUCTION/RECOVERY Ca - 97,300 Ca - 105,000Conductivity meters Cr - 13,800 Cr - 5,520Rack design eliminates drag out Hex. Cr - 0.2 Hex. Cr - 0.1Enhanced product hang times on pre-cleaning line Cu - 13,600 Cu - 5,520Wetting agents on chrome line Fe - 114,000 Fe - 189,000Spray rinses and drainage boards Pb - 2,870 Pb - 778
RINSEWATER Mn - 671 Mn - 950Counter-current flow rinsing on plating and pre-cleaning lines Hg - 0.4 Hg - NDFlow restrictors Ni - ND Ni - NDSpray rinsing on some pre-cleaning lines Se - 30,700 Se - 16,800Replaced solvent-based washers with aqueous systems (increasing sludge Ag - 47.4 Ag - 20.2generation) Na - 5,490 Na - 7,900Continually searching for new environmentally safe cleaners Sn - 497 Sn - 50.8
OTHER CN - ND CN - NDOperators are certified and receive on-going trainingTooling attention/maintenance TCLP (mg/l) TCLP (mg/l)Chemical inventory and control As - ND As - NDDiking Ba - 0.9 Ba - 0.2Utilize high efficiency motors Cd - 0.03 Cd - NDConduct annual plan assessments Cr - 14.5 Cr - 12.7Ongoing plant housekeeping and chemical usage reduction Pb - 0.3 Pb - 1.3Preventive maintenance systems Hg - 0.005 Hg - 0.01Employ monitoring and utilize bags Se - ND Se - ND
F16-01 F16-02
Cd - 1.3 Cd - 1.3
Mg - 10,400 Mg - 4,250
Zn - 14,200 Zn - 5,790
Ag - ND Ag - 0.04

September 1998 40 F006 Benchmarking Study
Table 9 (cont’d): Facility-Specific Information for Milwaukee FacilitiesFacility F17
Plating Process F006 Quantity and Management Sample Description
Zn (non-CN) on steel unreported F17-01 - Collected from sludge drierChrome on nonferrous F17-02 - Collected from supersackCopper-nickel on nonferrous Landfill dated the previous monthCopper-nickel on steelCadmium on steel
Pollution Prevention Practices Sample Characteristics (Dry wt.)
SPENT PLATING SOLUTIONUses vapor recompression evaporation and carbonate removal system for Total (mg/kg) Total (mg/kg)recovery Al - 1,260 Al - 1,360Employs filtration, carbon treatment, replenishment, and electrolytic Sb - 0.6 Sb - 0.6dummying As - 3.8 As - 4.1Utilizes cyanide bath carbonate freezing to extend life of solution Ba - 29.4 Ba - 43.5Reduced 50% of cadmium to zinc Be - ND Be - NDOil removal techniques on pre-cleaning line Bi - ND Bi - NDAlternate stripping methodologies - formerly used cyanide based stripper; Cd - 39,300 Cd - 21,600but now outsourced Ca - 141,000 Ca - 140,000
DRAG OUT REDUCTION/RECOVERY Hex. Cr - 19 Hex. Cr - 3.7Uses stagnant rinse tanks or drag out tanks Cu - 21,900 Cu - 18,600Drag out waters replace drag in waters or added back to plating bath Fe - 24,300 Fe - 17,400Spray rinses and diking Pb - 221 Pb - 237Enhanced product hang times Mg - 12,900 Mg - 12,300Utilizes wetting agents and drainage boards Mn - 244 Mn - 199Increased temperature bath, withdrawal and drainage time Hg - ND Hg - 0.12
RINSEWATER Se - 2.1 Se - 2.1Segregate wastewater streams Ag - 0.5 Ag - 1.5Counter-current flow rinse systems Na - 11,700 Na - 17,700Flow restrictors Sn - 11.2 Sn - 13.8Conductivity meters Zn - 35,500 Zn - 44,600Uses reverse osmosis (3 units) and atmospheric and vacuum distillation CN - 380 CN - 99evaporation to recycle rinse watersIon exchange for water delivered to plating baths TCLP (mg/l) TCLP (mg/l)
OTHER Ba - 1.3 Ba - 1.1Planning to re-engineer the WWT to segregate the nickel sludge from the Cd - 13.3 Cd - 5.7cadmium sludge to enable recycling of the nickel sludge to Encycle. Cr - ND Cr - NDCadmium sludge will be landfilled. Pb - ND Pb - NDChemical inventory and control Hg - ND Hg - NDRedesigned waste plumbing Se - 0.01 Se - NDUtilizes energy saving techniques Ag - ND Ag - NDConducts annual plant assessments and weekly plant housekeeping Preventive maintenance systems and leak detection on reverse osmosisequipment
F17-01 F17-02
Cr - 14,000 Cr - 9,250
Ni - 83,000 Ni - 35,100
As - ND As - ND

September 1998 41 F006 Benchmarking Study
Table 10: Overview of Milwaukee F006 Analytical Data: # of Samples Which Were: Not-Detected; “C” values(i.e., Statistically Estimated Values Above Instrument Detection Limit, but Below Method Quantitation Limit); AboveMethodQuantitation Limit
Constituent # Samples # Non # Samples # Samples Above MethodDetects Above Instrument Quantitation Limit
Detection, BelowMethod Quantitation
Total Metals Concentration (mg/kg)Aluminum 16 0(0%) 0(0%) 16(100%)
Antimony 16 0(0%) 6(37%) 10(63%)
Arsenic 16 0(0%) 2(12%) 14(88%)
Barium 16 0(0%) 3(19%) 13(81%)
Beryllium 16 14(87%) 0(0%) 2(13%)
Bismuth 16 6(37%) 3(19%) 7(44%)
Cadmium 16 1(6%) 2(12%) 13(82%)
Calcium 16 0(0%) 0(0%) 16(100%)
Chromium 16 0(0%) 0(0%) 16(100%)
Copper 16 0(0%) 0(0%) 16(100%)
Iron 16 0(0%) 0(0%) 16(100%)
Lead 16 0(0%) 1(6%) 15(94%)
Magnesium 16 0(0%) 0(0%) 16(100%)
Manganese 16 0(0%) 1(6%) 15(94%)
Mercury 16 6(37%) 4(25%) 6(37%)
Nickel 16 2(12%) 0(0%) 14(88%)
Selenium 16 2(12%) 0(0%) 12(75%)
Silver 16 3(37%) 1(6%) 12(75%)
Sodium 16 0(0%) 0(0%) 16(100%)
Tin 16 0(0%) 0(0%) 16(100%)
Zinc 16 0(0%) 1(6%) 15(94%)
TCLP (mg/l)Arsenic 16 16(100%) 0(0%) 0(0%)
Barium 16 0(0%) 12(75%) 4(25%)
Cadmium 16 4(25%) 4(25%) 8(50%)
Chromium 16 2(12%) 0(0%) 14(88%)
Lead 16 12(75%) 0(0%) 4(25%)
Mercury 16 13(81%) 0(0%) 3(19%)
Selenium 16 14(87%) 1(6%) 1(6%)
Silver 16 12(75%) 3(19%) 1(6%)
General Chemistry (mg/kg)Chloride 16 0(0%) 0(0%) 16(100%)
Fluoride 16 0(0%) 1(6%) 15(94%)
Chromium, hexavalent 16 0(0%) 0(0%) 16(100%)
Total Cyanide 16 4(25%) 0(0%) 12(75%)
Amenable Cyanide 16 4(25%) 0(0%) 12(75%)
Percent Solids 16 0(0%) 0(0%) 16(100%)

September 1998 42 F006 Benchmarking Study
Table 11: Analytical Data for the Milwaukee Facilities.Constituent CAS No. F1-01 F9-01 F16-01 F17-011
Volatile Organics - Method 8260A µg/kg
Acetone 67641 210 B 7,500 B 290 24
2-Butanone 78933 J B 58 B 69 J
2-Hexanone 591786 ND ND JB ND
Benzene 71432 ND 53 J ND
Chloroform 67663 J 6 ND ND
Chlorobenzene 108907 ND J ND ND
Trichloroethene 79016 ND ND J ND
4-Methyl-2-pentanone 108101 ND 16 64 ND
Toluene 108883 J J 20 ND
Ethylbenzene 100414 ND ND J ND
m,p-Xylenes 108383 / 106423 ND ND J ND
o-Xylene 95476 ND ND J ND
Semivolatile Organics - Method 8270B µg/kg
bis(2-Ethylhexyl)phthalate 117817 59,000 55,000 180,000 28,000
Di-n-octylphthalate 117840 J ND ND ND
Fluoranthene 206440 4,900 ND ND ND
Phenanthrene 85018 4,600 ND ND ND
Pyrene 129000 J ND ND ND
Phenol 108952 3,600 3,600 ND ND
Benzyl alcohol 100516 7,900 7,900 ND ND
Notes: All results reported on a dry-weight basis.1. Facility F4's F006 samples were designated as F1.J Mass spectral data indicate the presence of a compound that meets the identification criteria for which the result isless than the laboratory detection limit, but greater than zero.B Analyte also detected in the associated method blank analysis.ND Non-detectVolatiles analyzed for but not detected include: Chloromethane, Vinyl Chloride, Bromomethane, Chloroethane,Trichlorofluoromethane, 2-Chloroethyl vinyl ether, 1,1-Dichloroethene, Methylene Chloride, Carbon Disulfide, VinylAcetate, 1,1-Dichloroethane, trans-1,2-Dichloroethene, cis-1,2-Dichloroethene, 1,1,1-Trichloroethane, CarbonTetrachloride, 1,2-Dichloroethane, Benzene, 1,2-Dichloropropane, Bromodichloromethane, cis-1,3-Dichloropropene,trans-1,3-Dichloropropene, 1,1,2-Trichloroethane, Dibromochloromethane, Tetrachloroethene (PCE), Styrene,Bromoform, 1,1,2,2-Tetrachloroethane, 1,3-Dichlorobenzene, 1,4-Dichlorobenzene, and 1,2-Dichlorobenzene.Semivolatiles analyzed for but not detected include: bis(2-Chloroethyl)ether, 2-Chlorophenol, 2,3-Dichlorobenzene,1,4-Dichlorobenzene, 1,2-Dichlorobenzene, 2-Methylphanol, bis((2-Chloroisopropyl)ether, 4-Methyphenol, N-Nitroso-di-n-propylamine, Hexachloroethane, Nitrobenzene, Isophorone, 2-Nitrophenol, 2,4-Dimethylphenol, bis(2-Chloroethoxy)methane, Benzoic acid, 2,4-Dichlorophenol, 1,2,4-Trichlorobenzene, Naphthalene, 4-Chloroaniline,Hexachlorobutadiene, 4-Chloro-3-methylphenol, 2-Methylnaphthalene, Hexachlorocyclopentadiene, 2,4,6-Trichlorophenol, 2,4,5-Trichlorophenol, 2-Chloronaphthalene, 2-Nitroaniline, Dimethylphthalate, Acenaphthylene,2,6-Dinitrotoluene, 3-Nitroaniline, Acenaphthene, 2,4-Dinitrophenol, 4-Nitrophanol, 4-Nitrophenol ,Dibenzofuran,2,4-Dinitrotoluene, Diethyphthalate, 4-Chlorophenyl-phenylether, Fluorene, 4-Nitroaniline, 4,6-Dinitro-2-methylphenol, N-Nitrosodiphenylamine, 4-Bromophenyl-phenylether, Hexachlorobenzene, Pentachloropheno,lAnthraoene, Carbazole, Di-n-butylphthalate, Butylbenzylphthalate, 3,3'-Dichlorobenzidine, Benzo(a)anthracene,Chrysene, Din-octylphthalate, Benzo(b)fluoranthene, Benzo(k)fluoranthene, Benzo(a)pyrene, Indeno(1,2,3-cd)pyrene,Dibenz(a,h)anthracene, and Benzo(g,h,f)perylene

September 1998 43 F006 Benchmarking Study
Table 11 (cont’d): Analytical Data for the Milwaukee Facilities.Constituent CAS No. F1-01 F1-02 F5-01 F5-02 F16-01 F16-02 F8-01 F8-021
Total Metals - Methods 6020, 7471 mg/kg
Aluminum 7429905 31,200 17,300 3,690 1,710 3,940 1,210 19,300 8,560
Antimony 7440360 C 5.5 C 1.8 67.4 45.0 C 3.5 C 2.7 161 110
Arsenic 7440382 C 9.9 C 9.3 15.4 18.3 9.4 7.0 C 5.5 11.8
Barium 7440393 C 41.9 C 34.3 843 157 73.7 C 24.5 83.4 C 33.3
Beryllium 7440417 ND ND C 0.59 C 0.69 ND ND ND ND
Bismuth 7440699 C 2.7 C 3.3 C 2.1 3.2 5.4 C 2.2 ND ND
Cadmium 7440439 7.5 9.6 9.6 13.4 C 1.3 C 1.3 10.1 42.7
Calcium 7440702 24,800 17,500 21,400 23,200 97,300 105,000 67,400 50,800
Chromium 7440473 59,500 64,900 92,000 71,000 13,800 5,520 193,000 91,500
Copper 7440508 130 1,480 39,900 41,500 13,600 5,320 24,500 41,100
Iron 7439896 25,000 27,700 92,100 105,000 114,000 189,000 110,000 279,000
Lead 7439921 297 366 976 556 2,870 778 858 231
Magnesium 7439954 15,800 17,400 13,000 12,500 10,400 4,250 9,710 11,100
Manganese 7439965 1,710 399 1,200 1,340 671 950 1,360 1,080
Mercury 7439976 2.0 ND C 0.33 C 0.26 C 0.40 ND ND C 1.2
Nickel 7440020 19,900 18,200 104,000 105,000 ND ND 1,130 744
Selenium 7782492 16.6 16.0 10.6 11.3 30,700 16,800 ND ND
Silver 7440224 267 97.9 8.7 3.4 47.4 20.2 ND ND
Sodium 7440235 8,360 21,700 5,950 6,830 5,490 7,900 19,600 49,400
Tin 7440315 404 582 429 337 497 50.8 129 96.3
Zinc 7440666 336,000 335,000 126,000 158,000 14,200 5,790 3,790 9,610
TCLP Metals - Methods 1311, 6010, 7470 mg/L
Arsenic 7440382 ND ND ND ND ND ND ND ND
Barium 7440393 C 0.26 1.4 C 1.7 2.2 C 0.9 C 0.2 C 0.3 B 0.7
Cadmium 7440439 C 0.04 0.07 C 0.05 0.08 C 0.03 ND C 0.01 0.3
Chromium 7440473 40.6 56.2 27.2 12.1 14.5 12.7 54.1 12.8
Lead 7439921 ND 0.11 ND ND 0.3 1.3 0.1 ND
Mercury 7439976 ND ND ND ND 0.005 0.009 ND 0.005
Selenium 7782492 ND ND ND ND ND ND ND ND
Silver 7440224 C 0.05 ND ND ND ND C 0.04 ND ND
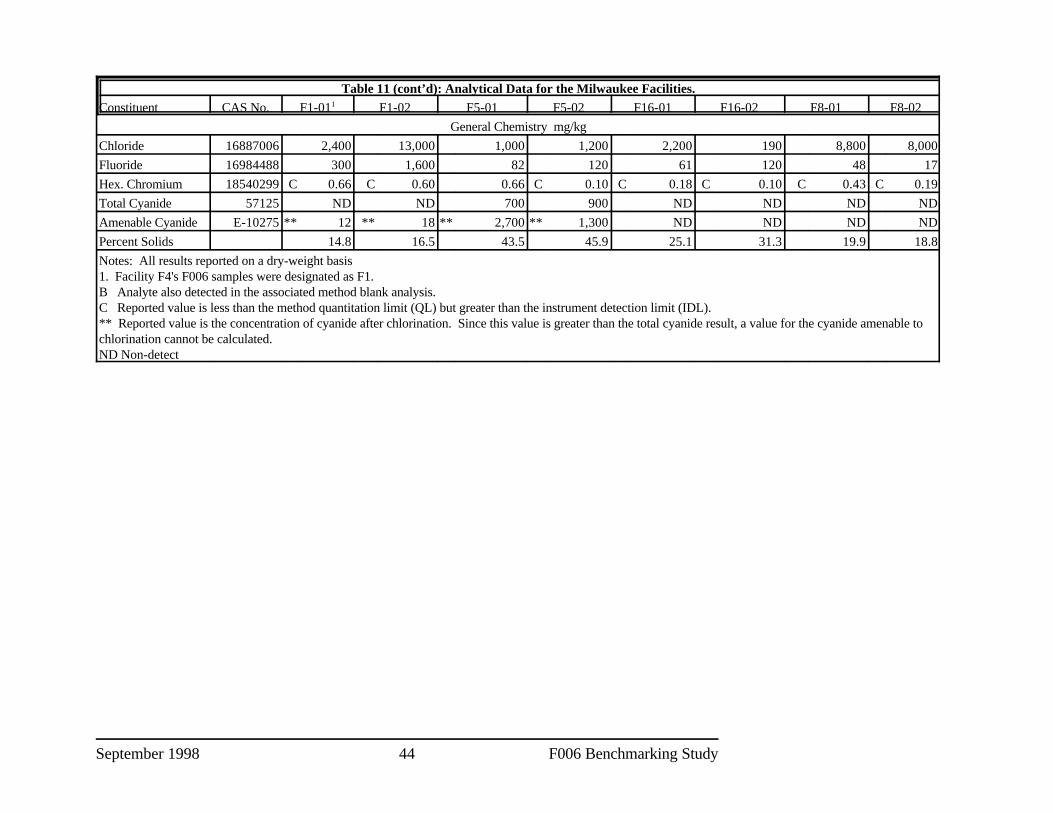
Table 11 (cont’d): Analytical Data for the Milwaukee Facilities.Constituent CAS No. F1-01 F1-02 F5-01 F5-02 F16-01 F16-02 F8-01 F8-021
September 1998 44 F006 Benchmarking Study
General Chemistry mg/kg
Chloride 16887006 2,400 13,000 1,000 1,200 2,200 190 8,800 8,000
Fluoride 16984488 300 1,600 82 120 61 120 48 17
Hex. Chromium 18540299 C 0.66 C 0.60 0.66 C 0.10 C 0.18 C 0.10 C 0.43 C 0.19
Total Cyanide 57125 ND ND 700 900 ND ND ND ND
Amenable Cyanide E-10275 ** 12 ** 18 ** 2,700 ** 1,300 ND ND ND ND
Percent Solids 14.8 16.5 43.5 45.9 25.1 31.3 19.9 18.8
Notes: All results reported on a dry-weight basis1. Facility F4's F006 samples were designated as F1. B Analyte also detected in the associated method blank analysis.C Reported value is less than the method quantitation limit (QL) but greater than the instrument detection limit (IDL).** Reported value is the concentration of cyanide after chlorination. Since this value is greater than the total cyanide result, a value for the cyanide amenable tochlorination cannot be calculated. ND Non-detect

September 1998 45 F006 Benchmarking Study
Table 11 (cont’d): Analytical Data for the Milwaukee Facilities.Constituent CAS No. F17-01 F17-02 F11-01 F11-02 F13-02 F14-01 F9-01 F9-02
Total Metals - Methods 6020, 7471 mg/kg (cont.)
Aluminum 7429905 1,260 1,360 1,800 1,650 311 2,320 27,000 13,200
Antimony 7440360 C 0.62 C 0.63 14.2 11.1 C 0.57 C 2.0 5.4 13.5
Arsenic 7440382 3.8 4.1 13.0 6.5 C 2.3 13.4 4.8 3.1
Barium 7440393 29.4 43.5 227 159 C 6.0 29.2 298 257
Beryllium 7440417 ND ND ND ND ND ND ND ND
Bismuth 7440699 ND ND C 1.7 C 1.8 ND ND 72.5 31.5
Cadmium 7440439 39,300 21,600 12.5 7.3 ND 3.9 2.1 17.3
Calcium 7440702 141,000 140,000 16,100 14,800 855 18,000 87,000 70,000
Chromium 7440473 14,000 9,250 31,100 48,100 193 26,900 28,200 94,000
Copper 7440508 21,900 18,600 8,980 11,300 33.6 54.6 20,700 15,000
Iron 7439896 24,300 17,400 58,800 69,300 3,350 194,000 105,000 80,800
Lead 7439921 221 237 527 230 C 0.59 64.8 439 410
Magnesium 7439954 12,900 12,300 13,500 13,700 355 9,990 44,300 30,300
Manganese 7439965 244 199 557 707 C 3.8 979 1,070 1,170
Mercury 7439976 ND C 0.12 ND C 0.29 ND ND 0.35 0.58
Nickel 7440020 83,000 35,100 180,000 84,600 76,000 57.1 14,800 18,700
Selenium 7782492 2.1 2.1 7.3 5.0 ND 5.7 1.9 ND
Silver 7440224 C 0.52 1.5 163 657 ND 4.4 65.0 230
Sodium 7440235 11,700 17,700 22,700 84,300 16,400 3,830 15,900 39,000
Tin 7440315 11.2 13.8 3,550 8,070 9.0 19.5 1,100 681
Zinc 7440666 35,500 44,600 129,000 94,400 C 6.1 277,000 67,200 83,900
TCLP Metals - Methods 1311, 6010, 7470 mg/L
Arsenic 7440382 ND ND ND ND ND ND ND ND
Barium 7440393 C 1.3 C 1.1 C 1.3 C 0.7 C 0.4 C 1.3 C 1.1 C 0.8
Cadmium 7440439 13.3 5.7 0.06 0.11 ND C 0.03 ND ND
Chromium 7440473 ND ND 3.1 0.64 1.9 0.2 0.9 13.1
Lead 7439921 ND ND ND ND ND ND ND ND
Mercury 7439976 ND ND ND ND ND ND ND ND
Selenium 7782492 0.08 ND ND ND ND ND ND C 0.04
Silver 7440224 ND ND ND C 0.08 ND ND ND ND

Table 11 (cont’d): Analytical Data for the Milwaukee Facilities.Constituent CAS No. F17-01 F17-02 F11-01 F11-02 F13-02 F14-01 F9-01 F9-02
September 1998 46 F006 Benchmarking Study
General Chemistry mg/kg
Chloride 16887006 5,500 13,000 690 30,000 17,000 2,700 12,000 23,000
Fluoride 16984488 C 0.7 1.2 99 48 120 250 200 1,400
Chromium, 18540299 19 C 3.7 26 0.43 0.50 2.6 29 1,000hexavalent
Total Cyanide 57125 380 99 16 6.6 2.0 200 46 74
Amenable Cyanide E-10275 ** 940 ** 180 3.0 3.3 ** 11 30 12 51
Percent Solids 65.9 77.4 38.2 54.9 54.1 37.7 74.3 69.1
Notes: * All results reported on a dry-weight basis.B Analyte also detected in the associated method blank analysis.C Reported value is less than the method quantitation limit (QL) but greater than the instrument detection limit (IDL).** Reported value is the concentration of cyanide after chlorination. Since this value is greater than the total cyanide result, a value for thecyanide amenable to chlorination cannot be calculated. ND Non-detect

September 1998 47 F006 Benchmarking Study
2. Chicago Benchmarking Study
This section provides a detailed presentation of data gathered in the ChicagoBenchmarking Study, including a characterization of plating processes, pollution prevention andrecycling practices, F006 characteristics, and site specific variations in the generation andmanagement of F006 for ten facilities in Milwaukee. Table 12is the facility selection matrix usedto select 10 facilities from 13 candidates. Table 13 presents information collected for eachfacility in the study. Table 14 summarizes the results of the laboratory analyses of F006 data andTable 15 presents detailed laboratory analysis results for each facility.
All Chicago facilities reported an annual quantity of waste generated. The total amountgenerated from all 10 facilities is approximately 1712 tons/year. Nine of the facilities recycletheir F006 waste. One facility landfills its F006 waste. Fifteen F006 laboratory samplesgathered.

September 1998 48 F006 Benchmarking Study
Table 12: Chicago Metal Finishing Facility Selection Matrix
Selection C7 C10 C11 C12Criteria Alternate Alternate Alternate Eliminated
C1 C2 C3 C4 C5 C6 C8 C9 C13 C14Selected Selected Selected Selected Selected Selected Selected Selected Selected Selected
Type: Job Job Job Job Job Job Job Job Job Job Job Job Job JobCaptive/Job
Size 80 150 37 43 70 30 60 50 35 120 150
Main Alk/ Alk/ Alk/ Alk/ Alk/ Alk/ Alk/ Alk/ Alk/ Alk/ Alk/ Alk/ Alk/ Alk/Treatment PPT PPT PPT/IX PPT/ PPT PPT PPT PPT PPT PPT PPT PPT PPT PPTTechnology Cr
Treatment CFR CFR/IX CFR CFR CFR/IX CFR CFR CFR CFR CFR CFR CFR CFR CFRTechnology
Onsite No Yes Yes Electro- Au/Ag No No No Yes No Au/Ag IX NoRecycle winning Closed System
System
Landfill No No No No No No Yes Yes Yes Yes No Yes
Main Recycle Recycle Recycle Recycle Reclaim Recycle LF LF Lf/Recycle LF Reclaim LFManagementMethod
Finishing Cu/Ni/Cr Cu/Ni/Cr CdCN Cu/Ni/Cr AuCN Cu/Ni CdCN Cu/Ni/Cr Zn/Fe CuCN/Ni Cu/Ni/Cr Electro- AuCN Zn(CN)/Processes E-Ni Zn(nCN)/ Zn(CN)/ AgCN Zn(nCN)/ Zn(nCN)/ Cu/Ni/Cr BrassCN E-Ni polish AgCN Fe
HCr Fe Fe Nickel Fe Fe E-Ni HCr ZnZn(nCN)/ Copper Zn/Fe Zn(nCN)/ (nCN)Fe Fe
SURVEY? Y N Y Y Y N N Y-SAIC Y-SAIC N Y-SAIC Y N Y

September 1998 49 F006 Benchmarking Study
Table 13: Facility-Specific Information for Chicago FacilitiesFacility C1
Plating Process F006 Quantity and Management Sample Description
Cu-CN Cd-CN 24 - 28 tons/yr C1-01 - sludge collected fromCu-Tin-Zn Au-CN supersack at drier output; slightlyBright dip of Cu alloy Ag-CN Recycle (World Resources) warm; gray-green colorNi/Cr on steel Acid-CuElectroless Ni ChromeTins Tin-NiTin-Zn Tin-acid
Pollution Prevention Practices Sample Characteristics (Dry wt.)
SPENT PLATING SOLUTIONS C1 - 01Filtration - E-Ni, Ni, Cu, Cd, Au, Sn, Ag Total (mg/kg) TCLP (mg/l)Carbon treatment - occasional use for Ni/as needed Al - 4,390 As - NDReplenishment - complete change for E-Ni only/soap dumped periodically Sb - ND Ba - NDPurified water - DI treated on-site As - ND Cd - 1.0Electrolytic dummying - as needed - Ni - primary Ba - 1,080 Cr - 2.8Cyanide bath carbonate freezing - Na-CN every winter, Cd Be - ND Pb - ND Precipitation - combined with bath filtration of carbon Bi - ND Hg - 0.001Monitor pH daily Cd - 17,300 Se - NDDrag-in Reduction - pre-rinse with DI water Ca - 47,400 Ag - 3.8High purity anodes (some tanks bagged) Cr - 83,000Non-chelated process chemistries in Tin-Zn bath Hex. Cr - 1,190Non-CN process chemicals - approx. 1/3 of chemicals non-CN Cu - 40,000Solvent degreasing alternatives - mineral spirits and limited ultrasonic. Fe - 27,800Alkaline Cleaners - skimming, chrome reducers Pb - 10,300Have written procedures for bath make-up and additions Mg - 51,100Use process baths to maximum extent possible (no dump schedule) Mn - 332Remove anodes from bath when they are idle Hg - NDPerform regular maintenance of racks/barrels Ni - 98,800Pre-inspect parts to prevent processing of obvious rejects Se - ND
DRAG-OUT REDUCTION/RECOVERY Na - 22,100Process Bath Operating Conc. - checked every other week Sn - 13,800Process Bath Operating Temp. - automated; daily Zn - 17,100Wetting agents - some CN - 1,800Workpiece positioningWithdrawal and Drainage Time - manual (operators trained)Drainage boards between all baths returned to bathDrag-out tanks on some tanks returned to bathElectrowinning on Au onlyMeshpad Mist Eliminators - chrome
RINSE WATERSpray or Fog Rinse/Rinse Water AgitationIncreased Contact Time/Multiple RinsesCountercurrent rinsing and flow restrictorsRecycling/Recovery of rinsewaterManually turning off rinsewater when not in useAir agitation in rinse tanks
OTHEREstablished a formal policy statement with regard to P2 and controlEstablished a formal P2 programConduct employee education for P2Establish a preventative maintenance program for tanks
Ag - 280

September 1998 50 F006 Benchmarking Study
Table 13 (cont’d): Facility-Specific Information for Chicago FacilitiesFacility C2
Plating Process F006 Quantity and Management Sample Description
Mg Anodizing Gold-CN ~347 tons/yr C2-01 - Sludge from roll-off bin; notCu/NiCr Electroless Ni dried; ambient temp. cool;Zn (nCN) on Fe Chromic acid Recycle (Horsehead) consistency of fudge; chunky;Cu plating (nCN) orange-brown; moistAg-CN C2-02 - Sludge from drier;
consistency of dirt; chocolate color
Pollution Prevention Practices Sample Characteristics (Dry wt.)
SPENT PLATING SOLUTIONS C2 - 01 C2-02Filtration - some continuous Total (mg/kg) Total (mg/kg)Carbon treatment to remove organic contaminants on some baths Al - 45,900 Al -27,900 Purified water - DI Sb -ND Sb - NDPrecipitation combined with filtration on certain baths As -ND As - NDMonitoring - daily with on-site lab Ba -65 Ba - 76Purer Anodes and Bags - depends on bath Be -ND Be - NDNonchelated Process Chemistries Bi - 66 Bi - 19Non-CN process chemicals except Au/Ag Cd -3,740 Cd - 4,440Solvent Degreasing Alternatives including Hot alkaline cleaning and Ca -32,900 Ca - 26,400Electrocurrent Cr -9,300 Cr - 18,700Alkaline Cleaners including Skimming and Coalescer on barrel lines Hex. Cr - 53 Hex. Cr - 11Acid Purification - Ion exchange removes metals Cu -1,210 Cu - 1,600
DRAG-OUT REDUCTION/RECOVERY Pb - 170 Pb - 161Wetting Agents - required Mg -161,000 Mg - 111,000Workpiece positioning Mn -1,240 Mn - 1,010Withdrawal and Drainage Time Hg - ND Hg - NDDrainage boards between tanks Ni - 1,640 Ni - 7,390Drag-out tanks Se - ND Se - NDIon Exchange chrome rinses (off-site) Ag -27 Ag - 88
RINSE WATER Sn -1,270 Sn - 2,090Increased Contact Time/ Multiple Rinses - manual rinse with DI water Zn -62,000 Zn - 89,200Countercurrent Rinsing - some but limited space for more CN - 3.3 CN - 0.8Flow controls - Flow restrictorsRecycle rinse water TCLP (mg/l) TCLP (mg/l)Recycle solvents via Safety Kleen As -ND As - ND
Fe - 29,500 Fe - 40,400
Na -29,600 Na - 33,100
Ba -ND Ba - NDCd -0.19 Cd - 0.16Cr - 0.08 Cr - 0.09Pb - ND Pb - NDHg -ND Hg - NDSe - ND Se - NDAg -ND Ag - ND

September 1998 51 F006 Benchmarking Study
Table 13 (cont’d): Facility-Specific Information for Chicago FacilitiesFacility C3
Plating Process F006 Quantity and Management Sample Description
Cd-CN ~90 tons/yr C3-01S - Sludge from left filterZn(non CN) on Steel press; mix of wet/soft and wet/hard
Recycle (Horsehead) sludge; brown color; fudgeconsistency
Pollution Prevention Practices Sample Characteristics (Dry wt.)
SPENT PLATING SOLUTIONS C3 - 01SGeneral Bath Life Extensions Total (mg/kg) TCLP (mg/l)Carbon Treatment - as needed Al -597 As -NDMonitoring - 3-4 times / day Sb -ND Ba -0.7Housekeeping - 1 person in charge of bath chemistry As -39 Cd -1.57Nonchelated Process Chemistries Ba -167 Cr - NDSolvent Degreasing Alternatives - Hot Alkaline Cleaning and Electrocurrent Be -ND Pb - NDAlkaline Cleaners - Skimming Bi - ND Hg -ND
DRAG-OUT REDUCTION Ca -30,200 Ag -NDProcess Bath Operating Concentration Cr -10,700Process Bath Operating Temperature - in the process of installing temp. Hex. Cr - 33controls Cu -86Withdrawal and Drainage Time Fe - 156,000Drainage Boards Pb - 581Drag-Out Tanks - Cd line has dead rinse and is returned to plating bath Mg -27,200
RINSE WATER Hg - NDImproved Rinsing Efficiency - Countercurrent Rinsing Ni - 106Flow Restrictors Se - ND
Cd -788 Se - ND
Mn -3,300
Ag -NDNa -8,200Sn -68Zn -262,000CN - 3,240

September 1998 52 F006 Benchmarking Study
Table 13 (cont’d): Facility-Specific Information for Chicago FacilitiesFacility C4
Plating Process F006 Quantity and Management Sample Description
Cu/Ni/Cr on brass Zn-CN ~73 tons/yr C4-01S - Sludge from lugger boxCu (Alkaline) Cd-CN under filter press: fudge consistency,Dull and Bright Ni Sn-acid Recycle (Horsehead) cool, chocolate-brown color, cakeNi/Cr on steel formed into 1 ½ inch thick layers,Bright dip of Cu estimated at 75% waterZn phosphateChromating of Al60/40 (Sn/Pb) solder
Pollution Prevention Practices Sample Characteristics (Dry wt.)
SPENT PLATING SOLUTIONS C4 - 01SFiltration on the Tin, Ni, and Cu baths Total (mg/kg) TCLP (mg/l)Carbon Treatment in the Ni and Cu baths Al -41,000 As -NDReplenishment Sb -ND Ba -NDElectrolytic Dummying for Ni, Cu, Cd, Zn, Cr As -ND Cd -1.26Cyanide Bath Carbonate Freezing Ba -715 Cr - NDPrecipitation - occasionally on tins Be -37 Pb - NDMonitoring - once/wk at minimum Bi - ND Hg -NDPurer Anodes and Bags Cd -6,040 Se - NDHexavalent for trivalent Chrome in clear chromate conversion coating Ca -63,500 Ag -NDSolvent Degreasing alternatives: hot alkaline cleaning, electrocurrent, & Cr -50,800ultrasonic Hex. Cr - 28Alkaline Cleaners - skimming Cu -9,940Waste reduction study conducted Fe - 124,000Pre-inspect parts to prevent processing of obvious rejects Pb - 2,320Perform regular maintenance of racks/barrels Mg -49,500Remove anodes from bath when they are idle Mn -1,690Use process baths to maximum extent possible Hg - NDHave written procedures for bath make-up and additions Ni - 11,300Waste stream segregation of contact and non-contact wastewaters Se - NDStrict chemical inventory control Ag -110Evaluation of recycling alternatives Na -4,440
DRAG-OUT REDUCTION/RECOVERY Zn -176,000Process Bath Operating Concentration and Temperature CN - 3,740Wetting Agents - add to Ni bathsWorkpiece PositioningWithdrawal and Drainage Time and BoardsDrag-Out TanksElectrowinning for Cd
RINSE WATERSpray Rinse/Rinse Water Agitation - some tinCountercurrent Rinsing - 2 and 3-stageRecycle/Recovery of Rinse WaterRecycle/Recovery of SolventsEliminate rinsewaters to waste treatmentManually turning off rinsewater when not in useFlow restrictors
OTHERConduct employee education for P2Housekeeping - QA manager controls bath chemistry
Sn -36,200

September 1998 53 F006 Benchmarking Study
Table 13 (cont’d): Facility-Specific Information for Chicago FacilitiesFacility C6
Plating Process F006 Quantity and Management Sample Description
Electroless Ni Ni ~15 tons/yr C6-01 - Sludge from plant 1; sludgeCu-CN Sn mixed with absorbent calledZn Ag-CN Recycle (World Resources) Absorbex; black and greenish-gray;Au-CN sludge is 2 days old
C6-02 - Sludge from superbag inplant 2; green/gray and brown; clayconsistency; sludge generated theprevious week
Pollution Prevention Practices Sample Characteristics (Dry wt.)
SPENT PLATING SOLUTIONS C6 - 01 C6-02Filtration - continuous Total (mg/kg) Total (mg/kg)Carbon Treatment - periodically Al -5,350 Al - 1,740Purified Water - for Ni Sb -207 Sb - NDElectrolytic Dummying - for Ni As -ND As -ND Cyanide Bath Carbonate Freezing - annually Ba -119 Ba - 54Precipitation - periodically Be -20 Be - 10Monitoring - weekly to outside labs/daily-weekly internally Bi - ND Bi - 35Housekeeping - lab controls bath chemistry Cd -51 Cd - NDPurer Anodes and Bags - Silver 99.998%; Gold 99.999%; Nickel 98% Ca -63,000 Ca - 13,000Hexavalent Chrome Alternatives - Trivalent chrome for clear/blue bright Cr -698 Cr - 59,400conversion coatings Hex. Cr - 7 Hex. Cr - 174Solvent Degreasing Alternatives - Hot Alkaline Cleaning and Electrocurrent Cu -37,500 Cu - 21,900Alkaline Cleaners - Skimming Fe - 24,600 Fe - 47,000
DRAG-OUT REDUCTION/RECOVERY Mg -53,400 Mg - 6,100Wetting Agents - present in formula from vendor Mn -799 Mn - 746Withdrawal and Drainage Time - Training Hg - ND Hg - NDDrainage Boards Ni - 77,100 Ni - 21,500Drag-Out Tanks (Dead Rinse) Se - ND Se - NDElectrowinning - Gold (periodic); Silver (continuous) Ag -272 Ag - 32Nickel drag out sent back to plating bath Na -37,200 Na - 89,200
RINSE WATER Zn -24,400 Zn - 81,400Improved Rinsing Efficiency CN - 373 CN - 240Spray Rinse/Rinse Water Agitation (Air Spargers)Countercurrent Rinsing - 2-stage TCLP (mg/l) TCLP (mg/l)Flow Restrictors As -ND As - ND
Pb - 326 Pb - 109
Sn -9,740 Sn - 12,100
Ba -ND Ba - NDCd -ND Cd - NDCr - ND Cr - 0.08Pb - ND Pb - NDHg -0.002 Hg - NDSe - ND Se - NDAg - 0.29 Ag - ND

September 1998 54 F006 Benchmarking Study
Table 13 (cont’d): Facility-Specific Information for Chicago FacilitiesFacility C7
Plating Process F006 Quantity and Management Sample Description
Plant 1: Plant 2: ~ 65 tons/yr C7-01S - From supersack; reddish-Ag (CN) Sn (Dull) brown and some greenish-gray,Cu-CN Ni (Sulfamate) Recycle (World Resources) muddy/clayey consistencyAcid-Sn Cu-CN C7-02S - from supersack, bigElectroless Ni Sn (Bright Acid) chunks, very hard but breakable,Cu-acid Solder red-brown, ambient temperature,
smells like paint -Plant 2
Pollution Prevention Practices Sample Characteristics (Dry wt.)
SPENT PLATING SOLUTIONS C7 - 01S C7-02SFiltration - removes organics Total (mg/kg) Total (mg/kg)Carbon Treatment Al -4,510 Al -493 Purified Water - DI Sb -ND Sb - NDElectrolytic Dummying As -ND As - NDPrecipitation Ba -20 Ba - 27Monitoring - at least weekly Be -ND Be - NDPurer Anodes and Bags - 99.9% Bi - ND Bi -54 Solvent Degreasing Alternatives - Hot Alkaline Cleaning and Electrocurrent Cd -9 Cd - NDAlkaline Cleaners - Skimming for oil Ca -11,000 Ca - 16,100
DRAG-OUT REDUCTION/RECOVERY Hex. Cr. - ND Hex. Cr - NDProcess Bath Operating Concentration Cu -21,400 Cu - 23,800Process Bath Operating Temperature Fe - 1,510 Fe - 131,000Wetting Agents - in Brightener Pb - 47 Pb - 2,080Workpiece Positioning Mg -336,000 Mg - 242,000Withdrawal and Drainage Time Mn -103 Mn - 523Silver rinse - Either electrowinning or electrodialysis Hg - ND Hg - ND
RINSE WATER Se - ND Se - NDSpray Rinse/Rinse Water Agitation - Air agitation Ag -253 Ag - NDCountercurrent Rinsing - 2-stage on most lines Na -1,060 Na - 1,230Flow Restrictors Sn -9,680 Sn - 36,600
Cr -161 Cr - 127
Ni - 27,100 Ni - 10,100
Zn -1,070 Zn - 2,060CN - 2,480 CN - 725
TCLP (mg/l) TCLP (mg/l)As -ND As - NDBa -ND Ba - NDCd -ND Cd - NDCr - ND Cr - NDPb - ND Pb - NDHg -ND Hg - NDSe - ND Se - NDAg -0.07 Ag - ND
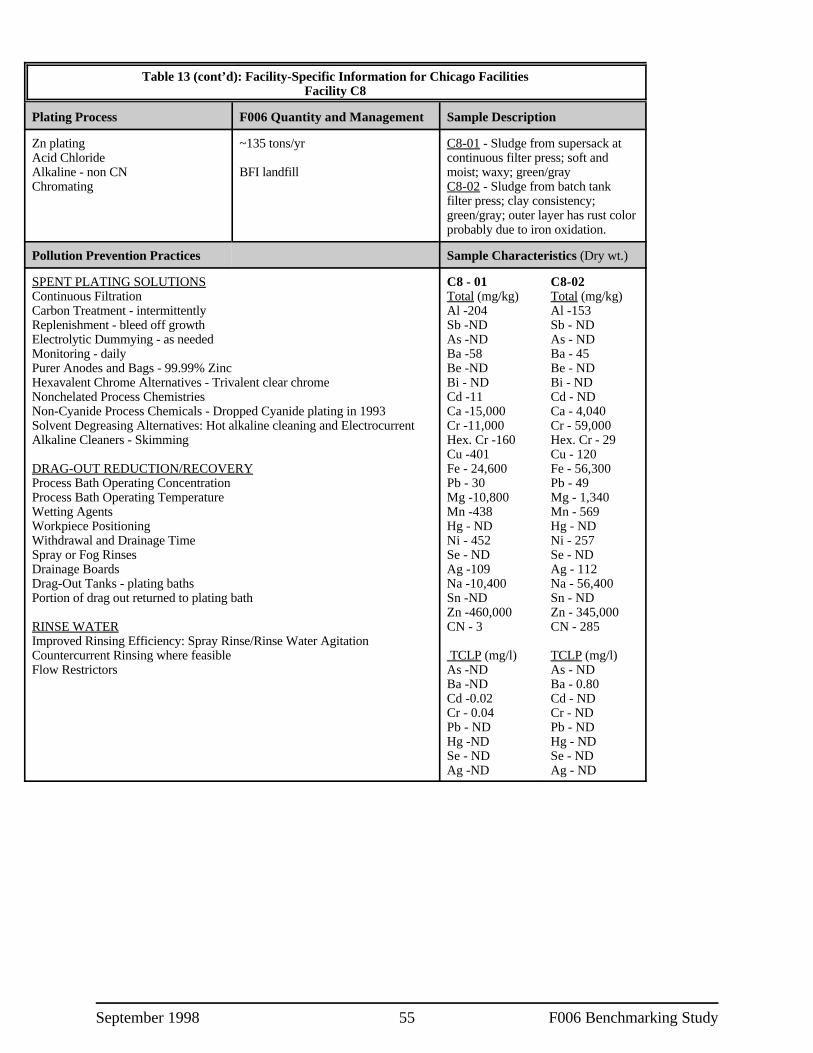
September 1998 55 F006 Benchmarking Study
Table 13 (cont’d): Facility-Specific Information for Chicago FacilitiesFacility C8
Plating Process F006 Quantity and Management Sample Description
Zn plating ~135 tons/yr C8-01 - Sludge from supersack atAcid Chloride continuous filter press; soft andAlkaline - non CN BFI landfill moist; waxy; green/grayChromating C8-02 - Sludge from batch tank
filter press; clay consistency;green/gray; outer layer has rust colorprobably due to iron oxidation.
Pollution Prevention Practices Sample Characteristics (Dry wt.)
SPENT PLATING SOLUTIONS C8 - 01 C8-02Continuous Filtration Total (mg/kg) Total (mg/kg)Carbon Treatment - intermittently Al -204 Al -153 Replenishment - bleed off growth Sb -ND Sb - NDElectrolytic Dummying - as needed As -ND As - NDMonitoring - daily Ba -58 Ba - 45Purer Anodes and Bags - 99.99% Zinc Be -ND Be - NDHexavalent Chrome Alternatives - Trivalent clear chrome Bi - ND Bi - NDNonchelated Process Chemistries Cd -11 Cd - NDNon-Cyanide Process Chemicals - Dropped Cyanide plating in 1993 Ca -15,000 Ca - 4,040Solvent Degreasing Alternatives: Hot alkaline cleaning and Electrocurrent Cr -11,000 Cr - 59,000Alkaline Cleaners - Skimming Hex. Cr -160 Hex. Cr - 29
DRAG-OUT REDUCTION/RECOVERY Fe - 24,600 Fe - 56,300Process Bath Operating Concentration Pb - 30 Pb - 49Process Bath Operating Temperature Mg -10,800 Mg - 1,340Wetting Agents Mn -438 Mn - 569Workpiece Positioning Hg - ND Hg - NDWithdrawal and Drainage Time Ni - 452 Ni - 257Spray or Fog Rinses Se - ND Se - NDDrainage Boards Ag -109 Ag - 112Drag-Out Tanks - plating baths Na -10,400 Na - 56,400Portion of drag out returned to plating bath Sn -ND Sn - ND
RINSE WATER CN - 3 CN - 285Improved Rinsing Efficiency: Spray Rinse/Rinse Water Agitation Countercurrent Rinsing where feasible TCLP (mg/l) TCLP (mg/l)Flow Restrictors As -ND As - ND
Cu -401 Cu - 120
Zn -460,000 Zn - 345,000
Ba -ND Ba - 0.80Cd -0.02 Cd - NDCr - 0.04 Cr - NDPb - ND Pb - NDHg -ND Hg - NDSe - ND Se - NDAg -ND Ag - ND

September 1998 56 F006 Benchmarking Study
Table 13 (cont’d): Facility-Specific Information for Chicago FacilitiesFacility C9
Plating Process F006 Quantity and Management Sample Description
Zn-acid plating 230-300 tons/yr C9-01 - Dried sludge fromCd-acid plating supersack after sludge drier, warm,Cu/Ni Recycle (Envirite) dark chocolate-brown color,Chromating granular to powdery consistencyPhosphating C9-02 - Sludge from a supersack
dated the previous week, dry/moistmix, reddish-brown, chunky andpowdery, ambient air temp
Pollution Prevention Practices Sample Characteristics (Dry wt.)
SPENT PLATING SOLUTIONS C9 - 01 C9-02Filtration - Zn baths as needed Total (mg/kg) Total (mg/kg)Carbon Treatment - as needed Al -298 Al -311 Purified Water - DI for chromates Sb -ND Sb - NDPrecipitation - Fe removal in Zn baths, combined with filtration As -ND As - NDMonitoring - daily Ba -578 Ba - 789Housekeeping - manager authorizes bath additions/changes Be -ND Be - NDPurer Anodes and Bags - min. 99.9% Bi - ND Bi - NDHexavalent Chrome Alternatives - Trivalent chrome for clear chromates Cd - 27,600 Cd - 13,800Nonchelated Process Chemistries Ca - 8,630 Ca - 17,000Non-Cyanide Process Chemicals - No CN Cr - 40,400 Cr - 32,200Solvent Degreasing Alternatives: Hot alkaline cleaning and Electrocurrent Hex. Cr -6 Hex. Cr -11
DRAG-OUT REDUCTION Fe - 185,000 Fe - 257,000Wetting Agents Pb - 5 Pb - 9Workpiece Positioning Mg -2,120 Mg - 4,190Withdrawal and Drainage Time Mn -2,130 Mn - 2,950Drainage Boards Hg - ND Hg - NDDrag out Tanks - on rinses only Ni - 707 Ni - 2,730
RINSE WATER Ag -225 Ag - 173Countercurrent Rinsing - 2 - 3-stage Na -7,840 Na - 11,600Flow Restrictors Sn -ND Sn - NDRecycle/Recovery Rinse Water Zn -115,000 Zn - 175,000
Cu - 388 Cu - 4,230
Se - ND Se - NA
CN - 2.6 CN - 1.6
TCLP (mg/l) TCLP (mg/l)As -ND As - NDBa -ND Ba - NDCd -144 Cd - 15.8Cr - 0.14 Cr - 0.02Pb - ND Pb - NDHg -ND Hg - NDSe - ND Se - NDAg -ND Ag - ND

September 1998 57 F006 Benchmarking Study
Table 13 (cont’d): Facility-Specific Information for Chicago FacilitiesFacility C13
Plating Process F006 Quantity and Management Sample Description
Cu-CN Ni 3 tons/yr C13-01 - Sludge from filter pressAu-CN Ag-CN bag; 30-day old sludge; consistencySn Recycle (United Refining) of cookies; chocolate-brown in color
Pollution Prevention Practices Sample Characteristics (Dry wt.)
SPENT PLATING SOLUTION C13 - 01Filtration - as needed Total (mg/kg) TCLP (mg/l)Carbon Treatment - as needed (rarely) Al -564 As -NDPurified Water Sb -90 Ba -NDElectrolytic Dummying - Silver uses As -ND Cd -NDMonitoring - once a month/ weekly additions Ba -143 Cr - NDHousekeeping - QC program to calculate usage Be -7 Pb - NDPurer Anodes and Bags - Silver 99.99% Bi - ND Hg - 0.011Solvent Degreasing Alternatives - Electrocurrent Cd -22 Se - ND
DRAG-OUT REDUCTION/RECOVERY Cr -73Wetting Agents Hex. Cr -4Withdrawal and Drainage Time - Training Cu -91,600Drag-Out Tanks (Dead Rinse) Fe - 69,000Ion Exchange for Gold Pb - 189Electrowinning for Silver - commercial unit Mg -10,800
RINSE WATER Hg - NDCountercurrent Rinsing - 2-stage for tin Ni - 9,010Flow Restrictors Se - NDRecycling/Recovery of Solvents (sent to off-site recovery) Ag -351
Ca -83,900 Ag -0.85
Mn -343
Na -1,420Sn -41,200Zn -3,590CN - 3,310
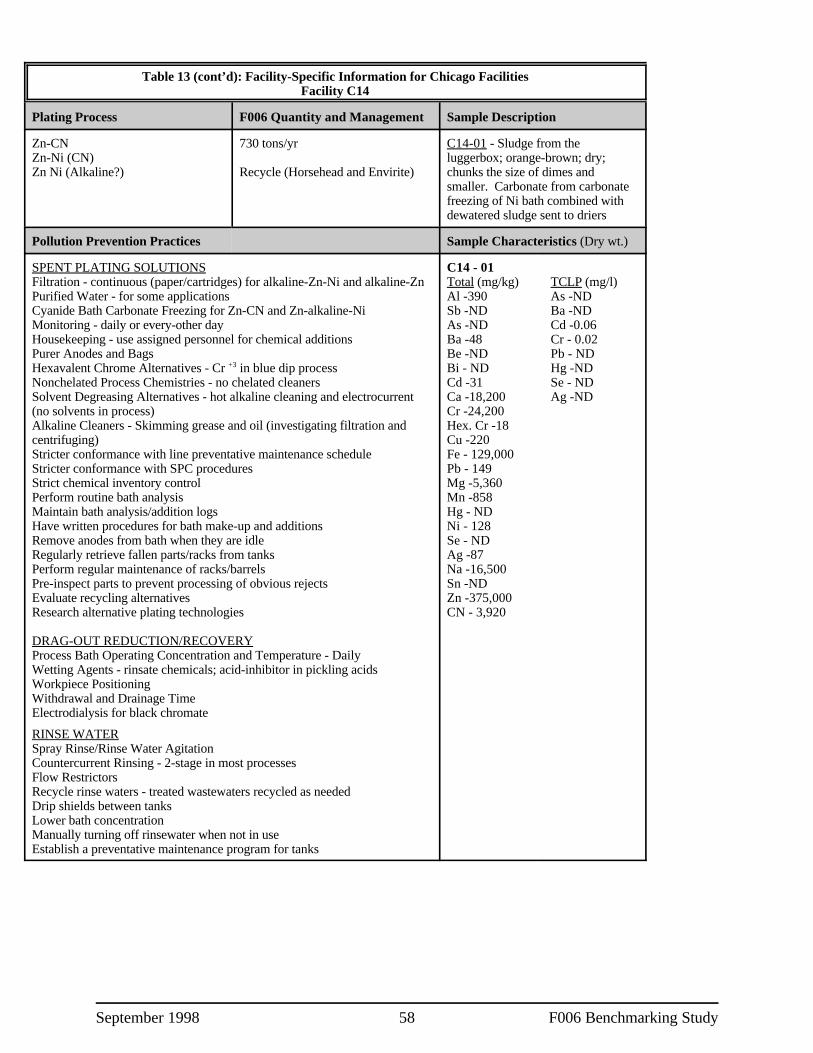
September 1998 58 F006 Benchmarking Study
Table 13 (cont’d): Facility-Specific Information for Chicago FacilitiesFacility C14
Plating Process F006 Quantity and Management Sample Description
Zn-CN 730 tons/yr C14-01 - Sludge from theZn-Ni (CN) luggerbox; orange-brown; dry;Zn Ni (Alkaline?) Recycle (Horsehead and Envirite) chunks the size of dimes and
smaller. Carbonate from carbonatefreezing of Ni bath combined withdewatered sludge sent to driers
Pollution Prevention Practices Sample Characteristics (Dry wt.)
SPENT PLATING SOLUTIONS C14 - 01Filtration - continuous (paper/cartridges) for alkaline-Zn-Ni and alkaline-Zn Total (mg/kg) TCLP (mg/l)Purified Water - for some applications Al -390 As -NDCyanide Bath Carbonate Freezing for Zn-CN and Zn-alkaline-Ni Sb -ND Ba -NDMonitoring - daily or every-other day As -ND Cd -0.06Housekeeping - use assigned personnel for chemical additions Ba -48 Cr - 0.02Purer Anodes and Bags Be -ND Pb - NDHexavalent Chrome Alternatives - Cr in blue dip process Bi - ND Hg -ND+3
Nonchelated Process Chemistries - no chelated cleaners Cd -31 Se - NDSolvent Degreasing Alternatives - hot alkaline cleaning and electrocurrent Ca -18,200 Ag -ND(no solvents in process) Cr -24,200Alkaline Cleaners - Skimming grease and oil (investigating filtration and Hex. Cr -18centrifuging) Cu -220Stricter conformance with line preventative maintenance schedule Fe - 129,000Stricter conformance with SPC procedures Pb - 149Strict chemical inventory control Mg -5,360Perform routine bath analysis Mn -858Maintain bath analysis/addition logs Hg - NDHave written procedures for bath make-up and additions Ni - 128Remove anodes from bath when they are idle Se - NDRegularly retrieve fallen parts/racks from tanks Ag -87Perform regular maintenance of racks/barrels Na -16,500Pre-inspect parts to prevent processing of obvious rejects Sn -NDEvaluate recycling alternatives Zn -375,000Research alternative plating technologies CN - 3,920
DRAG-OUT REDUCTION/RECOVERYProcess Bath Operating Concentration and Temperature - DailyWetting Agents - rinsate chemicals; acid-inhibitor in pickling acidsWorkpiece PositioningWithdrawal and Drainage TimeElectrodialysis for black chromate
RINSE WATERSpray Rinse/Rinse Water AgitationCountercurrent Rinsing - 2-stage in most processesFlow RestrictorsRecycle rinse waters - treated wastewaters recycled as neededDrip shields between tanksLower bath concentrationManually turning off rinsewater when not in useEstablish a preventative maintenance program for tanks

September 1998 59 F006 Benchmarking Study
Table 14: Summary of Chicago F006 Analytical Data
Constituent # Samples # Non Detects # Samples Above MethodQuantitation Limit
Total Metals Concentration (mg/kg)
Aluminum 15 0(0%) 15(100%)
Antimony 15 13(87%) 2(13%)
Arsenic 15 1(7%) 14(93%)
Barium 15 0(0%) 15(100%)
Beryllium 15 11(73%) 4(27%)
Bismuth 15 11(73%) 4(27%)
Cadmium 15 3(20%) 12(80%)
Calcium 15 0(0%) 15(100%)
Chromium 15 0(0%) 15(100%)
Copper 15 0(0%) 15(100%)
Iron 15 0(0%) 15(100%)
Lead 15 0(0%) 15(100%)
Magnesium 15 0(0%) 15(100%)
Manganese 15 0(0%) 15(100%)
Mercury 15 10(67%) 5(33%)
Nickel 15 0(0%) 15(100%)
Selenium 15 15(100%) 0(0%)
Silver 15 2(13%) 13(87%)
Sodium 15 0(0%) 15(100%)
Tin 15 5(33%) 10(67%)
Zinc 15 0(0%) 15(100%)
TCLP ( mg/l)
Arsenic 15 15(100%) 0(0%)
Barium 15 14(93%) 1(7%)
Cadmium 15 6(40%) 9(60%)
Chromium 15 7(47%) 8(53%)
Lead 15 15(100%) 0(0%)
Mercury 15 12(80%) 3(20%)
Selenium 15 15(100%) 0(0%)
Silver 15 11(7%) 4(93%)
General Chemistry (mg/kg)
Chloride 15 0(0%) 15(100%)
Fluoride 15 5(33%) 10(67%)
Chromium, hexavalent 15 2(13%) 13(87%)
Total Cyanide 15 0(0%) 15(100%)
Amenable Cyanide 15 0(0%) 15(100%)
Percent Solids 15 0(0%) 15(100%)

September 1998 60 F006 Benchmarking Study
Table 15: Detailed Chicago Analytical Data
Constituent CAS No. C1-01 C2-01 C2-02 C3-01S C4-01S C6-01 C6-02
Total Metals - Methods 6010A, 7471A, 7060A, 7421, 7740 mg/kg
Aluminum 7429905 4,390 45,900 27,900 597 41,000 5,350 1,740
Antimony 7440360 ND ND ND ND ND 207 ND
Arsenic 7440382 ND ND ND 39 ND ND ND
Barium 7440393 1,080 65 76 167 715 119 54
Beryllium 7440417 ND ND ND ND 37 20 10
Bismuth 7440699 ND 66 19 ND ND ND 35
Cadmium 7440439 17,300 3,740 4,440 788 6,040 51 ND
Calcium 7440702 47,400 32,900 26,400 30,200 63,500 63,000 13,000
Chromium 7440473 83,000 9,300 18,700 10,700 50,800 698 59,400
Copper 7440508 40,000 1,210 1,600 86 9,940 37,500 21,900
Iron 7439896 27,800 29,500 40,400 156,000 124,000 24,600 47,000
Lead 7439921 10,300 170 161 581 2,320 326 109
Magnesium 7439954 51,100 161,000 111,000 27,200 49,500 53,400 6,100
Manganese 7439965 332 1,240 1,010 3,300 1,690 799 746
Mercury 7439976 ND ND 0 ND 0 0 0
Nickel 7440020 98,800 1,640 7,390 106 11,300 77,100 21,500
Selenium 7782492 ND ND ND ND ND ND ND
Silver 7440224 280 27 88 ND 110 272 32
Sodium 7440235 22,100 29,600 33,100 8,200 4,440 37,200 89,200
Tin 7440315 13,800 1,270 2,090 68 36,200 9,740 12,100
Zinc 7440666 17,100 62,000 89,200 262,000 176,000 24,400 81,400
TCLP Metals - Methods 1311, 6010A, 7470A mg/L
Arsenic 7440382 ND ND ND ND ND ND ND
Barium 7440393 ND ND ND 0.7 ND ND ND
Cadmium 7440439 1.0 0.19 0.16 1.57 1.26 ND ND
Chromium 7440473 2.8 0.08 0.09 ND ND ND 0.08
Lead 7439921 ND ND ND ND ND ND ND
Mercury 7439976 0.001 ND ND ND ND 0.002 ND
Selenium 7782492 ND ND ND ND ND ND ND
Silver 7440224 3.8 ND ND ND ND 0.29 ND

Table 15: Detailed Chicago Analytical Data
Constituent CAS No. C1-01 C2-01 C2-02 C3-01S C4-01S C6-01 C6-02
September 1998 61 F006 Benchmarking Study
General Chemistry - Methods 300.0, 335.2, 335.1, 7195/6010A mg/kg
Chloride 16887006 2,720 7430 59,800 5,980 959 2,140 322
Fluoride 16984488 166 4210 1180 ND 96.5 128 347
Chromium, hex 18540299 1,190 53 11 33 28 7 174
Total Cyanide 57125 1,800 3.3 0.8 3,240 3,740 373 240
Amen. Cyanide E-10275 110 ** 6.2 ** 2.6 ** 4,940 ** 5,340 ** 471 ** 354
Percent Solids 57.0 13.5 44 15.3 14.7 25 30.3
Notes: * All results reported on a dry-weight basis.** Reported value is the concentration of cyanide after chlorination. Since this value is greater than the total
cyanide result, a value for the cyanide amenable to chlorination cannot be calculated.ND = Not detected

September 1998 62 F006 Benchmarking Study
Table 15: Detailed Chicago Analytical Data
Constituent CAS No. C7-01S C7-02S C8-01 C8-02 C9-01 C9-02 C13-01 C14-01
Total Metals - Methods 6010A, 7471A, 7060A, 7421, 7740 mg/kg
Aluminum 7429905 4,510 493 204 153 298 311 564 390
Antimony 7440360 ND ND ND ND ND ND 90 ND
Arsenic 7440382 ND ND ND ND ND ND ND ND
Barium 7440393 20 27 58 45 578 789 143 48
Beryllium 7440417 ND ND ND ND ND ND 7 ND
Bismuth 7440699 ND 54 ND ND ND ND ND ND
Cadmium 7440439 9 ND 11 ND 27,600 13,800 22 31
Calcium 7440702 11,000 16,100 15,000 4,040 8,630 17,000 83,900 18,200
Chromium 7440473 161 127 11,000 59,000 40,400 32,200 73 24,200
Copper 7440508 21,400 23,800 401 120 388 4,230 91,600 220
Iron 7439896 1,510 131,000 24,600 56,300 185,000 257,000 69,600 129,000
Lead 7439921 47 2,080 30 49 5 9 189 149
Magnesium 7439954 336,000 242,000 10,800 1,340 2,120 4,190 10,800 5,360
Manganese 7439965 103 523 438 569 2,130 2,950 343 858
Mercury 7439976 ND ND ND ND ND ND 0 ND
Nickel 7440020 27,100 10,100 452 257 707 2,730 9,010 128
Selenium 7782492 ND ND ND ND ND ND ND ND
Silver 7440224 253 ND 109 112 225 173 351 87
Sodium 7440235 1,060 1,230 10,400 56,400 7,840 11,600 1,420 16,500
Tin 7440315 9,680 36,600 ND ND ND ND 41,200 ND
Zinc 7440666 1,070 2,060 460,000 345,000 115,000 175,000 3,590 375,000
TCLP Metals - Methods 1311, 6010A, 7470A mg/L
Arsenic 7440382 ND ND ND ND ND ND ND ND
Barium 7440393 ND ND ND 0.80 ND ND ND ND
Cadmium 7440439 ND ND 0.02 ND 144 15.8 ND 0.06
Chromium 7440473 ND ND 0.04 ND 0.14 0.02 ND 0.02
Lead 7439921 ND ND ND ND ND ND ND ND
Mercury 7439976 ND ND ND ND ND ND 0.011 ND
Selenium 7782492 ND ND ND ND ND ND ND ND
Silver 7440224 0.07 ND ND ND ND ND 0.85 ND
General Chemistry - Methods 300.0, 335.2, 335.1, 7195/6010A mg/kg
Chloride 16887006 421 594 11,300 70,100 2,380 7,250 2,380 1,270
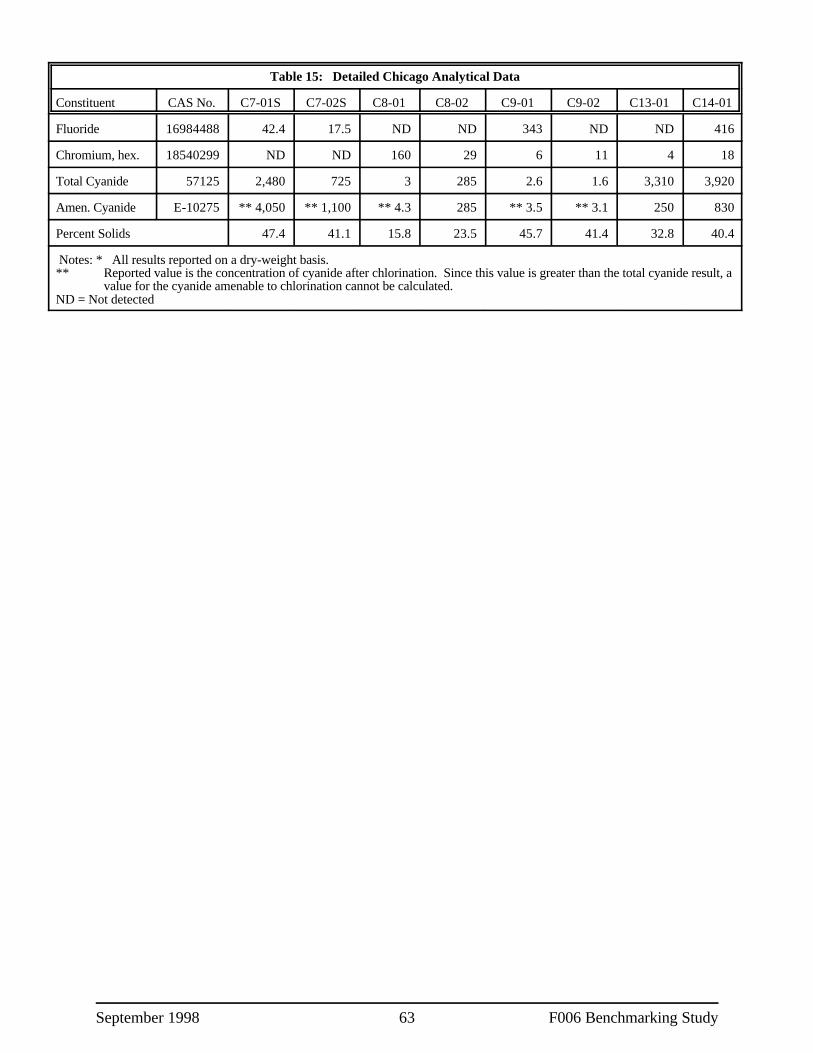
Table 15: Detailed Chicago Analytical Data
Constituent CAS No. C7-01S C7-02S C8-01 C8-02 C9-01 C9-02 C13-01 C14-01
September 1998 63 F006 Benchmarking Study
Fluoride 16984488 42.4 17.5 ND ND 343 ND ND 416
Chromium, hex. 18540299 ND ND 160 29 6 11 4 18
Total Cyanide 57125 2,480 725 3 285 2.6 1.6 3,310 3,920
Amen. Cyanide E-10275 ** 4,050 ** 1,100 ** 4.3 285 ** 3.5 ** 3.1 250 830
Percent Solids 47.4 41.1 15.8 23.5 45.7 41.4 32.8 40.4
Notes: * All results reported on a dry-weight basis.** Reported value is the concentration of cyanide after chlorination. Since this value is greater than the total cyanide result, a
value for the cyanide amenable to chlorination cannot be calculated.ND = Not detected

September 1998 64 F006 Benchmarking Study
3. Phoenix Benchmarking Study
This section provides a detailed presentation of data gathered in the Phoenix Benchmarking Study,including a characterization of plating processes, pollution prevention and recycling practices, F006characteristics, and site specific variations in the generation and management of F006 for ten facilities inPhoenix. Table 16 is the facility selection matrix used to select 10 facilities from 13 candidates. Table 17presents information collected for each facility in the study. Table 18 summarizes the results of thelaboratory analyses of F006 data and Table 19 presents detailed laboratory analysis results for each facility.
The 10 Phoenix facilities generate approximate 1428 tons of F006 per year. Eight facilities recycletheir waste and two facilities send their waste to be landfilled. Fifteen F006 laboratory samples weregathered.

September 1998 65 F006 Benchmarking Study
Table 16: Phoenix Metal Finishing Facility Selection Matrix
Selection Criteria P 1 P 2 P 3 P 4 P 5 P 6 P 7* P8 P 9 P 10 P 11 P 12* P13
Status Selected Selected Selected Selected Selected Selected Alternate Selected Selected Eliminated Selecte Alternate Selectedd
Type: Captive/Job Captive Job Job Captive Captive Job Job Job Captive Job Job Job Captive
Size 35 200 75 10 24 175 105 150 75-100 165 47 450 70
Treatment Technology CFR, IX, IX, CFR CFR, IX, CFR, ED CFR, CFR IX for Ag CF2, IX, MS CFR, MS, CFR, IX IX, MS ERDiagn. RO DOR DOR FM
Onsite Recycle water water No No No Off-spec No No water No IX closed Cu- water inreuse process loop bearing drag-out
foil from IX; tanksEW
Landfill No No No Yes Yes No No No No No No No No
Main Mgmt. Method Filter Press Filter Filter Filter Press Filter Filter Filter Press Filter Filter Filter Filter Filter FilterPress Press Press Press; Press Press Press Press Press Press
Drier (notin use)
Finishing Processes Cu, Ni, Au, Cr Cu-CN Cu, Ag, Cu-CN, Cu Cr, Ag, Cu-foil, Anodize, E-Cu; Cu/Ag/ Cu, Tin, Acid-Cu, HCl-Cu Acid-Cu,Tin Cd-CN Cr, E-Ni, strip, Ni, Cu on hard CR Chem- Cu; black Ni Tin-Pb, Tin, Tin- etching Ni, Au-
Anodiz, Anodiz, Etching, E- steel/Ni/ plating, Film-Cr on oxide; Ni, Au- Pb, Tin- CNPhosphat. Cu/Ag/ Ni, Ni Cr brass-CN Ti, Al, Fe, Au-CN; CN Ni, Ni-
CC, Ni Ni (produces Cr, Ag, Ni Ni Au(CN)Cu-foil)
* Facility operates as a metal finisher and not an electroplater but manages sludge as F006.
Key:MS Material Substitution ER Electrowinning Ni/Cr Nickel chromium Electroplate on steelAlk/PPT Alkaline precipitation FM Flow Meter Cu/Ni/Cr Copper nickel chromium on nonferrousIX Ion exchanges DOR Drag-Out Reduction Cu Copper/PC bandsUltra Ultrafiltration/Microfiltration CC Chrome conversions HCr Hard chromium on steelCFR Counterflow rinse Ni Nickel electroplating Cu-CN Copper cyanide electroplatingEMR Electrolytic metal recovery Au Gold electroplating Cd-CN Cadmium cyanide electroplating ED Electrodialysis E-Ni Electroless-Nickel electroplating Ag Silver electroplatingRO Reverse osmosis Zn/Fe Zinc electroplate on steel

September 1998 66 F006 Benchmarking Study
Table 17: Facility-Specific Information for Phoenix FacilitiesFacility P1
Plating Process F006 Quantity and Management Sample Description
Acid Cu Electroless Ni ~445 tons/yr P1-01 - collected from roll-off,Au-CN Electroless Cu includes sludge generated fromTin-Pb Recycle (World Resources) separate alkaline etch batch
treatment pressP1-02 - composite of sludgecollected from two roll-offscontaining sludge.
Pollution Prevention Practices Sample Characteristics (Dry wt.)
SPENT PLATING SOLUTIONS P1 - 01 P1 - 02Filtration Total (mg/kg) Total (mg/kg)Carbon treatment Al - 3,420 Al - 44,700Bath replenishment Sb - ND Sb - NDPurified water - utilize Reverse Osmosis (RO) and Electrodialytic Removal As - 2 As - 8(EDR) Ba - 6 Ba - 22Electrolytic dummying Bi - ND Bi - NDMonitoring - 90% of baths changed via throughput - some constant Cd - ND Cd - NDfeed/bleed Ca - 15,100 Ca - 15,300Housekeeping via checklists Cr - 10 Cr - 23Drag-in reduction - drip boards/rack orientation Hex. Cr - ND Hex. Cr - NDPurer anodes and bags - currently using purest level per specifications Cu - 7,690 Cu - 28,100Facility has explored electrowinning Cu Fe - 5,050 Fe - 4,020Solvent degreasing alternatives - currently use alkaline/aqueous Pb - 2,590 Pb - 194
DRAG-OUT REDUCTION/RECOVERY Mn - 101 Mn - 288Wetting agents - contained in some chemistries Hg - ND Hg - NDWorkpiece positioning - some racks set at angle Ni - 3,080 Ni - 4,450Withdrawal and drainage time - increased hang time Se - ND Se - NDSpray or fog rinses - all horizontal equipment Ag - 8 Ag - 22Drainage boards - automated line equipped w/drainage boards that move Na - 4,050 Na - 4,780w/racks Sn - 2,370 Sn - 1,710Drag-out tanks - replenish baths with drag-out tanks Zn - 57 Zn - 190Replenish plating baths with drag-out tanks CN - ND CN - ND
RINSEWATER TCLP (mg/l) TCLP (mg/l)Spray rinse/rinse water agitation - air agitation in most cases As - ND As - NDIncreased contact time/multiple rinses Ba - ND Ba - NDCountercurrent rinsing Cd - ND Cd - NDFlow restrictors - horizontal flow sensors - flow restrictors on most rinses Cr - ND Cr - NDConductivity-actuated flow control - rinse after micro-etch on oxide line Pb - 0.12 Pb - 0.08 Recycling of rinse water via a closed loop system for etch rinses Hg - ND Hg - ND
Mg - 319,000 Mg - 245,000
Se - ND Se - NDAg - ND Ag - ND
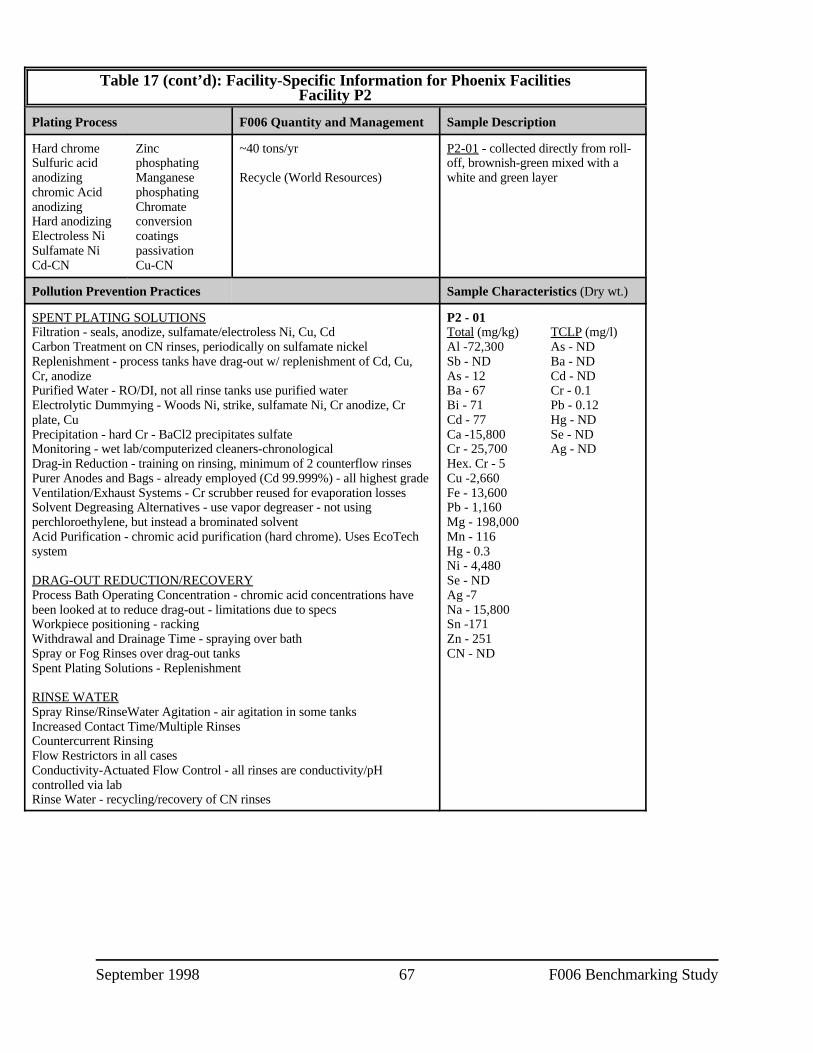
September 1998 67 F006 Benchmarking Study
Table 17 (cont’d): Facility-Specific Information for Phoenix FacilitiesFacility P2
Plating Process F006 Quantity and Management Sample Description
Hard chrome Zinc ~40 tons/yr P2-01 - collected directly from roll-Sulfuric acid phosphating off, brownish-green mixed with aanodizing Manganese Recycle (World Resources) white and green layerchromic Acid phosphatinganodizing ChromateHard anodizing conversionElectroless Ni coatingsSulfamate Ni passivation Cd-CN Cu-CN
Pollution Prevention Practices Sample Characteristics (Dry wt.)
SPENT PLATING SOLUTIONS P2 - 01Filtration - seals, anodize, sulfamate/electroless Ni, Cu, Cd Total (mg/kg) TCLP (mg/l)Carbon Treatment on CN rinses, periodically on sulfamate nickel Al -72,300 As - NDReplenishment - process tanks have drag-out w/ replenishment of Cd, Cu, Sb - ND Ba - NDCr, anodize As - 12 Cd - NDPurified Water - RO/DI, not all rinse tanks use purified water Ba - 67 Cr - 0.1Electrolytic Dummying - Woods Ni, strike, sulfamate Ni, Cr anodize, Cr Bi - 71 Pb - 0.12plate, Cu Cd - 77 Hg - NDPrecipitation - hard Cr - BaCl2 precipitates sulfate Ca -15,800 Se - NDMonitoring - wet lab/computerized cleaners-chronological Cr - 25,700 Ag - NDDrag-in Reduction - training on rinsing, minimum of 2 counterflow rinses Hex. Cr - 5Purer Anodes and Bags - already employed (Cd 99.999%) - all highest grade Cu -2,660Ventilation/Exhaust Systems - Cr scrubber reused for evaporation losses Fe - 13,600Solvent Degreasing Alternatives - use vapor degreaser - not using Pb - 1,160perchloroethylene, but instead a brominated solvent Mg - 198,000Acid Purification - chromic acid purification (hard chrome). Uses EcoTech Mn - 116system Hg - 0.3
DRAG-OUT REDUCTION/RECOVERY Se - NDProcess Bath Operating Concentration - chromic acid concentrations have Ag -7 been looked at to reduce drag-out - limitations due to specs Na - 15,800Workpiece positioning - racking Sn -171Withdrawal and Drainage Time - spraying over bath Zn - 251Spray or Fog Rinses over drag-out tanks CN - NDSpent Plating Solutions - Replenishment
RINSE WATERSpray Rinse/RinseWater Agitation - air agitation in some tanksIncreased Contact Time/Multiple RinsesCountercurrent RinsingFlow Restrictors in all casesConductivity-Actuated Flow Control - all rinses are conductivity/pHcontrolled via labRinse Water - recycling/recovery of CN rinses
Ni - 4,480
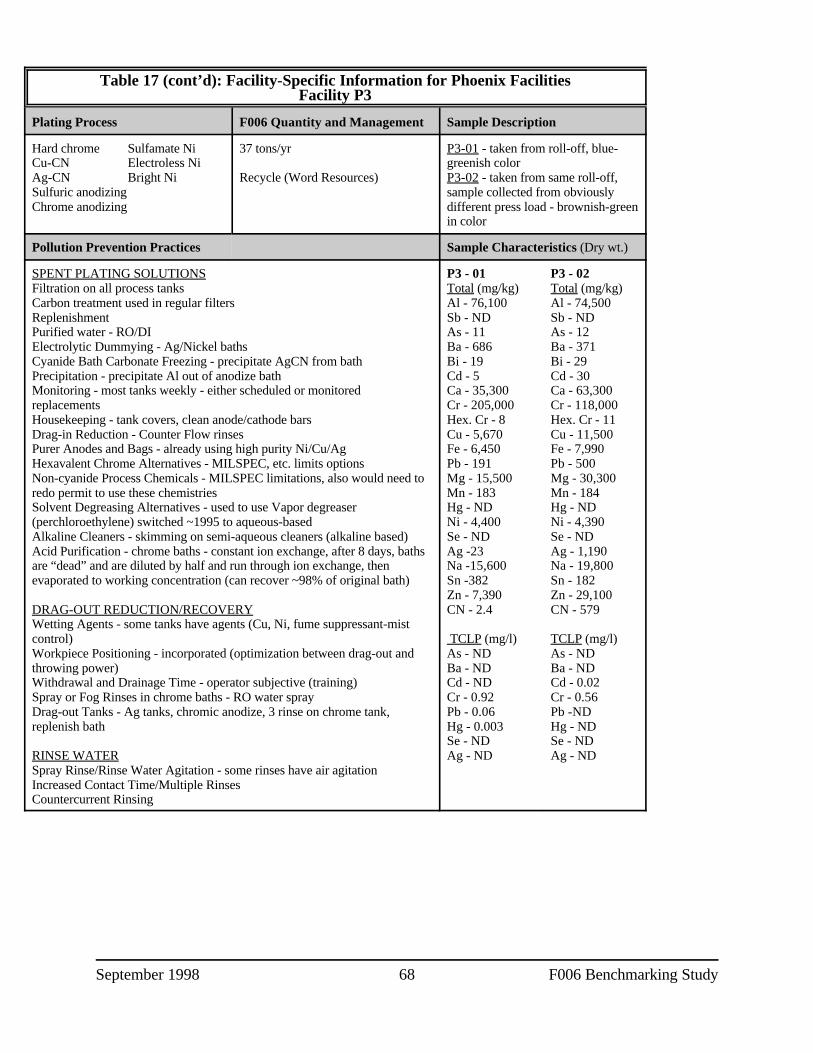
September 1998 68 F006 Benchmarking Study
Table 17 (cont’d): Facility-Specific Information for Phoenix FacilitiesFacility P3
Plating Process F006 Quantity and Management Sample Description
Hard chrome Sulfamate Ni 37 tons/yr P3-01 - taken from roll-off, blue-Cu-CN Electroless Ni greenish colorAg-CN Bright Ni Recycle (Word Resources) P3-02 - taken from same roll-off,Sulfuric anodizing sample collected from obviouslyChrome anodizing different press load - brownish-green
in color
Pollution Prevention Practices Sample Characteristics (Dry wt.)
SPENT PLATING SOLUTIONS P3 - 01 P3 - 02Filtration on all process tanks Total (mg/kg) Total (mg/kg)Carbon treatment used in regular filters Al - 76,100 Al - 74,500Replenishment Sb - ND Sb - NDPurified water - RO/DI As - 11 As - 12Electrolytic Dummying - Ag/Nickel baths Ba - 686 Ba - 371Cyanide Bath Carbonate Freezing - precipitate AgCN from bath Bi - 19 Bi - 29Precipitation - precipitate Al out of anodize bath Cd - 5 Cd - 30Monitoring - most tanks weekly - either scheduled or monitored Ca - 35,300 Ca - 63,300replacements Cr - 205,000 Cr - 118,000Housekeeping - tank covers, clean anode/cathode bars Hex. Cr - 8 Hex. Cr - 11Drag-in Reduction - Counter Flow rinses Cu - 5,670 Cu - 11,500Purer Anodes and Bags - already using high purity Ni/Cu/Ag Fe - 6,450 Fe - 7,990Hexavalent Chrome Alternatives - MILSPEC, etc. limits options Pb - 191 Pb - 500Non-cyanide Process Chemicals - MILSPEC limitations, also would need to Mg - 15,500 Mg - 30,300redo permit to use these chemistries Mn - 183 Mn - 184Solvent Degreasing Alternatives - used to use Vapor degreaser Hg - ND Hg - ND(perchloroethylene) switched ~1995 to aqueous-based Ni - 4,400 Ni - 4,390Alkaline Cleaners - skimming on semi-aqueous cleaners (alkaline based) Se - ND Se - NDAcid Purification - chrome baths - constant ion exchange, after 8 days, baths Ag -23 Ag - 1,190are “dead” and are diluted by half and run through ion exchange, then Na -15,600 Na - 19,800evaporated to working concentration (can recover ~98% of original bath) Sn -382 Sn - 182
DRAG-OUT REDUCTION/RECOVERY CN - 2.4 CN - 579Wetting Agents - some tanks have agents (Cu, Ni, fume suppressant-mistcontrol) TCLP (mg/l) TCLP (mg/l)Workpiece Positioning - incorporated (optimization between drag-out and As - ND As - NDthrowing power) Ba - ND Ba - NDWithdrawal and Drainage Time - operator subjective (training) Cd - ND Cd - 0.02Spray or Fog Rinses in chrome baths - RO water spray Cr - 0.92 Cr - 0.56Drag-out Tanks - Ag tanks, chromic anodize, 3 rinse on chrome tank, Pb - 0.06 Pb -NDreplenish bath Hg - 0.003 Hg - ND
RINSE WATER Ag - ND Ag - NDSpray Rinse/Rinse Water Agitation - some rinses have air agitationIncreased Contact Time/Multiple RinsesCountercurrent Rinsing
Zn - 7,390 Zn - 29,100
Se - ND Se - ND

September 1998 69 F006 Benchmarking Study
Table 17 (cont’d): Facility-Specific Information for Phoenix FacilitiesFacility P4
Plating Process F006 Quantity and Management Sample Description
Ni-Cr on steel 85 tons/yr P4-01 - collected directly from roll-Hard chrome on steel off, reddish-brown in colorCu-CN Subtitle C LandfillSulfuric acid anodizing
Pollution Prevention Practices Sample Characteristics (Dry wt.)
SPENT PLATING SOLUTIONS P4 - 01Replenishment on all tanks Total (mg/kg) TCLP (mg/l)Purified Water - DI water Al - 2,180 As - NDElectrolytic Dummying - hard chrome (regeneration automatically in tank) Sb - ND Ba - NDMonitoring once a week As - 10 Cd - NDHousekeeping - training for drag-out, air drying Ba - 49 Cr - NDVentilation/Exhaust Systems Bi - ND Pb - NDNonchelated Process Chemistries - segregate chelating chemistries, Cd - ND Hg - NDinvestigated material substitutions Ca -15,700 Se - NDSolvent Degreasing Alternatives - all cleaning is aqueous based Cr - 5,680 Ag - ND
DRAG-OUT REDUCTION/RECOVERY Cu - 417Wetting Agents - exploring with vendor Fe - 560,000Workpiece Positioning Pb - 80Withdrawal and Drainage Time - procedures set guideline Mg - 6,310Drainage boards and drag-out tanks Mn - 2,070Drag-out used as make-up in baths Hg - ND
RINSE WATER Se - NDSpray Rinse/Rinse Water Agitation - air and water agitation Ag - NDIncreased Contact Time/Multiple Rinses Na - 6,700Countercurrent Rinsing Sn - 38Rinse Water - counterflow recycling/recovery Zn - 258Spent Process Baths - a portion of FeCl is used in Waste water treatment for CN - NDflocculation
Hex. Cr - 75
Ni - 1,530

September 1998 70 F006 Benchmarking Study
Table 17 (cont’d): Facility-Specific Information for Phoenix FacilitiesFacility P5
Plating Process F006 Quantity and Management Sample Description
Hard chrome Sulfamate Ni 50 tons/yr P5-01 - composited a variety ofCu-CN Ag-CN different press loads into a singleAluminum anodizing Subtitle C Landfill sample, colors ranged from dark
brown to light brown to greenish-brown
Pollution Prevention Practices Sample Characteristics (Dry wt.)
SPENT PLATING SOLUTIONS P5 - 01Filtration of most baths Total (mg/kg) TCLP (mg/l)Replenishment of most baths Al - 2,270 As - NDPurified Water - RO/DI Sb - ND Ba - NDElectrolytic Dummying - hard chrome As - 160 Cd - NDCyanide Bath Carbonate Freezing for all CN plating (CaCO drops out) Ba - 387 Cr - 1.063
Monitoring - wet chemistry - all changes are based on testing Bi - ND Pb - NDHousekeeping - designated bath maintenance person Cd - 806 Hg - NDVentilation/Exhaust Systems - scrubbers segregated as well Ca - 29,300 Se - NDNonchelated Process Chemistries - segregated (electroless Ni) Cr - 206,000 Ag - NDSolvent Degreasing Alternatives - all cleaning aqueous based Hex. Cr - 77Alkaline Cleaners - coalesce/disk filter to remove contaminants Cu - 23,500
DRAG-OUT REDUCTION/RECOVERY Pb - 377Wetting Agents Mg - 31,300Workpiece positioning Mn - 556Withdrawal and Drainage Time - SOP’s Hg - NDAir Knives - some used for drying Ni - 10,300Spray or Fog Rinses - some drag-out tanks have spray rinse Se - NDDrainage boards and drag-out tanks Ag - 457Sent back for replenishment of plating baths Na - 15,300
RINSE WATER Zn - 291Spray Rinse/Rinse Water Agitation - air agitation CN - 102Increased Contact Time/Multiple RinsesCountercurrent RinsingFlow restrictors set at 5 gpm (timed)Spent Process Baths - copper alkaline strip recycled/recovered off-site at asmelterSolvents - oil based wax removal sent off site for fuel blending
Fe - 35,200
Sn - 546

September 1998 71 F006 Benchmarking Study
Table 17 (cont’d): Facility-Specific Information for Phoenix FacilitiesFacility P6
Plating Process F006 Quantity and Management Sample Description
Cu sulfate ~590 tons/yr P6-01 - “fresh” sludge sample fromHard chrome roll-off currently in use(sludgeCyanide-based brass Recycle (World Resources) dropped that day), sludge was a
mixture of bluish and dark brownP6-02 - “old” sludge from hopperaccumulated the previous week,appeared brownish
Pollution Prevention Practices Sample Characteristics (Dry wt.)
SPENT PLATING SOLUTIONS P6 - 01 P6 - 02Filtration on all baths - cartridge, bags, and diatomaceous earth filters Total (mg/kg) Total (mg/kg)Carbon Treatment - electroforming Al - 511 Al - 233Replenishment - continuous circulation Sb - 221 Sb - 153Purified Water - RO As - 8,780 As - 5,600Monitoring - on-line XRF, wet lab Ba - 67 Ba - 11Drag-in Reduction - multiple rinses, squeegees Bi - ND Bi - NDVentilation/Exhaust Systems Cd -3 Cd - NDNon-cyanide Process Chemicals - looking at material substitutions Ca -1,440 Ca - 1,980Caustic Etch Solution Regeneration - plate-out removes all copper Cr -10,000 Cr - 7,820Acid Purification - filtration Hex. Cr - 548 Hex. Cr - 466
DRAG-OUT REDUCTION/RECOVERY Fe - 6,650 Fe - 2,670Spray or Fog Rinses - some replenish to prior tank Pb - 19,800 Pb - 14,800All Drag-Out to Waste Water Treatment Mg - 1,320 Mg - 1,590
RINSE WATER Hg - ND Hg - NDSpray Rinse/Rinse Water Agitation Ni - 99 Ni - 51Increased Contact Time/Multiple Rinses Se - ND Se - NDFlow Restrictors - some used but operators can adjust flow manually Ag -3 Ag - NDConductivity-Actuated Flow Control Na - 60 Na - 25Spent Process Baths - Recycling/Recovery of electroforming bath - Solvent Sn - 3,570 Sn - 3,850Extraction of copper off-site Zn - 31,600 Zn - 24,600
Cu -552,000 Cu - 463,000
Mn - 72 Mn - 24
CN - 169 CN - 127
TCLP (mg/l) TCLP (mg/l)As - ND As - NDBa - ND Ba - NDCd - 0.02 Cd - 0.03Cr - ND Cr - NDPb - 35.40 Pb - 39.80Hg - ND Hg - NDSe - ND Se - NDAg - ND Ag - ND
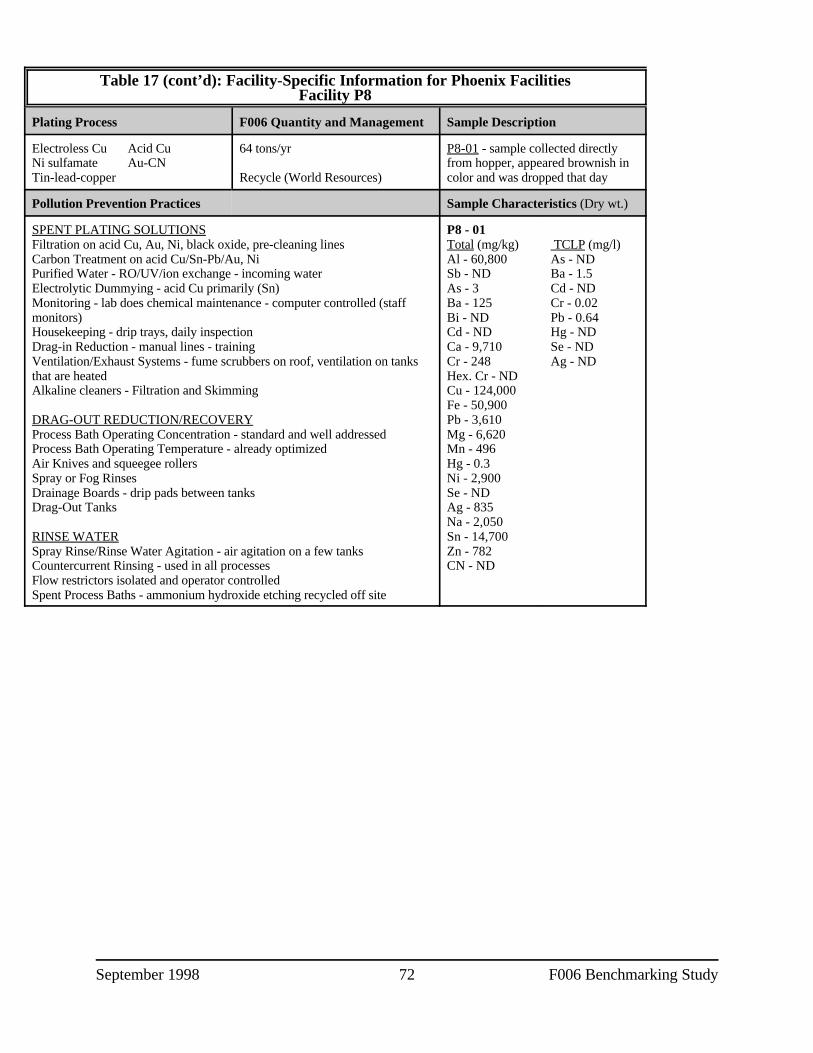
September 1998 72 F006 Benchmarking Study
Table 17 (cont’d): Facility-Specific Information for Phoenix FacilitiesFacility P8
Plating Process F006 Quantity and Management Sample Description
Electroless Cu Acid Cu 64 tons/yr P8-01 - sample collected directlyNi sulfamate Au-CN from hopper, appeared brownish inTin-lead-copper Recycle (World Resources) color and was dropped that day
Pollution Prevention Practices Sample Characteristics (Dry wt.)
SPENT PLATING SOLUTIONS P8 - 01Filtration on acid Cu, Au, Ni, black oxide, pre-cleaning lines Total (mg/kg) TCLP (mg/l)Carbon Treatment on acid Cu/Sn-Pb/Au, Ni Al - 60,800 As - NDPurified Water - RO/UV/ion exchange - incoming water Sb - ND Ba - 1.5Electrolytic Dummying - acid Cu primarily (Sn) As - 3 Cd - NDMonitoring - lab does chemical maintenance - computer controlled (staff Ba - 125 Cr - 0.02monitors) Bi - ND Pb - 0.64Housekeeping - drip trays, daily inspection Cd - ND Hg - NDDrag-in Reduction - manual lines - training Ca - 9,710 Se - NDVentilation/Exhaust Systems - fume scrubbers on roof, ventilation on tanks Cr - 248 Ag - NDthat are heated Hex. Cr - NDAlkaline cleaners - Filtration and Skimming Cu - 124,000
DRAG-OUT REDUCTION/RECOVERY Pb - 3,610Process Bath Operating Concentration - standard and well addressed Mg - 6,620Process Bath Operating Temperature - already optimized Mn - 496Air Knives and squeegee rollers Hg - 0.3Spray or Fog Rinses Ni - 2,900Drainage Boards - drip pads between tanks Se - NDDrag-Out Tanks Ag - 835
RINSE WATER Sn - 14,700Spray Rinse/Rinse Water Agitation - air agitation on a few tanks Zn - 782Countercurrent Rinsing - used in all processes CN - NDFlow restrictors isolated and operator controlledSpent Process Baths - ammonium hydroxide etching recycled off site
Fe - 50,900
Na - 2,050

September 1998 73 F006 Benchmarking Study
Table 17 (cont’d): Facility-Specific Information for Phoenix FacilitiesFacility P9
Plating Process F006 Quantity and Management Sample Description
Copper sulfate 109 tons/yr P9-01 - chelate sludge sampledNickel sulfate directly from small hopper prior toAu immersion (CN) Recycle (World Resources) moving to final storage roll-offTin where commingled with non-chelateElectrolytic Au (CN ) sludgeElectroless nickel P9-02 - non-chelate sludge sampled
directly from final storage hopperavoiding chelate sludge (some minormixing of the two occurred)
Pollution Prevention Practices Sample Characteristics (Dry wt.)
SPENT PLATING SOLUTIONS P9 - 01 P9 - 02Particulate filtration Total (mg/kg) Total (mg/kg)Carbon treatment Al - 4,110 Al - 59Replenishment Sb - 44 Sb - NDPurified Water - RO/DI As - 26 As - 9Electrolytic Dummying - Ni/Cu Ba - 40 Ba - 9Monitoring - AA testing, titrations, and microetch Cu testing Bi - 21 Bi - NDHousekeeping Cd - ND Cd - NDDrag-in Reduction Ca - 6,880 Ca - 682Purer Anodes and Bags are already implemented (function of industry) Cr - 100 Cr - 34Ventilation/Exhaust Systems Hex. Cr - ND Hex. Cr - 31Nonchelated Process Chemistries - chelating chemistries are segregated Cu - 48,700 Cu - 631,000Solvent Degreasing Alternatives - removed vapor degreaser Fe - 204,000 Fe - 364Caustic Etch Solution Regeneration - Cu Ammonium chlorite recycled off Pb - 1,660 Pb - NDsite Mg - 10,700 Mg - 230
DRAG-OUT REDUCTION/RECOVERY Hg - ND Hg - NDProcess Bath Operating Concentration - optimized Ni - 1,990 Ni - 10,800Process Bath Operating Temperature - optimized Se - ND Se - NDWetting Agents - Ni and Cu bath Ag - 38 Ag - 12Workpiece Positioning - looking at positioning sheets at 10° drip angle Na - 36,900 Na - 41,600Withdrawal and Drainage Time - automatic lines are programmed with dwell Sn - 37,200 Sn - 402and rate of removal Zn - 389 Zn - 2.750Air Knives and squeegees on conveyors CN - 9.1 CN - NDSpray or Fog RinsesDrainage Boards - used some in electrolytic gold and used in conveyors TCLP (mg/l) TCLP (mg/l)Drag-Out Tanks As - ND As - NDEvaporation - Ni drag-out replenished to Ni plate bath Ba - ND Ba - ND
RINSE WATER Cr - ND Cr - NDSpray Rinse/Rinse Water Agitation Pb - ND Pb - 0.08Increased Contact Time/Multiple Rinses Hg - ND Hg - NDCountercurrent Rinsing Se - ND Se - NDFlow Restrictors Ag - ND Ag - NDConductivity-Actuated Flow Control - used on large Cu-Tin lineRinse Water - approximately 30 to 35% of total flow is recycledSpent Process Baths - Au recovered on site
Mn - 191 Mn - 104
Cd - ND Cd - ND

September 1998 74 F006 Benchmarking Study
Table 17 (cont’d): Facility-Specific Information for Phoenix FacilitiesFacility P11
Plating Process F006 Quantity and Management Sample Description
Acid Cu Ni sulfate ~4 tons/yr P11-01 - sludge from supersackTin-Pb Acid TinAu -CN Recycle (World Resources)
Pollution Prevention Practices Sample Characteristics (Dry wt.)
SPENT PLATING SOLUTIONS P11 - 01Filtration on all process baths Total (mg/kg) TCLP (mg/l)Carbon treatment on acid-Cu quarterly and others periodically Al - 819 As - NDReplenishment of baths with drag-out Sb - ND Ba - NDPurified water - use deionized water As - ND Cd - NDElectrolytic dummying periodically Ba - 17 Cr - NDMonitoring via wet lab (pH, titration); baths replaced based on sq. ft. plated Bi - ND Pb - 0.13Drag-in reduction - drain times/dwell times Cd -ND Hg - NDSegregate chelating process chemistries (magnesium sulfate used on a batch- Ca -11,400 Se - NDby-batch basis) Cr - 119 Ag - NDSolvent degreasing alternatives - all cleaners are aqueous-based Hex. Cr - NDAlkaline cleaners - resist strip is filtered Cu - 125,000
DRAG-OUT REDUCTION/RECOVERY Pb - 6,080Workpiece positioning - racks are coated Mg - 72,600Optimize withdrawal and drainage time Mn - 2,080Use squirt bottles for rinsing Au/Ni solution back into bath Hg - NDUtilize Drag-out tanks Ni - 1,030Some drag-out tanks are used to replenish hot plating baths Se - ND
RINSE WATER Na - 13,400Spray rinse/rinse water agitation Sn - 131,000Increased contact time/multiple rinses Zn - 820Countercurrent rinsing CN - NDFlow restrictorsConductivity-actuated flow controlRecycling/recovery of rinse water - closed-loop on metal-bearing rinses
Fe - 75,800
Ag - 14
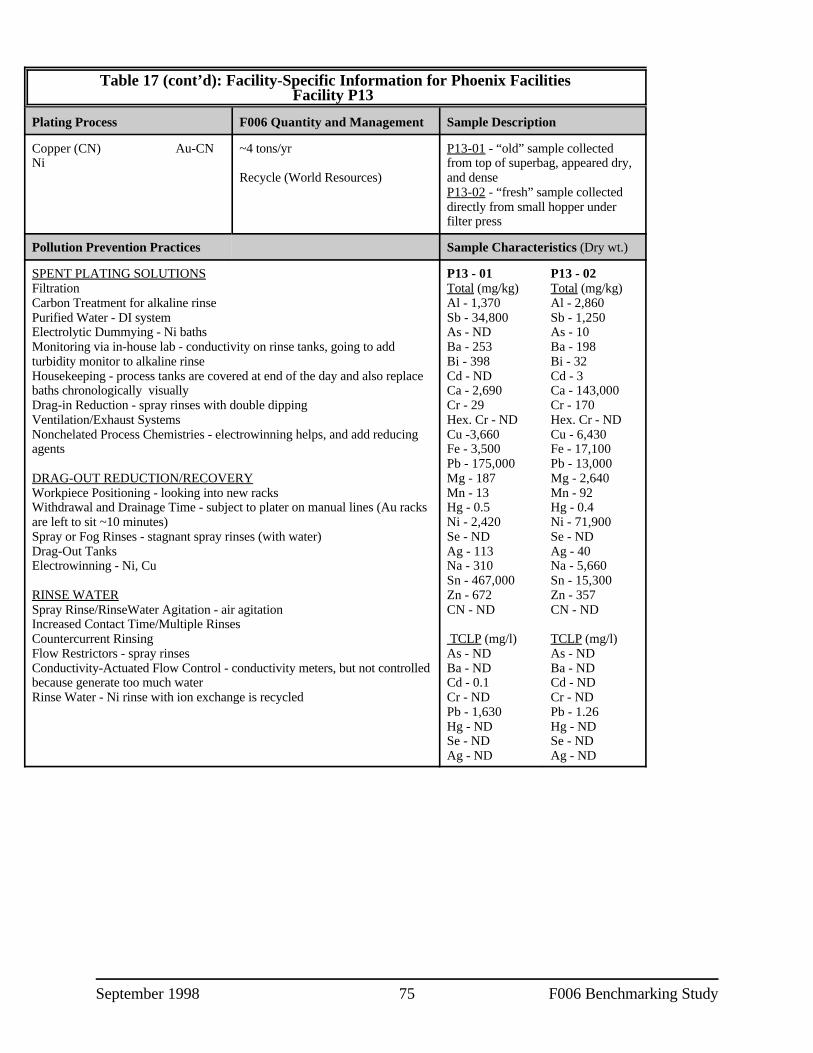
September 1998 75 F006 Benchmarking Study
Table 17 (cont’d): Facility-Specific Information for Phoenix FacilitiesFacility P13
Plating Process F006 Quantity and Management Sample Description
Copper (CN) Au-CN ~4 tons/yr P13-01 - “old” sample collectedNi from top of superbag, appeared dry,
Recycle (World Resources) and denseP13-02 - “fresh” sample collecteddirectly from small hopper underfilter press
Pollution Prevention Practices Sample Characteristics (Dry wt.)
SPENT PLATING SOLUTIONS P13 - 01 P13 - 02Filtration Total (mg/kg) Total (mg/kg)Carbon Treatment for alkaline rinse Al - 1,370 Al - 2,860Purified Water - DI system Sb - 34,800 Sb - 1,250Electrolytic Dummying - Ni baths As - ND As - 10Monitoring via in-house lab - conductivity on rinse tanks, going to add Ba - 253 Ba - 198turbidity monitor to alkaline rinse Bi - 398 Bi - 32Housekeeping - process tanks are covered at end of the day and also replace Cd - ND Cd - 3baths chronologically visually Ca - 2,690 Ca - 143,000Drag-in Reduction - spray rinses with double dipping Cr - 29 Cr - 170Ventilation/Exhaust Systems Hex. Cr - ND Hex. Cr - NDNonchelated Process Chemistries - electrowinning helps, and add reducing Cu -3,660 Cu - 6,430agents Fe - 3,500 Fe - 17,100
DRAG-OUT REDUCTION/RECOVERY Mg - 187 Mg - 2,640Workpiece Positioning - looking into new racks Mn - 13 Mn - 92Withdrawal and Drainage Time - subject to plater on manual lines (Au racks Hg - 0.5 Hg - 0.4are left to sit ~10 minutes) Ni - 2,420 Ni - 71,900Spray or Fog Rinses - stagnant spray rinses (with water) Se - ND Se - NDDrag-Out Tanks Ag - 113 Ag - 40Electrowinning - Ni, Cu Na - 310 Na - 5,660
RINSE WATER Zn - 672 Zn - 357Spray Rinse/RinseWater Agitation - air agitation CN - ND CN - NDIncreased Contact Time/Multiple RinsesCountercurrent Rinsing TCLP (mg/l) TCLP (mg/l)Flow Restrictors - spray rinses As - ND As - NDConductivity-Actuated Flow Control - conductivity meters, but not controlled Ba - ND Ba - NDbecause generate too much water Cd - 0.1 Cd - NDRinse Water - Ni rinse with ion exchange is recycled Cr - ND Cr - ND
Pb - 175,000 Pb - 13,000
Sn - 467,000 Sn - 15,300
Pb - 1,630 Pb - 1.26Hg - ND Hg - NDSe - ND Se - NDAg - ND Ag - ND

September 1998 76 F006 Benchmarking Study
Table 18: Summary of Phoenix F006 Analytical Data: # of Samples Which Were: NotDetected; Above Method Quantitation Limit
Constituent # Samples # Non Detects # Samples Above(%) (%) Method Quantitation
Limit (%)
Total Metals Concentration (mg/kg)Aluminum 15 0(0%) 15(100%)Antimony 15 10(67%) 5(33%)Arsenic 15 2(13%) 13(87%)Barium 15 0(0%) 15(100%)Beryllium 0 0 0Bismuth 15 9(60%) 6(40%)Cadmium 15 9(60%) 6(40%)Calcium 15 0(0%) 15(100%)Chromium 15 0(0%) 15(100%)Copper 15 0(0%) 15(100%)Iron 15 0(0%) 15(100%)Lead 15 1(7%) 14(93%)Magnesium 15 0(0%) 15(100%)Manganese 15 0(0%) 15(100%)Mercury 15 11(73%) 4(27%)Nickel 15 0(0%) 15(100%)Selenium 0 0 0Silver 15 2(13%) 13(87%)Sodium 15 0(0%) 15(100%)Tin 15 0(0%) 15(100%)Zinc 15 0(0%) 15(100%)TCLP (mg/l)Arsenic 0 0 0Barium 8 7(87%) 1(13%)Cadmium 15 11(73%) 4(27%)Chromium 15 10(67%) 5(33%)Lead 15 4(27%) 11(73%)Mercury 7 6(86%) 1(14%)Selenium 0 0 0Silver 0 0 0General Chemistry (mg/kg)Chloride 15 0(0%) 15(100%)Fluoride 15 1(7%) 14(93%)Chromium, hexavalent 15 7(46%) 8(54%)Total Cyanide 15 8(54%) 7(46%)Amenable Cyanide 15 1(7%) 14(93%)Percent Solids 15 0(0%) 15(100%)

September 1998 77 F006 Benchmarking Study
Table 19: Detailed Analytical Data for the Phoenix FacilitiesConstituent CAS No. P1-01 P1-02 P2-01 P3-01 P3-02 P4-01 P5-01
Total Metals - Methods 6010A, 7471A, 7060A, 7421, 7740 mg/kg Aluminum 7429905 3,420 44,700 72,300 76,100 74,500 2,180 2,270Antimony 7440360 ND ND ND ND ND ND NDArsenic 7440382 2 8 12 11 12 10 16Barium 7440393 6 22 67 686 371 49 387Beryllium 7440417 ND ND ND ND ND ND NDBismuth 7440699 ND ND 71 19 29 ND NDCadmium 7440439 ND ND 77 5 30 ND 806Calcium 7440702 15,100 15,300 15,800 35,300 63,300 15,700 29,300Chromium 7440473 10 23 25,700 205,000 118,000 5,680 206,000Copper 7440508 7,690 28,100 2,660 5,670 11,500 417 23,500Iron 7439896 5,050 4,020 13,600 6,450 7,990 560,000 35,200Lead 7439921 2,590 194 1,160 191 500 80 377Magnesium 7439954 319,000 245,000 198,000 15,500 30,300 6,310 31,300Manganese 7439965 101 288 116 183 184 2,070 556Mercury 7439976 ND ND 0.3 ND ND ND NDNickel 7440020 3,080 4,450 4,480 4,400 4,390 1,530 10,300Selenium 7782492 ND ND ND ND ND ND NDSilver 7440224 8 22 7 23 1,190 ND 457Sodium 7440235 4,050 4,780 15,800 15,600 19,800 6,700 15,300Tin 7440315 2,370 1,710 171 382 182 38 546Zinc 7440666 57 190 251 7,390 29,100 258 291
TCLP Metals - Methods 1311, 6010A, 7470A mg/L Arsenic 7440382 ND ND ND ND ND ND NDCadmium 7440439 ND ND ND ND 0.02 ND NDChromium 7440473 ND ND 0.1 0.92 0.56 ND 1.06Lead 7439921 0.12 0.08 0.12 0.06 ND ND NDMercury 7439976 ND ND ND 0.003 ND ND NDSelenium 7782492 ND ND ND ND ND ND NDSilver 7440224 ND ND ND ND ND ND ND
General Chemistry - Methods 300.0, 335.2, 335.1, 7195/6010A mg/kgChloride 16887006 542 3,950 451 430 566 8,120 4,790Fluoride 16984488 49.5 804 782 3,090 4,240 ND 161Hex. Chromium 18540299 ND ND 5 8 11 75 77Total Cyanide 57125 ND ND 1.1 2.4 579 ND 102Amen. Cyanide E-10275 **13.3 **89.7 **8.4 **7 **809 ND **156Percent Solids 60.1 30.1 27.3 27.8 20.9 28 28.5Notes: ND - not detected *All results reported on a dry-weight basis. **Reported value is the concentration of cyanide after chlorination. Since this value is greater than
the total cyanide result, a value for the cyanide amenable to chlorination cannot be calculated.

September 1998 78 F006 Benchmarking Study
Table 19 (con’t): Detailed Analytical Data for the Phoenix FacilitiesConstituent CAS No. P6-01 P6-02 P8-01 P9-01 P9-02 P11-01 P13-01 P13-02
Total Metals - Methods 6010A, 7471A, 7060A, 7421, 7740 mg/kg Aluminum 7429905 511 233 60,800 4,110 59 819 1,370 2,860Antimony 7440360 221 153 ND 44 ND ND 34,800 1,250Arsenic 7440382 8,780 5,600 3 26 9 ND ND 10Beryllium 7440417 ND ND ND ND ND ND ND NDBarium 7440393 67 11 125 40 9 17 253 198Bismuth 7440699 ND ND ND 21 ND ND 398 32Cadmium 7440439 3 ND ND ND ND ND ND 3Calcium 7440702 1,440 1,980 9,710 6,880 682 11,400 2,690 143,000Chromium 7440473 10,000 7,820 248 100 34 119 29 170Copper 7440508 552,000 463,000 124,000 48,700 631,000 125,000 3,660 6,430Iron 7439896 6,650 2,670 50,900 204,000 364 75,800 3,500 17,100Lead 7439921 19,800 14,800 3,610 1,660 ND 6,080 175,000 13,000Magnesium 7439954 1,320 1,590 6,620 10,700 230 72,600 187 2,640Manganese 7439965 72 24 496 191 104 2,080 13 92Mercury 7439976 ND ND 0.3 ND ND ND 0.5 0.4Nickel 7440020 99 51 2,900 1,990 10,800 1,030 2,420 71,900Selenium 7782492 ND ND ND ND ND ND ND NDSilver 7440224 3 ND 835 38 12 14 113 40Sodium 7440235 60 25 2,050 36,900 41,600 13,400 310 5,660Tin 7440315 3,570 3,850 14,700 37,200 402 131,000 467,000 15,300Zinc 7440666 31,600 24,600 782 389 2,750 820 672 357
TCLP Metals - Methods 1311, 6010A, 7470A mg/L Arsenic 7440382 ND ND ND ND ND ND ND NDBarium 7440393 ND ND 1.5 ND ND ND ND NDCadmium 7440439 0.02 0.03 ND ND ND ND 0.1 NDChromium 7440473 ND ND 0.02 ND ND ND ND NDLead 7439921 35.4 39.8 0.64 ND 0.08 0.13 1,630 1.26Mercury 7439976 ND ND ND ND ND ND ND NDSelenium 7782492 ND ND ND ND ND ND ND NDSilver 7440224 ND ND ND ND ND ND ND ND
General Chemistry - Methods 300.0, 335.2, 335.1, 7195/6010A mg/kgChloride 16887006 1,630 1,490 590 2,250 24,000 4,110 64 905Fluoride 16984488 ND ND 100 3,090 ND ND ND NDHex. Chromium 18540299 548 466 ND ND 31 ND ND NDTotal Cyanide 57125 169 127 ND 9.1 ND ND ND NDAmen. Cyanide E-10275 **359 **369 **3.9 **75.1 **20.8 **16.6 **14.7 **39.4Percent Solids 27.5 29.3 34.4 34.9 27.2 45.2 94.1 41.1 Notes: ND - not detected *All results reported on a dry-weight basis.
**Reported value is the concentration of cyanide after chlorination. Since this value is greater than the totalcyanide result, a value for the cyanide amenable to chlorination cannot be calculated.

September 1998 79 F006 Benchmarking Study
4. Detailed Results of the National Benchmarking Study
Tables 20- 32 present detailed results of the National Benchmarking Study. The data gathered is similarin type but is often less detailed than the data gathered in the Regional Benchmarking Study. Data categoriesinclude: metal finishing operations, pollution prevention practices, F006 characteristics and sludge managementpractices from a broad range of metal finishers (Appendix G contains the survey instrument). The survey wasdistributed by mail to member companies of NAMF and AESF, and at a metal finishers national technicalconference (SURFIN 97). In all, nearly 2,000 surveys were distributed. One hundred eighty-six (186) responseswere received and compiled into a computer data base. A variety of firms responded. The number of employeesof respondents ranged from 4 to 7,250 with an average of 229. The survey question number is indicated in thesummaries below in [brackets].
a. Characterization of the Survey Respondents
Average number of employees responding: 229Maximum number of employees responding: 7,250Minimum number of employees responding: 4
A total of 186 surveys were received.
Number of respondents to this question: 171 / 186 = 92 %
b. Product and Waste Stream Characterization [C1]
Respondents reported product weight using different units:Average of the responses reported in cubic yards : 60,867 tonsAverage of the responses reported in barrel loads: 150,000 barrel loads
Number of responses to this question: 88 / 186 = 47%
c. Total quantity of F006 waste generated in 1996 [C4]
Average of reponses reported in tons: 1016 tons
Number of responses to this question: 161 / 186 = 87%
d. F006 segregation [C2]
Facilities reporting that F006 wastes are combined in the wastewater: 139Facilities reporting that F006 wastes are process-specific: 22
Number of responses to this question: 161 / 186 = 87%
e. Cyanide sludge segregation [C3]
Facilities reporting that cyanide-bearing F006 sludges are segregated: 33Facilities reporting that cyanide-bearing F006 sludges are not segregated: 151
Number of responses to this question: 184 / 186 = 99%
f. Quantity of F006 waste generated by process [C5]
Respondents reported generating an average 1,016 tons of F006 sludge annually. As noted in the statisticalanalysis section, larger companies tended to respond more than smaller companies. A summary of F006 sludgegenerated by groups of plating processes is provided in Table 20. Table 21 presents the estimates of process-

September 1998 80 F006 Benchmarking Study
specific F006 waste generation for 1996. The quantities assume that all units are equivalent (e.g., cubic yards anddry tons).
Table 20: Summary of F006 Sludge Generation by Plating CategoryPlating Category Quantity (dry tons)
Mixed Acids 118750.47
Anodizing 19.05
Bright Dip of Copper/alloy 74.82
Cadmium 6373.50
All Chrome 55467.93
Cleaner 122.65
All Copper 7419.35
All Cyanide 8328.32
All Electroless Nickel 14.88
All Ion Exchange 14.42
All Nickel 23019.36
Silver Plate 75.65
Stainless Electropolish 68.63
Tin 51.45
All Zinc 15938.36
Table 21. Process-Specific F006 Waste Generation for 1996Facility Process Quantity Measure
027 Not available 1.00 Cubic Yards064 Not available 30.30 Dry Tons022 Not available Dry Tons016 Not available 0.56 Dry Tons016 Not available 0.14 Dry Tons078 ABS/Steel Chromium plating 78.47 Dry Tons123 acid 80.00 Cubic Yards037 acid batch treat 0.13 Dry Tons090 acid copper 6.04 Dry Tons037 acid rinses 26.50 Dry Tons083 acid-alkali wastewater 118388.00 Dry Tons145 acid-chloride zinc 90.00 Dry Tons075 acid/alkaline 141.84 Long Tons023 acid/alkaline rinses 17.97 Metric Tons001 alum treating 8.00 Dry Tons036 anodizing 0.50 Cubic Yards148 anodizing 1.00 Cubic Yards146 anodizing 7.50 Dry Tons144 sulfuric acid anodizing 0.05 Dry Tons174 Sulfuric Anodize/Hardcoat 2.00 Dry Tons144 bright dip of copper/alloys 6.00 Dry Tons035 black oxide 25.00 Cubic Yards112 brass plating 0.50 Dry Tons

Table 21. Process-Specific F006 Waste Generation for 1996Facility Process Quantity Measure
September 1998 81 F006 Benchmarking Study
138 brass waste treatment 40.60 Dry Tons057 bright dip of copper/alloy 0.13 Dry Tons156 bright dip of copper/alloy 2.60 Dry Tons155 bronze line cleaner side overflowing rinse 10.00 Dry Tons027 cadmium 1.00 Cubic Yards026 barrel cadmium 3126.00 Dry Tons173 cadmium 1.00 Dry Tons066 cadmium 26.00 Cubic Yards057 cadmium plating 0.50 Dry Tons120 cadmium plating 14.00 Dry Tons114 cadmium and other processes 14.00 Dry Tons133 cyanide cadmium plating 55.00 Cubic Feet026 rack cadmium 3126.00 Dry Tons119 chelate 20.00 Dry Tons048 chromating 3.22 Dry Tons119 chrome 15.00 Dry Tons096 chrome 8.10 Dry Tons075 chrome 54.75 Long Tons065 chrome anodize 1.50 Dry Tons080 chrome hydroxide 55.70 Dry Tons183 chrome plate 10245.00 Dry Tons038 chrome plating 1.00 Dry Tons051 chrome plating 10.92 Dry Tons059 chrome plating and chromating 61.00 Cubic Yards082 chrome plating and chromating 43.75 Dry Tons023 chrome rinses 5.39 Metric Tons134 chrome rinses 46.50 Dry Tons085 chrome/nickel 155.50 Dry Tons054 chromic anodize 16.00 Dry Tons174 chromic anodize 0.25 Dry Tons090 chromium 9.98 Dry Tons058 chromium 0.99 Dry Tons083 chromium contaminated wastewater 35687.00 Dry Tons049 hard chrome 7508.00 Dry Tons046 hard chrome 7.38 Dry Tons034 hard chrome 7.00 Dry Tons039 hard chrome plating 1500.00 Cubic Feet174 Conversion Coating 0.25 Dry Tons148 conversion coatings 2.00 Cubic Yards156 Chromate conversion on aluminum 1.75 Dry Tons116 cleaner tank bottoms 0.15 Dry Tons141 cleaning 5.00 Dry Tons104 cleaning (soap and acid); aluminum cleaning 10.00 Dry Tons004 cleaning rinses 93.50 Dry Tons185 batch treats(cleaners & Microetch) 14.00 Dry Tons

Table 21. Process-Specific F006 Waste Generation for 1996Facility Process Quantity Measure
September 1998 82 F006 Benchmarking Study
110 copper nickel plating 75.00 Dry Tons042 copper 5.51 Dry Tons021 copper & brass 2.60 Dry Tons112 copper nickel chrome plating on non ferrous 40.00 Dry Tons112 copper nickel chrome plating on steel 0.50 Dry Tons183 copper plate 657.00 Dry Tons061 copper plate 40.00 Dry Tons036 copper plate 0.50 Cubic Yards057 copper plating 0.13 Dry Tons082 copper plating 27.50 Dry Tons136 copper, nickel, chromium on steel 23.00 Dry Tons145 copper-nickel-chrome 9.00 Dry Tons053 copper/ni/chrome on ABS 140.00 Dry Tons027 copper/nickel/chrome 2.00 Cubic Yards016 copper/nickel/chrome 6.30 Dry Tons049 copper/nickel/chrome 6000.00 Dry Tons170 copper/nickel/chrome decorative plating 42.00 Cubic Yards157 copper/nickel/chrome plating on plastic 300.00 Dry Tons014 Cu, Ni, Cr 23.50 Dry Tons137 Cu/Ni/Cr on non-ferrous 5.55 Dry Tons090 cyanide copper 4.03 Dry Tons147 cyanide copper plating on zinc die cast 0.24 Dry Tons086 cyanide copper/cyanide brass 15.00 Cubic Yards083 cyanide contaminated wastewater 7930.00 Dry Tons123 cyanide 200.00 Cubic Yards119 cyanide 7.50 Dry Tons075 cyanide 52.26 Long Tons010 cyanide bearing rinse waters 1.37 Dry Tons031 Cyanide destruction 3.70 Dry Tons085 cyanide processes 93.30 Dry Tons023 cyanide rinses 8.99 Metric Tons134 cyanide rinses 11.00 Dry Tons037 cyanide rinses 3.45 Dry Tons029 misc cyanide wastes 16.75 Dry Tons055 electroless nickel 1.10 Dry Tons048 electroless nickel and gold plating 12.88 Dry Tons038 electroless nickel plating 0.90 Dry Tons140 hot dip galv 21.00 Dry Tons117 ion exchange 10.14 Dry Tons050 ion exchange regen 4.28 Dry Tons038 iron plating 1.75 Dry Tons041 lead plating 14.85 Cubic Yards019 Mn & zinc phosphate 7.00 Dry Tons137 Ni/Cr on steel 9.25 Dry Tons096 nickel 0.90 Dry Tons

Table 21. Process-Specific F006 Waste Generation for 1996Facility Process Quantity Measure
September 1998 83 F006 Benchmarking Study
042 nickel 63.31 Dry Tons035 nickel 10.00 Cubic Yards021 nickel 2.00 Dry Tons173 nickel 2.00 Dry Tons050 nickel 6.42 Dry Tons090 nickel 8.42 Dry Tons010 nickel bearing-acid/alkali rinses 3.00 Dry Tons036 nickel plate 3.00 Cubic Yards183 nickel plate(incl. Electroless Nickel) 684.00 Dry Tons004 nickel plating 25.00 Dry Tons038 nickel plating 0.40 Dry Tons033 nickel plating 3.00 Dry Tons082 nickel plating 37.50 Dry Tons059 nickel plating 60.00 Cubic Yards146 nickel plating 0.50 Dry Tons047 nickel plating 3.00 Dry Tons065 nickel plating 1.00 Dry Tons175 nickel plating 21.00 Dry Tons051 nickel plating 10.49 Dry Tons012 nickel plating (all types) 30.25 Dry Tons147 nickel plating on zinc die cast 0.21 Dry Tons029 nickel plating treatment 11.92 Dry Tons132 nickel, silver, chrome, tin, and E-coat 1.00 Dry Tons054 nickel/chrome 10.00 Dry Tons026 automatic nickel/chrome 18756.00 Dry Tons173 nickel/chrome 0.50 Dry Tons100 nickel/chrome plating 1.00 Dry Tons105 nickel/chrome plating 23.69 Dry Tons073 nickel/chromium plating 7.05 Dry Tons080 nickel/copper hyd. 51.80 Dry Tons071 nickel chromium plating 55.00 Dry Tons026 barrel nickel 3126.00 Dry Tons146 passivation 2.00 Dry Tons066 phosphate 100.00 Cubic Yards183 Silver Plate 71.00 Dry Tons111 silver plating operations 2.65 Long Tons148 silver, tin, electroless nickel 2.00 Cubic Yards105 stainless electropolish 3.38 Dry Tons144 stainless steel passivation 0.25 Dry Tons180 Steel 65.00 Dry Tons141 stripping 5.00 Dry Tons021 tin 0.30 Dry Tons019 tin plating 1.00 Dry Tons004 tin plating 50.00 Dry Tons041 tin/lead plating 0.15 Cubic Yards

Table 21. Process-Specific F006 Waste Generation for 1996Facility Process Quantity Measure
September 1998 84 F006 Benchmarking Study
071 titanium 5.00 Dry Tons014 zinc 20.00 Dry Tons084 zinc 15.00 Dry Tons072 zinc 224.00 Dry Tons071 zinc 20.00 Dry Tons066 zinc 126.00 Cubic Yards027 zinc 1.00 Cubic Yards021 zinc 76.50 Dry Tons180 zinc 5.00 Dry Tons042 zinc 206.44 Dry Tons148 zinc and cadmium plating 15.00 Cubic Yards095 zinc cyanide 1.00 Dry Tons104 zinc cyanide plating and chromate conversion 30.00 Dry Tons094 zinc electroplating 300.00 Cubic Yards125 zinc electroplating, zinc nickel alloy electropl. 575.00 Cubic Yards109 zinc electrotherapy on steel 148.00 Dry Tons080 zinc hydroxide 57.30 Dry Tons137 zinc on steel 18.50 Dry Tons136 zinc on steel 19.50 Dry Tons144 zinc phosphate 0.05 Dry Tons061 zinc plate 70.00 Dry Tons008 zinc plating 5507.20 Dry Tons140 zinc plating 175.00 Dry Tons003 zinc plating 5507.20 Dry Tons065 zinc plating 25.00 Dry Tons001 zinc plating 5.00 Dry Tons132 zinc plating 19.00 Dry Tons082 zinc plating 16.25 Dry Tons004 zinc plating 150.00 Dry Tons045 zinc plating 1040.00 Cubic Yards070 zinc plating 80.00 Cubic Yards105 zinc plating 40.62 Dry Tons059 zinc plating 235.00 Cubic Yards019 zinc plating 300.00 Dry Tons048 zinc plating 144.90 Dry Tons100 zinc plating 11.40 Dry Tons035 zinc plating 200.00 Cubic Yards012 zinc plating (all types) 60.50 Dry Tons088 zinc plating on steel 155.00 Dry Tons120 zinc plating on steel 140.00 Dry Tons156 zinc plating on steel 83.00 Dry Tons145 zinc-phosphate 1.00 Dry Tons098 ZnNi alloy plating & chromating of Zn & ZnNi 7.00 Dry Tons102 chloride zinc on steel 23.00 Cubic Yards118 all zinc plating 84.00 Cubic Yards

September 1998 85 F006 Benchmarking Study
g. On-site recycling techniques prior to discharge [C6]
Number of responses to this question: 36/186 = 19%
On-site recycling techniques that were mentioned by more than one company:• Electrowinning• Counter flow rinsing• Drag out rinses returned to plating tank• Electrodialysis• Evaporation• Precipitation
Metals that are recovered: brass, cadmium, chrome, copper, nickel, gold, silver.
Table 22 contains individual responses.
Table 22. On-Site Recycling TechniquesFacility Description Quantity Measure
023 BEWT Chemelec Unit, Reverse Cn Stip, Jaynor Units 1.70 Dry Tons
018 brass 0.10 Dry Tons
018 cadmium 0.10 Dry Tons
075 cadmium electrowinning 0.25 Dry Tons
001 chrome recovery 2.00 Dry Tons
110 chromic acid through demineralizes 50.00 Dry Tons
018 copper 0.15 Dry Tons
160 copper grinding swarf 2.50 Dry Tons
157 Corning Evaporators for Chrome Drag-out 75.00 Dry Tons
038 counter flow rinsing chrome plate 1.00 Dry Tons
038 counter flow rinsing nickel plating 0.75 Dry Tons
141 drag out rinses 1.00 Dry Tons
095 drag out tanks used for tank replenishment 1.00 Cubic Yards
098 drag out from plating tanks returned to bath 6.50 Dry Tons
106 electrodialysis of rinsewater 0.25 Dry Tons
124 electroless nickel directly reduced 0.05 Dry Tons
168 electrowinning of gold solutions 500.00 Dry Tons
168 electrowinning of silver solutions 3000.00 Dry Tons
168 electrowinning of solder and tin solutions 1.00 Dry Tons
010 electrowinning-plating cells 0.06 Dry Tons
116 evaporating recovery 0.20 Dry Tons
180 evaporators 30.00 Dry Tons
180 ion exchangers 10.00 Dry Tons
138 metal recovery systems 3.50 Dry Tons
075 nickel evaporation 0.75 Dry Tons
055 nickel plate out from electroless nickel solution 0.05 Dry Tons
157 nickel precipitation as carbonate 35.00 Dry Tons
008 precipitation, filtration, & drying 5507.20 Dry Tons
160 re-sell copper turnings 7.50 Dry Tons
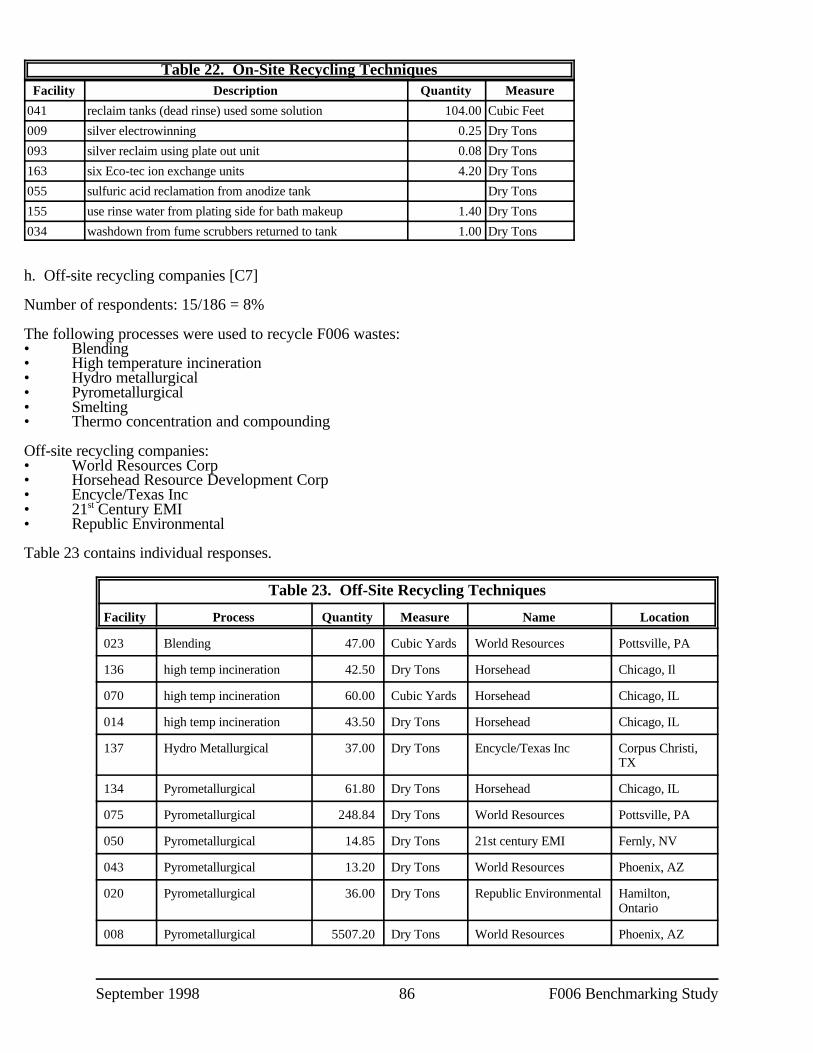
Table 22. On-Site Recycling TechniquesFacility Description Quantity Measure
September 1998 86 F006 Benchmarking Study
041 reclaim tanks (dead rinse) used some solution 104.00 Cubic Feet
009 silver electrowinning 0.25 Dry Tons
093 silver reclaim using plate out unit 0.08 Dry Tons
163 six Eco-tec ion exchange units 4.20 Dry Tons
055 sulfuric acid reclamation from anodize tank Dry Tons
155 use rinse water from plating side for bath makeup 1.40 Dry Tons
034 washdown from fume scrubbers returned to tank 1.00 Dry Tons
h. Off-site recycling companies [C7]
Number of respondents: 15/186 = 8%
The following processes were used to recycle F006 wastes:• Blending• High temperature incineration• Hydro metallurgical• Pyrometallurgical• Smelting• Thermo concentration and compounding
Off-site recycling companies:• World Resources Corp• Horsehead Resource Development Corp• Encycle/Texas Inc• 21 Century EMIst
• Republic Environmental
Table 23 contains individual responses.
Table 23. Off-Site Recycling Techniques
Facility Process Quantity Measure Name Location
023 Blending 47.00 Cubic Yards World Resources Pottsville, PA
136 high temp incineration 42.50 Dry Tons Horsehead Chicago, Il
070 high temp incineration 60.00 Cubic Yards Horsehead Chicago, IL
014 high temp incineration 43.50 Dry Tons Horsehead Chicago, IL
137 Hydro Metallurgical 37.00 Dry Tons Encycle/Texas Inc Corpus Christi,TX
134 Pyrometallurgical 61.80 Dry Tons Horsehead Chicago, IL
075 Pyrometallurgical 248.84 Dry Tons World Resources Pottsville, PA
050 Pyrometallurgical 14.85 Dry Tons 21st century EMI Fernly, NV
043 Pyrometallurgical 13.20 Dry Tons World Resources Phoenix, AZ
020 Pyrometallurgical 36.00 Dry Tons Republic Environmental Hamilton,Ontario
008 Pyrometallurgical 5507.20 Dry Tons World Resources Phoenix, AZ

Table 23. Off-Site Recycling Techniques
Facility Process Quantity Measure Name Location
September 1998 87 F006 Benchmarking Study
003 Pyrometallurgica 22.00 Long Tons World Resources Pheonix, AZ
051 smelting 22.40 Dry Tons World Resources Phoenix, AZ
031 thermo concentration and 18.53 Dry Tons World Resources Phoenix, AZcompounding
024 thermo concentration and 55.00 Dry Tons World Resources Phoenix, AZcompounding
i. Management methods for F006 wastes [C8]
Number of responses: 57
Management methods:• Incineration• Neutralization• Recycling• Solidification• Stabilization, landfilling• Subtitle C landfill
Receiving facilities:• Envirite • Chemical Waste Management• Wayandot Landfill • Peoria Disposal• LWD • LESI• Cynochem • USPCI• Envotech • Cycle Chem• Stablex Canada • Northland Environment• Heritage Environmental • Phillips Environmental• Threamionic • Chief Supply• Romic Environmental
Table 24 contains individual responses.
Table 24. Waste Management Methods F006 Wastes
Mgt Facility Quantity Measure Name Location
delisted facility 002 26.00 Cubic Yards Envirite Thomaston, CT
delisted facility 170 42.00 Cubic Yards Wayandot Landfill Carey, OH 43316
delisted facility 115 24.00 Cubic Yards Envirite Canton, OH
delisted facility 125 575.00 Cubic Yards Envirite of Illinois Harvey, IL
delisted facility 052 320.20 Dry Tons Envirite Corporation Canton, OH
delisted facility 066 100.00 Dry Tons Envirite
incineration 029 16.75 Dry Tons LWD Calventy City, KY
incineration 133 55.00 Cubic Feet Cynochem Detroit, MI
neutralization 152 4850.00 gal Cyanokem Detroit, MI
recycle 063 274.50 Dry Tons
recycle 179 35.01 Dry Tons World Resource Co. Pheonix, AZ
Solidification 100 11.50 Dry Tons Envirite Corp. Canton, OH
Solidification 108 28.00 Dry Tons Envotech (EQ) Belleville, MI
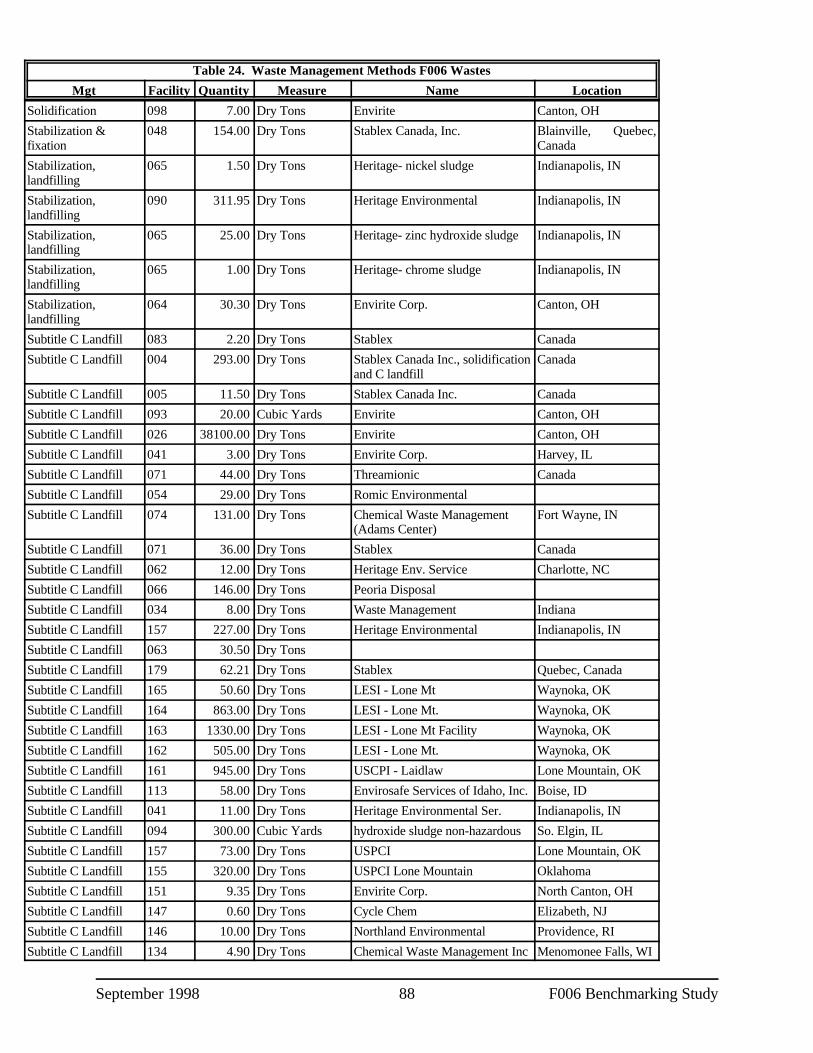
Table 24. Waste Management Methods F006 Wastes
Mgt Facility Quantity Measure Name Location
September 1998 88 F006 Benchmarking Study
Solidification 098 7.00 Dry Tons Envirite Canton, OH
Stabilization & 048 154.00 Dry Tons Stablex Canada, Inc. Blainville, Quebec,fixation Canada
Stabilization, 065 1.50 Dry Tons Heritage- nickel sludge Indianapolis, INlandfilling
Stabilization, 090 311.95 Dry Tons Heritage Environmental Indianapolis, INlandfilling
Stabilization, 065 25.00 Dry Tons Heritage- zinc hydroxide sludge Indianapolis, INlandfilling
Stabilization, 065 1.00 Dry Tons Heritage- chrome sludge Indianapolis, INlandfilling
Stabilization, 064 30.30 Dry Tons Envirite Corp. Canton, OHlandfilling
Subtitle C Landfill 083 2.20 Dry Tons Stablex Canada
Subtitle C Landfill 004 293.00 Dry Tons Stablex Canada Inc., solidification Canadaand C landfill
Subtitle C Landfill 005 11.50 Dry Tons Stablex Canada Inc. Canada
Subtitle C Landfill 093 20.00 Cubic Yards Envirite Canton, OH
Subtitle C Landfill 026 38100.00 Dry Tons Envirite Canton, OH
Subtitle C Landfill 041 3.00 Dry Tons Envirite Corp. Harvey, IL
Subtitle C Landfill 071 44.00 Dry Tons Threamionic Canada
Subtitle C Landfill 054 29.00 Dry Tons Romic Environmental
Subtitle C Landfill 074 131.00 Dry Tons Chemical Waste Management Fort Wayne, IN(Adams Center)
Subtitle C Landfill 071 36.00 Dry Tons Stablex Canada
Subtitle C Landfill 062 12.00 Dry Tons Heritage Env. Service Charlotte, NC
Subtitle C Landfill 066 146.00 Dry Tons Peoria Disposal
Subtitle C Landfill 034 8.00 Dry Tons Waste Management Indiana
Subtitle C Landfill 157 227.00 Dry Tons Heritage Environmental Indianapolis, IN
Subtitle C Landfill 063 30.50 Dry Tons
Subtitle C Landfill 179 62.21 Dry Tons Stablex Quebec, Canada
Subtitle C Landfill 165 50.60 Dry Tons LESI - Lone Mt Waynoka, OK
Subtitle C Landfill 164 863.00 Dry Tons LESI - Lone Mt. Waynoka, OK
Subtitle C Landfill 163 1330.00 Dry Tons LESI - Lone Mt Facility Waynoka, OK
Subtitle C Landfill 162 505.00 Dry Tons LESI - Lone Mt. Waynoka, OK
Subtitle C Landfill 161 945.00 Dry Tons USCPI - Laidlaw Lone Mountain, OK
Subtitle C Landfill 113 58.00 Dry Tons Envirosafe Services of Idaho, Inc. Boise, ID
Subtitle C Landfill 041 11.00 Dry Tons Heritage Environmental Ser. Indianapolis, IN
Subtitle C Landfill 094 300.00 Cubic Yards hydroxide sludge non-hazardous So. Elgin, IL
Subtitle C Landfill 157 73.00 Dry Tons USPCI Lone Mountain, OK
Subtitle C Landfill 155 320.00 Dry Tons USPCI Lone Mountain Oklahoma
Subtitle C Landfill 151 9.35 Dry Tons Envirite Corp. North Canton, OH
Subtitle C Landfill 147 0.60 Dry Tons Cycle Chem Elizabeth, NJ
Subtitle C Landfill 146 10.00 Dry Tons Northland Environmental Providence, RI
Subtitle C Landfill 134 4.90 Dry Tons Chemical Waste Management Inc Menomonee Falls, WI
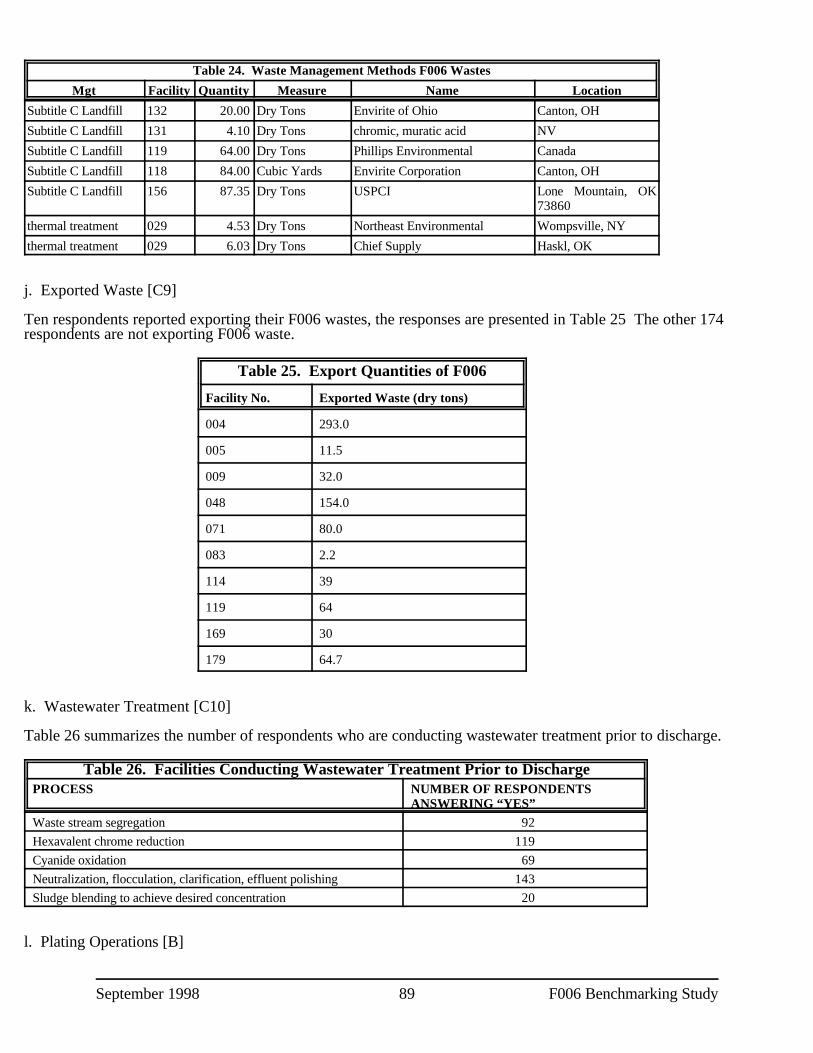
Table 24. Waste Management Methods F006 Wastes
Mgt Facility Quantity Measure Name Location
September 1998 89 F006 Benchmarking Study
Subtitle C Landfill 132 20.00 Dry Tons Envirite of Ohio Canton, OH
Subtitle C Landfill 131 4.10 Dry Tons chromic, muratic acid NV
Subtitle C Landfill 119 64.00 Dry Tons Phillips Environmental Canada
Subtitle C Landfill 118 84.00 Cubic Yards Envirite Corporation Canton, OH
Subtitle C Landfill 156 87.35 Dry Tons USPCI Lone Mountain, OK73860
thermal treatment 029 4.53 Dry Tons Northeast Environmental Wompsville, NY
thermal treatment 029 6.03 Dry Tons Chief Supply Haskl, OK
j. Exported Waste [C9]
Ten respondents reported exporting their F006 wastes, the responses are presented in Table 25 The other 174respondents are not exporting F006 waste.
Table 25. Export Quantities of F006
Facility No. Exported Waste (dry tons)
004 293.0
005 11.5
009 32.0
048 154.0
071 80.0
083 2.2
114 39
119 64
169 30
179 64.7
k. Wastewater Treatment [C10]
Table 26 summarizes the number of respondents who are conducting wastewater treatment prior to discharge.
Table 26. Facilities Conducting Wastewater Treatment Prior to DischargePROCESS NUMBER OF RESPONDENTS
ANSWERING “YES”Waste stream segregation 92
Hexavalent chrome reduction 119
Cyanide oxidation 69
Neutralization, flocculation, clarification, effluent polishing 143
Sludge blending to achieve desired concentration 20
l. Plating Operations [B]

September 1998 90 F006 Benchmarking Study
Table 27 summarizes responses to question B, “what type of plating operations are conducted by your facility?”.
Table 27. Types of Plating Conducted by RespondentsPROCESS NUMBER OF NUMBER OF
RESPONDENTS RESPONDENTSANSWERING “YES” ANSWERING “NO”
Zinc plating on steel 92 92
Zinc plating on steel - cyanide 23 161
Zinc plating on steel – non-cyanide 57 127
Nickel chromium 82 102
Copper/nickel/chrome 62 122
Copper plating/stripping 7 177
Hard chromium 36 148
Copper plating 85 99
Tin 57 127
Cadmium 45 139
Sulfuric acid 45 139
Silver 56 128
Gold 48 136
Bright dip 56 128
Other 95 89
m. Pollution Prevention Waste Minimization Activities [E]
The respondents were asked to complete a checklist of 59 individual waste minimization techniques broken intothree main categories (i.e., reduce drag out losses, reduce rinse water, and various operating practices). Table 28presents the total number of positive responses for each of 59 waste minimization technique broken into threemain categories (i.e. reduce drag out losses, reduce rinse water, and various operating practices). Three groupsof facilities were identified: small, medium, and large. Each group contained an equal number of facilities (i.e.,61) to enable a comparison of techniques by facility size. Based on the analysis, it appears as though facility sizeis not a deciding factor in determining the number or type of waste minimization techniques implemented. Thismay be because the techniques included in the survey are relatively low cost and easy to implement. Largerfacilities may be able to afford more sophisticated waste minimization improvements (e.g., process changes) thatwere not included in the survey. Table 29 identifies pollution prevention measures by technique.
Table 28: Summary of Techniques Used by Facility Size*
Technique (<30 employees) (> 31 and < 65 employees) (> 65 employees)Small Facilities Medium Facilities Large Facilities
Reduce drag-out losses Total 182 175 232
Allow rack/part to drip over plating tank 33 27 38
Using drag-out rinse tanks and returning 27 30 33chemicals to the process bath
Drip shields between tanks 18 22 29
Reduce rinse water use Total 151 166 285
Flow restrictors 26 39 58
Countercurrent rinses 30 38 61
Manually turn-off rinse waters 22 28 47
Air agitation in rinse tanks 22 22 37
Various operating practices 586 659 781TotalTraining and programs subtotal 120 114 152

Table 28: Summary of Techniques Used by Facility Size*
Technique (<30 employees) (> 31 and < 65 employees) (> 65 employees)Small Facilities Medium Facilities Large Facilities
September 1998 91 F006 Benchmarking Study
Conduct employee education 21 22 30
Establish preventive maintenance program 15 22 28
Use specifically assigned personnel 27 35 40
Procedures subtotal 200 213 271
Perform routine bath analysis 34 33 41
Maintain bath analysis logs 33 33 39
Use process baths to maximum 29 30 31
Have written procedures 25 28 37
F006 volume reduction subtotal 58 88 86
Sludge dewatering 28 47 50
Closed loop recycling 16 15 10
Use control method 6 14 10
Inspections / maintenance subtotal 60 66 73
Perform regular maintenance of 26 24 29racks/barrels
Pre-inspect parts 22 23 24
Research / evaluations subtotal 60 73 91
Evaluation of recycling alternatives 16 21 27
Increase drain time 19 20 22
Research of alternative plating technologies 13 18 21
Elimination / Replacement / Substitutions 88 105 108subtotal
Eliminate obsolete processes 20 19 22
Replace cyanide based plating 14 21 23
Eliminate plating service 16 17 1* number of positive responses by facility
Table 9.0 summarizes the results of the responses to each of the 59 individual techniques.

September 1998 92 F006 Benchmarking Study
Table 29. Pollution Prevention Benefits by TechniqueTechnique Number of Number of Number of P2 BENEFIT
“Yes” “No” Manual Vs.Responses Responses Automatic 1 = low success, 5 = high success
Responses1 2 3 4 5
Reduce Drag-out LossesUsing drag-out rinse tanks and 87 94 Manual: 57 3 4 17 20 27returning chemicals to the process Automatic: 22bathUsing drip tanks and returning 36 145 Manual: 27 3 0 10 8 6chemicals to the process bath Automatic: 6Reducing speed of rack/part 63 118 Manual: 43 5 9 20 11 6withdrawal Automatic: 20Allowing rack/part to drip over 96 85 Manual: 63 3 10 33 19 15plating tank Automatic: 33Using a drag-in/drag-out 40 141 Manual: 26 3 2 8 6 10arrangement (i.e., use of same Automatic: 14rinse tank before and after platingalso referred to as a double-dip ordouble-use rinse)Fog or spray rinses installed over 36 145 Manual: 21 1 2 6 9 7process bath Automatic: 12Air knives that blow off drag-out 16 165 Manual: 1 1 1 3 7 3
Automatic: 15Drip shields between tanks 66 115 Manual: 34 3 5 18 15 16
Automatic: 52Lower bath concentration 35 146 Not applicable 2 5 14 6 4Increasing solution temperature 13 168 Not applicable 4 0 4 4 0(reduces viscosity)Using a wetting agent (reduces 48 133 Not applicable 5 1 18 13 4viscosity)Positioning work piece to minimize 65 116 Not applicable 2 2 17 13 20solution holdupOther, specify 4 3 Not applicable 0 0 0 1 2Reduce Rinse Water Use Manually turning off rinse water 73 108 Not applicable 4 8 20 10 20when not in use

Table 29. Pollution Prevention Benefits by TechniqueTechnique Number of Number of Number of P2 BENEFIT
“Yes” “No” Manual Vs.Responses Responses Automatic 1 = low success, 5 = high success
Responses1 2 3 4 5
September 1998 93 F006 Benchmarking Study
Conductivity or pH rinse controls 22 159 Not applicable 1 2 8 4 3Timer rinse controls 24 157 Not applicable 1 4 3 8 5Flow restrictors 103 78 Not applicable 1 3 17 26 21Counter current rinses 113 68 Not applicable 0 3 13 26 33Spray rinses 59 122 Not applicable 2 4 9 15 11Air agitation in rinse tanks 73 86 Not applicable 1 3 20 17 20Use flow meters/accumulators to 23 136 Not applicable 1 0 8 3 5track water use at each rinse tankor plating lineReactive rinsing or cascade rinsing 22 136 Not applicable 1 1 2 5 9Other, specify 7 4 Not applicable 0 0 0 1 2Various Operating PracticesTraining and ProgramsEstablished a formal policy 60 99 Not applicable 11 6 11 12 11statement with regard to pollutionprevention and controlEstablished a formal pollution 64 95 Not applicable 7 6 23 6 12prevention programConduct employee education for 73 86 Not applicable 4 9 22 13 12pollution preventionEstablish a preventive maintenance 66 93 Not applicable 2 6 22 14 13program for tanksUse specifically assigned personnel 99 60 Not applicable 2 6 12 24 34for chemical additionsProceduresStricter conformance with Line 31 127 Not applicable 3 1 7 9 7Preventive Maintenance ScheduleStricter conformance with SPC 26 133 Not applicable 3 2 8 6 5ProceduresWaste stream segregation of 38 121 Not applicable 0 1 8 8 16contact and non contactwastewater

Table 29. Pollution Prevention Benefits by TechniqueTechnique Number of Number of Number of P2 BENEFIT
“Yes” “No” Manual Vs.Responses Responses Automatic 1 = low success, 5 = high success
Responses1 2 3 4 5
September 1998 94 F006 Benchmarking Study
Strict chemical inventory control 59 100 Not applicable 4 4 12 11 20Perform routine bath analyses 99 60 Not applicable 0 2 17 30 32Maintain bath analyses/addition 96 63 Not applicable 2 6 24 19 28logsHave written procedures for bath 83 76 Not applicable 3 4 19 22 22make-up and additionsUse process baths to maximum 83 76 Not applicable 0 3 13 24 26extent possible (no dump schedule)Remove anodes from bath when 36 123 Not applicable 2 1 9 6 11they are idle (e.g., cadmium, zinc)Regularly retrieve fallen 80 79 Not applicable 3 2 30 12 20parts/racks from tanksF006 Volume Reduction MethodsClosed-loop recycling 34 124 Not applicable 2 0 1 3 9Use control method for adding 29 130 Not applicable 1 2 6 5 8water to process tanksSludge dewatering (Vacuum filter, 113 46 Not applicable 0 0 10 17 37Solid bowl centrifuge, Imperforatebasket centrifuge, belt filter press,Recessed plate filter press, sludgedrying beds, sludge lagoons,sludge dryers, etc.)Install overflow alarms on process 19 140 Not applicable 3 0 6 3 5tanksInstall other spill/leak detection 15 144 Not applicable 3 0 1 3 5system, specifyInspections / MaintenancePerform regular maintenance of 73 86 Not applicable 3 8 24 20 7racks/barrelsPre-inspect parts to prevent 64 95 Not applicable 1 7 14 16 15processing of obvious rejectsWaste Reduction Study conducted 48 111 Not applicable 2 5 14 14 7Research / Evaluation

Table 29. Pollution Prevention Benefits by TechniqueTechnique Number of Number of Number of P2 BENEFIT
“Yes” “No” Manual Vs.Responses Responses Automatic 1 = low success, 5 = high success
Responses1 2 3 4 5
September 1998 95 F006 Benchmarking Study
Evaluation of recycling alternatives 59 100 Not applicable 4 7 16 13 8Increasing drain time over process 55 104 Not applicable 4 7 16 13 8tanksResearch of alternative plating 51 108 Not applicable 6 7 10 6 13technologiesDevelopment of tracking system 19 140 Not applicable 4 0 7 1 3for monitoring flow from differentareasMonitoring of incoming water with 26 133 Not applicable 3 0 4 6 4strict control programTwo separate labs for process 2 157 Not applicable 0 0 1 1 0chemistryElimination / Replacement /SubstitutionsEliminate obsolete processes 57 102 Not applicable 1 2 16 14 14and/or unused or infrequently usedprocessesReplace cyanide-based plating 56 103 Not applicable 3 2 6 7 24solution with alkaline-basedsolutionsElimination of rinse waters to 25 134 Not applicable 3 2 4 5 3waste treatment (nickel, chrome)Substitution of chromate and 2 157 Not applicable 0 0 2 0 0dichromate sealer with non-chromate sealerElimination of plating services 48 111 Not applicable 1 3 7 8 15(cadmium, tin, nickel, copper,brass, and hard chrome)Elimination of vapor degreasing 46 113 Not applicable 1 1 4 3 29 Implementation of a multi-stage 30 129 Not applicable 2 1 3 5 14cyanide destruct systemElimination of chelated cleaners 34 125 Not applicable 0 1 5 9 10Other, specify 5 6 Not applicable 0 0 0 3 3

Table 29. Pollution Prevention Benefits by TechniqueTechnique Number of Number of Number of P2 BENEFIT
“Yes” “No” Manual Vs.Responses Responses Automatic 1 = low success, 5 = high success
Responses1 2 3 4 5
September 1998 96 F006 Benchmarking Study
E - Additional 3 156 Not applicable n/a n/a n/a n/a n/a

September 1998 97 F006 Benchmarking Study
n. Waste Minimization Techniques by Generating Process
Table 30 summarizes the types of waste minimization techniques reported by facilities that conducted only onetype of plating. The four processes were selected for analysis because they are most representative of the platingindustry and the most problematic from a regulatory perspective. A handful of facilities only performed tinplating, bright dip, and sulfuric acid anodizing.
Table 30. Summary of Waste Minimization TechniquesTECHNIQUE NICKEL COPPER CHROME ZINC CADMIUM
Reduce drag-out losses 55 47 23 62 30
Reduce rinse water use 67 52 25 78 36
Training and programs subtotal 53 41 21 78 28
Procedures subtotal 52 43 20 55 26
F006 volume reduction subtotal 68 52 33 54 36
Inspections / maintenance subtotal 42 34 15 72 23
Research / evaluations subtotal 41 34 13 45 20
Elimination / Replacement / Substitutions 54 41 20 63 26
Various operating practices 310 245 122 159Total
o. Impact of Waste Minimization Projects on Wastewater Discharge Rates [E2]
Number of positive responses: 63Number of negative responses: 156
p. Recycle and Recovery Technologies [E3]
Table 31 summarizes the use of recycle and recovery technologies.
Table 31. Summary of Recycling and Recovery TechnologiesTECHNIQUE Number of Positive Responses Number of Negative ResponsesElectrodialysis 7 152
Electrowinning 26 133
Evaporator 39 120
Ion flotation 1 158
Ion exchange 28 131
Mesh pad mist eliminator/recycle 15 144
Reverse osmosis 8 151
Ultrafiltration 5 154
Other 11 2
q. Solution Maintenance Techniques [E4]
Table 32 summarizes the solution maintenance techniques.
Table 32. Summary of Solution Maintenance TechniquesTECHNIQUE # of Positive Responses # of Negative ResponsesAcid retardation 1 158Carbon treatment (batch) 46 113Carbon treatment (continuous) 40 119

Table 32. Summary of Solution Maintenance TechniquesTECHNIQUE # of Positive Responses # of Negative Responses
September 1998 98 F006 Benchmarking Study
Dummying of metal contaminants 56 103Electrodialysis for inorganic 56 155contaminantsCarbonate freezing 24 135Filtration, in-tank 53 106Filtration, external 51 108High pH treatment 16 143Precipitation 20 139Liquid/ Liquid extraction 2 157Microfiltration 1 158Ultrafiltration 1 158Other, specify 0 1

September 1998 99 F006 Benchmarking Study
Appendix A:Summary of the 10 Issue Areas Identified for the Metal Finishing Sector

September 1998 100 F006 Benchmarking Study
Issue 1. Operational Flexibility
Industry performance leaders would receive operational flexibility (i.e.,less burdensome permitting, monitoring, and reporting requirements) inrecognition of their good performance and as an incentive to seek theambitious performance goals.
Issue 2: Waste Minimization and Recovery
The first phase of this project was a bench marking analysis of F006 constituents, usingnational and regional sampling data. The data generated in the bench marking study willbe used by the RCRA Project Team to develop and assess options for reducing barriers topollution prevention and on-site and off-site metal recovery requirements.
Issue 3: Reporting and Right-to-Know
This project applies business process reengineering techniques to examine federal, state, andlocal reporting requirements for metal finishers across all environmental media.
Issue 4: Compliance Tools and Assistance
This project is designed to overcome barriers to improved compliance and pollutionprevention by combining pollution prevention assistance and enforcement relief policies asan incentive for improved environmental performance by metal finishers.
Issue 5: Research and Technology
The National Metal Finishing Environmental R&D Plan is a customer-oriented R&Dstrategy for risk characterization, exposure assessment, and technology transfer for metalfinishers, communities, and other stakeholders.
Issue 6: Industrial Pretreatment
The POTW Pretreatment Project is designed to identify ways to improve the capabilities ofPOTW manage their industrial users by reducing mass pollutant loadings without limitingindustry activity, and to provide the most effective POTW with increased managerialflexibility to achieve higher environmental quality at lower cost.
Issue 7: Environmentally Responsible Site Transition
This project develops a government sponsored “exit strategy” for metal finishers who wishto get out of the business that reduces future contaminated “orphan industrial sites.”
Issue 8: Enforcement for Chronic Non-Complier
This project develops a sector-based, targeted enforcement program for government at alllevel to identify chronic non-complier and take appropriate action against them.
Issue 9: Access to Capital
This project focuses on developing innovative approaches for improving access to capital formetal finishers and electronics firms.

September 1998 101 F006 Benchmarking Study
Appendix B:F006 Management Contained in EPA’s 1995 Biennial Report Database

September 1998 102 F006 Benchmarking Study
Waste Management Facilities: This appendix lists the names of hazardous waste landfill facilities contained inEPA’s 1995 Biennial Report that reported accepting and /or managing F006 waste. The table includes thequantities of F006 waste managed by each facility, the facility’s EPA ID, and the number of shipments the facilityreceived.
Table 1: F006 Waste Managed in Landfills
Number of RCRA large quantity generators (greater than 1000kg/month) who sent F006 waste off-site to a RCRA landfillin 1995 = 283
Volume of F006 generated on-site and shipped off-site to a landfill = 80,298.370 tons
Volume of F006 generated on-site and managed in a landfill on-site = 18,782.832 tons (2 facilities, not including TSDs)
Total volume generated and managed in landfills = 99,081.202 tons
Landfills that Accept/Manage F006 Waste, by State:
Number EPA ID Company Managed On-site On-site Rcvd Form
Qty "Generated" Qty Rcvd & # of& Managed Shpmts GM/WR
1 ALD000622464 Chemical Waste Management, Inc. 496.179 15 WR
2 CAD000633164 Laidlaw Environmental Services, Inc. 94.800 4 WR
3 CAT000646117 Chemical Waste Management, Inc. 260.000 GM
4 COD991300484 Highway 36 Land Development Co. 4,319.438 7 GM,WR
5 IDD073114654 Envirosafe Services of Idaho 138.955 20 WR
6 ILD000805812 Peoria Disposal Co. 5,208.628 GM
7 IND016584641 Midwest Steel Division 17,308.400 GM
8 IND078911146 Chemical Waste Management, Inc. 118.300 3,015.950 34 GM,WR
9 IND980503890 Heritage Environmental Services, Inc. 68,213.625 1 WR
10 KSD057889313 Ashland Chemical Co. 1.800 1 WR
11 LAD000777201 Chemical Waste Management, Inc. 44,939.950 45 WR
12 MID000724831 Michigan Disposal Waste Treatment 43,259.000 GM
13 MID048090633 Wayne Disposal Site #2 Landfill 45,070.380 9 WR
14 NJD002385730 E. I. DuPont de Nemours & Co. Inc. 10,030.000 GM
15 NYD049836679 CWM Chemical Services 60.170 4 WR
16 OHD045243706 Envirosafe Services of Ohio Inc. 236.490 13,558.665 54 GM,WR
17 OKD065438376 U.S. Pollution Control Inc. 3,403.746 17 WR
18 ORD089452353 Chemical Waste Management, Inc. 121.602 3,810,086.0 20 GM,WR
19 SCD070375985 Laidlaw Env. Svs. of SC Inc. 0.530 2,843.1 491 GM,WR
20 TND980847024 Excel TSD Inc. 1.310 GM
21 TXD069452340 Texas Ecologists, Inc. 1,800.2 3 WR
22 UTD982598898 Envirocare of Utah 4,431.8 7 WR
23 UTD991301748 USPCI Grassy Mountain Facility 6,859.9 7 WR
24 WAD041337130 Boeing - Auburn 115,193.0 2 WR
25 WAD041585464 Boeing Commercial Airplane Group WREverett
Totals 78,018.7 47,026.0 2
GM = Reported on Biennial Report GM form: identifies generators who manage F006 in an onsite landfill.
WR = Reported on WR form: identifies off-site facilities that receive and manage F006 in a landfill.

September 1998 103 F006 Benchmarking Study
Table 2 lists recycling facilities contained in EPA’s 1995 Biennial Report that reported accepting and/or managingF006 waste in 1995. The table includes the quantities of F006 waste managed by each facility, the facility’s EPAID, the number of shipments the facility received, recovery system used, and a system description.
Table 2: F006 Waste Managed by Metals Recovery
Number of generators who send F006 waste off-site to metals recovery = 824
Volume of F006 generated on-site and shipped off-site for metals recovery = 64,670.462 tons
Volume of F006 generated on-site and managed on-site by metals recovery = 217,292.304 tons (9 facilities)
Therefore, total volume of F006 generated and managed by metals recovery = 281,962.766 tons
Quantities and Number of Facilities/Streams that Shipped F006 Off-site for Metals Recovery
System System Description Qty Shipped Off-site # of Facilities # of Streams
M011 High temperature metals recovery 18,252.113 159 179
M012 Retorting 295.301 4 12
M013 Secondary smelting 11,958.071 74 89
M014 Other metals recovery for reuse (iron exchange, etc.) 16,707.303 278 320
M019 Metals recovery - type unknown 17,457.674 309 370
Totals 64,670.462 824 970

September 1998 104 F006 Benchmarking Study
Metals Recovery Facilities that Accept/Manage F006 Waste
Number EPA ID Company Managed On-site Managed On-site Shpmts Rcvd System Description Form
Qty Generated & Qty Rcvd & # of Recovery System GM/WR
1 CAD981695729 Pacific Circuit Services 74.000 M014 Other metals recovery for reuse GM
2 CAT000612150 Engelhard West, Inc. 25.314 M011 High temp. metals recovery GM
3 COD082657420 Schlage Lock Company 0.616 M014 Other metals recovery for reuse GM
4 ILD005087630 United Refining & Smelting Co. 87.186 2 M011 High temp. metals recovery WR
5 ILD984766279 Hydromet Environmental Inc. 138.880 3 M014 Other metals recovery for reuse WR
6 LAD058472721 Amax Metals Recovery Inc. 27.300 3 M014 Other metals recovery for reuse WR
7 MID047153077 Production Plated Plastics, Inc. 192,351.977 M014 Other metals recovery for reuse GM
8 MID981099435 Lacks - Airplane 24,603.837 M014 Other metals recovery for reuse GM
9 NYD001325661 Lea Ronal Inc. 0.864 1 M011 High temp. metals recovery WR
10 NYD086225596 AT&T Nassau Metals 0.741 4 M011 High temp. metals recovery WR
11 OHD061614673 Dayton Water Systems 57.700 17 M014 Other metals recovery for reuse WR
12 PAD087561015 Inmetco Inc. 4,839.448 97 M011 High temp. metals recovery WR
13 RID062309299 Hallmark Healy Group Inc. 207.745 M013 Secondary smelting GM
14 RID063890214 Boliden Metech Inc. 95.120 3 M014 Other metals recovery for reuse WR
15 RID981886104 Gannon & Scott Inc. 1.455 4 M011 High temp. metals recovery WR
16 TXD008117186 Encycle/Texas, Inc. 7,938.630 244 M014 Other metals recovery for reuse WR
17 TXD072181969 Metal Coatings Corp. 5.930 M011 High temp. metals recovery GM
18 TXD981514383 Alpha Omega Recycling Inc. 15.460 1,028.440 67 M014 Other metals recovery for reuse GM,WR
19 WID006129522 Krueger International 7.425 M014 Other metals recovery for reuse GM
Totals 217,292.304 14,215.763 445
GM = Reported on Biennial Report GM form: identifies generators who manage F006 in an onsite landfill.
WR = Reported on WR form: identifies off-site facilities that receive and manage F006 in a landfill.

September 1998 105 F006 Benchmarking Study
Appendix C:Observed F006 Handling Practices at Metal Finishing Facilities and List of Worker Health
and Safety Regulations

September 1998 106 F006 Benchmarking Study
Description of F006 Generation and Handling at Metal Finishing Facilities
Diagram 1 presents a generic F006 waste generation and handling process. Electroplating processwastewaters are treated through multiple processes to form a slurry/precipitate. Theslurry/precipitate is sent to a filter press where excess water is separated by the filter press. Themoist F006 drops from the filter press to a cart, supersack, roll-off box or to a sludge drier. Whenused a sludge drier reduces the amount of water in the sludge and reduces its volume. After dryingor in the moist state, the F006 is either taken away by a recycler or hazardous materials handler to itsfinal destination.

Diagram 1- Generic Flow Diagram of F006 After Wastewater Treatment to Final Storage*
Filter Press
Luggerbox, Cart
Superbag or FilterbagSludge Drier
Roll-off Box Sludge Drier Superbags Hopper Superbags
DrumSuperbags
Precipitator
Roll-off Box
Roll-off Box
*Flow diagram generated from Chicago ESVs conducted during CSI Project 10/97
Filter Press
Superbags Drum
Superbags
SuperbagsDrumRoll-off Box
(Plate/Frame or Bag)
September 1998 107 F006 Benchmarking Study

September 1998 108 F006 Benchmarking Study
Health and Safety Regulations and Guidelines
This section provides a list of worker and safety regulations, policies, guides and operatingprocedures which may apply to on-site and off-site management of F006 waste. All of OSHAGeneral Industry Standards are applicable. In addition, OSHA Construction Industry Standardswould be applicable to construction activities at these facilities.
Table 1 - List of Regulations, Policies, and Guidelines
Agency/Organization Title of Regulation Location of Regulation
EPA Personnel Training 40 CFR §262.34(a)(4) and40 CFR §265.16
Preparedness and Prevention 40 CFR §265, Subpart C
Contingency Plan and Emergency Procedures 40 CFR §265, Subpart D
Use and Management of Containers 40 CFR §265, Subpart I
Best Management Practices for Pollutant 40 CFR §125.104Dischargers
OSHA Walking-Working Surfaces 29 CFR §1910.22
Guarding floor & wall openings & holes 29 CFR §1910.23
Fixed Industrial Stairs 29 CFR §1910.24
Fixed Ladders 29 CFR §1910.27
Scaffolds 29 CFR §1910.28
Means of Egress 29 CFR §1910.37
Emergency Action Plan Implementation 29 CFR §1910.38(a)
Fire Prevention Plan Implementation 29 CFR §1910.38(b)
Powered Platform Operation 29 CFR §1910.66
Ventilation 29 CFR §1910.94
Hearing Conservation 29 CFR §1910.95
Flammable and Combustible Liquids 29 CFR §1910.106
Dip Tanks Containing Flammable or Combustible 29 CFR §1910.108Liquids
Process Safety Management of Highly Hazardous 29 CFR §1910.119Chemicals
OSHA (cont.) Hazardous Waste Operations (HAZWOPER) 29 CFR §1910.120Training
Personal Protective Equipment 29 CFR §1910.132
Eye & Face Protection 29 CFR §1910.133
Respirator Requirements 29 CFR §1910.134
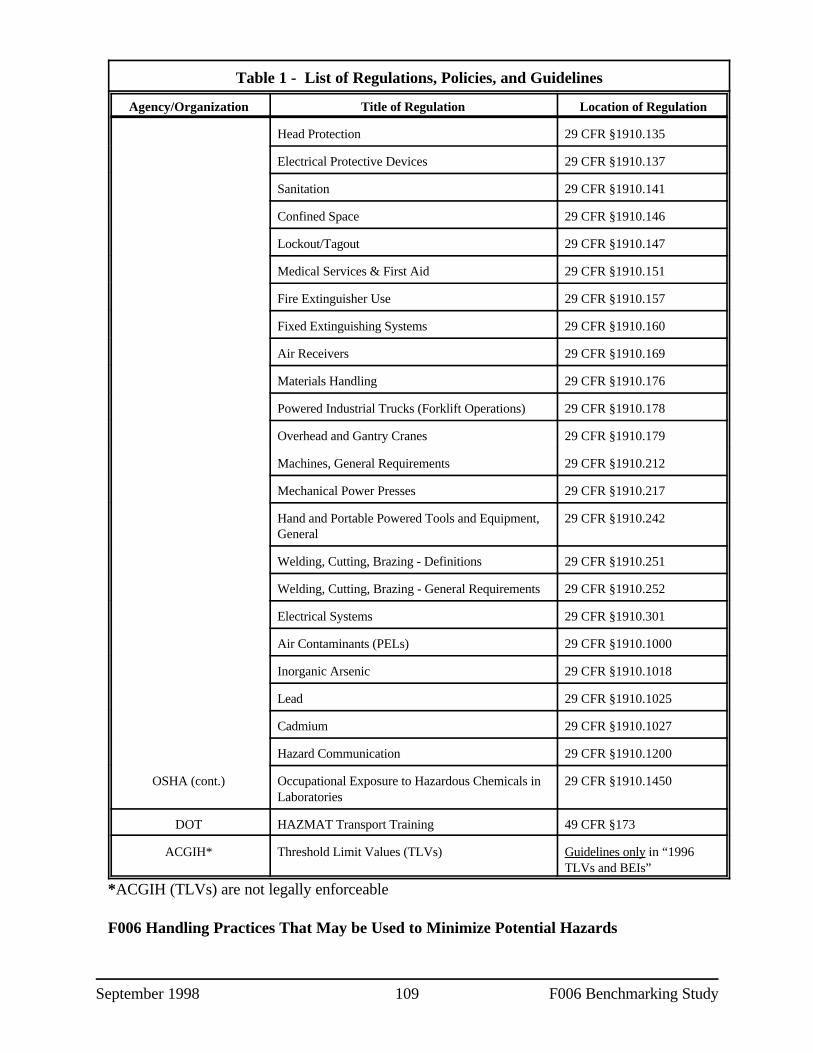
Table 1 - List of Regulations, Policies, and Guidelines
Agency/Organization Title of Regulation Location of Regulation
September 1998 109 F006 Benchmarking Study
Head Protection 29 CFR §1910.135
Electrical Protective Devices 29 CFR §1910.137
Sanitation 29 CFR §1910.141
Confined Space 29 CFR §1910.146
Lockout/Tagout 29 CFR §1910.147
Medical Services & First Aid 29 CFR §1910.151
Fire Extinguisher Use 29 CFR §1910.157
Fixed Extinguishing Systems 29 CFR §1910.160
Air Receivers 29 CFR §1910.169
Materials Handling 29 CFR §1910.176
Powered Industrial Trucks (Forklift Operations) 29 CFR §1910.178
Overhead and Gantry Cranes 29 CFR §1910.179
Machines, General Requirements 29 CFR §1910.212
Mechanical Power Presses 29 CFR §1910.217
Hand and Portable Powered Tools and Equipment, 29 CFR §1910.242General
Welding, Cutting, Brazing - Definitions 29 CFR §1910.251
Welding, Cutting, Brazing - General Requirements 29 CFR §1910.252
Electrical Systems 29 CFR §1910.301
Air Contaminants (PELs) 29 CFR §1910.1000
Inorganic Arsenic 29 CFR §1910.1018
Lead 29 CFR §1910.1025
Cadmium 29 CFR §1910.1027
Hazard Communication 29 CFR §1910.1200
OSHA (cont.) Occupational Exposure to Hazardous Chemicals in 29 CFR §1910.1450Laboratories
DOT HAZMAT Transport Training 49 CFR §173
ACGIH* Threshold Limit Values (TLVs) Guidelines only in “1996TLVs and BEIs”
*ACGIH (TLVs) are not legally enforceable
F006 Handling Practices That May be Used to Minimize Potential Hazards

September 1998 110 F006 Benchmarking Study
Table 2 summarizes F006 handling practices observed at Milwaukee, Chicago, and Phoenix metalfinishing facilities. This table represents observed practices not recommended best managementpractices.
Table 2 - F006 Handling Activities Observed in Regional Benchmarking Study
Work Activity Potential Hazard Hazard Control Method
Paddling wet F006 sludge cake Skin exposure to sludge, Personal Protective Equipment (eyefrom the filter press into a ingestion hazard, Physical body protection, gloves, respirator, non slip boots),lugger box, cart, or drum damage, slip hazard, possible ergonomics Training
dust hazard
Replacing worn or damaged Skin exposure to sludge, Personal Protective Equipment (eyefilter cloths in the filter press. ingestion hazard, Physical protection, gloves, respirator), Training,
damage to body appendages if Means of locking out filter presspress is activated
Shoveling dried F006 sludge Inhalation of metal dust Personal Protective Equipment (eyeinto supersacks, luggerboxes, particles, Skin exposure to dust, protection, gloves, respirator), Training onor drums. ingestion hazard, Physical lifting lifting
hazards, confined space entry
Shoveling dried F006 sludge Inhalation of metal dust Personal Protective Equipment (eyeinto a roll-off box particles, Skin exposure to dust, protection, gloves, respirator), ergonomic
ingestion hazard, Physical lifting training on lifting activitieshazards
Manually moving cart or Inhalation of metal dust, skin Personal Protective Equipment (eyelugger box to supersack or exposure, ingestion hazard, protection, gloves, respirator), ergonomicroll-off box Physical hazard training
Operation of overhead crane to Physical hazard of falling objects, Personal Protective Equipmenttransport cart or lugger box to Crane failure, Inhalation of metal Training on crane operation, crane inspectionroll-off box dust program
Opening/closing a roll-off box Inhalation of metal dust particles, Forklift Training, Personal Protectivemanually or with a forklift Skin exposure to dust, ingestion Equipment, Standard Operating Procedures
hazard, Forklift operation safety (SOPs) hazards, Physical lifting damage
Changing the filter to the sludge Inhalation of metal dust particles, Personal Protective Equipment (eye protection,drier. Skin exposure to dust, ingestion gloves, respirator), Training, means of locking
hazard, drier lock-out out drier to prevent accidental operation
Any work activity in the sludge Inhalation of metal dust particles, Personal Protective Equipment (respirator, eyedrier room. Skin exposure to dust, ingestion protection, hearing protection)
hazard, noise exposure, eyehazard
Sampling the F006 sludge (wet Inhalation of metal dust particles, Personal Protective Equipment (eye protection,or dry) Skin exposure to dust, ingestion gloves, respirator)
hazard

Table 2 - F006 Handling Activities Observed in Regional Benchmarking Study
Work Activity Potential Hazard Hazard Control Method
September 1998 111 F006 Benchmarking Study
Housekeeping Inhalation of metal dust particles, Personal Protective Equipment (eye protection,(i.e., cleaning roll-off box) Skin exposure to sludge or dust, gloves, respirator)
ingestion hazard, Physical lifting Means of locking-out Filter presshazards, Slip/trip/fall hazards,Discharge of F006 whilecleaning the inside of the roll-offbox, confined space entry
Any work activity in noisy areas Noise exposure Personal Protective Equipment (hearing(wastewater treatment pumps) protection)
Forklift operation a lugger box, Forklift operation safety hazards Forklift Training, Personal Protectivedrum, or bag. Equipment (respirator), Standard Operating
Procedures (SOPs)
“Wet” sludge as the term is used here is that sludge produced after the filter press which constitutes about 25-60 %solids. “Dry” sludge is produced by the sludge drier and constitutes about 90% solids.
Personal Protective Equipment Guidance
The National Institute for Occupational Safety and Health (NIOSH) is the government agencyresponsible for performing health and safety studies and making health and safety recommendations. NIOSH has recommended personal protective equipment and sanitary measures for handling specificchemicals and substances. Table 3 is extracted from the NIOSH “Pocket Guide to ChemicalHazards” recommending protective equipment and sanitary measures for specific chemicals andsubstances commonly found in F006 waste. This is not an all inclusive list, for example, respiratorswere not addressed. These recommendations supplement general work practices (e.g., no eating,drinking, or smoking where chemicals are used.)
Table 3 - NIOSH Recommended Personal Protection and Sanitation
Contaminant Skin: Eyes: Wash Skin: Remove Change Provide:Clothing: Clothing:
Aluminum N.R. N.R. N.R. N.R. N.R.
Antimony Prevent skin Prevent eye When When wet or Dailycontact contact contaminated contaminated
Arsenic Prevent skin Prevent eye When When wet or Daily Eyewash,contact contact contaminated contaminated Quickdrench
and daily
Barium Prevent skin Prevent eye When When wet or Dailychloride/nitrate contact contact contaminated contaminated(ASRA)
Beryllium Prevent skin Prevent eye Daily When wet or Daily Eyewashcontact contact contaminated

Contaminant Skin: Eyes: Wash Skin: Remove Change Provide:Clothing: Clothing:
September 1998 112 F006 Benchmarking Study
Bismuth as Prevent skin Prevent eye When When wet or N.R. Eyewash,telluride doped contact contact contaminated contaminated Quickdrenchwith seleniumsulfide
Cadmium N.R. N.R. Daily N.R. Daily
Chlorine Frostbite Frostbite N.R. N.R. N.R. Frostbiteprotection
Chromium N.R. N.R. N.R. N.R. N.R.
Chromium III Prevent skin Prevent eye When When wet or N.R.contact contact contaminated contaminated
Cobalt Prevent skin N.R. When When wet or Dailycontact contaminated contaminated
Copper Prevent skin Prevent eye When When wet or Dailycontact contact contaminated contaminated
Cyanide Prevent skin Prevent eye When When wet or Dailycontact contact contaminated contaminated
Iron N.R. N.R. N.R. N.R. N.R.
Lead Prevent skin Prevent eye Daily When wet or Dailycontact contact contaminated
Manganese N.R. N.R. N.R. N.R. N.R.
Mercury Prevent skin N.R. When When wet or Dailycontact contaminated contaminated
Nickel Preven skin N.R. When When wet or Dailycontact contaminated/ contaminated
daily
Platinum N.R. N.R. N.R. N.R. Daily
Platinum Prevent skin Prevent eye When When wet or Daily(soluble salts) contact contact contaminated contaminated
Selenium Prevent skin N.R. When When wet or N.R.contact contaminated contaminated
Silver Prevent skin Prevent eye When When wet or Dailycontact contact contaminated contaminated
Sodium Prevent skin Prevent eye When When wet or Daily Eyewash,hydroxide contact contact contaminated contaminated Quickdrench
Sulfur dioxide Frostbite Frostbite N.R. When wet or N.R. Frostbitecontaminated protection
Tin N.R. N.R. N.R. N.R. N.R.
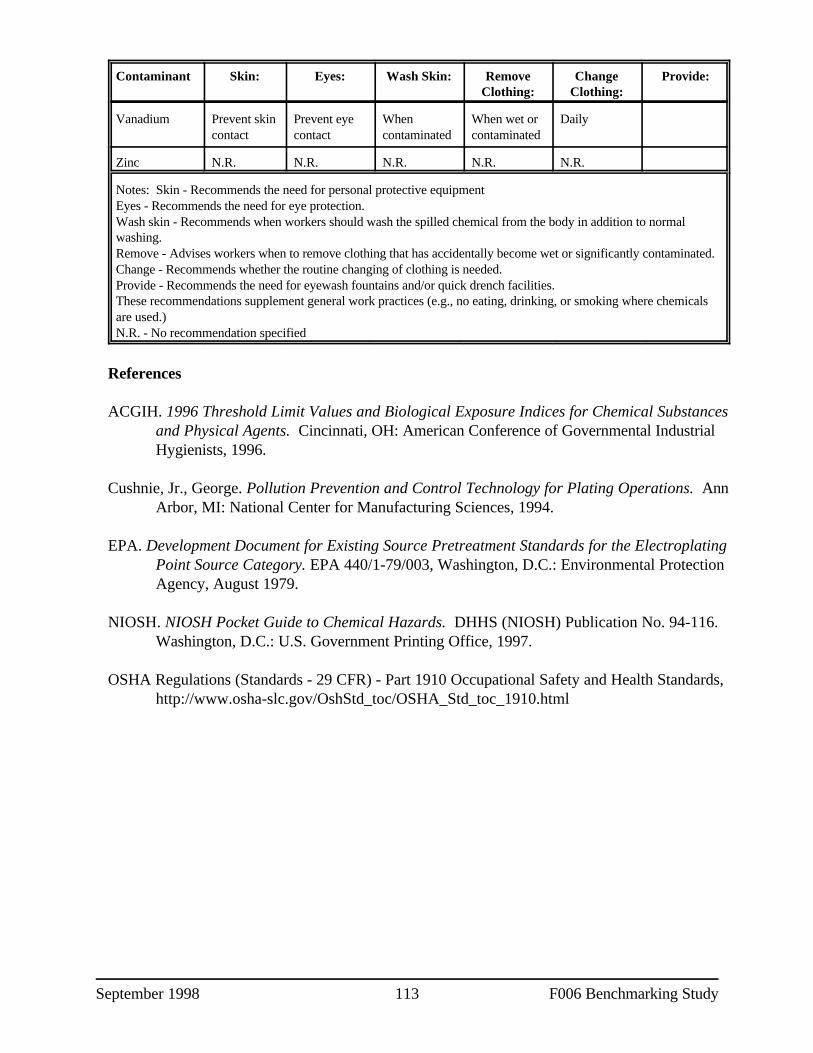
Contaminant Skin: Eyes: Wash Skin: Remove Change Provide:Clothing: Clothing:
September 1998 113 F006 Benchmarking Study
Vanadium Prevent skin Prevent eye When When wet or Dailycontact contact contaminated contaminated
Zinc N.R. N.R. N.R. N.R. N.R.
Notes: Skin - Recommends the need for personal protective equipmentEyes - Recommends the need for eye protection.Wash skin - Recommends when workers should wash the spilled chemical from the body in addition to normalwashing.Remove - Advises workers when to remove clothing that has accidentally become wet or significantly contaminated.Change - Recommends whether the routine changing of clothing is needed.Provide - Recommends the need for eyewash fountains and/or quick drench facilities.These recommendations supplement general work practices (e.g., no eating, drinking, or smoking where chemicalsare used.)N.R. - No recommendation specified
References
ACGIH. 1996 Threshold Limit Values and Biological Exposure Indices for Chemical Substances and Physical Agents. Cincinnati, OH: American Conference of Governmental Industrial Hygienists, 1996.
Cushnie, Jr., George. Pollution Prevention and Control Technology for Plating Operations. Ann Arbor, MI: National Center for Manufacturing Sciences, 1994.
EPA. Development Document for Existing Source Pretreatment Standards for the Electroplating Point Source Category. EPA 440/1-79/003, Washington, D.C.: Environmental Protection Agency, August 1979.
NIOSH. NIOSH Pocket Guide to Chemical Hazards. DHHS (NIOSH) Publication No. 94-116. Washington, D.C.: U.S. Government Printing Office, 1997.
OSHA Regulations (Standards - 29 CFR) - Part 1910 Occupational Safety and Health Standards, http://www.osha-slc.gov/OshStd_toc/OSHA_Std_toc_1910.html

September 1998 114 F006 Benchmarking Study
Appendix D:Checklist Used to Identify Pollution Prevention Technologiesat Metal Finishing Facilities

September 1998 115 F006 Benchmarking Study
P2 Technology TT Comment
1. SPENT PLATING SOLUTIONS
General Bath Life Extension
CC Filtration
CC Carbon Treatment
CC Replenishment
CC Purified Water
CC Electrolytic Dummying
CC Cyanide Bath Carbonate Freezing
CC Precipitation
CC Monitoring
CC Housekeeping
CC Drag-in Reduction
CC Purer Anodes and Bags
CC Ventilation/Exhaust Systems
Hexavalent Chrome AlternativesTrivalent chromeNon-chrome conversion coatings
Nonchelated Process ChemistriesContinuous filtration
Non-cyanide Process Chemicals
Solvent Degreasing AlternativesHot alkaline cleaningElectrocurrentUltrasonic
Alkaline Cleaners Filtration (Micro/Ultra)SkimmingCoalescer
Caustic Etch Solution Regeneration
Acid Purification Ion Exchange
2. DRAG-OUT REDUCTION
CC Process Bath Operating Concentrationand Temperature
CC Wetting Agents

P2 Technology TT Comment
September 1998 116 F006 Benchmarking Study
CC Workpiece Positioning
CC Withdrawal and Drainage Time
CC Air Knives
CC Spray or Fog Rinses
CC Plating Baths
CC Drainage Boards
CC Drag-Out Tanks
3. DRAG-OUT RECOVERY
CC Evaporation
CC Ion Exchange
CC Electrowinning
CC Electrodialysis
CC Reverse Osmosis
CC Meshpad Mist Eliminators
4. RINSE WATER
Improved Rinsing Efficiency
CC Spray Rinse/Rinse Water Agitation
CC Increased Contact Time/MultipleRinses
CC Countercurrent Rinsing
Flow Controls
CC Flow Restrictors
CC Conductivity-Actuated Flow Control
Recycling/Recovery
CC Rinse Water
CC Spent Process Baths
CC Solvents
September 1998 117 F006 Benchmarking Study
Appendix E:Laboratory Analysis Information: Constituents, Methods, and Detection Limits Used in the
Benchmarking Studies

September 1998 118 F006 Benchmarking Study
Table 1. Volatile Organic Target Analytes
Method 8260A
CONSTITUENT TARGET DETECTION LIMIT (FFg/Kg)
Chloromethane 5
Vinyl Chloride 5
Bromomethane 5
Chloroethane 10
Trichlorofluoromethane 5
Acetone 10
2-Chloroethyl vinyl ether 20
1,1-Dichloroethene 5
Methylene Chloride 5
Carbon Disulfide 5
Vinyl Acetate 10
1,1-Dichloroethane 5
2-Butanone 10
trans-1,2-Dichloroethene 5
cis-1,2-Dichloroethene 5
Chloroform 5
1,1,1-Trichloroethane 5
Carbon Tetrachloride 5
1,2-Dichloroethane 5
Benzene 5
Trichloroethene (TCE) 5
1,2-Dichloropropane 5
Bromodichloromethane 5
4-Methyl-2-pentanone 10
2-Hexanone 10
cis-1,3-Dichloropropene 5
trans-1,3-Dichloropropene 5
1,1,2-Trichloroethane 5
Toluene 5

Table 1. Volatile Organic Target Analytes
Method 8260A
CONSTITUENT TARGET DETECTION LIMIT (FFg/Kg)
September 1998 119 F006 Benchmarking Study
Dibromochloromethane 5
Tetrachloroethene (PCE) 5
Chlorobenzene 5
Ethylbenzene 5
m,p-Xylenes 5
o-Xylene 5
Styrene 5
Bromoform 5
1,1,2,2-Tetrachloroethane 5
1,3-Dichlorobenzene 5
1,4-Dichlorobenzene 5
1,2-Dichlorobenzene 5

September 1998 120 F006 Benchmarking Study
Table 2. Semivolatile Organic Target Analytes
Method 8270B - Solid Samples
CONSTITUENT TARGET DETECTION LIMIT (FFg/Kg)
Phenol 660
bis(2-Chloroethyl)ether 660
2-Chlorophenol 660
2,3-Dichlorobenzene 660
1,4-Dichlorobenzene 660
Benzyl alcohol 1300
1,2-Dichlorobenzene 660
2-Methylphanol 660
bis((2-Chloroisopropyl)ether 660
4-Methyphenol 660
N-Nitroso-di-n-propylamine 660
Hexachloroethane 660
Nitrobenzene 660
Isophorone 660
2-Nitrophenol 660
2,4-Dimethylphenol 660
bis(2-Chloroethoxy)methane 660
Benzoic acid 3300
2,4-Dichlorophenol 660
1,2,4-Trichlorobenzene 660
Naphthalene 660
4-Chloroaniline 1300
Hexachlorobutadiene 660
4-Chloro-3-methylphenol 1300
2-Methylnaphthalene 660
Hexachlorocyclopentadiene 660
2,4,6-Trichlorophenol 660
2,4,5-Trichlorophenol 660
2-Chloronaphthalene 660

Table 2. Semivolatile Organic Target Analytes
Method 8270B - Solid Samples
CONSTITUENT TARGET DETECTION LIMIT (FFg/Kg)
September 1998 121 F006 Benchmarking Study
2-Nitroaniline 3300
Dimethylphthalate 660
Acenaphthylene 660
2,6-Dinitrotoluene 3300
3-Nitroaniline 3300
Acenaphthene 660
2,4-Dinitrophenol 3300
4-Nitrophanol 3300
4-Nitrophenol 660
Dibenzofuran 660
2,4-Dinitrotoluene 660
Diethyphthalate 660
4-Chlorophenyl-phenylether 660
Fluorene 660
4-Nitroaniline 3300
4,6-Dinitro-2-methylphenol 3300
N-Nitrosodiphenylamine 660
4-Bromophenyl-phenylether 660
Hexachlorobenzene 660
Pentachlorophenol 3300
Phenanthrene 660
Anthraoene 660
Carbazole 660
Di-n-butylphthalate 660
Fluoranthene 660
Pyrene 660
Butylbenzylphthalate 660
3,3'-Dichlorobenzidine 1300
Benzo(a)anthracene 660

Table 2. Semivolatile Organic Target Analytes
Method 8270B - Solid Samples
CONSTITUENT TARGET DETECTION LIMIT (FFg/Kg)
September 1998 122 F006 Benchmarking Study
bis(2-Ethylhexyl)phthalate 660
Chrysene 660
Din-octylphthalate 660
Benzo(b)fluoranthene 660
Benzo(k)fluoranthene 660
Benzo(a)pyrene 660
Indeno(1,2,3-cd)pyrene 660
Dibenz(a,h)anthracene 660
Benzo(g,h,f)perylene 660

September 1998 123 F006 Benchmarking Study
Table 3. Target Analytes: Metals and other Inorganics
SW-846 TargetDetection Limits1
Analyte Method(s) Solid mg/kg
Aluminum 6020 10Antimony 6020 1 Arsenic 6020 2 Barium 6020 10 Beryllium 6020 1 Bismuth 6020 1Cadmium 6020 1 Calcium 6020 100Chromium 6020 2 Copper 6020 1 Iron 6020 10 Lead 6020 0.6 Magnesium 6020 100Manganese 6020 3 Mercury 7471 0.1 Nickel 6020 1 Selenium 6020 1 Silver 6020 1 Sodium 6020 100Tin 6020 1 Zinc 6020 4
Chloride SM 300.0 NRFluoride SM 340.2 NRCyanide (total and amenable) 9010 NRHexavalent chromium 3060A/7196A NR
S)))))))))))))))))))))))))))))))))))))Notes:
1 The target detection limits provided are for reference purposes. The actual method detectionlimits are sample dependent and may vary as the sample matrix varies.
NR - Not required, best achievable limit by laboratory to be used.

September 1998 124 F006 Benchmarking Study
Table 4. TCLP Compliance Criteria
Analyte Methods Target Quantitation Limits mg/L 1
Metals Arsenic 6020 5.0 Barium 6020 100. Cadmium 6020 1.0 Chromium 6020 5.0 Lead 6020 5.0 Mercury 7470 0.2 Selenium 6020 1.0 Silver 6020 5.0
S)))))))))))))))))))))))))))))))))))))))))))))))QNotes:
1. All methods are SW-846 3rd Ed.

September 1998 125 F006 Benchmarking Study
Appendix F:Regional Benchmarking Survey

September 1998 126 F006 Benchmarking Study
EPA’s CSI Survey of 10 Milwaukee PlatersInstructions
The National Association of Metal Finishers (NAMF) is member of Environmental Protection Agency's CommonSense Initiative (CSI) metal finishing sector workgroup and is participating in the data gather effort focusing on hazardouswaste regulatory issues has identified the need to compare the characteristics of F006 wastes generated today with F006wastes generated at the time of the listing under RCRA (1980). The following survey will be used to evaluate the chemicalcontent of F006 generated by 10 metal finishing facilities from Milwaukee. This information will be used to characterizeF006, evaluate the processes generating F006 and the level of pollution prevention practiced, and determine therecyclability of F006. Please note that this survey should be completed using available information or bestengineering judgement and that you are not required to generate any new data.
Confidentiality: If you believe that some parts of the information supplied by your are commercially sensitive, you mayclaim protection for your data. However it will be extremely difficult for the workgroup to use any data that is consideredconfidential in determining the F006 recyclability. If you believe your information to be sensitive, it may be blinded inorder for the workgroup to develop a final report.
Return the completed survey within 10 days from date of receipt to:
William (Bill) SonntagNAMF2600 Virginia Ave. NW, Suite 408Washington, DC 20037Phone: (202) 965-5190Fax: (202) 965-4037
The survey may also be submitted to the EPA contractor during the engineering site visit and sampling effort.
For technical assistance, call Kristy Allman, SAIC at (703) 318-4766.
Response may be typed or handwritten neatly. Use additional paper as needed.
A. Corporate and Facility Information
Parent Corporation
Name of Company/Affiliate
Address of Corporation Headquarters
Street
City State Zip
Name of Facility
Address of Facility (if different from above)
Street
City State Zip
RCRA Hazardous Waste Generator ID Number:
POTW/NPDES Permit Number:
PSD Permit Number:
Name(s) of personnel to be contacted for additional information pertaining to this questionnaire
Name Title Telephone

September 1998 127 F006 Benchmarking Study
Type of Facility: Job shop Captive shop
Number of Employees:
B. Process Flow Diagram
The purpose of this question is to provide the workgroup with an overview of the plating operations and understanding ofhow the various plating operations are linked together, and the flow of wastewaters to the waste water treatment plant(WWTP) generating the F006 sludge.
The workgroup is most interested in the following commonly used processes:
C zinc plating on steelC nickel/chromium plating on steelC copper/nickel/chromium plating on non-ferrous substrates (zinc, brass, ABS)C copper plating/stripping in the printed circuit industryC hard chromium plating on steelC cadmium plating
Please provide a general process block flow diagram for each these plating processes that identifies basic plating operation. This should contain general information on feedstocks, plating solutions, waste generation, etc.
Please provide a brief written description of the plating process. This should include:
C Feed stock, intermediate, or product storageC Waste management unitsC Waste storage and shipping equipmentC Production outputC Waste generation C Plating sequence, solutions, and substrates
C. Wastewater Treatment Plant Flow Diagram
Please provide a brief description of the treatment process wastewaters go through to remove metals and other toxicsubstances prior to discharge. Please discuss the following steps and equipment used (as applicable):
C waste stream segregationC hexavalent chrome reductionC cyanide oxidationC neutralization, flocculation, clarification, effluent polishingC sludge dewatering and dryingC sludge blending to achieve desired concentrationC sludge storage and duration
D. F006 Quantity Generated and Management Methods
D.1. What was the total product weight produced by your facility in 1995? Long Tons or Surface area (Circle one)
D.2. Is the F006 generated at your facility process-specific or is it combined in the wastewater treatment plant?
D.3. What was the total quantity of F006 generated in 1995? Dry tons
D.4. Estimate the quantity of F006 generated from each process in 1995?
Process Quantity (dry tons)

September 1998 128 F006 Benchmarking Study
D.5. Please provide a description of any onsite recycling of your F006. Please estimate the quantities (dry tons) recycledor recovered.
D.6. Please provide the name, location, brief process description (e.g., pyrometallurgical) and quantity (dry tons) for allF006 sludge that is sent offsite for recycling/metals recovery.
D.7. Please provide the name, location, management method (e.g., Subtitle C landfill) and quantity (dry tons) for all F006sludge that is sent offsite for disposal.
D.8. What is the quantity of F006 sludge disposed of onsite? Dry tonsD.9. What was the quantity exported outside the U.S. in 1995? Dry tons
E. F006 Waste Characterization
Please provide waste characterization analytical data sheets for your F006 sludge. Submit both Toxicity CharacteristicLeaching Procedure (TCLP) and total compositional data when possible. Please provide characterization information (ifavailable) for pH, reactive cyanide, specific gravity, and phase distribution. Please be sure your facility name and F006sludge sample identification is clearly marked on each page or provide it in the top right hand corner of the analytical datasheet with any additional information you may wish to provide. Please provide any specifications required by recyclers.
F. Pollution Prevention/Waste Minimization Activities
Briefly please respond to each of the following questions concerning your present or past pollution prevention/wasteminimization (P2) activities. Please remember it is just as important to document your failures as well as your successes inconducting P2.
F.1. What types of equipment changes or equipment layouts have you implement in conducting P2?
F.2. Describe how you have improved operating practices including operator training.
F.3. Describe any material substitution or elimination you have implemented to make your F006 less toxic or morerecyclable.
F.4. Describe your water-use (e.g., flow restriction, drag out) reduction program or policy and any addition P2 measuresconducted at your facility not mentioned before.

September 1998 129 F006 Benchmarking Study
F.5. Describe any closed-loop recycling conducted by your plating operation.
F.6. Please describe how your facility’s use of pollution prevention has (or has not) affected the quantities and/or qualityof F006 sludge generated at your facility.
F.7. Do you have any documentation where P2 was implemented and subsequently partially or completely abandoned infavor of reclamation. If so can you provide EPA with a copy of the documentation and briefly describe it below.
F.8. Please describe any industrial trends affecting your metal finishing facility or the metal finishing industry as a wholeand/or the generation of F006 sludge.
F.9. Please describe any economic barriers and/or incentives to conducting P2. Please describe the principle economicfactors that have lead to your facility’s current practices.
F.10. Please describe any regulations that affect P2, recycling and sludge treatment/management decisions.

September 1998 130 F006 Benchmarking Study

September 1998 131 F006 Benchmarking Study

September 1998 132 F006 Benchmarking Study
Appendix G:National Benchmarking Survey and Instructions

September 1998 133 F006 Benchmarking Study
Call for Data as Part of EPA’s CSIInstructions
The National Association of Metal Finishers (NAMF), American Electroplaters and Surface Finishers (AESF), and MetalFinishing Sciences Association (MFSA) are members of the Environmental Protection Agency's Common Sense Initiative(CSI) metal finishing sector workgroup and are participating in the data gathering effort focusing on hazardous waste regulatoryissues and has identified the need to compare the characteristics of F006 wastes generated today with F006 wastes generated atthe time of the listing under RCRA (1980). The following survey will be used to characterize F006, evaluate the processesgenerating F006 and the level of pollution prevention practiced, and determine the recyclability of F006. Please note that thissurvey should be completed using available information or best engineering judgement and that you are not requiredto generate any new data.
F006 is defined as “Wastewater treatment sludges from electroplating operations except from the following processes: (1)Sulfuric acid anodizing of aluminum; (2) tin plating on carbon steel; (3) zinc plating (segregated basis) on carbon steel; (4)aluminum or zinc-aluminum plating on carbon steel; (5) cleaning/stripping associated with tin, zinc, and aluminum platingon carbon steel; and (6) chemical etching and milling of aluminum.” (40 CFR §261.31)
Return the completed survey as soon as possible but not later than 30 days after receipt of this survey to:
Christian RichterNAMF/AESF/MFSA2600 Virginia Ave. NW, Suite 408Washington, DC 20037Phone: (202) 965-5190Fax: (202) 965-4037
Response may be typed or handwritten neatly.
A. CORPORATE AND FACILITY INFORMATION
Parent Corporation
Name of Company/Affiliate
Address of Corporation Headquarters
Street
City State Zip
Name of Facility
Address of Facility (if different from above)
Street
City State Zip
RCRA Hazardous Waste Generator ID Number:
POTW/NPDES Permit Number:
PSD Permit Number:
State or Local environmental permits:
Name(s) of personnel to be contacted for additional information pertaining to this data
Name Title Telephone
Type of Facility: Job shop Captive shop

September 1998 134 F006 Benchmarking Study
Number of Employees:
B. METAL FINISHING OPERATIONS
What type of plating operations are conducted by your facility? Specify cyanide- versus non-cyanide-based plating.
zinc plating on steel CN Non-CN
nickel/chromium plating on steel
copper/nickel/chromium plating on non-ferrous substrates (zinc, brass, ABS)
copper plating/stripping in the printed circuit industry
hard chromium plating on steel
Copper plating
tin (acid) plating
cadmium plating
sulfuric acid anodizing
silver plating
gold plating
bright dip of copper/alloy
Other,( specify):
C. F006 QUANTITY GENERATED AND MANAGEMENT METHODS
C1. What was the total product weight produced by your facility in 1996? (Long Tons/Cubicyards/Cubic feet) Please circle appropriate units.
C2. Is the F006 generated at your facility process-specific or is it combined in the wastewater treatment plant?
C3. Are cyanide-bearing F006 sludges segregated from non-cyanide F006? Yes / No
C4. What was the total quantity of F006 generated in 1996? (Dry Tons/Cubic yards/Cubic feet)Please circle appropriate units.
C5. Estimate the quantity of F006 generated from each process in 1996?
Process Quantity (Specify units)
C6. Please provide a description of any onsite recycling of your metals prior to discharge to wastewater treatment. Please estimate the quantities (Dry Tons/Cubic yards/Cubic feet) recycled or recovered.

September 1998 135 F006 Benchmarking Study
Description of any onsite recycling Quantity recycled or recovered
C7. Please provide the name, location, and quantity (Dry Tons/Cubic yards/Cubic feet) for all F006 sludge that is sentoffsite for recycling/metals recovery.
Name Location Quantity
C8. Please provide the name, location, management method (e.g., Subtitle C landfill) and quantity (dry tons) for allF006 sludge that is sent offsite for disposal.
Name Location Management QuantityMethod
C9. What was the quantity exported outside the U.S. in 1996? Dry tons
C10. Please check any of the wastewater treatment process used to remove metals and other toxic substances prior todischarge. Please discuss the following steps and equipment used (as applicable):
waste stream segregation
hexavalent chrome reduction
cyanide oxidation
neutralization, flocculation, clarification, effluent polishing
sludge blending to achieve desired concentration
D. F006 WASTE CHARACTERIZATION
Please provide waste characterization analytical data sheets for your F006 sludge. Submit both Toxicity Characteristic LeachingProcedure (TCLP) and total compositional data when possible. Please provide characterization information (if available) forpH, reactive cyanide, specific gravity, and phase distribution. Please be sure your facility name and F006 sludge sampleidentification is clearly marked on each page or provide it in the top right hand corner of the analytical data sheet with anyadditional information you may wish to provide. Please provide any specifications required by recyclers.
E. POLLUTION PREVENTION/WASTE MINIMIZATION ACTIVITIES
E1. Check the techniques used at your site. If requested, indicate whether the technique is automated or manual. Thepollution prevention benefits from the techniques you use (1= low success, 5= high success). If the rating is 1 or 2,

September 1998 136 F006 Benchmarking Study
indicate below what problems were encountered. Also, use the space below or other sheets to describe anyinnovative methods or to provide additional information.
Reduce Drag-Out Losses By: P2 Benefit
Using drag-out rinse tanks and returning chemicals to the process bath 9 Manual or 9 Automatic
Using drip tanks and returning chemicals to the process bath9 Manual or 9 Automatic
Reducing speed of rack/part withdrawal9 Manual or 9 Automatic
Allowing rack/part to drip over plating tank9 Manual or 9 Automatic
Using a drag-in/drag-out arrangement (i.e., use of same rinse tank before and after plating alsoreferred to as a double-dip or double-use rinse)9 Manual or 9 Automatic
Fog or spray rinses installed over process bath 9 Manual or 9 Automatic
Air knives that blow off drag-out9 Manual or 9 Automatic
Drip shields between tanks9 Manual or 9 Automatic
Lower bath concentration
Increasing solution temperature (reduces viscosity)
Using a wetting agent (reduces viscosity)
Positioning work piece to minimize solution holdup
Other, specify
Reduce Rinse Water Use By: P2 Benefit
Manually turning off rinse water when not in use
Conductivity or pH rinse controls
Timer rinse controls
Flow restrictors
Countercurrent rinses
Spray rinses
Air agitation in rinse tanks
Use flow meters/accumulators to track water use at each rinse tank or plating line
Reactive rinsing or cascade rinsing
Other, specify

September 1998 137 F006 Benchmarking Study
Various Operating Practices: P2 Benefit
Training and Programs:
Established a formal policy statement with regard to pollution prevention and control
Established a formal pollution prevention program
Conduct employee education for pollution prevention
Establish a preventative maintenance program for tanks
Use specifically assigned personnel for chemical additions
Procedures:
Stricter conformance w/ Line Preventive Maintenance Schedule
Stricter conformance w/ SPC Procedures
Waste stream segregation of contact and noncontact wastewater
Strict chemical inventory control
Perform routine bath analyses
Maintain bath analyses/addition logs
Have written procedures for bath make-up and additions
Use process baths to maximum extent possible (no dump schedule)
Remove anodes from bath when they are idle (e.g., cadmium, zinc)
Regularly retrieve fallen parts/racks from tanks
F006 Volume Reduction methods:
Closed-loop recycling
Use control method for adding water to process tanks
Sludge Dewatering- (Vacuum filter, Solid bowl centrifuge, Imperforate basket centrifuge, beltfilter press, Recessed plate filter press, sludge drying beds, sludge lagoons, sludge dryers, etc.)
Install overflow alarms on process tanks
Install other spill/leak detection system, specify _________________________________
Inspections/ Maintenance:
Perform regular maintenance of racks/barrels
Pre-inspect parts to prevent processing of obvious rejects
Waste Reduction Study conducted
Research/Evaluations:
Evaluation of recycling alternatives
Increasing drain time over process tanks

Various Operating Practices: P2 Benefit
September 1998 138 F006 Benchmarking Study
Research of alternative plating technologies
Development of tracking system for monitoring flow from different areas
Monitoring of incoming water with strict control program
Two separate labs for process chemistry and wastewater treatment
Elimination/ Replacement/Substitutions:
Eliminate obsolete processes and/or unused or infrequently used processes
Replace cyanide based plating solution with alkaline-based solutions
Elimination of rinse waters to waste treatment (nickel, chrome)
Substitution of chromate and dichromate seal with non chrome sealer
Elimination of plating services (cadmium, tin, nickel, copper, brass and hard chrome)
Elimination of vapor degreasing
Implementation of a multi- stage cyanide destruct system
Elimination of chelated cleaners
Other, specify
Other, specify
Additional Information (attach other sheets, if necessary): ______________________________________
E.2. Has the implementation of pollution prevention reduced your wastewater discharge rate?9 Yes 9 No
If yes, approximately how many gallons per day average have you reduced your flow by using pollution prevention? ______________________ gpd eliminated (base year = 19__)
E.3. Recycle and Recovery Technologies - Check each technology that you have used in the past or currently use,indicate the type of process bath to which the technology is applied.
Technology Process Bath Technology is Applied to
Electrodialysis
Electrowinning
Evaporator
Ion flotation
Ion exchange
Mesh pad mist eliminator/recycle
Reverse osmosis
Ultrafiltration

Technology Process Bath Technology is Applied to
September 1998 139 F006 Benchmarking Study
Other*
E.4. Solution Maintenance Techniques
Check the techniques that you presently use and indicate the type of process bath to which the techniques applied. Use the spacebelow to describe any innovative methods or to provide additional information.
Technology Process Bath Technology is Applied to
Acid retardation
Carbon treatment (batch)
Carbon treatment (continuous)
Dummying of metal contaminants
Electrodialysis for inorganiccontaminants
Carbonate freezing
Filtration, in-tank
Filtration, external
High pH treatment
Precipitation
Liquid/ Liquid extraction
Microfiltration
Ultrafiltration
Other, specify
Other, specify
Other, specify
Additional Information:________________________________________________________________________

September 1998 140 F006 Benchmarking Study
Appendix H:National Benchmarking Commercial Recyclers Survey

September 1998 141 F006 Benchmarking Study
EPA’s CSI Survey of Recyclers of F006 Instructions
The National Association of Metal Finishers (NAMF), American Electroplaters and Surface Finishers (AESF), and MetalFinishing Sciences Association (MFSA) are members of Environmental Protection Agency's Common Sense Initiative(CSI) metal finishing sector workgroup and are participating in the data gathering effort focusing on hazardous wasteregulatory issues. The workgroup has identified the need to compare the characteristics of F006 wastes generated todaywith F006 wastes generated at the time of the listing under RCRA (1980). The following survey will be used tocharacterize F006, evaluate the F006 recycling processes, and determine the recyclability of F006. Please note that thissurvey should be completed using available information or best engineering judgement and that you are notrequired to generate any new data.
Return the completed survey within 30 days from date of receipt to:
William (Bill) SonntagNAMF/AESF/MFSA2600 Virginia Ave. NW, Suite 408Washington, DC 20037Phone: (202) 965-5190Fax: (202) 965-4037
For technical assistance, please call Kristy Allman at (703) 318-4766.
Response may be typed or handwritten neatly. Use additional paper, as needed.
A. CORPORATE AND FACILITY INFORMATION
Parent Corporation
Name of Recycling Company/Affiliate
Address of Recycling Company Headquarters
Street
City State Zip
Address of Facility (if different from above)
Street
City State Zip
RCRA Hazardous Waste Generator ID Number:
POTW/NPDES Permit Number:
PSD Permit Number:
State and local environmental permits:
Name of person to be contacted for additional information pertaining to this questionnaire
Name Title Telephone
Manner of Handling F006: Hydrometallugical %
Pyrometallurgical %
Blender/Broker %
Other, specify (%)
Number of Employees:

The CSI workgroup is attempting to characterize the F006 sludge based on 1995 data. If data for 1995 is15
not available, other recent time frames will be useful. Please clearly mark the date or time frame on the data sheets.
September 1998 142 F006 Benchmarking Study
B. PROCESS FLOW DIAGRAM
B.1 On a separate sheet of paper, please provide brief description of your process and, if possible, a process flowdiagram that identifies basic metal recovery methods. This should include general information includingprocess steps, feeds, products, and the emissions and wastes from the recycling process. This should include:
C Feed stocks, intermediates, and/or productsC Process stepsC Waste management unitsC production outputC emissions and waste generation points
C. F006 QUANTITIES
C.1. What was the volume of all the materials processed by your facility in 1995? Long tons15
C.2. What was the volume of F006 sludge processed by your facility in 1995? Dry tons1
D. F006 CHARACTERIZATION
D.1. Please provide analytical data for F006 evaluated in 1995 . If this represents a large quantity of data, you may1
present a subset focusing on either more complete analytical scans or on a more recent time period (i.e., thelast month). If the data is confidential, you may present a range, with the average and number of data points. Ifavailable, please provide the broader pre-approval scans, typically examining a broader spectrum ofconstituents, rather than the more cursory screening analyses typically performed on each load of newlyreceived F006. When available, submit both Toxicity Characteristic Leaching Procedure (TCLP) and totalconcentration data. Please be sure your facility name, and F006 sludge sample is clearly identified on eachpage or provide it in the top right hand corner of the analytical data sheet with any additional characteristicinformation you may wish to provide. If you have any questions, you may call the technical assistance line.
D.2. Please provide a copy or descriptions of the specification for the F006 sludge must meet for your facility toaccept it for recycle. Use additional paper if necessary.
D.3. Explain any undesirable physical or chemical characteristics F006 might possess making it unacceptable toyou facility. Use additional paper if necessary.
EVALUATION OF F006
E.1. How does your facility establish the value of F006 (i.e., how do you determine what your company will chargeor pay for F006)? Please list the specific metals or combination of metals, or contaminants which affect yourvaluations. (Please respond in less specific terms if specific termination is considered proprietary.) Useadditional paper if necessary.

September 1998 143 F006 Benchmarking Study
Appendix I:Responses to Citizen Group Phone Survey

September 1998 144 F006 Benchmarking Study
Individual responses are summarized below.
Question #1: Is the Group Aware of Environmental Impacts from the Recycling Facility?
NO
NO. “Not in the past 6 years. No known violations. Involved in moving waste from one state to another--somequestion concerning whether it is “sham recycling” or not.”
NO
NO COMMENT. The environmental group technically no longer exists.
NO
NO. “They generally try to make env. laws easier, through political influence. They also operate a superfund site.”
NO
NO
UNKNOWN. “Never heard of the company.”
Question #2: Is the Group Aware of Economic Impacts from the Recycling Facility?
NO
NO. “They are the largest waste recycler in this state, but mostly imported from other states.”
NO
NO COMMENT. The environmental group technically no longer exists.
YES. “Positive impact, always in the business pages of the newspaper.”
NO
NO. “Provides a good service for local companies.”
NO
UNKNOWN. “Never Heard of the company.”
Question #3: Is the facility considered a “Good Neighbor?”
UNKNOWN
NO. ”They spread the waste on the ground to dry it.”
UNKNOWN. “Have heard little about this facility, it is 50 miles away.”
NO COMMENT. The environmental group technically no longer exists.
YES. “Have no information to say they are a bad neighbor.”
NO. “Don’t trust them.”
YES. “They make an effort to get involved in informing the community on what they do.”

Question #3: Is the facility considered a “Good Neighbor?”
September 1998 145 F006 Benchmarking Study
YES. “They received an environmental award and, we have participated with them on voluntary P2 committees andprojects.”
UNKNOWN. “Never heard of the company.”

September 1998 146 F006 Benchmarking Study
Appendix J: Statistical “Representativeness” of the National Benchmarking Study

Yj '1Njj
kYjk , Sj '
1Njj
k(Yjk&Yj)
2
September 1998 147 F006 Benchmarking Study
Statistical “Representativeness” of the National Benchmarking Study
A chi-square analysis was performed to determine whether there is a difference in the distributionof sample proportions for D&B, BRS and “national” databases over the different regions.
C Summary of results of comparison of the National sample with the Dun & Bradstreetextract
A chi-square analysis was performed to compare the National sample and the D & B extract (PrimarySIC code of 3471) on the number of data points for each of the ten EPA regions.
Results of the test showed that they are statistically different ( p-value - 0.003. Please refer to Table1 of Attachment 1 ). The difference can be attributed to the difference in percentages of the numberof facilities in the National sample and the D & B extract for EPA regions 4, 5, and 6. The D & Bextract had nearly 30% of the data points as against 42% in the National sample for region 5. TheNational sample had 5.78 % (region 4), 1.16% (region 6) of the data points as against 9.84% (region4) and 7.43% (region 6) in the D & B. The difference in size of the National sample (173) and theD & B (4147) was an important issue for the significant p-value of 0.03%. If the National sampleis used to produce any national estimate, there should be caveats for the differences mentioned abovefor EPA region 4, 5, and 6.
The National and the D&B extract were also compared on the basis of mean number of employeesper facility. It was found that the means for the National sample were consistently higher than thecorresponding means in the D & B ( Please refer to table 2 of Attachment 1). This shows thatrelatively larger facilities in terms of manpower volunteered for the National sample. Hence, anynational estimate from this sample must come with a caveat indicating a potential bias problem.
For 9 degrees of freedom, the P value of 25.22 is significant beyond both 5% and 1% levels.2
Therefore, we reject the null hypothesis that there is no difference in the sample proportions for D&Band “national’ databases. Note, however, that due to small sample sizes in the “national” database,the results could be more informative after collapsing several regions in larger strata.
2. In this section, a statistical method for testing the difference between average number of employeesfrom the D&B and “national” databases is described. Histograms and normal probability plots appliedto the total number of employees suggest that the characteristic of interest (# of employees) isdistributed more lognormally than normally. Therefore, the log-transformed version was used in allcalculations. Assuming that the D&B database covers almost all facilities of interest, the true meanand true standard deviation for each region can be approximated by
Since N is large enough and S is known, we can use normal approximation to test the differencesj j
between the true (D&B) mean, Y, and the sample (“national”) mean, y . In this case the test statisticj j
is given by

zj '|yj&Yj|
Sj
, j'1,2,ÿ,10
September 1998 148 F006 Benchmarking Study
C Summary of results of comparison of the National sample with the BRS sample
Results of the chi-square test performed to compare the National sample and the BRS sample aresimilar to the results of comparison of the National sample and the D & B extract. In fact, with aprecision of 0.1%, we conclude that the distribution of sample points by region in the National sampleis significantly different from the distribution of sample points by region in the BRS sample.The difference can be attributed to the difference in percentages of the number of facilities in thenational sample and the BRS sample for EPA regions 3, 4, 5, 6, and 9. Comparing the average F006 discharge for each region in the national sample and in the BRS sample,we found that, in general, there are no significant differences for most regions in these two samples.Only two regions (region 1 and region 5) out of ten in the National sample discharged significantlymore F006 than the corresponding regions in the BRS sample. Note also that there were no samplestaken from region 8 in the National survey.
C Comparison of the Regional Benchmarking Sampling data to the National Survey data
The results of the test for all 10 groups along with the corresponding p-values are attached.In order to compare the responses from the ALLDATA sample and the NATIONAL sample, weexamine how much the mean and distribution of each analyte from the ALLDATA sample differ fromthose from the NATIONAL sample. The table below summarizes the results of statistical testsperformed to compare the two samples. It contains p-values for the analytes that are in bothALLDATA and NATIONAL samples. P-values less than 0.05 indicate a statistically significantdifference between the responses from the ALLDATA sample and the NATIONAL sample for aparticular analyte.
From this table we conclude that the reported values are significantly different for Amenable Cyanide,Magnesium, Selenium, Total Cyanide, and Zinc from the TOTAL group. The results for otheranalytes do not show significant differences between the two samples under study.
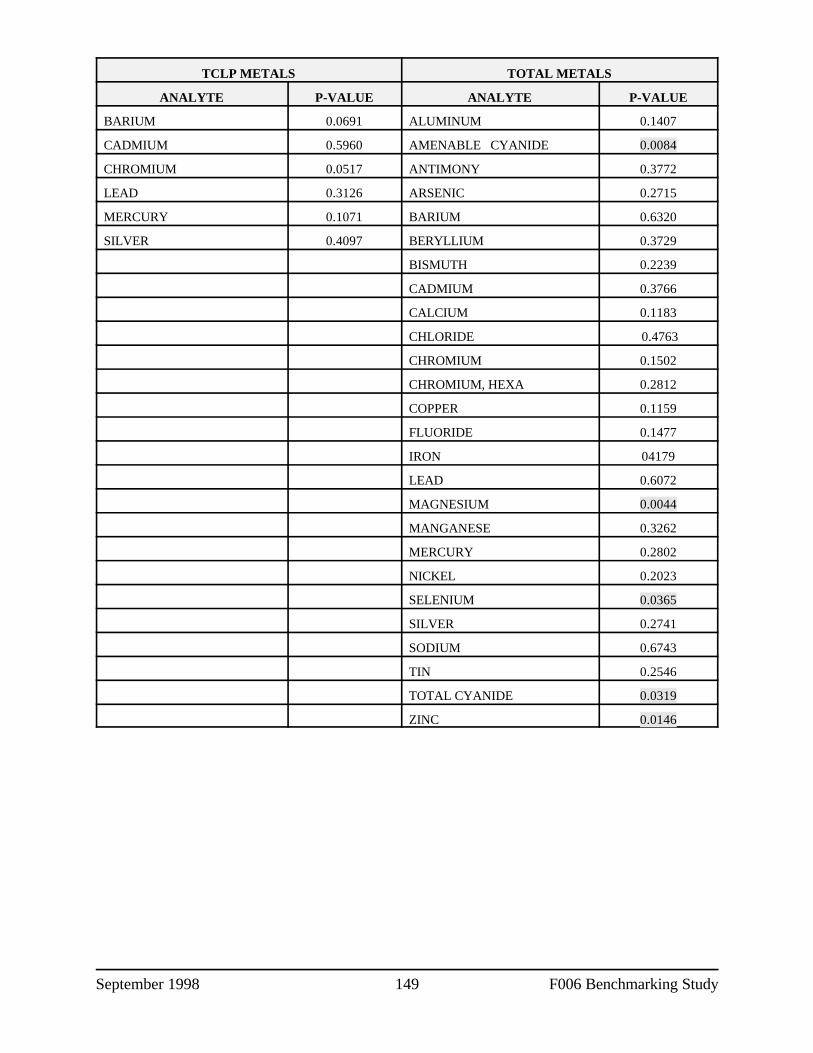
September 1998 149 F006 Benchmarking Study
TCLP METALS TOTAL METALS
ANALYTE P-VALUE ANALYTE P-VALUE
BARIUM 0.0691 ALUMINUM 0.1407
CADMIUM 0.5960 AMENABLE CYANIDE 0.0084
CHROMIUM 0.0517 ANTIMONY 0.3772
LEAD 0.3126 ARSENIC 0.2715
MERCURY 0.1071 BARIUM 0.6320
SILVER 0.4097 BERYLLIUM 0.3729
BISMUTH 0.2239
CADMIUM 0.3766
CALCIUM 0.1183
CHLORIDE 0.4763
CHROMIUM 0.1502
CHROMIUM, HEXA 0.2812
COPPER 0.1159
FLUORIDE 0.1477
IRON 04179
LEAD 0.6072
MAGNESIUM 0.0044
MANGANESE 0.3262
MERCURY 0.2802
NICKEL 0.2023
SELENIUM 0.0365
SILVER 0.2741
SODIUM 0.6743
TIN 0.2546
TOTAL CYANIDE 0.0319
ZINC 0.0146


![Privilege Benchmarking Study - 2016 [Infographic]](https://static.fdocuments.us/doc/165x107/587269421a28ab31498b550d/privilege-benchmarking-study-2016-infographic.jpg)