Healthcare services & knowledge economy: economy and social development

MassBenchmarks 2012 • volume fourteen issue one 19
Introductionthe new economy represents a major transformation in the industrial structure of Massachusetts and the nation. driven by the widespread proliferation of new information technologies and globalization, the new economy is char-acterized by the decline of manufacturing as the primary domestic economic base to be replaced by emergent strengths in information technology, biotechnology, and value-added services ranging from corporate management to multinational finance and logistics. the common thread linking these emergent sectors is their emphasis on continual learning, adaptation, innovation, and strong ties to basic science and applied research. thus, while many associate the new economy with specific tech-ori-ented products and services, it is really the abilities, skills and knowledge embedded in the workforce that provide the glue bridging these highly diverse sectors and drive regional competitiveness. Massachusetts has been among the greatest benefi-ciaries of the rise of the new economy. Massachusetts has consistently ranked first among the states in the Kauffman foundation’s index of the new Economy, since its first publication in 1999, scoring particularly well in its depth of managerial professionals, high-tech jobs, and higher education infrastructure.1 but while the commonwealth and the nation continue to actively pursue technology-based economic development, policy makers
Workforce Skills and theChanging Knowledge Economy in MassachusettsHe N R y Re N s k i a N d Rya N wa L L a c e
alThough The maSSachuSeTTS economy haS clearly Become more knowledge- and
Technology-inTenSive over The paST Two decadeS, joBS in key areaS like informaTion
Technology, healTh care, and educaTion require hyBrid Skill SeTS. TheSe include maTh
and Science SkillS along wiTh Social, communicaTive, and learning SkillS.
struggle to find ways to improve the prospects for those lacking the education or training to fully participate in the new economy. in particular, there is growing concern whether technological change is polarizing the labor force into a group of highly-paid knowledge elites on one end of the skills spectrum, and low-wage service and retail workers on the other, with a disappearing middle that was once populated by production workers and back-office staff. traditionally, state and regional economic analysis has focused on understanding questions of regional industrial composition and structure: What are the leading industries in a region? What are their prospects for continued growth? are these industries associated with well-paying jobs? the insights gleaned from this line of inquiry have informed policies and strategies to address the needs of particular industries. less attention has been given to how the structural shifts of the new economy have influenced the workforce, including changing skill and education requirements. and while economic developers have be-come increasingly aware of the interconnections among education, workforce development, and economic growth, the tools and information sources that we use to shape our understanding of such forces are still mired in an industry-based mindset. this study takes a different approach to understanding the evolution of the Massachusetts economy and how this
20 MassBenchmarks 2012 • volume fourteen issue one
compares to the nation. specifically, we examine how the occupational mix of the commonwealth has changed in the new economy, and what this suggests about changes in the education and skill requirements of the 21st century workforce. this paper opens with a review of occupational growth in the commonwealth over the past 17 years — a period coinciding with the ascension of the new economy. We examine whether the new economy actually favors more science and technology-oriented occupations, as commonly assumed. the next section looks at growth among occupations with different levels of post-secondary education and occupation-relevant experience. We address whether growing occupations require more education and experience compared with declining or stagnant ones, and whether there is evidence of skills polarization — the bifurcation of high- and low-education jobs and the disappearance of mid-education jobs — in the Massachusetts labor force. in the final section, we consider differences in the specific skill sets of occupations that are growing, compared with those that are stagnant or in decline. (sidebar)
Trends in Occupational growth, 1990 to 2007over the past 17 years, the Massachusetts employed labor force expanded at a constant annual growth rate of .2%. this compares with the much higher national rate of 1.2%
The data fueling this analysis come from two primary sources. Estimates of employment by occupation come from the 5% Public Use Micro-sample (PUMS) files associated with the U.S. decennial censuses of 1990 and 2000 and the equivalent 3% PUMS file from the American Community Survey (ACS) covering 2006–08. PUMS is a representative sample of the entire population that includes highly detailed data on the primary occupations of the employed labor force. The unem-ployed or those out of the labor force are not included. Information about occupational characteristics comes from the Occupational Information Network (O*NET) database developed by the U.S. Department of Labor Employment and Training Administration. O*NET contains a wealth of information that can be used to profile occupations, everything from typical worker characteristics such as required or preferred worker abilities to common occupation-specific requirements such as the types of tools and
technologies frequently encountered by workers in each occupation.2 For this analysis we limit our attention to an examination of educational, experience, training, and skill requirements. While the combination of PUMS and O*NET provides a rich source of information on changing workforce requirements, they are subject to several limitations. Most importantly, O*NET data are only available from the mid-2000s onward. Therefore, we cannot examine changing job requirements within occupations, only whether the economy has shifted towards occupations requiring more education or experience according to recent standards.3 It should also be remembered that PUMS data are based on a national sample of the employed labor force and not a universal census. Estimates derived from PUMS are subject to a degree of sampling error and not reflective of the skill sets of either the unemployed or those who are not in the labor force.4
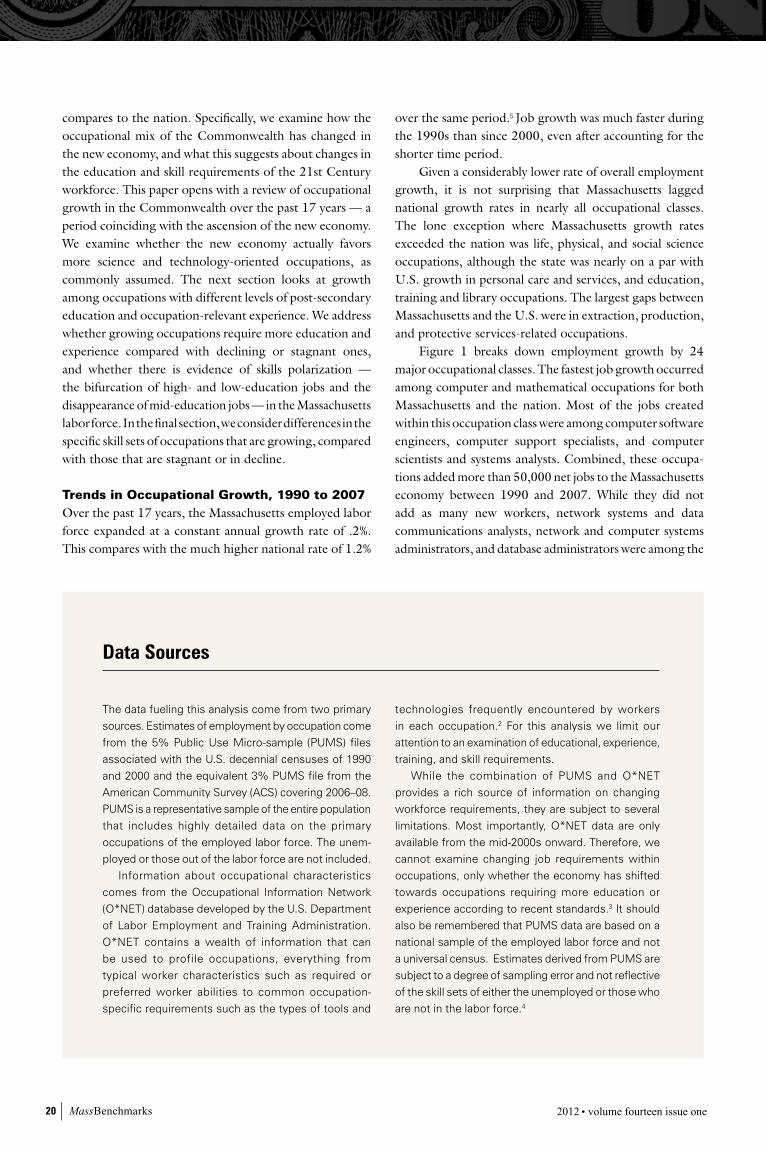
over the same period.5 Job growth was much faster during the 1990s than since 2000, even after accounting for the shorter time period. given a considerably lower rate of overall employment growth, it is not surprising that Massachusetts lagged national growth rates in nearly all occupational classes. the lone exception where Massachusetts growth rates exceeded the nation was life, physical, and social science occupations, although the state was nearly on a par with u.s. growth in personal care and services, and education, training and library occupations. the largest gaps between Massachusetts and the u.s. were in extraction, production, and protective services-related occupations. figure 1 breaks down employment growth by 24 major occupational classes. the fastest job growth occurred among computer and mathematical occupations for both Massachusetts and the nation. Most of the jobs created within this occupation class were among computer software engineers, computer support specialists, and computer scientists and systems analysts. combined, these occupa-tions added more than 50,000 net jobs to the Massachusetts economy between 1990 and 2007. While they did not add as many new workers, network systems and data communications analysts, network and computer systems administrators, and database administrators were among the
Data Sources
MassBenchmarks 2012 • volume fourteen issue one 21
fastest growing occupations. these gains were somewhat offset by a net decline of over 10,000 computer program-mers over the same period, reflecting the general shift of the industry toward digital-media and consumer and business services and the evolution of friendlier end-user software. following computer and mathematical occupations, the second fastest growing occupation class was personal care and services workers — a diverse collection that in-cludes expanding occupations such as personal care atten-dants, child care workers, and recreation and fitness workers. Education, training and library occupations were the third fastest growing class. growth within this class was dominated by the increasing number of teacher’s aides and, other teachers and instructors — a residual category of jobs that do not fit in standard teaching occupations. there was also relatively fast growth in special education and preschool/kindergarten teachers. Job losses in this occupational class were concentrated among librarians, library technicians, and archivists/curators. the fastest rates of job losses in Massachusetts occurred among extraction; farming, fishing and forestry; and pro-duction workers. continued job losses in production (i.e., manufacturing) is of particular concern because they still represent a large, but shrinking, portion of the state’s overall jobs base — roughly 5% in 2006/08, down from nearly
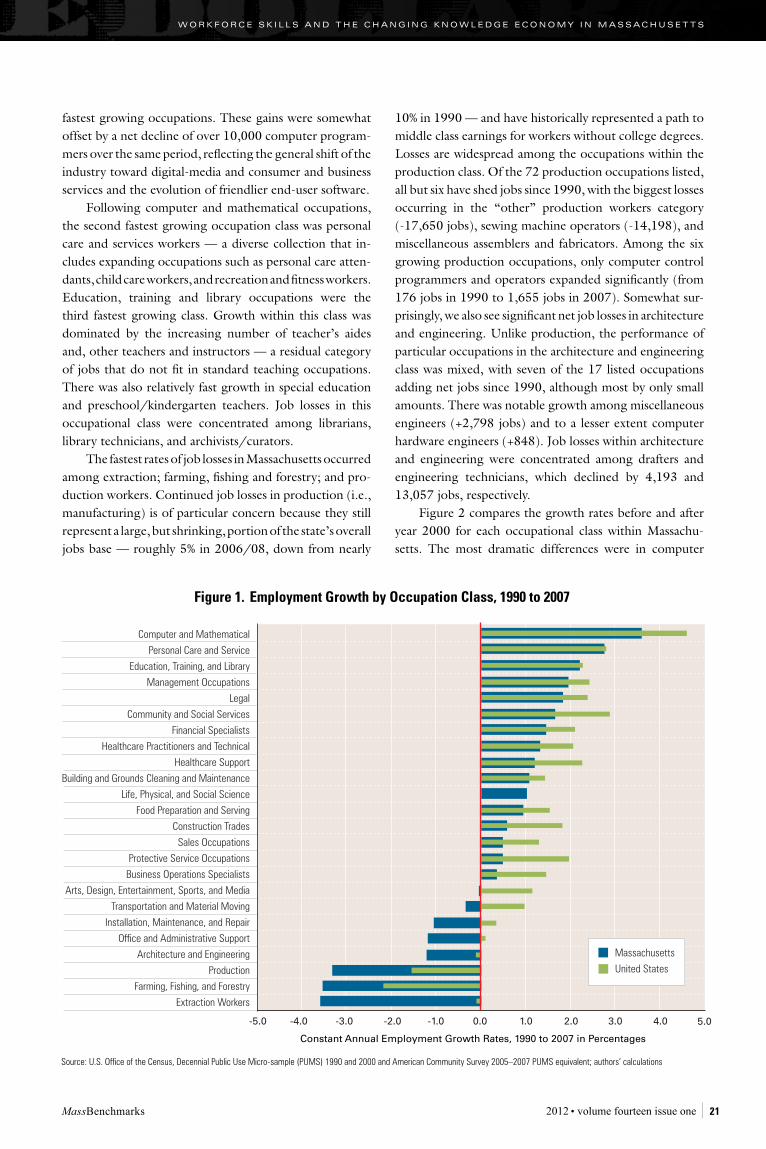
10% in 1990 — and have historically represented a path to middle class earnings for workers without college degrees. losses are widespread among the occupations within the production class. of the 72 production occupations listed, all but six have shed jobs since 1990, with the biggest losses occurring in the “other” production workers category (-17,650 jobs), sewing machine operators (-14,198), and miscellaneous assemblers and fabricators. among the six growing production occupations, only computer control programmers and operators expanded significantly (from 176 jobs in 1990 to 1,655 jobs in 2007). somewhat sur-prisingly, we also see significant net job losses in architecture and engineering. unlike production, the performance of particular occupations in the architecture and engineering class was mixed, with seven of the 17 listed occupations adding net jobs since 1990, although most by only small amounts. there was notable growth among miscellaneous engineers (+2,798 jobs) and to a lesser extent computer hardware engineers (+848). Job losses within architecture and engineering were concentrated among drafters and engineering technicians, which declined by 4,193 and 13,057 jobs, respectively. figure 2 compares the growth rates before and after year 2000 for each occupational class within Massachu-setts. the most dramatic differences were in computer
Source: U.S. Office of the Census, Decennial Public Use Micro-sample (PUMS) 1990 and 2000 and American Community Survey 2005–2007 PUMS equivalent; authors’ calculations
Figure 1. Employment Growth by Occupation Class, 1990 to 2007
w o r k f o r c e S k i l l S a n d T h e c h a n g i n g k n o w l e d g e e c o n o m y i n m a S S a c h u S e T T S
22 MassBenchmarks 2012 • volume fourteen issue one
and mathematical occupations, where nearly all of the employment gains during the past 17 years were made during the 1990s. in the years since 2000, computer and mathematical occupations have declined by roughly 1% per year. although far less dramatic, a similar trend is apparent among business operations specialists, which saw expansion in the 1990s and contraction since 2000. other occupational classes showing notably faster growth in the 1990s include management, legal, and community and social services. the pace of decline in production and installation, maintenance and repair occupations has also accelerated since 2000. (f2) the second fastest growing occupational class, personal care and services, shows the opposite trend of accelerated growth since 2000. growth in the number of personal and home care aides is driving much of this trend, reflecting the aging population and increasing preferences for out-patient care. other similarly situated occupational classes include: building and grounds cleaning and maintenance occupations; life, physical, and social science occupations; food preparation and serving; and construction trades — although construction occupations have been greatly affected by recent events such as the housing market bust
and offsetting economic stimulus-induced construction, neither of which is fully captured by our data. as mentioned previously, it is difficult to directly compare national and state growth rates of specific occu-pations because overall employment growth in Massachu-setts is far below national rates. figure 3 puts national and statewide occupational shifts in the labor force on more even ground by showing the percentage change in the share of each occupational class between 1990 and 2007. figure 3 also emphasizes structural changes in the compo-sition of the workforce relative to the nation. (f3) figure 3 provides further supporting evidence of a shifting Massachusetts economy that is evolving away from traditional production and distribution activities and toward service and knowledge-based occupations. More-over, Massachusetts has been outpacing the rest of the nation in this transition, as indicated by trends in bellwether knowledge occupations such as management, education, and computer and mathematical occupations, and greater relative losses in production. this shift does not purely favor high-tech over low-tech jobs, but also represents a shift upward within the corporate hierarchy favoring Massachusetts as a location
Source: U.S. Census, PUMS and ACS; authors’ calculations
Figure 2. Employment Growth by Occupation Class in Massachusetts, 1990 to 2000 vs. 2000 to 2007

MassBenchmarks 2012 • volume fourteen issue one 23
for corporate management and r&d functions. consider managerial occupations, which had the largest percentage increase in their share of the Massachusetts economy from 1990 (7.6%) to 2006/08 (9.9%). Within this broad occupational class, the fastest job growth was for computer and information systems managers followed by chief executives. contrast this with large relative losses in back-office and clerical functions and production. While this reflects the continued substitution of clerical and other routine office functions by personal computers and of pro-duction line jobs through automation, it is also consistent with globalizing trends leading to the spatial decoupling of production, back-office, customer support, r&d, and corporate headquarters. it is also consistent with growing numbers of new and small businesses, which typically have a higher ratio of owners/executives to employees.
Postsecondary Schooling and Experiencethus far, our findings are consistent with the conventional wisdom that the modern economy favors workers with higher levels of formal education. for both Massachusetts and the nation, the fastest growing occupations tend to be those associated with education-intensive fields such
as computers and education. However, it is worth exam-ining the relationship between educational requirements and occupational growth in further depth. first, broad occupation classes, such as management or production, hide considerable variation and typically include high education occupations alongside those with more modest educational requirements. Even jobs associated with science and technology do not necessarily require advanced degrees. consider the health industry, where some of the fastest-growing occupations are not Ph.ds or M.d.s but technicians, home health aides, and medical assistants — all which typically do not require a bachelor’s degree. a second issue is that formal schooling is not the only way to acquire the skills needed on the job. Past experience is also a form of education, in that it conditions how we acquire and apply new knowledge, and may be more or less highly valued than formal schooling, depending on the job. a final issue is whether more education is associated with faster job growth across the board, or whether there is a threshold after which the returns on additional schooling taper off. there may also be counterexamples of growing occupations that require little formal education, such as those in personal services and retail.
Source: U.S. Census, PUMS and ACS; authors’ calculations
Figure 3. Change in the Shares of Employment by Occupation Class, 1990 to 2007
w o r k f o r c e S k i l l S a n d T h e c h a n g i n g k n o w l e d g e e c o n o m y i n m a S S a c h u S e T T S

Source: U.S. Census, PUMS and ACS; Bureau of Labor Statistics Occupational Information Network (O*NET); authors’ calculations
Figure 4. Average Postsecondary Educational Requirements for Broad Occupational Classes
MassBenchmarks 2012 • volume fourteen issue one24
this section looks at distributional shifts among occupations with different education and experience requirements. for most every occupation, o*net provides estimates of the typical number of years of postsecondary schooling and related experience expected as a condition of hire.6 note that hiring expectations are not the same as requirements for an entry-level position. Many of the occupations listed in o*nEt (for example, chief execu-tives) are not entry-level positions. instead, these ratings reflect the expectations of employers when hiring workers in each occupation, regardless of whether it is an entry, intermediate, or senior level. figures 4 and 5 present the average levels of post-secondary schooling and experience requirements for occupations within each occupation class, ordered left to right from highest to lowest. We also include standard deviations to indicate the spread of requirements among the occupations classified within each class. life, physical, and social scientists and healthcare practitioners top the list in terms of postsecondary schooling, with respective aver-ages of 4.5 and 4.0 years (figure 4). However, occupa-tions within the healthcare practitioner class represent a far greater spread — ranging from podiatrists and physicians and surgeons requiring an average 8.7 years of postsec-
ondary education to emergency medical technicians/para-medics that typical require less than a year of postsecondary education. there is a secondary grouping of relatively high-education occupation classes requiring between 3.4 and 3.7 years of postsecondary schooling, including computer and mathematical; education, training, and library; community and social services; legal; and architecture and engineering. at the low end of the spectrum are extraction workers, food preparation and serving, production occupations, and con-struction trades, which typically require less than a half year of postsecondary education as a condition of hire. (f4) comparing experience to post-secondary education, we find similarities and differences in the relative rankings of occupations. Education and experience are related, but not the same, as evidenced by a moderate correlation coefficient of .51. using average occupational experience requirements as the barometer, we see architecture and engineering and management occupations moving to the top of the list from their former position in the upper-mid-dle tier under education. arts, design, entertainment and media occupations and construction trades workers have also moved much higher up in their relative rankings —requiring considerably more experience than formal education, per se. Healthcare practitioners have moved far

MassBenchmarks 2012 • volume fourteen issue one 25
Source: U.S. Census, PUMS and ACS; BLS O*NET; authors’ calculations
Figure 5. Average Experience Requirements for Broad Occupational Classes
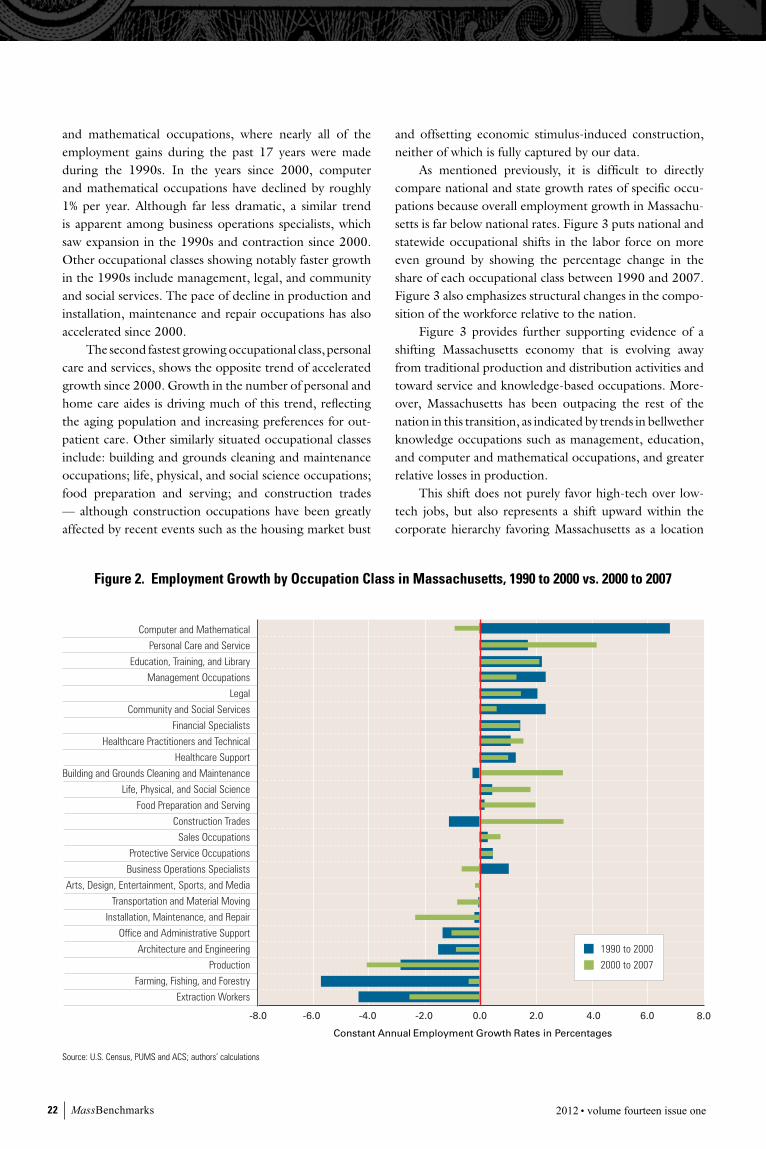
down on the list; in general, these occupations are charac-terized as requiring considerable schooling but only mod-est levels of relevant experience. this may be because of the recent upswing in demand for such jobs, or that their educational curriculum requires a strong residency or clin-ical component. aside from construction, most of occupa-tion classes found at the low-end of the experience spectrum also had fairly low education requirements, most notably food preparation and serving, personal care and service, extraction workers, and office and administrative support. to investigate structural changes in the occupational mix, we rank each occupation by its education and expe-rience requirements (horizontal axis) plotted against its percentage change in the share of employed labor force from 1990 to 2007 (vertical axis).7 figure 6 shows a major shift in the labor force toward occupations requiring more postsecondary schooling. occupational changes in the commonwealth largely mirror those for the nation, although the shift toward high-education occupations is much more dramatic in Massachusetts.8 occupations above the 75th percentile (i.e., requiring roughly three or more years of postsecondary schooling) clearly gained in their relative share of the workforce with expansion tapering among occupations above the 85th
percentile (just under four years of postsecondary school-ing). unlike the u.s., Massachusetts did not show any gains among occupations in the middle of the educational spectrum. However, there were slight gains among occu-pations requiring virtually no postsecondary schooling. this is consistent with a weak polarizing trend with con-siderable demand for highly educated workers and some growing demand in jobs lacking a formal education, although nearly all of these gains at the low end are attrib-utable to expansion in three occupations: cashiers, coun-ter attendants, and restaurant hosts and hostesses. grow-ing demand for low-education workers is not widespread beyond these three occupations. (f6) similar to education, recent changes in the Massachu-setts economy have also favored occupations requiring a high level of experience, with relative stability among low-experience positions (figure 7). likewise, the shift favoring high-experience jobs is even more profound in Massachu-setts than for the u.s. — consistent with the view of the state economy shifting toward higher-order managerial and r&d functions. but while the state economy has shifted toward more experienced positions, there were relatively fewer opportunities in entry level positions or among occupations requiring a modest degree of experience. (f7)
w o r k f o r c e S k i l l S a n d T h e c h a n g i n g k n o w l e d g e e c o n o m y i n m a S S a c h u S e T T S
MassBenchmarks 2012 • volume fourteen issue one26
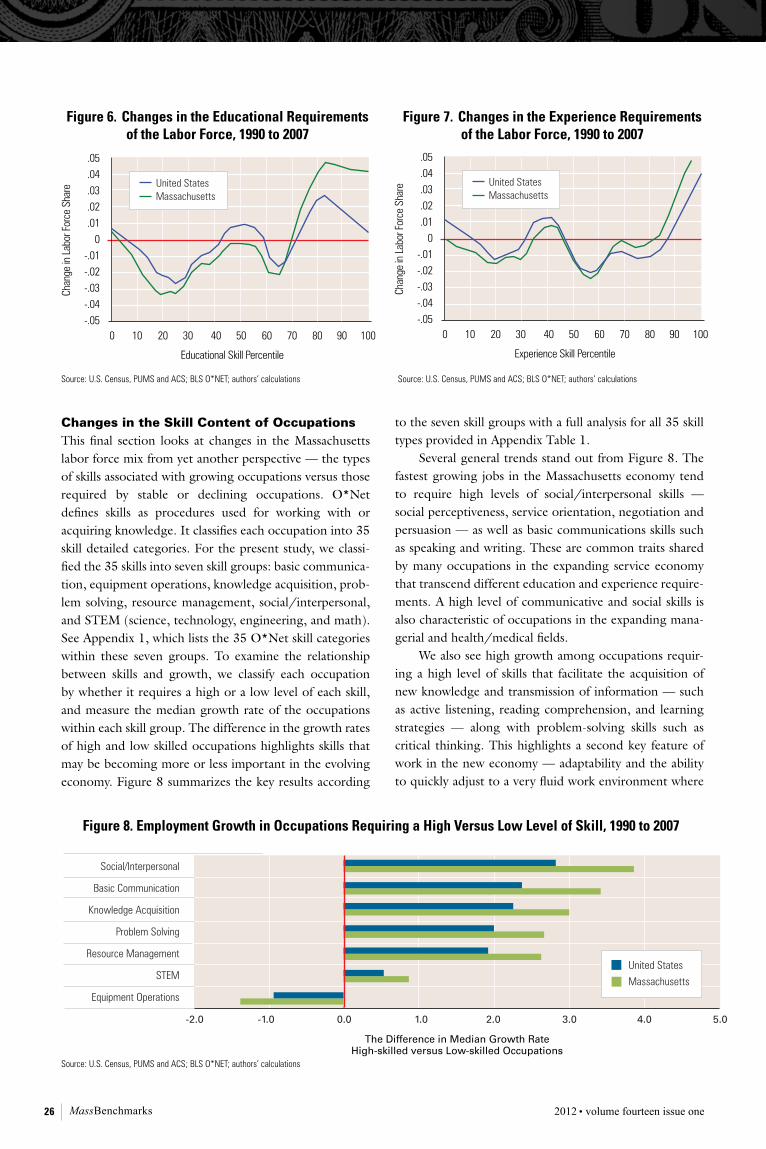
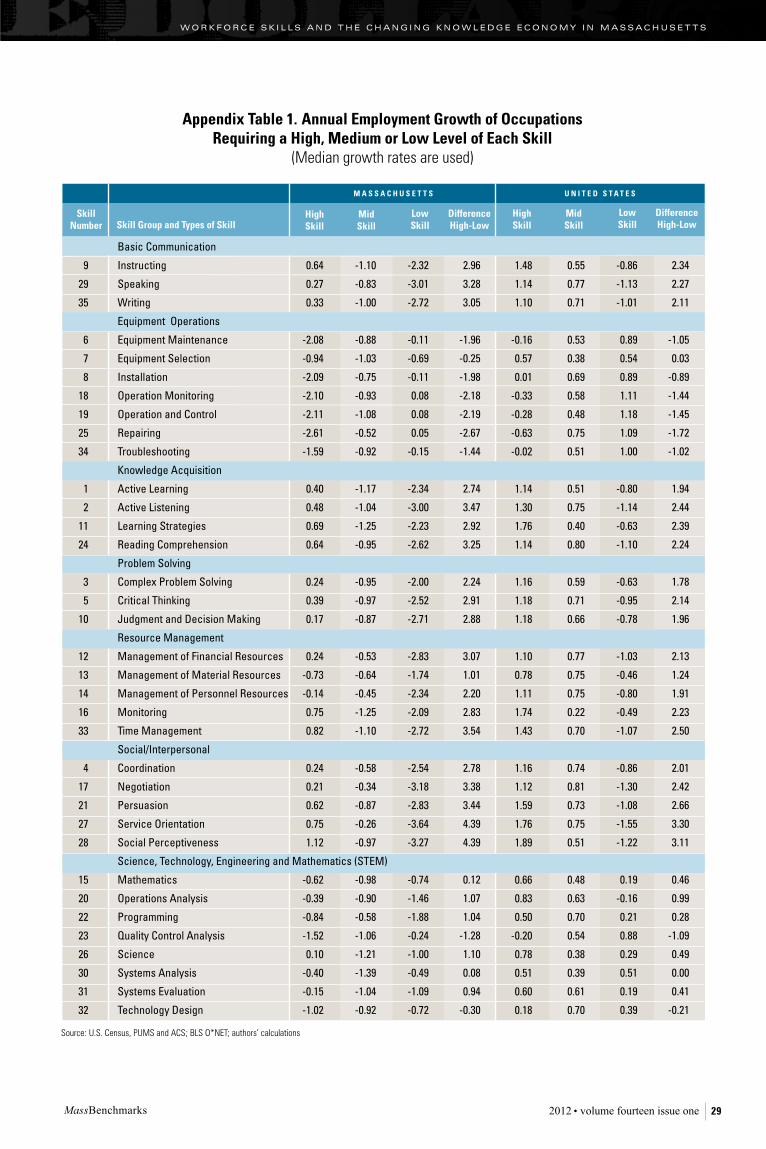
Changes in the Skill Content of Occupationsthis final section looks at changes in the Massachusetts labor force mix from yet another perspective — the types of skills associated with growing occupations versus those required by stable or declining occupations. o*net defines skills as procedures used for working with or acquiring knowledge. it classifies each occupation into 35 skill detailed categories. for the present study, we classi-fied the 35 skills into seven skill groups: basic communica-tion, equipment operations, knowledge acquisition, prob-lem solving, resource management, social/interpersonal, and stEM (science, technology, engineering, and math). see appendix 1, which lists the 35 o*net skill categories within these seven groups. to examine the relationship between skills and growth, we classify each occupation by whether it requires a high or a low level of each skill, and measure the median growth rate of the occupations within each skill group. the difference in the growth rates of high and low skilled occupations highlights skills that may be becoming more or less important in the evolving economy. figure 8 summarizes the key results according
to the seven skill groups with a full analysis for all 35 skill types provided in appendix table 1. several general trends stand out from figure 8. the fastest growing jobs in the Massachusetts economy tend to require high levels of social/interpersonal skills — social perceptiveness, service orientation, negotiation and persuasion — as well as basic communications skills such as speaking and writing. these are common traits shared by many occupations in the expanding service economy that transcend different education and experience require-ments. a high level of communicative and social skills is also characteristic of occupations in the expanding mana-gerial and health/medical fields. (f8) We also see high growth among occupations requir-ing a high level of skills that facilitate the acquisition of new knowledge and transmission of information — such as active listening, reading comprehension, and learning strategies — along with problem-solving skills such as critical thinking. this highlights a second key feature of work in the new economy — adaptability and the ability to quickly adjust to a very fluid work environment where
Source: U.S. Census, PUMS and ACS; BLS O*NET; authors’ calculations
Figure 6. Changes in the Educational Requirements of the Labor Force, 1990 to 2007
Source: U.S. Census, PUMS and ACS; BLS O*NET; authors’ calculations
Figure 7. Changes in the Experience Requirements of the Labor Force, 1990 to 2007
Source: U.S. Census, PUMS and ACS; BLS O*NET; authors’ calculations
Figure 8. Employment Growth in Occupations Requiring a High Versus Low Level of Skill, 1990 to 2007
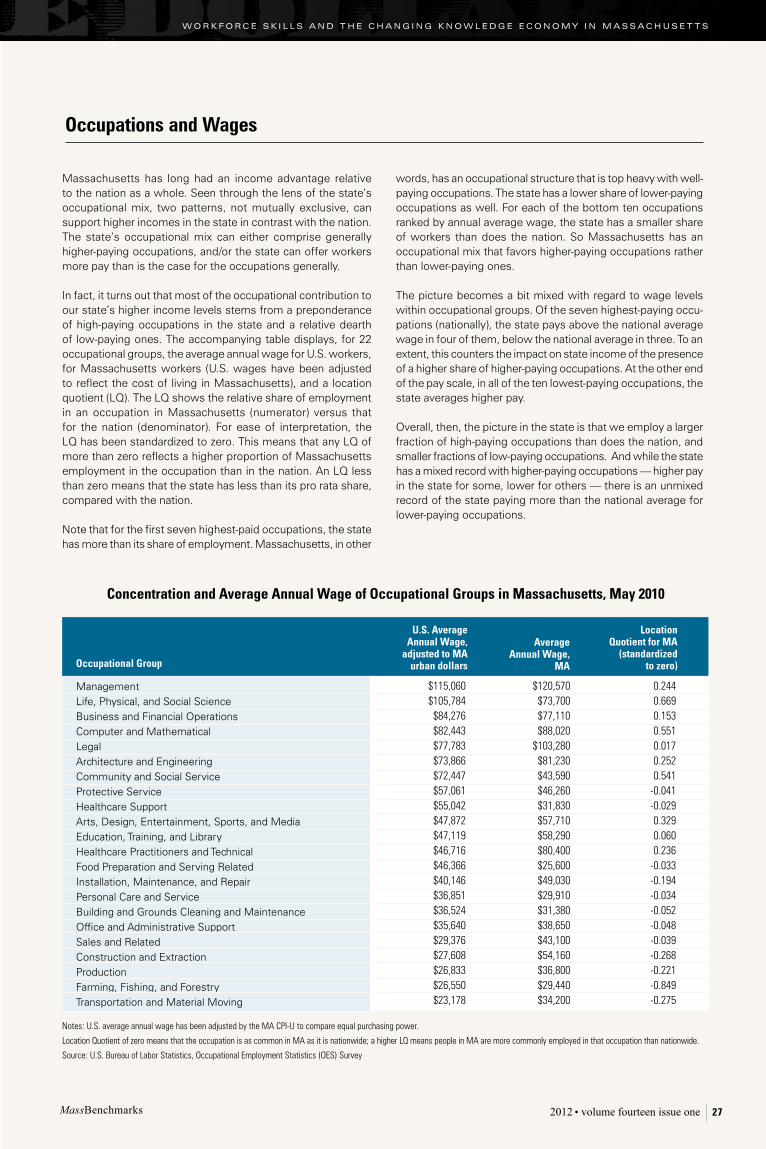
words, has an occupational structure that is top heavy with well-paying occupations. The state has a lower share of lower-paying occupations as well. For each of the bottom ten occupations ranked by annual average wage, the state has a smaller share of workers than does the nation. So Massachusetts has an occupational mix that favors higher-paying occupations rather than lower-paying ones.
The picture becomes a bit mixed with regard to wage levels within occupational groups. Of the seven highest-paying occu-pations (nationally), the state pays above the national average wage in four of them, below the national average in three. To an extent, this counters the impact on state income of the presence of a higher share of higher-paying occupations. At the other end of the pay scale, in all of the ten lowest-paying occupations, the state averages higher pay. Overall, then, the picture in the state is that we employ a larger fraction of high-paying occupations than does the nation, and smaller fractions of low-paying occupations. And while the state has a mixed record with higher-paying occupations — higher pay in the state for some, lower for others — there is an unmixed record of the state paying more than the national average for lower-paying occupations.
MassBenchmarks 2012 • volume fourteen issue one 27
Massachusetts has long had an income advantage relative to the nation as a whole. Seen through the lens of the state’s occupational mix, two patterns, not mutually exclusive, can support higher incomes in the state in contrast with the nation. The state’s occupational mix can either comprise generally higher-paying occupations, and/or the state can offer workers more pay than is the case for the occupations generally.
In fact, it turns out that most of the occupational contribution to our state’s higher income levels stems from a preponderance of high-paying occupations in the state and a relative dearth of low-paying ones. The accompanying table displays, for 22 occupational groups, the average annual wage for U.S. workers, for Massachusetts workers (U.S. wages have been adjusted to reflect the cost of living in Massachusetts), and a location quotient (LQ). The LQ shows the relative share of employment in an occupation in Massachusetts (numerator) versus that for the nation (denominator). For ease of interpretation, the LQ has been standardized to zero. This means that any LQ of more than zero reflects a higher proportion of Massachusetts employment in the occupation than in the nation. An LQ less than zero means that the state has less than its pro rata share, compared with the nation.
Note that for the first seven highest-paid occupations, the state has more than its share of employment. Massachusetts, in other
Management Life, Physical, and Social Science Business and Financial Operations Computer and Mathematical Legal Architecture and Engineering Community and Social Service Protective Service Healthcare Support Arts, Design, Entertainment, Sports, and Media Education, Training, and Library Healthcare Practitioners and Technical Food Preparation and Serving Related Installation, Maintenance, and Repair Personal Care and Service Building and Grounds Cleaning and Maintenance Office and Administrative Support Sales and Related Construction and Extraction Production Farming, Fishing, and Forestry Transportation and Material Moving
Occupations and Wages
Notes: U.S. average annual wage has been adjusted by the MA CPI-U to compare equal purchasing power.
Location Quotient of zero means that the occupation is as common in MA as it is nationwide; a higher LQ means people in MA are more commonly employed in that occupation than nationwide.
Source: U.S. Bureau of Labor Statistics, Occupational Employment Statistics (OES) Survey
Concentration and Average Annual Wage of Occupational Groups in Massachusetts, May 2010
Occupational Group
U.S. Average Annual Wage,
adjusted to MA urban dollars
$115,060$105,784$84,276$82,443$77,783$73,866$72,447$57,061$55,042$47,872$47,119$46,716$46,366$40,146$36,851$36,524$35,640$29,376$27,608$26,833$26,550$23,178
Average Annual Wage,
MA
$120,570$73,700$77,110$88,020
$103,280$81,230$43,590$46,260$31,830$57,710$58,290$80,400$25,600$49,030$29,910$31,380$38,650$43,100$54,160$36,800$29,440$34,200
Location Quotient for MA
(standardized to zero)
0.2440.6690.1530.5510.0170.2520.541
-0.041-0.0290.3290.0600.236
-0.033-0.194-0.034-0.052-0.048-0.039-0.268-0.221-0.849-0.275
w o r k f o r c e S k i l l S a n d T h e c h a n g i n g k n o w l e d g e e c o n o m y i n m a S S a c h u S e T T S
MassBenchmarks 2012 • volume fourteen issue one28
technology and competition are continually rewriting the rules of the game. time management skills also fit into the growing emphasis on adaptability, in that the increas-ing complexity of work requires the ability to rapidly shift focus and direct attention to new problems as they arise. occupations requiring a high level of skill in the oper-ation of equipment and machinery are on the wane. this includes skills traditionally associated with production occupations and skilled trades such as repairing, operation and control, operation monitoring, installation of equip-ment and maintenance. somewhat surprising, many of the hallmark skills associated strictly with science, technology and mathe-matics (stEM) occupations (e.g., science, programming, operations analysis, systems evaluation and mathemat-ics) have experienced little overall growth. in part, this is because many stEM-related occupations have witnessed relative decline over the study period, including econo-mists, astronomers and physicists, and mechanical and environmental engineers. these are balanced by many fast-growing occupations in stEM fields, namely in soft-ware, life sciences, and medicine. science and math skills also tend to be rather specialized, with relatively few occu-pations that require a high level of mastery. that means that the top 25th percentile of occupations requiring sci-ence and math skills is highly diverse, and includes not only the commonly associated stEM occupations such as biological technicians and software engineers, but more science-oriented occupations in farming, fishing, forestry, production, transportation and materials moving, and installation, maintenance, and repair. this is not to say that stEM skills are not important. While they may not have the fast growth associated with service-industry skills, scientific discoveries, and the cre-ation of new knowledge create a disproportionate share of regional wealth. However, for the labor market as a whole, the common denominator of growing occupa-tions is not their high science or math content, per se, but interpersonal and learning skills. in fact, key stEM occupations often require a high degree of social percep-tiveness, reading comprehension, time management and active learning, and critical thinking. national trends in changing skill requirements largely mirror Massachusetts, although the national patterns are more subtle. the commonwealth has seen larger dif-ferences between high- and low-skill growth across the board. in part, this is because the u.s. is larger and more diverse, thus muting some of the swing found in smaller and more specialized state economies. as shown previ-ously, the occupational structure of Massachusetts has also made a much more dramatic structural shift toward occupations requiring a higher formal educational and experience content than the nation. similarly, the relative
decline in equipment operations occupations has been far slower for the u.s. than in Massachusetts.
Summary and Conclusionsthis study documents changes in the Massachusetts labor force coinciding with the rise of the new economy. Mas-sachusetts has clearly become more knowledge- and tech-intensive over the past two decades — with fast-growing occupations in information technology, health care, and education. the economy has also become more service-oriented with considerable expansion in the number of managerial workers, and declining employment in pro-duction and back-office administrative workers. the Massachusetts workforce has also become consid-erably more education and experience intensive. changes in the u.s. occupation mix have clearly favored jobs requiring more education and experience, but in Massa-chusetts this shift has been more dramatic. additionally, there is some evidence of a mild polarization of skills in the job market, characterized by slight growth among jobs requiring very little postsecondary education or prior experience, such as cashiers, sales clerks, roofers, and con-struction laborers. although these jobs may require little formal education, they are difficult to automate or out-source because they involve nonroutine work tasks that are nontransferrable in that they often demand a physical presence or have a high tacit knowledge component that cannot be easily learned or taught from a distance. the primary lesson for policy makers is to understand that success in today’s workforce is both a technical and social enterprise. While most think of the new economy in terms of emerging technologies, the skills that are most highly associated with growing jobs are not purely science and math skills. rather it is the combination of social, communicative, and learning skills that appear to be driv-ing the growth of high-skilled occupations in manage-ment, healthcare, software development, and numerous other expanding fields. More than anything, the highly fluid landscape of the new economy favors adaptability. While science and innovation help create the new tech-nologies that give rise to new industries and transform the way we live and work, it is skills related to the acquisition, processing, and dissemination of new knowledge that condition our ability to effectively adapt to these changes. We need to nurture both to remain vital in the new global economy of the 21st century.
HENRY RENSKI is an assistant professor of Regional Planning in the Department of Landscape Architecture and Regional Planning at UMass Amherst.
RYAN WALLACE is a graduate student pursuing a PhD in Regional Planning in the Department of Landscape Architecture and Regional Planning at UMass Amherst.
MassBenchmarks 2012 • volume fourteen issue one 29
Appendix Table 1. Annual Employment Growth of Occupations Requiring a High, Medium or Low Level of Each Skill
(Median growth rates are used)
High SkillSkill Group and Types of Skill
M A S S A C H U S E T T S U N I T E D S T A T E S
Skill Number
Mid Skill
Low Skill
DifferenceHigh-Low
9
29
35
6
7
8
18
19
25
34
1
2
11
24
3
5
10
12
13
14
16
33
4
17
21
27
28
15
20
22
23
26
30
31
32
0.64
0.27
0.33
-2.08
-0.94
-2.09
-2.10
-2.11
-2.61
-1.59
0.40
0.48
0.69
0.64
0.24
0.39
0.17
0.24
-0.73
-0.14
0.75
0.82
0.24
0.21
0.62
0.75
1.12
-0.62
-0.39
-0.84
-1.52
0.10
-0.40
-0.15
-1.02
-1.10
-0.83
-1.00
-0.88
-1.03
-0.75
-0.93
-1.08
-0.52
-0.92
-1.17
-1.04
-1.25
-0.95
-0.95
-0.97
-0.87
-0.53
-0.64
-0.45
-1.25
-1.10
-0.58
-0.34
-0.87
-0.26
-0.97
-0.98
-0.90
-0.58
-1.06
-1.21
-1.39
-1.04
-0.92
-2.32
-3.01
-2.72
-0.11
-0.69
-0.11
0.08
0.08
0.05
-0.15
-2.34
-3.00
-2.23
-2.62
-2.00
-2.52
-2.71
-2.83
-1.74
-2.34
-2.09
-2.72
-2.54
-3.18
-2.83
-3.64
-3.27
-0.74
-1.46
-1.88
-0.24
-1.00
-0.49
-1.09
-0.72
2.96
3.28
3.05
-1.96
-0.25
-1.98
-2.18
-2.19
-2.67
-1.44
2.74
3.47
2.92
3.25
2.24
2.91
2.88
3.07
1.01
2.20
2.83
3.54
2.78
3.38
3.44
4.39
4.39
0.12
1.07
1.04
-1.28
1.10
0.08
0.94
-0.30
High Skill
Mid Skill
Low Skill
DifferenceHigh-Low
1.48
1.14
1.10
-0.16
0.57
0.01
-0.33
-0.28
-0.63
-0.02
1.14
1.30
1.76
1.14
1.16
1.18
1.18
1.10
0.78
1.11
1.74
1.43
1.16
1.12
1.59
1.76
1.89
0.66
0.83
0.50
-0.20
0.78
0.51
0.60
0.18
0.55
0.77
0.71
0.53
0.38
0.69
0.58
0.48
0.75
0.51
0.51
0.75
0.40
0.80
0.59
0.71
0.66
0.77
0.75
0.75
0.22
0.70
0.74
0.81
0.73
0.75
0.51
0.48
0.63
0.70
0.54
0.38
0.39
0.61
0.70
-0.86
-1.13
-1.01
0.89
0.54
0.89
1.11
1.18
1.09
1.00
-0.80
-1.14
-0.63
-1.10
-0.63
-0.95
-0.78
-1.03
-0.46
-0.80
-0.49
-1.07
-0.86
-1.30
-1.08
-1.55
-1.22
0.19
-0.16
0.21
0.88
0.29
0.51
0.19
0.39
2.34
2.27
2.11
-1.05
0.03
-0.89
-1.44
-1.45
-1.72
-1.02
1.94
2.44
2.39
2.24
1.78
2.14
1.96
2.13
1.24
1.91
2.23
2.50
2.01
2.42
2.66
3.30
3.11
0.46
0.99
0.28
-1.09
0.49
0.00
0.41
-0.21
Basic Communication
Instructing
Speaking
Writing
Equipment Operations
Equipment Maintenance
Equipment Selection
Installation
Operation Monitoring
Operation and Control
Repairing
Troubleshooting
Knowledge Acquisition
Active Learning
Active Listening
Learning Strategies
Reading Comprehension
Problem Solving
Complex Problem Solving
Critical Thinking
Judgment and Decision Making
Resource Management
Management of Financial Resources
Management of Material Resources
Management of Personnel Resources
Monitoring
Time Management
Social/Interpersonal
Coordination
Negotiation
Persuasion
Service Orientation
Social Perceptiveness
Science, Technology, Engineering and Mathematics (STEM)
Mathematics
Operations Analysis
Programming
Quality Control Analysis
Science
Systems Analysis
Systems Evaluation
Technology Design
w o r k f o r c e S k i l l S a n d T h e c h a n g i n g k n o w l e d g e e c o n o m y i n m a S S a c h u S e T T S
Source: U.S. Census, PUMS and ACS; BLS O*NET; authors’ calculations

MassBenchmarks 2012 • volume fourteen issue one30
Endnotes:
1.) http://www.kauffman.org/uploadedfiles/snei_2010_report.pdf.
2.) for more information on the o*nEt content model, please visit http://www.onetcenter.org/content.html.
3.) We measure occupational requirements using a version of o*net coinciding with the terminal year of our study period (o*nEt v. 11 released in 2006). as o*net is constantly being updated and expanded, more recent releases contain greater coverage of occu-pations than early models. the content model of o*nEt is also updated on a three-year rolling basis, meaning that the data included in the 2006 release reflect occupation skills measured between 2004 to 2006.
4.) also note that these ratings are based on a national sample and may not reflect state-specific occupational requirements, as would be the case if Massachusetts employers typically required more or less education for the same occupation than did other employers in the u.s.
5.) because of the different time spans between 1990 to 2000 and 2000 to 2007, we calculate annual growth rates as the implied annual rate, assuming that growth was constant over the study period.
the constant annual growth rate is calculated as where n is the number of annual intervals between the terminal period (t) and the base period (b). the advantage in calculating constant annual growth rates is that they can be directly compared between study periods of different lengths, whereas percentage change growth rates or annual average growth rates are dependent upon the length of the study period.
6.) o*net includes categorical measures of degree requirements (e.g., associates degree, bachelor’s degree), which we converted into equivalent years of postsecondary schooling by assuming typical years for completion. for example, associates degrees were assumed to be 2 years of postsecondary education, bachelor’s degrees require four years of postsecondary education, etc.
7.) the education, experience and training requirements are ranked as percentiles to space them evenly across the distribution, using a kernel-based weighted moving average that smooths over individual points and emphasizes the overall trend.
8.) although not shown, a breakdown of the study period into its 1990 to 2000 and 2000 to 2006/08 components shows that the same general pattern holds for both sub-periods, although the shifts toward education-biased occupations were faster during the 1990s.
,