WORK-LIFE BALANCE WHEN WORK MEETS HOME
16
International Journal of Business Management and Economic Review Vol. 4, No. 04; 2021 ISSN: 2581-4664 http://ijbmer.org/ Page 191 WORK-LIFE BALANCE WHEN WORK MEETS HOME Mrs Richa K Saxena* Assistant Professor – NMIMS Mumbai Campus Dr Shobha A Menon Principal – Valia College of Commerce, Mumbai http://doi.org/10.35409/IJBMER.2021.3293 ABSTRACT The COVID 19 pandemic forced a reset on work-life balance for employees across all sectors. For a large number of employees, working from home was a new experience. While many of them found WFH good for the work-life balance, others felt the lack of corporate culture while working at home. This study explored the demographic differences in the preferences people experienced towards WFH. The finding clearly exposed the line between gender preferences. While women prefer time with co-workers at the office, men are more likely to spend free time in recreational activities. People perceive that work efficiency is better in the office, and the future intention to WFH is not clearly formed. Keyword: COVID19, Work from home, Work-life Balance, Family, Intention to WFH. 1. INTRODUCTION Work from home is not a new phenomenon in many industries. For example, IT companies have been providing flexible timings and WFH facilities to their employees for years. However, in 2020, when the government imposed the lockdown due to COVID 19 outbreak, WFH was implemented in almost every industry. Indeed, it was a new experience even for the sectors extensively using the internet and online technology. Though this arrangement was convenient to manypeople, it has also led to the disruption in work-life balance. A report published by Kent University in the UK discussed how WFH had brought changes in the lifestyles of different demographics and life-cycle stages. While most of the people welcomed the WFH, they agreed to have faced challenges of work-life balance. Still, a recent survey conducted by Ernst & Yong revealed that 54% of the respondents prefer WFH post- pandemic (Bhattacharya, 2021). In the context of work-life balance, Tietze and Musson (2002) have studied the premise of “work time” and “ho me-time”. The core of work and life organisation lies in the clear distinction of both the timings (Tietze & Musson, 2002). This study has the following objectives: (1) Toexplore the ramification of WFH in an individual’s work and home life (2) To discuss the issues and challenges that emerged due to the new work environment and how it has affected genders and other demographics differently.
Transcript of WORK-LIFE BALANCE WHEN WORK MEETS HOME

International Journal of Business Management and Economic Review
Vol. 4, No. 04; 2021
ISSN: 2581-4664
http://ijbmer.org/ Page 191
WORK-LIFE BALANCE WHEN WORK MEETS HOME
Mrs Richa K Saxena*
Assistant Professor – NMIMS Mumbai Campus
Dr Shobha A Menon
Principal – Valia College of Commerce, Mumbai
http://doi.org/10.35409/IJBMER.2021.3293
ABSTRACT
The COVID 19 pandemic forced a reset on work-life balance for employees across all sectors.
For a large number of employees, working from home was a new experience. While many of
them found WFH good for the work-life balance, others felt the lack of corporate culture while
working at home. This study explored the demographic differences in the preferences people
experienced towards WFH. The finding clearly exposed the line between gender preferences.
While women prefer time with co-workers at the office, men are more likely to spend free time
in recreational activities. People perceive that work efficiency is better in the office, and the
future intention to WFH is not clearly formed.
Keyword: COVID19, Work from home, Work-life Balance, Family, Intention to WFH.
1. INTRODUCTION
Work from home is not a new phenomenon in many industries. For example, IT companies have
been providing flexible timings and WFH facilities to their employees for years. However, in
2020, when the government imposed the lockdown due to COVID 19 outbreak, WFH was
implemented in almost every industry. Indeed, it was a new experience even for the sectors
extensively using the internet and online technology. Though this arrangement was convenient to
manypeople, it has also led to the disruption in work-life balance.
A report published by Kent University in the UK discussed how WFH had brought changes in
the lifestyles of different demographics and life-cycle stages. While most of the people
welcomed the WFH, they agreed to have faced challenges of work-life balance. Still, a recent
survey conducted by Ernst & Yong revealed that 54% of the respondents prefer WFH post-
pandemic (Bhattacharya, 2021).
In the context of work-life balance, Tietze and Musson (2002) have studied the premise of “work
time” and “home-time”. The core of work and life organisation lies in the clear distinction of
both the timings (Tietze & Musson, 2002).
This study has the following objectives:
(1) Toexplore the ramification of WFH in an individual’s work and home life
(2) To discuss the issues and challenges that emerged due to the new work environment and
how it has affected genders and other demographics differently.

International Journal of Business Management and Economic Review
Vol. 4, No. 04; 2021
ISSN: 2581-4664
http://ijbmer.org/ Page 192
(3) To understand the intention to WFH in the future.
2. LITERATURE REVIEW
The available literature on WFH primarily covers two different issues. The first category
discussed people’s preference towards WFH,i.e., the advantages and disadvantages people
experienced. The second category discussed the increased burden on women due to the new
adjustments needed for WFH.
Purwanto et al. (2020) have identified that WFH helped people overcome several issues like
getting up early, grooming, travelling costs, traffic hassles, and non-flexible timings. Further,
people are happy to get time for family and recreation and the flexibility to work from anywhere.
Disadvantages include the lack of infrastructural facilities at home and added cost of electricity
and air conditioning. Research conducted on the employees of an IT firm in Indonesia revealed
that WFH has improved performance and has given people an opportunity to devote more time
to home (Tiroina & Mahdani, 2021). A study conducted by Hatayama, Viollaz, & Winkler
(2020), discussed the various amenability for WFH. Jobs requiring meeting people and technical
equipment are difficult to manage with online meetings and portable equipment. Internet
connection at home is also a significant concern(Hatayama et al., 2020).
A report published by the University of Kent highlighted the positive side of WFH as a
preference towards flexible working hours. At the same time, people miss interactions with their
colleagues and struggled with a lack of equipment and space (Chung, Seo, Forbes, & Birkett,
2020). A Price WaterhouseCooper’s report on the costs and benefits of WFH outlines that people
spent less time in traffic, which resulted in cost savings (Borggreven, 2020b). The negative side
of WFH was less collaboration amongst colleagues, low employee engagement, and employee
well-being(Borggreven, 2020a).
WFH literature significantly addressed the issue of gender inequality. For example, in a study
conducted in Iceland,Hjálmsdóttir and Bjarnadóttir(2021) pointed out that household chores are
primarily attributed to females. This is even true in a country that is considered to be a “paradise
for women”. WFH is difficult for parents with young children as other household responsibilities
disrupt work time. In addition, especially women have faced the mental stress of meeting the
work requirements while dealing with the young children seeking continuous attention. While
women tried to do their best, their mental state has been tired, frustrated and anxious. At the
same time, women are also responsible for keeping the mental and emotional well-being of the
family.
Further, Power (2020) highlighted how WFH had increased the burden on women. Working
women have been a part of the care economy (family needs), paid economy (professional needs)
and emotional economy (mental well-being needs). COVID 19 has increased the unpaid part of
the responsibilities and overlapped and overshadowed the paid one.
While people struggle with work-life balance issues, many companies are looking at a bright
future with WFH. Large technology firms like Google, SAP, Facebook and Accenture have
given their employees an option to WFH even with vaccination (ET Bureau, 2021). Amazon has
allowed its employees to WFH two days a week(ET Panache, 2021). In addition, more and more
International Journal of Business Management and Economic Review
Vol. 4, No. 04; 2021
ISSN: 2581-4664
http://ijbmer.org/ Page 193
people are refurbishing their homes to make them work-friendly.
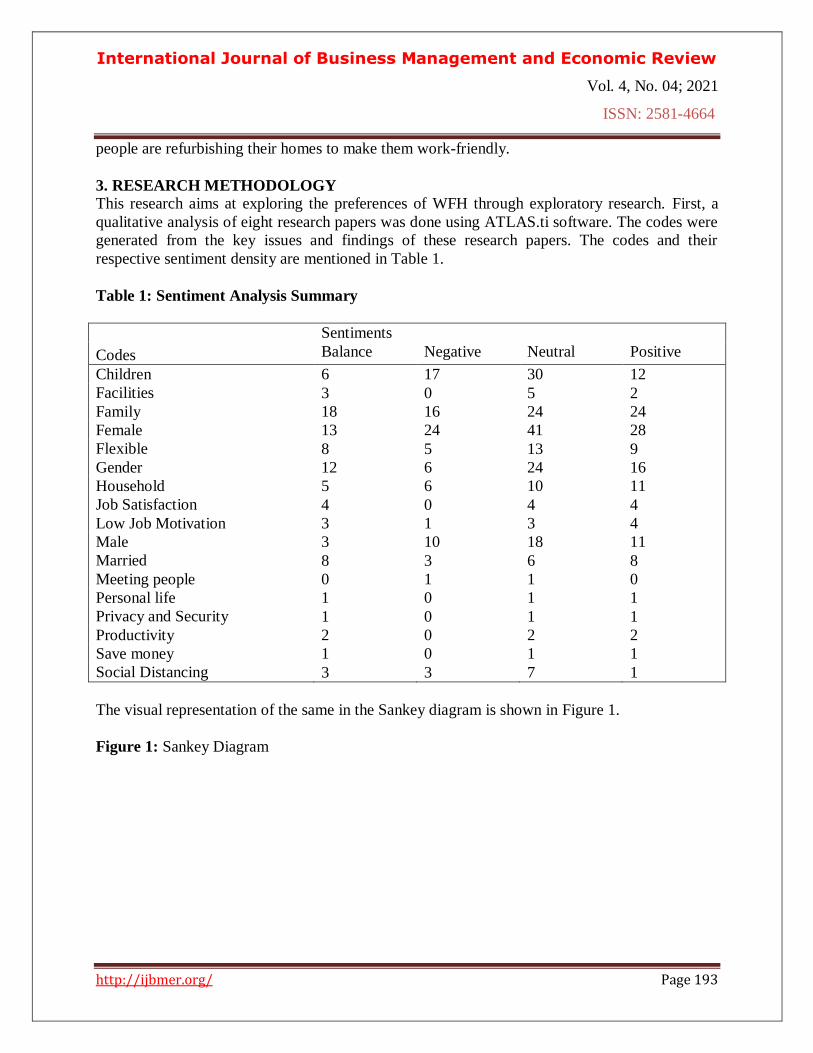
3. RESEARCH METHODOLOGY
This research aims at exploring the preferences of WFH through exploratory research. First, a
qualitative analysis of eight research papers was done using ATLAS.ti software. The codes were
generated from the key issues and findings of these research papers. The codes and their
respective sentiment density are mentioned in Table 1.
Table 1: Sentiment Analysis Summary
Codes
Sentiments
Balance Negative Neutral Positive
Children 6 17 30 12
Facilities 3 0 5 2
Family 18 16 24 24
Female 13 24 41 28
Flexible 8 5 13 9
Gender 12 6 24 16
Household 5 6 10 11
Job Satisfaction 4 0 4 4
Low Job Motivation 3 1 3 4
Male 3 10 18 11
Married 8 3 6 8
Meeting people 0 1 1 0
Personal life 1 0 1 1
Privacy and Security 1 0 1 1
Productivity 2 0 2 2
Save money 1 0 1 1
Social Distancing 3 3 7 1
The visual representation of the same in the Sankey diagram is shown in Figure 1.
Figure 1: Sankey Diagram

International Journal of Business Management and Economic Review
Vol. 4, No. 04; 2021
ISSN: 2581-4664
http://ijbmer.org/ Page 194
Source: Authors’ work using ATLAS.ti
Secondly, open-ended discussions with working professionals, self-employed, services
professionals and academicians were conducted.Finally, a list of tenfavourable and 14
unfavourable statements are created,as given in Table 2.
Table 2: Descriptive of Variables
Variable Description Mean Standard
Deviation
FAV1 Avoid travelling 3.45 1.199
FAV2 Availability of freshly cooked home food 3.36 1.300
FAV3 Flexible work schedule 3.34 1.310
FAV4 Quality time with family 3.75 1.081
FAV5 Others at home can help with work 2.13 1.102
FAV6 Can balance household chores along with work 3.17 1.223
FAV7 More time to socialise with friends 2.47 1.181
FAV8 Spare time to pursue hobbies 3.30 1.269
FAV9 Avoid interactions with co-workers 2.10 1.116
FAV0 Reduced expenses 3.71 1.129
UNFAV1 No office pranks and gossip 2.95 1.276
UNFAV2 No non-work conversations with colleagues 3.16 1.270
UNFAV3 Not able to supervise subordinates work 3.04 1.149
UNFAV4 Cannot meet external stakeholders for work 3.04 1.219
UNFAV5 The office environment is good for cross learnings 3.99 1.055

International Journal of Business Management and Economic Review
Vol. 4, No. 04; 2021
ISSN: 2581-4664
http://ijbmer.org/ Page 195
UNFAV6 Not able to meet and network with people 3.64 1.179
UNFAV7 Affects physical fitness 3.66 1.150
UNFAV8 No socialising and meeting friends 3.47 1.218
UNFAV9 No snacks/tea/coffee otherwise provided by the
employer
2.19 1.063
UNFAV10 No recreational facilities otherwise provided by the
employer
2.23 1.068
UNFAV11 Frequently distracted by background noises 3.33 1.261
UNFAV12 Poor internet stability/network issues 3.39 1.309
UNFAV13 More tiring due to longer working hours 3.54 1.236
UNFAV14 Family is around all the time 2.49 1.142
Further, the literature review and the interview process revealed that these differences were not
equally relevant for different demographics. Therefore, statistical analysis was conducted to
explore the differences amongst genders, marital status, age groups, people with or without
children, people living with the elderly, type of residence, family type, and sectors. Further, a
combination of these factors was also explored to understand their effect.
4. DATA COLLECTION
The responses were collected on favourable and unfavourable statements using a 5 point Likert
scalewhere 1-strongly disagree, 2-disagree, 3-neutral, 4-agree and 5-strongly agree(Vagias &
Wade, 2006). The respondents were also asked for their perception of efficiency when working
from the office against working at home. Finally, they were asked about their intention to work
from home. The data was collected using an online questionnaire from July 2020 to October
2020. The details of the responses are given in Table 3.
The preferences were tested for normality using Kolmogorov-Smirnov and Shapiro-Wilk tests.
Both tests showed p <0.001 for all the variables. Therefore, all variables are significantly non-
normal. Thus, for the hypothesis testing, non-parametric tests were used.
Table 3: Demographic and other Variables
Demographic Frequency Percent
Gender Male 75 56.0
Female 59 44.0
Age
21-30 83 61.9
31-40 27 20.1
41-50 20 14.9
above 50 4 3.0
Marital Status Single 73 54.5
Married 61 45.5
Children None 92 68.7
Yes 42 31.3

International Journal of Business Management and Economic Review
Vol. 4, No. 04; 2021
ISSN: 2581-4664
http://ijbmer.org/ Page 196
5. DATA ANALYSIS
First, the descriptive analysis was conducted using means and standard deviations. From Table 2,
it is evident that for the favourable statements, the highest agreement is with “quality time with
family” (mean=3.75), followed by “reduced expenses” (mean=3.71). These statements also have
the smallest variation amongst respondents. The least agreement is with the statements “avoid
interaction with co-workers” (mean=2.10) and “others at home can help with work”
(mean=2.13).“Flexible hours” and “availability of freshly cooked home food” have a relatively
high agreement but also has the highest variation. Figure 2 shows the visual representation of the
level of agreement for favourable statements.
For unfavourable statements, the highest agreement is for “office environment is good for cross
learnings” (mean=3.99).The second highest agreement is for the statement “affects physical
fitness” (mean=3.66). Both the statements also have small variations. The least agreement for
unfavourable statements is for “no snack/tea/coffee” (mean=2.19) and “no recreational facilities”
(2.23) otherwise provided by the employer. Figure 3 shows the visual representation of the level
of agreement with the unfavourable statements.
Elderly None 69 51.5
Yes 65 48.5
Residence
1RK 30 22.4
1BHK 40 29.9
2BHK 42 31.3
3BHK 22 16.4
Family
Alone 9 6.7
with friends 2 1.5
nuclear family 98 73.1
extended family 25 18.7
Sector
Corporate 91 67.9
Education 28 20.9
Self Employed 8 6.0
Government and Healthcare 7 5.2
Efficiency
Working from Office 78 58.2
Working from home 16 11.9
No difference 40 29.9
Intentions
Yes 25 18.7
No 33 24.6
May be 76 56.7

International Journal of Business Management and Economic Review
Vol. 4, No. 04; 2021
ISSN: 2581-4664
http://ijbmer.org/ Page 197
Figure 2: Level of Agreement for Favourable Statements
Source: Authors’ work using MS Excel
Figure 3: Level of Agreement for Unfavourable Statements
Source: Authors’ work using MS Excel
Next, the group difference analysis was conducted. Mann-Whitney test for 2-independent
samples was used to test the difference between the opinion of male and female respondents. As
-1.00
-0.80
-0.60
-0.40
-0.20
0.00
0.20
0.40
0.60
0.80
1.00
1
Leve
l of
Agr
eem
ent
Favourable Statements
FAV1
FAV4
FAV5
FAV6
FAV7
FAV8
FAV9
FAV10
FAV2
FAV3
-1.00
-0.80
-0.60
-0.40
-0.20
0.00
0.20
0.40
0.60
0.80
1.00
1.20
1
Leve
l of
Agr
eem
enr
Unfavourable Statements
UNFAV1
UNFAV4
UNFAV5
UNFAV6
UNFAV7
UNFAV8
UNFAV9
UNFAV10
UNFAV11
UNFAV12
UNFAV13
UNFAV14

International Journal of Business Management and Economic Review
Vol. 4, No. 04; 2021
ISSN: 2581-4664
http://ijbmer.org/ Page 198
shown in Table 4, four favourable statements and three unfavourable statements are significantly
different for male and female respondents at p < 0.05.
Table 4: Test Statistics for Gender Differences
Statements
Mann-
Whitney
U
Wilcoxon
W Z
Asymp.
Sig. (2-
tailed)
Mean Rank Inference
Male female
FAV2
1731.500 3501.500 -2.216 0.027 73.91 59.350
male respondents
agreed more than
female respondents
FAV4
1743.500 3513.500 -2.190 0.029 73.75 59.550
FAV7
1687.500 3457.500 -2.432 0.015 74.50 58.600
FAV8
1896.000 3666.000 -1.476 0.140 71.72 62.140
UNFAV5
1680.500 4530.500 -2.565 0.010 60.41 76.520
female respondents
agree more than male
respondents
UNFAV12
1644.500 4494.500 -2.621 0.009 59.93 77.130
UNFAV14
1540.000 4390.000 -3.119 0.002 58.53 78.900
a. Grouping Variable: Gender
Next, the test was run to identify significant differences in the responses of single and married
respondents. The significant statements are given in Table 5.
Table 5: Test Statistics for differences due to Martial Status
Statement
Mann-
Whitney
U
Wilcoxo
n W Z
Asymp.
Sig. (2-
tailed)
Mean Rank Inference
Male female
FAV2 1696.5 3526.5 -2.407 0.016 74.57 58.78
single respondents
agree more than
married respondents
FAV7
1608.5 3438.5 -2.828 0.005 75.76 57.31
FAV10 1683.5 3513.5 -2.501 0.012 74.75 58.56
UNFAV1
1951.5 3781.5 -1.230 0.218 71.13 63.03
a. Grouping Variable: Marital Status
Since the data consists of four age groups, K-means sample non-parametric test is used to test the
difference amongst age groups. Table 6 represents the statistics. Only one statement showed a
significant difference amongst the respondents.

International Journal of Business Management and Economic Review
Vol. 4, No. 04; 2021
ISSN: 2581-4664
http://ijbmer.org/ Page 199
Table 6: Test Statistics for Age Groups
Statement Kruskal-
Wallis H df
Asymp.
Sig.
Mean Rank
Inference 21-30
years
31-40
years
41-50
years
Above
50 years
FAV10 11.8095 3 0.008 75.14 51.5 64 34.38
21-30 agreed more,
and above 50 agreed
less than the rest
a. Kruskal Wallis Test
b. Grouping Variable: Age Groups
K-means sample is also used for differences in four categories of types of residents. Table 7
represents the test statistics for the same.
Table 7: Test Statistics for differences in residential status
Statements
Kruskal-
Wallis
H
df Asymp.
Sig.
Mean Rank
Inference 1RK 1BHK 2BHK 3BHK
FAV5
8.383 3 0.039 76.07 69.05 70.36 47.55
People living in 3BHK
agree less FAV9
9.158 3 0.027 74.83 72.23 68.81 46.41
UNFAV5 9.458 3 0.024 66.02 66.21 69.07 87.95 People living in 3BHK
agree more UNFAV6 11.364 3 0.010 59.73 66.19 61.8 91.36
a. Kruskal Wallis Test
b. Grouping Variable: RESIDENCE
Next, the analysis was done, creating different groups of males and female respondents, and 2-
sample mean the test was run to test the differences based on marital status. The results are
displayed in Table 8.
Table 8: Test Statistics for Marital Status * Gender
Statements Mean
Rank
Wilcoxon
W Z
Asymp.
Sig. (2-
tailed)
Mean Rank
Inferences Single
male
Married
male
FAV10 441.000 1107.000 -2.924 0.003 44.69 30.750
single male respondents
agree more than married
male respondents
a. GEN = 1 Male
b. Grouping Variable: MS
Statements
Mann-
Whitne
y U
Wilcoxon
W Z
Asymp.
Sig. (2-
tailed)
Single
female
Married
female Inferences

International Journal of Business Management and Economic Review
Vol. 4, No. 04; 2021
ISSN: 2581-4664
http://ijbmer.org/ Page 200
FAV7 265.500 565.500 -2.488 0.013 34.41 23.560 single female
respondents agree more
than married female
respondents
UNFAV10 291.000 591.000 -2.074 0.038 33.69 24.630
UNFAV12 273.500 573.500 -2.360 0.018 34.19 23.900
a. GEN = 2 Female
b. Grouping Variable: MS
Also, the analysis was done after grouping the data into marital statuses. The differences in male
and female responses were identified. The significant differences are given in Table 9.
Table 9: Test Statistics for Gender * Marital Status
Statements
Mann-
Whitney
U
Wilcoxon
W Z
Asymp.
Sig. (2-
tailed)
Mean Rank
Inferences Single
male
Single
Female
UNFAV12 390.000 1170.000 -3.262 0.001 30 45.86 single female
respondents agree
more than single male
respondents UNFAV14 490.500 1270.500 -2.142 0.032 32.58 42.99
a. MS = 1 Single
b. Grouping Variable: GEN
Mean Rank
Inferences Statements
Mann-
Whitney
U
Wilcoxon
W Z
Asymp.
Sig. (2-
tailed)
Marrie
d male
Married
female
FAV7 294.500 594.500 -2.168 0.030 34.32 24.77 married male
respondents agree
more than married
female respondents
FAV8 292.500 592.500 -2.210 0.027 34.38 24.69
UNFAV3 290.500 590.500 -2.220 0.026 34.43 24.6
a. MS = 2 Married
b. Grouping Variable: GEN
There is no significant difference identified in people’s responses with children or no children or
living or not living with the elderly. Next, the data for single and married male and female
respondents living with or without elderly was analysed. The significant differences are given in
Table 10.
Table 10 Test Statistics for Marital Status*Gender*Having Elderly or not
Statements
Mann-
Whitney
U
Wilcoxon
W Z
Asymp.
Sig. (2-
tailed)
Exact
Sig.
[2*(1-
tailed
Sig.)]
Mean Rank
Inferences No
Elderly
With
Elderly

International Journal of Business Management and Economic Review
Vol. 4, No. 04; 2021
ISSN: 2581-4664
http://ijbmer.org/ Page 201
FAV2 108.500 339.500 -2.387 0.017 0.022 16.17 24.47 Respondents
living with the
elderly agree
more than not
living with
elderly
FAV4 114.000 345.000 -2.212 0.027 0.035 16.43 24.17
FAV7 94.000 325.000 -2.794 0.005 0.007 15.48 25.28
UNFAV8 118.500 289.500 -2.061 0.039 0.046 23.36 16.08
a. MS = 1 Single, GEN = 1 Male
b. Grouping Variable: ELDERLY
FAV8 79 250 -2.529 0.011 0.014 22.35 13.89
Respondents
living with the
elderly agree
more than not
living with
elderly
a MS = 1 Single, GEN = 2 Female
b Grouping Variable: ELDERLY
UNFAV1 34 79 -2.071 0.038 0.048 8.78 14.17 Respondents not
living with the
elderly agree
more than not
living with
elderly UNFAV7 32 77 -2.214 0.027 0.035 8.56 14.87
a MS = 2 Married, GEN = 2 Female
b Grouping Variable: ELDERLY
Next is the people’s response to the statement compared between people living alone, with
family or friends. Test statistics are given in Table 11
Table 11: Test Statistics for Type of Family
Statements
Kruskal-
Wallis
H
df Asymp.
Sig.
Mean Rank
Inference Alone
with
friends
Nuclear
Family
Extended
Family
FAV6 11.1389 3 0.011 100.5 18.75 64.53 71.16 people living with
friends agree least
with the statement UNFAV13 11.8837 3 0.0078 28.39 98 70.85 66
a. Kruskal Wallis Test
b. Grouping Variable: FAMILY
Sector-wise comparison and the results are reflected in Table 12:

International Journal of Business Management and Economic Review
Vol. 4, No. 04; 2021
ISSN: 2581-4664
http://ijbmer.org/ Page 202
Table 12: Test Statistics for Sectors
Statements
Kruskal
-Wallis
H
df Asymp.
Sig.
Mean Rank
Inference Corporate
Academi
cs
Self-
employe
d
Public
Sector
FAV5 10.650 3 0.014 61.42 87.23 63.94 71.64
Academicians
agree more than
others
FAV6 8.847 3 0.031 61.68 79.04 94.19 66.5
Self-employed
and
academicians
agree more than
others
FAV10 8.919 3 0.030 71.38 49.98 68.44 86.07
Public sector
employees agree
most,
Academicians
agree least
UNFAV13 21.234 3 0.000 76.27 48.5 27.94 74.71
Public and
private sector
agree maximum,
self-employed
agreed least
a. Kruskal Wallis Test
b. Grouping Variable: SEC
Finally, the intention of the people to WFH in future was assessed. Figure 4 shows the visual
representation of people’s perception of the efficiency in work at home vs office. Clearly, people
felt that efficiencies are more at the office. Given that, people are not able to form the intention
to WFH. Figure 5 provides the visual representation of the intention to WFH.

International Journal of Business Management and Economic Review
Vol. 4, No. 04; 2021
ISSN: 2581-4664
http://ijbmer.org/ Page 203
Figure 4: Perception of Work Efficiency
Source: Authors’ work using MS Excel
Figure 5: Intention to WFH
Source: Authors’ work using MS Excel
6. FINDINGS AND DISCUSSIONS
The first discussion is about the difference of opinion between genders. Male respondents are
more inclined towards favourable statements. They get freshly home-cooked food, have time to
spend with family and friends, and pursue hobbies. Married males appear to like the latter two
more than married females. On the other hand, female respondents majorly agreed with
unfavourable statements being surrounded by family during work hours and are affected by poor
40
16
78
0 10 20 30 40 50 60 70 80 90
Frequency
Efficiency
When I work from office When I work from home There is no difference
0 10 20 30 40 50 60 70 80
No
May be
Yes
Intention to WFH

International Journal of Business Management and Economic Review
Vol. 4, No. 04; 2021
ISSN: 2581-4664
http://ijbmer.org/ Page 204
internet.
Moreover, female respondents missed the learning environment of the office. Evidently, these
differences are due to work plus home responsibilities for married female respondents even
during work hours. As a result, married female respondents did not get much time to socialise or
pursue anything else. However, the single female does agree that they got more time to interact
with friends than married women. Next, single male and female respondents liked getting freshly
cooked food, talking to friends, and reduced expenses than married men and women. However,
they also missed office gossips more than married ones. Also, single men liked the reduction in
expenses more than married men.
Single female respondents seem to miss office recreation and internet speed than married
women. Between single men and women, differences occur in two unfavourable statements –
internet facilities and being surrounded by family all the time. Evidently, female respondents are
affected more than male respondents. Married men disliked missing subordinates more than
married women.
Age groups wise analysis showed aged 21-30 years are most relieved due to reduction in
expenses, and 50 and above are least affected by such reduction. People living in big houses
(3BHK) seems to be preferring the office environment. They agreed more that they do not get to
explore cross-learning and cannot meet or network. Instead, they agree less with the statement
that people at home can be of any help. They preferred office interactions.
There are no significant differences found in the liking or disliking of people having or not
having children. However, single males living with the elderly agreed more on the availability of
freshly cooked home food and spare time for family and friends. On the other hand, single
female respondents liked that they get to pursue their hobbies due to the presence of the elderly
in the family. Also, single men not living with the elderly disliked not being able to socialise due
to lockdown. There is no significant difference found in the opinion of married men living or not
living with the elderly. However, married females not living with the elderly appear to be
missing office pranks. They also feel that their physical fitness is affected.
Next, people living with friends cannot balance work and household chores. On the contrary,
people living alone find work more tiring due to long hours. The academicians agreed that they
could get help from others and balance work and household chores. However, they do not agree
to have saved expenses. Self-employed also agreed to manage work-life better than other sectors
and disagree with having put more working hours. Public sector employees appear to be saving
expenses but are also putting in more working hours. The employees in the private sector also
feel that they are putting more hours into work.
Though people believe that it is more efficient to work from the office, they are not sure if they
want to go to the office in the future. Other than the advantages of WFH, safety from the
pandemic also can be the reason for the same.
The findings of this research direct towards a mixed arrangement that can create a balance
between work efficiencies and comfort of home, savings and overall well-being, post-pandemic.
Employers should consider providing flexibility to employees to WFH. In the cases where
physical meetings are necessary or specific equipment to be used, employees can work from the
office.
7. CONCLUSIONS AND LIMITATIONS
The findings of the paper revealed that the WFH has significantly distorted the work-life

International Journal of Business Management and Economic Review
Vol. 4, No. 04; 2021
ISSN: 2581-4664
http://ijbmer.org/ Page 205
balance. The issues related to gender disparities surfaced even with this small sample. While men
utilise more spare time in recreation, women have to prioritise their household liabilities, which
is difficult without support. Private and public sector employees see an increase in overall
working hours. This research could not find any implications due to the responsibilities of young
children. Also, there is no significant difference in the preference or intention to continue to
WFH across demographics.
REFERENCES
Bhattacharya, R. (2021). Even after Covid, most would prefer flexibility in work: EY Survey -
The Economic Times. Economic Times. Retrieved from
https://economictimes.indiatimes.com/jobs/post-covid-most-would-prefer-flexibility-in-
work/articleshow/83126513.cms
Borggreven, M. (2020a). The costs and benefits of working from home, Part II: The impact of
working from home on innovation, people engagement and well-being.
PricewaterhouseCoopers (PwC) BV (KvK 34180289), 1–11. Retrieved from
https://www.pwc.nl/nl/actueel-publicaties/assets/pdfs/pwc-the-costs-and-benefits-of-
working-from-home.pdf
Borggreven, M. (2020b). The costs and benefits of working from home.
PricewaterhouseCoopers (PwC) BV (KvK 34180289), 1–11. Retrieved from
https://www.pwc.nl/nl/actueel-publicaties/assets/pdfs/pwc-the-costs-and-benefits-of-
working-from-home.pdf
Chung, H., Seo, H., Forbes, S., & Birkett, O. (2020). Working From Home During The Covid-19
Lockdown: Changing Preferences And The Future of Work. University of Birmingham and
University of Kent.
ET Bureau, S. K. (2021, June 13). Increasing number of companies looking to shift permanently
to flexible, fully remote work model - The Economic Times. Economic Times. Retrieved
from https://economictimes.indiatimes.com/industry/services/property-/-
cstruction/increasing-number-of-companies-looking-to-shift-permanently-to-flexible-fully-
remote-work-model/articleshow/83476977.cms
ET Panache, A. (2021, June 11). Amazon allows employees to work from home 2 days a week -
The Economic Times. Retrieved June 15, 2021, from
https://economictimes.indiatimes.com/magazines/panache/amazon-allows-employees-to-
work-from-home-2-days-a-week/articleshow/83426358.cms
Hatayama, M., Viollaz, M., & Winkler, H. (2020). Jobs’ Amenability to Working from Home:
Evidence from Skills Surveys for 53 Countries. Jobs’ Amenability to Working from Home:
Evidence from Skills Surveys for 53 Countries. https://doi.org/10.1596/1813-9450-9241
Hjálmsdóttir, A., & Bjarnadóttir, V. S. (2021). “I have turned into a foreman here at home”:
Families and work–life balance in times of COVID‐19 in a gender equality paradise.
Gender, Work & Organisation. https://doi.org/10.1111/gwao.12552
Power, K. (2020). The COVID-19 pandemic has increased the care burden of women and
families. Sustainability: Science, Practice, and Policy, 16(1), 67–73.
https://doi.org/10.1080/15487733.2020.1776561
Tietze, S., & Musson, G. (2002). When ‘Work’ Meets ‘Home’: Temporal flexibility as lived
experience. Time & Society, 11(3), 315–334.

International Journal of Business Management and Economic Review
Vol. 4, No. 04; 2021
ISSN: 2581-4664
http://ijbmer.org/ Page 206
https://doi.org/10.1177/0961463X02011002008
Tiroina, S. De, & Mahdani, S. (2021). The Effect of Work From Home during the COVID19
Pandemic on Work-life Balance and its Impact on Employee Performance of Aceh
Communication, Informatics and Encoding Office, 4(02), 55–63.
Vagias, & Wade, M. (2006). Likert-type scale response anchors. Clemson International Institute
for Tourism and …, 3–4. https://doi.org/10.1525/auk.2008.125.1.225