Work in the Postindustrial Economy of California and OFER ...
29
work in the postindustrial economy 67 I in the nature of work. 1 The most striking of these is the ongoing shift from an econ- omy based on manufacturing to one based on services. The state of California is in many ways on the leading edge of these changes. According to the 2001–2002 California Workforce Survey (CWS), which is the empirical basis of this chapter, only 13 percent of Californians work for companies in manufacturing. 2 We have also seen striking changes in how work is organized. Scholars generally agree that from about 1950 until 1980, the American workplace operated under an implicit labor contract that granted core workers a certain degree of job and income security in exchange for allowing managers to control the firm (Osterman 1999; Harrison 1994). Firms rewarded workers’ loyalty with steady benefits and cost-of-liv- ing wage increases. During the 1970s slow economic growth, relatively high unem- ployment, and high inflation combined to produce a severe economic crisis in the United States. Scholars and policymakers began to argue that a weakening of mar- ket forces in product and labor markets was at least partly at the root of the down- turn. The basic public policy implication was that market deregulation would in- crease efficiency and stimulate economic growth. This view held sway and led to the deregulation of the trucking and airline industries. Later, the government deregu- lated the financial services, banking, telecommunications, and health care industries as well. The Reagan administration also challenged labor unions directly by decerti- fying the air traffic controllers’ union in 1981. This view of the cause of the economic crisis won out more generally in corporate America during the 1980s. The scholarly literature shows that the largest corporations began to embrace the idea that the central purpose of the firm was to maximize share- holder value, even at the expense of other stakeholders in the firm, namely, workers, communities, and oddly, customers (Fligstein 2001; Friedman 1985; Appelbaum and Work in the Postindustrial Economy of California NEIL FLIGSTEIN and OFER SHARONE 1. We would like to thank Ruth Milkman, Tom Piazza, and Margaret Weir for their comments on an earlier draft. 2. The 2001 Current Population Survey also reports that 13 percent of the California workforce is employed in manufacturing. For a more complete comparison of the survey with the CPS and the 2000 U.S. Census, see Piazza, Fligstein, and Weir (this volume). Labor-FO2.qxd 10/29/02 11:35 AM Page 67
Transcript of Work in the Postindustrial Economy of California and OFER ...
work in the postindustrial economy 67
I
in the nature of work.1 The most striking of these is the ongoing shift from an econ-
omy based on manufacturing to one based on services. The state of California is in
many ways on the leading edge of these changes. According to the 2001–2002
California Workforce Survey (CWS), which is the empirical basis of this chapter,
only 13 percent of Californians work for companies in manufacturing.2
We have also seen striking changes in how work is organized. Scholars generally
agree that from about 1950 until 1980, the American workplace operated under an
implicit labor contract that granted core workers a certain degree of job and income
security in exchange for allowing managers to control the firm (Osterman 1999;
Harrison 1994). Firms rewarded workers’ loyalty with steady benefits and cost-of-liv-
ing wage increases. During the 1970s slow economic growth, relatively high unem-
ployment, and high inflation combined to produce a severe economic crisis in the
United States. Scholars and policymakers began to argue that a weakening of mar-
ket forces in product and labor markets was at least partly at the root of the down-
turn. The basic public policy implication was that market deregulation would in-
crease efficiency and stimulate economic growth. This view held sway and led to the
deregulation of the trucking and airline industries. Later, the government deregu-
lated the financial services, banking, telecommunications, and health care industries
as well. The Reagan administration also challenged labor unions directly by decerti-
fying the air traffic controllers’ union in 1981.
This view of the cause of the economic crisis won out more generally in corporate
America during the 1980s. The scholarly literature shows that the largest corporations
began to embrace the idea that the central purpose of the firm was to maximize share-
holder value, even at the expense of other stakeholders in the firm, namely, workers,
communities, and oddly, customers (Fligstein 2001; Friedman 1985; Appelbaum and
Work in the Postindustrial
Economy of CaliforniaNEIL FLIGSTEIN
and OFER SHARONE
1. We would like to thank Ruth Milkman, Tom Piazza, and Margaret Weir for their comments on
an earlier draft.
2. The 2001 Current Population Survey also reports that 13 percent of the California workforce is
employed in manufacturing. For a more complete comparison of the survey with the CPS and
the 2000 U.S. Census, see Piazza, Fligstein, and Weir (this volume).
Labor-FO2.qxd 10/29/02 11:35 AM Page 67
Berg 1996). For employees the resulting corporate reorganizations often entailed
downsizing, layoffs, and cuts in benefits. Many firms also abandoned their American
manufacturing plants by either getting out of manufacturing altogether or moving
their production facilities offshore (Harrison and Bluestone 1988).
An important side effect of these changes was an increase in income inequality.
Numerous scholars have documented the fact that less skilled workers have fared
particularly poorly in this new economy (Freeman 1997; Blackburn, Bloom, and
Freeman 1990; Farber 1997). The number of workers who are members of unions has
also declined. Only 18 percent of the workers responding to the CWS were union-
ized, and many of them were in the public sector. Only 12 percent of the respondents
working in the private sector were unionized.
One of the most interesting issues raised in recent commentary is how these
changes have affected different types of workers. Some scholars (Bernhardt et al. 2001;
Pfeffer and Baron 1988) have argued that all workers, regardless of skill level, have fared
worse in the shareholder-value era. Schor (1992, 1998) found that all types of workers
have taken on more work hours, partly to meet the demands of their employers, but
also to make more money to consume more goods and services. Other scholars have
claimed that the new postindustrial economy has generously rewarded workers who
possess scarce skills, and that the growing income inequality stems more from rising in-
comes among the most highly skilled workers than from falling wages among the less
skilled (Katz and Murphy 1992; Levy and Murnane 1992). Osterman (1999) has argued
that both have happened. But as Blair and Kochan (2000) have asserted, the economy
may be providing inordinately good opportunities for those at the top of the occupa-
tional hierarchy and fewer opportunities for those at the bottom.
It is this last hypothesis that we explore in this chapter. Using the new estimates
available in the CWS, we find that there are good opportunities for income and satis-
fying work at the top of the occupational and skill distributions but few such oppor-
tunities at the bottom. Managers and professionals in California are doing extraordi-
narily well when it comes to opportunities to earn income. But they are also facing new
challenges in their jobs. Many of them report working long hours and being tied to
their cell phones and pagers after hours. Most managers and professionals like their
work and workplaces, but many are also having difficulties finding time for both work
and family. Some also report being under pressure to work long hours because of tight
deadlines and not having enough time to do all their work.
In contrast, clerical, sales, service, and blue-collar workers make much less money
but actually work fewer hours than their more skilled counterparts. In fact, many of
them wish they could have more hours of work to make more money. They are also
less likely to have benefits on the job and are more fearful of layoffs. The main ex-
ception to this is unionized workers, who, as we shall show, have higher pay, more
benefits, and greater job security.
Occupations and rewards in the California economy vary with gender, race, eth-
nicity, and nativity. Native-born Anglos top the income, education, and occupa-
the state of california labor / 200268
Labor-FO2.qxd 10/29/02 11:35 AM Page 68
tional hierarchies. African Americans have education levels similar to Anglos’, but
they are less apt to work in managerial or professional occupations, and they make
less income. U.S.-born Latinos have lesser educations than African Americans and
Anglos, lower level jobs, and less income. Foreign-born Latinos are at the bottom of
the educational, occupational, and income hierarchies. Asian immigrants, on the
other hand, have high levels of schooling, occupations, and income. Native-born
Asian respondents have high education levels but lower incomes and somewhat
lower occupations than Anglos. Women continue to be segregated in a few occupa-
tions and tend to work fewer hours and earn less money.
Indeed, the survey data offer a fascinating perspective on the postindustrial econ-
omy. For those with managerial and professional jobs, the economy is providing un-
precedented opportunities to make a living. But it is also pressuring those same peo-
ple to work harder for more hours and to be on call 24 hours a day, seven days a
week. For those with fewer skills, the economy offers jobs with less income, fewer
benefits, and fewer opportunities. Many of these lower level jobs are going to recent
immigrants who have limited education. Although the jobs may be better than the
alternatives the immigrants had in their home countries, the combination of declin-
ing wages and a rising cost of living is making it harder for them to make ends meet.
The one thing that does improve the working conditions of clerical, sales, service,
and blue-collar workers, is unionization. Our findings indicate that workers in
unions, even outside of the government, have higher incomes, more benefits, and
greater job security than their nonunion counterparts do.
A PORTRAIT OF CALI FOR N IA WOR KE R S
The CWS was designed to assess current work conditions in California. It yielded
data from 1,255 respondents, who participated in telephone interviews for the survey
between July 10, 2001 and January 27, 2002. Of the full sample, 911 were working at
the time of their interview. This subsample of employed respondents forms the basis
for our analysis in this chapter.3
Earnings, Education, and Workweeks
California workers in the survey had a mean income of $37,689 a year. Income var-
ied considerably across sociodemographic groups, however. Men averaged $43,299,
while women earned substantially less, averaging $31,605. This difference is statisti-
cally significant.4 Part of the gender gap is due to differences in hours worked. Women
worked 6.5 fewer hours per week than men did, on average, a statistically significant
Fligstein & Sharone / Work in the Post- Industrial Economy of California 69
3. For more details on the survey and its methodology, see Piazza, Fligstein, and Weir (this volume).
4. We use two types of significance tests, depending on the type of comparison that we are mak-
ing. We use a t-test if we want to compare the mean level of a variable across two groups. For
Labor-FO2.qxd 10/29/02 11:35 AM Page 69
difference. If one breaks down yearly earnings by hours of work, the largest discrep-
ancy between men and women appears among part-time workers. Whereas the earn-
ings of men and women who worked full-time exhibit a smaller gap, men who
worked part-time earned 25 percent more than women part-timers did.
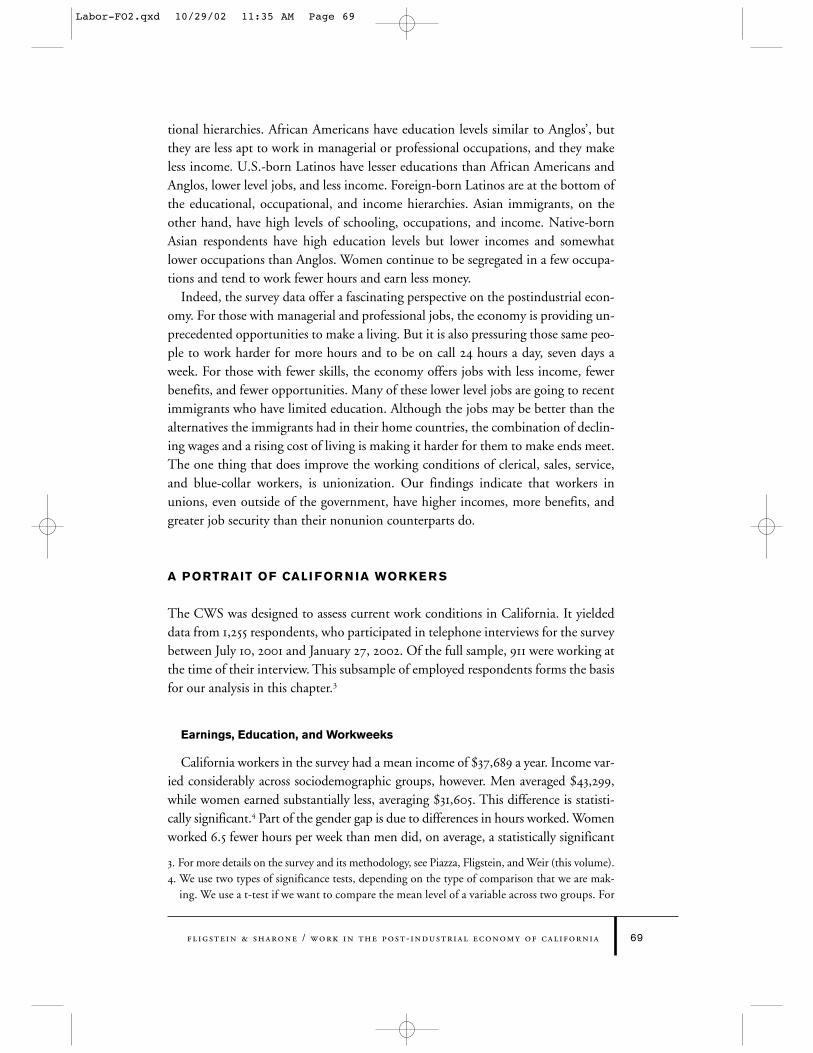
There are also striking racial and ethnic differences in earnings, as Figure 3.1 shows.
Anglos and foreign-born Asian workers earned the most, followed by U.S.-born
Asians, African Americans, and U.S.-born Latinos, with foreign-born Latinos at the
bottom. The U.S.-born Latino workers surveyed had average annual earnings of
$31,441, while foreign-born Latino workers averaged only $19,037, less than half the
average for Anglos, $45,726 a year. Although the lower earnings of Latino workers was
partly due to their lower average number of years of schooling (Figure 3.2), the esti-
mates also suggest that immigration status had important effects on earnings. Asian
workers (both foreign- and U.S.-born) tended to have high levels of schooling, and
they earned nearly as much as U.S.-born Anglos.5 African Americans had relatively
high levels of schooling and relatively low levels of income ($39,940). The income dif-
ferences among Anglos, African Americans, and Latinos are statistically significant. Figure 3.1 after here
Not surprisingly, because of their lower earnings, foreign-born Latino respondents
reported having much more trouble paying their monthly bills than any other group
(not shown here). When asked whether they had a problem paying their rent or
mortgage in the past year, 57 percent of these workers reported having a “very seri-
ous” or “moderately serious” problem, whereas the comparable figure for Anglos is
only 12 percent, a statistically significant difference. Figure 3.2 after here
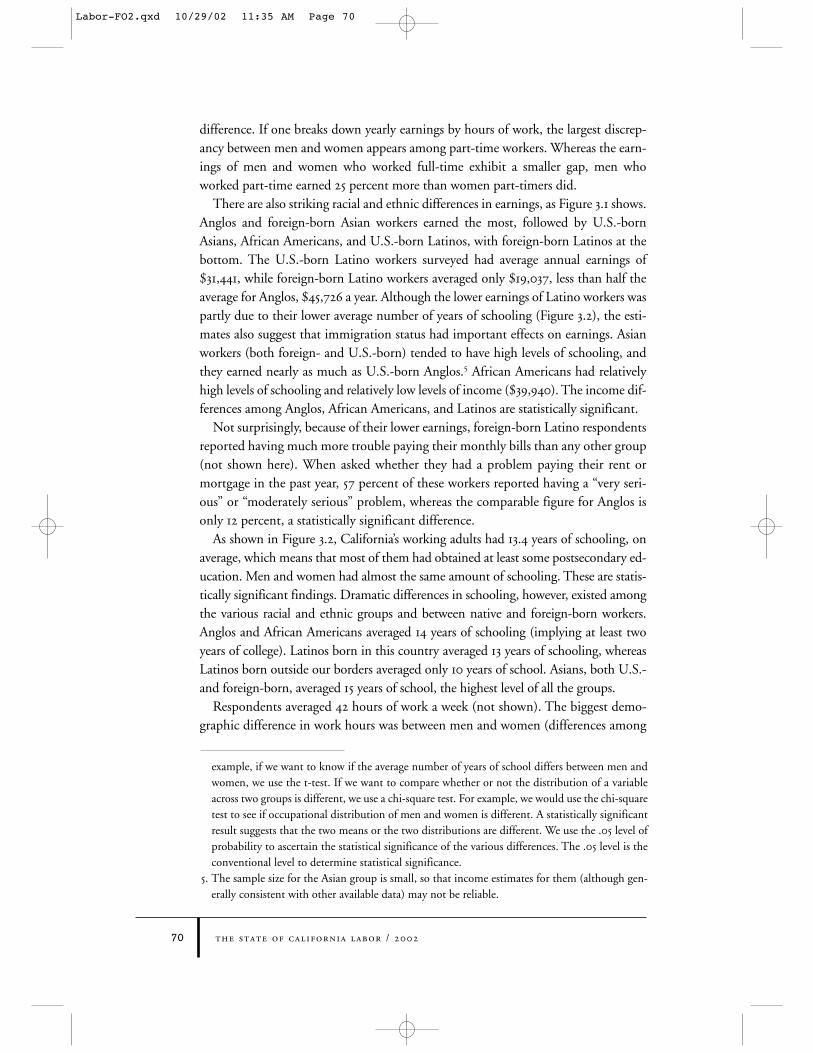
As shown in Figure 3.2, California’s working adults had 13.4 years of schooling, on
average, which means that most of them had obtained at least some postsecondary ed-
ucation. Men and women had almost the same amount of schooling. These are statis-
tically significant findings. Dramatic differences in schooling, however, existed among
the various racial and ethnic groups and between native and foreign-born workers.
Anglos and African Americans averaged 14 years of schooling (implying at least two
years of college). Latinos born in this country averaged 13 years of schooling, whereas
Latinos born outside our borders averaged only 10 years of school. Asians, both U.S.-
and foreign-born, averaged 15 years of school, the highest level of all the groups.
Respondents averaged 42 hours of work a week (not shown). The biggest demo-
graphic difference in work hours was between men and women (differences among
the state of california labor / 200270
example, if we want to know if the average number of years of school differs between men and
women, we use the t-test. If we want to compare whether or not the distribution of a variable
across two groups is different, we use a chi-square test. For example, we would use the chi-square
test to see if occupational distribution of men and women is different. A statistically significant
result suggests that the two means or the two distributions are different. We use the .05 level of
probability to ascertain the statistical significance of the various differences. The .05 level is the
conventional level to determine statistical significance.
5. The sample size for the Asian group is small, so that income estimates for them (although gen-
erally consistent with other available data) may not be reliable.
Labor-FO2.qxd 10/29/02 11:35 AM Page 70
Fligstein & Sharone / Work in the Post- Industrial Economy of California 71
types of occupations are discussed later). Women’s weekly hours worked averaged
about seven hours less than men’s. There were only slight differences, however, in
weekly hours worked among racial, ethnic, and nativity groups.
Occupations and Workplaces
Californians worked predominantly in government and nonmanufacturing pri-
vate sector jobs. The vast majority worked outside manufacturing: Only 9 percent
were service and blue-collar workers in manufacturing (not shown). Within the
full subsample, 8 percent were managers, 26 percent were professionals, 25 percent
Anglos AfricanAmericans
U.S-bornLatinos
Foreign-bornLatinos
U.S.-bornAsians
Foreign-bornAsians
16
10
6
12
14
8
4
2
0
Year
s of
Sch
oolin
g
Figure 3 .2 Respondents’ Mean Number of Years of Schooling,
by Race, Ethnicity, and Nativity
Anglos AfricanAmericans
U.S-bornLatinos
Foreign-bornLatinos
U.S.-bornAsians
Foreign-bornAsians
50,000
40,000
30,000
20,000
10,000
0
Mea
n A
nnua
l Inc
ome
(dol
lars
)
Figure 3 . 1 Respondents’ Mean Annual Income, by Race, Ethnicity,
and Nativity
Labor-FO2.qxd 10/29/02 11:35 AM Page 71
the state of california labor / 200272
were other white-collar workers, and 41 percent were service and blue-collar
workers.6
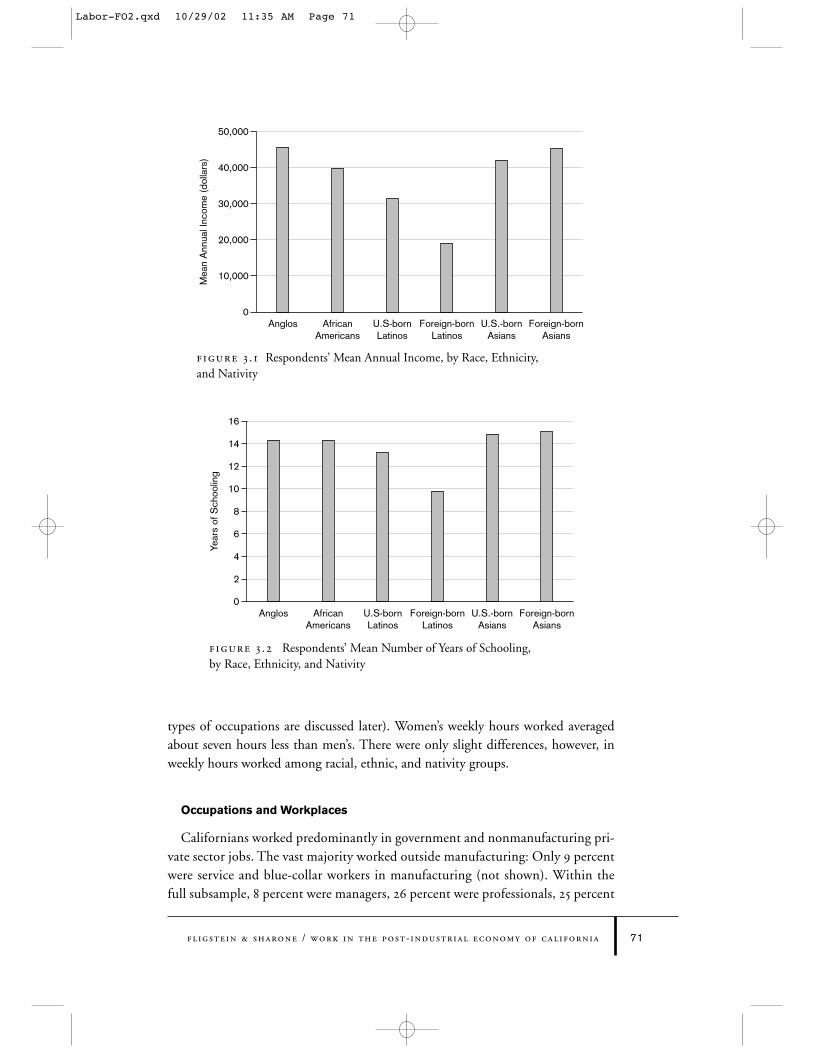
There were important differences in the types of jobs that various kinds of work-
ers held. Men were more likely than women to be managers and service and blue-col-
lar workers, while women were more likely to be professionals and other white-col-
lar workers (see Figure 3.3). This reflects the persistence of sex segregation in
occupations (see Reskin and Roos 1990). A large percentage of the women profes-
sionals were school teachers. Women also held a large share of clerical and sales jobs.
These differences are statistically significant. Figure 3.3 after here
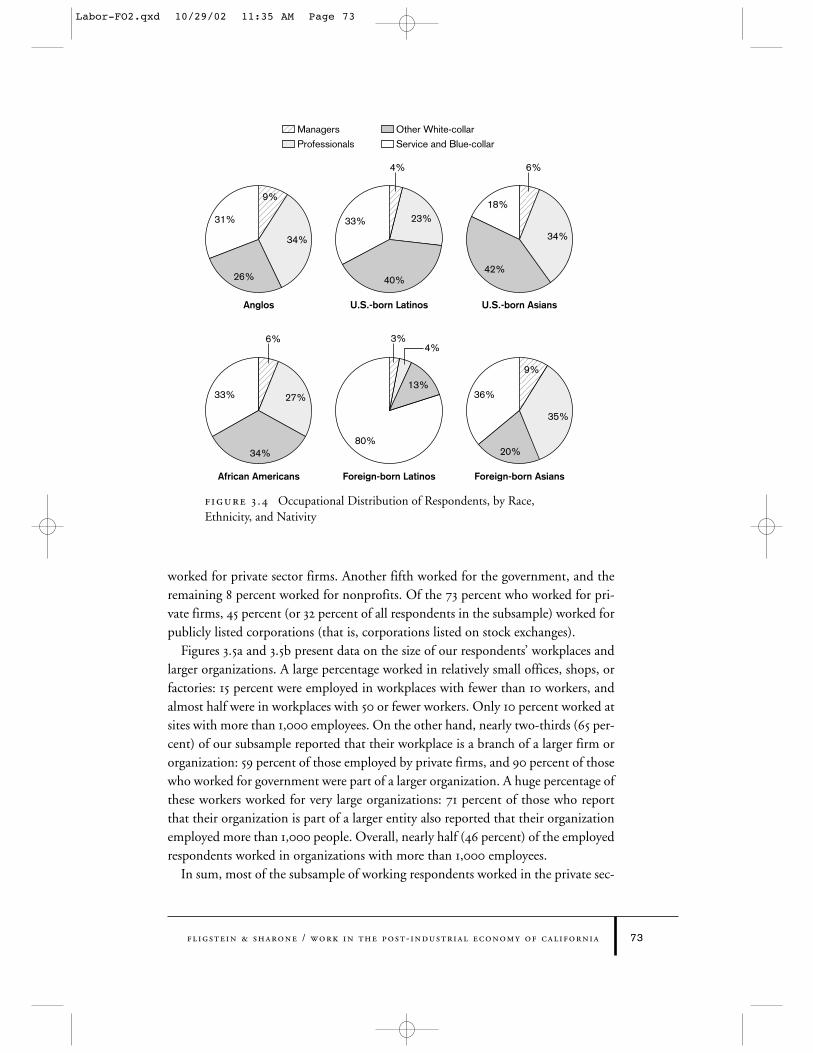
Figure 3.4 breaks down our four types of occupations by race, ethnicity, and nativ-
ity. African Americans were less likely to be managers and professionals than Anglos
and were more highly represented in the other white-collar and service and blue-collar
categories. Their lower earnings reported above reflect their occupational placement.
U.S.-born Latino respondents were most highly represented in the other white-collar
and service and blue-collar occupations, whereas 79 percent of foreign-born Latino re-
spondents had jobs in service and blue-collar occupations. Latinos’ overwhelming con-
centration in these poorly paid occupations is reflected in their low annual earnings.
Foreign-born Asian workers were similar to Anglos in their occupational distribution,
except for being a little more prevalent in the service and blue-collar category and a lit-
tle less prevalent in the other white-collar category. U.S.-born Asian workers are more
likely to be other white-collar and less likely to be service and blue-collar than their
Anglo counterparts are. All of these groups had occupational distributions that are sta-
tistically significantly different from that of Anglos.Figure 3.4 after here.
We have already noted that the California workers in the survey tended to work
in nonmanufacturing settings. Almost three-fourths of our respondents (73 percent)
Men Women
6%
30%
38%
26%
9%
23%
14%
54%
Other White-collarManagers
Professionals Service and Blue-collar
Figure 3 .3 Occupational Distribution
of Respondents, by Gender
6. See the Appendix for details on how we recoded major occupational groups to create four cate-
gories for types of occupations: managers, professionals, other white-collar workers (mainly cler-
ical and sales workers) and service and blue-collar workers.
Labor-FO2.qxd 10/29/02 11:35 AM Page 72
Fligstein & Sharone / Work in the Post- Industrial Economy of California 73
worked for private sector firms. Another fifth worked for the government, and the
remaining 8 percent worked for nonprofits. Of the 73 percent who worked for pri-
vate firms, 45 percent (or 32 percent of all respondents in the subsample) worked for
publicly listed corporations (that is, corporations listed on stock exchanges).
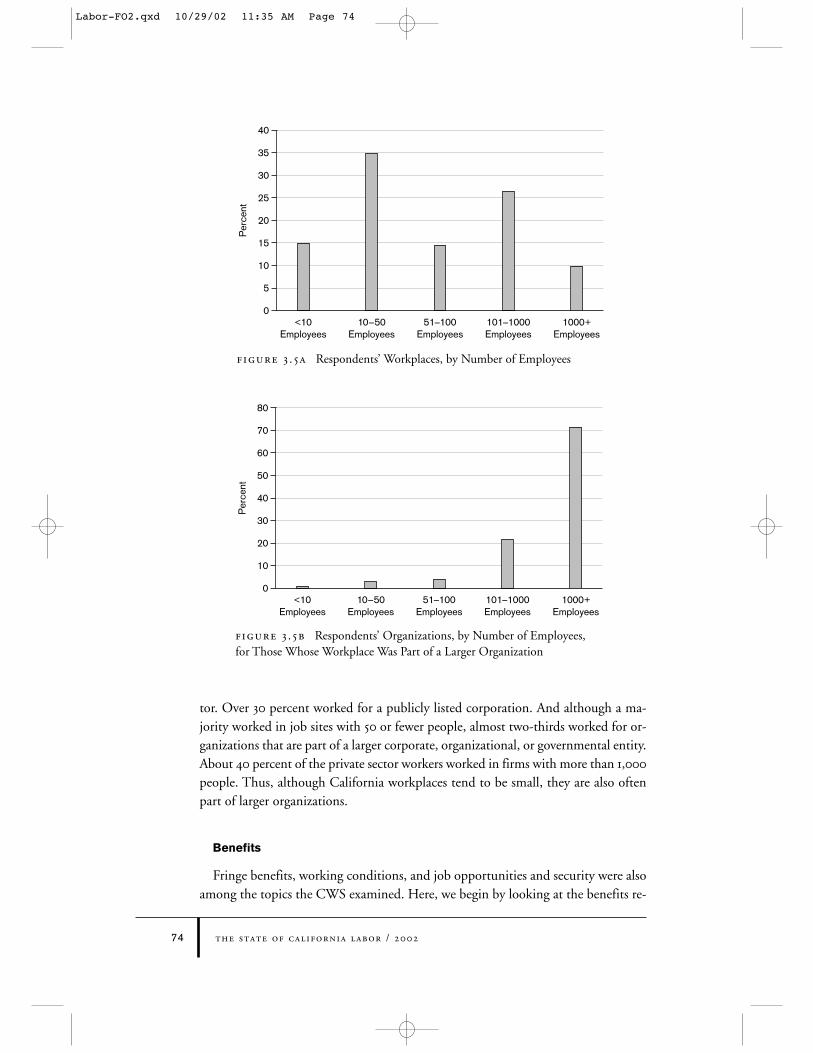
Figures 3.5a and 3.5b present data on the size of our respondents’ workplaces and
larger organizations. A large percentage worked in relatively small offices, shops, or
factories: 15 percent were employed in workplaces with fewer than 10 workers, and
almost half were in workplaces with 50 or fewer workers. Only 10 percent worked at
sites with more than 1,000 employees. On the other hand, nearly two-thirds (65 per-
cent) of our subsample reported that their workplace is a branch of a larger firm or
organization: 59 percent of those employed by private firms, and 90 percent of those
who worked for government were part of a larger organization. A huge percentage of
these workers worked for very large organizations: 71 percent of those who report
that their organization is part of a larger entity also reported that their organization
employed more than 1,000 people. Overall, nearly half (46 percent) of the employed
respondents worked in organizations with more than 1,000 employees. Figure 3.5 about here
In sum, most of the subsample of working respondents worked in the private sec-
Other White-collarManagers
Professionals Service and Blue-collar
African Americans
U.S.-born LatinosAnglos
Foreign-born Latinos Foreign-born Asians
U.S.-born Asians
4%
23%
40%
33%
9%
34%
26%
31%
3%4%
13%
80%
6%
6%
27%
34%
33%
9%
34%
42%
18%
35%
20%
36%
Figure 3 .4 Occupational Distribution of Respondents, by Race,
Ethnicity, and Nativity
Labor-FO2.qxd 10/29/02 11:35 AM Page 73
the state of california labor / 200274
tor. Over 30 percent worked for a publicly listed corporation. And although a ma-
jority worked in job sites with 50 or fewer people, almost two-thirds worked for or-
ganizations that are part of a larger corporate, organizational, or governmental entity.
About 40 percent of the private sector workers worked in firms with more than 1,000
people. Thus, although California workplaces tend to be small, they are also often
part of larger organizations.
Benefits
Fringe benefits, working conditions, and job opportunities and security were also
among the topics the CWS examined. Here, we begin by looking at the benefits re-
<10Employees
51–100Employees
101–1000Employees
40
25
15
30
35
20
10
5
0
Per
cent
1000+Employees
10–50Employees
Figure 3 . 5a Respondents’ Workplaces, by Number of Employees
80
50
30
60
70
40
20
10
0
Per
cent
1000+Employees
<10Employees
10–50Employees
51–100Employees
101–1000Employees
Figure 3 . 5b Respondents’ Organizations, by Number of Employees,
for Those Whose Workplace Was Part of a Larger Organization
Labor-FO2.qxd 10/29/02 11:35 AM Page 74
Fligstein & Sharone / Work in the Post- Industrial Economy of California 75
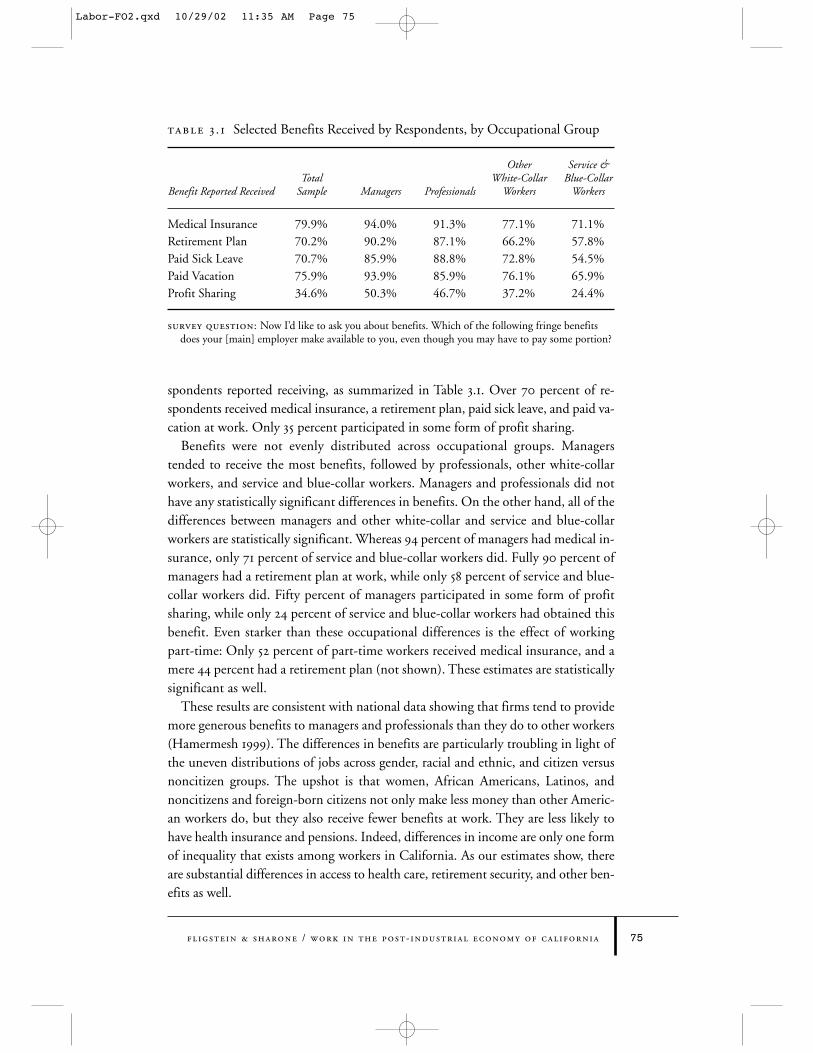
spondents reported receiving, as summarized in Table 3.1. Over 70 percent of re-
spondents received medical insurance, a retirement plan, paid sick leave, and paid va-
cation at work. Only 35 percent participated in some form of profit sharing.
Benefits were not evenly distributed across occupational groups. Managers
tended to receive the most benefits, followed by professionals, other white-collar
workers, and service and blue-collar workers. Managers and professionals did not
have any statistically significant differences in benefits. On the other hand, all of the
differences between managers and other white-collar and service and blue-collar
workers are statistically significant. Whereas 94 percent of managers had medical in-
surance, only 71 percent of service and blue-collar workers did. Fully 90 percent of
managers had a retirement plan at work, while only 58 percent of service and blue-
collar workers did. Fifty percent of managers participated in some form of profit
sharing, while only 24 percent of service and blue-collar workers had obtained this
benefit. Even starker than these occupational differences is the effect of working
part-time: Only 52 percent of part-time workers received medical insurance, and a
mere 44 percent had a retirement plan (not shown). These estimates are statistically
significant as well.Table 3.1 after here
These results are consistent with national data showing that firms tend to provide
more generous benefits to managers and professionals than they do to other workers
(Hamermesh 1999). The differences in benefits are particularly troubling in light of
the uneven distributions of jobs across gender, racial and ethnic, and citizen versus
noncitizen groups. The upshot is that women, African Americans, Latinos, and
noncitizens and foreign-born citizens not only make less money than other Americ-
an workers do, but they also receive fewer benefits at work. They are less likely to
have health insurance and pensions. Indeed, differences in income are only one form
of inequality that exists among workers in California. As our estimates show, there
are substantial differences in access to health care, retirement security, and other ben-
efits as well.
Table 3 . 1 Selected Benefits Received by Respondents, by Occupational Group
Other Service & Total White-Collar Blue-Collar
Benefit Reported Received Sample Managers Professionals Workers Workers
Medical Insurance 79.9% 94.0% 91.3% 77.1% 71.1%Retirement Plan 70.2% 90.2% 87.1% 66.2% 57.8%Paid Sick Leave 70.7% 85.9% 88.8% 72.8% 54.5%Paid Vacation 75.9% 93.9% 85.9% 76.1% 65.9%Profit Sharing 34.6% 50.3% 46.7% 37.2% 24.4%
SURVEY QUESTION: Now I’d like to ask you about benefits. Which of the following fringe benefitsdoes your [main] employer make available to you, even though you may have to pay some portion?
Labor-FO2.qxd 10/29/02 11:35 AM Page 75
the state of california labor / 200276
Hours of Work and Overtime
As we pointed out earlier, on the whole, managers and professionals are doing
quite well in the postindustrial economy. The earnings and benefits data confirm this
view. But managers and professionals are also more likely to be feeling pressured be-
cause of long workweeks and after-hours obligations to their workplace. Ironically,
at the same time, other white-collar workers, as well as service and blue-collar work-
ers, are experiencing a dearth in hours of work.
Among survey respondents, 88 percent of managers, 70 percent of professionals,
42 percent of other white-collar workers, and 21 percent of service and blue-collar
workers are salaried for part or all of their income (not shown). Most managers and
professionals do not receive extra pay for overtime, whereas most other white-collar
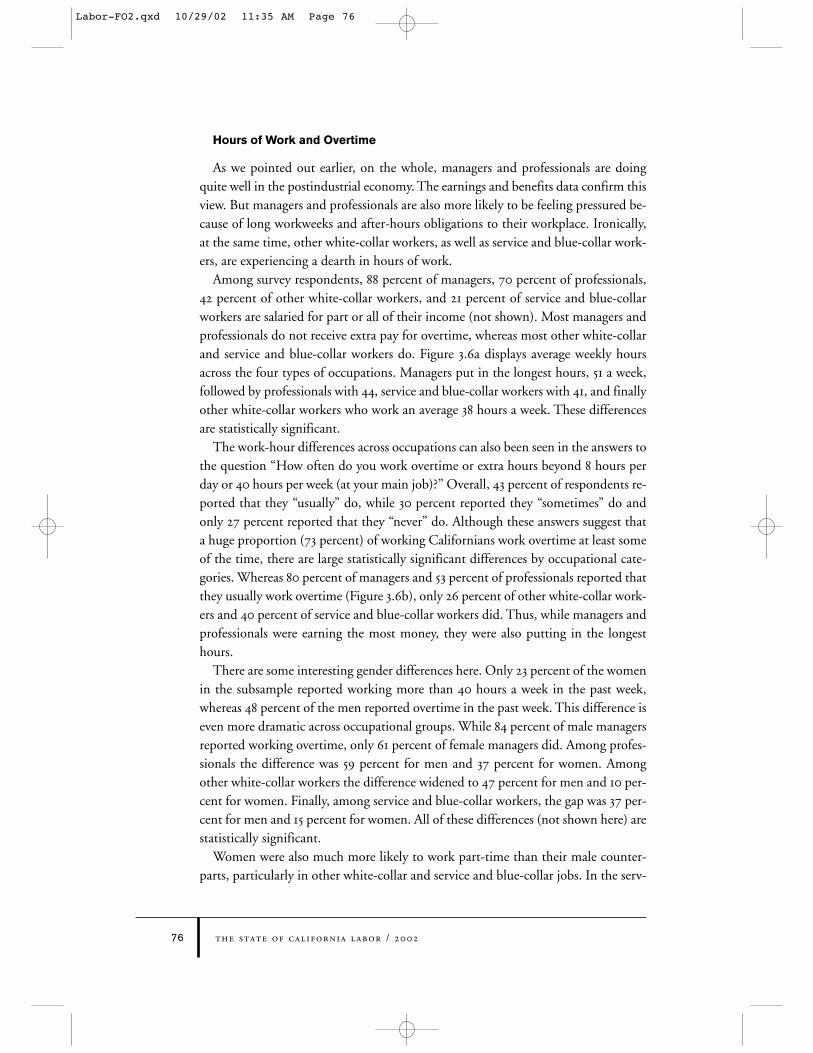
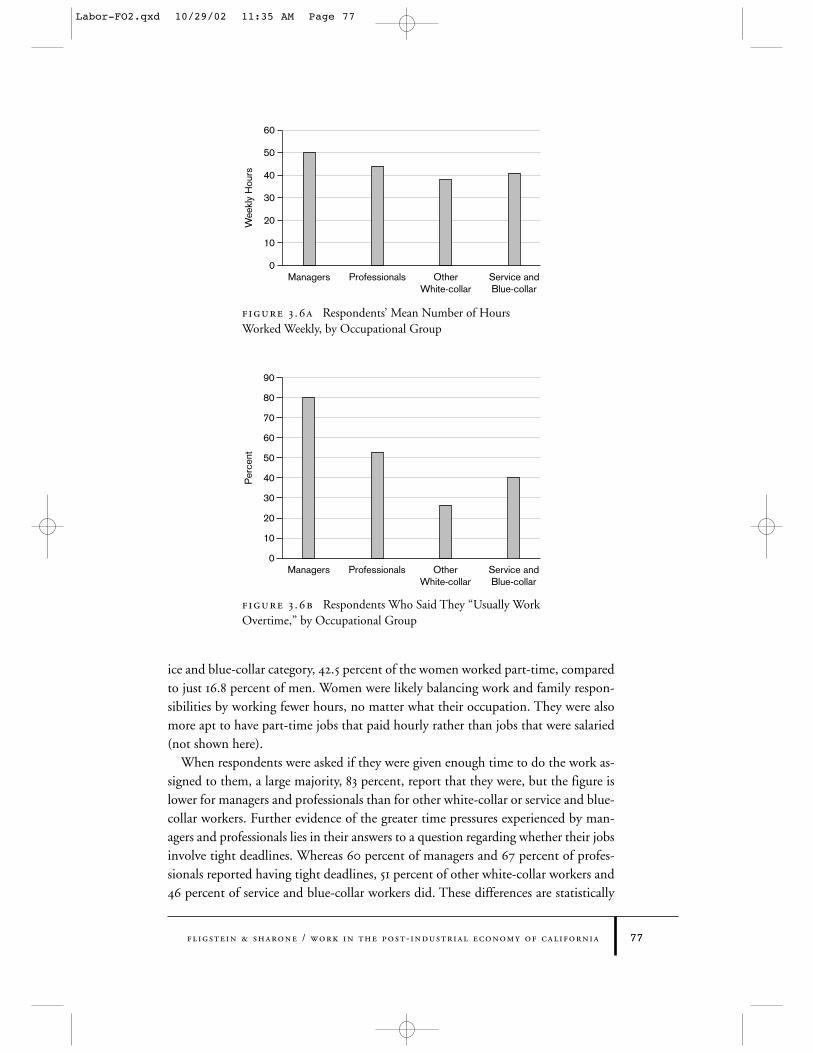
and service and blue-collar workers do. Figure 3.6a displays average weekly hours
across the four types of occupations. Managers put in the longest hours, 51 a week,
followed by professionals with 44, service and blue-collar workers with 41, and finally
other white-collar workers who work an average 38 hours a week. These differences
are statistically significant. Figure 3.6a after here
The work-hour differences across occupations can also been seen in the answers to
the question “How often do you work overtime or extra hours beyond 8 hours per
day or 40 hours per week (at your main job)?” Overall, 43 percent of respondents re-
ported that they “usually” do, while 30 percent reported they “sometimes” do and
only 27 percent reported that they “never” do. Although these answers suggest that
a huge proportion (73 percent) of working Californians work overtime at least some
of the time, there are large statistically significant differences by occupational cate-
gories. Whereas 80 percent of managers and 53 percent of professionals reported that
they usually work overtime (Figure 3.6b), only 26 percent of other white-collar work-
ers and 40 percent of service and blue-collar workers did. Thus, while managers and
professionals were earning the most money, they were also putting in the longest
hours. Figure 3.6b after here
There are some interesting gender differences here. Only 23 percent of the women
in the subsample reported working more than 40 hours a week in the past week,
whereas 48 percent of the men reported overtime in the past week. This difference is
even more dramatic across occupational groups. While 84 percent of male managers
reported working overtime, only 61 percent of female managers did. Among profes-
sionals the difference was 59 percent for men and 37 percent for women. Among
other white-collar workers the difference widened to 47 percent for men and 10 per-
cent for women. Finally, among service and blue-collar workers, the gap was 37 per-
cent for men and 15 percent for women. All of these differences (not shown here) are
statistically significant.
Women were also much more likely to work part-time than their male counter-
parts, particularly in other white-collar and service and blue-collar jobs. In the serv-
Labor-FO2.qxd 10/29/02 11:35 AM Page 76
Fligstein & Sharone / Work in the Post- Industrial Economy of California 77
ice and blue-collar category, 42.5 percent of the women worked part-time, compared
to just 16.8 percent of men. Women were likely balancing work and family respon-
sibilities by working fewer hours, no matter what their occupation. They were also
more apt to have part-time jobs that paid hourly rather than jobs that were salaried
(not shown here).
When respondents were asked if they were given enough time to do the work as-
signed to them, a large majority, 83 percent, report that they were, but the figure is
lower for managers and professionals than for other white-collar or service and blue-
collar workers. Further evidence of the greater time pressures experienced by man-
agers and professionals lies in their answers to a question regarding whether their jobs
involve tight deadlines. Whereas 60 percent of managers and 67 percent of profes-
sionals reported having tight deadlines, 51 percent of other white-collar workers and
46 percent of service and blue-collar workers did. These differences are statistically
Wee
kly
Hou
rs
50
30
60
40
20
10
0Managers Other
White-collarService andBlue-collar
Professionals
Managers OtherWhite-collar
Service andBlue-collar
90
50
30
60
70
80
40
20
10
0
Per
cent
Professionals
Figure 3 .6a Respondents’ Mean Number of Hours
Worked Weekly, by Occupational Group
Figure 3 .6b Respondents Who Said They “Usually Work
Overtime,” by Occupational Group
Labor-FO2.qxd 10/29/02 11:35 AM Page 77
the state of california labor / 200278
significant. These findings suggest that managers and professionals were “usually”
working overtime at least in part because they were facing tight deadlines and did not
have enough time to complete their work.
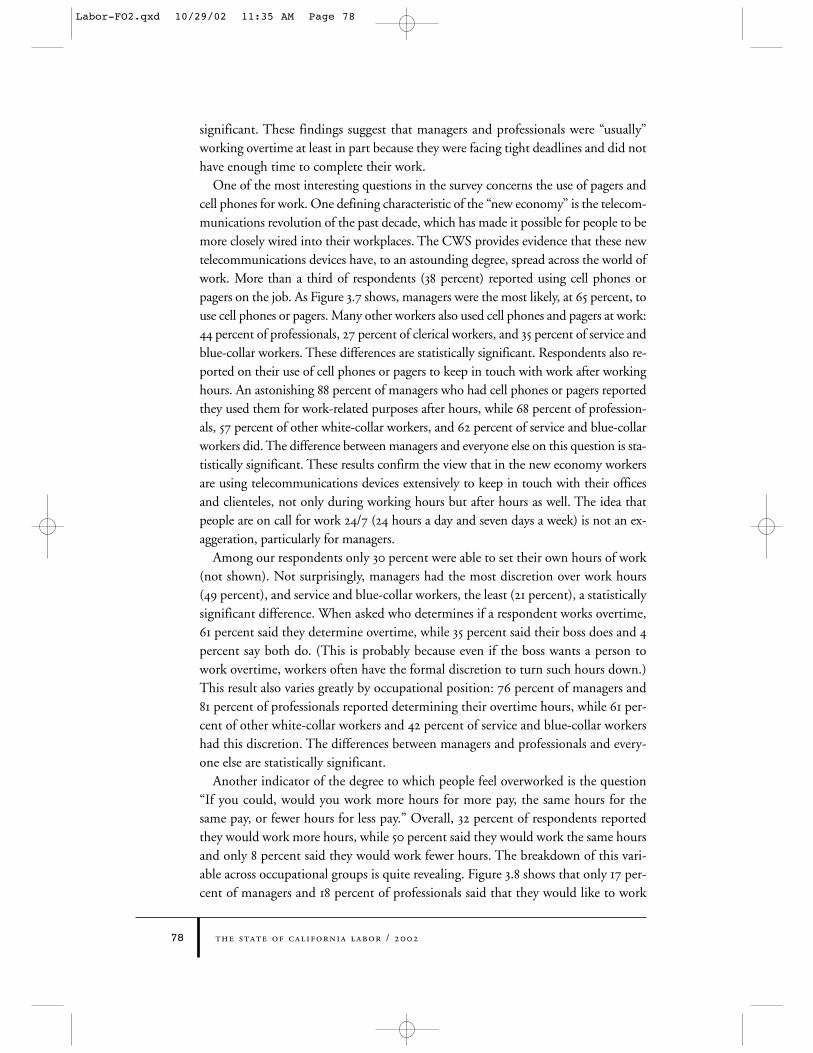
One of the most interesting questions in the survey concerns the use of pagers and
cell phones for work. One defining characteristic of the “new economy” is the telecom-
munications revolution of the past decade, which has made it possible for people to be
more closely wired into their workplaces. The CWS provides evidence that these new
telecommunications devices have, to an astounding degree, spread across the world of
work. More than a third of respondents (38 percent) reported using cell phones or
pagers on the job. As Figure 3.7 shows, managers were the most likely, at 65 percent, to
use cell phones or pagers. Many other workers also used cell phones and pagers at work:
44 percent of professionals, 27 percent of clerical workers, and 35 percent of service and
blue-collar workers. These differences are statistically significant. Respondents also re-
ported on their use of cell phones or pagers to keep in touch with work after working
hours. An astonishing 88 percent of managers who had cell phones or pagers reported
they used them for work-related purposes after hours, while 68 percent of profession-
als, 57 percent of other white-collar workers, and 62 percent of service and blue-collar
workers did. The difference between managers and everyone else on this question is sta-
tistically significant. These results confirm the view that in the new economy workers
are using telecommunications devices extensively to keep in touch with their offices
and clienteles, not only during working hours but after hours as well. The idea that
people are on call for work 24/7 (24 hours a day and seven days a week) is not an ex-
aggeration, particularly for managers. Figure 3.7 after here
Among our respondents only 30 percent were able to set their own hours of work
(not shown). Not surprisingly, managers had the most discretion over work hours
(49 percent), and service and blue-collar workers, the least (21 percent), a statistically
significant difference. When asked who determines if a respondent works overtime,
61 percent said they determine overtime, while 35 percent said their boss does and 4
percent say both do. (This is probably because even if the boss wants a person to
work overtime, workers often have the formal discretion to turn such hours down.)
This result also varies greatly by occupational position: 76 percent of managers and
81 percent of professionals reported determining their overtime hours, while 61 per-
cent of other white-collar workers and 42 percent of service and blue-collar workers
had this discretion. The differences between managers and professionals and every-
one else are statistically significant.
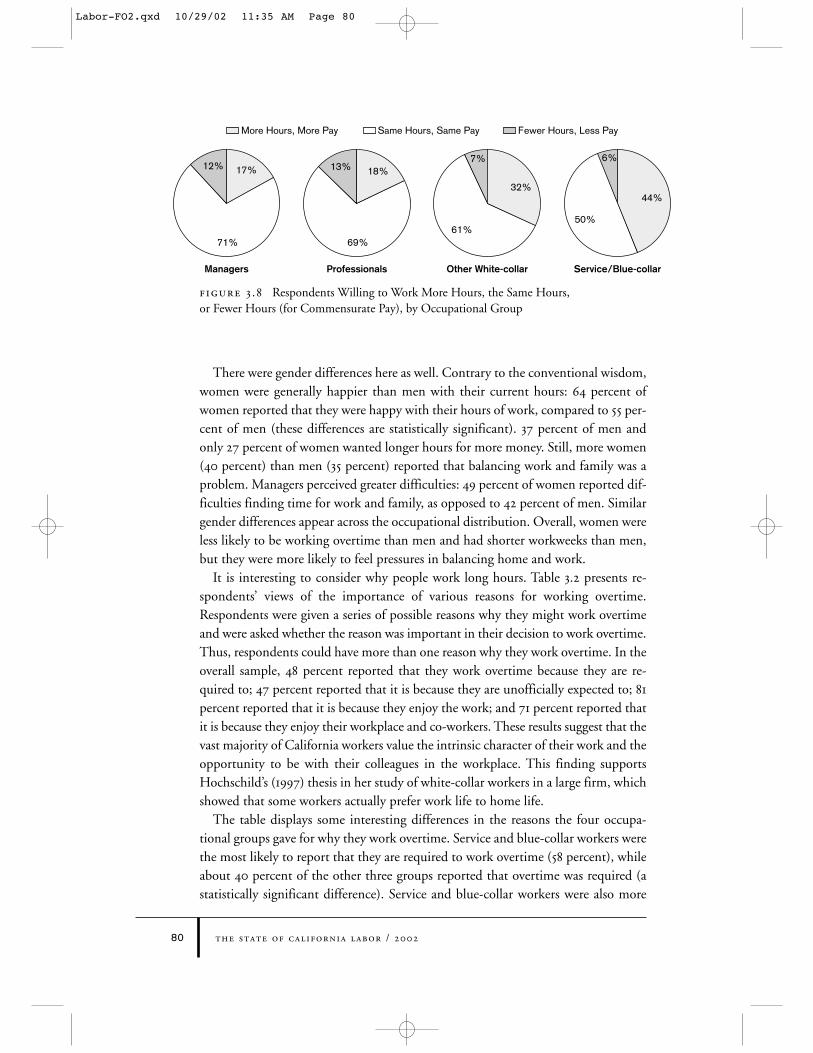
Another indicator of the degree to which people feel overworked is the question
“If you could, would you work more hours for more pay, the same hours for the
same pay, or fewer hours for less pay.” Overall, 32 percent of respondents reported
they would work more hours, while 50 percent said they would work the same hours
and only 8 percent said they would work fewer hours. The breakdown of this vari-
able across occupational groups is quite revealing. Figure 3.8 shows that only 17 per-
cent of managers and 18 percent of professionals said that they would like to work
Labor-FO2.qxd 10/29/02 11:35 AM Page 78
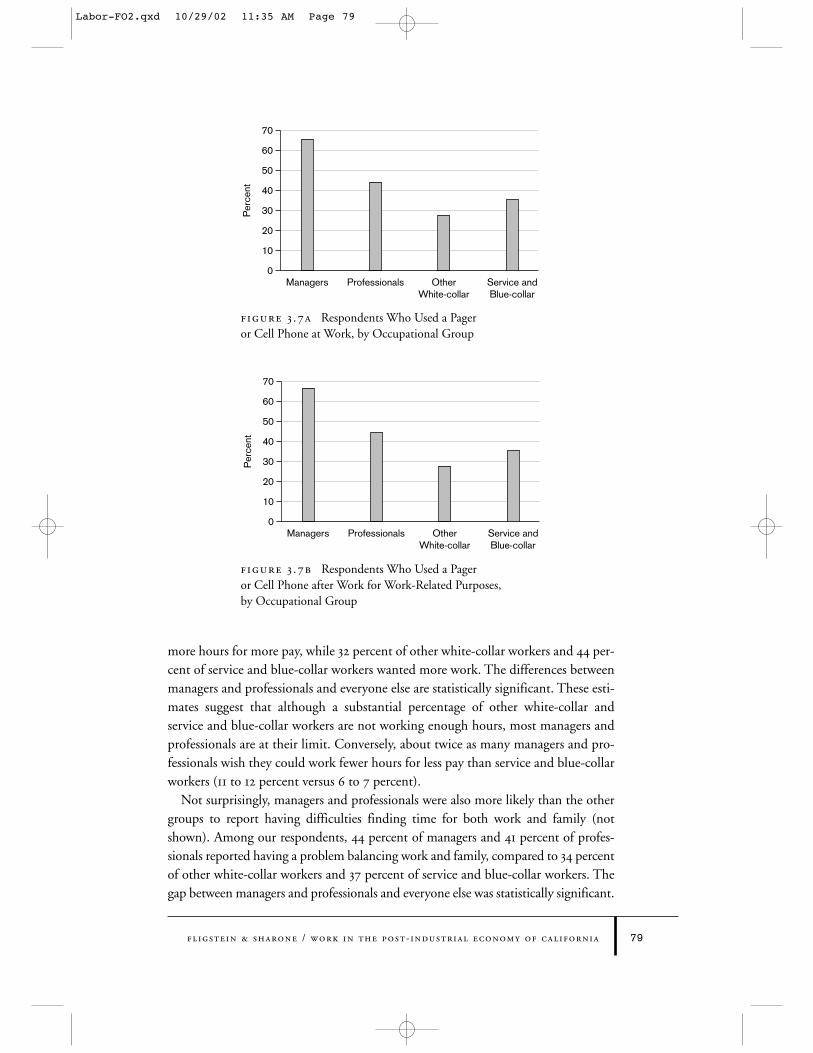
more hours for more pay, while 32 percent of other white-collar workers and 44 per-
cent of service and blue-collar workers wanted more work. The differences between
managers and professionals and everyone else are statistically significant. These esti-
mates suggest that although a substantial percentage of other white-collar and
service and blue-collar workers are not working enough hours, most managers and
professionals are at their limit. Conversely, about twice as many managers and pro-
fessionals wish they could work fewer hours for less pay than service and blue-collar
workers (11 to 12 percent versus 6 to 7 percent). Figure 3.8 after here.
Not surprisingly, managers and professionals were also more likely than the other
groups to report having difficulties finding time for both work and family (not
shown). Among our respondents, 44 percent of managers and 41 percent of profes-
sionals reported having a problem balancing work and family, compared to 34 percent
of other white-collar workers and 37 percent of service and blue-collar workers. The
gap between managers and professionals and everyone else was statistically significant.
Fligstein & Sharone / Work in the Post- Industrial Economy of California 79
Managers OtherWhite-collar
Service andBlue-collar
70
50
30
60
40
20
10
0
Per
cent
Professionals
Figure 3 .7a Respondents Who Used a Pager
or Cell Phone at Work, by Occupational Group
Managers OtherWhite-collar
Service andBlue-collar
70
50
30
60
40
20
10
0
Per
cent
Professionals
Figure 3 .7b Respondents Who Used a Pager
or Cell Phone after Work for Work-Related Purposes,
by Occupational Group
Labor-FO2.qxd 10/29/02 11:35 AM Page 79
the state of california labor / 200280
There were gender differences here as well. Contrary to the conventional wisdom,
women were generally happier than men with their current hours: 64 percent of
women reported that they were happy with their hours of work, compared to 55 per-
cent of men (these differences are statistically significant). 37 percent of men and
only 27 percent of women wanted longer hours for more money. Still, more women
(40 percent) than men (35 percent) reported that balancing work and family was a
problem. Managers perceived greater difficulties: 49 percent of women reported dif-
ficulties finding time for work and family, as opposed to 42 percent of men. Similar
gender differences appear across the occupational distribution. Overall, women were
less likely to be working overtime than men and had shorter workweeks than men,
but they were more likely to feel pressures in balancing home and work.
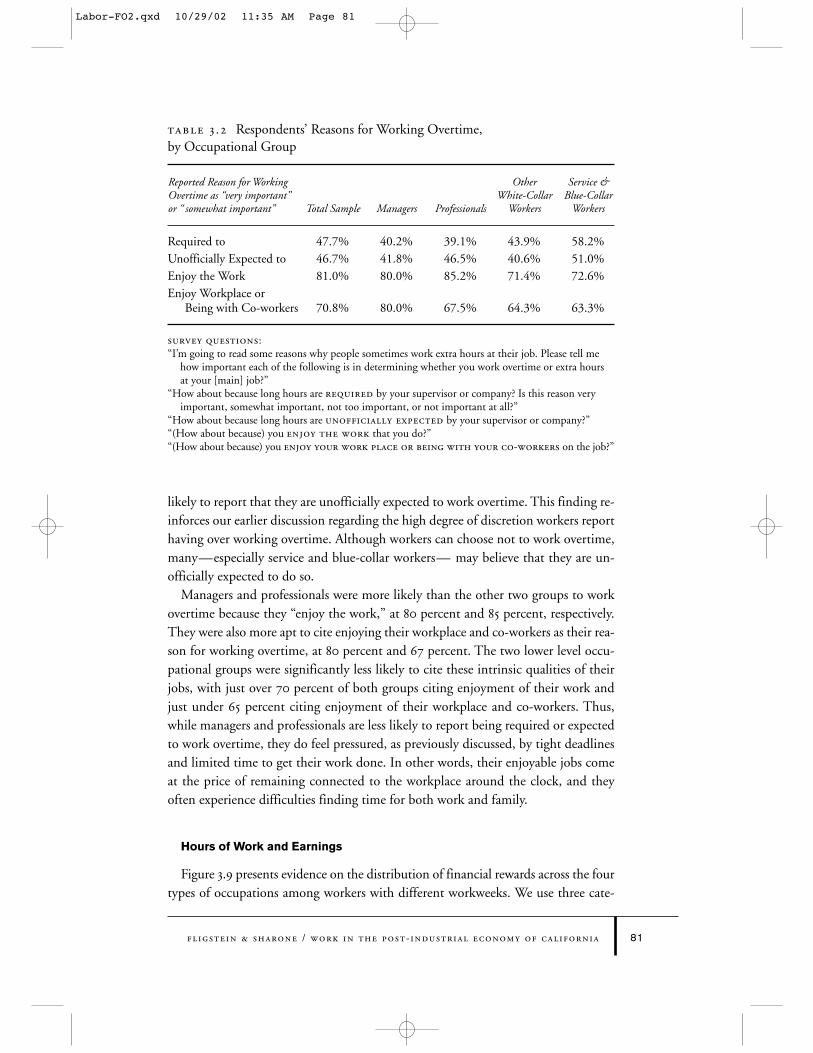
It is interesting to consider why people work long hours. Table 3.2 presents re-
spondents’ views of the importance of various reasons for working overtime.
Respondents were given a series of possible reasons why they might work overtime
and were asked whether the reason was important in their decision to work overtime.
Thus, respondents could have more than one reason why they work overtime. In the
overall sample, 48 percent reported that they work overtime because they are re-
quired to; 47 percent reported that it is because they are unofficially expected to; 81
percent reported that it is because they enjoy the work; and 71 percent reported that
it is because they enjoy their workplace and co-workers. These results suggest that the
vast majority of California workers value the intrinsic character of their work and the
opportunity to be with their colleagues in the workplace. This finding supports
Hochschild’s (1997) thesis in her study of white-collar workers in a large firm, which
showed that some workers actually prefer work life to home life. Table 3.2 about here
The table displays some interesting differences in the reasons the four occupa-
tional groups gave for why they work overtime. Service and blue-collar workers were
the most likely to report that they are required to work overtime (58 percent), while
about 40 percent of the other three groups reported that overtime was required (a
statistically significant difference). Service and blue-collar workers were also more
17%
71% 69%61%
7%12% 13% 18%
32%
50%
6%
44%
Fewer Hours, Less PayMore Hours, More Pay Same Hours, Same Pay
Managers Professionals Other White-collar Service/Blue-collar
Figure 3 .8 Respondents Willing to Work More Hours, the Same Hours,
or Fewer Hours (for Commensurate Pay), by Occupational Group
Labor-FO2.qxd 10/29/02 11:35 AM Page 80
Fligstein & Sharone / Work in the Post- Industrial Economy of California 81
likely to report that they are unofficially expected to work overtime. This finding re-
inforces our earlier discussion regarding the high degree of discretion workers report
having over working overtime. Although workers can choose not to work overtime,
many—especially service and blue-collar workers— may believe that they are un-
officially expected to do so.
Managers and professionals were more likely than the other two groups to work
overtime because they “enjoy the work,” at 80 percent and 85 percent, respectively.
They were also more apt to cite enjoying their workplace and co-workers as their rea-
son for working overtime, at 80 percent and 67 percent. The two lower level occu-
pational groups were significantly less likely to cite these intrinsic qualities of their
jobs, with just over 70 percent of both groups citing enjoyment of their work and
just under 65 percent citing enjoyment of their workplace and co-workers. Thus,
while managers and professionals are less likely to report being required or expected
to work overtime, they do feel pressured, as previously discussed, by tight deadlines
and limited time to get their work done. In other words, their enjoyable jobs come
at the price of remaining connected to the workplace around the clock, and they
often experience difficulties finding time for both work and family.
Hours of Work and Earnings
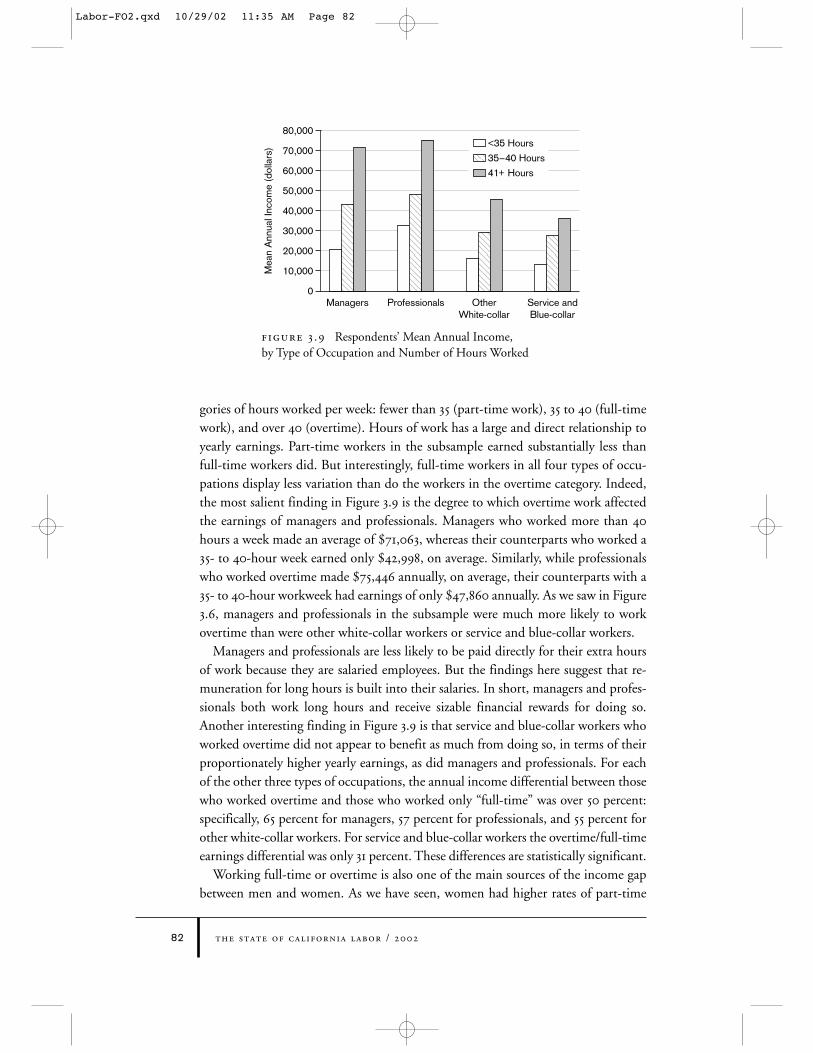
Figure 3.9 presents evidence on the distribution of financial rewards across the four
types of occupations among workers with different workweeks. We use three cate-
Table 3 .2 Respondents’ Reasons for Working Overtime,
by Occupational Group
Reported Reason for Working Other Service &Overtime as “very important” White-Collar Blue-Collar or “ somewhat important” Total Sample Managers Professionals Workers Workers
Required to 47.7% 40.2% 39.1% 43.9% 58.2%Unofficially Expected to 46.7% 41.8% 46.5% 40.6% 51.0%Enjoy the Work 81.0% 80.0% 85.2% 71.4% 72.6%Enjoy Workplace or
Being with Co-workers 70.8% 80.0% 67.5% 64.3% 63.3%
SURVEY QUESTIONS:“I’m going to read some reasons why people sometimes work extra hours at their job. Please tell me
how important each of the following is in determining whether you work overtime or extra hoursat your [main] job?”
“How about because long hours are REQUIRED by your supervisor or company? Is this reason veryimportant, somewhat important, not too important, or not important at all?”
“How about because long hours are UNOFFICIALLY EXPECTED by your supervisor or company?”“(How about because) you ENJOY THE WORK that you do?” “(How about because) you ENJOY YOUR WORK PLACE OR BEING WITH YOUR CO-WORKERS on the job?”
Labor-FO2.qxd 10/29/02 11:35 AM Page 81
the state of california labor / 200282
gories of hours worked per week: fewer than 35 (part-time work), 35 to 40 (full-time
work), and over 40 (overtime). Hours of work has a large and direct relationship to
yearly earnings. Part-time workers in the subsample earned substantially less than
full-time workers did. But interestingly, full-time workers in all four types of occu-
pations display less variation than do the workers in the overtime category. Indeed,
the most salient finding in Figure 3.9 is the degree to which overtime work affected
the earnings of managers and professionals. Managers who worked more than 40
hours a week made an average of $71,063, whereas their counterparts who worked a
35- to 40-hour week earned only $42,998, on average. Similarly, while professionals
who worked overtime made $75,446 annually, on average, their counterparts with a
35- to 40-hour workweek had earnings of only $47,860 annually. As we saw in Figure
3.6, managers and professionals in the subsample were much more likely to work
overtime than were other white-collar workers or service and blue-collar workers. Figure 3.9 after here
Managers and professionals are less likely to be paid directly for their extra hours
of work because they are salaried employees. But the findings here suggest that re-
muneration for long hours is built into their salaries. In short, managers and profes-
sionals both work long hours and receive sizable financial rewards for doing so.
Another interesting finding in Figure 3.9 is that service and blue-collar workers who
worked overtime did not appear to benefit as much from doing so, in terms of their
proportionately higher yearly earnings, as did managers and professionals. For each
of the other three types of occupations, the annual income differential between those
who worked overtime and those who worked only “full-time” was over 50 percent:
specifically, 65 percent for managers, 57 percent for professionals, and 55 percent for
other white-collar workers. For service and blue-collar workers the overtime/full-time
earnings differential was only 31 percent. These differences are statistically significant.
Working full-time or overtime is also one of the main sources of the income gap
between men and women. As we have seen, women had higher rates of part-time
Managers OtherWhite-collar
Service andBlue-collar
80,000
50,000
30,000
60,000
70,000
40,000
20,000
10,000
0Professionals
Mea
n A
nnua
l Inc
ome
(dol
lars
)
35–40 Hours
<35 Hours
41+ Hours
Figure 3 .9 Respondents’ Mean Annual Income,
by Type of Occupation and Number of Hours Worked
Labor-FO2.qxd 10/29/02 11:35 AM Page 82
employment across the occupational spectrum, and at the top of the spectrum they
were less likely to work overtime than men were. Nevertheless, there are still gaps be-
tween male and female pay rates even if we control for hours of work. For example,
male managers in the survey subsample who worked full-time averaged $45,726 an-
nually, but their female full-time counterparts averaged only $37,708. Women who
worked overtime, though, did substantially close the gender gap in earnings. Among
those in the subsample who worked more than 40 hours a week, the men averaged
$57,006 a year, while women averaged $55,851.
It is useful to step back and synthesize these results. Managers and professionals
work long hours and also report that they “usually” work overtime. They are likely to
do so both because they enjoy the work and the workplace, and because they are sub-
ject to tight deadlines. Although they are highly paid for their long workweeks, man-
agers and professionals are also more likely to be closely tied to their work with cell
phones and pagers and more apt to report having trouble finding time for both work
and family. Despite their high rewards, they are at their limit in terms of work hours.
Workers in the other white-collar and service and blue-collar occupations also enjoy
work and the workplace and many choose to work overtime as a result. But they also
have less discretion over working overtime and report more formal and informal pres-
sure to do so. They are also more likely than managers and professionals to report that
they do not have enough hours of work. Service and blue-collar workers who do work
overtime receive less remuneration for it than workers in the other three types of oc-
cupations. Finally, women are more apt to work part-time than men and less likely to
work overtime. Their shorter workweek, on average, is one of the main sources of the
gender gap in incomes. And despite their shorter workweek, women report more con-
flict between work and family than men do, which suggests that the traditional
household division of labor still places a heavier burden on women than on men.
This picture broadly supports the view that there has been a bifurcation of work
in the postindustrial economy. The “haves”—managers and professionals—have
long work hours and receive high levels of compensation in doing so, while the “have
less” workers wish they had more working hours and are paid proportionately much
less when they do work longer than a “full-time” workweek. Although those who
work overtime in both sets of occupations do so partly because they enjoy their work,
workplaces, and co-workers, there are significant differences between the two in the
types and extent of pressures they face. Managers and professionals are more apt to
complain of tight deadlines and difficulties balancing work and family, while the
other white-collar and service and blue-collar groups report less discretion over work
hours and overtime and more pressure from the boss to work overtime.
Job Opportunities, Security, and Satisfaction
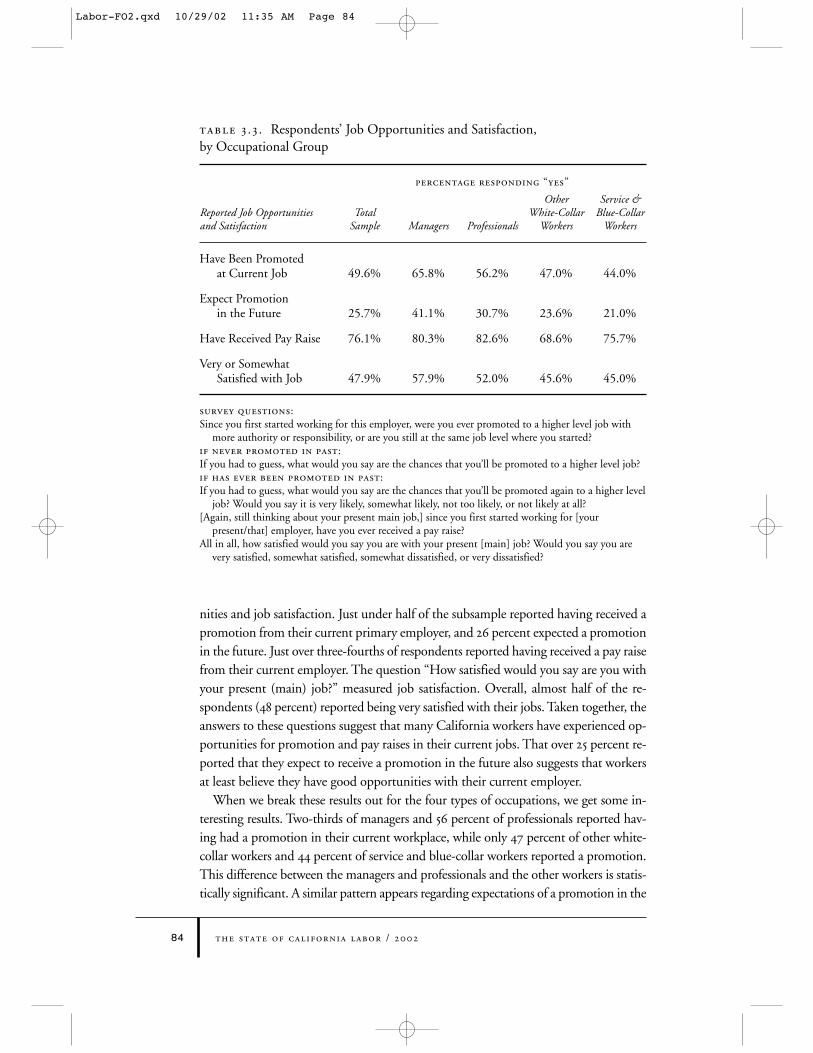
We also explored the opportunities and insecurities workers report at work. Table 3.3
presents workers’ responses to some of the survey questions on a workplace opportu-
Fligstein & Sharone / Work in the Post- Industrial Economy of California 83
Labor-FO2.qxd 10/29/02 11:35 AM Page 83
the state of california labor / 200284
nities and job satisfaction. Just under half of the subsample reported having received a
promotion from their current primary employer, and 26 percent expected a promotion
in the future. Just over three-fourths of respondents reported having received a pay raise
from their current employer. The question “How satisfied would you say are you with
your present (main) job?” measured job satisfaction. Overall, almost half of the re-
spondents (48 percent) reported being very satisfied with their jobs. Taken together, the
answers to these questions suggest that many California workers have experienced op-
portunities for promotion and pay raises in their current jobs. That over 25 percent re-
ported that they expect to receive a promotion in the future also suggests that workers
at least believe they have good opportunities with their current employer. Table 3.3 after here
When we break these results out for the four types of occupations, we get some in-
teresting results. Two-thirds of managers and 56 percent of professionals reported hav-
ing had a promotion in their current workplace, while only 47 percent of other white-
collar workers and 44 percent of service and blue-collar workers reported a promotion.
This difference between the managers and professionals and the other workers is statis-
tically significant. A similar pattern appears regarding expectations of a promotion in the
Table 3 .3 . Respondents’ Job Opportunities and Satisfaction,
by Occupational Group
Percentage Responding “Yes”
Other Service & Reported Job Opportunities Total White-Collar Blue-Collar and Satisfaction Sample Managers Professionals Workers Workers
Have Been Promoted at Current Job 49.6% 65.8% 56.2% 47.0% 44.0%
Expect Promotion in the Future 25.7% 41.1% 30.7% 23.6% 21.0%
Have Received Pay Raise 76.1% 80.3% 82.6% 68.6% 75.7%
Very or Somewhat Satisfied with Job 47.9% 57.9% 52.0% 45.6% 45.0%
SURVEY QUESTIONS:Since you first started working for this employer, were you ever promoted to a higher level job with
more authority or responsibility, or are you still at the same job level where you started?IF NEVER PROMOTED IN PAST:If you had to guess, what would you say are the chances that you’ll be promoted to a higher level job?IF HAS EVER BEEN PROMOTED IN PAST:If you had to guess, what would you say are the chances that you’ll be promoted again to a higher level
job? Would you say it is very likely, somewhat likely, not too likely, or not likely at all?[Again, still thinking about your present main job,] since you first started working for [your
present/that] employer, have you ever received a pay raise?All in all, how satisfied would you say you are with your present [main] job? Would you say you are
very satisfied, somewhat satisfied, somewhat dissatisfied, or very dissatisfied?
Labor-FO2.qxd 10/29/02 11:35 AM Page 84
Fligstein & Sharone / Work in the Post- Industrial Economy of California 85
next 12 months; managers and professionals appear to have had more opportunities for
promotion in their workplace and thus are more apt to anticipate opportunities in the
future. The percentage reporting a pay raise in their current workplace is high for all
groups. Still, managers and professionals were more likely to have received a raise.
Finally, managers were the most likely group (at 58 percent) to report being very sat-
isfied with their job, while other white-collar and service and blue-collar were the least
likely to do so (at about 45 percent each). The fact that 48 percent of all the respon-
dents reported a high level of satisfaction with their work is not surprising. The liter-
ature shows that American workers generally do report high levels of job satisfaction
(see Lincoln and Kalleberg 1990). This is partly due to the American tendency to be-
lieve that individuals are in control of their own economic destiny, regardless of their
actual career mobility. In this cultural context workers may be more likely to present
themselves as satisfied with their jobs because they believe a lack of satisfaction might
reflect a personal failure to take responsibility for finding a job more to their liking.
This tendency may also partly account for the high numbers of workers who reported
that they work overtime because they enjoy their work and the workplace.
The period during which the telephone interviews took place (again, in the sec-
ond half of 2001 and the first month of 2002) was part of a national recession.
Californians were witnessing relatively high unemployment (see Pastor and Zabin,
this volume) and a great deal of economic uncertainty. We therefore also explored
how those economic conditions were affecting workers’ sense of security.
The average number of years respondents had worked for their current employer was
6.7 years. Fourteen percent of respondents reported having been laid off in the past
three years. Nineteen percent feared they might be laid off in the next 12 months. The
recession in California had almost a fifth of the subsample worried about their jobs. In
answering the question “How easy do you think it would be to find a job with another
employer with approximately the same income and fringe benefits that you have now?”
only 23 percent of respondents thought it would be “very easy” to find a job as good as
the one they currently held. This again reflects some insecurity on their part.
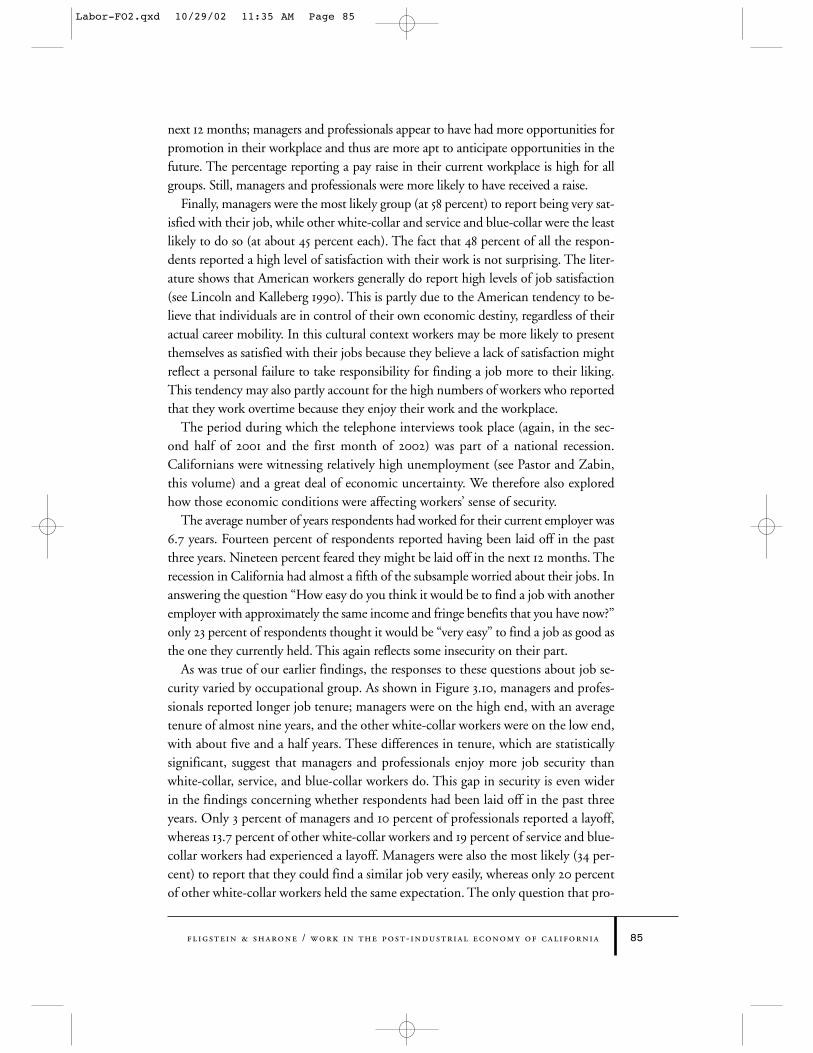
As was true of our earlier findings, the responses to these questions about job se-
curity varied by occupational group. As shown in Figure 3.10, managers and profes-
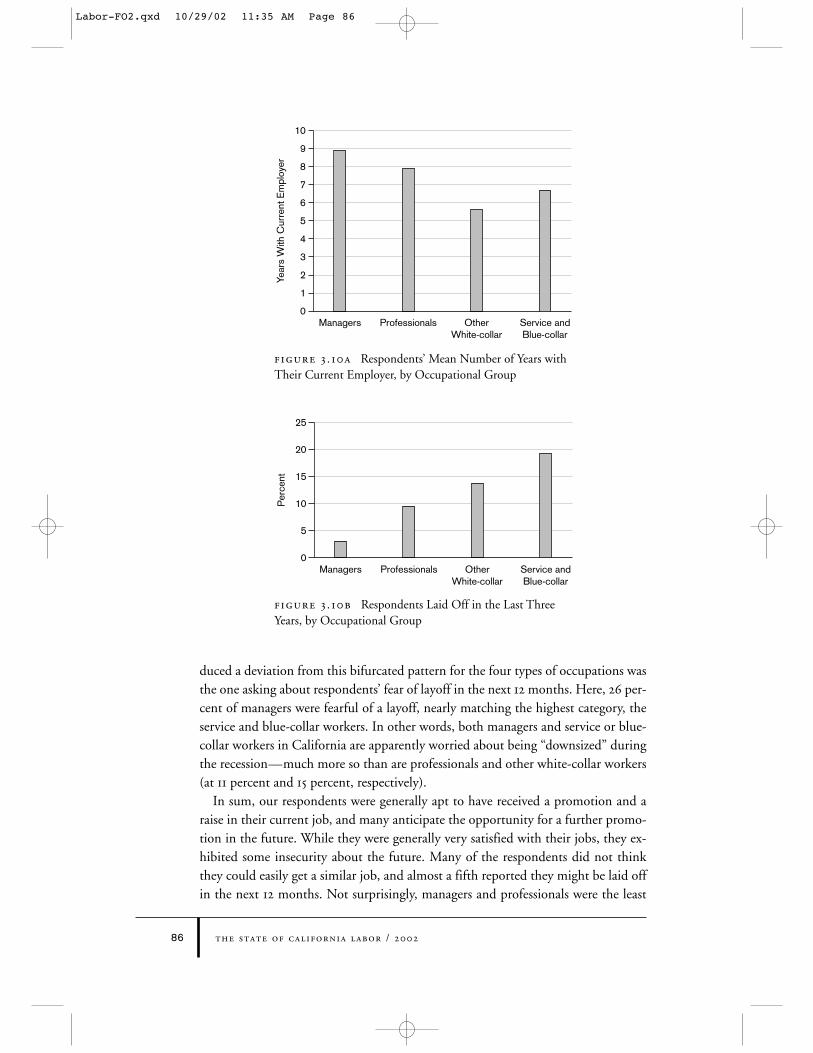
sionals reported longer job tenure; managers were on the high end, with an average
tenure of almost nine years, and the other white-collar workers were on the low end,
with about five and a half years. These differences in tenure, which are statistically
significant, suggest that managers and professionals enjoy more job security than
white-collar, service, and blue-collar workers do. This gap in security is even wider
in the findings concerning whether respondents had been laid off in the past three
years. Only 3 percent of managers and 10 percent of professionals reported a layoff,
whereas 13.7 percent of other white-collar workers and 19 percent of service and blue-
collar workers had experienced a layoff. Managers were also the most likely (34 per-
cent) to report that they could find a similar job very easily, whereas only 20 percent
of other white-collar workers held the same expectation. The only question that pro-
Labor-FO2.qxd 10/29/02 11:35 AM Page 85
the state of california labor / 200286
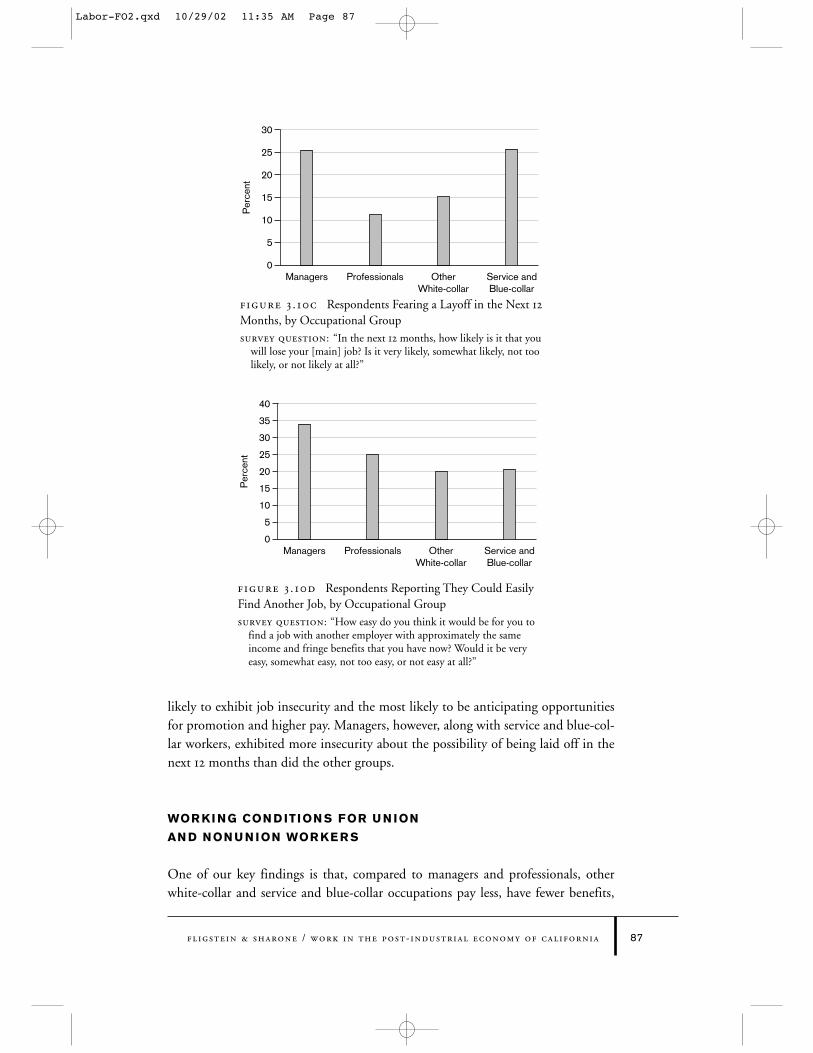
duced a deviation from this bifurcated pattern for the four types of occupations was
the one asking about respondents’ fear of layoff in the next 12 months. Here, 26 per-
cent of managers were fearful of a layoff, nearly matching the highest category, the
service and blue-collar workers. In other words, both managers and service or blue-
collar workers in California are apparently worried about being “downsized” during
the recession—much more so than are professionals and other white-collar workers
(at 11 percent and 15 percent, respectively). Figure 3.10 (a, b, c, & d) after here
In sum, our respondents were generally apt to have received a promotion and a
raise in their current job, and many anticipate the opportunity for a further promo-
tion in the future. While they were generally very satisfied with their jobs, they ex-
hibited some insecurity about the future. Many of the respondents did not think
they could easily get a similar job, and almost a fifth reported they might be laid off
in the next 12 months. Not surprisingly, managers and professionals were the least
Managers OtherWhite-collar
Service andBlue-collar
10
5
3
6
7
8
9
4
2
1
0
Year
s W
ith C
urre
nt E
mpl
oyer
Professionals
Managers OtherWhite-collar
Service andBlue-collar
25
15
20
10
5
0
Per
cent
Professionals
Figure 3 . 10a Respondents’ Mean Number of Years with
Their Current Employer, by Occupational Group
Figure 3 . 10b Respondents Laid Off in the Last Three
Years, by Occupational Group
Labor-FO2.qxd 10/29/02 11:35 AM Page 86
likely to exhibit job insecurity and the most likely to be anticipating opportunities
for promotion and higher pay. Managers, however, along with service and blue-col-
lar workers, exhibited more insecurity about the possibility of being laid off in the
next 12 months than did the other groups.
WOR KI NG CON D ITION S FOR U N ION
AN D NON U N ION WOR KE R S
One of our key findings is that, compared to managers and professionals, other
white-collar and service and blue-collar occupations pay less, have fewer benefits,
Fligstein & Sharone / Work in the Post- Industrial Economy of California 87
25
15
30
20
10
5
0
Per
cent
Managers OtherWhite-collar
Service andBlue-collar
Professionals
30
15
40
20
35
25
10
5
0
Per
cent
Managers OtherWhite-collar
Service andBlue-collar
Professionals
Figure 3 . 10d Respondents Reporting They Could Easily
Find Another Job, by Occupational Group
survey question: “How easy do you think it would be for you tofind a job with another employer with approximately the sameincome and fringe benefits that you have now? Would it be veryeasy, somewhat easy, not too easy, or not easy at all?”
Figure 3 . 10c Respondents Fearing a Layoff in the Next 12
Months, by Occupational Group
survey question: “In the next 12 months, how likely is it that youwill lose your [main] job? Is it very likely, somewhat likely, not toolikely, or not likely at all?”
Labor-FO2.qxd 10/29/02 11:35 AM Page 87
the state of california labor / 200288
and are more insecure. But we also find that outside the professional and managerial
categories, unionization can make a big difference. Not only do unionized workers
earn wage premiums, but they also enjoy many other advantages over their non-
union counterparts. Among our respondents 18 percent (N=175) were union mem-
bers. Within this group 51 percent worked in the public sector. Since the government
tends to provide more benefits and security than the private sector does, one could
suspect that the better working conditions of union workers might merely be the re-
sult of government employment. It turns out, however, that working conditions are
better for union workers in both the private and public sector.
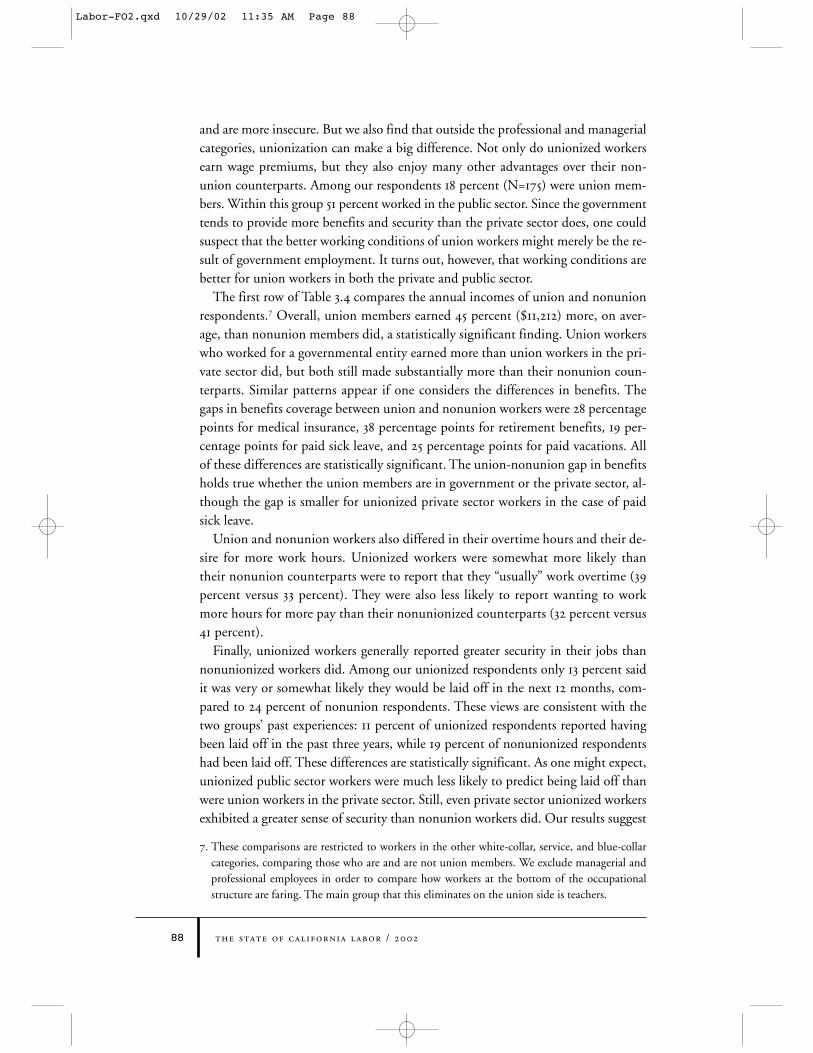
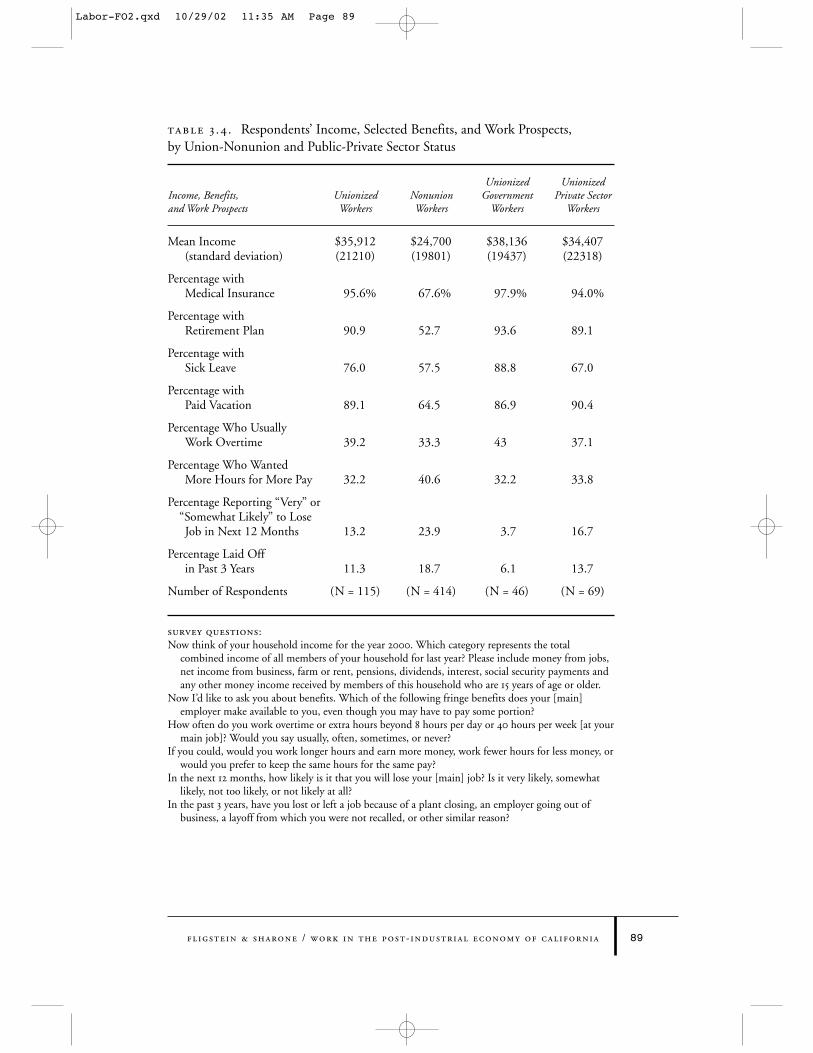
The first row of Table 3.4 compares the annual incomes of union and nonunion
respondents.7 Overall, union members earned 45 percent ($11,212) more, on aver-
age, than nonunion members did, a statistically significant finding. Union workers
who worked for a governmental entity earned more than union workers in the pri-
vate sector did, but both still made substantially more than their nonunion coun-
terparts. Similar patterns appear if one considers the differences in benefits. The
gaps in benefits coverage between union and nonunion workers were 28 percentage
points for medical insurance, 38 percentage points for retirement benefits, 19 per-
centage points for paid sick leave, and 25 percentage points for paid vacations. All
of these differences are statistically significant. The union-nonunion gap in benefits
holds true whether the union members are in government or the private sector, al-
though the gap is smaller for unionized private sector workers in the case of paid
sick leave. Table 3.4 after here
Union and nonunion workers also differed in their overtime hours and their de-
sire for more work hours. Unionized workers were somewhat more likely than
their nonunion counterparts were to report that they “usually” work overtime (39
percent versus 33 percent). They were also less likely to report wanting to work
more hours for more pay than their nonunionized counterparts (32 percent versus
41 percent).
Finally, unionized workers generally reported greater security in their jobs than
nonunionized workers did. Among our unionized respondents only 13 percent said
it was very or somewhat likely they would be laid off in the next 12 months, com-
pared to 24 percent of nonunion respondents. These views are consistent with the
two groups’ past experiences: 11 percent of unionized respondents reported having
been laid off in the past three years, while 19 percent of nonunionized respondents
had been laid off. These differences are statistically significant. As one might expect,
unionized public sector workers were much less likely to predict being laid off than
were union workers in the private sector. Still, even private sector unionized workers
exhibited a greater sense of security than nonunion workers did. Our results suggest
7. These comparisons are restricted to workers in the other white-collar, service, and blue-collar
categories, comparing those who are and are not union members. We exclude managerial and
professional employees in order to compare how workers at the bottom of the occupational
structure are faring. The main group that this eliminates on the union side is teachers.
Labor-FO2.qxd 10/29/02 11:35 AM Page 88
Fligstein & Sharone / Work in the Post- Industrial Economy of California 89
Table 3 .4 . Respondents’ Income, Selected Benefits, and Work Prospects,
by Union-Nonunion and Public-Private Sector Status
Unionized UnionizedIncome, Benefits, Unionized Nonunion Government Private Sectorand Work Prospects Workers Workers Workers Workers
Mean Income $35,912 $24,700 $38,136 $34,407(standard deviation) (21210) (19801) (19437) (22318)
Percentage with Medical Insurance 95.6% 67.6% 97.9% 94.0%
Percentage with Retirement Plan 90.9 52.7 93.6 89.1
Percentage with Sick Leave 76.0 57.5 88.8 67.0
Percentage with Paid Vacation 89.1 64.5 86.9 90.4
Percentage Who Usually Work Overtime 39.2 33.3 43 37.1
Percentage Who Wanted More Hours for More Pay 32.2 40.6 32.2 33.8
Percentage Reporting “Very” or “Somewhat Likely” to Lose Job in Next 12 Months 13.2 23.9 3.7 16.7
Percentage Laid Off in Past 3 Years 11.3 18.7 6.1 13.7
Number of Respondents (N = 115) (N = 414) (N = 46) (N = 69)
SURVEY QUESTIONS: Now think of your household income for the year 2000. Which category represents the total
combined income of all members of your household for last year? Please include money from jobs,net income from business, farm or rent, pensions, dividends, interest, social security payments andany other money income received by members of this household who are 15 years of age or older.
Now I’d like to ask you about benefits. Which of the following fringe benefits does your [main]employer make available to you, even though you may have to pay some portion?
How often do you work overtime or extra hours beyond 8 hours per day or 40 hours per week [at yourmain job]? Would you say usually, often, sometimes, or never?
If you could, would you work longer hours and earn more money, work fewer hours for less money, orwould you prefer to keep the same hours for the same pay?
In the next 12 months, how likely is it that you will lose your [main] job? Is it very likely, somewhatlikely, not too likely, or not likely at all?
In the past 3 years, have you lost or left a job because of a plant closing, an employer going out ofbusiness, a layoff from which you were not recalled, or other similar reason?
Labor-FO2.qxd 10/29/02 11:35 AM Page 89
that despite the decline in union density over recent decades, unions remain an im-
portant organizational vehicle to improve workers’ earnings, benefits, and sense of
job security.
CONCLUS ION
The California economy is dominated by nonmanufacturing activities, such as fi-
nance, real estate, construction, services, and government, with only 13 percent of all
workers employed in manufacturing companies. California workers are highly edu-
cated, averaging over 13 years of schooling. Almost three-fifths of them are managers,
professionals, or other white-collar workers. California, simply put, has a postindus-
trial economy that is predominantly white-collar and depends heavily on the skills
of its workers.
These skills are not distributed equally across the population. We have seen that
Anglos, African Americans, and Asians average more than 14 years of schooling,
while Latinos, both native born and foreign born average much less. Foreign-born
Latinos have the least schooling (9 years on average) and correspondingly, the low-
est annual earnings. There is also evidence that Anglos hold the best paying jobs, fol-
lowed by Asians, African Americans, and Latinos. In addition, the data shows con-
tinuing sex segregation in occupations. Women are concentrated in traditionally
female jobs like teaching, sales, and clerical work. They also are more likely to work
part-time and less likely to work overtime. They express more satisfaction than men
do with their current hours of work but more dissatisfaction with their ability to find
time for both work and home.
Much of our analysis has focused on conditions of work for four occupational
groups. As we have seen, there are also stark differences by race, ethnicity, and na-
tivity. The Latino population, in particular, is concentrated in the lower ranks of the
occupational distribution, with foreign-born Latinos particularly concentrated in the
service and blue-collar category. Where Anglos and Asians are overrepresented, at the
top of the occupational distribution, people work the longest hours and earn the
most. To the degree that Latino immigrants are absent from these top occupational
categories, they do not share in the associated benefits. Besides earning less money,
they are less apt to receive job promotions, and they are more vulnerable to layoffs.
At least part of the gap between Latino immigrants and the rest of the population is
due to their low levels of education, as well as the labor market disadvantages asso-
ciated with being foreign born. Although finding employment in the United States
may provide many low-skilled immigrants with a better standard of living than they
would have attained in their home countries, their low wages nevertheless make it
hard for them to make ends meet.
Women equal men in terms of schooling but still tend to work in occupations seg-
regated by gender. Their incomes still trail men’s in all occupation groups. Women
the state of california labor / 200290
Labor-FO2.qxd 10/29/02 11:35 AM Page 90
work fewer hours and are less likely to report overtime than men. They are generally
happy with their hours of work, but they are more apt than men are to report hav-
ing problems juggling work and family. This suggests that women are still the or-
ganizers of family life. They adjust their hours of work to meet their home respon-
sibilities, but they pay the price in terms of lower incomes, fewer benefits, and less
access to retirement plans.
One of the questions we were most interested in pursuing was how conditions at
work differed in the postindustrial economy for various occupational groups. Most
scholars agree that the labor market has become much more deregulated in the past
20 years and that there has been growing income inequality. As we have seen, in-
equality in fringe benefits is nearly as extreme as inequality in income. In addition,
the labor force is polarized on the spectrum of working hours. We found that man-
agers and professionals report “usually” working overtime. They are also likely to re-
port that they work under tight deadlines and with not enough time to do their jobs.
They are highly likely to use cell phones and pagers, and these devices tie them to the
workplace after regular work hours. We showed that those managers and profes-
sionals who work long hours take home premium earnings, but often report trouble
finding time for both work and family. Nonetheless, managers and professionals
tend to find work rewarding. Managers and professionals are also more likely to have
had a promotion in their current place of employment, expect a promotion in the
next 12 months, and have received a salary increase. They also have higher benefit
levels, including medical insurance, retirement plans, and profit sharing.
Workers in the other white-collar and service and blue-collar categories work
fewer hours than managers and professionals do, and they would like to have the op-
portunity to earn more income. Many service and blue-collar workers in particular
wish they had more work hours. They also have fewer benefits such as medical in-
surance or a retirement plan. Other white-collar and service and blue-collar workers
are also more likely to have been laid off, and they are the least likely of the four
groups to predict that they could find a job as good as the one that they currently
have.
Managers and professionals work long hours, but in turn they receive higher pay,
more benefits and greater control over their work. They also report high levels of job
satisfaction. Those who work long hours report enjoying their work and their col-
leagues. Other white-collar workers and service and blue-collar workers earn less,
have fewer opportunities for advancement, and wish they could add hours to add in-
come. They are also more insecure in their jobs and are more likely to experience lay-
offs. For workers in the lower parts of the education and occupational distributions,
unionization brings better pay, benefits, and working conditions, across both the pri-
vate and public sectors.
Our snapshot of work in California captures two worlds of work. One world, for
those at the top (34 percent of the labor force), has lots of pressures but many
rewards. The other, for those at the bottom (66 percent of the labor force), has fewer
Fligstein & Sharone / Work in the Post- Industrial Economy of California 91
Labor-FO2.qxd 10/29/02 11:35 AM Page 91
rewards and more insecurity. Managers and professionals who are prepared to work
long hours reap the reward in income, psychic benefits such as job satisfaction, paid
benefits, and more security on the job. For the other white-collar and service and
blue-collar workers, however, life at work is more onerous. They have fewer working
hours than they need to make ends meet, have fewer paid benefits, and face more in-
security on the job.
R E FE R E NCE S
Appelbaum, Eileen, and Peter Berg. 1996. “Financial Market Constraints and Business Strat-
egy in the USA.” Pp. 239–61 in Creating Industrial Capacity: Towards Full Employment,edited by Jonathan Michie and John Grieve Smith. New York: Oxford University Press.
Bernhardt, Annette, Martina Morris, Mark S. Handcock, and Marc A. Scott. 2001. DivergentPaths: Economic Mobility in the New American Labor Market. New York: Russell Sage Foun-
dation.
Blackburn, McKinley, David Bloom, and Richard Freeman. 1990. “The Declining Econom-
ic Position of Less Skilled American Men.” In A Future of Lousy Jobs? The Changing Struc-ture of U.S. Wages, edited by Gary T. Burtless. Washington, DC: Brookings Institution.
Blair, Margaret M., and Thomas A. Kochan. 2000. The New Relationship: Human Capital inthe American Corporation. Washington, DC: Brookings Institution.
Farber, Henry S. 1997. “The Changing Face of Job Loss in the U.S., 1981–1995.” BrookingsPapers on Economic Activity: Microeconomics. Washington, DC: Brookings Institution.
Fligstein, Neil. 2001. The Architecture of Markets: An Economic Sociology of Capitalist Societies.Princeton: Princeton University Press.
Freeman, Richard B. 1997. When Earnings Diverge: Causes, Consequences, and Cures for theNew Inequality in the U.S. Washington, DC: National Planning Association.
Friedman, Benjamin M. 1985. “The Substitutability of Equity for Debt.” In Corporate Capi-tal Structures in the U.S., edited by Benjamin M. Friedman. Chicago: University of Chica-
go Press.
Hamermesh, Daniel S. 1999. “Changing Inequality in Markets for Workplace Amenities.”
Quarterly Journal of Economics 114 (November): 1085–1123.
Harrison, Bennett, and Barry Bluestone. 1988. The Great U-Turn: Corporate Restructuring andthe Polarizing of America. New York: Basic Books.
Harrison, Bennett. 1994. Lean and Mean: The Changing Landscape of Corporate Power in theAge of Flexibility. New York: Basic Books.
Hochschild, Arlie Russell. 1997. The Time Bind: When Work Becomes Home and Home BecomesWork. New York: Henry Holt.
Katz, Lawrence, and Kevin Murphy. 1992. “Changes in Relative Wages, 1963–1987: Supply
and Demand Factors.” Quarterly Journal of Economics 107, 1 (February): 35–78.
Levy, Frank, and Richard Murnane. 1992. “Earnings Level and Earnings Inequality: A
Review of Recent Trends and Proposed Explanations.” Journal of Economic Literature 30:
1333–81.
Lincoln, James R., and Arne L. Kalleberg. 1990. Culture, Control and Commitment: A Studyof Work Organizations and Work Attitudes in the U.S. and Japan. New York: Cambridge
University Press.
the state of california labor / 200292
Labor-FO2.qxd 10/29/02 11:35 AM Page 92
Osterman, Paul. 1999. Securing Prosperity: The American Labor Market: How It Has Changedand What to Do about It. Princeton: Princeton University Press.
Pfeffer, Jeffrey, and James N. Baron. 1988. “Taking the Workers Back Out: Recent Trends in
the Structuring of Employment.” Research in Organizational Behavior 10: 257–303.
Reskin, Barbara F., and Patricia A. Roos. 1990. Job Queues, Gender Queues: Explaining Women’sInroads into Male Occupations. Philadelphia: Temple University Press.
Schor, Juliet B. 1992. The Overworked American: The Unexpected Decline of Leisure. New York:
Basic.
———. 1998. The Overspent American: Why We Want What We Don’t Need. New York: Basic.
Fligstein & Sharone / Work in the Post- Industrial Economy of California 93
Labor-FO2.qxd 10/29/02 11:35 AM Page 93
the state of california labor / 200294
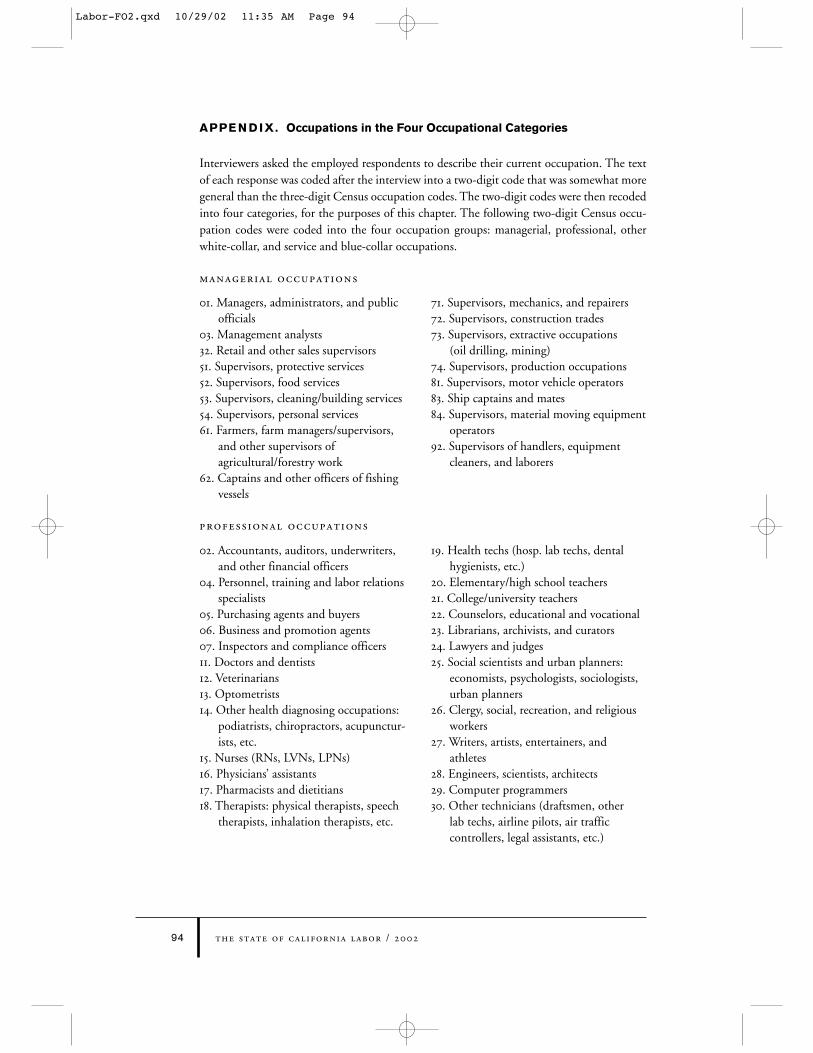
APPE N D IX. Occupations in the Four Occupational Categories
Interviewers asked the employed respondents to describe their current occupation. The text
of each response was coded after the interview into a two-digit code that was somewhat more
general than the three-digit Census occupation codes. The two-digit codes were then recoded
into four categories, for the purposes of this chapter. The following two-digit Census occu-
pation codes were coded into the four occupation groups: managerial, professional, other
white-collar, and service and blue-collar occupations.
Managerial occupations
Profess ional occupations
01. Managers, administrators, and public
officials
03. Management analysts
32. Retail and other sales supervisors
51. Supervisors, protective services
52. Supervisors, food services
53. Supervisors, cleaning/building services
54. Supervisors, personal services
61. Farmers, farm managers/supervisors,
and other supervisors of
agricultural/forestry work
62. Captains and other officers of fishing
vessels
71. Supervisors, mechanics, and repairers
72. Supervisors, construction trades
73. Supervisors, extractive occupations
(oil drilling, mining)
74. Supervisors, production occupations
81. Supervisors, motor vehicle operators
83. Ship captains and mates
84. Supervisors, material moving equipment
operators
92. Supervisors of handlers, equipment
cleaners, and laborers
02. Accountants, auditors, underwriters,
and other financial officers
04. Personnel, training and labor relations
specialists
05. Purchasing agents and buyers
06. Business and promotion agents
07. Inspectors and compliance officers
11. Doctors and dentists
12. Veterinarians
13. Optometrists
14. Other health diagnosing occupations:
podiatrists, chiropractors, acupunctur-
ists, etc.
15. Nurses (RNs, LVNs, LPNs)
16. Physicians’ assistants
17. Pharmacists and dietitians
18. Therapists: physical therapists, speech
therapists, inhalation therapists, etc.
19. Health techs (hosp. lab techs, dental
hygienists, etc.)
20. Elementary/high school teachers
21. College/university teachers
22. Counselors, educational and vocational
23. Librarians, archivists, and curators
24. Lawyers and judges
25. Social scientists and urban planners:
economists, psychologists, sociologists,
urban planners
26. Clergy, social, recreation, and religious
workers
27. Writers, artists, entertainers, and
athletes
28. Engineers, scientists, architects
29. Computer programmers
30. Other technicians (draftsmen, other
lab techs, airline pilots, air traffic
controllers, legal assistants, etc.)
Labor-FO2.qxd 10/29/02 11:35 AM Page 94
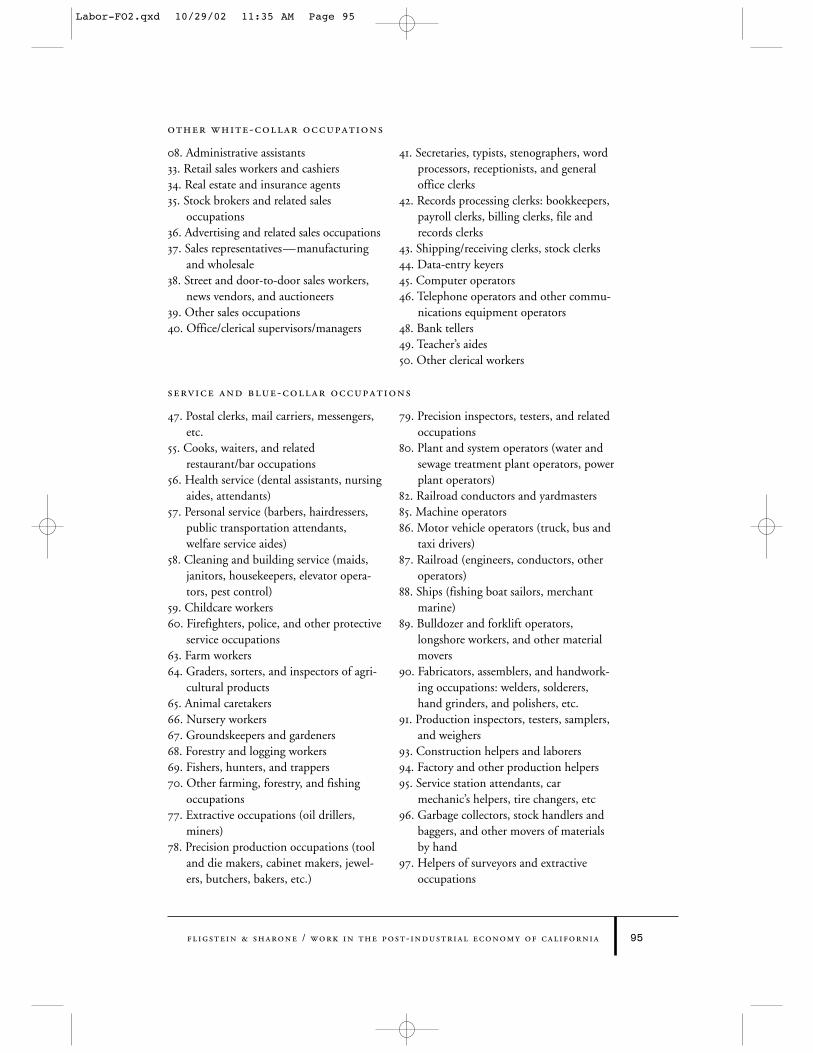
Fligstein & Sharone / Work in the Post- Industrial Economy of California 95
Other white-collar occupations
Service and blue-collar occupations
08. Administrative assistants
33. Retail sales workers and cashiers
34. Real estate and insurance agents
35. Stock brokers and related sales
occupations
36. Advertising and related sales occupations
37. Sales representatives—manufacturing
and wholesale
38. Street and door-to-door sales workers,
news vendors, and auctioneers
39. Other sales occupations
40. Office/clerical supervisors/managers
41. Secretaries, typists, stenographers, word
processors, receptionists, and general
office clerks
42. Records processing clerks: bookkeepers,
payroll clerks, billing clerks, file and
records clerks
43. Shipping/receiving clerks, stock clerks
44. Data-entry keyers
45. Computer operators
46. Telephone operators and other commu-
nications equipment operators
48. Bank tellers
49. Teacher’s aides
50. Other clerical workers
47. Postal clerks, mail carriers, messengers,
etc.
55. Cooks, waiters, and related
restaurant/bar occupations
56. Health service (dental assistants, nursing
aides, attendants)
57. Personal service (barbers, hairdressers,
public transportation attendants,
welfare service aides)
58. Cleaning and building service (maids,
janitors, housekeepers, elevator opera-
tors, pest control)
59. Childcare workers
60. Firefighters, police, and other protective
service occupations
63. Farm workers
64. Graders, sorters, and inspectors of agri-
cultural products
65. Animal caretakers
66. Nursery workers
67. Groundskeepers and gardeners
68. Forestry and logging workers
69. Fishers, hunters, and trappers
70. Other farming, forestry, and fishing
occupations
77. Extractive occupations (oil drillers,
miners)
78. Precision production occupations (tool
and die makers, cabinet makers, jewel-
ers, butchers, bakers, etc.)
79. Precision inspectors, testers, and related
occupations
80. Plant and system operators (water and
sewage treatment plant operators, power
plant operators)
82. Railroad conductors and yardmasters
85. Machine operators
86. Motor vehicle operators (truck, bus and
taxi drivers)
87. Railroad (engineers, conductors, other
operators)
88. Ships (fishing boat sailors, merchant
marine)
89. Bulldozer and forklift operators,
longshore workers, and other material
movers
90. Fabricators, assemblers, and handwork-
ing occupations: welders, solderers,
hand grinders, and polishers, etc.
91. Production inspectors, testers, samplers,
and weighers
93. Construction helpers and laborers
94. Factory and other production helpers
95. Service station attendants, car
mechanic’s helpers, tire changers, etc
96. Garbage collectors, stock handlers and
baggers, and other movers of materials
by hand
97. Helpers of surveyors and extractive
occupations
Labor-FO2.qxd 10/29/02 11:35 AM Page 95