WOLFE ISLAND WIND PLANT POST-CONSTRUCTION FOLLOW- …
151
WOLFE ISLAND WIND PLANT POST-CONSTRUCTION FOLLOW- UP PLAN BIRD AND BAT RESOURCES MONITORING REPORT NO. 3 JANUARY - JUNE 2010 File No. 160960494 January 2011 Prepared For: TransAlta Corporation’s wholly owned subsidiary Canadian Renewable Energy Corporation Prepared by: Stantec Consulting Ltd. Suite 1 - 70 Southgate Drive Guelph ON N1G 4P5
Transcript of WOLFE ISLAND WIND PLANT POST-CONSTRUCTION FOLLOW- …

WOLFE ISLAND WIND PLANT POST-CONSTRUCTION FOLLOW-UP PLAN BIRD AND BAT RESOURCES MONITORING REPORT NO. 3 JANUARY - JUNE 2010
File No. 160960494 January 2011
Prepared For:
TransAlta Corporation’s wholly owned subsidiary Canadian Renewable Energy Corporation
Prepared by:
Stantec Consulting Ltd. Suite 1 - 70 Southgate Drive Guelph ON N1G 4P5

WOLFE ISLAND WIND PLANT POST-CONSTRUCTION FOLLOW-UP PLAN BIRD AND BAT RESOURCES MONITORING REPORT NO. 3, JANUARY - JUNE 2010
cm w:\active\60960494\reports\monitoring report #3 (2010 jan-june)\rpt_2011-01-24_60494_wi-pcm-report-3_fin.docx E.1
Executive Summary
This report contains the results of the post-construction monitoring program for bird and bat resources at the Wolfe Island Wind Plant for the period between January 1 and June 30, 2010 (the “Reporting Period”). The Wolfe Island Wind Plant is a 197.8 megawatt (“MW”) wind plant on Wolfe Island, Township of Frontenac Islands, Frontenac County, Province of Ontario. Eighty-six 2.3 MW wind turbine generators (“WTGs”) and ancillary facilities have been placed over the western portion of Wolfe Island with additional supporting electrical infrastructure on the Kingston mainland.
This report, the third in a series, contains the results of the post-construction monitoring program for the period between January 1 and June 30, 2010. The wind plant achieved commercial operation on June 26, 2009, and all 86 WTGs had completed their commissioning works by June 29. With intermittent and periodic turbine shutdown to allow for ‘fine-tuning’ maintenance work, the first full week of operation of all 86 WTGs was the week of July 6, 2009.
Consistent with the schedule for post-construction monitoring outlined in Section 5.1 of the Post-Construction Follow-Up Plan for Bird and Bat Resources for the Wolfe Island Wind Plant (revised February 2010) (the “Follow-up Plan”), field surveys conducted during the Reporting Period included:
· bird and bat mortality monitoring
· disturbance effects monitoring – wintering raptors
· disturbance effects monitoring – staging and foraging migratory waterfowl
· disturbance effects monitoring – breeding waterfowl
· disturbance effects monitoring – breeding grassland, woodland and marsh birds
Mortality monitoring was carried out by employees of Wolfe Island Wind Monitoring, an independent consulting firm, according to a schedule and methods prepared by Stantec that were based on the Follow-up Plan. In addition to carcass searches, trials to determine various corrective factors for searcher efficiency and scavenging rates were conducted during the Reporting Period.
A total of 66 carcasses of 28 bird species were collected during the Reporting Period. During the reporting period all species had provincial S-Ranks of S5 (i.e., Secure – common, widespread and abundant in Ontario) or S4 (i.e., Apparently Secure – uncommon but not rare). Bird fatalities were distributed quite uniformly through the spring period (April, May and early

WOLFE ISLAND WIND PLANT POST-CONSTRUCTION FOLLOW-UP PLAN BIRD AND BAT RESOURCES MONITORING REPORT NO. 3, JANUARY - JUNE 2010 EXECUTIVE SUMMARY January 2011
E.2 cm w:\active\60960494\reports\monitoring report #3 (2010 jan-june)\rpt_2011-01-24_60494_wi-pcm-report-3_fin.docx
June). Fewer fatalities were recorded in February and March, and no fatalities were noted in January.
One Chimney Swift fatality was recorded at T04 on May 11. This species is listed as Threatened on Schedule 1 of the federal Species at Risk Act and on the Species at Risk in Ontario list of the provincial Endangered Species Act (2007). One Bobolink fatality was recorded at T68 on June 10. Although not listed under the Species at Risk Act or Endangered Species Act at the time, it was identified as threatened by Committee of the Status of Endangered Wildlife in Canada (COSEWIC) in April of 2010 and by the Committee on the Status of Species at Risk in Ontario (COSSARO) in June of 2010. Five of the species have been identified as species of conservation priority by Ontario Partners in Flight (2006). Based on the observation dates, two were likely breeding within or near the wind plant: Wood Thrush (one on June 23), and Bobolink (one on June 8). The other three species, Savannah Sparrow (one on May 6), Chimney Swift and Baltimore Oriole (one on May 17), were likely struck during migration. There is no evidence to suggest Chimney Swifts breed or congregate in the vicinity of the site, and no basis to identify a future threat to other individuals of this species.
Nine raptor and one vulture fatalities were recorded over the course of this Reporting Period: seven Red-tailed Hawks, one Osprey, one Northern Harrier, and one Turkey Vulture. Based on the dates of recovery, five of the fatalities were likely of individuals breeding within or in the vicinity of the wind plant (one Osprey on May 3, one Northern Harrier on May 13, one Turkey Vulture on June 1 and one Red-tailed Hawk on each of May 17 and June10). One Red-tailed Hawk, recovered on February 8, was presumed to be a wintering bird. The remaining Red-tailed Hawks, recovered in April, were presumed to be staging in or moving through the wind plant during spring migration.
The nine raptor and one vulture carcasses recovered, when corrected for scavenger removal, represent an estimated total raptor mortality rate of 0.12 raptors/turbine (0.05 raptors/MW) for the Reporting Period. The estimated mortality rate for all birds is 6.39 birds/turbine (2.78 birds/MW) for the Reporting Period. When combined with the results of the June – December 2009 period, the annual mortality rate can be estimated, and has been calculated to be 13.4 birds/turbine (5.82 birds/MW). This annual mortality rate is well below the adaptive management threshold of 11.7 birds/MW identified in the Follow-up Plan. The Wolfe Island bird mortality rate is strongly influenced by the mortality of swallows and martins, primarily in July and August. Large numbers of Tree Swallows congregate on Wolfe Island during the summer, prior to fall migration.
The annual bird mortality rate of 5.82 birds/MW is very similar to that observed at the Maple Ridge, New York facility (5.81 birds/MW) in 2006 (Jain et al., 2007), and higher than the rate observed at Maple Ridge in 2007 (3.82 birds/MW; Jain et al., 2009). The Maple Ridge facility is located approximately 75 km south of the Wolfe Island Wind Plant. The Wolfe Island mortality rates are within the mortality range of 0 birds/MW to approximately 14 birds/MW reported by The National Wind Coordinating Collaborative (“NWCC”, 2010) in their review of fatality rates at

WOLFE ISLAND WIND PLANT POST-CONSTRUCTION FOLLOW-UP PLAN BIRD AND BAT RESOURCES MONITORING REPORT NO. 3, JANUARY - JUNE 2010 EXECUTIVE SUMMARY January 2011
cm w:\active\60960494\reports\monitoring report #3 (2010 jan-june)\rpt_2011-01-24_60494_wi-pcm-report-3_fin.docx E.3
North American wind facilities. When comparing numbers, it is important to note that most, if not all of the studies at Maple Ridge and those summarized in the NWCC report did not include winter mortality monitoring, and therefore any fatalities occurring over the winter months were not included in annual mortality rates. The data for the Wolfe Island Wind Plant includes winter fatalities.
When combined with the results of the June-December 2009 period, the annual mortality rate can be estimated, and has been calculated to be 0.27 raptors per turbine (0.12 raptors/MW). The annual raptor and vulture mortality rate of 0.12 raptors per MW is within the mortality range observed at other facilities in North America outside California (0 – 0.32 raptors/MW; NWCC, 2010). It is approximately half of the rate observed at Maple Ridge in 2007, (0.25 raptors/MW as reported by NWCC, 2010), although higher than the rate observed at Maple Ridge in 2006 (approximately 0.05 raptors/MW, as reported by NWCC, 2010). The majority of the raptor and vulture fatalities appeared to be individuals migrating through the study area.
The raptor and vulture mortality rate is higher than the notification threshold of 0.09 raptors/MW identified in the Follow-up Plan. In accordance with the Follow-up Plan, TransAlta and the MNR have initiated discussions regarding adaptive management. Raptor behavioural studies are underway involving surveys during four peak mortality periods, and will continue across late summer and late fall, 2010 and spring, 2011.
A total of 34 carcasses of three bat species were collected during the Reporting Period. The Silver-haired Bat (28 fatalities) and Eastern Red Bat (2 fatalities), comprising 88% of all bat fatalities during the Reporting Period, are ranked S4 (i.e., Apparently Secure – uncommon, but not rare) and are classified as long-distance migratory tree bats. The Big Brown Bat (4 fatalities), comprising 12% of all bat fatalities, has a provincial S-Rank of S5 (i.e., Secure – common, widespread and abundant in Ontario). The majority of bat mortality occurred in a one week period at the beginning of May. Correcting for searcher efficiency, scavenger and other removal rates, and percent area searched, the 34 recovered carcasses represent an estimated total bat mortality rate for the Reporting Period of 5.23 bats/turbine (2.27 bats/MW).
When combined with results of June – December 2009 report, the annual bat mortality rate of 8.69 bats/MW (19.99 bats/turbine) is at the median of the mortality range observed at other facilities in North America, which ranges from 0 – 39 bats/MW (NWCC, 2010). It is lower the rates observed at Maple Ridge in 2007 (11.23 bats/MW) (Jain et al., 2009). The annual bat mortality rate at Wolfe Island is below the threshold for adaptive management of 12.5 bats/MW as identified in the Follow-up Plan. Thirty-four (15.9%) of the 214 bat fatalities recorded during year-round monitoring at the Wolfe Island wind plant fell within the spring months, with a decided peak in the first week of May. Long-distance migratory tree bats comprised 76% of identified fatalities.
The annual bat mortality rate is below the adaptive management threshold of 12.5 bats/MW as identified in the Follow-Up Plan. Although the bat mortality rate is below the threshold, TransAlta

WOLFE ISLAND WIND PLANT POST-CONSTRUCTION FOLLOW-UP PLAN BIRD AND BAT RESOURCES MONITORING REPORT NO. 3, JANUARY - JUNE 2010 EXECUTIVE SUMMARY January 2011
E.4 cm w:\active\60960494\reports\monitoring report #3 (2010 jan-june)\rpt_2011-01-24_60494_wi-pcm-report-3_fin.docx
is committed to complete additional research in 2011 to evaluate practical measures to reduce the effects of operating wind turbines on bats at the wind plant. TransAlta will complete testing of potential mitigation measures during the fall migration period in 2011 to determine the feasibility and effectiveness of implementing such mitigation measures at Wolfe Island.Disturbance effects monitoring was conducted during the monitoring period. Maximum wintering raptor numbers observed during any one of the 2009/2010 winter raptor surveys include 7 Snowy Owls (December 23), 8 Northern Harriers (December 23), 13 Red-tailed Hawks (February 16), 5 American Kestrels (March 17), 15 Short-eared Owls (December 22) and 4 Bald Eagles (January 6). Winter raptor numbers during 2009/2010 post-construction monitoring were generally lower than those during 2006/2007 pre-construction surveys. Overall, the average density during the afternoon surveys of 2006/2007 and 2009/2010 were respectively 0.72 and 0.25 raptors per kilometer. The average density of Short-eared Owls during the early evening surveys for 2006/2007 and 2009/2010 were respectively 0.16 and 0.09 owls per kilometer.
Northern Harrier and Rough-legged Hawk accounted for the majority of the decrease in abundance between 2006/2007 and 2009/2010. Northern Harrier observations decreased from 159 in 2006/2007 to 19 in 2009/2010. Rough-legged Hawk observations decreased from 119 in 2006/2007 to 13 in 2009/2010.
Numbers of wintering raptors and owls are known to vary significantly from year to year, based on prey conditions in their northern breeding and southern wintering areas. Results from across Ontario in 2009/2010, as reported in surveys conducted at other sites (Stantec, unpublished; Environment Canada, pers. comm.) and on the OntBirds listserve, indicate that the number of wintering raptors and owls in the winter of 2009-2010 were lower than average. Overall, the results of the 2009/2010 post-construction winter raptor monitoring indicate that raptors continued to utilize the wind plant study area. Differences in raptor density observed within the study area between 2006/2007 and 2009/2010 are reflective of observations throughout the Kingston area and across southern Ontario. Therefore, differences observed between the pre- and post-construction monitoring are attributed to natural variability and not avoidance of the Project.
In total, seven species of waterfowl were observed foraging inland during the spring 2010 post-construction monitoring; all species were either geese or dabbling ducks. Species composition in 2010, dominated by Canada Goose, was very similar to that observed during the 2007 pre-construction monitoring. Overall, the total number of waterfowl days was lower in 2010, totaling 57,906, compared to 85,219 waterfowl days in the spring of 2007. This decrease in abundance appears to be attributed largely to a decrease in the number of Canada Goose observations.
In the spring of 2010, areas of highest waterfowl concentration occurred in the southern portion of Wolfe Island, south of Reed’s Bay Road. The largest flocks usually occurred in close proximity to the bays where they stage overnight. When comparing 2007 and 2010 spring results, the areas of waterfowl concentration were generally similar with some localized shifting

WOLFE ISLAND WIND PLANT POST-CONSTRUCTION FOLLOW-UP PLAN BIRD AND BAT RESOURCES MONITORING REPORT NO. 3, JANUARY - JUNE 2010 EXECUTIVE SUMMARY January 2011
cm w:\active\60960494\reports\monitoring report #3 (2010 jan-june)\rpt_2011-01-24_60494_wi-pcm-report-3_fin.docx E.5
(e.g., using different fields within the same concession). Crop preference in the spring of 2007 and 2010 were similar, with the majority of observations in hay or pasture. Grain fields, such as corn or soy, were generally not as important to foraging waterfowl during the spring season.
Major movement routes were similar in 2007 and 2010. All major routes were associated with the primary offshore staging areas, namely Reed’s Bay, Pyke’s Bay, Button Bay, Bayfield Bay and the small inlet off Carpenter’s Point Rd. Waterfowl did not appear to adjust their flight height in reaction to the WTGs, with the majority of ducks and geese flying at blade sweep height. In many cases, avoidance behavior was observed, as flocks of waterfowl adjusted their flight course as they approached a WTG.
Waterfowl use of offshore staging areas, as measured through aerial surveys, was very similar in the spring of 2008, 2009 and 2010; waterfowl days in the spring of 2010 was 8% larger than that of 2008 and 1% smaller than 2009. A significant increase in waterfowl days in 2010 (118% larger than 2009) was observed along the southern side of the Wolfe Island, including Button Bay. However, a decrease in waterfowl days between 2010 and 2009 was observed in Bayfield Bay. The north and west sides of Wolfe Island experienced less variability in waterfowl days between years. As the overall waterfowl days remained similar between years, the observed fluctuations between sectors is likely due in large part to movement of flocks, and their location at the time of the survey.
For most guilds (i.e. bay ducks, goldeneye and merganser), waterfowl days recorded in the spring of 2010 were consistent with data from 2008 and 2009. Geese, large dabblers and small dabblers were recorded in larger numbers in spring 2010 than in spring 2008 and 2009. The waterfowl days for sea ducks fluctuated notably, with 2010 being an intermediate year. Overall, it is apparent that waterfowl remained abundant in each sector and each of the major staging areas each year, with no apparent avoidance of Project during construction in 2009 or operation in 2010.
Breeding waterfowl surveys found a total of 11 species of waterfowl, 8 of which were expected to be breeding within the five major wetlands in proximity to WTG’s. Mallard (19 observed breeding pairs) was the most common species, followed by Canada Goose (9 observed breeding pairs) and Wood Duck (9 observed breeding pairs). Other species were observed in lower numbers; 1 to 3 breeding pairs across the five wetlands. The Bayfield Bay Marsh route had the largest number of breeding pairs observed, 14 in total. Overall, the waterfowl breeding pairs surveys found populations of breeding geese and/or ducks in each of the major wetlands that are in proximity to WTG. The results of the surveys did not provide any indication that waterfowl avoided nesting in proximity to the WTG.
Overall, the grassland surveys indicated that grassland breeding birds remained common throughout the project area. The grassland point counts, repeated during pre and post-construction monitoring, recorded an apparent decrease in breeding density in several grassland species. However, decreases were not observed for the same species in the study

WOLFE ISLAND WIND PLANT POST-CONSTRUCTION FOLLOW-UP PLAN BIRD AND BAT RESOURCES MONITORING REPORT NO. 3, JANUARY - JUNE 2010 EXECUTIVE SUMMARY January 2011
E.6 cm w:\active\60960494\reports\monitoring report #3 (2010 jan-june)\rpt_2011-01-24_60494_wi-pcm-report-3_fin.docx
area through paired point count surveys and grassland area searches; one potential explanation for the decrease observed at grassland point counts is roadside avoidance. Results of the grassland area searches, which surveyed large portions of the study area with high grassland bird densities both pre and post-construction, did not demonstrate a decrease in grassland bird density. In addition, a WTG avoidance effect was not observed for most grassland species through paired point count data.
Generally, the abundance of wetland breeding birds, as measured by the point counts and area searches, remained similar between pre and post-construction surveys. Species of note included Red-winged Blackbird, which were recorded at significantly lower densities and Common Yellowthroat, which were recorded in significantly higher densities. Overall, results of the wetland point counts and area searches suggest population of breeding birds in the five major wetlands in proximity to WTGs remained relatively consistent between pre and post-construction surveys.
Relatively high breeding bird species diversity was recorded through area searches in the surveyed woodlands in proximity to WTGs. For most species, point count data suggest there was little change in breeding densities between 2008 pre-construction and 2010 post-construction surveys.
Mortality and disturbance effects monitoring should proceed in 2010 according to the February 2010 Follow-up Plan. For mortality monitoring, it is recommended that additional correction factor trials be conducted for searcher efficiency and scavenger removal to better assess the number of raptor and vulture fatalities.
The Follow-up Plan indicates that searcher efficiency trials will typically be conducted once each year. More frequent searcher efficiency trials (i.e., once each season) are recommended to ensure seasonal correction factors are appropriate to seasonal conditions.
Finally, the Follow-up Plan indicates that if scavenging rates are low, the carcass searches may be scaled back to once per week. Scavenging rates are similar to or higher than those observed at other Ontario sites during spring, summer and fall, but are very low during winter: on average, 89.4% of test carcasses are not scavenged over the average search interval. In consideration of the very low number of fatalities observed during the winter months (six bird fatalities in December, January and February), it is recommended that the winter carcass searches be scaled back to once per week through December, January and February.

WOLFE ISLAND WIND PLANT POST-CONSTRUCTION FOLLOW-UP PLAN BIRD AND BAT RESOURCES MONITORING REPORT NO. 3, JANUARY - JUNE 2010
cm w:\active\60960494\reports\monitoring report #3 (2010 jan-june)\rpt_2011-01-24_60494_wi-pcm-report-3_fin.docx i
Table of Contents
EXECUTIVE SUMMARY E.1
1.0 INTRODUCTION .............................................................................................................. 1.1 1.1 PROJECT OVERVIEW ..................................................................................................... 1.1 1.2 POST-CONSTRUCTION FOLLOW-UP PLAN .................................................................. 1.2 1.3 MONITORING REPORT OVERVIEW ............................................................................... 1.2
2.0 METHODS ........................................................................................................................ 2.1 2.1 MORTALITY MONITORING ............................................................................................. 2.1 2.2 FIELD SURVEYS .............................................................................................................. 2.1
2.2.1 Correction Factors and Data Analysis ................................................................ 2.2 2.2.1.1 Searcher Efficiency ............................................................................................ 2.3 2.2.1.2 Scavenger Trials ................................................................................................ 2.4 2.2.1.3 Percent Area Searched ...................................................................................... 2.5
2.3 AGENCY SITE VISITS ...................................................................................................... 2.6 2.4 DISTURBANCE EFFECTS ............................................................................................... 2.6
2.4.1 Winter Raptor Surveys ....................................................................................... 2.7 2.4.2 Foraging Waterfowl Surveys .............................................................................. 2.7 2.4.3 Overland Waterfowl Movement Surveys ............................................................. 2.8 2.4.4 Aerial Waterfowl Surveys ................................................................................... 2.8 2.4.5 Waterfowl Breeding Pairs Surveys ..................................................................... 2.9 2.4.6 Grassland Breeding Bird Point Counts, Paired Point Counts and Area Searches
......................................................................................................................... 2.10 2.4.7 Wetland Breeding Bird Point Counts and Area Searches ................................. 2.11
3.0 RESULTS ......................................................................................................................... 3.1 3.1 MORTALITY MONITORING ............................................................................................. 3.1
3.1.1 Correction Factors .............................................................................................. 3.1 3.1.1.1 Searcher Efficiency ............................................................................................ 3.1 3.1.1.2 Scavenger Removal ........................................................................................... 3.1 3.1.1.3 Percent Area Searched ...................................................................................... 3.2 3.1.2 Direct Effects - Birds ........................................................................................... 3.2 3.1.3 Direct Effects - Bats ............................................................................................ 3.3
3.2 DISTURBANCE EFFECTS MONITORING ....................................................................... 3.4 3.2.1 Winter Raptor Surveys ....................................................................................... 3.4 3.2.2 Foraging Waterfowl Surveys .............................................................................. 3.6 3.2.3 Overland Waterfowl Movement Surveys ............................................................. 3.6 3.2.4 Aerial Waterfowl Surveys ................................................................................... 3.7 3.2.5 Waterfowl Breeding Pairs Surveys ..................................................................... 3.8 3.2.6 Grassland Breeding Bird Point Counts, Paired Point Counts and Area Searches
........................................................................................................................... 3.9 3.2.7 Wetland Breeding Bird Point Counts and Area Searches ................................. 3.12

WOLFE ISLAND WIND PLANT POST-CONSTRUCTION FOLLOW-UP PLAN BIRD AND BAT RESOURCES MONITORING REPORT NO. 3, JANUARY - JUNE 2010
Table of Contents
ii cm w:\active\60960494\reports\monitoring report #3 (2010 jan-june)\rpt_2011-01-24_60494_wi-pcm-report-3_fin.docx
3.2.8 Woodland Breeding Bird Point Counts and Area Searches in Woodlots Larger than 10ha ......................................................................................................... 3.13
3.3 NOTIFICATIONS ............................................................................................................ 3.13 3.3.1 High Annual Mortality Rates – Raptors and Vultures ........................................ 3.14 3.3.2 High Annual Mortality Rates – Bats .................................................................. 3.14 3.3.3 Mortality of Species at Risk .............................................................................. 3.14 3.3.4 Disturbance of Staging Waterfowl .................................................................... 3.14
4.0 DISCUSSION AND RECOMMENDATIONS ..................................................................... 4.1 4.1 DIRECT EFFECTS – MORTALITY ................................................................................... 4.1
4.1.1 Birds ................................................................................................................... 4.2 4.1.2 Bats .................................................................................................................... 4.4
4.2 INDIRECT EFFECTS – DISTURBANCE ........................................................................... 4.4 4.2.1 Wintering Raptors ............................................................................................... 4.4 4.2.2 Foraging Waterfowl Surveys .............................................................................. 4.6 4.2.3 Overland Waterfowl Movement Surveys ............................................................. 4.6 4.2.4 Aerial Waterfowl Surveys ................................................................................... 4.7 4.2.5 Waterfowl Breeding Pairs Surveys ..................................................................... 4.8 4.2.6 Grassland Breeding Bird Point Counts, Paired Point Counts and Area Searches
........................................................................................................................... 4.9 4.2.7 Wetland Breeding Bird Point Counts and Area Searches ................................. 4.11 4.2.8 Woodland Breeding Bird Point Counts and Area Searches in Woodlots Larger
than 10ha ......................................................................................................... 4.12 4.3 RECOMMENDATIONS ................................................................................................... 4.13
5.0 REFERENCES ................................................................................................................. 5.1

WOLFE ISLAND WIND PLANT POST-CONSTRUCTION FOLLOW-UP PLAN BIRD AND BAT RESOURCES MONITORING REPORT NO. 3, JANUARY - JUNE 2010
Table of Contents
cm w:\active\60960494\reports\monitoring report #3 (2010 jan-june)\rpt_2011-01-24_60494_wi-pcm-report-3_fin.docx iii
List of Appendices
Appendix A Figures Appendix B Tables Appendix C Mortality Monitoring Schedule Appendix D Survey Conditions Appendix E NRCan Report on Ensuring Implementation of the Wolfe Island PCFP Appendix F Mortality Monitoring Results Appendix G Aerial Waterfowl Data Appendix H Waterfowl Breeding Pairs Survey Results Appendix I Grassland Breeding Bird Survey Results Appendix J Woodland Breeding Bird Survey Results Appendix K Notifications and Agency Responses
List of Figures Appendix A
Figure 1: Wolfe Island Project Layout Figure 2: Wolfe Island Waterfowl Survey Location Figure 3: Marsh and Breeding Waterfowl Area Search Route Figure 4: Location of Grassland and Marsh Breeding Bird Points Counts Figure 5: Post-Construction Breeding Bird Area Search Locations Figure 6: Woodlot Point Count and Area Search Location Figure 7: Fatalities by Date Figure 8: Fatalities at each Turbine Figure 9: Comparison of Bat Fatalities vs Mean Overnight Wind Figure 10: Comparison of Wintering Raptor Concentration 2006/2007 and 2009/2010 Figure 11 Comparison of Wintering Short-eared Owl Concentration 2006/2007 and
2009/2010 Figure 12: Comparison of Wintering Spring Waterfowl Foraging in 2007 and 2010 Figure 13: Comparison of Spring Waterfowl Morning Movement 2007 and 2010 Figure 14: Comparison of Spring Waterfowl Evening Movement 2007 and 2010

WOLFE ISLAND WIND PLANT POST-CONSTRUCTION FOLLOW-UP PLAN BIRD AND BAT RESOURCES MONITORING REPORT NO. 3, JANUARY - JUNE 2010
Table of Contents
iv cm w:\active\60960494\reports\monitoring report #3 (2010 jan-june)\rpt_2011-01-24_60494_wi-pcm-report-3_fin.docx
List of Tables Appendix B
Table 2.1: Aerial Waterfowl Survey Sectors Table 2.2: Species Composition of Waterfowl Guilds Table 3.1 Results of Searcher Efficiency Trials April – July 2010 Table 3.2: Weighted Searcher Efficiency by Month Table 3.3: Results of Scavenger Trials by Month Table 3.4: Summary of Bird Fatalities, Reporting Period Table 3.5: Calculation of Bird (Raptor) Mortality Rates, January – June 2010 Table 3.6: Calculation of Bird Mortality Rates (Excluding Raptors), January – June 2010 Table 3.7: Summary of Bat Fatalities, Reporting Period Table 3.8: Calculation of Bat Mortality Rates, January – June 2010 Table 3.9: Winter Raptor Survey Results, November 2009 to March 2010 Table 3.10: Comparison of total winter raptor observations, November to March 2006/2007 and
2009/2010. Table 3.11: Summary of Kingston Area Christmas Bird Count results from 2000-2009 Table 3.12: Comparison of Species Composition of Field Foraging Waterfowl: March-May 2007
and March-May 2010 Table 3.13: Comparison of Foraging Field Selection by Waterfowl: March-May 2007 and
March-May 2010 Table 3.14: Spring 2010 Waterfowl Morning Movement Table 3.15: Spring 2010 Waterfowl Evening Movement Table 3.16: Comparison of Waterfowl Use by Sector Table 3.17: Comparison of Waterfowl Use by Staging Area Table 3.18: Comparison of Waterfowl Use by Guild Table 3.19: Number of waterfowl breeding pairs observed in each wetland in May 2010 Table 3.20: Comparison of Breeding Densities (pairs/10ha), as measured by point count, in
grassland habitat between 2006 and 2007 pre-construction and 2010 post-construction surveys
Table 3.21: Comparison of breeding bird densities (pairs/10ha) at three distance regimes from WTG bases, as measured by grassland paired point counts.
Table 3.22: Comparison of Breeding Bird density (pairs/10ha) between pre-construction (2007) and post-construction (2010) grassland area searches across all sectors
Table 3.23: Comparison of Breeding Bird density (pairs/10ha) between pre-construction (2007) and post-construction (2010) grassland area searches in only sectors with grassland habitat (i.e. hay or pasture).
Table 3.24: Comparison of Breeding Species Densities (pairs/10ha), as measured by point count, in wetland habitat between 2006/2007 pre-construction and 2010 post-construction surveys

WOLFE ISLAND WIND PLANT POST-CONSTRUCTION FOLLOW-UP PLAN BIRD AND BAT RESOURCES MONITORING REPORT NO. 3, JANUARY - JUNE 2010
Table of Contents
cm w:\active\60960494\reports\monitoring report #3 (2010 jan-june)\rpt_2011-01-24_60494_wi-pcm-report-3_fin.docx v
Table 3.25: Comparison of Wetland Area Search Results between 2007 pre-construction and 2010 post-construction surveys. Results are expressed as number of pairs observed along each route.
Table 3.26: Comparison of Forest Breeding Species Densities (pairs/10ha) in Woodland Habitat between 2008 pre-construction and 2010 post-construction surveys
Table 3.27: Summary of Notifications - Reporting Period

WOLFE ISLAND WIND PLANT POST-CONSTRUCTION FOLLOW-UP PLAN BIRD AND BAT RESOURCES MONITORING REPORT NO. 3, JANUARY - JUNE 2010
Table of Contents
vi cm w:\active\60960494\reports\monitoring report #3 (2010 jan-june)\rpt_2011-01-24_60494_wi-pcm-report-3_fin.docx
This page left blank intentionally.

WOLFE ISLAND WIND PLANT POST-CONSTRUCTION FOLLOW-UP PLAN BIRD AND BAT RESOURCES MONITORING REPORT NO. 3, JANUARY - JUNE 2010
cm w:\active\60960494\reports\monitoring report #3 (2010 jan-june)\rpt_2011-01-24_60494_wi-pcm-report-3_fin.docx 1.1
1.0 Introduction
1.1 PROJECT OVERVIEW
TransAlta Corporation, through its wholly owned subsidiary Canadian Renewable Energy Corporation (“CREC”), has developed a 197.8 MW wind plant on Wolfe Island, Township of Frontenac Islands, Frontenac County, Province of Ontario. Eighty-six 2.3 MW WTGs and ancillary facilities have been placed over the western portion of Wolfe Island (Figure 1, Appendix A) with additional supporting electrical infrastructure on the Kingston mainland.
BirdLife International, in cooperation with Bird Studies Canada and Nature Canada, has identified Wolfe Island as an Important Bird Area (“IBA”) due to the presence of globally and continentally significant numbers of “congregatory” waterfowl species that gather offshore during the spring migration (information is available at www.bsc-eoc.org/iba/site.jsp?siteID=ON037). In addition, Wolfe Island supports notable landbird populations (albeit not in numbers of global or continental importance) including wintering raptors and Tree Swallows.
The high quality grassland habitat that attracts wintering raptors also supports a high abundance and diversity of grassland breeding bird species of conservation priority (Cadman et al., 2007; Ontario Partners in Flight, 2006). As discussed in Section 7.9.1 of the Environmental Review Report (“ERR”), Wolfe Island is a Category 4 Level of Concern Project from the perspective of bird use, based on criteria provided in Environment Canada’s Wind Turbines and Birds: A Guidance Document for Environmental Assessment (April, 2007a).
Wolfe Island would be a Sensitivity Rating 3 (High) project for bats based on the criteria provided in the Ontario Ministry of Natural Resources Guideline to Assist in the Review of Wind Power Proposals: Potential Impacts to Bats and Bat Habitats (August 2007). Potential concerns with bats are generally associated with the Project’s proximity to the shoreline of Lake Ontario, which could potentially act as a corridor or channeling feature for migrating bats.
Recognizing the IBA designation related to waterfowl, as documented in the Project’s ERR, and the importance of the area to wintering raptors and breeding grassland birds, extensive primary pre-construction data were collected through multiple-year bird and bat baseline studies on Wolfe Island. These data were further augmented with secondary data from published and unpublished sources to generate a robust data set from which to assess the potential effects of the Project during its operation phase.
The potential bird and bat effects and associated mitigation measures, based upon this dataset, ornithological advice, and professional opinion, among other factors, are provided in ERR Section 7.9. Additionally, bird and bat post-construction monitoring commitments are provided in ERR Section 9.4. These commitments provide the first step of confirming the ERR

WOLFE ISLAND WIND PLANT POST-CONSTRUCTION FOLLOW-UP PLAN BIRD AND BAT RESOURCES MONITORING REPORT NO. 3, JANUARY - JUNE 2010 Introduction January 2011
1.2 cm w:\active\60960494\reports\monitoring report #3 (2010 jan-june)\rpt_2011-01-24_60494_wi-pcm-report-3_fin.docx
predictions of potential effects and provide the basis from which the need for mitigative actions, if any, may be determined.
1.2 POST-CONSTRUCTION FOLLOW-UP PLAN
A formal Post-Construction Follow-up Plan for Bird and Bat Resources (“Follow-up Plan”) was developed among CREC, Environment Canada / Canadian Wildlife Service, the Ontario Ministry of Natural Resources, Natural Resources Canada, and Ducks Unlimited Canada (collectively the “parties”) in consideration of the unique features of Wolfe Island. The final Follow-up Plan was posted to the Wolfe Island Project website in May, 2009 following a period of public comment on a draft Follow-up Plan.
The Follow-up Plan was subsequently revised to reflect site-specific findings available from the 2009 studies on Wolfe Island, and revised guidance materials available from the regulatory agencies. The revised Follow-up Plan (February, 2010) has been posted on TransAlta’s Wolfe Island Wind Plant website at www.transalta.com/wolfeisland for stakeholder information. Hard copies were also made available at the Township office on Wolfe Island and at the public library on Wolfe Island. The previous version of the Plan (May, 2009), a summary of stakeholder comments received on the draft Follow-up Plan, and written notification of the revised Follow-up Plan are also available on the Project website, the Township office and the public library on Wolfe Island for stakeholder review.
The objective of the Follow-up Plan was to set out the methods used to assess the direct and indirect effects of the 86 WTGs on the birds and bats of Wolfe Island and, if necessary, to implement appropriate measures to mitigate adverse environmental effects so they do not become significant. The Follow-up Plan was designed by the parties to achieve all of the provincial and federal commitments and requirements.
The Follow-up Plan is to be fully implemented upon commencement of commercial operations. The implementation of the Follow-up Plan will test the predictions of the ERR prepared in accordance with the Ontario Environmental Assessment Act and the Canadian Environmental Assessment Act. Should any unanticipated adverse environmental effects be identified, it is the goal of the Follow-up Plan to mitigate those effects such that they do not become significant.
1.3 MONITORING REPORT OVERVIEW
The Follow-up Plan specifies bi-annual post-construction monitoring reporting for periods ending June 30 and December 31. This report, the third in a series, contains the results of the post-construction monitoring program for the period between January 1 and June 30, 2010 (the “Reporting Period”).

WOLFE ISLAND WIND PLANT POST-CONSTRUCTION FOLLOW-UP PLAN BIRD AND BAT RESOURCES MONITORING REPORT NO. 3, JANUARY - JUNE 2010 Introduction January 2011
cm w:\active\60960494\reports\monitoring report #3 (2010 jan-june)\rpt_2011-01-24_60494_wi-pcm-report-3_fin.docx 1.3
Consistent with the schedule for post-construction monitoring outlined in Section 5.1 of the Follow-up Plan, field surveys conducted during the Reporting Period included:
· bird and bat mortality monitoring
· disturbance effects monitoring – wintering raptors
· disturbance effects monitoring – staging and foraging migratory waterfowl
· disturbance effects monitoring – breeding waterfowl
· disturbance effects monitoring – breeding grassland, woodland and marsh birds

WOLFE ISLAND WIND PLANT POST-CONSTRUCTION FOLLOW-UP PLAN BIRD AND BAT RESOURCES MONITORING REPORT NO. 3, JANUARY - JUNE 2010 Introduction January 2011
1.4 cm w:\active\60960494\reports\monitoring report #3 (2010 jan-june)\rpt_2011-01-24_60494_wi-pcm-report-3_fin.docx
This page left blank intentionally.

WOLFE ISLAND WIND PLANT POST-CONSTRUCTION FOLLOW-UP PLAN BIRD AND BAT RESOURCES MONITORING REPORT NO. 3, JANUARY - JUNE 2010
cm w:\active\60960494\reports\monitoring report #3 (2010 jan-june)\rpt_2011-01-24_60494_wi-pcm-report-3_fin.docx 2.1
2.0 Methods
2.1 MORTALITY MONITORING
2.2 FIELD SURVEYS
Mortality monitoring was carried out by employees of Wolfe Island Wind Monitoring, an independent consulting firm. Their activities were carried out according to a schedule and methods prepared by Stantec that were based on the Follow-up Plan.
The Follow-up Plan specifies that carcass searches are to be conducted at half the WTGs twice per week and at the other half once per week; the two groups shall be rotated so that one week the subset of WTGs receives the less intensive treatment, and the next week the more intensive treatment. Prior to the start of carcass searches, a schedule was prepared to ensure all WTGs received the appropriate coverage (Appendix C). To reduce some imprecision arising from the alternating carcass search schedule, one recommendation of Monitoring Report No. 2 (Stantec Consulting Ltd., May 2010) was to change to a search schedule in which one half the WTGs are searched twice weekly (3.5 day search interval) and the other half are searched once weekly (7 day search interval). Mortality estimates were calculated separately for each treatment. With agreement from the agencies, the latter approach was adopted starting at the beginning of May 2010.
Carcass searches for birds and bats were conducted at operating WTGs on weekdays during the Reporting Period, consistent with the Follow-Up Plan. Carcass searches were not conducted under hazardous weather conditions (e.g., thunder and lightning), or when maintenance or reclamation activities prevented access or presented a safety concern. A complete summary of survey dates, times, and weather conditions is provided in Appendix D.
The carcass searches consisted of one surveyor searching clear or minimally-vegetated portions (as recommended by Environment Canada [2007b]) of a 50 m radius area under each WTG, walking concentric transects spaced at 7 m intervals starting at 2 m from the turbine base. The search area radius and the locations of the transects at each WTG were determined using laser rangefinders with an accuracy of ±1 m.
If a bird or bat carcass was discovered, the following information was recorded:
· date and time it was found
· state of decomposition
· estimated number of days since death
· injury sustained (or best estimate if the carcass was in poor condition)

WOLFE ISLAND WIND PLANT POST-CONSTRUCTION FOLLOW-UP PLAN BIRD AND BAT RESOURCES MONITORING REPORT NO. 3, JANUARY - JUNE 2010 Methods January 2011
2.2 cm w:\active\60960494\reports\monitoring report #3 (2010 jan-june)\rpt_2011-01-24_60494_wi-pcm-report-3_fin.docx
· species (or best estimate if the carcass was in poor condition)
· distance and direction from the nearest WTG
· substrate in which the carcass was found.
Carcasses were photographed, collected, and transported to an on-site freezer by Wolfe Island Wind Monitoring for confirmation of species by Stantec, if necessary. Those that were found in reasonable condition were kept for later use in searcher efficiency trials.
2.2.1 Correction Factors and Data Analysis
Information to calculate various corrective factors for searcher efficiency and scavenging rates was also collected during the Reporting Period. Correction factors were calculated to account for carcasses that fell in areas that were not searched as a result of dense vegetation, standing water or other obstacles, for carcasses that were overlooked, and for carcasses that were removed by scavengers prior to the search.
There are numerous published and unpublished approaches to incorporating these corrective factors into an overall assessment of total bird and bat mortality. Currently, as documented in the Follow-up Plan, Environment Canada and the Canadian Wildlife Service recommend the following correction formula:
C = c / (Se x Sc x Ps), where
C is the corrected number of bird or bat fatalities
c is the number of carcasses found
Se is the proportion of carcasses expected to be found by searchers (searcher efficiency)
Sc is the proportion of carcasses not removed by scavengers over the search period
Ps is the percent of the area searched.
Correction factors for raptors and vultures are expected to be significantly different than those for small birds and bats, for the following reasons:
· searcher efficiency rates are higher than average for larger birds
· larger and heavier birds are more likely to land closer to the wind turbine generators

WOLFE ISLAND WIND PLANT POST-CONSTRUCTION FOLLOW-UP PLAN BIRD AND BAT RESOURCES MONITORING REPORT NO. 3, JANUARY - JUNE 2010 Methods January 2011
cm w:\active\60960494\reports\monitoring report #3 (2010 jan-june)\rpt_2011-01-24_60494_wi-pcm-report-3_fin.docx 2.3
· scavenger rates are lower for larger birds as they are harder for scavengers to carry off. There is also some evidence from western North America that scavengers may have an aversion to the carcasses of large hawks (Strickland and Morrison, 2008).
As a result, Se and Ps are estimated to be 1.0 for raptors and vultures. An estimate of Sc for raptors and vultures was determined through a January scavenger trial using 3 raptor and 3 vulture carcasses. Therefore, in calculating the total number of bird fatalities, raptor and vulture fatalities were corrected separately. The corrected number of raptor and vulture fatalities was added to the corrected number of other bird fatalities to obtain the total estimated number of bird fatalities:
C = (c1/ (Se1 x Sc1 x Ps1)) + (c2 / (Se2 x Sc2 x Ps2)), where
C is the corrected number of bird fatalities
c1 is the number of raptor or vulture carcasses found
c2 is the number of other carcasses found
Se is the proportion of raptor/vulture carcasses (Se1) or other carcasses (Se2) expected to be found by searchers (searcher efficiency)
Sc is the proportion of raptor/vulture carcasses (Sc1) or other carcasses (Sc2) not removed by scavengers over the search period
Ps is the percent of the area searched for raptors/vultures (Ps1) or other carcasses (Ps2).
The total number of bird or bat fatalities was divided by the number of turbines (i.e., 86) and the number of MW (i.e., 197.8) to obtain the estimated mortality rates by turbine and by MW for the Reporting Period.
2.2.1.1 Searcher Efficiency
Searcher efficiency trials are designed to correct for carcasses that may be overlooked by searchers during the survey periods. Environment Canada (2007b) provides detailed recommendations on determining searcher efficiency, expressed as a proportion of carcasses expected to be found by individual searchers.
During the Reporting Period, searcher efficiency trials involved a “tester” that placed carcasses under WTGs prior to the standard carcass searches over a period of several weeks between April 22 and July 19, 2010 to test each searcher’s detection rate. The trials involved between 10 and 25 test bird carcasses for each of the three searchers.

WOLFE ISLAND WIND PLANT POST-CONSTRUCTION FOLLOW-UP PLAN BIRD AND BAT RESOURCES MONITORING REPORT NO. 3, JANUARY - JUNE 2010 Methods January 2011
2.4 cm w:\active\60960494\reports\monitoring report #3 (2010 jan-june)\rpt_2011-01-24_60494_wi-pcm-report-3_fin.docx
Searcher efficiency is expressed as a proportion of unscavenged carcasses found by individual searchers. Searcher efficiency (Se) was calculated for each searcher as follows:
Se = number of test carcasses found
number of test carcasses placed – number of test carcasses removed by scavengers
Because searchers surveyed varying numbers of turbines over the course of the mortality monitoring, it was necessary to find a weighted average which reflected the proportion of turbines each searcher surveyed. This weighted average, or overall Se, was calculated as follows:
Seo = Se1(n1/T) + Se2(n2/T) + Se3(n3/T)
where: Seo is the overall searcher efficiency;
Se1 –Se3 are individual searcher efficiency ratings;
n1 – n3 is quantity of search days completed by each searcher; and
T is the total number of search days completed by all searchers.
2.2.1.2 Scavenger Trials
Scavenger trials are designed to correct for carcasses that are removed by scavenging animals before the search period. These trials involve the distribution of carcasses in known locations at each WTG, followed by periodic checking to determine the rate of removal.
During the Reporting Period, three two-week scavenger trials were conducted during the months of January, May and June. Two dead, dark-coloured chicks were placed in two locations within the 50 m search radius around one half of the WTGs. In May and June, trial carcasses were split between turbines that were searched once weekly and turbines that were searched twice weekly. If there was more than one substrate type (e.g., gravel, hay, crop, or ploughed soil), the two chicks were placed on different substrates. UTM coordinates were taken at each chick location and the distance and direction from the WTG were measured.

WOLFE ISLAND WIND PLANT POST-CONSTRUCTION FOLLOW-UP PLAN BIRD AND BAT RESOURCES MONITORING REPORT NO. 3, JANUARY - JUNE 2010 Methods January 2011
cm w:\active\60960494\reports\monitoring report #3 (2010 jan-june)\rpt_2011-01-24_60494_wi-pcm-report-3_fin.docx 2.5
Chick carcasses were placed on January 3, May 16, and June 13, 2010, with their presence or absence recorded during regularly-scheduled carcass searches over the subsequent two weeks. In May, some regularly-scheduled checks could not be carried out due to WTG maintenance or weather. To ensure an accurate value of Sc, trial carcasses were only included in the calculation if data were available from the first scheduled check. Proportions of carcasses remaining after each search interval were pooled to calculate the overall scavenger correction (Sc) factors as follows:
Sc = nvisit1 + nvisit2 + nvisit3, +… where
nvisit0 + nvisit1 + nvisit2 +…
Sc is the proportion of carcasses not removed by scavengers over the search period
nvisit0 is the total number of carcasses placed
nvisit1 – nvisit3 are the numbers of carcasses remaining on visits 1 through 3
Sc is expected to vary with the length of the search interval, i.e., the proportion of carcasses not removed by scavengers over the search period is expected to be higher for shorter search intervals and lower for longer search intervals. In May and June, Sc was calculated separately for the two WTG treatments (searched once weekly [7 day search interval] and searched twice weekly [3.5 day search interval]).
An additional scavenger trial was conducted using three raptor carcasses, placed at three different WTGs on January 3, and three vulture carcasses, placed at three different WTGs on January 11. Their presence or absence was recorded during regularly-scheduled carcass searches over the subsequent two weeks, and Sc for raptors and vultures was calculated in the manner as described above.
2.2.1.3 Percent Area Searched
Environment Canada has indicated that 85% to 88% of carcasses fall within 50 m of a WTG base (C. Francis, pers. comm., January 2008). Environment Canada (2007b) also specifies that for a WTG of the size as those on Wolfe Island, most bat carcasses fall within 50 m. Furthermore, it is generally agreed in the literature that the density of carcasses decreases with distance from the WTG base (e.g., Jain et al., 2007; Kerns et al., 2005 [as cited in Arnett et al., 2008]). Accordingly, and to be comparable to the results of post-construction monitoring reported for other Ontario wind power facilities, and in accordance with the Follow-Up Plan, the percent area searched was calculated based on a 50 m radius circle.
Ps was 100% during January and February, when the entire search areas were snow-covered and could be readily accessed. Ps was calculated for the remainder of the Reporting Period

WOLFE ISLAND WIND PLANT POST-CONSTRUCTION FOLLOW-UP PLAN BIRD AND BAT RESOURCES MONITORING REPORT NO. 3, JANUARY - JUNE 2010 Methods January 2011
2.6 cm w:\active\60960494\reports\monitoring report #3 (2010 jan-june)\rpt_2011-01-24_60494_wi-pcm-report-3_fin.docx
based on data collected during regularly-scheduled surveys at between March 29 and April 2, May 24 to May 28, and June 28 to July 2. In each season, searchers filled out a 50 m radius circle diagram with 5 m x 5 m grid cells for each WTG, sketching areas searched and identifying areas that could not be searched due to vegetation cover or other factors. The area searched was determined for each WTG or MET tower by counting the number of searched grid cells within 50 m, and dividing the summed area of those cells by the total area within a 50 m radius circle to determine the percent area searched for that turbine (Psx, where x is the turbine number or the MET tower).
Psx = area searched within 50 m radius circle
π (50)2
The overall Ps for the facility during the search period was calculated as the average of Ps1 through Ps86, with Ps for MET towers calculated separately:
Ps = Ps1 + Ps2 + Ps3 + …. + Ps86
86
In May and June, Ps was calculated separately for the two WTG treatments (searched once weekly [7 day search interval] and searched twice weekly [3.5 day search interval]).
2.3 AGENCY SITE VISITS
NRCan has prepared a “Report on Ensuring Implementation of the Wolfe Island EcoPower Centre’s Post-Construction Follow-up Plan for Bird and Bat Resources (PCFP)” based on the results of site visit audits by MNR and EC in winter, spring and early summer. The report concluded that MNR and EC have indicated that the PCFP is being implemented as expected, and provided some recommendations for future surveys (Appendix E).
2.4 DISTURBANCE EFFECTS
Disturbance studies completed during the Reporting Period include winter raptor surveys, spring waterfowl migrant studies (i.e. field foraging surveys, overland movement surveys and aerial surveys of bays, wetlands and rivers), waterfowl breeding pairs surveys and breeding bird surveys. Breeding bird surveys included point counts and area searches of grassland, wetland and woodland habitat. In total, forty-two point counts (27 in grassland, 8 in wetland and 7 in woodland habitat) were conducted in the same locations as the pre-construction surveys, using the same, standard point count protocols as the pre-construction surveys. In addition to the standard point counts, paired point counts were conducted at turbine locations in grassland habitat and playback surveys were conducted at wetland point count stations.
WOLFE ISLAND WIND PLANT POST-CONSTRUCTION FOLLOW-UP PLAN BIRD AND BAT RESOURCES MONITORING REPORT NO. 3, JANUARY - JUNE 2010 Methods January 2011
cm w:\active\60960494\reports\monitoring report #3 (2010 jan-june)\rpt_2011-01-24_60494_wi-pcm-report-3_fin.docx 2.7
Survey dates, times and weather conditions for all disturbance effects monitoring surveys are provided in Appendix D.
2.4.1 Winter Raptor Surveys
Pre-construction baseline winter raptor surveys were conducted to establish areas of raptor use and general behaviour in the study area. The purpose of the post-construction winter raptor use surveys is to assess potential displacement or disturbance effects (i.e., distribution and abundance) to these species compared to pre-construction conditions.
The post-construction winter raptor surveys were carried out using the same survey protocols as the pre-construction baseline surveys conducted in 2006-2007. On each date, a late afternoon survey was conducted for raptors and an early evening survey (from sunset to dusk) was conducted for Short-eared Owls. Two vehicles were used on each survey, with an experienced surveyor and a driver in each vehicle. The use of two vehicles allowed the study area to be more thoroughly covered during the early evening period.
All north-south roads and most of the east-west roads in the study area were driven at slow speeds (i.e., 30-40 km/h). The fields and woodlots were scanned using binoculars to detect any raptors, and a spotting scope was used for closer inspection of stationary birds. All raptors and owls were recorded and their locations mapped.
On each visit, weather conditions, the route taken and the number of kilometers driven were recorded. Density estimates were calculated as the number of raptors or owls per km travelled. Visibility during each of the surveys was good or excellent.
Winter raptor surveys were completed once every two weeks in November, 2009 through March, 2010. Monitoring Report No. 2 - July to December 2009, presented the findings of the November and December 2009 winter raptor surveys. This report will address the entire winter raptor season (i.e. November 2009 to March 2010) which will allow for a full comparison to 2006-2007 results.
2.4.2 Foraging Waterfowl Surveys
In spring and fall, geese and dabbling ducks that stage in the bays surrounding Wolfe Island move inland to forage in agricultural fields. Studies were completed during the Reporting Period to examine any changes in patterns of spring foraging across the study area compared to pre-construction conditions.
The post-construction spring foraging waterfowl surveys were conducted using the same protocols as the pre-construction baseline surveys carried out in the spring of 2007. Weekly daytime surveys were conducted for 8 consecutive weeks during peak waterfowl migration and staging, between March 24 and May 13, 2010.

WOLFE ISLAND WIND PLANT POST-CONSTRUCTION FOLLOW-UP PLAN BIRD AND BAT RESOURCES MONITORING REPORT NO. 3, JANUARY - JUNE 2010 Methods January 2011
2.8 cm w:\active\60960494\reports\monitoring report #3 (2010 jan-june)\rpt_2011-01-24_60494_wi-pcm-report-3_fin.docx
These daytime surveys consisted of two experienced surveyors driving all north-south roads and the majority of the east-west roads in the study area at slow speeds (i.e., 30-40 km/h), using binoculars to scan fields and open areas. Information on species, numbers, location, and activity for all waterfowl observed inland was recorded and mapped.
Data on waterfowl use of fields was calculated in the form of “waterfowl days”, as described in Dennis and Chandler (1974) as cited by Ross (1989). This analysis involves averaging results for each successive pair of surveys, multiplying the results by the number of days separating each pair, and summing over the migration period.
2.4.3 Overland Waterfowl Movement Surveys
The purpose of the overland movement surveys was to record movement of waterfowl across the study area at dawn and dusk, when waterfowl are most active. Although some movement of waterfowl may occur throughout the day, the largest movements occur at dawn, with waterfowl moving from the bays into the fields to forage, and at dusk, with waterfowl returning from the fields into the bays to roost for the night. The post-construction waterfowl movement surveys were carried out using the same protocols established during the pre-construction baseline surveys conducted in the fall of 2007.
The surveys were conducted weekly for 8 consecutive weeks from late March to mid-May. During each survey, two observers were stationed at separate points (Figure 12, Appendix A) placed at locations with locally high elevation and good visibility towards the bays. One observer was situated on the western side of the study area, with views towards Pyke’s Bay, Big Sandy Bay Wetland and Reeds Bay Wetland. The other observer was situated on the eastern side of the study area with views towards Bayfield Bay Marsh and Button Bay Wetland.
The same two locations were used for each survey in both the 2007 and 2010 waterfowl studies. Movement of waterfowl flocks was mapped and the height, direction, and flight path were recorded along with the size of the flock and species, where possible.
2.4.4 Aerial Waterfowl Surveys
The purpose of the aerial waterfowl surveys was to record the abundance of staging waterfowl in the bays, shorelines and coastal marshes around Wolfe Island. The surveys focused on both the western and eastern portions of the island.
Aerial surveys were conducted in association with Canadian Wildlife Service (“CWS”), following the methods used by CWS as outlined in Ross (1989). The same methods were used for CWS’s 1999 waterfowl surveys, the 2008 pre-construction monitoring, and the 2009 and 2010 post-construction monitoring.
WOLFE ISLAND WIND PLANT POST-CONSTRUCTION FOLLOW-UP PLAN BIRD AND BAT RESOURCES MONITORING REPORT NO. 3, JANUARY - JUNE 2010 Methods January 2011
cm w:\active\60960494\reports\monitoring report #3 (2010 jan-june)\rpt_2011-01-24_60494_wi-pcm-report-3_fin.docx 2.9
Pre-construction surveys were undertaken by Stantec and CWS in the spring of 2008. In the spring of 2009, construction of the facility was occurring with turbines erected and a few beginning to come on-line during the waterfowl staging season (i.e. late March to early May). During the construction of spring 2009, CWS conducted aerial waterfowl surveys of Wolfe Island as part of their eastern Lake Ontario studies and provided the results to Stantec. In the spring of 2010, when the project was fully operational, Stantec undertook post-construction surveys of staging waterfowl.
In the spring of each year (i.e. 2008 to 2010), surveys were conducted over an 8 week period from late-March/early April to early May. Surveys were conducted from a four-seater fixed-wing aircraft by two qualified surveyors accompanied by one pilot. One surveyor was situated in the front passenger (shore) side of the plane, while the other was situated in the back left, behind the pilot (offshore side). The plane departed from the Kingston airport and completed a standardized route following a line roughly 200 metres off the shoreline. Waterfowl numbers were assessed, and individuals were identified to species where possible, and to larger species grouping (guild) when segregation to species was not possible. Observations were recorded on digital recorder and later transcribed onto paper data forms.
Data were recorded according to a sector system as established by CWS (see Figure 2.0, Appendix A and Table 2.1, Appendix B). Data for each of the major staging areas (i.e., Bayfield Bay, Button Bay, Pyke’s Bay and Reed’s Bay) were collected separately so specific results could be discerned from the sectors. Species were grouped into one of eight guilds (Table 2.2, Appendix B). Data on waterfowl use of bays are presented in the form of “waterfowl days”, as calculated in Dennis and Chandler (1974) and cited by Ross (1989).
2.4.5 Waterfowl Breeding Pairs Surveys
The purpose of the waterfowl breeding pairs survey was to record the density of breeding waterfowl in wetlands adjacent to the Project. Daytime surveys for breeding waterfowl were conducted twice in early May, 2010 within major wetlands in the vicinity to the Project. Button Bay Marsh and Big Sandy Bay Wetland were traversed on foot from the edge and trails. Bayfield Bay Marsh, Reed’s Bay Wetland and Sandy Bay Wetland were less accessible and therefore traversed by canoe. The routes traveled in each wetland are shown in Figure 3.0, Appendix B.
The location and species of all waterfowl were recorded. For species with sexual dimorphism, the number of males and females in each grouping were noted. Waterfowl sightings were assessed record by record and considered to be breeding (versus migrating) based on the species’ breeding range, late migration date, early nesting date, and habitat requirements during breeding and migration. The Canadian Wildlife Service’s table “Calculation of Indicated Pairs” was used to determine the number of breeding pairs.

WOLFE ISLAND WIND PLANT POST-CONSTRUCTION FOLLOW-UP PLAN BIRD AND BAT RESOURCES MONITORING REPORT NO. 3, JANUARY - JUNE 2010 Methods January 2011
2.10 cm w:\active\60960494\reports\monitoring report #3 (2010 jan-june)\rpt_2011-01-24_60494_wi-pcm-report-3_fin.docx
2.4.6 Grassland Breeding Bird Point Counts, Paired Point Counts and Area Searches
The post-construction grassland breeding bird surveys gathered extensive data on species presence and breeding density, to be compared to pre-construction conditions. Two types of point count surveys were conducted: pre/post construction point counts and paired point counts.
Each of the 27 point counts in grassland habitat established during pre-construction surveys was resurveyed in 2010, using the same protocols. Due to changes in crop types, some point count locations were adjusted to ensure all 27 were in suitable grassland habitat. Point count locations are shown in Figure 4.0, Appendix A.
Paired point counts were conducted at 20 WTGs that were in prime grassland habitat (Figure 4.0, Appendix A). Paired point counts consisted of two 10-minute point counts; one half circle, 100m-radius point count at the WTG base and one full circle, 100m-radius point count 200m from the base of the WTG. During both point counts, birds were recorded at 100m intervals allowing bird occurrences to be mapped in 100m bands from 0-300 m from the WTG’ s base.
All point counts were conducted twice in June, once during an early June visit and once during a late June visit. Point counts were conducted in the mornings between dawn and 10:00. For each point count, a record was made of the start time and a hand-held GPS unit was used to georeference its location. A brief description of the habitat was recorded for each point count. Each standard point count was conducted for 10 minutes, during which time all breeding pairs were recorded within 100m of the observer.
In addition to the point counts, area searches were repeated using the same areas and protocols as the pre-construction baseline surveys in 2007 (Figure 5.0, Appendix B). Each area search covered two large tracts of high quality grassland habitat with relatively high WTG density, one in the northwestern portion of the study area (199ha) and the other in the southeastern portion (195ha). Both area searches were conducted twice in June, 2010.
The “Southeast Area” was located between Concession 9 and Concession 8, and between Reeds Bay Road and Bennett Road. Landowner permission determined which fields were surveyed. The area was broken into twelve sub-areas, or “sectors”, based on land use. Separate lists of breeding birds were recorded for each sector. The Southeast Area contained several open country habitats including 57.9 ha of hay, 107.1 ha of pasture and 30.5 ha of wheat. There was more suitable habitat for grassland birds in the Southeast Area during the post-construction survey, as some cropland had been converted to hay since 2007. Total grassland habitat (i.e. hay and pasture) in the Southeast Area encompassed 141.1ha in 2007 and 164.9 ha in 2010, a 17% increase.
The “Northwest Area” was located between Concession 2 and Concession 3 for approximately 500 m north of and 1200 m south of Baseline Road. This area was broken into six sub-areas, or “sectors” based on land use. Separate lists of breeding birds were recorded for each sector.

WOLFE ISLAND WIND PLANT POST-CONSTRUCTION FOLLOW-UP PLAN BIRD AND BAT RESOURCES MONITORING REPORT NO. 3, JANUARY - JUNE 2010 Methods January 2011
cm w:\active\60960494\reports\monitoring report #3 (2010 jan-june)\rpt_2011-01-24_60494_wi-pcm-report-3_fin.docx 2.11
The Northwest Area encompassed 146.5ha of hay fields, 24.4ha of plowed field and 28.7ha of fallow field. The fallow field had been recently fallowed, containing early successional species such as horseweed, chickweed and wild mustards, but little grass cover; it was not considered grassland habitat, as it did not support species such as Bobolink. As some fields supporting hay in 2007 were plowed in 2010, less grassland habitat was present during the post-construction survey. Total grassland habitat (i.e. hay) encompassed 199.6 ha in 2007 and 146.5 ha in 2010, a 27% decrease.
Each area search consisted of walking predetermined transects through the designated area. Transects ran parallel through each area at 200 m intervals. While in the field, aerial photography was used to navigate along the routes, while a GPS unit assisted in spacing the transects. Tallies of all breeding pairs of each species were recorded. For grassland birds, separate tallies were made for each parcel.
A conservative approach to breeding status was taken. The presence of a male bird (singing, displaying, perched or flying) in appropriate breeding habitat was considered to represent a breeding pair. Of the grassland species present, Bobolink required additional consideration to record accurate numbers of breeding pairs, due to their colonial nesting habits. Therefore, Bobolinks were counted on a landscape scale, recording the number of flying and/or displaying males in each colony as they were encountered.
Some species, such as the Northern Harrier or Upland Sandpiper, frequently travel some distance while hunting or displaying. A single individual of these species could likely be encountered on two or more of the transects. In the case of Northern Harrier, a single individual could be encountered throughout an area search. However, the relatively large size and conspicuous flight of these species made it relatively easy to track individuals and avoid double counting.
To standardize the data, all breeding bird point count and area search results were expressed in pair densities per 10 ha. To address changes in the amount of grassland habitat (i.e. hay and pasture) within the area searches between pre and post construction, the density was also calculated within just the grassland sectors. For paired point counts, an Analysis of Variation (ANOVA) was performed to determine whether the differences in the most commonly observed species’ densities were significant among of the distance regimes.
2.4.7 Wetland Breeding Bird Point Counts and Area Searches
The wetland breeding bird surveys recorded species presence and density of breeding birds in major wetlands adjacent to the Project. The purpose of the surveys was to establish post-construction data to examine any disturbance/displacement effects on breeding wetland birds compared to pre-construction surveys.

WOLFE ISLAND WIND PLANT POST-CONSTRUCTION FOLLOW-UP PLAN BIRD AND BAT RESOURCES MONITORING REPORT NO. 3, JANUARY - JUNE 2010 Methods January 2011
2.12 cm w:\active\60960494\reports\monitoring report #3 (2010 jan-june)\rpt_2011-01-24_60494_wi-pcm-report-3_fin.docx
Wetland point counts and area searches were conducted twice in June 2010 using the same locations and protocols as the pre-construction surveys. Point counts were conducted twice in June, once during an early June visit and once during a late June visit. Point counts were conducted in the mornings between dawn and 10:00. For each point count, a record was made of the start time and a hand-held GPS unit was used to georeference its location. A brief description of the habitat was recorded for each point count. Each standard point count was conducted for 10 minutes, during which time all breeding pairs were recorded within 100m of the observer. The area search routes typically followed open channels and focused on portions of the wetlands in the vicinity of WTG’s. Button Bay Marsh and Big Sandy Bay Wetland were traversed on foot and Bayfield Bay Marsh, Reed’s Bay Wetland and Sandy Bay Wetland were traversed by canoe. Survey routes (same as those used during pre-construction surveys and post-construction waterfowl breeding pairs surveys) are shown in Figure 3.0, Appendix A. The species and number of all breeding pairs heard or seen during the area search were recorded. Observations were recorded at unlimited distance, but restricted to the marsh community.
All eight wetland point counts established during pre-construction surveys were resurveyed in June 2010 (Figure 4.0, Appendix A). Each point count consisted of a standard ten minute, 100m radius point count followed by an additional ten minute playback survey. Playback surveys were used to aid in detection of more secretive marsh bird species, specifically Virginia Rail, Sora, Least Bittern and King Rail, and were conducted in accordance with Bird Studies Canada’s Marsh Monitoring Program (“MMP”) protocols. The playback surveys involved broadcasting taped breeding calls of each species listed above, to induce a vocal or approach response. The call of each species was repeated for a duration of approximately one minute, followed by a one minute pause to listen for a response. The response of marsh birds during the playback survey were recorded at an unlimited radius.
2.4.8 Woodland Breeding Bird Point Counts and Area Searches in Woodlots Larger than 10ha
The woodland breeding bird surveys collected species presence and density of birds in woodlots larger than 10ha in size that are located in proximity to WTG’s. Two forested areas were surveyed, including the woodlot immediately south of the Sand Bay Wetland (16.4 ha) and the wooded area associated with the Big Sandy Bay ANSI (101 ha).
In total, seven standard point counts were conducted in the same location as pre-construction surveys in June 2008, one in the forested area south of the Sand Bay Wetland and six points in the Big Sandy Bay woodlot. Point counts were conducted twice in June, once during an early June visit and once during a late June visit. Point counts were conducted in the mornings between dawn and 10:00. For each point count, a record was made of the start time and a hand-held GPS unit was used to georeference its location. A brief description of the habitat was recorded for each point count. Each standard point count was conducted for 10 minutes, during which time all breeding pairs were recorded within 100m of the observer. Area searches were

WOLFE ISLAND WIND PLANT POST-CONSTRUCTION FOLLOW-UP PLAN BIRD AND BAT RESOURCES MONITORING REPORT NO. 3, JANUARY - JUNE 2010 Methods January 2011
cm w:\active\60960494\reports\monitoring report #3 (2010 jan-june)\rpt_2011-01-24_60494_wi-pcm-report-3_fin.docx 2.13
conducted in both woodlots consisting of traversing the woodlot on foot, along the routes used in pre-construction surveys, and recording all species observed.

WOLFE ISLAND WIND PLANT POST-CONSTRUCTION FOLLOW-UP PLAN BIRD AND BAT RESOURCES MONITORING REPORT NO. 3, JANUARY - JUNE 2010 Methods January 2011
2.14 cm w:\active\60960494\reports\monitoring report #3 (2010 jan-june)\rpt_2011-01-24_60494_wi-pcm-report-3_fin.docx
This page left blank intentionally.

WOLFE ISLAND WIND PLANT POST-CONSTRUCTION FOLLOW-UP PLAN BIRD AND BAT RESOURCES MONITORING REPORT NO. 3, JANUARY - JUNE 2010
cm w:\active\60960494\reports\monitoring report #3 (2010 jan-june)\rpt_2011-01-24_60494_wi-pcm-report-3_fin.docx 3.1
3.0 Results
3.1 MORTALITY MONITORING
3.1.1 Correction Factors
3.1.1.1 Searcher Efficiency
Individual searcher efficiency during the Reporting Period ranged from 10% to 65% (Table 3.1, Appendix B). The overall searcher efficiency was subsequently calculated by weighting the individual searcher efficiencies, according to the proportion of search days surveyed in each month over the Reporting Period. The weighted searcher efficiency values for each month are shown in Table 3.2, Appendix B and ranged from 0.359 to 0.412. These values were applied to assess bat and small bird mortality rates.
Searcher efficiency for raptors and vultures was assumed to be 100% due to the size of these birds. Vegetation cover was non-existent or low over the majority of the Reporting Period, and was not expected to be a significant factor affecting searcher efficiency in the periods of concern (winter and spring migration).
3.1.1.2 Scavenger Removal
Analysis of the scavenger trial indicates that in the winter, on average, 89.4% of trial carcasses were not removed by scavengers over the average search interval (Table 3.3, Appendix B). The winter results were applied in January, February and March. In spring, the May scavenger trial indicated that, on average, 54.4% of carcasses were not removed by scavengers over the 3.5 day search interval, and 36.2% were not removed by scavengers over the 7 day search interval (Table 3.3, Appendix B). The value for April scavenger removal was calculated as the combined May 3.5 and 7 day search interval results. In June, the scavenger trial indicated that, on average, 60% of carcasses were not removed by scavengers over the 3.5 day search interval, and 29.1% were not removed by scavengers over the 7 day search interval (Table 3.3, Appendix B).These values were applied to assess bat and small bird mortality rates.
The scavenger removal rate of raptor and vulture carcasses is expected to be less than for that of bats and smaller birds for the reasons discussed in Section 2.1.2. Based on the early January scavenger trial using Red-tailed Hawk and Turkey Vulture carcasses, approximately 94.1% of raptor and vulture carcasses were not removed by scavengers over the average search interval (n=17). Although just one Red-tailed Hawk carcass was moved by scavengers during the trial, it was refound within the search radius on February 16, 2010.

WOLFE ISLAND WIND PLANT POST-CONSTRUCTION FOLLOW-UP PLAN BIRD AND BAT RESOURCES MONITORING REPORT NO. 3, JANUARY - JUNE 2010 Results January 2011
3.2 cm w:\active\60960494\reports\monitoring report #3 (2010 jan-june)\rpt_2011-01-24_60494_wi-pcm-report-3_fin.docx
3.1.1.3 Percent Area Searched
Ps was 100% during January and February, when the entire search areas were snow-covered and could be readily accessed. The average proportion of the 50 m radius search area that was physically searched during the March/April period was 84.5%. In May, Ps was 0.521 for the WTGs with 3.5 day search interval and 0.531 at WTGs with 7 day search interval. In June, there was considerably more vegetation; Ps was 0.252 for the WTGs with 3.5 day search interval and 0.272 at WTGs with 7 day search interval. These values were applied to assess bat and small bird mortality rates.
Ps for raptors and vultures was assumed to be 100%. Vegetation cover was non-existent or low over the majority of the Reporting Period, and was not expected to be a significant factor affecting searcher efficiency in the periods of concern (winter and spring migration). The large size of raptors and vultures meant that carcasses were visible in vegetation that would obscure smaller birds or bats, and the longer persistence times of the large carcasses meant that carcasses would be present over several weeks, through changing vegetation or standing water conditions, greatly increasing the likelihood of detection.
3.1.2 Direct Effects - Birds
Raw mortality data for the Reporting Period is provided in Appendix E.
An Avian and Bat Observation Form is available on the Project website to receive comments from the public regarding bird and bat observations related to wind plant operations. No comments were received from the public during the Reporting Period.
A total of 65 carcasses of 28 bird species were collected during mortality monitoring during the Reporting Period. A summary is presented in Table 3.4 (Appendix B). In addition, one Turkey Vulture carcass was recovered by a landowner outside of regularly-scheduled searches, for a total of 66 carcasses. All native species have provincial S-Ranks of S5 (i.e., Secure – common, widespread and abundant in Ontario) or S4 (i.e., Apparently Secure – uncommon but not rare). Two species, Ring-necked Pheasant and European Starling, are not native to Ontario and have provincial S-Ranks of SNA (i.e., Not Applicable - A conservation status rank is not applicable because the species is not a suitable target for conservation activities). Seven bird carcasses were not identifiable to genus or species, as a result of prior activity by scavenging animals or an advanced state of decomposition.
One Chimney Swift fatality was recorded at T04 on May 11. This species is listed as Threatened on Schedule 1 of the federal Species at Risk Act and on the Species at Risk in Ontario list of the provincial Endangered Species Act (2007). This individual was likely a migrant; Cink and Collins (2002) indicate that this species arrives in Ontario in late April or early May, and begins nest building in late May or early June in nearby New York.

WOLFE ISLAND WIND PLANT POST-CONSTRUCTION FOLLOW-UP PLAN BIRD AND BAT RESOURCES MONITORING REPORT NO. 3, JANUARY - JUNE 2010 Results January 2011
cm w:\active\60960494\reports\monitoring report #3 (2010 jan-june)\rpt_2011-01-24_60494_wi-pcm-report-3_fin.docx 3.3
Five of the species have been identified as species of conservation priority by Ontario Partners in Flight (2006). Based on the observation dates, two were likely breeding within or near the wind plant: Wood Thrush (one on June 23), and Bobolink (one on June 8). Although not listed under the Species at Risk Act or Endangered Species Act at the time, the Bobolink was identified as threatened by Committee of the Status of Endangered Wildlife in Canada (COSEWIC) in April of 2010 and by the Committee on the Status of Species at Risk in Ontario (COSSARO) in June of 2010. The other three species, Savannah Sparrow (one on May 6), Chimney Swift and Baltimore Oriole (one on May 17), were likely struck during migration.
The most commonly encountered bird species were Ring-billed Gull (seven fatalities, with three fatalities between April 26 and May 4 and four fatalities between May 31 and June 11), Wilson’s Snipe (seven fatalities; six were detected between April 13 and April 26, with the seventh occurrence on June 25), and Red-tailed Hawk (seven fatalities, discussed below).
Nine raptor and one vulture fatalities were recorded over the course of this Reporting Period: seven Red-tailed Hawks, one Osprey, one Northern Harrier and one Turkey Vulture. Based on the dates of recovery, five of the fatalities were likely of individuals breeding within or in the vicinity of the wind plant (one Osprey on May 3, one Northern Harrier on May 13, one Turkey Vulture on June 1 and one Red-tailed Hawk on each of May 17 and June 10). One Red-tailed Hawk, recovered on February 8, was presumed to be a wintering bird. The remaining Red-tailed Hawks, recovered in April, were presumed to be staging in or moving through the wind plant during spring migration.
Bird fatalities were distributed quite uniformly through the spring period (April, May and early June). Fewer fatalities were recorded in February and March, and no fatalities were noted in January (Figure 7, Appendix A). The highest number of bird fatalities over the course of the Reporting Period occurred at T46 and T76 (four fatalities at each), which are located in the eastern and western portion of the wind plant (Figure 8, Appendix A).
The ten raptor and vulture carcasses recovered, when corrected for scavenger removal, represent an estimated total raptor mortality rate of 0.12 raptors/turbine (0.05 raptors/MW) for the Reporting Period (Table 3.5, Appendix B). Correcting seasonally for searcher efficiency, scavenger and other removal rates, and the percent area searched, the 56 other bird carcasses recovered represent an estimated bird mortality rate (excluding raptors) for the Reporting Period of 6.27 birds/turbine (2.73 birds/MW) (Table 3.6, Appendix B). Combined, the estimated bird mortality rate is 6.39 birds/turbine (2.78 birds/MW) for the reporting period.
3.1.3 Direct Effects - Bats
Raw mortality data for the Reporting Period is provided in Appendix E. An Incidental Avian and Bat Observation Form is available on the Project website to receive comments from the public regarding bird and bat observations related to wind plant operations. No comments were received from the public during the Reporting Period.

WOLFE ISLAND WIND PLANT POST-CONSTRUCTION FOLLOW-UP PLAN BIRD AND BAT RESOURCES MONITORING REPORT NO. 3, JANUARY - JUNE 2010 Results January 2011
3.4 cm w:\active\60960494\reports\monitoring report #3 (2010 jan-june)\rpt_2011-01-24_60494_wi-pcm-report-3_fin.docx
A total of 34 carcasses of three bat species were collected during the Reporting Period. A summary is provided in Table 3.7 (Appendix B). The Silver-haired Bat (28 fatalities) and Eastern Red Bat (2 fatalities), comprising 88% of all bat fatalities during the Reporting Period, are ranked S4 (i.e., Apparently Secure – uncommon, but not rare) and are classified as long-distance migratory tree bats. The Big Brown Bat (4 fatalities), comprising 12% of all bat fatalities, has a provincial S-Rank of S5 (i.e., Secure – common, widespread and abundant in Ontario).
The majority of bat mortality occurred in a one week period at the beginning of May (Figure 7, Appendix A). The highest number of bat fatalities over the course of the Reporting Period occurred at T58 (three fatalities) (Figure 8, Appendix A), located in the eastern portion of the wind plant.
Correcting for searcher efficiency, scavenger and other removal rates, and percent area searched, the 34 recovered carcasses represent an estimated total bat mortality rate for the Reporting Period of 5.23 bats/turbine (2.27 bats/MW) (Table 3.8, Appendix B).
In an effort to correlate bat mortality to wind speed, wind speed data for the Reporting Period was downloaded from the MET tower in the northwest portion of the wind plant. Wind speed is recorded at 10 minute intervals and these data were summarized to obtain a mean wind speed for each ten hour period from 20:00 to 06:00. Wind speeds recorded at a height of 78 m were used to correspond to wind speeds in the blade sweep area. Mean wind speed was calculated over the ten hour period from 20:00 the night before until 06:00 the day of each carcass search. For example, mean wind speed for April 18 was calculated from 20:00 April 17 to 06:00 April 18. Figure 9, Appendix A compares bat mortality to mean wind speed. When considering the results depicted in Figure 9, it is important to consider the lag period over the search interval. If, for example, higher mortality occurred across the wind plant on a single low wind night, detection of the carcasses would be spread out over the search interval (three to seven days). It appears that the peak of bat mortality observed during the first week of May corresponded to a period of relatively low wind speeds.
3.2 DISTURBANCE EFFECTS MONITORING
3.2.1 Winter Raptor Surveys
A complete summary of raptors and owls recorded during each survey throughout the winter season (November 2009 to March 2010) is provided in Table 3.9 (Appendix B). Although not within the Reporting Period, November and December 2009 were included to provide a full season of results, allowing for a complete comparison to pre-construction surveys.
Within the 2009/2010 season, Red-tailed Hawk (60 observations) was the most common raptor observed during the afternoon surveys. Snowy Owl (34 observations) was the second most common raptor with observations peaking in December and January. Other relatively common

WOLFE ISLAND WIND PLANT POST-CONSTRUCTION FOLLOW-UP PLAN BIRD AND BAT RESOURCES MONITORING REPORT NO. 3, JANUARY - JUNE 2010 Results January 2011
cm w:\active\60960494\reports\monitoring report #3 (2010 jan-june)\rpt_2011-01-24_60494_wi-pcm-report-3_fin.docx 3.5
species included American Kestrel (30 observations) and Northern Harrier (19 observations). Although Northern Harrier was the most common species observed in November and December 2009, no harriers were observed from January to March, 2010. Maximum numbers of observations during any one survey include 7 Snowy Owls (December 23), 8 Northern Harriers (December 23), 13 Red-tailed Hawks (February 16) and 5 American Kestrels (March 17).
During the evening surveys, Short-eared Owls were relatively common with a total of 52 observations throughout the season. The maximum number of Short-eared Owls observed in a single survey was 15 on December 22, 2009.
Average raptor density, calculated as the number of raptors per kilometer, was highest on January 6, 2010 (0.5 raptors per kilometer); this included 11 Short-eared Owl during the afternoon survey, as well as 9 Red-tailed Hawks and 6 Snowy Owls. The largest number of Bald Eagles (4 observations) was also observed on this date.
Table 3.10 (Appendix B), provides a comparison of 2006/2007 pre-construction and 2009/2010 post-construction survey results by species. Overall, significantly fewer raptors were observed during the 2009/2010 season with an approximate 65% decrease in abundance during the afternoon surveys. The difference in abundance between the two years can almost entirely be attributed to two species, Northern Harrier and Rough-legged Hawk. Northern Harrier observations decreased from 159 in 2006/2007 to 19 in 2009/2010. Rough-legged Hawk observations decreased from 119 in 2006/2007 to 13 in 2009/2010. Results of the evening surveys suggest that abundance of Short-eared Owls in the winter of 2009/2010 was approximately half that of the 2006/2007 season. Species that appeared to be more abundant in 2009/2010, compared to 2006/2007 include Snowy Owl (34 and 14 observations respectively), Bald Eagle (11 and 6 observations respectively) and Merlin (4 and 2 observations respectively).
Numbers of wintering raptors and owls are known to vary significantly from year to year, based on prey conditions in their northern breeding and southern wintering areas. Table 3.11, Appendix B summarizes the results of the Kingston Christmas Bird Count (“CBC”) from 2000 to 2009, and demonstrates annual fluctuations in wintering raptor numbers in the Kingston area. The results are presented as number of birds observed per party hour. The CBC data suggests that 2006 was peak year for many raptor species with high numbers of Northern Harriers, Red-tailed Hawks, Short-eared Owls and Rough-legged Hawks.
As with the results of the pre-construction raptor surveys, areas of particularly high raptor and Short-eared Owl density (defined as more than 5 raptors per kilometer or more than 3 owls per kilometer) were mapped. Areas of high raptor and high owl density, as defined above, are shown in Figure 10.0 and Figure 11.0, Appendix A, respectively. Most areas of raptor concentration in 2009/2010 occurred in the western portion of the study area, between Highway

WOLFE ISLAND WIND PLANT POST-CONSTRUCTION FOLLOW-UP PLAN BIRD AND BAT RESOURCES MONITORING REPORT NO. 3, JANUARY - JUNE 2010 Results January 2011
3.6 cm w:\active\60960494\reports\monitoring report #3 (2010 jan-june)\rpt_2011-01-24_60494_wi-pcm-report-3_fin.docx
95 and Concession 4, with a single area of high concentration in the northeastern corner of the study area. Concentrations of Short-eared Owl activity were most commonly observed centrally within the study area, between Concession 7 Rd, Ridge Rd, Concession 5 Rd and Baseline Rd, and near the south end of Concession 9 Rd. During the 2006/2007 preconstruction surveys, several more areas of high raptor and owl concentration occurred, most of which were located in the northwestern end of Wolfe Island (west of Conc 4. Rd), and the southern part of the Wolfe Island study area (south of Reeds Bay Road).
3.2.2 Foraging Waterfowl Surveys
In total, seven species of waterfowl were observed foraging inland during the spring 2010 post-construction monitoring; all species were either geese or dabbling ducks. Canada Goose was the most abundant species, representing approximately 99% of all observations. Mallard represented approximately 1% of observations, with only a small number of the remaining five species (American Black Duck, Gadwall, Northern Shoveler, Northern Pintail and Green-winged Teal). The species composition was very similar to that observed during the 2007 pre-construction monitoring (Table 3.12, Appendix B).
Overall, the number of waterfowl observed during 2007 pre-construction surveys and 2010 post construction surveys were respectively 10,295 and 9031, a 12% reduction. When the results are expressed as waterfowl days, the difference between 2007 and 2010 is 32%, with 85,219 and 57,906 waterfowl days, respectively. The number of waterfowl days at inland foraging areas in spring 2007 and spring 2010 are shown in Figure 12.0, Appendix A.
In the spring of 2010, areas of highest waterfowl concentration occurred in the southern portion of Wolfe Island, south of Reed’s Bay Road. The largest flocks usually occurred in close proximity to the bays where they stage overnight. When comparing 2007 and 2010 spring results, the areas of waterfowl concentration were generally similar with some localized shifting (e.g., using different fields within the same concession).
Crop preference in the spring of 2007 and 2010 were similar, with the majority of observations in hay or pasture. During the spring migration period, young grass shoots appear to be the diet of choice for the Canada Goose. Grain fields, such as corn or soy, were generally not as important to foraging waterfowl during the spring season (Table 3.13, Appendix B). Fields used as the primary inland foraging areas were often different between weekly visits. It is presumed that waterfowl foraging inland moved about in response to changing foraging opportunities and field management, for example, moving away from a previously productive foraging site as the food was depleted by the flock, or after the field was tilled.
3.2.3 Overland Waterfowl Movement Surveys
Summaries of the spring 2010 morning and evening waterfowl movement surveys are provided in Tables 3.14 and 3.15 (Appendix B), respectively. Figures 13.0 and 14.0 (Appendix A)
WOLFE ISLAND WIND PLANT POST-CONSTRUCTION FOLLOW-UP PLAN BIRD AND BAT RESOURCES MONITORING REPORT NO. 3, JANUARY - JUNE 2010 Results January 2011
cm w:\active\60960494\reports\monitoring report #3 (2010 jan-june)\rpt_2011-01-24_60494_wi-pcm-report-3_fin.docx 3.7
compare the major routes used by waterfowl in spring during the 2007 pre-construction and 2010 post-construction monitoring. Generally, major movement routes were similar in 2007 and 2010. All major routes were associated with the primary offshore staging areas, namely Reed’s Bay, Pyke’s Bay, Button Bay, Bayfield Bay and the small inlet off Carpenter’s Point Rd. Routes used by waterfowl were typically similar during morning and evening movement, with the directions reversed. Morning movement of diving ducks from Button Bay to Bayfield Bay, in a route over the St. Lawrence River then crossing Carpenter’s Point was observed in 2010, a route also observed during fall waterfowl studies.
Waterfowl observed during the spring 2010 post-construction monitoring flew between WTGs. In many instances, flocks of Canada Geese appeared to alter their course to avoid WTGs. In most cases, these were minor adjustments to avoid individual WTGs. As in the fall 2009 post-construction monitoring, flocks of Canada Geese moving into Bayfield Bay often altered their route up to 500m to avoid a cluster of WTG’s, choosing to follow the shoreline into the bay (Route 11, Figure 14.0, Appendix A).
Canada Geese represented the majority of movement observations in both 2007 and 2010, representing 95% and 99% of observations respectively. Dabbling ducks represented 5% of the observations in 2007 but less than 1% in 2010.
The results of the 2010 spring waterfowl movement monitoring indicate that the majority of waterfowl moving between bays and inland foraging areas flew at WTG blade sweep height. Of the 15,791 observations during morning and evening movement monitoring, 12,851 (81%) were observed at blade sweep height for at least a portion of their flight. Wind speed appeared to be a significant factor influencing flight height, with flights below blade sweep height often occurring during high wind conditions.
3.2.4 Aerial Waterfowl Surveys
Waterfowl data collected during spring of 1999, 2008, 2009 and 2010 aerial surveys were grouped into guilds and waterfowl days were calculated for each sector. Appendix F presents the waterfowl days in each guild by sector for each year. The waterfowl days by guild for each major staging area (i.e., Bayfield Bay, Button Bay, Pyke’s Bay and Reed’s Bay) for spring 2008, 2009 and 2010 are also provided in Appendix F; data specific to each major staging area were not collected by CWS in 1999.
Table 3.16, Appendix B, compares the number of waterfowl days in each sector in the springs of 1999, 2008, 2009 and 2010, inclusive of major staging areas. Overall, 1999 had the largest number of waterfowl days (474,079); approximately 24% higher than the average of the three recent surveys. When comparing the three recent years, the total number of waterfowl days observed was very similar, with the waterfowl days in the spring of 2010 being 8% larger than that of 2008 and 1% smaller than 2009. No significant differences in waterfowl days in Sectors C7, C8 and C11 were observed between the three recent years of data. Sector C10

WOLFE ISLAND WIND PLANT POST-CONSTRUCTION FOLLOW-UP PLAN BIRD AND BAT RESOURCES MONITORING REPORT NO. 3, JANUARY - JUNE 2010 Results January 2011
3.8 cm w:\active\60960494\reports\monitoring report #3 (2010 jan-june)\rpt_2011-01-24_60494_wi-pcm-report-3_fin.docx
experienced a significant increase in waterfowl days in 2010, supporting 118% more waterfowl than observed in 2009. Within Sector C9, the waterfowl days in spring 2010 were down 31% from 2009. However, there was only a 2% difference in waterfowl days in Sector 9 between 2010 and 2008.
Table 3.17, Appendix B, compares the waterfowl days in each of the major staging areas in the springs of 2008, 2009 and 2010. Overall, the total number of waterfowl days within the major staging areas was highest in 2009, and was 28% higher in 2009 than in the spring of 2010. The large number of total waterfowl days in 2009 can largely be attributed to Bayfield Bay. Waterfowl days in Bayfield Bay were 66% larger in the spring of 2009 compared to 2010, although only a 16% difference was observed in the number of waterfowl days between 2008 and 2010. The 2010 surveys observed an increase in waterfowl days in Button Bay; up 482% from 2009. It is worth noting that post-construction surveys in the fall of 2009 observed a 61% decrease in Button Bay’s waterfowl days from the pre-construction surveys in the fall of 2008. Waterfowl days in Pyke’s Bay and Reed’s Bay were relatively similar in 2009 and 2010, but were lower compared to 2008. A respective 53% and 66% decrease in waterfowl days was observed between 2008 and 2010 in Pyke’s Bay and Reed’s Bay.
Table 3.18, Appendix B, compares the waterfowl days for each guild in the springs of 1999, 2008, 2009 and 2010. Generally, the numbers of waterfowl days for each guild were relatively variable between the four years of spring surveys, without distinctive trends. Waterfowl days for geese were similar in 2010 and 2009, but were significantly lower in 2008. Among the three recent years, 2010 had high waterfowl days for large and small dabblers, although large dabblers were much higher in 1999. Similarly, in 2010 waterfowl days for bay ducks were higher than 2008 or 2009, although much lower than 1999. The waterfowl days for the goldeneye guild were quite variable over the years, but 2010 appeared to have relatively average abundance. Waterfowl days for mergansers in 2010 were lower compared to 2009, but higher than that observed in 2008 or 1999. Sea duck observations in 2010 were significantly higher than 2008 (870% increase in waterfowl days), but significantly lower when compared to the spring of 2009 (75% decrease in waterfowl days)
3.2.5 Waterfowl Breeding Pairs Surveys
Appendix G provides the results in each wetland on each of the waterfowl breeding pairs surveys. Table 3.19, Appendix B provides a summary of the maximum breeding pairs in each wetland, based on the calculation of indicated pairs.
In total, 11 species of waterfowl were observed during the breeding pairs surveys, 8 of which are expected to be breeding on Wolfe Island. Observations of Bufflehead, American Wigeon and Pied-billed Grebe were not considered breeding individuals based on the calculation of indicated pairs. Mallard was the most common species with 19 breeding pairs observed across the 5 wetlands. Canada Goose and Wood Duck were also relatively common with 9 breeding

WOLFE ISLAND WIND PLANT POST-CONSTRUCTION FOLLOW-UP PLAN BIRD AND BAT RESOURCES MONITORING REPORT NO. 3, JANUARY - JUNE 2010 Results January 2011
cm w:\active\60960494\reports\monitoring report #3 (2010 jan-june)\rpt_2011-01-24_60494_wi-pcm-report-3_fin.docx 3.9
pairs each across the 5 wetlands. Other species were observed in fewer numbers, with 1 to 3 breeding pairs across the 5 wetlands. The Bayfield Bay Marsh route had the largest number of breeding pairs observed: 14 in total, 8 of which were Mallard.
Button Bay Wetland route had the lowest number of breeding pairs observed, 5 in total. However, as Button Bay was the shortest route, fewer observations would be anticipated. Big Sandy Bay Wetland route had 9 breeding pairs of 3 species. Reed’s Bay had the lowest species diversity, including only Canada Goose and Mallard, 3 breeding pairs of each. Sandy Bay Wetland had the second highest number of breeding pairs, 11 in total, and the highest species diversity with six species, including a possible Red-breasted Merganser breeding pair.
3.2.6 Grassland Breeding Bird Point Counts, Paired Point Counts and Area Searches
Point Counts
Table 3.20, Appendix B compares grassland breeding bird densities, as measured through the 2006 and 2007 pre-construction and 2010 post-construction grassland breeding bird point counts.
Bobolink and Savannah Sparrow are two grassland breeding birds that show little change in recorded breeding densities between the two pre-construction and post-construction surveys. Densities of Eastern Kingbird and Song Sparrow also remained stable. Observed densities of most other grassland species were lower during the post-construction 2010 surveys. Specifically, Upland Sandpiper, Killdeer, Barn Swallow, Horned Lark and Eastern Meadowlark were recorded at lower densities in 2010 than during pre-construction surveys. In addition, a number of species that are not considered “grassland birds” appeared to experience a decrease in abundance between pre and post-construction grassland point counts; specifically Mourning Dove, American Robin, European Starling, Yellow Warbler, Red-winged Blackbird and Common Grackle were all recorded in lower numbers during 2010 post-construction grassland point counts.
The density of all breeding birds, as measured through the grassland point counts, was lower during the post-construction surveys. However, a similar decrease in abundance was not observed between the pre and post-construction grassland area searches (results presented below). Further discussion is provided in Section 4.2.6.
Paired Point Counts
Table 3.21, Appendix B provides the results of the grassland paired point count surveys, comparing average breeding bird densities (pairs/10ha) at three distance regimes; within 100m of the WTG bases, 100-200m and 200-300m from the bases. Bobolink, Savannah Sparrow and

WOLFE ISLAND WIND PLANT POST-CONSTRUCTION FOLLOW-UP PLAN BIRD AND BAT RESOURCES MONITORING REPORT NO. 3, JANUARY - JUNE 2010 Results January 2011
3.10 cm w:\active\60960494\reports\monitoring report #3 (2010 jan-june)\rpt_2011-01-24_60494_wi-pcm-report-3_fin.docx
Red-winged Blackbird were the most commonly encountered species, which is consistent with the grassland point counts.
There was no apparent trend in breeding densities between the three distance regimes (i.e., species densities did not clearly increase or decrease in relation to distance from the turbine). Summary statistics are provided in Appendix I. The single factor ANOVA analysis of the results indicated that the difference in densities of all species combined was significantly lower between 100-200 m from the WTG base compared to 0-100 m and 200-300 m from the WTG base (p<0.05). The combined species densities appeared to be influenced by flocks of European Starlings that were observed in the 0-100 m and 200-300 m distance categories, however, when European Starlings were removed from the analysis, the same significant difference was observed, albeit less pronounced (Appendix I).
Species densities for the 6 most common grassland species combined (i.e., Upland Sandpiper, Eastern Kingbird, Savannah Sparrow, Grasshopper Sparrow, Bobolink and Eastern Meadowlark) were not statistically significantly different among the three distance categories (p<0.05).
A single factor ANOVA analysis was also conducted for each of the most common species observed that have a strong affinity for grassland habitat (Eastern Kingbird, Savannah Sparrow, Grasshopper Sparrow, Bobolink and Eastern Meadowlark), with no statistically significant difference in breeding densities observed among the three distance categories for four of the five species (p<0.05, Appendix I). The density of Eastern Meadowlarks was significantly lower within 200 m of the WTG base compared to densities more than 200 m of the WTG base (p<0.05, Appendix I). Upland Sandpipers were observed in too few numbers to allow for a statistical analysis.
Southeast Area Search
In total, 28 species were observed breeding within the Southeast Area. Detailed observations are provided in Appendix I. Savannah Sparrow was the most abundant species (9.7 pairs/10ha), followed by Bobolink (9.4 pairs/10ha) and Red-winged Blackbird (6.8 pairs/10ha). Eastern Meadowlarks were also relatively abundant with a maximum of 24 males observed during the June 14, 2010 survey, which results in 1.2 pairs/10ha. A pair of Northern Harriers was observed and likely bred within the Southeast Area during both pre and post-construction surveys.
Table 3.22, Appendix B compares the densities of grassland breeding birds between 2007 pre-construction and 2010 post-construction surveys. Table 3.23, Appendix B compare the densities within grassland sectors alone, to account for change in the amount of hay and pasture between years.

WOLFE ISLAND WIND PLANT POST-CONSTRUCTION FOLLOW-UP PLAN BIRD AND BAT RESOURCES MONITORING REPORT NO. 3, JANUARY - JUNE 2010 Results January 2011
cm w:\active\60960494\reports\monitoring report #3 (2010 jan-june)\rpt_2011-01-24_60494_wi-pcm-report-3_fin.docx 3.11
For the majority of grassland species, densities were very similar between pre and post-construction surveys. Savannah Sparrow was the most abundant species in both 2007 and 2010, with the same density of breeding pairs in grassland habitat.
Bobolink appeared to experience the largest change in density, with a significant increase in abundance between 2007 and 2010. Densities of Eastern Kingbird and Grasshopper Sparrow had observed decreases between pre and post-construction surveys. However, these differences are attributed to a relatively small change in the number of breeding pairs; 6 and 3 fewer breeding pairs respectively for Eastern Kingbird and Grasshopper Sparrow. Overall, observed decreases are likely attributed to yearly fluctuation.
Northwest Area Search
In total, 27 species were observed breeding within the Northwest Area. Detailed observations are provided in Appendix I. Bobolink had the highest observed density (16.6 pairs/10ha), followed by Savannah Sparrow (15.1 pairs/10ha) and Red-winged Blackbird (7.7. pairs/10ha). A pair of Northern Harriers was observed during both pre and post-construction surveys and were likely breeding within the Northwest Area.
Table 3.22, Appendix B compares the densities of grassland breeding birds between 2007 pre-construction and 2010 post-construction surveys. Table 3.23, Appendix B compare the densities within grassland sectors alone, to account for change in the amount of hay and pasture between years.
The overall density of Bobolinks within the Northwest Area was lower during the post-construction surveys. However, this can be attributed to the amount of grassland habitat; within grassland habitat alone, the density of Bobolinks was very similar pre and post-construction. Typically, the grassland habitat in close proximity to WTG had been disturbed for the gravel pads used in tower erections. During the June 2010 surveys, the gravel pads used for construction had been removed and these disturbed areas were in a state of regeneration. Bobolinks typically avoided these regenerating areas. However, where suitable grassy ground cover occurred, Bobolinks were occasionally observed within 50m of the base of WTG.
As observed during pre-construction surveys, Upland Sandpipers remain a common species within the Northwest Area during the post-construction monitoring. An Upland Sandpiper was flushed from a nest approximately 35m from the base of T15. This individual was taking advantage of the regenerating disturbed area, nesting on the bare ground under a clump of weeds.
An observed decline in Grasshopper Sparrows was recorded between pre and post-construction survey. During the 2007 pre-construction surveys, a particular concentration of Grasshopper Sparrows had been observed within a swale in Sector 8. Although Grasshopper

WOLFE ISLAND WIND PLANT POST-CONSTRUCTION FOLLOW-UP PLAN BIRD AND BAT RESOURCES MONITORING REPORT NO. 3, JANUARY - JUNE 2010 Results January 2011
3.12 cm w:\active\60960494\reports\monitoring report #3 (2010 jan-june)\rpt_2011-01-24_60494_wi-pcm-report-3_fin.docx
Sparrows were still present in this location, approximately 500m from the closest WTG, they were in lower numbers in 2010.
3.2.7 Wetland Breeding Bird Point Counts and Area Searches
Table 3.24, Appendix B compares the breeding densities of wetland birds, as measured through the 2007 pre-construction and 2010 post-construction wetland breeding bird point counts. Red-winged Blackbird, Swamp Sparrow, Marsh Wren, Yellow Warbler and Common Yellowthroat were the most common species during both pre and post-construction surveys. For most species, abundance was very similar, with differences in breeding density resulting from a small change in the number of breeding pairs observed. However, the point count data suggests the Red-winged Blackbird experienced a decrease in abundance. Red-winged Blackbird abundance in 2010, as measured by the point count survey, was approximately half that recorded in 2007. However, given the relatively small number of point counts conducted in wetland habitat, the data is heavily influenced by outlier points. A gregarious species such as the Red-winged Blackbird would be particularly prone to such influence, as a breeding colony could be located just within, or just outside of, the 100m point count station. In such cases, the area search data provides a more accurate comparison of breeding bird abundance. Red-winged Blackbird numbers, as recorded during the area searches (Table 3.25, Appendix B) indicates relatively consistent abundance within all 5 wetlands surveyed.
Another species, the Common Yellowthroat, also appeared to have a change in abundance between the pre and post-construction surveys. Both the point count data and the area searches recorded an increase in Common Yellowthroats, suggesting this species was in fact more abundant during the 2010 surveys. For most other species, the area searches (Table 3.25, Appendix B) recorded similar abundance during pre and post-construction surveys. Changes were recorded for the Wood Duck (increase from 8 to 15 pairs), Mallard (decrease from 17 to 7 pairs) and the Willow Flycatcher (increase from 6 to 13 pairs).
Species diversity between the 2007 and 2010 surveys was very similar. In 2007, 43 species were observed during the wetland area searches, 40 of which were likely breeding in the wetlands; 3 were visiting to forage (Double-crested Cormorant, Great Blue Heron and Osprey). In 2010, 50 species were observed, 41 of which were likely breeding within the wetlands; 8 were visiting to forage (Double-crested Cormorant, Great Blue Heron, Bald Eagle, Osprey, Herring Gull, Ring-billed Gull, Caspian Tern and Barn Swallow) and 1 was a late migrant (Least Sandpiper).
One threatened species, the Least Bittern, was observed during the wetland post-construction monitoring. A single male was heard calling in the Big Sandy Bay Wetland on June 15, 2010; recorded during both the area search and on a point count. This species was not detected during pre-construction surveys, but had been historically recorded breeding on the island.

WOLFE ISLAND WIND PLANT POST-CONSTRUCTION FOLLOW-UP PLAN BIRD AND BAT RESOURCES MONITORING REPORT NO. 3, JANUARY - JUNE 2010 Results January 2011
cm w:\active\60960494\reports\monitoring report #3 (2010 jan-june)\rpt_2011-01-24_60494_wi-pcm-report-3_fin.docx 3.13
3.2.8 Woodland Breeding Bird Point Counts and Area Searches in Woodlots Larger than 10ha
Point counts and area searches were conducted in two of the large woodland areas that were in close proximity to WTGs, the woodlands connected to Big Sandy Bay Wetland and woodlands associated with the Sandy Bay Wetland. The Big Sandy Bay woodland habitat consisted mostly of swamp, ranging from mature closed canopy silver maple swamp to more open canopy ash-maple swamp with a dense understorey. The Sandy Bay woodland consisted of a deciduous forest community dominated by ironwood, sugar maple and white ash with hawthorn in the understorey.
Respective totals of 45 and 51 species were recorded during the 2008 pre-construction and 2010 post-construction area search surveys (Appendix J). Due to the wet nature of the Big Sandy Bay woodlands, some species typical of thicket swamps were recorded, such as Swamp Sparrow and Common Yellowthroat. Waterfowl, including Canada Goose, Mallard and Wood Duck were observed in the swamp communities; they were considered potential breeders as suitable habitat was present. The woodlands also supported many forest breeding species such as Wood Thrush, Eastern Wood-Pewee, Great Crested Flycatcher, Red-eyed Vireo and Rose-breasted Grosbeak. Several area-sensitive forest nesting species were recorded within the two woodlands including Pileated Woodpecker (recorded during the 2008 surveys), Blue-gray Gnatcatcher, American Redstart, Northern Waterthrush and Mourning Warbler (recorded during the 2010 surveys) and Veery (recorded in both years).
Woodland point count results are provided in Table 3.26, Appendix B. The most abundant species were generally similar during both pre and post-construction surveys including Yellow Warbler, American Robin, Song Sparrow and Swamp Sparrow; these are species that are generally characteristic of the more open canopy nature of most of the woodlots. Species characteristic of more mature forests, such as Wood Thrush or Rose-breasted Grosbeak, were typically less common. For most species, the point counts recorded very similar densities between pre and post-construction surveys, with differences resulting from a small change in the number of breeding pairs observed.
3.3 NOTIFICATIONS
Section 3.2 of the Follow-up Plan outlines mortality and disturbance thresholds which trigger contact with Environment Canada / Canadian Wildlife Service, the Ontario Ministry of Natural Resources, and Natural Resources Canada. There were seven notifications filed during the Reporting Period (Table 3.27 Appendix B), related to mortality of raptors and vultures, bats, species at risk and disturbance to staging waterfowl.
Notifications and the agency responses are provided in Appendix K.

WOLFE ISLAND WIND PLANT POST-CONSTRUCTION FOLLOW-UP PLAN BIRD AND BAT RESOURCES MONITORING REPORT NO. 3, JANUARY - JUNE 2010 Results January 2011
3.14 cm w:\active\60960494\reports\monitoring report #3 (2010 jan-june)\rpt_2011-01-24_60494_wi-pcm-report-3_fin.docx
3.3.1 High Annual Mortality Rates – Raptors and Vultures
The threshold for high annual mortality rates – raptors as outlined in the Follow-up Plan is two raptor or vulture fatalities over a six-week period. Four of the seven notifications were related to raptor and vulture fatalities, and were submitted on April 15, May 6, May 18, and June 11, 2010 (Table 3.27, Appendix B). Each notification involved two or three raptor or vulture fatalities over periods of varying length, but less than six weeks (Table 3.27 Appendix B).
3.3.2 High Annual Mortality Rates – Bats
The threshold for high annual mortality rates – bats as outlined in the Follow-up Plan is 144 bat fatalities over a consecutive three-week period. This threshold value is intended to represent the estimated actual number of fatalities corrected for projected scavenger removal and searcher efficiency. One of the notifications was related to bat fatalities, and was submitted on May 26 (25 bat fatalities) (Table 3.27, Appendix B).
3.3.3 Mortality of Species at Risk
The Follow-up Plan requires that any mortality of species at risk must be immediately reported to NRCan, MNR and EC. On May 11, 2010 a single Chimney Swift fatality was recorded at T04. This species is listed as Threatened on Schedule 1 of the federal Species at Risk Act and on the Species at Risk in Ontario list of the provincial Endangered Species Act (2007). This individual was likely a migrant; Cink and Collins (2002) indicate that this species arrives in Ontario in late April or early May, and begins nest building in late May or early June in nearby New York.
3.3.4 Disturbance of Staging Waterfowl
The threshold for disturbance to staging waterfowl as outlined in the Follow-up Plan is a 30% decline in the staging numbers of any of the listed waterfowl guilds over a period of more than one month. The measure of abundance is “waterfowl days” per guild, compared between the average of 2008/2009 pre-construction surveys and the 2010 post-construction surveys.
Over the period March 24-May 5, 2010, waterfowl days for the sea duck guild (which includes Long-tailed Duck, scoters and eiders) were 1,050, which represents a 50.3% decline over the pre-construction 2008/2009 average of 2,113. The notification (Appendix K) cautioned that these numbers are small, and a relatively small deviation of hundreds of waterfowl days (arising from a difference of a few dozen individuals over several weeks) results in a large percentage change. Additionally, the small number is sensitive to inter-year variation; the 2010 value of 1,050 waterfowl days is an order of magnitude greater than the 2008 pre-construction value (108) although it is considerably less than the 2009 construction season value (4,118) (Table 3.18, Appendix B).

WOLFE ISLAND WIND PLANT POST-CONSTRUCTION FOLLOW-UP PLAN BIRD AND BAT RESOURCES MONITORING REPORT NO. 3, JANUARY - JUNE 2010 Results January 2011
cm w:\active\60960494\reports\monitoring report #3 (2010 jan-june)\rpt_2011-01-24_60494_wi-pcm-report-3_fin.docx 3.15
Four surveys were conducted between March 24 and May 5. Following the first two surveys, sea duck waterfowl days in 2010 were nearly double the average number of sea duck waterfowl days observed under pre-construction conditions. Following the third survey, sea duck waterfowl days were approximately equivalent under pre- and post-construction conditions. The decline in numbers observed following the fourth survey strongly suggests that the sea ducks arrived and departed the area earlier than in previous years, probably as a result of weather or other factors unrelated to the wind plant. Overall, the data suggest that similar numbers of sea ducks were present in 2010 but that they were present over a shorter period of the survey, which was reflected in reduced waterfowl days.

WOLFE ISLAND WIND PLANT POST-CONSTRUCTION FOLLOW-UP PLAN BIRD AND BAT RESOURCES MONITORING REPORT NO. 3, JANUARY - JUNE 2010 Results January 2011
3.16 cm w:\active\60960494\reports\monitoring report #3 (2010 jan-june)\rpt_2011-01-24_60494_wi-pcm-report-3_fin.docx
This page left blank intentionally.
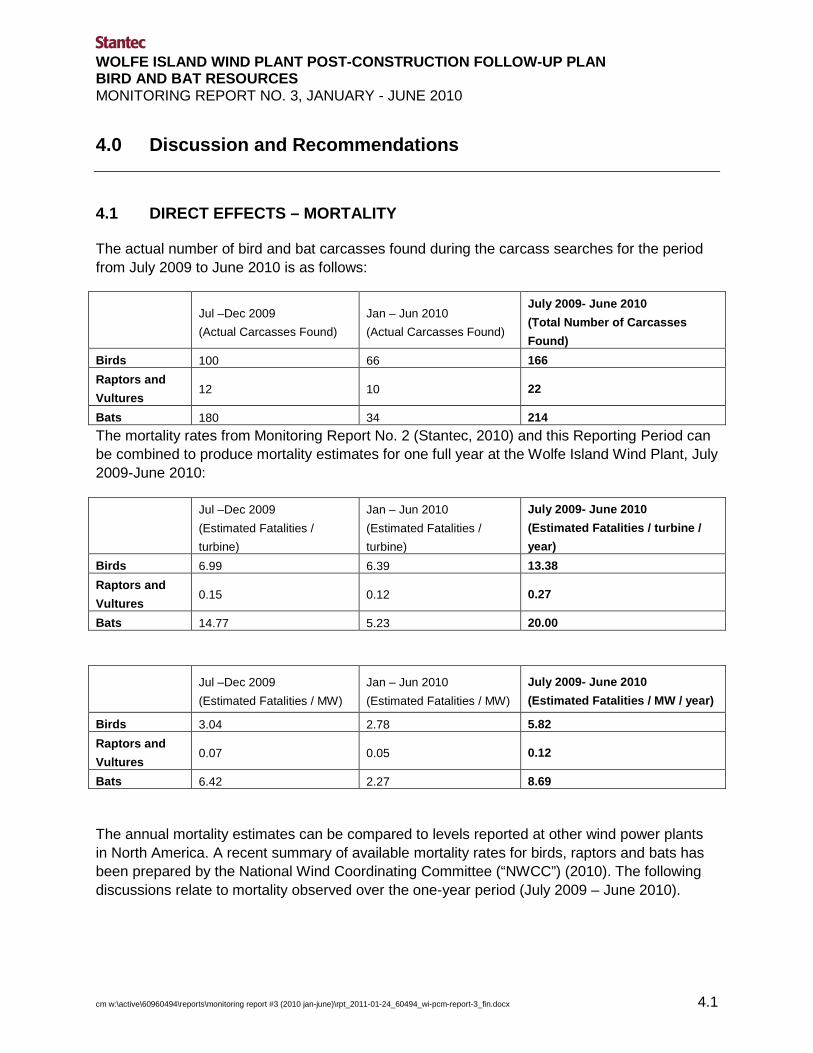
WOLFE ISLAND WIND PLANT POST-CONSTRUCTION FOLLOW-UP PLAN BIRD AND BAT RESOURCES MONITORING REPORT NO. 3, JANUARY - JUNE 2010
cm w:\active\60960494\reports\monitoring report #3 (2010 jan-june)\rpt_2011-01-24_60494_wi-pcm-report-3_fin.docx 4.1
4.0 Discussion and Recommendations
4.1 DIRECT EFFECTS – MORTALITY
The actual number of bird and bat carcasses found during the carcass searches for the period from July 2009 to June 2010 is as follows:
Jul –Dec 2009 (Actual Carcasses Found)
Jan – Jun 2010 (Actual Carcasses Found)
July 2009- June 2010 (Total Number of Carcasses Found)
Birds 100 66 166 Raptors and Vultures
12 10 22
Bats 180 34 214 The mortality rates from Monitoring Report No. 2 (Stantec, 2010) and this Reporting Period can be combined to produce mortality estimates for one full year at the Wolfe Island Wind Plant, July 2009-June 2010:
Jul –Dec 2009 (Estimated Fatalities / turbine)
Jan – Jun 2010 (Estimated Fatalities / turbine)
July 2009- June 2010 (Estimated Fatalities / turbine / year)
Birds 6.99 6.39 13.38 Raptors and Vultures
0.15 0.12 0.27
Bats 14.77 5.23 20.00
Jul –Dec 2009 (Estimated Fatalities / MW)
Jan – Jun 2010 (Estimated Fatalities / MW)
July 2009- June 2010 (Estimated Fatalities / MW / year)
Birds 3.04 2.78 5.82 Raptors and Vultures
0.07 0.05 0.12
Bats 6.42 2.27 8.69
The annual mortality estimates can be compared to levels reported at other wind power plants in North America. A recent summary of available mortality rates for birds, raptors and bats has been prepared by the National Wind Coordinating Committee (“NWCC”) (2010). The following discussions relate to mortality observed over the one-year period (July 2009 – June 2010).

WOLFE ISLAND WIND PLANT POST-CONSTRUCTION FOLLOW-UP PLAN BIRD AND BAT RESOURCES MONITORING REPORT NO. 3, JANUARY - JUNE 2010 Discussion and Recommendations January 2011
4.2 cm w:\active\60960494\reports\monitoring report #3 (2010 jan-june)\rpt_2011-01-24_60494_wi-pcm-report-3_fin.docx
4.1.1 Birds
The estimated annual bird mortality rate of 5.82 birds/MW (13.39 birds/turbine) is very similar to that observed at the Maple Ridge facility (5.81 birds/MW) in 2006 (Jain et al., 2007), although it is higher than the rate observed at Maple Ridge in 2007 (3.82 birds/MW; Jain et al., 2009). Jain et al. (2007) concluded that such a rate, provided that it did not involve endangered or threatened species at risk, was not likely to lead to significant adverse effects on a population level, “even with respect to cumulative impacts of fatalities from many wind plants.” Arnett et al (2007) similarly concluded that the fatality of passerines, which comprise the majority of collision victims at wind facilities, has been so low that it “is not significant at the population level.”
The annual mortality rate at the Wolfe Island Wind Plant is within the mortality range of 0 to 14 birds/MW as reported by NWCC (2010). The estimated annual fatality rate for birds at the wind plant is well below the threshold of 11.7 birds/MW, as identified in the Follow-up Plan. When comparing mortality rates, it is important to note that most, if not all of the studies at Maple Ridge and those included in the NWCC summary did not involve mortality monitoring during the winter months. Fourteen (8.5%) of the 165 bird fatalities found at Wolfe Island were found between mid-November and the end of March.
The Wolfe Island mortality rate is strongly influenced by the mortality of swallows and martins, primarily in July and August. Large numbers of Tree Swallows congregate on Wolfe Island during the summer, prior to fall migration. Swallows and martins comprised 41 (24.5%) of the 165 observed bird fatalities, however, this number is small relative to the estimated 10,000 Tree Swallows reported to use the site in the IBA Site Summary for Wolfe Island (IBA Canada, undated) and the estimated Ontario population of 400,000 (Cadman et al., 2007). Although Tree Swallows and Barn Swallows were identified as having an elevated risk of collision in the ERR based on their observed flight heights, they were not identified as one of the main species at risk of collision overall.
and
As identified in the ERR, grassland species that conduct aerial mating displays may be at higher risk to collisions with turbines. In particular, Wilson’s Snipe was a species that was identified as having an elevated risk as male perform aerial territorial displays at the height of turbine blade sweep and as suitable breeding habitat is common throughout the project area. Seven Wilson’s Snipe fatalities were recorded during the spring period in which they conduct their aerial displays. This is small relative to the common and secure Ontario population, which is estimated at 500,000 individuals (Cadman et al., 2007). Wilson’s Snipe is a managed game bird in Ontario, with a daily bag limit of 10 individuals which is considered an acceptable take in managing the population. Overall, the annual mortality rate of Wilson’s Snipe, which is far below limits set for hunting, is anticipated to have a negligible impact on the local population.

WOLFE ISLAND WIND PLANT POST-CONSTRUCTION FOLLOW-UP PLAN BIRD AND BAT RESOURCES MONITORING REPORT NO. 3, JANUARY - JUNE 2010 Discussion and Recommendations January 2011
cm w:\active\60960494\reports\monitoring report #3 (2010 jan-june)\rpt_2011-01-24_60494_wi-pcm-report-3_fin.docx 4.3
Nine other species of conservation priority were on the list of fatalities over the one-year period July 2009-June 2010 (American Kestrel, Baltimore Oriole, Bank Swallow, Black-billed Cuckoo, Chimney Swift, Eastern Kingbird, Savannah Sparrow, Wood Thrush), however, only one or two fatalities of each were recorded. This level of mortality is not considered to be a concern at the population level for these nine species.
Bobolinks have been identified as a species of conservation priority by Ontario Partners in Flight (2006). This species was identified as threatened by Committee of the Status of Endangered Wildlife in Canada (COSEWIC) in April of 2010 and by the Committee on the Status of Species at Risk in Ontario (COSSARO) in June of 2010, but was not listed or protected under the federal Species at Risk Act or provincial Endangered Species Act during the reporting period. Nine Bobolink fatalities were recorded from July 2009 to June 2010. The majority of Bobolink fatalities occurred in late July or August, a time when juveniles are leaving the nests, suggesting many of the fatalities may have been recently fledged young. Positive confirmation of which specimens were juvenile was not always possible, due to the condition of some specimens and similarities between juvenile and non-breeding adult Bobolinks. However, at least three of the fatalities could be identified as juveniles. Applying the correction factors to a single species can provide a rough estimate of the actual mortality rate, although this relies on a potentially erroneous assumption that the species composition of recovered fatalities is equivalent to the species composition of all fatalities. If the correction factors were applied to the nine Bobolink fatalities, the estimated annual mortality rate would be 73 birds. This estimated annual mortality rate is small relative to the estimated regional and Ontario population. Pre-construction surveys estimated the population in June within the Study Area to be 1,000-1,500 (approximately 1,050 counted during area searches, plus others observed during point counts; Stantec, 2008a). The estimated population in Ontario during the June breeding season is 800,000 Bobolinks (Cadman et al., 2007). It is noted that population sizes would be significantly larger after July 1, when the majority of fatalities were observed, with the addition of juvenile birds.
Chimney Swift has been identified as both provincially and federally Threatened. The individual found in May was a spring migrant. There is no evidence to suggest Chimney Swifts breed or congregate in the vicinity of the site, and no basis to identify a future threat to other individuals of this species.
The annual raptor and vulture mortality rate of 0.12 raptors per MW (0.27 raptors/turbine) is in the middle of the mortality range observed at other facilities in North America outside California (0 – 0.32 raptors/MW; NWCC, 2010). It is lower the rates observed at Maple Ridge in 2007 (0.25 raptors/MW as reported by NWCC, 2010), although higher than the rate observed at Maple Ridge in 2006 (approximately 0.05 raptors/MW, as reported by NWCC, 2010). The majority of the raptor and vulture fatalities appeared to be individuals migrating through the study area. Corrected for scavenger removal, the 22 observed raptor and vulture fatalities of six species (ten Red-tailed Hawks, seven Turkey Vultures, two American Kestrels and one each of

WOLFE ISLAND WIND PLANT POST-CONSTRUCTION FOLLOW-UP PLAN BIRD AND BAT RESOURCES MONITORING REPORT NO. 3, JANUARY - JUNE 2010 Discussion and Recommendations January 2011
4.4 cm w:\active\60960494\reports\monitoring report #3 (2010 jan-june)\rpt_2011-01-24_60494_wi-pcm-report-3_fin.docx
Merlin, Osprey and Northern Harrier) represent 23 raptor and vulture fatalities over the period July 2009 – June 2010.
The raptor and vulture mortality rate is higher than the notification threshold of 0.09 raptors/MW identified in the Follow-up Plan. At the time of Plan preparation, 0.09 raptors/MW was the highest rate of raptor mortality recorded in North America, outside California, although since that time, studies at ten additional facilities in New York, Oregon, Washington, Texas and Alberta have reported higher rates of raptor mortality (NWCC, 2010). Nonetheless, in accordance with the Follow-up Plan, TransAlta and the MNR have initiated discussions regarding adaptive management. Raptor behavioural studies are underway involving surveys at during four peak mortality periods, and will continue across late summer and late fall, 2010 and spring, 2011.
4.1.2 Bats
The annual bat mortality rate of 8.69 bats/MW (19.99 bats/turbine) is at the median of the mortality range observed at other facilities in North America, which ranges from 0 – 39 bats/MW (NWCC, 2010). It is lower the rates observed at Maple Ridge (11.23 bats/MW) in 2007 (Jain et al., 2009). The annual bat mortality rate at Wolfe Island is below the threshold for adaptive management of 12.5 bats/MW as identified in the Follow-up Plan.
Johnson (2004, as cited by Ontario Ministry of Natural Resources, 2006) indicated that over 90% of bat fatalities at wind plants occur between mid-July and the end of September. In the period July 2009 – June 2010, the peak of bat mortality occurred at the wind plant in late August. However, 34 (15.9%) of the 214 bat fatalities recorded during year-round monitoring at the Wolfe Island Wind Plant fell within the spring months, with a decided peak in the first week of May. Long-distance migratory tree bats comprised 76% of identified fatalities during the first full year of monitoring.
The annual bat mortality rate is below the adaptive management threshold of 12.5 bats/MW as identified in the Follow-Up Plan. Although the bat mortality rate is below the threshold, TransAlta is committed to complete additional research in 2011 to evaluate practical measures to reduce the effects of operating wind turbines on bats at the wind plant. TransAlta will complete testing of potential mitigation measures during the fall migration period in 2011 to determine the feasibility and effectiveness of implementing such mitigation measures at Wolfe Island.
4.2 INDIRECT EFFECTS – DISTURBANCE
4.2.1 Wintering Raptors
Wolfe Island has been identified as a significant wintering area for a variety of species of raptors and owls. Results of the pre-construction winter raptor monitoring, which was conducted from November 2006 to March 2007, confirmed that some species can become abundant during winter months, including one species at risk, the Short-eared Owl.

WOLFE ISLAND WIND PLANT POST-CONSTRUCTION FOLLOW-UP PLAN BIRD AND BAT RESOURCES MONITORING REPORT NO. 3, JANUARY - JUNE 2010 Discussion and Recommendations January 2011
cm w:\active\60960494\reports\monitoring report #3 (2010 jan-june)\rpt_2011-01-24_60494_wi-pcm-report-3_fin.docx 4.5
Overall, the 2009/2010 post-construction monitoring found that, although raptors were still relatively common, the overall density was well below that observed in 2006/2007. The average density in 2009/2010 was 0.25 raptors/kilometer compared with 0.72 raptors/kilometer in 2006/2007, a 65% decrease. Annual numbers of most overwintering raptors are dependent upon the number of meadow voles, the populations of which vary in a cyclical fashion. As such, the low density of raptors on Wolfe Island in the winter of 2009/2010 is likely a direct result of low prey abundance. Most of southern Ontario likely experienced low prey abundance during the winter of 2009/2010, as surveys conducted at other sites (Stantec, unpublished; Environment Canada, pers. comm.) and reported on the OntBirds listserve, indicate that the number of wintering raptors and owls were generally lower than average across southern Ontario.
Christmas Bird Count (“CBC”) results, which include observations throughout the Kingston count circle, generally correlate with the differences observed between the 2006/2007 pre-construction and 2009/2010 post-construction monitoring on Wolfe Island. Both the CBC and the post-construction monitoring found Rough-legged Hawks and Northern Harriers experienced the largest changes in abundance, with less significant changes in the abundance of Short-eared Owls. It is noted that, whereas in 2006-2007 Northern Harriers were generally abundant throughout the winter months, during post-construction surveys they were observed in November and December only, suggesting they moved further south mid-winter in search of areas with higher prey density. Overall, it is evident that low raptor abundance observed on Wolfe Island in the winter of 2009/2010 was observed throughout the Kingston area and across southern Ontario, and was likely attributed to low prey abundance. As such, low raptor density was not attributed to avoidance of potential project disturbances, such as WTGs.
Bald Eagle was a species that appeared to experience a significant increase in abundance between 2006/2007 and 2009/2010, as observed through both the post-construction monitoring and the CBC. The increase in Bald Eagle observations is likely attributed to the general increase in abundance of this species throughout Ontario, as it continues to recover from population crashes experienced mid-century (Cadman et al., 2007).
Fewer areas of raptor and owl concentration, as shown on Figures 10.0 and 11.0, Appendix A, were identified during the post-construction survey. The overall low raptor density in 2009/2010 was likely the major contributing factor to the lack of raptor and owl concentration areas. As such, trends in the distribution of raptor and owl concentration areas in the 2009/2010 season are not evident. However, it is noted that no raptor or owl concentration areas were recorded in the northwest end of Wolfe Island, an area of high WTG concentration. Although not occurring in concentrations of 5 or more raptors within 1 kilometer, raptors were regularly recorded in this area. Throughout the season, 11% of raptor observations were made in the northwest end of Wolfe Island, an area which encompasses approximately 15% of the survey route traveled.

WOLFE ISLAND WIND PLANT POST-CONSTRUCTION FOLLOW-UP PLAN BIRD AND BAT RESOURCES MONITORING REPORT NO. 3, JANUARY - JUNE 2010 Discussion and Recommendations January 2011
4.6 cm w:\active\60960494\reports\monitoring report #3 (2010 jan-june)\rpt_2011-01-24_60494_wi-pcm-report-3_fin.docx
Concentrations of both raptors and owls were observed in close proximity to single WTGs, suggesting raptors and owls do not avoid utilizing habitat adjacent to WTGs. Further disturbance studies, in years with higher raptor densities, will be capable of providing further insight into the potential impacts on raptor abundance in areas with high WTG densities.
4.2.2 Foraging Waterfowl Surveys
The results of the spring inland foraging surveys indicated a general decrease in waterfowl abundance between 2007 and 2010. In both 2007 and 2010, Canada Goose was by far the most common species observed. As such, the change in waterfowl days can almost entirely be attributed to the Canada Goose. Lower goose observations were relatively consistent throughout the spring 2010 season, with lower numbers observed on most surveys when compared to the same week in 2007. Conversely, the post-construction monitoring conducted in the fall of 2009 found consistently higher Canada Goose abundance over the pre-construction surveys in the fall of 2007. Possible explanations for the fluctuation in the abundance of Canada Geese observed during the post-construction monitoring include natural variability, crop rotation or presence of the turbines. Regardless, it is clear from the spring 2010 post-construction surveys that Canada Geese remained an abundant species on Wolfe Island through the spring migratory season.
Fewer Mallard observations were recorded in 2010, a 54% decrease from 2007. However, given the low numbers of Mallard recorded in both years, outlier observations, such as the 125 Mallards observed on April 4, 2007, have a significant influence on the perceived overall abundance. As the difference in Mallards recorded between 2007 and 2010 resulted from a small number of flock observations, it may not be a reliable indication of lower Mallard abundance. During the aerial waterfowl surveys, a method which samples much higher numbers of waterfowl, large dabblers, including Mallards, were significantly higher in the spring of 2010 over the 2008 pre-construction data.
The distribution of flocks in 2007 and 2010 was similar with flocks often choosing to forage in the same general locations. It was also noted that flocks were occasionally observed foraging in proximity (i.e. within 300 m) to a WTG. Overall, the results suggest that proximity to wind turbines is not an important factor to the foraging field selection of waterfowl. Factors that are likely to have more significant influences on foraging field selection would include foraging opportunities and field management.
4.2.3 Overland Waterfowl Movement Surveys
Routes selected during the waterfowl morning and evening movement were very similar during the spring 2007 and spring 2009 surveys. The major movement routes occurred in and out of the primary off-shore staging areas for geese and dabblers, including Reed’s Bay, Pyke’s Bay, Button Bay, Bayfield Bay and the small inlet off Carpenter’s Point Rd. Waterfowl did not appear to adjust their flight height in reaction to the WTGs, with the majority of ducks and geese flying

WOLFE ISLAND WIND PLANT POST-CONSTRUCTION FOLLOW-UP PLAN BIRD AND BAT RESOURCES MONITORING REPORT NO. 3, JANUARY - JUNE 2010 Discussion and Recommendations January 2011
cm w:\active\60960494\reports\monitoring report #3 (2010 jan-june)\rpt_2011-01-24_60494_wi-pcm-report-3_fin.docx 4.7
at blade sweep height. Flight height did, however appear to be affected by wind conditions, with lower flight heights being more prevalent during periods of stronger winds.
Waterfowl appeared to adjust their flight route to avoid flying in close proximity to WTG. In many cases, obvious avoidance behavior was observed, as flocks of waterfowl adjusted their flight course as they approached a WTG. As a result, more routes were recorded during the post-construction monitoring, as flocks chose difference paths around WTGs to reach their destination. Overall, overland movement routes were very similar during pre and post-construction surveys, with slight changes likely attributable to changes in foraging fields and adjustments around WTGs.
4.2.4 Aerial Waterfowl Surveys
The total number of waterfowl days were very similar in 2008, 2009 and 2010, although down from 1999. When comparing the recent years of data including 2008 pre-construction, 2009 during construction and 2010 post-construction, there was no apparent change in overall waterfowl abundance throughout the Wolfe Island study area.
Through analysis of the spring data, it is not apparent if the reduction in the number of waterfowl days from 1999 to 2008-2010 is attributable to natural variation, a decreasing trend in waterfowl abundance over the past decade, or perhaps in part, an artefact of variability related to sampling on a large scale. However, for comparison, an examination of the aerial waterfowl data from the fall of 1999 and 2009 suggests waterfowl abundance has remained relatively stable. Overall, differences in spring 1999 and 2010 waterfowl days can likely be attributed to natural variation.
Despite the consistency in overall waterfowl days from 2008 to 2010, the distribution of waterfowl between the five Wolfe Island sectors experienced considerable fluctuations. Specifically, the 2010 post-construction surveys revealed a reduction of waterfowl days in Sector 9 (including Bayfield Bay) compared with 2009 data, although 2010 was similar to 2008 data. In Sector 10 (including Button Bay), waterfowl days were similar during the spring surveys of 2008 and 2009, but experienced an increase in 2010. Waterfowl days in Sector 11 (including Reed’s Bay) had a general decreasing trend from 2008 through 2009 and 2010. Evidence from morning movement surveys (both pre- and post-construction) suggest that large flocks of bay ducks make daily movements between bays, specifically Button Bay and Bayfield Bay. As the overall waterfowl days remained similar between years, the observed fluctuations between sectors is likely due in large part to movement of flocks, and their location at the time of the survey. Regardless, it is apparent that waterfowl remained abundant in each sector and each of the major staging areas each year, with no apparent avoidance of project construction in 2009 or operation in 2010.
For most guilds (i.e. bay ducks, goldeneye and merganser), waterfowl days recorded in the spring of 2010 were consistent with the other three years of pre-construction data. Geese, large dabblers and small dabblers were recorded in larger numbers in the spring 2010 than the other

WOLFE ISLAND WIND PLANT POST-CONSTRUCTION FOLLOW-UP PLAN BIRD AND BAT RESOURCES MONITORING REPORT NO. 3, JANUARY - JUNE 2010 Discussion and Recommendations January 2011
4.8 cm w:\active\60960494\reports\monitoring report #3 (2010 jan-june)\rpt_2011-01-24_60494_wi-pcm-report-3_fin.docx
spring surveys in 2008 and 2009. The waterfowl days for sea ducks experienced significant fluctuations, within 2010 being a year of intermediate abundance. However, the waterfowl days for sea ducks should be viewed with some caution, as they are small and a relatively small deviation of hundreds of waterfowl days results in a large percent change. Four surveys were conducted between March 24 and May 5, 2010. Following the first two surveys, sea duck waterfowl days in 2010 were nearly double the number of sea duck waterfowl days observed under pre-construction conditions. Following the third survey, sea duck waterfowl days were approximately equivalent under pre- and post-construction conditions. The decline in numbers observed following the fourth survey strongly suggests that the sea ducks arrived and departed the area earlier than in previous years, probably as a result of weather or other factors unrelated to the wind plant. Overall, the data suggest that similar numbers of sea ducks were present in 2010 but that they were present over a shorter period of time, which was reflected in reduced waterfowl days. Overall, the fluctuation of waterfowl days within the guilds can be attributed to natural fluctuation and variability related to sampling on a large scale.
4.2.5 Waterfowl Breeding Pairs Surveys
Overall, all five wetlands surveyed for breeding pairs of waterfowl supported breeding populations of geese and/or ducks. Although the surveys routes did not cover the entire wetlands, and therefore did not attempt to identify every breeding pair within each wetland, the surveys provide an indication of waterfowl breeding in portions of the wetlands close to WTGs. The largest number of breeding pairs was observed in the Bayfield Bay Marsh. The predominant species observed were Mallard and Wood Duck. Extensive suitable breeding habitat was present, including cattail marsh with small ponds and channels, including channels that were created as part of a Ducks Unlimited Canada’s habitat project. Woodlands, providing potential nesting cavities, occurred along the shoreline, adjacent to the marsh. Two WTGs occur approximately 350 m south of the wetland edge.
Button Bay Wetland had the fewest numbers of breeding pairs, although it is smaller in size than the other wetlands, and the overall breeding density would be similar or higher than other wetlands. Habitat was limited to the open bay with marginal cattail habitat, surrounded by agricultural fields. A fallow area with patches of trees occurred to the north of the wetland. The treed area potentially provided suitable nesting cavities for the Wood Ducks and Common Mergansers observed, although more mature forest cover occurs at the east end of Button Bay. Two WTGs occur in the field to the west, approximately 200 m from the wetland edge.
Big Sandy Bay Wetland encompasses extensive swamp habitat. Due to limited accessibility, only a portion of the wetland was surveyed along the existing trail system. Habitat along the survey route included dense thicket swamp, mature deciduous swamp and a dug open channel. Four species of waterfowl were observed, the most common being Mallard. A string of WTGs occur to the east of the wetland, approximately 150 m from the wetland edge.

WOLFE ISLAND WIND PLANT POST-CONSTRUCTION FOLLOW-UP PLAN BIRD AND BAT RESOURCES MONITORING REPORT NO. 3, JANUARY - JUNE 2010 Discussion and Recommendations January 2011
cm w:\active\60960494\reports\monitoring report #3 (2010 jan-june)\rpt_2011-01-24_60494_wi-pcm-report-3_fin.docx 4.9
Two species of waterfowl were observed breeding in Reed’s Bay Wetland, Mallard and Canada Goose. Habitat was limited to cattail marsh surrounding the open bay. The wetland was surrounded by agricultural fields with tree cover limited to patches along the lakeshore. No WTGs are present in the immediate vicinity to the wetland, with individual WTGs occurring more than 500 m away to the north, east and south.
Sandy Bay Wetland had the highest diversity of waterfowl with six species recorded. Habitat consisted of cattail marsh surrounding the open bay, with mature willow trees along the lakeshore. A group of Red-breasted Mergansers was observed during the May 13, 2010 survey, and included 3 females and a male, indicating a potential breeding pair. WTGs are present within 150 m, to the north and south of the wetland. Waterfowl observations were made in portions of the wetland closest to WTG, suggesting that presence of the WTG did not deter breeding.
Overall, the waterfowl breeding pairs surveys found populations of breeding geese and/or ducks in each of the major wetlands that are in proximity to WTGs. The results of the surveys did not provide any indication that waterfowl avoided nesting in proximity to the WTGs.
4.2.6 Grassland Breeding Bird Point Counts, Paired Point Counts and Area Searches
Overall, the grassland surveys indicated that grassland breeding birds remained common throughout the project area. It was noted that, due to crop rotation, in some fields grassland habitat (i.e., hay and pasture) was lost, while in other fields grassland habitat was gained. By shifting three of the pre-construction grassland point count locations to adjacent fields, to account for crop rotation, and by correcting the grassland area searches for changes in percent grassland habitat, the composition of grassland habitat surveyed during pre and post-construction were generally consistent.
The grassland point counts, repeated during pre and post-construction monitoring, recorded an apparent decrease in breeding density in several grassland species. It is possible that the observed decrease in grassland species could, in part, be attributed to the general declining population trend in grassland birds, which has been reported throughout Ontario (McCracken, 2009). However, given the relatively short timeframe between pre and post-construction surveys, and because decreases were not observed for the same species in the study area through paired point count surveys and grassland area searches, it is likely that some other factors, unrelated to the operation of the wind plant, have contributed to the decrease. Additionally, many species of common and widespread non-grassland birds, such as American Robin, Mourning Dove and Yellow Warbler, were also observed to decrease between pre and post-construction conditions, further suggests that the observed decreases are not related to greater population trends. Results of the grassland area searches, which surveyed large portions of the study area with high grassland bird densities both pre and post-construction, did not demonstrate the same decrease in grassland bird density.

WOLFE ISLAND WIND PLANT POST-CONSTRUCTION FOLLOW-UP PLAN BIRD AND BAT RESOURCES MONITORING REPORT NO. 3, JANUARY - JUNE 2010 Discussion and Recommendations January 2011
4.10 cm w:\active\60960494\reports\monitoring report #3 (2010 jan-june)\rpt_2011-01-24_60494_wi-pcm-report-3_fin.docx
One potential explanation for the decrease observed at grassland point counts is roadside avoidance. Twenty-three of the 27 grassland point counts were conducted from roadsides. Road improvement work along Township roads, following the construction of the Wind Plant, resulted in wider road corridors along most roads as roadside ditches were graded and vegetation was disturbed. It is possible this disturbance resulted in decreased nesting densities along the roadsides. Species that are likely to breed in roadside ditches and shrubs (e.g., Eastern Meadowlark, Red-winged Blackbird, Yellow Warbler, American Robin) were also observed in lower densities, whereas species that are more likely to nest in fields (i.e., Bobolink), but perch on roadside fences (and thus be detected during point counts), were recorded at similar densities pre and post road improvement.
A second possible explanation for reduced roadside breeding bird density is traffic disturbance. Ordinarily, the relatively low level of traffic on most Wolfe Island roads would result in little disturbance to birds nesting in roadside ditches and hedgerows. However, the increased level of traffic in the summers of 2008 and 2009, during project construction, commissioning and land reclamation, may have resulted in avoidance of roadside nesting. It is generally thought that, following a disturbance at a nest site, avoidance of that nest site may carry through to the next breeding season. As such, reduced breeding bird density in 2009, as measured by the largely roadside grassland point counts, could possibly be attributed to residual avoidance behavior from increased traffic during construction. If this is the case, such impacts would be short term, as breeding densities in roadside ditches and hedgerows should begin to return to normal levels as road traffic has returned to pre-construction levels. Additional seasons of post-construction data will provide an indication if breeding densities in the vicinity of Township roads rebound.
A WTG avoidance effect was not observed for most grassland species through paired point count data. Eastern Meadowlarks were present in small numbers and bred in significantly lower densities within approximately 200 m of WTG bases. As well, although not statistically significant, Bobolinks were observed in slight lower numbers within 0-100m of the WTG base. At some turbines, portions of the 0-100m sector consisted of disturbed areas in a state of early succession, where the gravel pads used during construction had been removed. These early successional areas, which were not suitable for nesting Bobolink, made up a relatively small proportion of the 0-100m sectors. However, the small reduction in suitable habitat may account for the slight deduction in Bobolink density. Species that are more likely to nest within the early successional areas, such as Savannah Sparrow or Upland Sandpiper, did not show any reduction in density within the 0-100m sectors. Incidentally, an Upland Sandpiper nest was observed during grassland area searches approximately 35m from the base of a WTG, within an early successional area. Overall, the results of the paired point counts did not provide any evidence to suggest avoidance of the most common grassland breeding birds around WTG’s.
For most species, the results of the grassland area searches showed little change in breeding density between pre and post-construction surveys. Bobolinks were more abundant in the Southeast Area search during the 2010 post-construction monitoring. The reason for this

WOLFE ISLAND WIND PLANT POST-CONSTRUCTION FOLLOW-UP PLAN BIRD AND BAT RESOURCES MONITORING REPORT NO. 3, JANUARY - JUNE 2010 Discussion and Recommendations January 2011
cm w:\active\60960494\reports\monitoring report #3 (2010 jan-june)\rpt_2011-01-24_60494_wi-pcm-report-3_fin.docx 4.11
observed increase in Bobolink density is not apparent. The highest densities of Bobolinks occurred in Sectors 5 and 6, new hayfields that were not present in 2007. However, pasture habitat, such as that found in Sector 4, appeared to remain unchanged between 2007 and 2010 but also supported an increased number of Bobolinks. A potential hypothesis for the changes in Bobolink density within pasture could be changes in density of cattle or grazing pressure, however, such habitat information was not recorded pre and post-construction to allow for a comparison. Given the study design, the reasons for the changes in Bobolink density between pre and post-construction surveys cannot be determined, however, it is likely attributed in changes in habitat structure or local population variability.
Eastern Meadowlark was also recorded in higher densities in the Southeast Area search during the 2010 surveys, when compared to pre-construction surveys. The differences in densities relates to 24 individuals observed in 2010, compared to only 7 observations in 2007. As with the Bobolink, this change can likely be attributed to changes in habitat structure or local population variability.
Although Grasshopper Sparrows were still present in the Northwest Area search during the 2010 surveys, they were observed in lower numbers than during the pre-construction survey. In both years, they were observed in a similar location, approximately 500m from the closest WTG. The rational for this observed decrease is not apparent, but due to the distance from the closest WTG, is likely not attributable to avoidance.
Overall, the results of the grassland breeding bird surveys suggest populations of grassland species remain common within the study area with no evidence of avoiding WTG’s.
4.2.7 Wetland Breeding Bird Point Counts and Area Searches
Generally, the abundance of wetland breeding birds, as measure by the point counts and area searches, remained similar between pre and post-construction surveys. The point count data recorded an apparent decrease in the abundance of Red-winged Blackbirds. However, given the small number of wetland point counts, the calculated density was heavily influenced by a relatively minor difference in observed numbers of Red-winged Blackbirds. Results of the wetland area search are considered to provide a more accurate estimate of abundance pre and post-construction, which showed little change in Red-winged Blackbird abundance.
Common Yellowthroat appeared to be particularly more abundant during the post-construction surveys. A reason for this increase was not obvious. Although detailed records of habitat characteristics within each wetland were not kept during pre and post-construction years, the surveyor’s generally impression was that habitat remained relatively unchanged, without a significant increase in suitable Common Yellowthroat nesting habitat (i.e. dense low vegetation). As such, the increase in Common Yellowthroat could likely be attributed to natural variation or surveyor differences.

WOLFE ISLAND WIND PLANT POST-CONSTRUCTION FOLLOW-UP PLAN BIRD AND BAT RESOURCES MONITORING REPORT NO. 3, JANUARY - JUNE 2010 Discussion and Recommendations January 2011
4.12 cm w:\active\60960494\reports\monitoring report #3 (2010 jan-june)\rpt_2011-01-24_60494_wi-pcm-report-3_fin.docx
A change in the abundance of Mallards and Wood Ducks was recorded through the wetland area searches. However, as these species typically breed earlier in the year, the June wetland surveys are not considered an accurate indicator of breeding abundance.
Overall, results of the wetland point counts and area searches suggest population of breeding birds in the five major wetlands in proximity to WTGs remained relatively consistent between pre and post-construction surveys.
A single male Least Bittern was detected within the Big Sandy Bay Wetland during the 2010 post-construction surveys. The habitat in the vicinity of the observation appeared to be ideal for the Least Bittern: cattail marsh interspersed with open water and shrubby vegetation. This species was not recorded during the pre-construction surveys.
4.2.8 Woodland Breeding Bird Point Counts and Area Searches in Woodlots Larger than 10ha
Relatively high breeding bird species diversity was recorded through area searches in the surveyed woodlands in proximity to WTGs. For most species, point count data suggest there was little change in breeding densities between 2008 pre-construction and 2010 post-construction surveys. American Robin and Common Yellowthroat had the highest observed increases in density, relating to an average increase of 1 breeding pair per point count. As discussed with the wetland area search and point count data, Common Yellowthroat appeared to be particularly abundant on Wolfe Island during the 2010 breeding season. The largest decreases in abundance were observed in House Wren and Mourning Dove, relating to an average decrease of less than 1 breeding pair per point count. It is likely such fluctuations in observed breeding density are a result of natural variability and variability resulting from the relatively small sample size of point counts.
During the 2008 surveys, Wood Thrush were observed at 5 of the 7 woodland point count stations, with observations in both the Big Sandy Bay woodland and Sandy Bay woodland. However, during the 2010 surveys, Wood Thrush was observed at only a single point count station, in the Big Sandy Bay woodland. Anecdotal reports (L. Friesen per. comm) suggest Wood Thrush has experienced significant declines in numbers over its southern Ontario breeding range over the past two breeding seasons. Although the reason for the Wood Thrush’s decline has yet to be confirmed, the most likely cause is the loss the suitable mature forest habitat in its overwintering range in Central America.
WOLFE ISLAND WIND PLANT POST-CONSTRUCTION FOLLOW-UP PLAN BIRD AND BAT RESOURCES MONITORING REPORT NO. 3, JANUARY - JUNE 2010 Discussion and Recommendations January 2011
cm w:\active\60960494\reports\monitoring report #3 (2010 jan-june)\rpt_2011-01-24_60494_wi-pcm-report-3_fin.docx 4.13
4.3 RECOMMENDATIONS
Mortality and disturbance effects monitoring should proceed in 2010 according to the February 2010 Follow-up Plan. For mortality monitoring, it is recommended that additional correction factor trials be conducted to better assess the number of raptor and vulture fatalities:
· The Follow-up Plan specified that one scavenger trial be conducted using raptor and vulture carcasses, in early winter. However, most of the raptor and vulture mortality was observed outside the winter period, and scavenger removal of small birds was lowest during winter compared to spring, summer and fall. A scavenger trial should be conducted using raptor and vulture carcasses in fall, 2010, although this will depend on the availability of a sufficient number of carcasses.
· Searcher efficiency has been assumed to be 100% for raptor and vulture carcasses, but this should be confirmed through searcher efficiency trials using raptor and vulture carcasses (if available; priority will be given to scavenger trials).
The Follow-up Plan indicates that searcher efficiency trials will typically be conducted once each year. More frequent searcher efficiency trials (i.e., once each season) are recommended to ensure seasonal correction factors are appropriate to seasonal conditions.
Finally, the Follow-up Plan indicates that if scavenging rates are low, the carcass searches may be scaled back to once per week. Scavenging rates are similar to or higher than those observed at other Ontario sites during spring, summer and fall, but are very low during winter: on average, 89.4% of test carcasses are not scavenged over the average search interval. In consideration of the very low number of fatalities observed during the winter months (six bird fatalities in December, January and February), it is recommended that the winter carcass searches be scaled back to once per week through December, January and February.
STANTEC CONSULTING LTD.
Valerie Wyatt, M.Sc. Andrew Taylor, B.Sc. Senior Project Manager Ecologist/Project Manager

WOLFE ISLAND WIND PLANT POST-CONSTRUCTION FOLLOW-UP PLAN BIRD AND BAT RESOURCES MONITORING REPORT NO. 3, JANUARY - JUNE 2010 Discussion and Recommendations January 2011
4.14 cm w:\active\60960494\reports\monitoring report #3 (2010 jan-june)\rpt_2011-01-24_60494_wi-pcm-report-3_fin.docx
This page left blank intentionally.

WOLFE ISLAND WIND PLANT POST-CONSTRUCTION FOLLOW-UP PLAN BIRD AND BAT RESOURCES MONITORING REPORT NO. 3, JANUARY - JUNE 2010
cm w:\active\60960494\reports\monitoring report #3 (2010 jan-june)\rpt_2011-01-24_60494_wi-pcm-report-3_fin.docx 5.1
5.0 References
Arnett, E. B., D. B. Inkley, D. H. Johnson, R. P. Larkin, S. Manes, A. M. Manville, J. R. Mason, M. L. Morrison, M. D. Strickland, and R. Thresher. 2007. Impacts of wind energy facilities on wildlife and wildlife habitat. Wildlife Society Technical Review 07-2. The Wildlife Society, Bethesda, Maryland, USA.
Cadman, M. D., D. A. Sutherland, G. G. Beck, D. Lepage and A. R. Couturier (eds.). 2007. Atlas of the Breeding Birds of Ontario, 2001-2005. Bird Studies Canada, Environment Canada, Ontario Field Ornithologists, Ontario Ministry of Natural Resources, and Ontario Nature, Toronto. Xxii + 706 pp.
C. Francis, pers. comm. Environment Canada, January 29, 2008.
Cink, Calvin L. and Charles T. Collins. 2002. Chimney Swift (Chaetura pelagica), The Birds of North America Online (A. Poole, Ed.). Ithaca: Cornell Lab of Ornithology; Retrieved from the Birds of North America Online:
Dennis, D. G. and R. E. Chandler. 1974. Waterfowl use of the Ontario shoreline of the southern Great Lakes during migration. Pp. 58-65 in H. Boyd (ed.), Canadian Wildlife Service Waterfowl Studies in eastern Canada. Canadian Wildlife Service Report Series No. 29, Ottawa, Canada.
http://bna.birds.cornell.edu/bna/species/646doi:10.2173/bna.646
Environment Canada. 2007a. Wind Turbines and Birds - A Guidance Document for Environmental Assessment. Final: February 2007.
Environment Canada. 2007b. Recommended Protocols for Monitoring Impacts of Wind Turbines
on Birds. Final: February 2007.
Jain, A., P. Kerlinger, R. Curry and L. Slobodnik. 2007. Annual Report for the Maple Ridge Wind Power Project: Postconstruction Bird and Bat Fatality Study – 2006. Final Report, June 25, 2007. Prepared for PPM Energy and Horizon Energy and Technical Advisory Committee for the Maple Ridge Project Study.
Jain, A., P. Kerlinger, R. Curry, L. Slobodnik, J. Histed and J. Meacham. 2009. Annual Report for the Noble Clinton Windpark, LLC: Postconstruction Bird and Bat Fatality Study – 2008. April 13, 2009. Prepared for Noble Environmental Power, LLC.Kerns, J., W. P. Erickson and E. B. Arnett. 2005. Bat and bird fatality at wind energy facilities in Pennsylvania and West Virginia. Page 24-95 in E. B. Arnett, ed., Relationships between bats and wind turbines in Pennsylvania and West Virginia: an assessment of bat fatality search protocols, patterns of fatality, and behavioral interactions with wind turbines. A

WOLFE ISLAND WIND PLANT POST-CONSTRUCTION FOLLOW-UP PLAN BIRD AND BAT RESOURCES MONITORING REPORT NO. 3, JANUARY - JUNE 2010 References January 2011
5.2 cm w:\active\60960494\reports\monitoring report #3 (2010 jan-june)\rpt_2011-01-24_60494_wi-pcm-report-3_fin.docx
final report submitted to the Bats and Wind Energy Cooperative. Bat Conservation International, Austin, TX.
McCracken, J. 2009. “Grassland Bird Conservation in Ontario”, Bird Conservation Planning Workshop, Bird Studies Canada, Port Rowan, ON
National Wind Coordinating Committee. 2010. Wind Turbine Interactions with Birds, Bats, and their Habitats: A Summary of Research Results and Priority Questions. Spring 2010. www.nationalwind.org.
Ontario Ministry of Natural Resources. 2007. Guideline to Assist in the Review of Wind Power Proposals: Potential Impacts to Bats and Bat Habitats. Developmental Working Draft – August 2007.
Ontario Partners in Flight. 2006. Ontario Landbird Conservation Plan: Lower Great Lakes/St. Lawrence Plain (North American Bird Conservation Region 13), Priorities, Objectives and Recommended Actions. Environment Canada (Ontario Region) and Ontario Ministry of Natural Resources. Final Draft, February 15, 2006.
Ross, R. K. 1989. A re-survey of migrant waterfowl use of the Ontario St. Lawrence River and northeastern Lake Ontario. Technical Report Series No. 52. Canadian Wildlife Service, Ontario Region.
Stantec Consulting Ltd. 2008a. Environmental Review Report: Wolfe Island Wind Project. November 2008.
Stantec Consulting Ltd. 2008b. Wolfe Island Wind Project: 2007 Fall Raptors Baseline Report. January 2008.
Stantec Consulting Ltd. 2010. Wolfe Island EcoPower Centre: Post-construction Follow-up Plan Bird and Bat Resources – Monitoring Report No. 2, July-December 2009.
Strickland, D., and M. Morrison. 2008. A summary of avian/wind facility interactions in the U.S. Report presented to the Wind Turbine Guidelines Advisory Committee on February 26, 2008 in Washington, DC. Available online at http://www.fws.gov/habitatconservation/windpower/Meeting_Feb_26_28_2008/Morrison_Strickland.pdf

WOLFE ISLAND WIND PLANT POST-CONSTRUCTION FOLLOW-UP PLAN BIRD AND BAT RESOURCES MONITORING REPORT NO. 3, JANUARY - JUNE 2010
Appendix A
Figures

!
!
D
!
! DDD
#*
!(
!(!(
!( !(
!(
!( !(
!(
!(
!(
!(
!(
!(
!(
!(
!(
!( !(
!(!(
!(
!(
!(
!(
!(
!(
!(
!(
!(
!(
!(
!(!(
!(
!(
!(
!(
!(
!(
!(
!(
!(
!(!(
!(
!(
!(
!(
!(!(
!(
!(
!(
!(
!(
!(
!(
!(
!(
!(
!(
!(
!(
!(
!(
!(
!(
!(
!(!(
!(
!(
!(
!(
!(
!(
!(
!(
!(
!(
!(
!(
!(
!(
!(
"Lower Gap"
W O L F E I S L A N D
KINGSTON
KINGSTON WOLFE ISLAND FERRY
SIMCOE ISLAND
WINTER FERRY
St. Lawrence River
INTERNATIONAL BOUNDARY
CANA
DAUS
A
CAPE VINCENT
NEW YORK
Lake Ontario
BayfieldBay
ButtonBay
Pyke'sBay
Reed'sBay
95 HWY
CONC 3 RD
CONC 5 RD
CONC 7 RD
CONC 8 RD
CONC 4 RD
96 HWY
RIDGE RD
OAK POINT RD
S SHORE RD
CONC 9 RD
BASELINE RD
REEDS BAY RD
STEVENSON RD
HIGHLAND RD
12TH LINE RD
Reeds
Creek
Bueter
s Cree
k
CONC 2 RD
96 HWY
96 HWY
BayfieldBay
Marsh
Big SandyBay
Wetland
ButtonBay
Wetland
Brown'sBay
Wetland
SandBay
Wetland
BarrettBay
Wetland
McDonellBay
Wetland
ReedsBay
Wetland
Wolfe IslandMarsh
Wolfe IslandWetlandComplex
LittleCataraqui Creek
ComplexAbraham's Head
9
87
6
54
3 2
1
86
8584
83
82
80
79
78
77
76
75
74
73
72
7170
69
68
6766
65
64
63
6261
6059
58
57
56 55
5453
5251 50
49
48
4746
45 44
43
42
4140
39
3837
36
35
34 33
3231
30
29
28
27
26
25
2423
22
2120
191817
16
15
14
1312
1110
Graminoid Coastal Meadow Marsh
Little Bluestem-Switchgrass-Beachgrass Dune Grassland
Shanty
Creek
BENNETT RD
13TH LINE RD
KING ST W
81
378000
378000
382000
382000
386000
386000
390000
390000
394000
394000
4885
000
4885
000
4888
000
4888
000
4891
000
4891
000
4894
000
4894
000
4897
000
4897
000
¶Study Area
!. Gardiners Transformer Station!( Turbine Layout
230 kV Submarine Cable230 kV Transmission Line - UndergroundAccess Roads34.5 kV Collector Lines
#*230 kV Substation / Operation & Maintenance BuildingTemporary RoadCrane Walk Path
Area of Natural or Scientific Interest (ANSI)EarthLife
WetlandsProvincially Significant WetlandNon-Provincially Significant WetlandUnevaluated Wetland
Other Natural Areas! Earth Science SiteD International Biological Program Site! Life Science Site! Vegetation Communities
Warm Water StreamsCataraqui Region Conservation Authority LandsRare Species OccurenceWoodlot
W:\ac
tive\6
0960
494\g
raphic
s\GIS
\MXD
\Mon
itorin
gRep
ort_3
\6096
0494
_MR-
3_Fig
1-0_W
olfeIs
landP
rojec
tLayo
ut_20
1003
22_C
EW.m
xd - 9
/30/20
10 @
2:59
:27 P
M
Client/Project
Figure No.
Title
Wolfe IslandProject Layout
1.0
WOLFE ISLAND ECOPOWER CENTREMONITORING REPORT NO. 3
Notes
Legend
1.2.3.
Coordinate System: UTM NAD 83 - Zone 18 (N).Data Sources: Ontario Ministry of Natural Resources© Queens Printer Ontario, 2009.Image Sources: © LIDAR (study area coverage),January 2006; © LANDSAT7 (U.S. coverage), 1999;© City of Kingston (city coverage), 2005.Natural environmental features and hydrological data isfrom the Ministry of Natural Resources PeterboroughDistrict NRVIS 2006 and the Cataraqui RegionConservation Authority, 2006.
March 22, 2010160960494
0 21 Kilometers
1:60,000

!(
!(!(
!( !(
!(
!( !(
!(!(
!(
!(!(
!(
!(
!(
!(
!( !(
!( !(
!(
!(!(
!(
!(
!(
!(
!(
!(
!(
!(
!(!(
!(
!(
!(
!(
!(
!(
!(
!(
!(
!(!(
!(!(
!(
!(!(
!(!(
!(!(
!(
!(
!(
!(
!(
!(
!(!(
!(
!(
!(
!(!(
!(
!(
!(!(
!(
!(
!(
!(
!(
!(
!(
!(
!(
!(
!(
!(
!(
!(
!(
J
J
J J
J
J
J
J
J
J
7
11
10
8
9
Kingston
Wolfe Island
Frontenac Islands
Howe Island
Simcoe Island
Lake Ontario
BayfieldBay
ButtonBay
Pyke'sBay
Reed'sBay
987
6
543 2
1
8685
84
8382
8180
79
78
77
7675
7473
72
71 70
6968
6766
65
6463
62 61
6059
5857
5655
54 53
5251 50 49
48
4746
45 4443
42
4140
3938
3736
35
34 33
3231
3029
2827
26252423
222120
191817
16
15
141312
1110
¶!( Turbine Layout
Expressway / HighwayPrimary RoadSecondary RoadFerryInternational BoundaryWatercourseWaterbody
W:\ac
tive\6
0960
494\g
raphic
s\GIS\
MXD\
Monit
oring
Repo
rt_3\6
0960
494_
MR-3_
Fig2-0
_Wate
rfowlS
urvey
Loca
tions
_201
0032
2_CE
W.mx
d - 9/
30/20
10 @
3:01
:01 PM
Client/Project
Figure No.
Title
Wolfe Island WaterfowlSurvey Sectors
2.0
WOLFE ISLAND ECOPOWER CENTREMONITORING REPORT NO. 3
Notes
Legend
1.2.
Coordinate System: UTM NAD 83 - Zone 18 (N).Data Sources: Ontario Ministry of Natural Resources© Queens Printer Ontario, 2009.
March 22, 2010160960494
0 21 Kilometers
1:100,000
ONTARIO
QUEBEC
Ottawa
Toronto
Study Area

1
2
34
5
!
!26
25
!!!
!
44 43 42
!22
!15
!
!
!
41
30
29
Key Map
1:10,000Legend
Search Routes! Location of Breeding Bird Point Count
(1) Sandy Bay Wetland
(3) Reed's Bay Wetland
(5) Big Sandy Bay Wetland
(2) Bayfield Bay Marsh
(4) Button Bay Wetland
¶0 250 500 750 1,000Meters
Coordinate System: UTM NAD 83 - Zone 18 (N).Data Sources: Ontario Ministry of Natural Resources © Queens Printer Ontario, 2009.Image Sources: © LIDAR (study area coverage), January 2006; © LANDSAT7 (U.S. coverage), 1999; © City of Kingston (city coverage), 2005.
Notes1.2.3.
Client/Project
Figure No.
TitleMarsh and BreedingWaterfowl AreaSearch Route
3.0
WOLFE ISLAND ECOPOWER CENTREMONITORING REPORT NO. 3
August, 2010160960494
W:\ac
tive\6
0960
494\g
raphic
s\GIS
\MXD
\Mon
itorin
gRep
ort_3
\6096
0494
_MR-
3_Fig
3-0_
Marsh
Bree
dingW
aterfo
wl_2
0100
831_
PW.m
xd

!.
!
!
!!
!
!
!
!
!!!
!
!
!
!
!
!
!
!
!
!
!
!
!!
!
!
!
!
!
!
!
!
!
!
!
!
!
!!
!
!
!
!
!
!
D
!
D!
! DDD
"Lower Gap"
St. Lawrence RiverW O L F E I S L A N D
H O W E I S L A N D
KINGSTON
KINGSTON WOLFE ISLAND FERRY
SIMCOE ISLAND
INTERNATIONAL BOUNDARY
WINTER FERRY
CANA
DAUS
A
NEW YORK
CAPE VINCENT
Big SandyBay
Wetland
BayfieldBay
Marsh
GreaterCataraqui
Marsh
McDonellBay
Wetland
LittleCataraqui Creek
Complex
ButtonBay
Wetland
Brown'sBay
Wetland
SandBay
Wetland
BarrettBay
Wetland
WetlandRestoration
Project
Wolfe IslandWetlandComplex
ReedsBay
Wetland
OakPoint
Wetland
Madoma Marsh
Bayfield BayMarsh
ButternutCreek
Wetland Cassidy'sBayPSW
JohnsonBay
Wetland
Abraham's Head
95 HWY
CONC 3 RD CONC 5 RD
CONC 7 RD
CONC 8 RD
CONC 4 RD
96 HWY
FRONT RD
RIDGE RD
OAK POINT RD
DAYS RD.
S SHORE RD
CONC 9 RD
BASELINE RD
REEDS BAY RD
STEVENSON RDHIGHLAND RD
12TH LINE RD
13TH LINE RD
BATH RD
Shanty
Creek
Bueter
s Cree
k
COUNTER ST
CONC 2 RD
PRINCESS ST
DIVISION ST
96 HWY
96 HWY
96 HWY
PRINCESS ST
987
6
543 2
1
8685
84
8382
81
8079
78
77
7675
74
73
72
71 70
6968
6766
65
6463
62 61
6059
5857
5554
53
5251 50
49
48
4746
45 4443
42
4140
39
3837
36
35
34 33
3231
30
29
2827
2625
2423
222120
191817
16
15
1413
1211
10
31
37
44 43 42
41
40
38
36
3534
33
32
1
98
7
6
54
32
3029
28 2726
24
23
21
20
19
17
16
15
14
13
1211
10
Graminoid Coastal Meadow Marsh
Little Bluestem-Switchgrass-Beachgrass Dune Grassland
St. Lawrence IslandsNational ParkCedar Island
LOWER SIDERD
Reeds
Creek
HOWE ISLAND DR
BENNETT RD
15 HW
Y__ABBEY DAWN RD
KING ST W
56
39
25
22
18
374000
374000
378000
378000
382000
382000
386000
386000
390000
390000
394000
394000
4882
000
4882
000
4885
000
4885
000
4888
000
4888
000
4891
000
4891
000
4894
000
4894
000
4897
000
4897
000
4900
000
4900
000
¶0 21 Kilometers
LegendStudy Area
!( Turbine Layout!. Gardiners Transformer Station! Location of Preconstruction Breeding Bird Point Count
Paired Point Count Location
Grassland Point Count Resurveyed Post-Construction
Wetland Point Count Resurveyed Post-Constructionroads
Area of Natural or Scientific Interest (ANSI)EarthLife
WetlandsProvincially significant wetlandNon-provincially significant wetlandUnevaluated wetland
Other Natural Areas! Earth Science SiteD International Biological Program Site! Life Science Site! Vegetation Communities
WoodlotCataraqui Region Conservation Authority Lands
Coordinate System: UTM NAD 83 - Zone 18 (N).Data Sources: Ontario Ministry of Natural Resources © Queens Printer Ontario, 2009.Image Sources: © LIDAR (study area coverage), January 2006; © LANDSAT7 (U.S. coverage), 1999; © City of Kingston (city coverage), 2005.Natural environmental features and hydrological data is fromthe Ministry of Natural Resources Peterborough District NRVIS 2006,the Cataraqui Region Conservation Authority, 2006,and Ducks Unlimited Canada, April 2006.
Notes1.2.3.
4.
Client/Project
Figure No.
TitleLocation of Grassland andMarsh Breeding Bird PointCounts
4.0
WOLFE ISLAND ECOPOWER CENTREMONITORING REPORT NO. 3
August, 2010160960494
W:\ac
tive\6
0960
494\g
raphic
s\GIS
\MXD
\Mon
itorin
gRep
ort_3
\6096
0494
_MR-
3_Fig
4-0_
Gras
sland
Marsh
Bree
dingB
irdCo
unt_2
0100
831_
PW.m
xd

"Lower Gap"
W O L F E I S L A N D
H O W E I S L A N D
KINGSTON
KINGSTON WOLFE ISLAND FERRY
SIMCOE ISLAND
WINTER FERRY
St. Lawrence River
INTERNATIONAL BOUNDARY
CANA
DAUS
A
CAPE VINCENT
NEW YORK
SoutheastArea Search(195.4 ha)
NorthwestArea Search(199.6 ha)
95 HWY
CONC 3 RD
CONC 5 RD
CONC 7 RD
CONC 8 RD
CONC 4 RD
96 HWY
LOWER SIDERD
2 HWY
FRONT RD
RIDGE RD
OAK POINT RD
DAYS RD.
S SHORE RD
15 HW
Y
CONC 9 RD
BASELINE RD
401 HWY
REEDS BAY RD
STEVENSON RDHIGHLAND RD
12TH LINE RD
13TH LINE RD
BATH RD
HOWE ISLAND DR
Shanty
Creek
COUNTER ST
CONC 2 RD
PRINCESS ST
DIVISION ST
96 HWY
96 HWY
96 HWY
PRINCESS ST
987
6
543 2
1
8685
84
8382
80
79
78
77
7675
74
7372
71 70
6968
6766
65
6463
62 61
6059
5857
5554
53
5049
48
4746
45 4443
42
4140
39
3837
36
35
34 33
3231
30
29
2827
2625
2423
222120
191817
16
15
1413
1211
10
Reeds
Creek
BENNETT RD
Bueter
s Cree
k
__ABBEY DAWN RD
KING ST W
81 56
5251
374000
374000
378000
378000
382000
382000
386000
386000
390000
390000
394000
394000
4885
000
4885
000
4888
000
4888
000
4891
000
4891
000
4894
000
4894
000
4897
000
4897
000
4900
000
4900
000
4903
000
4903
000
0 21 Kilometers
Study AreaTurbine Layout
Tall Hay(1)
Fallow(2)
Woodlot
Hay(5)
Hay(6)
Hay(7)
Hay(8)
Ploughed(4)
Hay(3)
CONC 3 RD9
87
6
25
24
23
22
2120
1918
17
16
15
13
12
11
10 Hay(2)
Hay(11)
Wheat(12)Hay
(10)
Pasture (7)
Pasture(8)
Pasture/Barnyard
(9)
Hay(6)
Pasture(4)
Hay(5)Pasture
(1)
Wheat(3)
CONC 8 RD
Shan
ty Cr
eek
REEDS BAY RD
58
57
48
47
46
4544
43
CONC 9 RD
BENNETT RD
(1) Sector Number
Coordinate System: UTM NAD 83 - Zone 18 (N).Data Sources: Ontario Ministry of Natural Resources © Queens Printer Ontario, 2009.Image Sources: © LIDAR (study area coverage), January 2006; © LANDSAT7 (U.S. coverage), 1999; © City of Kingston (city coverage), 2005.
Notes1.2.3.
Client/Project
Figure No.
TitlePost-ConsturctionBreeding BirdArea Search Locations
5.0
WOLFE ISLAND ECOPOWER CENTREMONITORING REPORT NO. 3
August, 2010160960494
W:\ac
tive\6
0960
494\g
raphic
s\GIS
\MXD
\Mon
itorin
gRep
ort_3
\6096
0494
_MR-
3_Fig
5-0_B
reedin
gBird
Area
Searc
h_20
1008
31_C
EW.m
xd - 8
/31/20
10 @
12:19
:20 PM
Legend

!.
#*
!(
!(!(
!( !(
!(
!( !(
!(!(
!(
!(
!(
!(
!(
!(
!(
!( !(
!( !(
!(
!(!(
!(
!(
!(
!(
!(
!(
!(
!(
!(!(
!(
!(
!(
!(
!(
!(
!(
!(
!(
!(!(
!(
!(
!(
!(!(
!(
!(
!(
!(
!(
!(
!(
!(
!(
!(
!(!(
!(
!(
!(
!(
!(
!(
!(
!(!(
!(
!(
!(
!(
!(
!(
!(
!(
!(
!(
!(
!(
!(
!(
!(
"Lower Gap"
W O L F E I S L A N D
H O W E I S L A N D
KINGSTON
KINGSTON WOLFE ISLAND FERRY
SIMCOE ISLAND
WINTER FERRY
St. Lawrence River
INTERNATIONAL BOUNDARY
CANA
DAUS
A
CAPE VINCENT
NEW YORK
SoutheastArea Search(195.4 ha)
NorthwestArea Search(199.6 ha)
95 HWY
CONC 3 RD
CONC 5 RD
CONC 7 RD
CONC 8 RD
CONC 4 RD
96 HWY
LOWER SIDERD
2 HWY
FRONT RD
RIDGE RD
OAK POINT RD
DAYS RD.
S SHORE RD
15 HW
Y
CONC 9 RD
BASELINE RD
401 HWY
REEDS BAY RD
STEVENSON RDHIGHLAND RD
12TH LINE RD
13TH LINE RD
BATH RD
HOWE ISLAND DR
Shanty
Creek
Bueter
s Cree
k
COUNTER ST
CONC 2 RD
PRINCESS ST
DIVISION ST
96 HWY
96 HWY
96 HWY
PRINCESS ST
Big SandyBay
Wetland
GreaterCataraqui
Marsh
BayfieldBay
Marsh
McDonellBay
Wetland
LittleCataraqui Creek
Complex
ButtonBay
Wetland
Brown'sBay
Wetland
SandBay
Wetland
BarrettBay
Wetland
WetlandRestoration
Project
Wolfe IslandWetlandComplex
ReedsBay
Wetland
OakPoint
Wetland
Madoma Marsh
JohnsonBay
Wetland
Bayfield BayMarsh
ButternutCreek
Wetland Cassidy'sBayPSW
Pitt'sFerry
WetlandLawlessWetland
Abraham's Head
987
6
543 2
1
8685
84
8382
80
79
78
77
7675
74
7372
71 70
6968
6766
65
6463
62 61
6059
5857
56 5554
53
52 5049
48
4746
45 4443
42
4140
39
3837
36
35
34 33
3231
30
29
2827
2625
2423
222120
191817
16
15
1413
1211
10
Reeds
Creek
BENNETT RD
__ABBEY DAWN RD
KING ST W
81 51
374000
374000
378000
378000
382000
382000
386000
386000
390000
390000
394000
394000
4885
000
4885
000
4888
000
4888
000
4891
000
4891
000
4894
000
4894
000
4897
000
4897
000
4900
000
4900
000
4903
000
4903
000
¶0 21 Kilometers
Coordinate System: UTM NAD 83 - Zone 18 (N).Data Sources: Ontario Ministry of Natural Resources © Queens Printer Ontario, 2009.Image Sources: © LIDAR (study area coverage), January 2006; © LANDSAT7 (U.S. coverage), 1999; © City of Kingston (city coverage), 2005.
Notes1.2.3.
Client/Project
Figure No.
TitleWoodlot Point Countand Area Search Locations
6.0
WOLFE ISLAND ECOPOWER CENTREMONITORING REPORT NO. 3
August, 2010160960494
W:\ac
tive\6
0960
494\g
raphic
s\GIS
\MXD
\Mon
itorin
gRep
ort_3
\6096
0494
_MR-
3_Fig
6-0_W
oodlo
tPoin
tCou
nt_20
1008
31_C
EW.m
xd - 9
/2/20
10 @
3:31
:43 PM
Legend
!(
!(!(
!(!(
!(
!(!(
!(
!(
!(
!(
!(
!(
!(
!(
!(
!(
!(
!(
!(
!?
CONC 3 RD
SandBay
Wetland
9
87
54
3 2
1
27
23
22
14
13
12
11
10
!(
!(
!(
!(
!(!(
!(
!?
!?
!?
!?
!?
!?
HIGHLAND RD
Big SandyBay
Wetland
34 33
32
31
30
29
Study Area230 kV Transmission Line - UndergroundAccess Roads34.5 kV Collector Lines230 kV Submarine Cable
#* 230 kV Substation230 kV Substation / Operation & Maintenance Building
Crane Walk PathTemporary Road
!. Gardiners Transformer Station!( Turbine Layout
Area of Natural or Scientific Interest (ANSI)EarthLife
WetlandsProvincially Significant WetlandNon-Provincially Significant WetlandUnevaluated WetlandWoodlot
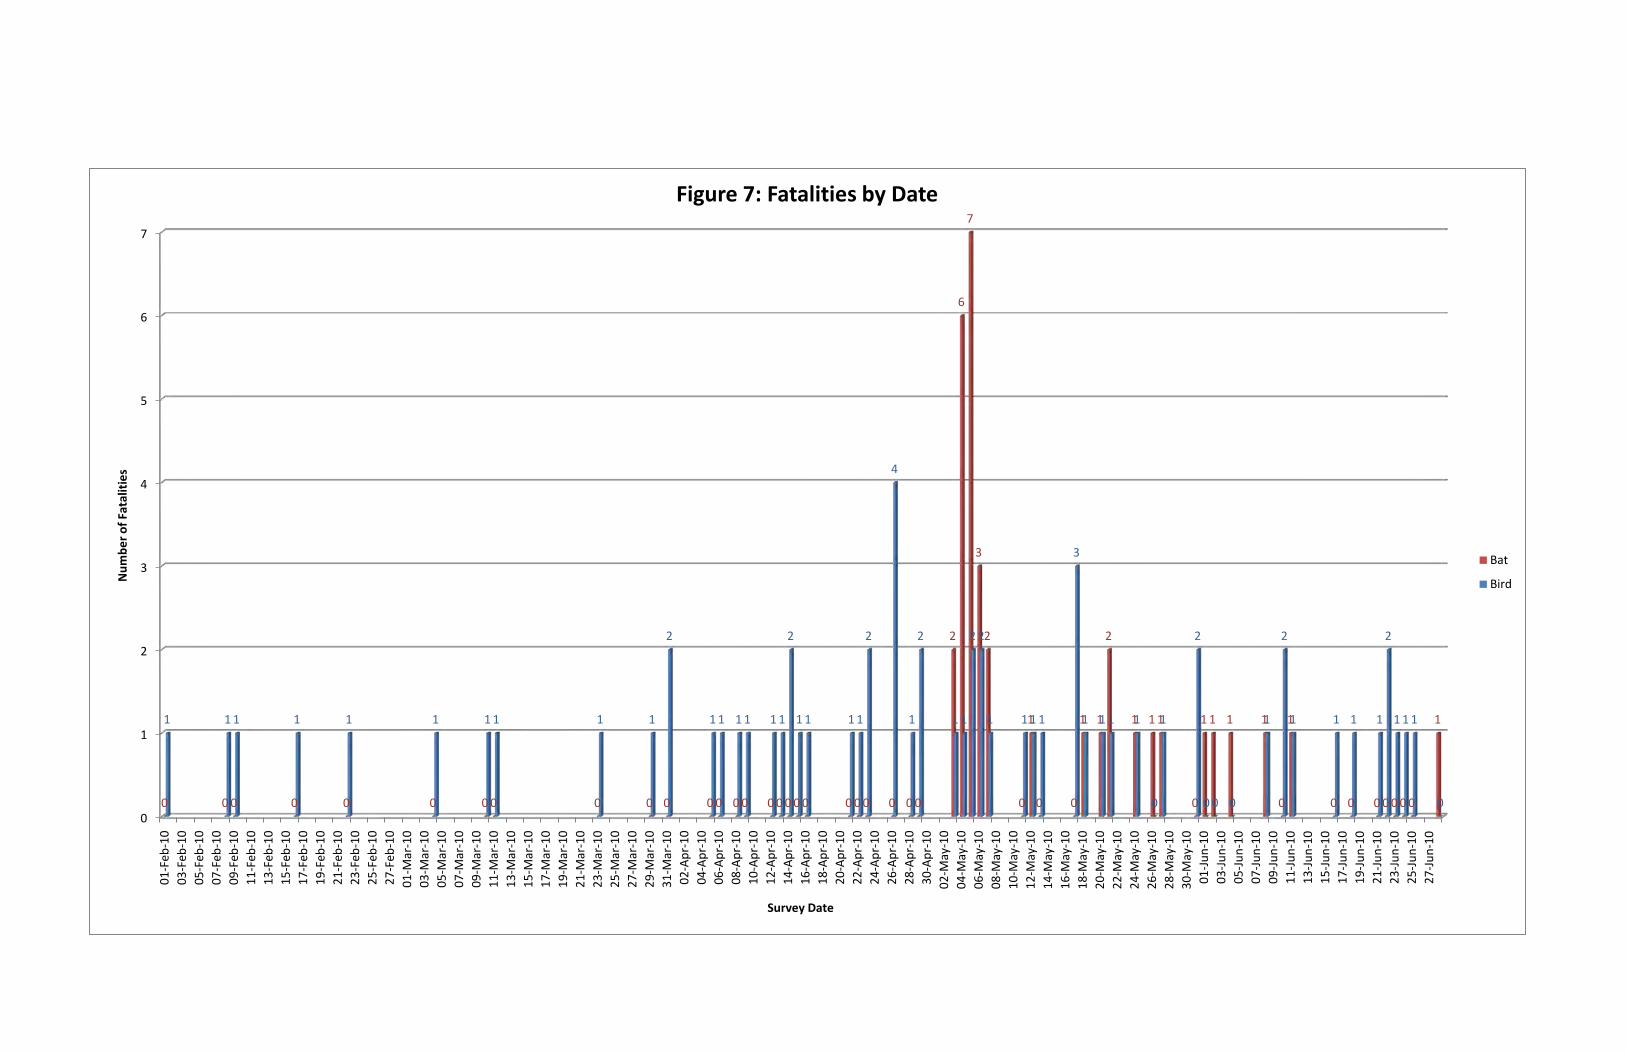
0
1
2
3
4
5
6
7
01-F
eb-1
003
-Feb
-10
05-F
eb-1
007
-Feb
-10
09-F
eb-1
011
-Feb
-10
13-F
eb-1
015
-Feb
-10
17-F
eb-1
019
-Feb
-10
21-F
eb-1
023
-Feb
-10
25-F
eb-1
027
-Feb
-10
01-M
ar-1
003
-Mar
-10
05-M
ar-1
007
-Mar
-10
09-M
ar-1
011
-Mar
-10
13-M
ar-1
015
-Mar
-10
17-M
ar-1
019
-Mar
-10
21-M
ar-1
023
-Mar
-10
25-M
ar-1
027
-Mar
-10
29-M
ar-1
031
-Mar
-10
02-A
pr-1
004
-Apr
-10
06-A
pr-1
008
-Apr
-10
10-A
pr-1
012
-Apr
-10
14-A
pr-1
016
-Apr
-10
18-A
pr-1
020
-Apr
-10
22-A
pr-1
024
-Apr
-10
26-A
pr-1
028
-Apr
-10
30-A
pr-1
002
-May
-10
04-M
ay-1
006
-May
-10
08-M
ay-1
010
-May
-10
12-M
ay-1
014
-May
-10
16-M
ay-1
018
-May
-10
20-M
ay-1
022
-May
-10
24-M
ay-1
026
-May
-10
28-M
ay-1
030
-May
-10
01-J
un-1
003
-Jun
-10
05-J
un-1
007
-Jun
-10
09-J
un-1
011
-Jun
-10
13-J
un-1
015
-Jun
-10
17-J
un-1
019
-Jun
-10
21-J
un-1
023
-Jun
-10
25-J
un-1
027
-Jun
-10
0 0 0 0 0 0 0 0 0 0 0 0 0 0 0 0 0 0 0 0 0 0 0 0 0 0
2
6
7
3
2
0
1
0 0
1 1
2
1 1 1
0
1 1 1 1
0
1
0 0 0 0 0 0 0
11 1 1 1 1 1 1 1 1 1
2
1 1 1 1 1 1
2
1 1 1 1
2
4
1
2
1 1
2 2
1 1 1 1
3
1 1 1 1
0
1
2
0 0 0
1
2
1 1 1 1
2
1 1 1
0
Num
ber o
f Fat
alit
ies
Survey Date
Figure 7: Fatalities by Date
Bat
Bird
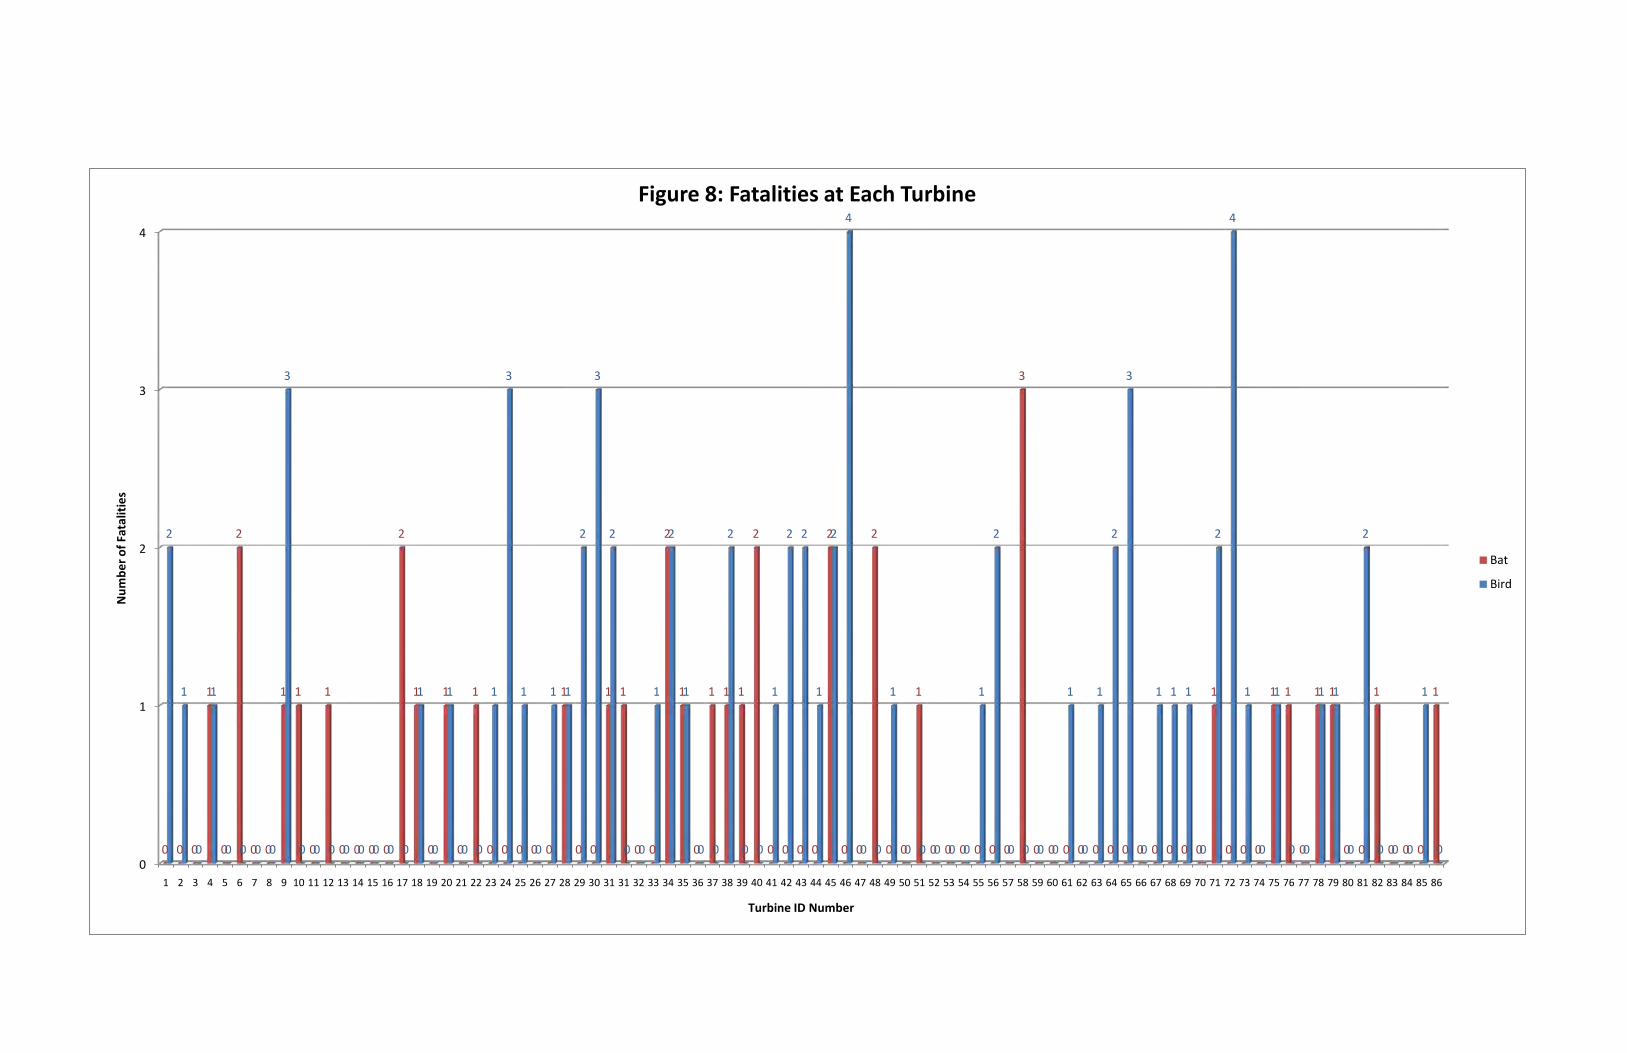
0
1
2
3
4
1 2 3 4 5 6 7 8 9 10 11 12 13 14 15 16 17 18 19 20 21 22 23 24 25 26 27 28 29 30 31 31 32 33 34 35 36 37 38 39 40 41 42 43 44 45 46 47 48 49 50 51 52 53 54 55 56 57 58 59 60 61 62 63 64 65 66 67 68 69 70 71 72 73 74 75 76 77 78 79 80 81 82 83 84 85 86
0 0 0
1
0
2
0 0
1 1
0
1
0 0 0 0
2
1
0
1
0
1
0 0 0 0 0
1
0 0
1 1
0 0
2
1
0
1 1 1
2
0 0 0 0
2
0 0
2
0 0
1
0 0 0 0 0 0
3
0 0 0 0 0 0 0 0 0 0 0 0
1
0 0 0
1 1
0
1 1
0 0
1
0 0 0
1
2
1
0
1
0 0 0 0
3
0 0 0 0 0 0 0 0
1
0
1
0 0
1
3
1
0
1 1
2
3
2
0 0
1
2
1
0 0
2
0 0
1
2 2
1
2
4
0 0
1
0 0 0 0 0
1
2
0 0 0 0
1
0
1
2
3
0
1 1 1
0
2
4
1
0
1
0 0
1 1
0
2
0 0 0
1
0
Num
ber o
f Fat
alit
ies
Turbine ID Number
Figure 8: Fatalities at Each Turbine
Bat
Bird

8
10
12
14
16
(#) /
mean Wind Speed (m
/s)
Figure 9: Comparison of bat fatalities (bars) vs. mean overnight wind speed (line)
0
2
4
6
1‐May
7‐May
13‐M
ay
19‐M
ay
25‐M
ay
31‐M
ay
6‐Jun
12‐Jun
18‐Jun
24‐Jun
30‐Jun
Fatalities (
Date

#*
Lake Ontario
BayfieldBay
ButtonBay
Pyke'sBay
Reed'sBay
95 HWYCONC 3 RD
CONC 5 RD
CONC 7 RD
CONC 8 RD
CONC 4 RD
96 HWY
OAK POINT RD
S SHORE RD
CONC 9 RDBASELINE RD
FRONT RD
REEDS BAY RD
STEVENSON RD
12TH LINE RD
Reeds
Creek
Shanty
Creek
Bueter
s Cree
k
96 HWY
96 HWY
96 HWY
Big SandyBay
Wetland
BayfieldBay
Marsh
ButtonBay
Wetland
Brown'sBay
Wetland
SandBay
Wetland
BarrettBay
Wetland
Wolfe IslandWetlandComplex
McDonellBay
Wetland
ReedsBay
Wetland
Wolfe IslandMarsh
LittleCataraqui Creek
ComplexAbraham's Head
RIDGE RD
HIGHLAND RD
DAYS RD.
BENNETT RD
13TH LINE RD
CONC 2 RD
KING ST W
7Mar. 65Dec. 5
5Feb. 20
9Feb. 28
6Feb. 20
7Feb. 20
7Nov. 20
7Nov. 28
6Dec. 19
7 + 6Nov. 28 + Dec. 5
5 + 5Nov. 28 + Dec. 5
5 + 7 + 5Nov. 20 + Dec. 5 + Jan. 23
Client/Project
Figure No.
TitleComparison of WinteringRaptor Concentrations2006/2007 AND 2009/2010
10.0
WOLFE ISLAND ECOPOWER CENTREMONITORING REPORT NO. 3
July, 2010160960494
Notes
Legend
1.2.3.
W:\ac
tive\6
0960
494\g
raphic
s\GIS
\MXD
\Mon
itorin
gRep
ort_3
\6096
0494
_MR-
3_Fig
10-0
_Wint
ering
Rapto
r_20
1008
31_C
EW.m
xd -
8/31/2
010 @
3:14
:55 P
M
#*
!(
!(!(
!( !(
!(
!( !(
!(!(
!(
!(
!(
!(
!(
!(
!(
!( !(
!( !(
!(
!(!(
!(
!(
!(
!(
!(
!(
!(
!(
!(!(
!(
!(
!(
!(
!(
!(
!(
!(
!(
!(!(
!(
!(
!(
!(
!(!(
!(
!(
!(
!(
!(
!(
!(
!(
!(
!(!(
!(
!(
!(
!(
!(
!(
!(
!(!(
!(
!(
!(
!(
!(
!(
!(
!(
!(
!(
!(
!(
!(
!(
!(
Lake Ontario
BayfieldBay
ButtonBay
Pyke'sBay
Reed'sBay
95 HWY
CONC 3 RD
CONC 5 RD
CONC 7 RD
CONC 8 RD
CONC 4 RD
96 HWY
RIDGE RD
OAK POINT RD
S SHORE RD
CONC 9 RD
BASELINE RD
FRONT RD
REEDS BAY RD
STEVENSON RDHIGHLAND RD
12TH LINE RD
Reeds
Creek
Shanty
Creek
CONC 2 RD
96 HWY
96 HWY
96 HWY
Big SandyBay
Wetland
BayfieldBay
Marsh
ButtonBay
Wetland
Brown'sBay
Wetland
SandBay
Wetland
BarrettBay
Wetland
Wolfe IslandWetlandComplex
McDonellBay
Wetland
ReedsBay
Wetland
Wolfe IslandMarsh
LittleCataraqui Creek
Complex
987
6
543 2
1
8685
84
8382
8180
79
78
77
7675
74
7372
71 70
6968
6766
65
6463
62 61
6059
5857
5655
5453
5251 50
49
48
4746
45 4443
42
4140
39
3837
36
35
34 33
3231
30
29
2827
2625
2423
222120
191817
16
15
1413
1211
10
5Mar. 2
5Jan. 6
6Jan. 6
5Mar. 17
DAYS RD.
BENNETT RD
Bueter
s Cree
k
13TH LINE RD
KING ST W
Coordinate System: UTM NAD 83 - Zone 18 (N).Data Sources: Ontario Ministry of Natural Resources © Queens Printer Ontario, 2009.Image Sources: © LIDAR (study area coverage), January 2006; © LANDSAT7(U.S. coverage), 1999; © City of Kingston (city coverage), 2005.Natural environmental features and hydrological data is from the Ministry of Natural ResourcesPeterborough District NRVIS 2006 and the Cataraqui Region Conservation Authority, 2006.
2006\2007 Pre-Construction Results
2009\2010 Post-Construction Results
Study Area
!. Gardiners Transformer Station
!( Turbine Layout
230 kV Submarine Cable
230 kV Transmission Line - Underground
Access Roads
34.5 kV Collector Lines
#*230 kV Substation / Operation & Maintenance Building
Temporary Road
Crane Walk Path
Woodlot
WetlandsProvincially Significant Wetland
Non-Provincially Significant Wetland
Unevaluated Wetland ¶0 21 Kilometers
1:85,000
7Dec. 20Location of Observation
# of Raptors in ObservationDate of Observation
7Dec. 20Location of Observation
# of Raptors in ObservationDate of Observation

Lake Ontario
BayfieldBay
ButtonBay
Pyke'sBay
Reed'sBay
95 HWY
CONC 3 RD CONC 5 RD
CONC 7 RD
CONC 8 RD
CONC 4 RD
96 HWY
RIDGE RD
OAK POINT RD
S SHORE RD
CONC 9 RDBASELINE RD
FRONT RD
STEVENSON RD
12TH LINE RD
Reeds
Creek
Shanty
Creek
BENNETT RD
Bueter
s Cree
k
96 HWY
96 HWY
96 HWY
Big SandyBay
Wetland
BayfieldBay
Marsh
ButtonBay
Wetland
Brown'sBay
Wetland
SandBay
Wetland
BarrettBay
Wetland
Wolfe IslandWetlandComplex
McDonellBay
Wetland
ReedsBay
Wetland
Wolfe IslandMarsh
LittleCataraqui Creek
ComplexAbraham's Head
7*Mar. 6
3Mar. 6
3Mar. 6
4Mar. 6
7*Feb. 20 3Feb. 20
3Feb. 20
3 + 3Mar. 6 + Nov. 208 + 6Dec. 19 + Feb. 20
4 + 4Nov. 28 + Dec. 19
4 + 3 + 3*Feb. 5 + Feb. 20 + Mar. 6
REEDS BAY RD
HIGHLAND RD
DAYS RD.
13TH LINE RD
CONC 2 RD
KING ST W
Client/Project
Figure No.
TitleComparison of WinteringShort-eared OwlConcentrations2006/2007 AND 2009/2010
11.0
WOLFE ISLAND ECOPOWER CENTREMONITORING REPORT NO. 3
August, 2010160960494
Notes
Legend
1.2.3.
W:\ac
tive\6
0960
494\g
raphic
s\GIS
\MXD
\Mon
itorin
gRep
ort_3
\6096
0494
_MR-
3_Fig
11-0
_Wint
ering
Shor
tEare
dOwl
_201
0083
1_CE
W.m
xd - 8
/31/20
10 @
12:14
:22 P
M
Lake Ontario
BayfieldBay
ButtonBay
Pyke'sBay
Reed'sBay
95 HWY
CONC 3 RD
CONC 7 RD
CONC 8 RD
CONC 4 RD
96 HWY
RIDGE RD
OAK POINT RD
S SHORE RD
CONC 9 RD
BASELINE RD
FRONT RD
REEDS BAY RD
STEVENSON RDHIGHLAND RD
12TH LINE RD
Reeds
Creek
Shanty
Creek
CONC 2 RD
96 HWY
96 HWY
96 HWY
Big SandyBay
Wetland
BayfieldBay
Marsh
ButtonBay
Wetland
Brown'sBay
Wetland
SandBay
Wetland
BarrettBay
Wetland
Wolfe IslandWetlandComplex
ReedsBay
Wetland
McDonellBay
Wetland
Wolfe IslandMarsh
LittleCataraqui Creek
Complex
987
6
543 2
1
8685
84
8382
8180
79
78
77
7675
74
7372
71 70
6968
6766
65
6463
62 61
6059
5857
5655
5453
5251 50
49
48
4746
45 4443
42
4140
39
3837
36
35
34 33
3231
30
29
2827
2625
2423
222120
191817
16
15
1413
1211
10 3Mar. 2
3Dec. 22 4Dec. 223 + 3Nov. 11 + Jan. 6
3 + 5*Dec. 22 + Jan. 64 + 3Dec. 8 + Dec. 224 + 3 + 3Nov. 11 + Jan. 6 + Mar. 11
CONC 5 RD
DAYS RD.
BENNETT RD
Bueter
s Cree
k
13TH LINE RD
KING ST W
Coordinate System: UTM NAD 83 - Zone 18 (N).Data Sources: Ontario Ministry of Natural Resources © Queens Printer Ontario, 2009.Image Sources: © LIDAR (study area coverage), January 2006; © LANDSAT7(U.S. coverage), 1999; © City of Kingston (city coverage), 2005.Natural environmental features and hydrological data is from the Ministry of Natural ResourcesPeterborough District NRVIS 2006 and the Cataraqui Region Conservation Authority, 2006.
Location of ObservationObservation Made During Daytime Raptor Study# of Owls in ObservationDate of Observation
7*Dec. 20
2006/2007 Pre-Construction Results
2009/2010 Post-Construction Results
Study Area
Gardiners Transformer Station
Turbine Layout
230 kV Submarine Cable
230 kV Transmission Line - Underground
Access Roads
34.5 kV Collector Lines230 kV Substation / Operation & Maintenance Building
Temporary Road
Crane Walk Path
Woodlot
WetlandsProvincially Significant Wetland
Non-Provincially Significant Wetland
Unevaluated Wetland
0 21 Kilometers
1:85,299
Location of ObservationObservation Made During Daytime Raptor Study# of Owls in ObservationDate of Observation
7*Dec. 20

CANA
DA
Lake Ontario
BayfieldBay
ButtonBay
Pyke'sBay
Reed'sBay
17421632
2081
700
13001900
320
1837
9002048
901
518
758
2211000
1368 975
280444
7120
5650
350550
2265
368
578
560
52981703
478
1875
2870
3413
10801010 1558
518
225
3615
44502180 2248
2823
1968
1926
1441352
73595 HWY
CONC 3 RD
CONC 5 RD
CONC 7 RD
CONC 8 RD96 HWY
OAK POINT RD
S SHORE RD
CONC 9 RDBASELINE RD
FRONT RD
STEVENSON RDHIGHLAND RD
12TH LINE RD
Reeds
Creek
CONC 2 RD
96 HWY
96 HWY
96 HWY
Big SandyBay
Wetland
BayfieldBay
Marsh
ButtonBay
Wetland
Brown'sBay
Wetland
SandBay
Wetland
BarrettBay
Wetland
Wolfe IslandWetlandComplex
McDonellBay
Wetland
ReedsBay
Wetland
Wolfe IslandMarsh
LittleCataraqui Creek
ComplexAbraham's Head
Graminoid Coastal Meadow Marsh
Little Bluestem-Switchgrass-Beachgrass Dune Grassland
CONC 4 RD
RIDGE RD
REEDS BAY RD
DAYS RD.
Shanty
Creek
BENNETT RD
Bueter
s Cree
k
13TH LINE RD
KING ST W
Client/Project
Figure No.
TitleComparison of SpringWaterfowl Foragingin 2007 and 2010
12.0
WOLFE ISLAND ECOPOWER CENTREMONITORING REPORT NO. 3
August, 2010160960494
Notes
Legend
1.2.3.
W:\ac
tive\6
0960
494\g
raphic
s\GIS
\MXD
\Mon
itorin
gRep
ort_3
\6096
0494
_MR-
3_Fig
12-0
_Spri
ngWa
terfow
lFora
ging_
2010
0831
_CEW
.mxd
- 8/3
1/201
0 @ 12
:12:37
PM
Lake Ontario
BayfieldBay
ButtonBay
Pyke'sBay
Reed'sBay
258
544
485
342
908
430
511
433
474
770
623 305
291
748
2520
1023
3966
1155
1520
2116
3963
1588
1500
4295
2044
2544
2132
7008
1014
7035
3643
1723
95 HWY
CONC 3 RD
CONC 5 RD
CONC 7 RDCONC 8 RD96 H
WY
OAK POINT RD
S SHORE RD
BASELINE RD
FRONT RD
REEDS BAY RD
12TH LINE RD
Reeds
Creek
Shanty
Creek
CONC 2 RD
96 HWY
96 HWY
96 HWY
Big SandyBay
Wetland
BayfieldBay
Marsh
ButtonBay
Wetland
Brown'sBay
Wetland
SandBay
Wetland
BarrettBay
Wetland
Wolfe IslandWetlandComplex
ReedsBay
Wetland
McDonellBay
Wetland
Wolfe IslandMarsh
LittleCataraqui Creek
Complex
987
6
5
3 21
8685
84
8382
8180
79
78
77
7675
74
7372
71 70
6968
6766
65
6463
62 61
6059
5857
5655
5453
5251 50
49
48
4746
45 4443
42
4140
39
3837
36
35
34 33
3231
30
29
2827
26252423
222120
191817
16
15
1413
1211
10
Graminoid Coastal Meadow Marsh
Little Bluestem-Switchgrass-Beachgrass Dune Grassland
CONC 4 RD
RIDGE RD
CONC 9 RD
STEVENSON RDHIGHLAND RD
DAYS RD.
BENNETT RD
Bueter
s Cree
k
13TH LINE RD
KING ST W
4
Coordinate System: UTM NAD 83 - Zone 18 (N).Data Sources: Ontario Ministry of Natural Resources © Queens Printer Ontario, 2009.Image Sources: © LIDAR (study area coverage), January 2006; © LANDSAT7(U.S. coverage), 1999; © City of Kingston (city coverage), 2005.Natural environmental features and hydrological data is from the Ministry of Natural ResourcesPeterborough District NRVIS 2006 and the Cataraqui Region Conservation Authority, 2006.
2007 Pre-Construction Results
2010 Post-Construction Results
Study Area
Gardiners Transformer Station
Turbine Layout
230 kV Submarine Cable
230 kV Transmission Line - Underground
Access Roads
34.5 kV Collector Lines230 kV Substation / Operation & Maintenance Building
Temporary Road
Crane Walk Path
Woodlot
WetlandsProvincially Significant Wetland
Non-Provincially Significant Wetland
Unevaluated Wetland
#< 5,000 Waterfowl Days5,000 - 10,000 Waterfowl Days
> 10,000 Waterfowl Days# of Waterfowl Days
#< 5,000 Waterfowl Days5,000 - 10,000 Waterfowl Days
> 10,000 Waterfowl Days# of Waterfowl Days
0 21 Kilometers
1:85,000

CANA
DA
Lake Ontario
BayfieldBay
ButtonBay
Pyke'sBay
Reed'sBay
74
3
8
9
6
2
5
1
10
95 HWY
CONC 3 RD
CONC 5 RD
CONC 7 RD
CONC 8 RD
CONC 4 RD
96 HWY
RIDGE RD
OAK POINT RD
S SHORE RD
CONC 9 RDBASELINE RD
FRONT RD
REEDS BAY RD
STEVENSON RDHIGHLAND RD
12TH LINE RD
Reeds
Creek
BENNETT RD
Bueter
s Cree
k
CONC 2 RD
96 HWY
96 HWY
96 HWY
Big SandyBay
Wetland
BayfieldBay
Marsh
ButtonBay
Wetland
Brown'sBay
Wetland
SandBay
Wetland
BarrettBay
Wetland
Wolfe IslandWetlandComplex
McDonellBay
Wetland
ReedsBay
Wetland
Wolfe IslandMarsh
LittleCataraqui Creek
ComplexAbraham's Head
DAYS RD.
Shanty
Creek
13TH LINE RD
KING ST W
Client/Project
Figure No.
TitleComparison ofSpring WaterfowlMorning Movement2007 and 2010
13.0
WOLFE ISLAND ECOPOWER CENTREMONITORING REPORT NO. 3
August, 2010160960494
Notes
Legend
1.2.3.
11
Lake Ontario
BayfieldBay
ButtonBay
Pyke'sBay
Reed'sBay
8 14
3
4
2
6
5
12
1
13
10
9
7
95 HWY
CONC 3 RD
CONC 5 RD
CONC 7 RD
CONC 8 RD
CONC 4 RD
96 HWY
RIDGE RD
OAK POINT RD
S SHORE RD
CONC 9 RD
BASELINE RD
FRONT RD
REEDS BAY RD
STEVENSON RDHIGHLAND RD
12TH LINE RD
Reeds
Creek
Shanty
Creek
Bueter
s Cree
k
CONC 2 RD
96 HWY
96 HWY
96 HWY
Big SandyBay
Wetland
BayfieldBay
Marsh
ButtonBay
Wetland
Brown'sBay
Wetland
SandBay
Wetland
BarrettBay
Wetland
Wolfe IslandWetlandComplex
ReedsBay
Wetland
McDonellBay
Wetland
Wolfe IslandMarsh
LittleCataraqui Creek
Complex
987
6
543 2
1
8685
84
8382
8180
79
78
77
7675
74
7372
71 70
6968
6766
65
6463
62 61
6059
5857
5655
5453
5251 50
49
48
4746
45 4443
42
4140
39
3837
36
35
34 33
3231
30
29
2827
2625
2423
222120
191817
16
15
1413
1211
10
DAYS RD.
BENNETT RD
13TH LINE RD
KING ST W
Coordinate System: UTM NAD 83 - Zone 18 (N).Data Sources: Ontario Ministry of Natural Resources © Queens Printer Ontario, 2009.Image Sources: © LIDAR (study area coverage), January 2006; © LANDSAT7(U.S. coverage), 1999; © City of Kingston (city coverage), 2005.Natural environmental features and hydrological data is from the Ministry of Natural ResourcesPeterborough District NRVIS 2006 and the Cataraqui Region Conservation Authority, 2006.
2007 Pre-Construction Results
2010 Post-Construction Results
Study Area
Gardiners Transformer Station
Turbine Layout
230 kV Submarine Cable
230 kV Transmission Line - Underground
Access Roads
34.5 kV Collector Lines230 kV Substation / Operation & Maintenance Building
Temporary Road
Crane Walk Path
Woodlot
WetlandsProvincially Significant Wetland
Non-Provincially Significant Wetland
Unevaluated Wetland
0 21 Kilometers
1:85,000
Survey LocationsSpring Waterfowl Morning Movement% at Blade Height
<10%
10-49%
>50%
0 - 500 individuals
501 - 1000 individuals> 1000 individuals
0 - 500 individuals
501 - 1000 individuals> 1000 individuals
W:\ac
tive\6
0960
494\g
raphic
s\GIS
\MXD
\Mon
itorin
gRep
ort_3
\6096
0494
_MR-
3_Fig
13-0
_Spri
ngW
aterfo
wlMo
rning
Move
ment_
2010
0831
_CEW
.mxd
- 8/3
1/201
0 @ 12
:07:51
PM
Spring Waterfowl Morning Movement% at Blade Height
<10%
10-49%
>50%
Waterfowl Movement Route
Survey Locations
1

CANA
DA
Lake Ontario
BayfieldBay
ButtonBay
Pyke'sBay
Reed'sBay
8
6
7
93
2
4
5
1
95 HWY
CONC 3 RD
CONC 5 RD
CONC 7 RD
CONC 8 RD
CONC 4 RD
96 HWY
RIDGE RD
OAK POINT RD
S SHORE RD
CONC 9 RDBASELINE RD
FRONT RD
REEDS BAY RD
STEVENSON RDHIGHLAND RD
12TH LINE RD
Reeds
Creek
BENNETT RD
Bueter
s Cree
k
CONC 2 RD
96 HWY
96 HWY
96 HWY
Big SandyBay
Wetland
BayfieldBay
Marsh
ButtonBay
Wetland
Brown'sBay
Wetland
SandBay
Wetland
BarrettBay
Wetland
Wolfe IslandWetlandComplex
McDonellBay
Wetland
ReedsBay
Wetland
Wolfe IslandMarsh
LittleCataraqui Creek
ComplexAbraham's Head
DAYS RD.
Shanty
Creek
13TH LINE RD
KING ST W
Client/Project
Figure No.
TitleComparison ofSpring WaterfowlEvening Movement2007 and 2010
14.0
WOLFE ISLAND ECOPOWER CENTREMONITORING REPORT NO. 3
August, 2010160960494
Notes
Legend
1.2.3.
W:\ac
tive\6
0960
494\g
raphic
s\GIS
\MXD
\Mon
itorin
gRep
ort_3
\6096
0494
_MR-
3_Fig
14-0
_Spri
ngW
aterfo
wlEv
ening
Move
ment_
2010
0831
_CEW
.mxd
- 8/31
/2010
@ 12
:06:33
PM
Lake Ontario
BayfieldBay
ButtonBay
Pyke'sBay
Reed'sBay
2
5
11
8
6
9
7
3
4
10
1
12
95 HWY
CONC 3 RD
CONC 5 RD
CONC 7 RD
CONC 8 RD
CONC 4 RD
96 HWY
RIDGE RD
OAK POINT RD
S SHORE RD
CONC 9 RD
BASELINE RD
FRONT RD
REEDS BAY RD
STEVENSON RDHIGHLAND RD
12TH LINE RD
Reeds
Creek
Bueter
s Cree
k
CONC 2 RD
96 HWY
96 HWY
96 HWY
Big SandyBay
Wetland
BayfieldBay
Marsh
ButtonBay
Wetland
Brown'sBay
Wetland
SandBay
Wetland
BarrettBay
Wetland
Wolfe IslandWetlandComplex
ReedsBay
Wetland
McDonellBay
Wetland
Wolfe IslandMarsh
LittleCataraqui Creek
Complex
987
6
543 2
1
8685
84
8382
8180
79
78
77
7675
74
7372
71 70
6968
6766
65
6463
62 61
6059
5857
5655
5453
5251 50
49
48
4746
45 4443
42
4140
39
3837
36
35
34 33
3231
30
29
2827
2625
2423
222120
191817
16
15
1413
1211
10
Shanty
Creek
DAYS RD.
BENNETT RD
13TH LINE RD
KING ST W
Coordinate System: UTM NAD 83 - Zone 18 (N).Data Sources: Ontario Ministry of Natural Resources © Queens Printer Ontario, 2009.Image Sources: © LIDAR (study area coverage), January 2006; © LANDSAT7(U.S. coverage), 1999; © City of Kingston (city coverage), 2005.Natural environmental features and hydrological data is from the Ministry of Natural ResourcesPeterborough District NRVIS 2006 and the Cataraqui Region Conservation Authority, 2006.
2007 Pre-Construction Results
2010 Post-Construction Results
Study Area
Gardiners Transformer Station
Turbine Layout
230 kV Submarine Cable
230 kV Transmission Line - Underground
Access Roads
34.5 kV Collector Lines230 kV Substation / Operation & Maintenance Building
Temporary Road
Crane Walk Path
Woodlot
WetlandsProvincially Significant Wetland
Non-Provincially Significant Wetland
Unevaluated Wetland
0 21 Kilometers
1:85,000
Survey LocationsSpring Waterfowl Evening Movement% at Blade Height
<10%
10-49%
>50%
Spring Waterfowl Evening Movement% at Blade Height
<10%
10-49%
>50%
Waterfowl Movement RouteSurvey Locations
1
0 - 500 individuals
501 - 1000 individuals> 1000 individuals
0 - 500 individuals
501 - 1000 individuals> 1000 individuals

WOLFE ISLAND WIND PLANT POST-CONSTRUCTION FOLLOW-UP PLAN BIRD AND BAT RESOURCES MONITORING REPORT NO. 3, JANUARY - JUNE 2010
Appendix B
Tables
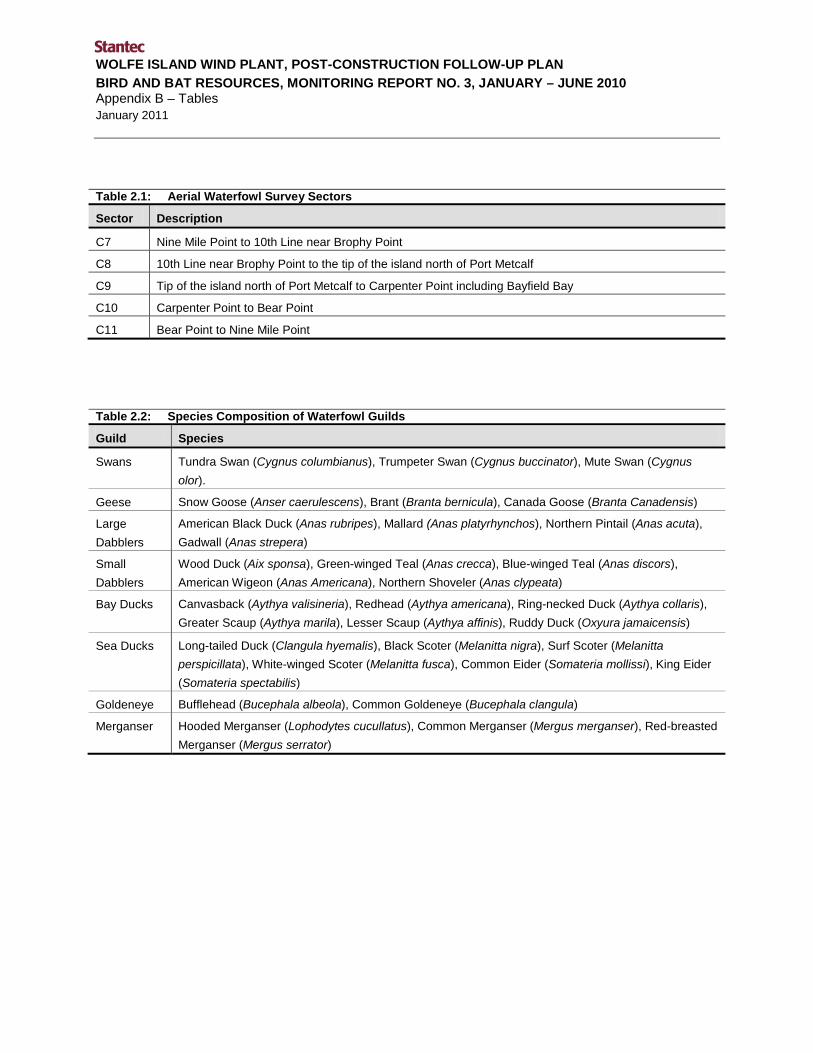
WOLFE ISLAND WIND PLANT, POST-CONSTRUCTION FOLLOW-UP PLAN BIRD AND BAT RESOURCES, MONITORING REPORT NO. 3, JANUARY – JUNE 2010 Appendix B – Tables January 2011
Table 2.1: Aerial Waterfowl Survey Sectors
Sector Description
C7 Nine Mile Point to 10th Line near Brophy Point
C8 10th Line near Brophy Point to the tip of the island north of Port Metcalf
C9 Tip of the island north of Port Metcalf to Carpenter Point including Bayfield Bay
C10 Carpenter Point to Bear Point
C11 Bear Point to Nine Mile Point
Table 2.2: Species Composition of Waterfowl Guilds
Guild Species
Swans Tundra Swan (Cygnus columbianus), Trumpeter Swan (Cygnus buccinator), Mute Swan (Cygnus olor).
Geese Snow Goose (Anser caerulescens), Brant (Branta bernicula), Canada Goose (Branta Canadensis)
Large Dabblers
American Black Duck (Anas rubripes), Mallard (Anas platyrhynchos), Northern Pintail (Anas acuta), Gadwall (Anas strepera)
Small Dabblers
Wood Duck (Aix sponsa), Green-winged Teal (Anas crecca), Blue-winged Teal (Anas discors), American Wigeon (Anas Americana), Northern Shoveler (Anas clypeata)
Bay Ducks
Canvasback (Aythya valisineria), Redhead (Aythya americana), Ring-necked Duck (Aythya collaris), Greater Scaup (Aythya marila), Lesser Scaup (Aythya affinis), Ruddy Duck (Oxyura jamaicensis)
Sea Ducks Long-tailed Duck (Clangula hyemalis), Black Scoter (Melanitta nigra), Surf Scoter (Melanitta perspicillata), White-winged Scoter (Melanitta fusca), Common Eider (Somateria mollissi), King Eider (Somateria spectabilis)
Goldeneye Bufflehead (Bucephala albeola), Common Goldeneye (Bucephala clangula)
Merganser Hooded Merganser (Lophodytes cucullatus), Common Merganser (Mergus merganser), Red-breasted Merganser (Mergus serrator)

WOLFE ISLAND WIND PLANT, POST-CONSTRUCTION FOLLOW-UP PLAN BIRD AND BAT RESOURCES, MONITORING REPORT NO. 3, JANUARY - JUNE 2010 Appendix B - Tables January 2011
Table 3.1 Results of Searcher Efficiency Trials April – July 2010
Surveyor number of carcasses placed
number of carcasses scavenged
number of carcasses found
Individual Se
1 25 5 13 0.650
2 22 4 8 0.444
3 10 0 1 0.100
Table 3.2: Weighted Searcher Efficiency by Month
Surv
eyor
Indi
vidu
al S
e
Janu
ary:
Pro
port
ion
of
Sear
chin
g (W
eigh
ted
Se)
Febr
uary
: Pro
port
ion
of
Sear
chin
g (W
eigh
ted
Se)
Mar
ch: P
ropo
rtio
n of
Se
arch
ing
(Wei
ghte
d Se
)
Apr
il: P
ropo
rtio
n of
Se
arch
ing
(Wei
ghte
d Se
)
May
: Pro
port
ion
of
Sear
chin
g (W
eigh
ted
Se)
June
: Pro
port
ion
of
Sear
chin
g (W
eigh
ted
Se)
1 0.650 23% (0.150) 24% (0.156) 24% (0.153) 23% (0.152) 28% (0.184) 26% (0.172)
2 0.444 38.5% (0.171) 40% (0.178) 45% (0.200) 47% (0.208) 46% (0.203) 45% (0.199)
3 0.100 38.5% (0.038) 36% (0.036) 31% (0.031) 30% (0.030) 26% (0.026) 29% (0.029)
100% (0.359) 100% (0.370) 100% (0.385) 100% (0.390) 100% (0.412) 100% (0.400)

WOLFE ISLAND WIND PLANT, POST-CONSTRUCTION FOLLOW-UP PLAN BIRD AND BAT RESOURCES, MONITORING REPORT NO. 3, JANUARY - JUNE 2010 Appendix B - Tables January 2011
Table 3.3: Results of Scavenger Trials by Month
Number of Test Carcasses Placed
Number Remaining - Visit 1
Number Remaining - Visit 2
Number Remaining - Visit 3
Number Remaining - Visit 4
Sc
January (raptors)
6 6 5 5
- 0.941
January (small birds)
83 80 72 58
- 0.894
May (3.5 Day Search Interval)
38 27 10
4 2
0.544
May (7 Day Search Interval)
34 13 4
- - 0.362
June (3.5 Day Search Interval)
44 33 16
12 2
0.600
June (7 Day Search Interval)
42 13 3
- - 0.291

WOLFE ISLAND WIND PLANT, POST-CONSTRUCTION FOLLOW-UP PLAN BIRD AND BAT RESOURCES, MONITORING REPORT NO. 3, JANUARY - JUNE 2010 Appendix B - Tables January 2011
Table 3.4: Summary of Bird Fatalities, Reporting Period
Species Number of Fatalities Turbine Number
Baltimore Oriole 1 85
Bird Sp. 6 30, 46, 55, 65, 69, 73
Black-and-white Warbler 1 34
Blue Jay 1 29
Bobolink 1 68
Chimney Swift 1 4
Common Grackle 2 9, 18
Double-crested Cormorant 1 2
European Starling 4 1, 41, 61, 72
Horned Lark 3 23, 38, 72
Killdeer 3 20, 30, 43
Magnolia Warbler 1 33
Mallard 3 1, 31, 56
Mourning Dove 2 46, 67
Nashville Warbler 1 71
Northern Harrier 1 46
Osprey 1 43
Philadelphia Vireo 1 25
Red-tailed Hawk 7 27, 29, 64, 75, 78, 81, 81
Red-winged Blackbird 1 64
Ring-billed Gull 7 24, 24, 24, 35, 38, 65, 71
Ring-necked Pheasant 1 56
Savannah Sparrow 1 34
Tree Swallow 3 42, 46, 63
Turkey Vulture 1 83
Upland Sandpiper 2 65, 72
Wilson's Snipe 7 9, 9, 28, 30, 42, 49, 79
Wood Thrush 1 31
Yellow Warbler 1 72

WOLFE ISLAND WIND PLANT, POST-CONSTRUCTION FOLLOW-UP PLAN BIRD AND BAT RESOURCES, MONITORING REPORT NO. 3, JANUARY - JUNE 2010 Appendix B - Tables January 2011
Table 3.5: Calculation of Bird (Raptor) Mortality Rates, January – June 2010
c (raptors) Ps Sc Se C (raptors)
January 0 1.000 0.941 1.000 0.00
February 1 1.000 0.941 1.000 1.06
March 0 1.000 0.941 1.000 0.00
April 4 1.000 0.941 1.000 4.25
May - 2x weekly 2 1.000 0.941 1.000 2.13
May - 1x weekly 1 1.000 0.941 1.000 1.06
June - 2x weekly 0 1.000 0.941 1.000 0.00
June - 1x weekly 2 1.000 0.941 1.000 2.13
total 10 10.63
per turbine 0.12
per MW 0.05
Sc: Scavenger Impact Trial Results
Se: Searcher Efficiency Trial Results
Ps: Percent Area Searched
C: Corrected Number of Fatalities
Per Turbine: C Divided by Total Number of Turbines
Per MW: C Divided by Total Number of MW

WOLFE ISLAND WIND PLANT, POST-CONSTRUCTION FOLLOW-UP PLAN BIRD AND BAT RESOURCES, MONITORING REPORT NO. 3, JANUARY - JUNE 2010 Appendix B - Tables January 2011
Table 3.6: Calculation of Bird Mortality Rates (Excluding Raptors), January – June 2010
c (birds) Ps Sc Se C (birds)
January 0 1.000 0.894 0.359 0.00
February 4 1.000 0.894 0.370 12.09
March 7 0.845 0.894 0.385 24.07
April 18 0.845 0.462 0.390 118.22
May - 2x weekly 14 0.521 0.544 0.412 119.89
May - 1x weekly 3 0.531 0.362 0.412 37.88
June - 2x weekly 8 0.252 0.600 0.400 132.28
June - 1x weekly 3 0.272 0.291 0.400 94.75
total 57 539.19
per turbine 6.27
per MW 2.73
Sc Scavenger Impact Trial Results
Se Searcher Efficiency Trial Results
Ps Percent Area Searched
C Corrected Number of Fatalities
Per Turbine C Divided by Total Number of Turbines
Per MW C Divided by Total Number of MW

WOLFE ISLAND WIND PLANT, POST-CONSTRUCTION FOLLOW-UP PLAN BIRD AND BAT RESOURCES, MONITORING REPORT NO. 3, JANUARY - JUNE 2010 Appendix B - Tables January 2011
Table 3.7: Summary of Bat Fatalities, Reporting Period
Species Number of Fatalities Turbine Number
Big Brown Bat 4 58, 75, 78, 82
Red Bat 2 9, 48
Silver-haired Bat 28
4, 6, 6, 10, 12, 17, 17, 18, 20, 22, 28, 31, 34, 34, 35, 37, 38, 39, 40, 40, 48 51, 58, 58, 71, 76, 79, 86
Table 3.8: Calculation of Bat Mortality Rates, January – June 2010
c (bats) Ps Sc Se C - bats
January 0 1.000 0.894 0.359 0.00
February 0 1.000 0.894 0.370 0.00
March 0 0.845 0.894 0.385 0.00
April 0 0.845 0.462 0.390 0.00
May - 2x weekly 12 0.521 0.544 0.412 102.77
May - 1x weekly 16 0.531 0.362 0.412 202.03
June - 2x weekly 3 0.252 0.600 0.400 49.60
June - 1x weekly 3 0.272 0.291 0.400 94.75
total 34 449.15
per turbine 5.22
per MW 2.27
Sc Scavenger Impact Trial Results Se Searcher Efficiency Trial Results Ps Percent Area Searched C Corrected Number of Fatalities Per Turbine C Divided by Total Number of Turbines Per MW C Divided by Total Number of MW

WOLFE ISLAND WIND PLANT, POST-CONSTRUCTION FOLLOW-UP PLAN BIRD AND BAT RESOURCES, MONITORING REPORT NO. 3, JANUARY - JUNE 2010 Appendix B - Tables January 2011
Table 3.9: Winter Raptor Survey Results, November 2009 to March 2010
Species
Survey Date
Total Nov-11-
2009
Nov-25-
2009
Dec-08-
2009
Dec-23-
2009
6-Jan-
2010
21-Jan-
2010
4-Feb-
2010
16-Feb-
2010
2-Mar-
2010
17-Mar-
2010
Afternoon Survey
Great Horned Owl 1 1
Snowy Owl 5 7 6 5 3 4 3 1 34
Short-eared Owl 11 1 12
Bald Eagle 1 4 3 2 1 11
Northern Harrier 4 3 4 8 19
Cooper's Hawk 1 1
Red-tailed Hawk 1 5 4 9 5 6 13 11 6 60
Rough-legged Hawk 1 2 2 1 1 5 1 13
American Kestrel 3 4 3 3 2 4 2 4 5 30
Merlin 1 2 1 4
Unidentified 2 2
Total 10 9 19 25 33 17 14 20 25 15 187
Total Kilometers 75 70 65.8 70.6 71.5 74.2 76 81.1 75.5 74.5 734.2
Density / kilometer
0.1 0.1 0.3 0.4 0.5 0.2 0.2 0.2 0.3 0.2 0.3

WOLFE ISLAND WIND PLANT, POST-CONSTRUCTION FOLLOW-UP PLAN BIRD AND BAT RESOURCES, MONITORING REPORT NO. 3, JANUARY - JUNE 2010 Appendix B - Tables January 2011
Table 3.9: Winter Raptor Survey Results, November 2009 to March 2010
Species
Survey Date
Total Nov-11-
2009
Nov-25-
2009
Dec-08-
2009
Dec-23-
2009
6-Jan-
2010
21-Jan-
2010
4-Feb-
2010
16-Feb-
2010
2-Mar-
2010
17-Mar-
2010
Evening Survey
Short-eared Owl 7 0 4 15 8 6 0 4 8 0 52
Total Kilometers 36.2 53.9 47.4 50.7 65.3 74 72 66 71 66.5 603
Density / kilometer 0.2 0.0 0.1 0.3 0.1 0.1 0.0 0.1 0.1 0.0 0.1

WOLFE ISLAND WIND PLANT, POST-CONSTRUCTION FOLLOW-UP PLAN BIRD AND BAT RESOURCES, MONITORING REPORT NO. 3, JANUARY – JUNE 2010 Appendix B - Tables
Table 3.10: Comparison of total winter raptor observations, November to March 2006/2007 and 2009/2010.
Total Observations November - March
2006/2007 2009/2010
Afternoon Survey
Great Horned Owl 0 1
Snowy Owl 14 34
Short-eared Owl 39 12
Bald Eagle 6 11
Northern Harrier 159 19
Sharp-shinned Hawk 1 0
Cooper's Hawk 0 1
Red-tailed Hawk 85 60
Rough-legged Hawk 119 13
American Kestrel 30 30
Merlin 2 4
Unidentified 0 2
Total 455 187
Total Kilometers 634 734
Density / kilometer 0.72 0.25
Evening Survey
Short-eared Owl 83 52
Total Kilometers 519 603
Density / kilometer 0.16 0.09

WOLFE ISLAND WIND PLANT, POST-CONSTRUCTION FOLLOW-UP PLAN BIRD AND BAT RESOURCES, MONITORING REPORT NO. 3, JANUARY - JUNE 2010 Appendix B - Tables January 2011
Table 3.11: Summary of Kingston Area Christmas Bird Count results from 2000-2009
Number of Raptors per Party Hour
Species 2000 2001 2002 2003 2004 2005 2006 2007 2008 2009
Great Horned Owl 0.04 0.14 0.09 0.06 0.14 0.06 0.08 N/A 0.04 0.06
Snowy Owl 0.09 0.07 0.06 0.01 0.03 0.03 0.06 N/A 0.09 0.07
Short-eared Owl 0.03 0.00 0.03 0.03 0.03 0.00 0.04 N/A 0.01 0.00
Bald Eagle 0.20 0.10 0.04 0.08 0.08 0.13 0.02 N/A 0.29 0.70
Northern Harrier 0.01 0.13 0.04 0.29 0.18 0.02 0.60 N/A 0.18 0.18
Sharp-shinned Hawk 0.03 0.03 0.03 0.01 0.03 0.05 0.04 N/A 0.03 0.05
Cooper's Hawk 0.05 0.04 0.03 0.02 0.01 0.06 0.02 N/A 0.03 0.02
Red-tailed Hawk 0.40 0.40 0.42 0.27 0.27 0.23 0.51 N/A 0.49 0.22
Rough-legged Hawk 0.11 0.14 0.02 0.43 0.08 0.06 0.18 N/A 0.18 0.08
American Kestrel 0.15 0.16 0.11 0.01 0.03 0.08 0.10 N/A 0.13 0.05
Merlin 0.04 0.02 0.01 0.00 0.01 0.03 0.02 N/A 0.02 0.02
N/A – data not available.
Bolded numbers highlight 2006, year of pre-construction monitoring and 2009, year of post-construction monitoring.
Table 3.12: Comparison of Species Composition of Field Foraging Waterfowl: March-May 2007 and March-May 2010
2007 2010
Canada Goose 10052 8903
Mallard 203 92
American Black Duck 4
Gadwall 6
Northern Shoveler 7
Northern Pintail 5
Green-winged Teal 3 21
Teal sp. 30
Total 10295 9031

WOLFE ISLAND WIND PLANT, POST-CONSTRUCTION FOLLOW-UP PLAN BIRD AND BAT RESOURCES, MONITORING REPORT NO. 3, JANUARY - JUNE 2010 Appendix B - Tables January 2011
Table 3.13: Comparison of Foraging Field Selection by Waterfowl: March-May 2007 and March-May 2010
2007 2010
Corn 3% 1%
Fallow Field 5% 1%
Golf Course <1%
Hayfield 73% 31%
Pasture 15% 43%
Plowed Field 1% 2%
Soy 2% 9%
Wheat 6%
Creek/Flooded 1% 5%
Unknown 2%

WOLFE ISLAND WIND PLANT, POST-CONSTRUCTION FOLLOW-UP PLAN BIRD AND BAT RESOURCES, MONITORING REPORT NO. 3, JANUARY - JUNE 2010 Appendix B - Tables January 2011
Table 3.14: Spring 2010 Waterfowl Morning Movement
Date
Route*
1 2 3 4 5 6 7 8 9 10 11 12 13 14** Other*** Grand Total
24-Mar-10 40 148 68 33 18 60 78 67 512
31-Mar-10 94 189 18 20 13 465 20 20 20 70 150 1079
9-Apr-10 13 4 228 65 105 15 430
14-Apr-10 513 277 6 99 550 155 38 5 120 28 1791
22-Apr-10 254 15 35 135 460 185 20 390 175 6 1675
30-Apr-10 20 470 2 155 13 48 233 60 318 6 1325
5-May-10 343 4 17 15 50 15 138 60 2 644
14-May-10 5 5
Grand Total
667 1699 35 262 211 144 1801 588 78 493 198 85 926 150 124 7461
% at Blade Height
85% 64% 34% 27% 69% 10% 97% 80% 59% 95% 69% 100%
64% 0% 79% 74%
Notes: Cells represent number of individuals.
*Routes depicted on Figure 13.0
**All individuals on this route are diving ducks not moving over land.
***Represents the sum of smaller flocks not following a major flight route

WOLFE ISLAND WIND PLANT, POST-CONSTRUCTION FOLLOW-UP PLAN BIRD AND BAT RESOURCES, MONITORING REPORT NO. 3, JANUARY - JUNE 2010 Appendix B - Tables January 2011
Table 3.15: Spring 2010 Waterfowl Evening Movement
Date
Route*
1 2 3 4 5 6 7 8 9 10 11 12 Other** Grand Total
23-Mar-10 14 110 12 53 8 197
30-Mar-10 280 175 50 20 30 41 596
8-Apr-10 250 140 3 52 250 230 3 6 15 290 1239
13-Apr-10 1791 550 298 380 2 98 12 3131
21-Apr-10 72 400 175 140 40 253 1080
29-Apr-10 37 383 90 8 565 312 3 1398
4-May-10 2 188 129 108 230 4 661
13-May-10 6 22 28
Grand Total 2432 1836 611 116 250 740 233 52 46 1114 602 230 68 8330
% at Blade Height 99% 94% 62% 98% 100% 97% 100% 100% 22% 65% 73% 100% 54% 88%
Notes: Cells represent number of individuals.
*Routes depicted on Figure 14.0
**Represents the sum of smaller flocks not following a major flight route

WOLFE ISLAND WIND PLANT, POST-CONSTRUCTION FOLLOW-UP PLAN BIRD AND BAT RESOURCES, MONITORING REPORT NO. 3, JANUARY - JUNE 2010 Appendix B - Tables January 2011
Table 3.16: Comparison of Waterfowl Use by Sector
1999 2008 2009 2010
C7 36,316 33,363 35,696 47,060
C8 121,622 33,846 31,110 39,092
C9 266,231 148,667 212,323 145,796
C10 23,054 54,425 46,492 101,349
C11 26,857 69,806 45,658 35,422
Total 474,079 340,105 371,278 368,718
Notes: Cells represent waterfowl days.
Table 3.17: Comparison of Waterfowl Use by Staging Area
2008 2009 2010
Bayfield 62,794 158,209 52,939
Button 18,242 11,529 67,126
Pyke's 13,183 5,359 6,143
Reed's 19,905 8,593 6,705
Total 114,124 183,689 132,913
Notes: Cells represent waterfowl days.
Table 3.18: Comparison of Waterfowl Use by Guild
1999 2008 2009 2010
Swans 218 35 214 582
Geese 17,867 7,251 23,779 26,152
Large dabblers 23,360 1,214 8,321 16,282
Small dabblers 663 62 78 1,185
Bay ducks 381,605 186,325 179,704 205,895
Sea ducks 89 108 4,118 1,050
Goldeneye 30,628 125,058 54,093 83,109
Mergansers 19,651 17,247 55,737 29,777
Unknown 2,809 45,236 4,688
Total 474,079 340,105 371,278 368,718
Notes: Cells represent waterfowl days.

WOLFE ISLAND WIND PLANT, POST-CONSTRUCTION FOLLOW-UP PLAN BIRD AND BAT RESOURCES, MONITORING REPORT NO. 3, JANUARY - JUNE 2010 Appendix B - Tables January 2011
Table 3.19: Number of waterfowl breeding pairs observed in each wetland in May 2010
Number of breeding pairs
Bayfield Bay Marsh
Button Bay Wetland
Big Sandy Bay Wetland
Reed's Bay Wetland
Sandy Bay Wetland
Canada Goose 1 0 2 3 3
Wood Duck 4 2 2 1
Gadwall 1 1
American Wigeon 0
Mallard 8 4 3 4
Blue-winged Teal 0
Green-winged Teal 2 1
Bufflehead 0
Common Merganser 1 1
Red-breasted Merganser 1
Pied-billed Grebe 0
Total 14 5 9 6 11
0 - indicates species was observed but not expected to be breeding based on Calculation of Indicated Pairs

WOLFE ISLAND WIND PLANT, POST-CONSTRUCTION FOLLOW-UP PLAN BIRD AND BAT RESOURCES, MONITORING REPORT NO. 3, JANUARY - JUNE 2010 Appendix B - Tables January 2011
Table 3.20: Comparison of Breeding Densities (pairs/10ha), as measured by point count, in grassland
habitat between 2006 and 2007 pre-construction and 2010 post-construction surveys
Pre-construction Post-construction
Common name 2006 2007 2010
Bobolink 14.86 15.92 14.90
Red-winged Blackbird 16.50 15.26 10.82
Savannah Sparrow 11.43 12.63 10.22
European Starling 14.37 4.06 3.36
American Robin 4.25 3.95 2.52
Yellow Warbler 3.92 3.51 2.28
Eastern Meadowlark 6.04 5.71 3.12
Mourning Dove 3.43 2.75 1.08
Common Grackle 2.94 2.31 0.72
American Goldfinch 2.94 1.76 0.96
Barn Swallow 3.92 1.10 0.12
Song Sparrow 1.80 3.07 2.40
Brown-headed Cowbird 3.92 1.10 0.84
Horned Lark 1.63 1.43 0.48
Upland Sandpiper 3.10 1.43 0.36
Killdeer 2.29 1.21 0.72
Eastern Kingbird 2.29 1.76 1.92
Tree Swallow 0.82 0.77 0.12
Common Yellowthroat 0.49 0.88 0.96
Gray Catbird 0.16 0.11 0.12

WOLFE ISLAND WIND PLANT, POST-CONSTRUCTION FOLLOW-UP PLAN BIRD AND BAT RESOURCES, MONITORING REPORT NO. 3, JANUARY - JUNE 2010 Appendix B - Tables January 2011
Table 3.21: Comparison of breeding bird densities (pairs/10ha) at three distance regimes from WTG bases, as measured by grassland paired point counts.
Species Distance from Turbine Base
0-100 100-200 200-300
Bobolink 14.97 16.56 16.56
Savannah Sparrow 11.46 11.78 10.83
Red-winged Blackbird 5.41 5.41 7.32
European Starling 7.96 0.32 7.01
Song Sparrow 4.46 2.55 3.82
Yellow Warbler 2.55 1.27 3.50
Grasshopper Sparrow 2.23 1.91 3.18
Eastern Meadowlark 1.59 0.64 3.50
Brown-headed Cowbird 1.27 1.59 2.87
Eastern Kingbird 2.55 0.96 1.59
American Robin 2.23 0.96 1.91
Willow Flycatcher 1.59 0.64 0.96
Mourning Dove 0.64 0.64 1.59
Common Yellowthroat 0.64 0.96 1.27
American Goldfinch 0.64 0.32 0.64
Chipping Sparrow 0.64 0.96 0.00
Mallard 0.00 0.64 0.64
Northern Harrier 0.32 0.00 0.96
Spotted Sandpiper 0.32 0.00 0.64
Warbling Vireo 0.32 0.32 0.32
Baltimore Oriole 0.64 0.00 0.32
Upland Sandpiper 0.32 0.00 0.32
Ring-billed Gull 0.64 0.00 0.00
Horned Lark 0.32 0.00 0.32
House Wren 0.32 0.00 0.32
Gray Catbird 0.32 0.00 0.32
Brown Thrasher 0.32 0.00 0.32
Field Sparrow 0.32 0.00 0.32
Swamp Sparrow 0.00 0.00 0.64
Ring-necked Pheasant 0.00 0.32 0.00
Killdeer 0.00 0.00 0.32
Cedar Waxwing 0.32 0.00 0.00
Vesper Sparrow 0.00 0.32 0.00
Common Grackle 0.00 0.00 0.32

WOLFE ISLAND WIND PLANT, POST-CONSTRUCTION FOLLOW-UP PLAN BIRD AND BAT RESOURCES, MONITORING REPORT NO. 3, JANUARY - JUNE 2010 Appendix B - Tables January 2011
Table 3.22: Comparison of Breeding Bird density (pairs/10ha) between pre-construction (2007) and post-
construction (2010) grassland area searches across all sectors
Southeast Area Search Northwest Area Search
2007 Pre-con 2010 Post-con 2007 Pre-con 2010 Post-con
Northern Harrier 0.1 0.1 0.1 0.1
Killdeer 0.4 0.3 0.1 0.3
Upland Sandpiper 0.2 0.1 0.4 0.5
Wilson's Snipe 0.1 0.0 0.1 0.0
Eastern Kingbird 0.6 0.3 0.3 0.5
Horned Lark 0.8 0.2 0.0 0.3
Field Sparrow 0.0 0.0 0.0 0.0
Vesper Sparrow 0.1 0.0 0.0 0.0
Savannah Sparrow 9.3 9.7 17.5 15.1
Grasshopper Sparrow 0.3 0.2 0.7 0.1
Bobolink 4.3 9.4 22.0 16.6
Eastern Meadowlark 0.4 1.2 0.5 0.2
Table 3.23: Comparison of Breeding Bird density (pairs/10ha) between pre-construction (2007) and post-construction (2010) grassland area searches in only sectors with grassland habitat (i.e. hay or pasture).
Southeast Area Search Northwest Area Search
2007 Pre-con 2010 Post-con 2007 Pre-con 2010 Post-con
Northern Harrier 0.1 0.1 0.1 0.1
Killdeer 0.1 0.2 0.1 0.1
Upland Sandpiper 0.1 0.1 0.4 0.3
Wilson's Snipe 0.1 0.0 0.1 0.0
Eastern Kingbird 0.8 0.4 0.3 0.6
Horned Lark 0.1 0.0 0.0 0.0
Field Sparrow 0.0 0.0 0.0 0.0
Vesper Sparrow 0.1 0.0 0.0 0.0
Savannah Sparrow 11.6 11.6 17.5 18.4
Grasshopper Sparrow 0.4 0.2 0.7 0.1
Bobolink 5.7 11.1 22.0 22.6
Eastern Meadowlark 0.5 1.5 0.5 0.3

WOLFE ISLAND WIND PLANT, POST-CONSTRUCTION FOLLOW-UP PLAN BIRD AND BAT RESOURCES, MONITORING REPORT NO. 3, JANUARY - JUNE 2010 Appendix B - Tables January 2011
Table 3.24: Comparison of Breeding Species Densities (pairs/10ha), as measured by point count, in wetland habitat between 2006/2007 pre-construction and 2010 post-construction surveys
Species Pre-construction Results (2006/2007)
Post-construction Results (2010)
Red-winged Blackbird 26.48 12.28
Swamp Sparrow 6.37 8.19
Marsh Wren 5.70 8.19
Yellow Warbler 5.03 5.46
Common Yellowthroat 3.64 9.55
Mallard 3.35 0.45
American Robin 3.02 2.73
Song Sparrow 2.35 4.09
American Goldfinch 2.01 0.91
Common Grackle 2.01 0.91
Great Blue Heron 2.01 0.91
Tree Swallow 2.01 0.45
European Starling 1.68 0.00
Wood Duck 1.01 2.27
Mourning Dove 1.01 0.91
Brown-headed Cowbird 1.01 0.45
Canada Goose 0.67 2.73
Wilson's Snipe 0.67 1.36
Virginia Rail 0.67 0.45
Gray Catbird 0.34 1.36
Willow Flycatcher 0.00 2.73
Least Bittern 0.00 0.45

WOLFE ISLAND WIND PLANT, POST-CONSTRUCTION FOLLOW-UP PLAN BIRD AND BAT RESOURCES, MONITORING REPORT NO. 3, JANUARY - JUNE 2010 Appendix B - Tables January 2011
Table 3.25: Comparison of Wetland Area Search Results between 2007 pre-construction and 2010 post-construction surveys. Results are expressed as number of pairs observed along each route.
Bayfield Bay Button Bay Big Sandy Bay Reed's Bay Sandy Bay Total
2007 2010 2007 2010 2007 2010 2007 2010 2007 2010 2007 2010
Wood Duck 5 10 0 2 2 0 0 2 1 1 8 15
Gadwall 0 0 0 0 0 0 0 0 0 1 0 1
American Black Duck 0 0 0 0 0 0 1 0 0 0 1 0
Mallard 10 2 1 2 1 0 3 2 2 1 17 7
Blue-winged Teal 0 0 0 0 1 0 0 0 0 0 1 0
Redhead 0 0 0 0 0 0 1 0 0 0 1 0
Hooded Merganser 0 0 1 0 0 0 0 0 0 0 1 0
Common Loon 1 0 0 0 0 1 1 0 0 0 2 1
Pied-Billed Grebe 0 0 0 1 0 0 0 0 0 0 0 1
American Bittern 0 3 0 0 0 0 0 0 0 1 0 4
Least Bittern 0 0 0 0 0 1 0 0 0 0 0 1
Great Blue Heron 7 8 3 2 2 2 2 5 1 2 15 19
Green Heron 0 0 0 0 2 0 0 0 0 0 2 0
Osprey 0 1 0 0 0 0 0 0 1 0 1 1
Bald Eagle 0 1 0 0 0 0 0 0 0 0 0 1
Northern Harrier 1 2 0 0 0 0 0 0 1 0 2 2
Virginia Rail 0 0 0 0 4 1 0 0 0 0 4 1
Spotted Sandpiper 1 0 1 0 0 2 2 1 3 1 7 4
Least Sandpiper 0 0 0 0 0 0 0 0 0 2 0 2
Wilson's Snipe 0 0 0 0 2 4 1 2 1 0 4 6

WOLFE ISLAND WIND PLANT, POST-CONSTRUCTION FOLLOW-UP PLAN BIRD AND BAT RESOURCES, MONITORING REPORT NO. 3, JANUARY - JUNE 2010 Appendix B - Tables January 2011
Table 3.25: Comparison of Wetland Area Search Results between 2007 pre-construction and 2010 post-construction surveys. Results are expressed as number of pairs observed along each route.
Bayfield Bay Button Bay Big Sandy Bay Reed's Bay Sandy Bay Total
2007 2010 2007 2010 2007 2010 2007 2010 2007 2010 2007 2010
Alder Flycatcher 0 0 0 0 0 1 0 0 0 0 0 1
Willow Flycatcher 1 3 2 2 2 5 0 1 1 2 6 13
Marsh Wren 19 40 5 9 3 0 15 14 15 14 57 77
Yellow Warbler 8 16 2 7 8 10 2 2 4 4 24 39
Common Yellowthroat 12 37 3 16 2 14 1 11 3 16 21 94
Swamp Sparrow 26 24 4 6 6 15 7 6 5 6 48 57
Red-winged Blackbird 25 24 26 33 12 24 27 24 24 23 114 128

WOLFE ISLAND WIND PLANT, POST-CONSTRUCTION FOLLOW-UP PLAN BIRD AND BAT RESOURCES, MONITORING REPORT NO. 3, JANUARY - JUNE 2010 Appendix B - Tables January 2011
Table 3.26: Comparison of Forest Breeding Species Densities (pairs/10ha) in Woodland Habitat between 2008 pre-construction and 2010 post-construction surveys
Species Pre-construction Results (2008)
Post-construction Results (2010)
Yellow Warbler 6.37 4.55
House Wren 4.55 1.82
Mourning Dove 3.64 0.91
American Robin 2.73 5.91
Song Sparrow 2.73 3.18
Swamp Sparrow 2.73 4.09
Wood Thrush 2.73 0.45
American Goldfinch 1.82 1.82
Common Grackle 1.82 0.45
Common Yellowthroat 1.36 4.55
Eastern Wood-Pewee 1.36 2.27
Gray Catbird 1.36 1.82
Great Crested Flycatcher 1.36 1.36
Red-eyed Vireo 1.36 2.27
Rose-breasted Grosbeak 1.36 1.36
Black-capped Chickadee 0.91 1.36
Downy Woodpecker 0.91 1.36
Least Flycatcher 0.91 0.00
Northern Flicker 0.91 0.00
American Crow 0.45 0.45
Baltimore Oriole 0.45 1.36
Black-billed Cuckoo 0.45 0.00
Brown-headed Cowbird 0.45 0.45
Cedar Waxwing 0.45 3.64
Chestnut-sided Warbler 0.45 0.00
European Starling 0.45 0.00
Northern Cardinal 0.45 1.36
Tree Swallow 0.45 0.00
Veery 0.45 1.36
Warbling Vireo 0.00 1.82
Willow Flycatcher 0.00 1.36

WOLFE ISLAND WIND PLANT, POST-CONSTRUCTION FOLLOW-UP PLAN BIRD AND BAT RESOURCES, MONITORING REPORT NO. 3, JANUARY - JUNE 2010 Appendix B - Tables January 2011
Table 3.26: Comparison of Forest Breeding Species Densities (pairs/10ha) in Woodland Habitat between 2008 pre-construction and 2010 post-construction surveys
Species Pre-construction Results (2008)
Post-construction Results (2010)
Ovenbird 0.00 0.91
American Redstart 0.00 0.45
Blue Jay 0.00 0.45
Brown Thrasher 0.00 0.45
Indigo Bunting 0.00 0.45
Mourning Warbler 0.00 0.45
Northern Waterthrush 0.00 0.45
Ruby-throated Hummingbird 0.00 0.45
Yellow-billed Cuckoo 0.00 0.45
Table 3.27: Summary of Notifications - Reporting Period
Notification No. Date Period Notification Status
1 April 15 April 9 – April 15 High Annual Mortality - Raptors (3)
2 May 6 April 16 – May 3 High Annual Mortality - Raptors (2)
3 May 13 May 11 Mortality of Species at Risk (Chimney Swift)
4 May 13 March 24 – May 5 Disturbance to Staging Waterfowl
5 May 18 May 13 - 17 High Annual Mortality - Raptors (2)
6 May 26 May 3 – May 21 High Annual Mortality – Bats (25)
7 June 11 June 1 – June 10 High Annual Mortality - Raptors (2)

WOLFE ISLAND WIND PLANT, POST-CONSTRUCTION FOLLOW-UP PLAN BIRD AND BAT RESOURCES MONITORING REPORT NO. 3, JANUARY - JUNE 2010
Appendix C
Mortality Monitoring Schedule

WEEK SUBSET Monday Tuesday Wednesday Thursday Friday
Week 1
Subset A 4, (6, 7, 8, 9, 10,
11), 12, 66
(3, 5), (13, 14),
21, 22, 26, (29,
30, 31, 32), (40,
41), 47, 48, 52,
56, 58, (59, 60,
63), 72, (79, 80,
81), 83, MET 1
(53, 54, 55), (73,
74, 75, 76, 77)
Subset B
(1, 2), 23, 24,
27, 28, (33, 34,
35), 36, 37,
(38, 39), 42,
(43, 44, 45,
46), 50, 64, 65,
78, 82, (84, 85,
86), MET 2
(15, 16, 17, 18,
19, 20), 25, 49,
51, 57, (61, 62),
(67, 68, 69), (70,
71)
(1, 2), 23, 24, 27,
28, (33, 34, 35),
36, 37, (43, 44,
45, 46), (84, 85,
86)
(15, 16, 17, 18,
19, 20), 25, (38,
39), 42, 49, 50,
51, 57, (61, 62),
64, 65, (67, 68,
69), (70, 71), 78,
82, MET 2

WOLFE ISLAND WIND PLANT, POST-CONSTRUCTION FOLLOW-UP PLAN BIRD AND BAT RESOURCES MONITORING REPORT NO. 3, JANUARY - JUNE 2010
Appendix D
Survey Conditions

Distrubance Monitoring
Survey Date Survey Type Weather Start Time End Time
6-Jan-10 Short-eared Owl SurveyTemp: -8 C Wind: 2-3 Cloud: 100% PPT: none Overnight ppt or fog: snow 4:10pm 5:20pm
6-Jan-10 Winter Raptor SurveyTemp: -6 - -8 C Wind: 3 Cloud: 50-80% PPT: none Overnight ppt or fog: snow 1:40pm 3:40pm
21-Jan-10 Short-eared Owl SurveyTemp: -6 - -2 C Wind: 1 Cloud: 0-20% PPT: none Overnight ppt or fog: none 4:00pm 6:00pm
21-Jan-10 Winter Raptor SurveyTemp: -2 C Wind: 1-2 Cloud: 70-10% PPT: none Overnight ppt or fog: none 1:00pm 2:40pm
4-Feb-10 Short-eared Owl SurveyTemp: -6 C Wind: 2-5 W Cloud: 25-50% PPT: none Overnight ppt or fog: none 5:00pm 6:15pm
4-Feb-10 Winter Raptor SurveyTemp: -4 - -6 C Wind: 2-5 W Cloud: 15-50% PPT: none Overnight ppt or fog: none 2:30pm 5:00pm
16-Feb-10 Short-eared Owl SurveyTemp: -3 - -4 C Wind: 1-2 Cloud: 100% PPT: none Overnight ppt or fog: none 4:55pm 6:15pm
16-Feb-10 Winter Raptor SurveyTemp: -3 C Wind: 1-2 Cloud: 95-100% PPT: none Overnight ppt or fog: none 2:30pm 4:45pm
2-Mar-10 Short-eared Owl SurveyTemp: 0-1 C Wind: 0 Cloud: 40-70% PPT: none Overnight ppt or fog: none 5:00pm 6:20pm
2-Mar-10 Winter Raptor SurveyTemp: 1-3 C Wind: 1 Cloud: 50-70% PPT: none Overnight ppt or fog: none 2:30pm 5:00pm
17-Mar-10 Short-eared Owl SurveyTemp: 10 C Wind: 3 Cloud: 0-5% PPT: none Overnight ppt or fog: none 6:00pm 7:25pm
17-Mar-10 Winter Raptor SurveyTemp: 15 C Wind: 3 Cloud: 0% PPT: none Overnight ppt or fog: none 4:00pm 6:15pm
23-Mar-10Spring Waterfowl - Dusk Movement
Temp: 0-1 C Wind: 3-4 Cloud: 100% PPT: drizzle Overnight ppt or fog: rain 7:35pm 8:00pm
24-Mar-10Spring Waterfowl - field foraging Temp: 3 C Wind: 3 Cloud: 50% PPT: Overnight ppt or fog: rain 9:00am 12:00pm
24-Mar-10Spring Waterfowl - morning movement
Temp: -1 - 0 C Wind: 3 Cloud: 0-5% PPT: none Overnight ppt or fog: rain 7:15am 8:15am
24-Mar-10 Spring Aerial WaterfowlTemp: 5-12 C Wind: 2 Cloud: 0-5% PPT: none Overnight ppt or fog: none 2:10pm 3:15pm
30-Mar-10Spring Waterfowl - Dusk Movement
Temp: 5-10 C Wind: 3-4 Cloud: 80-95% PPT: none Overnight ppt or fog: none 7:25pm 8:15pm
31-Mar-10Spring Waterfowl - field foraging
Temp: 12 C Wind: 2-1 Cloud: 95% PPT: none Overnight ppt or fog: none 9:45am 11:30am
31-Mar-10Spring Waterfowl - morning movement
Temp: 3-8 C Wind: 4 S Cloud: 95-100% PPT: none Overnight ppt or fog: none 7:00am 8:15am
2-Apr-10Spring Waterfowl - field foraging
Temp: 15-13 C Wind: 2-3 W Cloud: 0-5% PPT: none Overnight ppt or fog: none 5:00pm 7:30pm
8-Apr-10Spring Waterfowl - Dusk Movement Temp: 9-12 C Wind: 1 Cloud: 100% PPT: showers Overnight pp7:40pm 8:40pm
8-Apr-10 Spring Aerial WaterfowlTemp: 13 C Wind: 3 Cloud: 95-100% PPT: none Overnight ppt or fog: rain 2:00pm 3:15pm
9-Apr-10Spring Waterfowl - field foraging
Temp: 5 C Wind: 3-4 Cloud: 90% PPT: none Overnight ppt or fog: showers 9:00am 11:00am
9-Apr-10Spring Waterfowl - morning movement
Temp: 4-5 C Wind: 3-4 Cloud: 95-100% PPT: none Overnight ppt or fog: rain 6:45am 7:50am
13-Apr-10Spring Waterfowl - Dusk Movement
Temp: 7-10 C Wind: 1-2 Cloud: 0-5% PPT: none Overnight ppt or fog: none 7:30pm 8:40pm
14-Apr-10Spring Waterfowl - field foraging
Temp: 8 C Wind: 1 Cloud: 0% PPT: none Overnight ppt or fog: none 8:45am 11:00am
14-Apr-10Spring Waterfowl - morning movement
Temp: 3-4 C Wind: 1 Cloud: 0% PPT: none Overnight ppt or fog: none 6:25am 7:50am
21-Apr-10Spring Waterfowl - Dusk Movement
Temp: 8-9 C Wind: 1-2 Cloud: 15-50% PPT: none Overnight ppt or fog: none 7:45pm 8:45pm
21-Apr-10 Spring Aerial WaterfowlTemp: 14-18 C Wind: 2 Cloud: 5-15% PPT: none Overnight ppt or fog: none 1:00pm 2:10pm
22-Apr-10Spring Waterfowl - field foraging
Temp: 7 C Wind: 2 Cloud: 90% PPT: none Overnight ppt or fog: showers 9:00am 11:00am
22-Apr-10Spring Waterfowl - morning movement
Temp: 3-4 C Wind: 1-3 Cloud: 95-100% PPT: none Overnight ppt or fog: rain 6:15am 8:00am
W:\active\60960494\reports\Monitoring Report #3 (2010 Jan-June)\Appendices\Appendix D_Survey Conditions_Both Tabs.xlsx 1 of 10

Distrubance Monitoring
Survey Date Survey Type Weather Start Time End Time
29-Apr-10Spring Waterfowl - Dusk Movement
Temp: 11C Wind: 3-4 WNW Cloud: 5-10% PPT: none Overnight ppt or fog: none 7:40pm 8:45pm
30-Apr-10Spring Waterfowl - morning movement
Temp: 8-10 C Wind: 0-2 Cloud: 90% PPT: none Overnight ppt or fog: none 6:15am 8:30am
4-May-10Spring Waterfowl - field foraging
Temp: 17 C Wind: 3-4 Cloud: 90-20% PPT: none Overnight ppt or fog: rain 10:30am 7:00pm
4-May-10Spring Waterfowl - Dusk Movement
Temp: 16-8 C Wind: 3-4 S Cloud: 30% PPT: none Overnight ppt or fog: light rain 7:55pm 9:00pm
4-May-10Spring Waterfowl - Breeding Pairs
Temp: 16-17 C Wind: 3-4 Cloud: 20-50% PPT: none Overnight ppt or fog: light rain 12:30pm 4:30pm
5-May-10Spring Waterfowl - morning movement
Temp: 7-10 C Wind: 2 Cloud: 80-100% PPT: none Overnight ppt or fog: none 6:55am 8:15am
5-May-10 Spring Aerial WaterfowlTemp: 17 C Wind: 2 Cloud: 40-50% PPT: none Overnight ppt or fog: none 11:20am 12:30pm
13-May-10Spring Waterfowl - field foraging
Temp: 17 C Wind: 2-3 SW Cloud: 100% PPT: none Overnight ppt or fog: rain 3:00pm 4:00pm
13-May-10Spring Waterfowl - Dusk Movement
Temp: 10 C Wind: 2-3 E Cloud: 100% PPT: rain Overnight ppt or fog: rain 8:05pm 9:10pm
13-May-10Spring Waterfowl - Breeding Pairs
Temp: 17 C Wind: 2-3 SW Cloud: 40-100% PPT: none Overnight ppt or fog: rain 11:00am 4:45pm
14-May-10Spring Waterfowl - morning movement
Temp: 8-9 C Wind: 0-3 SE Cloud: 100% PPT: fog early Overnight ppt or fog: rain 5:55am 7:30am
31-May-10Breeding Bird - Grassland Point Counts
Temp: 14-19 C Wind: 3-2 Cloud: 10% PPT: none Overnight ppt or fog: none 6:30am 6:45am
1-Jun-10
Breeding Bird - Grassland Point Counts and Area Searches
Temp: 17 C Wind: 1-2 Cloud: overcast PPT: light steady rain Overnight ppt or fog: rain overnight 5:45am 9:15am
1-Jun-10Breeding Bird - Grassland Point Counts
Temp: 18-19 C Wind: 2-3 WNW Cloud: 100% PPT: rain Overnight ppt or fog: rain 6:15am 9:30am
2-Jun-10
Breeding Bird - Marsh Point Counts and Area Search
Temp: 17 C Wind: 1-3 SW Cloud: 0-5% PPT: none Overnight ppt or fog: rain 5:30am 9:00am
3-Jun-10
Breeding Bird - Grassland Point Counts and Area Searches
Temp: 20 C Wind: 2 Cloud: 90% PPT: none Overnight ppt or fog: rain 5:30am 10:30am
3-Jun-10
Breeding Bird - Marsh Point Counts and Area Search
Temp: 17-18 C Wind: 3-4 NNE Cloud: 100% PPT: rain until 0530 Overnight ppt or fog: rain 5:15am 8:00am
4-Jun-10Breeding Bird - Grassland Point Counts
Temp: 16-18 C Wind: 1-2 Cloud: fog PPT: none Overnight ppt or fog: rain 5:15am 7:30am
5-Jun-10Breeding Bird - Grassland Point Counts
Temp: 17-19 C Wind: 3-SW Cloud: 100% PPT: early light drizzle Overnight ppt or fog: rain 5:30am 8:45am
8-Jun-10Breeding Bird - Paired Grassland
Temp: 14 C Wind: 2-3 S Cloud: 70-90% PPT: none Overnight ppt or fog: rain 5:15am 9:00am
9-Jun-10Breeding Bird - Paired Grassland
Temp: 12-14 C Wind: 2-3 Cloud: 100% PPT: none Overnight ppt or fog: rain yesterday 5:15am 9:30am
10-Jun-10Breeding Bird - Paired Grassland
Temp: 11-13 C Wind: 2-3 Cloud: 100% PPT: none Overnight ppt or fog: rain 5:15am 9:45am
11-Jun-10
Breeding Bird - Woodland PCs and Area Search
Temp: 9-10 C Wind: 0-1 SW Cloud: Fog + 30% PPT: fog Overnight ppt or fog: rain 5:15am 8:30am
14-Jun-10
Breeding Bird - Grassland Point Counts and Area Searches
Temp: 16 C Wind: 2-3 WSW Cloud: overcast PPT: none Overnight ppt or fog: none 5:00am 10:00am
15-Jun-10Breeding Bird - Grassland Point Counts
Temp: 15 C Wind: 1 Cloud: 5% PPT: none Overnight ppt or fog: showers 5:45am 6:15am
15-Jun-10
Breeding Bird - Marsh, Woodland and Grassland point counts. Marsh and Woodland Area Searches
Temp: 12-16 C Wind: 2-3 Cloud: 20-60% PPT: none Overnight ppt or fog: rain 5:15am 9:30am
W:\active\60960494\reports\Monitoring Report #3 (2010 Jan-June)\Appendices\Appendix D_Survey Conditions_Both Tabs.xlsx 2 of 10

Distrubance Monitoring
Survey Date Survey Type Weather Start Time End Time
16-Jun-10
Breeding Bird - Marsh Point Counts and Area Search
Temp: 15-16 C Wind: 0-4 Cloud: 90% PPT: none Overnight ppt or fog: none 5:30am 10:15am
16-Jun-10
Breeding Bird - Grassland Point Counts and Area Searches
Temp: 14-15 C Wind: 2-3 Cloud: 95-100% PPT: none Overnight ppt or fog: none 5:15am 9:00am
17-Jun-10
Breeding Bird - Paired Grassland and Grassland Area Searches
Temp: 15 C Wind: 3-4 NW Cloud: 100% PPT: drizzle Overnight ppt or fog: rain 5:30am 9:15am
18-Jun-10
Breeding Bird - Woodland PCs and Area Search
Temp: 13-16 C Wind: 2-3 S Cloud: 5-15% PPT: none Overnight ppt or fog: none 5:30am 9:15am
19-Jun-10Breeding Bird - Paired Grassland
Temp: 18-23C Wind: 4-S Cloud: 9-95% PPT: none Overnight ppt or fog: none 5:15am 10:00am
20-Jun-10Breeding Bird - Paired Grassland
Temp: 17-20 C Wind: 1-2 NW Cloud: 90-100% PPT: none Overnight ppt or fog: none 5:15am 8:45am
W:\active\60960494\reports\Monitoring Report #3 (2010 Jan-June)\Appendices\Appendix D_Survey Conditions_Both Tabs.xlsx 3 of 10

Mortality Monitoring
Survey Date Temp (° C) Wind Speed Cloud PPTOvernight PPT Start Time End Time
04-Jan-10 -11 3-4 Partly None 10:06 AM 3:01 PM04-Jan-10 -11 3-4 Partly None 10:07 AM 3:03 PM05-Jan-10 -6 3-4 Overcast Snow 2:51 PM 4:25 PM05-Jan-10 -6 3-4 Overcast Snow 1:00 PM 4:25 PM05-Jan-10 -6 3-4 Overcast Snow Snow 9:04 AM 1:34 PM06-Jan-10 -7 2-3 Partly None 11:45 AM 2:10 PM06-Jan-10 -7 3-4 Overcast None 11:44 AM 2:02 PM06-Jan-10 -11 4 None 8:44 AM 2:57 PM07-Jan-10 -5 2-4 Overcast None 10:25 AM 2:27 PM07-Jan-10 -5 2-3 Overcast None 10:30 AM 2:30 PM8-Jan-10 -8 4-6 Overcast Snow 10:00 AM 11:43 AM8-Jan-10 -8 4-6 Overcast Snow 10:00 AM 11:52 AM8-Jan-10 -12 4 Overcast Snow 8:26 AM 12:00 PM11-Jan-10 -6 3-4 Overcast None 10:28 AM 12:26 PM11-Jan-10 -3 2-4 Overcast None 10:25 AM 12:25 PM11-Jan-10 -6 3 Partly None 8:47 AM 2:10 PM12-Jan-10 -8 4 Partly None 10:00 AM 2:05 PM12-Jan-10 -9 4 Snow 10:24 AM 1:56 PM13-Jan-10 -3 2-3 Overcast None 11:00 AM 1:12 PM13-Jan-10 -3 2-3 Overcast Snow 11:14 AM 1:21 PM13-Jan-10 8:45 AM 12:45 PM14-Jan-10 2 2-4 Overcast None 7:45 AM 11:40 AM14-Jan-10 2 4 Overcast None 7:51 AM 11:20 AM15-Jan-10 2 3-4 None None 7:45 AM 9:54 AM15-Jan-10 2 2-4 None None 8:10 AM 10:16 AM15-Jan-10 2 2 Overcast Drizzle 8:32 AM 1:00 PM18-Jan-10 0 2-3 Overcast None 12:02 PM 3:54 PM18-Jan-10 0 2-3 Overcast Fog 12:10 PM 4:03 PM19-Jan-10 2 2-3 Partly None 10:22 AM 12:21 PM19-Jan-10 2 8:25 AM 12:06 PM19-Jan-10 2 2-4 Overcast None 10:21 AM 12:25 PM20-Jan-10 -3 2-3 Overcast None 9:03 AM 11:00 AM20-Jan-10 -3 3 Overcast None 8:39 AM 1:47 PM20-Jan-10 -3 2-4 Overcast None 9:01 AM 10:53 AM21-Jan-10 -10 2-4 Overcast None Fog 7:50 AM 11:33 AM21-Jan-10 -6 3-4 Overcast Frost Fog 7:58 AM 11:59 AM22-Jan-10 -6 4 None None 9:00 AM 11:03 AM22-Jan-10 -9 3-4 None None 8:57 AM 10:41 AM22-Jan-10 -8 4 None None 8:39 AM 12:17 PM25-Jan-10 9 4 Overcast Rain 9:08 AM 3:00 PM25-Jan-10 9 4-6 Overcast Light Rain 9:20 AM 11:21 AM25-Jan-10 8 6 Overcast Rain 9:15 AM 11:12 AM26-Jan-10 0 5-6 Overcast Flurries 7:50 AM 11:48 AM26-Jan-10 0 6 Overcast None 7:56 AM 11:56 AM27-Jan-10 -1 3 Overcast Light Snow 8:25 AM 1:32 PM27-Jan-10 1 4 Overcast Trace Snow 9:15 AM 11:27 AM27-Jan-10 1 4 Overcast None 9:16 AM 11:15 AM28-Jan-10 -3 4-6 Overcast Heavy Snow 7:50 AM 11:40 AM28-Jan-10 -3 4-6 Overcast Blowing Snow 7:50 AM 12:00 PM29-Jan-10 -17 3 Partly None 9:36 AM 11:44 AM29-Jan-10 -16 3-4 Partly None 9:35 AM 11:29 AM29-Jan-10 -18 4 None None 9:24 AM 1:15 PM1-Feb-10 -12 4 Overcast None 9:06 AM 11:45 AM
W:\active\60960494\reports\Monitoring Report #3 (2010 Jan-June)\Appendices\Appendix D_Survey Conditions_Both Tabs.xlsx 4 of 10

Mortality Monitoring
Survey Date Temp (° C) Wind Speed Cloud PPTOvernight PPT Start Time End Time
1-Feb-10 -4 4-6 Partly None 2:35 PM 4:52 PM1-Feb-10 -4 5-6 Overcast None 2:36 PM 4:20 PM2-Feb-10 -3 9:20 AM 12:32 PM2-Feb-10 -2 1-2 Overcast None 9:37 AM 11:38 AM2-Feb-10 -2 2 Partly None 9:26 AM 11:28 AM3-Feb-10 -6 2 Overcast Flurries 7:58 AM 11:42 AM3-Feb-10 -6 2-3 Overcast Flurries 8:00 AM 12:25 PM4-Feb-10 -4 2-3 Partly None 10:31 AM 2:25 PM4-Feb-10 -6 2 Partly None 10:27 AM 2:27 AM5-Feb-10 -4 3 Partly None 9:03 AM 10:51 AM5-Feb-10 -4 2-4 Partly None 9:02 AM 10:49 AM5-Feb-10 -8 9:10 AM 12:21 PM8-Feb-10 -8 3-4 Partly None 9:15 AM 11:03 AM8-Feb-10 -8 3-4 Partly None 9:15 AM 11:13 AM8-Feb-10 12 3 None None 9:18 AM 1:45 PM9-Feb-10 -5 2 Overcast None 2:32 PM 4:21 PM9-Feb-10 -4 1-3 Partly None 2:35 PM 4:40 PM9-Feb-10 9:03 AM 12:45 PM10-Feb-10 -3 3-4 Overcast None 7:46 AM 11:44 AM10-Feb-10 -4 4 Overcast None 7:50 AM 11:29 AM11-Feb-10 -2 3-4 None None 12:23 PM 4:00 PM11-Feb-10 -4 4-6 None None 12:15 PM 3:55 PM12-Feb-10 -8 1 None None 9:03 AM 12:40 PM12-Feb-10 -12 3-4 None None 2:45 PM 4:10 PM12-Feb-10 -3 2-3 None None 2:47 PM 4:09 PM15-Feb-10 -2 4 Overcast None 8:37 AM 11:03 AM15-Feb-10 -3 4-6 Overcast None 7:45 AM 10:28 AM15-Feb-10 -3 6 Overcast None 7:58 AM 10:34 AM16-Feb-10 -2 4 Overcast None 9:06 AM 12:38 PM16-Feb-10 2 1-3 Overcast None 12:10 PM 2:10 PM16-Feb-10 3 2-3 Overcast None 2:44 PM 4:25 PM17-Feb-10 -3 3-4 Overcast Flurries 8:19 AM 10:03 AM17-Feb-10 -3 3-4 Overcast Flurries 8:15 AM 10:04 AM17-Feb-10 -1 9:09 AM 1:35 PM18-Feb-10 -1 4 Overcast None 8:00 AM 4:44 PM18-Feb-10 0 3-4 Overcast None 7:44 AM 10:40 AM19-Feb-10 -1 4 Overcast None 7:54 AM 10:45 AM19-Feb-10 -1 4 Overcast None 8:00 AM 10:36 AM22-Feb-10 -8 3-4 None None 6:53 AM 9:15 AM22-Feb-10 -2 3-4 Partly None 10:24 AM 2:02 PM23-Feb-10 1 3-4 Overcast None 8:13 AM 11:31 AM23-Feb-10 2 4 Overcast Light Rain 8:12 AM 8:28 PM24-Feb-10 0 2-3 Overcast Light Wet Snow 9:12 AM 11:50 AM25-Feb-10 1 2-3 Overcast Heavy Wet Snow 8:22 AM 9:29 AM25-Feb-10 1 2-4 Overcast Light Wet Snow Light Snow 8:16 AM 9:35 AM24-Feb-10 -1 3 Overcast Snow Snow 8:03 AM 11:35 AM25-Feb-10 0 1 None Snow 8:10 AM 12:15 PM26-Feb-10 2 6+ Partly None 10:18 AM 1:05 PM26-Feb-10 2 5 None Snow 7:46 AM 11:19 AM1-Mar-10 3 3 Overcast None 2:53 PM 5:22 PM1-Mar-10 3 2-4 Partly None 9:10 AM 11:48 AM2-Mar-10 0 0-2 Partly None 8:06 AM 10:33 AM
W:\active\60960494\reports\Monitoring Report #3 (2010 Jan-June)\Appendices\Appendix D_Survey Conditions_Both Tabs.xlsx 5 of 10

Mortality Monitoring
Survey Date Temp (° C) Wind Speed Cloud PPTOvernight PPT Start Time End Time
2-Mar-10 -1 1-3 Partly None 8:05 AM 10:29 AM3-Mar-10 1 6 Partly None 8:00 AM 10:34 AM3-Mar-10 8:03 AM 1:32 PM4-Mar-10 -1 4 Light None 7:50 AM 10:26 AM4-Mar-10 -2 4 None 8:07 AM 11:32 AM5-Mar-10 7 2-4 None 12:23 PM 1:53 PM5-Mar-10 4 2-3 None 3:45 PM 5:05 PM5-Mar-10 -2 4 None 7:37 AM 10:47 AM8-Mar-10 4 2-4 Partly None 6:54 AM 9:35 AM8-Mar-10 2 3-4 None 6:50 AM 9:30 AM9-Mar-10 6 1-2 None 2:51 PM 5:27 PM9-Mar-10 4 3 None 8:36 AM 12:00 PM10-Mar-10 5 2-3 None 9:10 AM 10:30 AM10-Mar-10 7:34 AM 11:45 AM10-Mar-10 11 2-4 None 11:13 AM 12:49 PM11-Mar-10 4 3-4 Overcast None 7:16 AM 9:47 AM11-Mar-10 4 2-3 Overcast None 7:10 AM 9:45 AM12-Mar-10 8 4 Overcast Light Rain 2:42 PM 5:21 PM12-Mar-10 9 4 Overcast Light Rain 10:13 AM 12:46 PM15-Mar-10 10 4 Partly None 2:50 PM 5:33 PM15-Mar-10 7 4 Partly None 9:21 AM 1:30 PM16-Mar-10 4 2-4 None 9:16 AM 10:43 AM16-Mar-10 8:50 AM 12:28 PM16-Mar-10 9 3-4 Partly None 2:49 PM 4:07 PM17-Mar-10 10 1-3 None 9:47 AM 1:50 PM17-Mar-10 10 11:18 AM 2:00 PM18-Mar-10 12 4 Light None 2:39 PM 5:09 PM18-Mar-10 8:11 AM 10:40 AM18-Mar-10 6:09 PM 7:29 PM19-Mar-10 9 4-6 Partly None 11:11 AM 2:10 PM19-Mar-10 11 None 10:30 AM 1:01 PM22-Mar-10 6 4 Overcast Light Rain 1:05 PM 3:44 PM23-Mar-10 3 4-6 Overcast Rain 2:42 PM 5:34 PM23-Mar-10 8:36 AM 12:31 PM24-Mar-10 6 1-3 None None 10:05 AM 11:36 AM24-Mar-10 2 4 Overcast Rain 7:38 AM 10:42 AM24-Mar-10 1 4 None None 7:53 AM 9:21 AM25-Mar-10 5 3-4 Partly None 7:11 AM 9:46 AM25-Mar-10 2 4 Partly None 7:10 AM 9:46 AM25-Mar-10 4 3 None None 8:24 AM 12:25 PM26-Mar-10 -7 4-6 None None 9:13 AM 11:49 AM26-Mar-10 -1 4 None None 2:35 PM 5:30 PM29-Mar-10 5 2-4 Overcast None 10:36 AM 2:10 PM29-Mar-10 4 4-5 Overcast Light Rain 10:36 AM 2:12 PM30-Mar-10 5 4-5 Partly None 10:18 AM 2:15 PM30-Mar-10 4 4-6 Partly None 10:20 AM 1:58 PM31-Mar-10 11 1-3 Partly None 10:34 AM 2:17 PM31-Mar-10 10 3-4 Partly None 10:40 AM 2:15 PM1-Apr-10 15 1-3 Partly None 11:15 AM 3:09 PM1-Apr-10 16 2-3 Light None 11:18 AM 3:00 PM2-Apr-10 15 4 None 8:00 AM 11:00 AM2-Apr-10 16 3-4 None 7:46 AM 11:35 AM5-Apr-10 11 4 Overcast Light Rain 8:35 AM 11:35 AM
W:\active\60960494\reports\Monitoring Report #3 (2010 Jan-June)\Appendices\Appendix D_Survey Conditions_Both Tabs.xlsx 6 of 10

Mortality Monitoring
Survey Date Temp (° C) Wind Speed Cloud PPTOvernight PPT Start Time End Time
5-Apr-10 12 8:53 AM 1:17 PM6-Apr-10 12 2 Partly Light Rain 11:15 AM 2:43 PM6-Apr-10 7:07 AM 12:33 PM7-Apr-10 12 4-5 Overcast Rain 11:11 AM 1:46 PM7-Apr-10 9 4-6 Overcast Rain 9:47 AM 1:43 PM8-Apr-10 9 4-6 Overcast None 9:11 AM 10:51 AM8-Apr-10 9 4-5 Overcast Rain Rain 9:15 AM 10:52 AM8-Apr-10 8:32 AM 1:55 PM9-Apr-10 5 4-6 Partly None 10:58 AM 2:21 PM9-Apr-10 7 6 Partly None 11:29 AM 3:01 PM12-Apr-10 11 3-4 Partly None 1:21 PM 4:38 PM12-Apr-10 10:59 AM 3:33 PM13-Apr-10 8:34 AM 1:15 PM13-Apr-10 12 3-4 Partly None 1:04 PM 4:10 PM14-Apr-10 8:39 AM 2:05 PM14-Apr-10 11 2-3 None None 11:14 AM 1:03 PM14-Apr-10 13 1-3 None None 11:09 AM 1:03 PM15-Apr-10 12 1-2 Overcast Light Rain 11:25 AM 2:21 PM15-Apr-10 13 1-3 Overcast None 11:15 AM 2:43 PM16-Apr-10 8 2-3 Overcast Rain 8:04 AM 11:20 AM16-Apr-10 8 3-4 Partly Rain 10:08 AM 1:12 PM19-Apr-10 14 2-4 Partly None 2:42 PM 6:37 PM19-Apr-10 14 4 Partly None 2:40 PM 5:39 PM20-Apr-10 8:55 AM 1:46 PM20-Apr-10 16 4 Partly None 3:00 PM 6:20 PM21-Apr-10 16 3-4 Light None 2:23 PM 5:54 PM21-Apr-10 15 3-4 None None 11:10 AM 2:38 PM22-Apr-10 3-4 Overcast Light Rain 7:58 AM 9:32 AM22-Apr-10 9:06 AM 2:04 PM23-Apr-10 7 2-3 None None 8:05 AM 11:28 AM23-Apr-1026-Apr-10 14 4 Light None 10:10 AM 2:19 PM26-Apr-10 9:07 AM 2:48 PM27-Apr-10 3 4-6 Overcast Flurries 9:18 AM 10:32 AM27-Apr-10 9:03 AM 1:50 PM27-Apr-10 4 4-6 Overcast Wet Snow 10:10 AM 11:38 AM28-Apr-10 10 4-6 Partly None 9:12 AM 1:00 PM28-May-10 10 4-6 None 9:20 AM 12:39 PM29-Apr-10 8:59 AM 1:56 PM29-Apr-10 16 4-6 None None 11:36 AM 3:18 PM30-Apr-10 14 1-3 Overcast None 9:20 AM 2:55 PM30-Apr-10 9 2-3 Partly 6:30 AM 2:34 PM3-May-10 20 4-5 Partly None 12:10 PM 2:04 PM3-May-10 9:46 AM 3:09 PM3-May-10 20 4 Light None 10:18 AM 11:43 AM4-May-104-May-10 11 4-5 Overcast None 6:20 AM 10:08 AM5-May-10 11 2-4 Overcast Light Rain 8:01 AM 11:35 AM5-May-10 15 3-4 Partly None 10:24 AM 2:18 PM6-May-10 10:09 AM 3:28 PM6-May-10 10 4-5 Partly None 6:25 AM 9:28 AM7-May-10 8 2-3 None None 8:05 AM 11:35 AM7-May-10 13 1-3 Partly None 8:57 AM 12:48 PM
W:\active\60960494\reports\Monitoring Report #3 (2010 Jan-June)\Appendices\Appendix D_Survey Conditions_Both Tabs.xlsx 7 of 10

Mortality Monitoring
Survey Date Temp (° C) Wind Speed Cloud PPTOvernight PPT Start Time End Time
10-May-10 9 3-4 Light None 10:35 AM 1:51 PM10-May-10 13 1-3 Partly None 10:26 AM 2:03 PM11-May-10 11 3-4 Hazy None 10:16 AM 11:43 AM11-May-10 13 1-3 None 10:26 AM 11:38 AM11-May-10 8:10 AM 12:10 PM12-May-10 12 2-4 Overcast None 10:24 AM 1:42 PM12-May-10 10 3-4 Overcast None 7:15 AM 11:44 AM13-May-10 11 2-4 Light None 9:27 AM 1:52 PM13-May-1014-May-10 8:39 AM 12:28 PM14-May-10 15 4-6 None None 2:50 PM 5:45 PM17-May-10 12 2-3 Light None 8:01 AM 11:06 AM17-May-10 17 1-3 None None 10:23 AM 2:03 PM18-May-10 15 2-4 Partly None 8:15 AM 11:19 AM18-May-10 17 1-3 Partly None 10:18 AM 12:56 PM19-May-10 21 1-3 Partly 3:25 PM 5:15 PM19-May-10 8:08 AM 12:16 PM19-May-10 19 2-3 Partly None 8:10 AM 9:34 AM20-May-10 None None 7:49 AM 12:56 PM20-May-10 19 2-3 Partly None 1:15 PM 3:51 PM21-May-10 None None 7:13 AM 12:24 PM21-May-10 27 2-3 Light None 3:50 PM 6:40 PM24-May-10 23 2-4 None None 10:12 AM 11:50 AM24-May-10 19 4 None None 7:00 AM 8:47 AM24-May-10 None None 6:34 AM 11:47 AM25-May-10 None None 7:13 AM 10:51 AM25-May-10 15 2-3 None None 6:15 AM 9:42 AM26-May-10 30 2-4 Partly None 11:00 AM 2:18 PM26-May-10 24 2-3 None None 10:55 AM 1:56 PM27-May-10 None None 7:20 AM 12:31 PM27-May-10 24 2-3 Overcast None 5:40 AM 8:27 AM28-May-10 21 2-4 Overcast None 11:20 AM 2:25 PM28-May-10 16 2-3 Partly None 6:00 AM 9:53 AM31-May-10 22 2-3 Light None 9:55 AM 12:40 PM31-May-10 None None 7:20 AM 12:17 PM1-Jun-10 None None 10:04 AM 1:45 PM1-Jun-10 22 3-4 Partly None 10:15 AM 11:29 AM1-Jun-10 22 1-3 Overcast None 10:15 AM 11:43 AM2-Jun-10 21 3-5 None None 10:30 AM 1:14 PM2-Jun-10 None None 6:35 AM 12:54 PM3-Jun-10 20 2-3 Overcast None 9:40 AM 12:32 PM3-Jun-10 21 1-3 Overcast None 11:26 AM 3:09 PM4-Jun-10 16 1-2 Light None 6:15 AM 10:00 AM4-Jun-10 22 1-3 Partly None 10:14 AM 1:00 PM7-Jun-10 15 2-3 None None 7:45 AM 10:50 AM7-Jun-10 None None 8:09 AM 12:03 PM8-Jun-10 None None 7:25 AM 11:10 AM8-Jun-10 158-Jun-10 21 2-4 Partly None 4:05 PM 6:03 PM9-Jun-10 17 2-4 Overcast Light Rain 10:30 AM 2:05 PM9-Jun-10 14 4-6 Overcast Rain 10:30 AM 1:40 PM10-Jun-10 17 3-4 Overcast Light Rain 10:27 AM 1:41 PM10-Jun-10 15 2-3 Overcast Rain 10:19 AM 1:11 PM
W:\active\60960494\reports\Monitoring Report #3 (2010 Jan-June)\Appendices\Appendix D_Survey Conditions_Both Tabs.xlsx 8 of 10
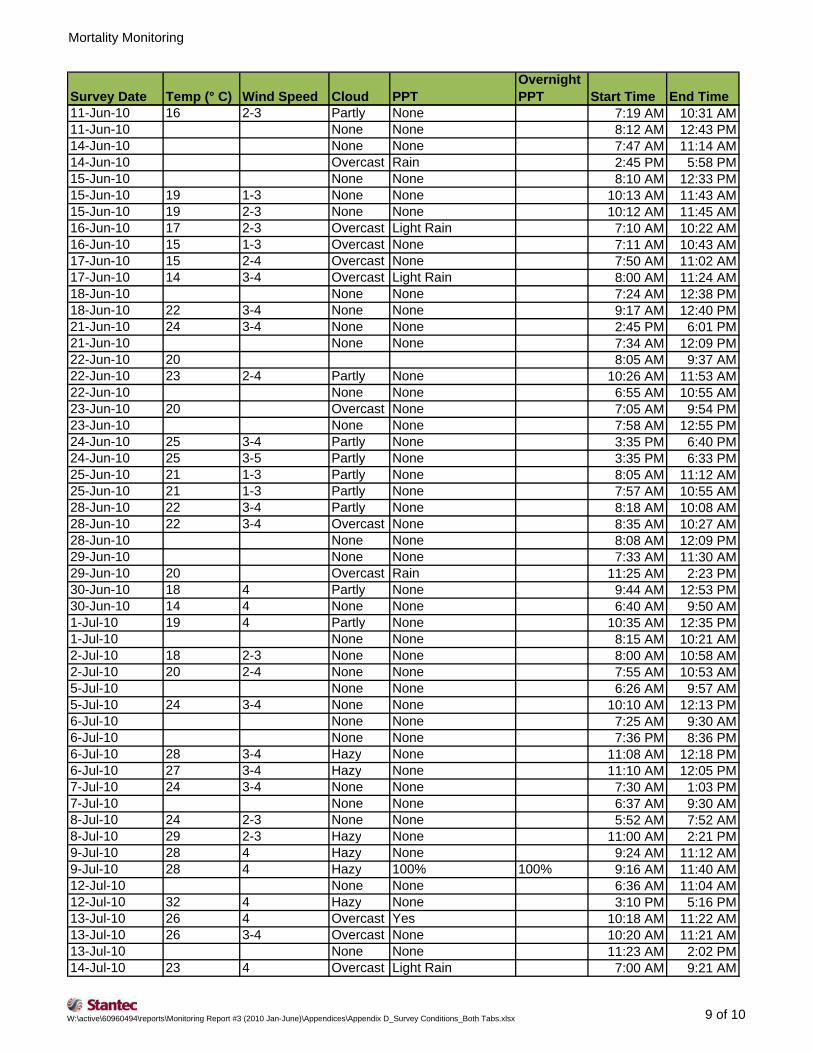
Mortality Monitoring
Survey Date Temp (° C) Wind Speed Cloud PPTOvernight PPT Start Time End Time
11-Jun-10 16 2-3 Partly None 7:19 AM 10:31 AM11-Jun-10 None None 8:12 AM 12:43 PM14-Jun-10 None None 7:47 AM 11:14 AM14-Jun-10 Overcast Rain 2:45 PM 5:58 PM15-Jun-10 None None 8:10 AM 12:33 PM15-Jun-10 19 1-3 None None 10:13 AM 11:43 AM15-Jun-10 19 2-3 None None 10:12 AM 11:45 AM16-Jun-10 17 2-3 Overcast Light Rain 7:10 AM 10:22 AM16-Jun-10 15 1-3 Overcast None 7:11 AM 10:43 AM17-Jun-10 15 2-4 Overcast None 7:50 AM 11:02 AM17-Jun-10 14 3-4 Overcast Light Rain 8:00 AM 11:24 AM18-Jun-10 None None 7:24 AM 12:38 PM18-Jun-10 22 3-4 None None 9:17 AM 12:40 PM21-Jun-10 24 3-4 None None 2:45 PM 6:01 PM21-Jun-10 None None 7:34 AM 12:09 PM22-Jun-10 20 8:05 AM 9:37 AM22-Jun-10 23 2-4 Partly None 10:26 AM 11:53 AM22-Jun-10 None None 6:55 AM 10:55 AM23-Jun-10 20 Overcast None 7:05 AM 9:54 PM23-Jun-10 None None 7:58 AM 12:55 PM24-Jun-10 25 3-4 Partly None 3:35 PM 6:40 PM24-Jun-10 25 3-5 Partly None 3:35 PM 6:33 PM25-Jun-10 21 1-3 Partly None 8:05 AM 11:12 AM25-Jun-10 21 1-3 Partly None 7:57 AM 10:55 AM28-Jun-10 22 3-4 Partly None 8:18 AM 10:08 AM28-Jun-10 22 3-4 Overcast None 8:35 AM 10:27 AM28-Jun-10 None None 8:08 AM 12:09 PM29-Jun-10 None None 7:33 AM 11:30 AM29-Jun-10 20 Overcast Rain 11:25 AM 2:23 PM30-Jun-10 18 4 Partly None 9:44 AM 12:53 PM30-Jun-10 14 4 None None 6:40 AM 9:50 AM1-Jul-10 19 4 Partly None 10:35 AM 12:35 PM1-Jul-10 None None 8:15 AM 10:21 AM2-Jul-10 18 2-3 None None 8:00 AM 10:58 AM2-Jul-10 20 2-4 None None 7:55 AM 10:53 AM5-Jul-10 None None 6:26 AM 9:57 AM5-Jul-10 24 3-4 None None 10:10 AM 12:13 PM6-Jul-10 None None 7:25 AM 9:30 AM6-Jul-10 None None 7:36 PM 8:36 PM6-Jul-10 28 3-4 Hazy None 11:08 AM 12:18 PM6-Jul-10 27 3-4 Hazy None 11:10 AM 12:05 PM7-Jul-10 24 3-4 None None 7:30 AM 1:03 PM7-Jul-10 None None 6:37 AM 9:30 AM8-Jul-10 24 2-3 None None 5:52 AM 7:52 AM8-Jul-10 29 2-3 Hazy None 11:00 AM 2:21 PM9-Jul-10 28 4 Hazy None 9:24 AM 11:12 AM9-Jul-10 28 4 Hazy 100% 100% 9:16 AM 11:40 AM12-Jul-10 None None 6:36 AM 11:04 AM12-Jul-10 32 4 Hazy None 3:10 PM 5:16 PM13-Jul-10 26 4 Overcast Yes 10:18 AM 11:22 AM13-Jul-10 26 3-4 Overcast None 10:20 AM 11:21 AM13-Jul-10 None None 11:23 AM 2:02 PM14-Jul-10 23 4 Overcast Light Rain 7:00 AM 9:21 AM
W:\active\60960494\reports\Monitoring Report #3 (2010 Jan-June)\Appendices\Appendix D_Survey Conditions_Both Tabs.xlsx 9 of 10

Mortality Monitoring
Survey Date Temp (° C) Wind Speed Cloud PPTOvernight PPT Start Time End Time
14-Jul-10 29 2-4 Partly None 4:55 PM 7:28 PM15-Jul-10 21 2-3 None None 6:50 AM 8:53 AM16-Jul-10 28 4 None None 2:35 PM 4:52 PM16-Jul-10 None None 6:14 AM 1:21 PM19-Jul-10 23 4 Overcast None 9:42 AM 12:13 PM19-Jul-10 None None 7:37 AM 12:53 PM20-Jul-10 None None 7:00 AM 9:45 AM20-Jul-10 24 2-3 Overcast Rain Periods 10:36 AM 12:26 PM21-Jul-10 26 3-4 Partly None 8:50 AM 11:22 AM21-Jul-10 None None 6:47 AM 10:04 AM22-Jul-10 21 2-3 None None 8:00 AM 10:18 AM22-Jul-10 None None 6:24 AM 10:59 AM23-Jul-10 None None 6:29 AM 9:34 AM23-Jul-10 20 4 Overcast None 8:05 AM 10:14 AM26-Jul-10 21 2-4 None None 7:05 AM 9:33 AM26-Jul-10 19 2-3 None None 7:08 AM 9:26 AM27-Jul-10 22 3-4 None None 8:00 AM 10:07 AM27-Jul-10 22 2-3 None None 8:00 AM 9:44 AM28-Jul-10 21 2-4 Light None 5:40 AM 7:41 AM28-Jul-10 None None 6:34 AM 10:47 AM29-Jul-10 20 3-4 None None 7:10 AM 11:04 AM29-Jul-10 21 2-4 None None 9:21 AM 1:05 PM30-Jul-10 18 2-3 None None 6:10 AM 9:41 AM30-Jul-10 20 3-4 Partly None 9:20 AM 12:54 PM
W:\active\60960494\reports\Monitoring Report #3 (2010 Jan-June)\Appendices\Appendix D_Survey Conditions_Both Tabs.xlsx 10 of 10

WOLFE ISLAND WIND PLANT, POST-CONSTRUCTION FOLLOW-UP PLAN BIRD AND BAT RESOURCES MONITORING REPORT NO. 3, JANUARY - JUNE 2010
Appendix E
NRCan Report on Ensuring Implementation of the Wolfe Island PCFP

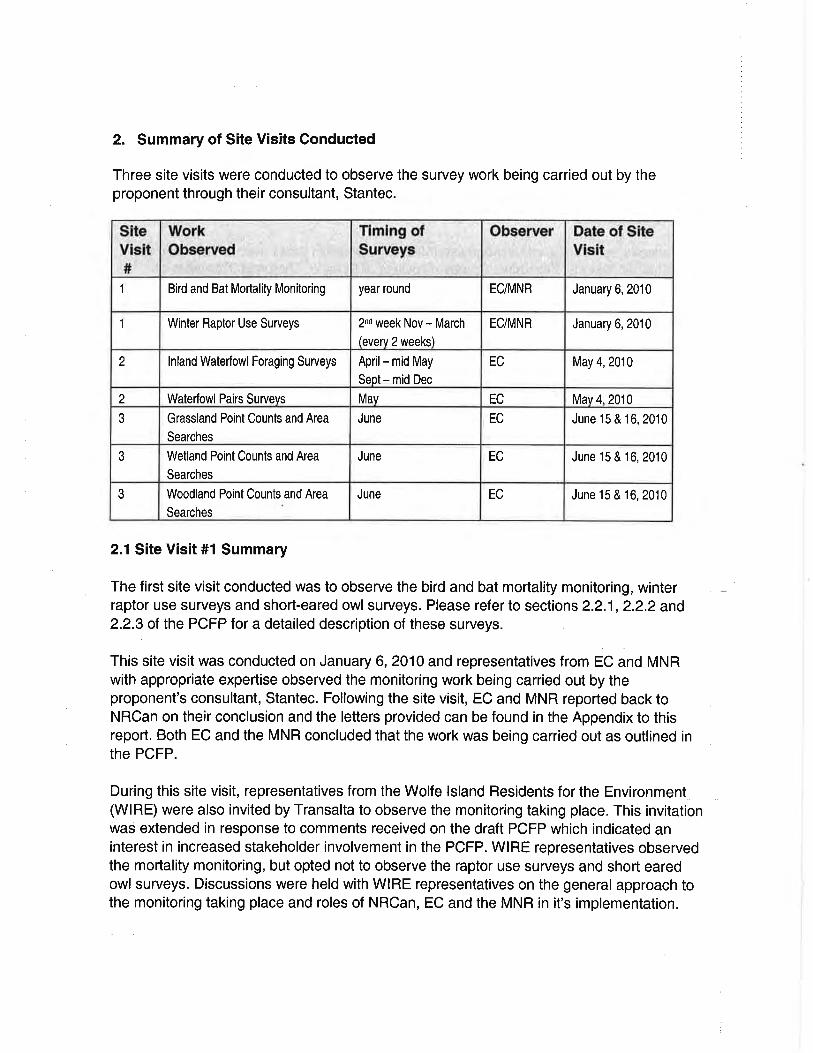


WOLFE ISLAND WIND PLANT, POST-CONSTRUCTION FOLLOW-UP PLAN BIRD AND BAT RESOURCES MONITORING REPORT NO. 3, JANUARY - JUNE 2010
Appendix F
Mortality Monitoring Results

Mortaility Data - Detailed Results Birds
Date
# checks/week
Turbine #
GPS LocationZoneEastingNorthing Observer Species Guild
Condition/Estimated Time Since Death Injuries Sustained
Distance(m)
Direction(°)
Direction(compass) Ground Cover
01-Feb-10 46 0389918 4890696 CF Bird Sp. bird old - at least 3 days 13 62 E Soil08-Feb-10 81 0389704 4894002 WS Red-tailed Hawk bird frozen - less than 5 days bent wing 23 253 W Soil09-Feb-10 30 0384145 4890364 WS Bird Sp. bird complete - >30 days 44 40 N Soil16-Feb-10 69 0384733 4886852 WS Bird Sp. bird Bodyless, Wing - >30 days 12 18 N Soil
22-Feb-10 72 0385840 4892986 CF European Starling birdFresh, partially scavenged - 1-2 days Wing 16 166 S Gravel
04-Mar-10 55 0387550 4889924 JL Bird Sp. bird Fresh, 1-2 days 40 270 W Soil / Veg
10-Mar-10 65 0384733 4886852 WS Bird Sp. birdSkeleton w/ Feathers, >30 days 43 110 E Swamp
11-Mar-10 61 0390023 4894173 CF European Starling bird Fresh, 1-2 days Neck 15 194 S Soil23-Mar-10 43 0390564 4891503 JL Killdeer bird Fresh, 1-2 days Wing / Neck 34 350 N Gravel29-Mar-10 1 0381112 4890726 CF Starling bird Fresh, 1-3 days Neck 12 270 W Soil31-Mar-10 29 0384748 4886878 JL Blue Jay bird Old, 3-4 days 14 210 SW Soil / Veg31-Mar-10 41 0387552 4886656 CF Starling bird Fresh, 1-2 days Neck 44 44 NE Soil / Soybean Veg05-Apr-10 72 0387700 4892945 WS Horned Lark bird Fresh, < 3 days Trauma, left side 31 215 S Soil06-Apr-10 30 0385820 4892985 WS Killdeer bird Fresh, 3-5 days Chest trauma 15 319 N Grass08-Apr-10 18 0381634 4888714 JL Grackle bird Fresh, 1-2 days Neck (?) 19 110 E Mud/Veg09-Apr-10 81 0384123 4890372 JL Red-tailed Hawk bird Fresh, < 2 days Neck / Leg 31 105 E Veg / Soil12-Apr-10 38 0387277 4888061 JL Horned Lark bird Fresh, 1-2 days Head 9 90 E Gravel13-Apr-10 9 0380923 4890046 JL Wilson's Snipe bird Fresh, 1-2 days Beak / Body 19 270 W Gravel14-Apr-10 29 0384729 4886854 WS Red-tailed Hawk bird Fresh, < 3 days Decapitated 26 110 E Soil14-Apr-10 30 0384732 4886839 WS Wilson's Snipe bird Old, > 5 days 6 160 SE Grass15-Apr-10 27 0382244 4891308 JL Red-tailed Hawk bird Fresh, <1 day Neck (?) 8 330 N Soil / Rock16-Apr-10 64 0388550 4893697 JL Red-tailed Hawk bird Fresh, 1-2 days Wing / Neck 40 330 N Hay / Mud21-Apr-10 49 0387565 4886688 CF Wilson's Snipe bird Fresh, 1-2 days Neck 1 158 S Gravel22-Apr-10 9 0380924 4890065 WS Wilson's Snipe bird Decaying, >3 days 28 260 W Grass23-Apr-10 56 0385846 4890236 JL Mallard ♀ bird Fresh, < 1 day Neck / Head 10 235 SW Soil23-Apr-10 79 0384852 4889368 JL Wilson's Snipe bird Fresh, 2-3 days Neck 10 50 NE Soil / Veg23 Apr 10 79 0384852 4889368 JL Wilson s Snipe bird Fresh, 2 3 days Neck 10 50 NE Soil / Veg
26-Apr-10 2 0382125 4891651 WSDouble-crested Cormorant bird Fresh, 3-5 days Headless 31 320 N Swamp
26-Apr-10 1 0380953 4891108 WS Mallard ♀ bird Fresh, < 3 days Footless 35 320 N Grass26-Apr-10 65 0381077 4890730 WS Ring-billed Gull bird Unknown Bodyless, wings only 31 60 N Grass26-Apr-10 28 0382110 4891660 WS Wilson's Snipe bird Fresh, < 3 days Broken neck 0 40 N Tower base28-Apr-10 63 0388780 4893376 JL Tree Swallow bird Old, 2-3 days 40 350 N Soil / Veg29-Apr-10 73 0387728 4892954 WS Bird Sp. bird Fresh, < 3 days Broken neck 22 100 E Soil29-Apr-10 24 0382773 4890019 JL Ring-billed Gull bird Fresh, 1 day Split in half 49 300 NW Veg / Soil03-May-10 2 43 0390538 4891543 JL Osprey bird Really Fresh, < 12 hours Head 15 135 SE Soil04-May-10 2 71 0384293 4893473 WS Ring-billed Gull bird Unknown 40 110 Mud05-May-10 1 31 0384867 4886113 CF Mallard ♂ bird Fresh, 1-3 days Neck 27 62 E Soil05-May-10 1 72 0385878 4892975 CF Upland Sandpiper bird Fresh, 1-2 days Wing 44 262 W Vegetation06-May-10 2 34 0384070 4887239 WS Black & White Warbler bird Fresh, < 3 days Nothing visible 38 220 Rock06-May-10 2 34 0384008 4893473 WS Savannah Sparrow bird Fresh, 3-5 days 27 86 Soil07-May-10 2 71 0386358 4894067 JL Nashville warbler bird Fresh, 1-2 days Neck? 31 315 NW Soil11-May-10 1 4 0380294 4890715 CF Chimney Swift bird Fresh, 1-2 days Neck? 40 238 W Vegetation12-May-10 1 72 0385868 4892992 CF Yellow Warbler bird Fresh, 1-2 days Neck 36 244 W Soil / Veg13-May-10 2 46 0383933 4893057 WS Northern Harrier bird Fresh, 3-5 days Broken neck 40 150 S Gravel17-May-10 2 85 0381871 4892264 CF Baltimore oriole bird Fresh, 1-2 days Neck? 21 104 E Soil
W:\active\60960494\reports\Monitoring Report #3 (2010 Jan-June)\Appendices\Appendix F - Mortality Monitoring Results\Appendix F_Mortality Data_FINAL_Detailed Results BIRDS and BATS tabs only.XLS 1 of 3

Mortaility Data - Detailed Results Birds
Date
# checks/week
Turbine #
GPS LocationZoneEastingNorthing Observer Species Guild
Condition/Estimated Time Since Death Injuries Sustained
Distance(m)
Direction(°)
Direction(compass) Ground Cover
17-May-10 2 33 0384514 4887219 JL Magnolia warbler bird Fresh, 1-2 days Wing/Neck 40 315 NW Soil17-May-10 2 78 0385183 4890985 CF Red-tailed Hawk bird Fresh, 1-2 days Neck 31 78 E Vegetation18-May-10 2 25 0382723 4890484 CF Philadelphia Vireo bird Fresh, 1-2 days Abdomen 9 40 NE Vegetation20-May-10 2 23 0382112 4890206 JL Horned Lark bird Old, > 7 days 41 180 S Soil / Veg21-May-10 2 64 0388499 4893739 JL Red-winged Blackbird bird Fresh, 1-2 days Neck? 29 130 SE Gravel24-May-10 2 65 0382179 4892621 WS Upland Sandpiper bird Fresh, < 5 days Entirely 39 180 Soil27-May-10 2 46 0389906 4890719 WS Mourning Dove bird 3-5 days Mangled 37 172 Weeds31-May-10 2 35 0384235 4887843 JL Ring-billed Gull bird Fresh, 2-3 days Neck 20 95 E Soil / Veg31-May-10 2 24 0389903 4890711 WS Ring-billed Gull bird Old, > 5 days Entirely 34 220 Grass08-Jun-10 2 68 0386462 4891880 WS Bobolink bird Old, 2-5 days Entirely 38 234 Cornfield10-Jun-10 1 75 0384512 4892590 CF Red-tailed Hawk bird Fresh, 1-2 days Neck 18 22 N Soil / Veg10-Jun-10 2 24 0382751 4890005 JL Ring-billed Gull bird Fresh, 1-2 days Wing / Neck 35 345 N Soil / Veg
11-Jun-10 2 38 0387304 4887585 WS Ring-billed Gull birdUnknown, feathers only, body has been scavenged 17 234 Soil
16-Jun-10 1 56 0385779 4890243 CF Ring-necked Pheasant bird Fresh, 1-2 days Neck? 1 194 S Soil / Veg18-Jun-10 2 20 0381832 4889279 WS Killdeer bird Feathers only ? Scavenged 40 249 Grass21-Jun-10 2 42 0386325 4889071 JL Tree swallow bird Fresh, 1-2 days Wing / Neck 23 320 NW Veg / Soil22-Jun-10 1 9 0380911 4890059 JL Common Grackle bird Old, 3-4 days 16 255 W Gravel22-Jun-10 2 67 0386811 4891257 WS Mourning Dove bird Fresh, < 3 days 1 200 Soil23-Jun-10 1 31 0384874 4886158 WS Wood Thrush bird Old, > 3 days Entirely 29 185 Gravel24-Jun-10 2 46 0389914 4890729 CF Tree swallow bird Fresh, 1-2 days Wing? 30 172 S Gravel25-Jun-10 2 42 0386302 4889048 CF Wilson's Snipe bird Completely (maggots) 3-4 d Neck 32 78 E Gravel
W:\active\60960494\reports\Monitoring Report #3 (2010 Jan-June)\Appendices\Appendix F - Mortality Monitoring Results\Appendix F_Mortality Data_FINAL_Detailed Results BIRDS and BATS tabs only.XLS 2 of 3

Mortaility Data - Detailed Results Bats
Date#checks/week
Turbine #
GPS LocationZoneEastingNorthing Species Guild
Condition/Estimated Time Since Death Injuries Sustained
Distance(m)
Direction(°)
Direction(compass) Ground Cover
03-May-10 2 34 0384046 4887210 Silver-haired Bat bat Fresh, 1-3 days Neck 2 297 W Soil03-May-10 2 37 0388784 4887840 Silver-haired Bat bat Fresh, 1-2 days Wing 37 162 S Soil04-May-10 2 18 0381637 4888739 Silver-haired Bat bat Fresh, 1-2 days No visible trauma 34 165 S Gravel04-May-10 2 20 0381828 4889268 Silver-haired Bat bat Fresh, 1-2 days No visible trauma 25 250 W Gravel04-May-10 1 10 0381229 4890224 Silver-haired Bat bat Fresh, 1-2 days No visible trauma 18 135 SE Soil / Veg04-May-10 1 4 0380286 4890698 Silver-haired Bat bat Fresh, 1-2 days No visible trauma 24 270 W Soil04-May-10 1 6 0380777 4889443 Silver-haired Bat bat Fresh, 1-2 days No visible trauma 32 180 S Soil04-May-10 1 6 0380791 4889428 Silver-haired Bat bat Fresh, 1-2 days No visible trauma 14 225 SW Soil / Veg05-May-10 1 79 0384834 4889365 Silver-haired Bat bat Old, 2-3 days No visible trauma 28 75 E Gravel05-May-10 1 40 0388026 4886999 Silver-haired Bat bat Fresh, 1-2 days No visible trauma 20 280 W Soil05-May-10 1 40 0388023 4887032 Silver-haired Bat bat Fresh, 1-2 days No visible trauma 42 210 SW Gravel05-May-10 1 48 0389232 4889722 Silver-haired Bat bat Fresh, 1-2 days No visible trauma 45 250 SW Gravel05-May-10 1 58 0389380 4892202 Silver-haired Bat bat Fresh, 1 day No visible trauma 30 200 S Soil05-May-10 1 58 0389378 4892193 Silver-haired Bat bat Fresh, 1 day No visible trauma 18 180 S Soil05-May-10 1 22 0382229 4887716 Silver-haired Bat bat Fresh, 1-2 days Wing 41 152 S Soil06-May-10 2 34 0384293 4893473 Silver-haired Bat bat Old, > 5 days 21 270 Grass06-May-10 2 35 0384059 4887212 Silver-haired Bat bat Old, > 5 days 19 240 Grass06-May-10 1 76 0383939 4893072 Silver-haired Bat bat Old, > 5 days 31 250 Gravel07-May-10 2 39 0387308 4887590 Silver-haired Bat bat Fresh, 1-2 days No visible trauma 32 238 W Soil07-May-10 2 17 0381105 4888998 Silver-haired Bat bat Old, 2-4 days Wing 41 240 W Gravel12-May-10 1 31 0384862 4886145 Silver-haired Bat bat Old, 2-4 days Rear end 17 126 ESE Soil / Veg18-May-10 1 12 0381827 4890340 Silver-haired Bat bat Fresh, < 1 day No visible trauma 20 175 S Gravel20-May-10 2 28 0382153 4891662 Silver-haired Bat bat Fresh, 1-2 days No visible trauma 43 280 W Soil21-May-10 2 82 0389889 4890748 Big Brown Bat bat Fresh, 3-5 days No visible trauma 14 240 Gravel21-May-10 2 38 0387290 4888058 Silver-haired Bat bat Fresh, < 3 days No visible trauma 3 190 Soil24-May-10 2 86 0387274 4888061 Silver-haired Bat bat Dessicated, > 5 days Broken neck 44 280 Soil26 M 10 1 58 0389385 4892169 Bi B B t b t F h 1 2 d N i ibl t 1 t 2 300 W G l26-May-10 1 58 0389385 4892169 Big Brown Bat bat Fresh, 1-2 days No visible trauma 1 to 2 300 W Gravel27-May-10 1 75 0387762 4892964 Big Brown Bat bat Old, > 5 days 18 310 Grass01-Jun-10 2 51 0387750 4890480 Silver-haired Bat bat Old, > 5 days Entirely 16 262 Gravel02-Jun-10 1 48 0389219 4889709 Red bat bat Fresh, 1-2 days No visible trauma 44 240 W Gravel04-Jun-10 2 17 0381046 4888970 Silver-haired Bat bat Fresh, 1-2 days No visible trauma 21 70 E Soil / Veg08-Jun-10 1 9 0380925 4890037 Red bat bat Old, 3-4 days 33 290 W Gravel11-Jun-10 2 71 0386322 4894087 Silver-haired Bat bat Fresh, 1-2 days No visible trauma 12 170 S Gravel28-Jun-10 2 78 0385256 4891011 Big Brown Bat bat Completely, > 5 days 44 248 Gravel
W:\active\60960494\reports\Monitoring Report #3 (2010 Jan-June)\Appendices\Appendix F - Mortality Monitoring Results\Appendix F_Mortality Data_FINAL_Detailed Results BIRDS and BATS tabs only.XLS 3 of 3

WOLFE ISLAND WIND PLANT, POST-CONSTRUCTION FOLLOW-UP PLAN BIRD AND BAT RESOURCES MONITORING REPORT NO. 3, JANUARY - JUNE 2010
Appendix G
Aerial Waterfowl Data

Table 1: Waterfowl Guild by Sector, 2010C7 C8 C9 C10 C11 Total
Swans 71 469 14 14 14 582Geese 2,485 35 521 20,570 2,541 26,152Large dabblers 736 3,401 10,022 1,162 962 16,282Small dabblers 210 210 765 0 0 1,185Bay ducks 12,337 15,517 116,540 58,867 2,634 205,895Sea ducks 0 0 0 0 1,050 1,050Goldeneye 24,819 9,379 9,868 15,843 23,201 83,109Mergansers 6,376 9,130 4,746 4,786 4,740 29,777Unknown 27 953 3,321 108 280 4,688Total 47,060 39,092 145,796 101,349 35,422 368,718
Table 2: Waterfowl Guild by Major Staging Area, 2010Bayfield Button Pyke's Reed's Total
Swans 0 0 0 0 0Geese 318 7,720 3,492 2,370 13,900Large dabblers 9,448 733 278 138 10,596Small dabblers 765 0 0 0 765Bay ducks 34,831 53,225 0 103 88,158Sea ducks 0 0 0 0 0Goldeneye 4,025 4,118 1,992 3,314 13,448Mergansers 1,773 1,332 382 780 4,266Unknown 1,780 0 0 0 1,780Total 52,939 67,126 6,143 6,705 132,912
Table 3: Waterfowl Guild by Sector, 2009C7 C8 C9 C10 C11 Total
Swans 29 29 15 0 142 214Geese 5,076 3,668 9,782 1,588 3,667 23,779Large dabblers 851 1,355 3,002 1,171 1,942 8,321Small dabblers 0 0 45 0 33 78Bay ducks 7,985 10,974 134,288 22,994 3,465 179,704Sea ducks 118 200 2,508 281 1,011 4,118Goldeneye 11,930 3,017 6,079 9,867 23,200 54,093Mergansers 9,624 11,869 12,805 9,242 12,199 55,737Unknown 86 0 43,800 1,350 0 45,236Total 35,696 31,110 212,323 46,492 45,658 371,278
Table 4: Waterfowl Guild by Major Staging Area, 2009Bayfield Button Pyke's Reed's Total
Swans 0 0 0 0 0Geese 4,430 638 40 2,550 7,657Large dabblers 2,559 230 800 645 4,234Small dabblers 45 0 0 0 45Bay ducks 110,989 7,737 1,600 165 120,490Sea ducks 0 0 0 63 63Goldeneye 2,400 1,165 2,014 3,341 8,919Mergansers 4,487 1,760 906 1,830 8,982Unknown 33,300 0 0 0 33,300Total 158,209 11,529 5,359 8,593 183,689
2010 Aerial Waterfowl Summary
2009 Aerial Waterfowl Summary
W:\active\60960494\reports\Monitoring Report #3 (2010 Jan-June)\Appendices\Appendix G Summaries of Aerial Waterfowl Data from spring 1999, 2008, 2009 and 2010.xlsx 1 of 2

Table 5: Waterfowl Guild by Sector, 2008C7 C8 C9 C10 C11 Total
Swans 0 0 0 8 27 35Geese 0 88 1,256 747 5,161 7,251Large dabblers 203 231 237 395 149 1,214Small dabblers 0 0 54 8 0 62Bay ducks 8,485 18,620 119,933 24,027 15,260 186,325Sea ducks 0 0 0 0 108 108Goldeneye 20,840 11,779 19,844 25,781 46,815 125,058Mergansers 3,836 3,128 4,594 3,461 2,229 17,247Unknown 0 0 2,750 59 2,809Total 33,363 33,846 148,667 54,425 69,806 340,105
Table 6: Waterfowl Guild by Bay, 2008Bayfield Button Pyke's Reed's Total
Swans 0 0 0 0 0Geese 0 222 375 2,912 3,509Large dabblers 87 225 75 27 414Small dabblers 54 8 0 0 62Bay ducks 50,460 11,985 5,625 4,850 72,920Sea ducks 0 0 0 0 0Goldeneye 8,956 5,202 6,958 11,712 32,828Mergansers 737 601 150 347 1,835Unknown 2,500 0 0 59 2,559Total 62,794 18,242 13,183 19,905 114,124
Table 7: Waterfowl Guild by Sector, 1999C7 C8 C9 C10 C11 Total
Swans 0 0 68 150 0 218Geese 3,097 607 3,099 2,919 8,146 17,867Large dabblers 1,458 696 9,254 8,019 3,933 23,360Small dabblers 0 25 116 69 453 663Bay ducks 19,912 112,954 245,418 2,545 777 381,605Sea ducks 0 0 0 75 14 89Goldeneye 6,523 3,361 4,745 5,701 10,299 30,628Mergansers 5,326 3,980 3,533 3,577 3,236 19,651UnknownTotal 36,316 121,622 266,231 23,054 26,857 474,079
2008 Aerial Waterfowl Summary
1999 Aerial Waterfowl Summary
W:\active\60960494\reports\Monitoring Report #3 (2010 Jan-June)\Appendices\Appendix G Summaries of Aerial Waterfowl Data from spring 1999, 2008, 2009 and 2010.xlsx 2 of 2

WOLFE ISLAND WIND PLANT, POST-CONSTRUCTION FOLLOW-UP PLAN BIRD AND BAT RESOURCES MONITORING REPORT NO. 3, JANUARY - JUNE 2010
Appendix H
Waterfowl Breeding Pairs Survey Results
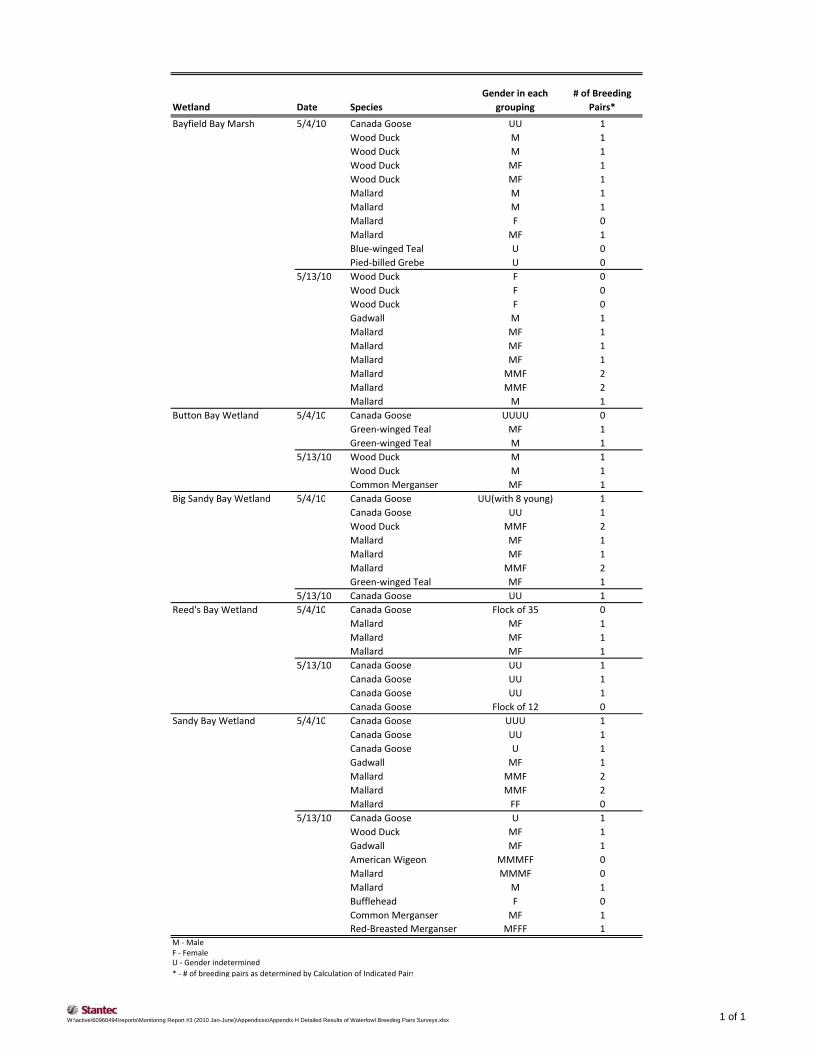
Wetland Date SpeciesGender in each
grouping# of Breeding
Pairs*
Bayfield Bay Marsh 5/4/10 Canada Goose UU 1Wood Duck M 1Wood Duck M 1Wood Duck MF 1Wood Duck MF 1Mallard M 1Mallard M 1Mallard F 0Mallard MF 1Blue‐winged Teal U 0Pied‐billed Grebe U 0
5/13/10 Wood Duck F 0Wood Duck F 0Wood Duck F 0Gadwall M 1Mallard MF 1Mallard MF 1Mallard MF 1Mallard MMF 2Mallard MMF 2Mallard M 1
Button Bay Wetland 5/4/10 Canada Goose UUUU 0Green‐winged Teal MF 1Green‐winged Teal M 1
5/13/10 Wood Duck M 1Wood Duck M 1Common Merganser MF 1
Big Sandy Bay Wetland 5/4/10 Canada Goose UU(with 8 young) 1Canada Goose UU 1Wood Duck MMF 2Mallard MF 1Mallard MF 1Mallard MMF 2Green‐winged Teal MF 1
5/13/10 Canada Goose UU 1Reed's Bay Wetland 5/4/10 Canada Goose Flock of 35 0
Mallard MF 1Mallard MF 1Mallard MF 1
5/13/10 Canada Goose UU 1Canada Goose UU 1Canada Goose UU 1Canada Goose Flock of 12 0
Sandy Bay Wetland 5/4/10 Canada Goose UUU 1Canada Goose UU 1Canada Goose U 1Gadwall MF 1Mallard MMF 2Mallard MMF 2Mallard FF 0
5/13/10 Canada Goose U 1Wood Duck MF 1Gadwall MF 1American Wigeon MMMFF 0Mallard MMMF 0Mallard M 1Bufflehead F 0Common Merganser MF 1Red‐Breasted Merganser MFFF 1
M ‐ MaleF ‐ FemaleU ‐ Gender indetermined* ‐ # of breeding pairs as determined by Calculation of Indicated Pairs
W:\active\60960494\reports\Monitoring Report #3 (2010 Jan-June)\Appendices\Appendix H Detailed Results of Waterfowl Breeding Pairs Surveys.xlsx 1 of 1

WOLFE ISLAND WIND PLANT, POST-CONSTRUCTION FOLLOW-UP PLAN BIRD AND BAT RESOURCES MONITORING REPORT NO. 3, JANUARY - JUNE 2010
Appendix I
Grassland Breeding Bird Survey Results

Detailed Results of Grassland Area Searches
Table 1: Summary of Grassland Species Observations in Southeast Area Search
Southeast Area SearchSector 1 2 3 4 5 6 7 8 9 10 11 12 Totals Density
Habitat (area in ha) Pasture (11.1) Density Hay (15.1) Density Wheat (7.6) Density Pasture (46.5) Density Hay (8.4) Density Hay (10.6) Density Pasture (24.2) Density Pasture (19.0) Density Barnyard (6.3) Density Hay (24.4) Density Hay (11.4) Density Wheat (22.9) DensityDates 3-Jun 14-Jun (pair/10ha) 3-Jun 14-Jun (pair/10ha) 3-Jun 14-Jun (pair/10ha) 3-Jun 14-Jun (pair/10ha) 3-Jun 14-Jun (pair/10ha) 4-Jun 18-Jun (pair/10ha) 3-Jun 14-Jun (pair/10ha) 3-Jun 14-Jun (pair/10ha) 3-Jun 14-Jun (pair/10ha) 3-Jun 14-Jun (pair/10ha) 3-Jun 14-Jun (pair/10ha) 3-Jun 14-Jun (pair/10ha) round 1 round 2 Max (pairs/10ha)
BIRDSNorthern Harrier 1 0.9 0.0 0.0 1 0.2 0.0 0.0 0.0 1 0.5 0.0 0.0 0.0 0.0 1 2 2 0.10Killdeer 1 0.9 0.0 1 1 1.3 1 2 0.4 0.0 0.0 0.0 1 0.5 1 1 1.6 0.0 0.0 0.0 4 5 5 0.26Upland Sandpiper 2 1.8 0.0 0.0 0.0 0.0 0.0 0.0 0.0 0.0 0.0 0.0 0.0 0 2 2 0.10Wilson's Snipe 0.0 0.0 0.0 0.0 0.0 0.0 0.0 0.0 0.0 0.0 0.0 0.0 0 0 0 0.00Eastern Kingbird 1 1 0.9 0.0 0.0 2 0.4 0.0 0.0 2 4 1.7 1 0.5 0.0 0.0 1 0.9 0.0 6 6 6 0.31Horned Lark 0.0 0.0 1 3 4.0 0.0 0.0 0.0 0.0 0.0 0.0 0.0 0.0 0.0 1 3 3 0.15Field Sparrow 0.0 0.0 0.0 0.0 0.0 0.0 0.0 0.0 0.0 0.0 0.0 0.0 0 0 0 0.00Vesper Sparrow 0.0 0.0 0.0 0.0 0.0 0.0 0.0 0.0 0.0 0.0 0.0 0.0 0 0 0 0.00Savannah Sparrow 7 10 9.0 12 12 7.9 5 5 6.6 42 36 9.0 8 7 9.5 7 28 26.5 29 37 15.3 23 29 15.3 4 7 11.2 11 7 8.9 7 4 6.2 12 8 5.2 167 190 190 9.72Grasshopper Sparrow 0.0 0.0 0.0 3 0.6 0.0 0.0 0.0 0.0 0.0 0.0 0.0 0.0 3 0 3 0.15Bobolink 13 14 12.6 17 18 11.9 0.0 44 49 10.5 17 8 20.2 19 3 18.0 26 31 12.8 26 9 13.7 0.0 13 12 10.5 8 11 9.7 0.0 183 155 183 9.36Eastern Meadowlark 3 1 2.7 2 1.3 0.0 4 1 0.9 2 1 2.4 2 1.9 6 2 2.5 1 1 0.5 1 1 1.6 2 1.6 1 0.9 0.0 24 7 24 1.23
Table 2: Summary of Grassland Species Observations in Northwest Area Search
Northwest Area SearchSector 1 2 3 4 5 Totals Density
Habitat (area in ha)Tall Grass
(19.6)Tall Grass
(20.7) Density Fallow (28.7) Density Hay (13.1) Density Plowed (24.4) Density Hay (16.4) Density Hay (25.8) Density Hay (33.4) Density Hay (37.2) DensityDates 1-Jun 17-Jun (pair/10ha) 1-Jun 17-Jun (pair/10ha) 1-Jun 17-Jun (pair/10ha) 31-May 17-Jun (pair/10ha) 31-May 15-Jun (pair/10ha) 31-May 15-Jun (pair/10ha) 31-May 15-Jun (pair/10ha) 31-May 15-Jun (pair/10ha) round 1 round 2 Max (pairs/10ha)
BIRDSNorthern Harrier 0.0 0.0 0.0 0.0 1 0.6 0.0 1 0.3 1 1 0.3 2 2 2 0.1Killdeer 0.0 3 1.0 0.0 3 1 1.2 0.0 0.0 1 0.3 2 0.5 5 5 5 0.3Upland Sandpiper 1 1 0.5 2 0.7 1 0.8 2 3 1.2 1 0.6 1 1 0.4 1 1 0.3 0.0 6 9 9 0.5Wilson's Snipe 0.0 0.0 0.0 0.0 0.0 0.0 0.0 0.0 0 0 0 0.0Eastern Kingbird 3 1.4 1 0.3 1 0.8 0.0 1 0.6 1 0.4 2 0.6 2 0.5 10 1 10 0.5Horned Lark 0.0 3 1.0 0.0 5 3 2.0 0.0 0.0 0.0 0.0 5 6 6 0.3Field Sparrow 0.0 0.0 0.0 0.0 0.0 0.0 0.0 0.0 0 0 0 0.0Vesper Sparrow 0.0 0.0 0.0 0.0 0.0 0.0 0.0 0.0 0 0 0 0.0Savannah Sparrow 11 9 5.3 25 18 8.7 16 3 12.3 7 9 3.7 38 30 23.2 91 49 35.2 55 56 16.8 59 93 25.0 302 267 302 15.1Grasshopper Sparrow 0.0 0.0 0.0 0.0 0.0 0.0 0.0 2 1 0.5 2 1 2 0.1Bobolink 32 32 15.5 0.0 23 16 17.6 0.0 47 34 28.7 63 72 27.9 85 78 25.4 81 89 23.9 331 321 331 16.6Eastern Meadowlark 1 0.5 0.0 1 0.8 0.0 0.0 1 0.4 0.0 1 1 0.3 4 1 4 0.2
Table 3: Summary of all species observed in both the Southeast and Northwest Area Searches
Southeast Area Search Northwest Area SearchRound 1 Round 2 MAX Density (pairs/10ha) Round 1 Round 2 MAX Density (pairs/10ha)
Canada Goose 8 8 0.4 52 52 2.6Gadwall 1 1 0.1 1 1 0.1Mallard 5 1 5 0.3 0 0.0Wild Turkey 0 0.0 6 6 0.3Common Loon 0 0.0 1 1 0.1Double-crested Cormorant 0 0.0 1 1 0.1Great Blue Heron 3 2 3 0.2 0 0.0Northern Harrier 1 2 2 0.1 2 2 2 0.1Red-tailed Hawk 1 1 0.1 1 1 0.1American Kestrel 1 1 0.1 0 0.0Killdeer 4 5 5 0.3 5 5 5 0.3Upland Sandpiper 2 2 0.1 6 9 9 0.5Spotted Sandpiper 0 0.0 1 1 1 0.1Ring-billed Gull 13 13 0.7 28 28 1.4Mourning Dove 3 1 3 0.2 7 7 0.4Willow Flycatcher 2 1 2 0.1 1 1 0.1Eastern Kingbird 6 6 6 0.3 10 1 10 0.5Warbling Vireo 2 1 2 0.1 3 1 3 0.2American Crow 1 1 1 0.1 0 0.0Horned Lark 1 3 3 0.2 5 6 6 0.3Tree Swallow 4 4 0.2 1 7 7 0.4Barn Swallow 5 7 7 0.4 2 1 2 0.1House Wren 1 1 0.1 0 0.0American Robin 15 10 15 0.8 25 21 25 1.3Gray Catbird 0 0.0 1 1 0.1European Starling 10 6 10 0.5 0 0.0Yellow Warbler 8 9 9 0.5 14 12 14 0.7Common Yellowthroat 4 2 4 0.2 1 1 0.1Savannah Sparrow 167 190 190 9.7 302 267 302 15.1Grasshopper Sparrow 3 3 0.2 2 1 2 0.1Song Sparrow 8 5 8 0.4 17 2 17 0.9Bobolink 183 165 183 9.4 331 321 331 16.6Red-winged Blackbird 133 116 133 6.8 153 120 153 7.7Eastern Meadowlark 24 7 24 1.2 4 1 4 0.2Common Grackle 3 1 3 0.2 2 2 0.1Brown-headed Cowbird 0 0.0 8 1 8 0.4Baltimore Oriole 2 2 0.1 3 3 0.2American Goldfinch 2 6 6 0.3 4 4 0.2Visitor; not anticipated to be breeding in the searched area.
6 7 8
W:\active\60960494\reports\Monitoring Report #3 (2010 Jan-June)\Appendices\Appendix I Detailed Results of Grassland Area Searches.xlsx 1 of 1

WOLFE ISLAND WIND PLANT, POST-CONSTRUCTION FOLLOW-UP PLAN BIRD AND BAT RESOURCES MONITORING REPORT NO. 3, JANUARY - JUNE 2010
Appendix J
Woodland Breeding Bird Survey Results

Woodland Area Search Species List
COMMON NAME SCIENTIFIC NAMEPre-construction
(2008)Post-construction
(2010)ONTARIO
STATUS
GLOBAL
STATUS COSSARO COSEWIC
AREA
(ha) REGION
Local Status
PIF Priority
Species COMMENTS
Area
Sensitive
Reference
Canada Goose Branta canadensis X X S5 G5Wood Duck Aix sponsa X S5 G5Mallard Anas platyrhynchos X X S5 G5Ring-necked Pheasant Phasianus colchicus X SNA G5Wild Turkey Meleagris gallopava X X S5 G5Wilson's Snipe Gallinago delicata X X S5B G5American Woodcock Scolopax minor X S4B G5Mourning Dove Zenaida macroura X X S5 G5Yellow-billed Cuckoo Coccyzus americanus X S4B G5Black-billed Cuckoo Coccyzus erythropthalmus X S5B G5 XRuby-throated Hummingbird Archilochus colubris X S5B G5Red-bellied Woodpecker Melanerpes carolinus X S4 G5Downy Woodpecker Picoides pubescens X X S5 G5Northern Flicker Colaptes auratus X X S4B G5 XPileated Woodpecker Dryocopus pileatus X S5 G5 30-50* Naylor et al., 1996Eastern Wood-Pewee Contopus virens X X S4B G5 XWillow Flycatcher Empidonax traillii X S5B G5 XLeast Flycatcher Empidonax minimus X X S4B G5Great Crested Flycatcher Myiarchus crinitus X X S4B G5Eastern Kingbird Tyrannus tyrannus X X S4B G5 XWarbling Vireo Vireo gilvus X X S5B G5Red-eyed Vireo Vireo olivaceus X X S5B G5Blue Jay Cyanocitta cristata X X S5 G5American Crow Corvus brachyrhynchos X X S5B G5Tree Swallow Tachycineta bicolor X X S4B G5Black-capped Chickadee Poecile atricapillus X X S5 G5White-breasted Nuthatch Sitta carolinensis X X S5 G5 10House Wren Troglodytes aedon X X S5B G5Blue-gray Gnatcatcher Polioptila caerulea X S4B G5 30Veery Catharus fuscescens X X S4B G5 10-20Wood Thrush Hylocichla mustelina X X S4B G5 XAmerican Robin Turdus migratorius X X S5B G5Gray Catbird Dumetella carolinensis X X S4B G5Brown Thrasher Toxostoma rufum X X S4B G5 XEuropean Starling Sturnus vulgaris X X SNA G5Cedar Waxwing Bombycilla cedrorum X X S5B G5Yellow Warbler Dendroica petechia X X S5B G5Chestnut-sided Warbler Dendroica pensylvanica X S5B G5American Redstart Setophaga ruticilla X S5B G5 20-30Northern Waterthrush Seiurus noveboracensis X S5B G5 20Mourning Warbler Oporornis philadelphia X S4B G5 30Common Yellowthroat Geothlypis trichas X X S5B G5Eastern Towhee Pipilo erythrophthalmus X X S4B G5 XChipping Sparrow Spizella passerina X X S5B G5Field Sparrow Spizella pusilla X X S4B G5 XSong Sparrow Melospiza melodia X X S5B G5Swamp Sparrow Melospiza georgiana X X S5B G5Northern Cardinal Cardinalis cardinalis X X S5 G5Rose-breasted Grosbeak Pheucticus ludovicianus X X S4B G5 XIndigo Bunting Passerina cyanea X X S4B G5Red-winged Blackbird Agelaius phoeniceus X X S5 G5Common Grackle Quiscalus quiscula X X S5B G5
W:\active\60960494\reports\Monitoring Report #3 (2010 Jan-June)\Appendices\Appendix J Woodland Area Search Species Lists.xlsx 1 of 3

Woodland Area Search Species List
COMMON NAME SCIENTIFIC NAMEPre-construction
(2008)Post-construction
(2010)ONTARIO
STATUS
GLOBAL
STATUS COSSARO COSEWIC
AREA
(ha) REGION
Local Status
PIF Priority
Species COMMENTS
Area
Sensitive
Reference
Brown-headed Cowbird Molothrus ater X X S4B G5Baltimore Oriole Icterus galbula X X S4B G5 XAmerican Goldfinch Carduelis tristis X X S5B G5
Explanation of Status and Acronymns
COSSARO: Committee on the Status of Species at Risk in OntarioCOSEWIC: Committee on the Status of Endangered Wildlife in CanadaREGION: Rare in a Site RegionS1: Critically Imperiled—Critically imperiled in the province (often 5 or fewer occurrences) S2: Imperiled—Imperiled in the province, very few populations (often 20 or fewer), S3: Vulnerable—Vulnerable in the province, relatively few populations (often 80 or fewer)S4: Apparently Secure—Uncommon but not rareS5: Secure—Common, widespread, and abundant in the provinceSX: Presumed extirpatedSH: Possibly Extirpated (Historical)SNR: UnrankedSU: Unrankable—Currently unrankable due to lack of information SNA: Not applicable—A conservation status rank is not applicable because the species is not a suitable target for conservation activities.S#S#: Range Rank—A numeric range rank (e.g., S2S3) is used to indicate any range of uncertainty about the status of the species?: Indicates uncertainty in the assigned rankG1: Extremely rare globally; usually fewer than 5 occurrences in the overall rangeG1G2: Extremely rare to very rare globallyG2: Very rare globally; usually between 5-10 occurrences in the overall rangeG2G3: Very rare to uncommon globallyG3: Rare to uncommon globally; usually between 20-100 occurrencesG3G4: Rare to common globallyG4: Common globally; usually more than 100 occurrences in the overall rangeG4G5: Common to very common globallyG5: Very common globally; demonstrably secureT: Denotes that the rank applies to a subspecies or varietyEND: EndangeredTHR: ThreatenedSC: Special Concern2, 3 or NS after a COSEWIC ranking indicates the species is either on Schedule 2, Schedule 3 or No Schedule of the Species At Risk Act (SARA)NAR: Not At RiskIND: Indeterminant, insufficient information to assign statusDD: Data Deficient6: Rare in Site Region 67: Rare in Site Region 7Area: Minimum patch size for area-sensitive species (ha)H- highly significant in Hamilton Region (i.e. rare)m- moderately significant in Hamilton Region (i.e. uncommon)L1- extremely rare locally (Toronto Region)L2- very rare locally (Toronto Region)L3- rare to uncommon locally (Toronto Region)HR- rare in Halton Region, highly significantHU- uncommon in Halton Region, moderately significant* The Pileated Woodpecker will incorporate smaller woodlots into its homerange, therefore it may not be a true area-sensitive species (Naylor et al. 1996)
LATEST STATUS UPDATE
W:\active\60960494\reports\Monitoring Report #3 (2010 Jan-June)\Appendices\Appendix J Woodland Area Search Species Lists.xlsx 2 of 3

Woodland Area Search Species List
COMMON NAME SCIENTIFIC NAMEPre-construction
(2008)Post-construction
(2010)ONTARIO
STATUS
GLOBAL
STATUS COSSARO COSEWIC
AREA
(ha) REGION
Local Status
PIF Priority
Species COMMENTS
Area
Sensitive
Reference
Butterflies: September, 2009Reptiles: September, 2009Birds: September, 2009Mammals: September, 2009S and G ranks and explanations: September, 2009
NOTE
All rankings for birds refer to breeding birds unless the ranking is followed by N
REFERENCES
COSSARO Status
Endangered Species Act, 2007 (Bill 184). Schedules 1- 5. June 30 2008.
COSEWIC Status
COSEWIC. 2007. Canadian Species at Risk. Committee on the Status of Endangered Wildlife in Canada. September 11, 2007 with updates from COSEWIC Assessments November 2007, April 2008
Local Status
Dwyer, Jill K. 2003. Nature Counts Project Hamilton Natural Areas Inventory 2003. Species Checklists. Hamilton Naturalists Club.Halton Natural Areas Inventory 2006: Volume 2 Species Checklists (ISBN 0-9732488-7-4)
Region of Waterloo. 1996. Regionally Significant Breeding Birds.TRCA. 2003. Revised Fauna Scores and Ranks, February 2003. Toronto Region Conservation Authority.
Area-sensitive information
Austen, M.J.W., M.D. Cadman, and R.D. James. 1994. Ontario birds at risk: status and conservation needs. Toronto and Port Rowan, ON: Federation of Ontario Naturalists and Long Point Bird Observatory. 165 pp.Dunn, Erica H. and David J. Agro. 1995. Black Tern (Chlidonias niger), The Birds of North America Online (A. Poole, Ed.). Ithaca: Cornell Lab of Ornithology; Retrieved from the Birds of North America Online: http://bna.birds.cornell.edu/bna/species/147Herkert, J.R. 1991. An ecological study of the breeding birds of grassland habitats within Illinois. Ph.D. dissertation. University of Illinois, Urbana, IL. 112 pp.Hejl, S.J., J.A. Holmes, and D.E. Kroodsma. 2002. Winter Wren (Troglodtyes troglodytes). In Poole, A., and F. Gill, eds. The birds of North America, No. 623. Philadelphia, PA: The Birds of North America, Inc. 31 pp.Naylor, B. J., J. A. Baker, D. M. Hogg, J. G. McNicol and W. R. Watt. 1996. Forest Management Guidelines for the Provision of Pileated Woodpecker Habitat. Ontario Ministry of Natural Resources, Forest Management Branch, Sault Ste. Marie, Ontario. 26 pp.
Sandilands. A. 2005. Birds of Ontario. Habitat Requirements, Limiting Factors and Status. UBC Press.
Ontario Partners in Flight. 2006. Ontario Landbird Conservation Plan: Lower Great Lakes/St. Lawrence Plain (North American Bird Conservation Region 13), Priorities, Objectives and Recommended Actions. Environment Canada and Ontario Ministry of Natural Resources. Draft, February 2006.
Robbins, C.S. 1979. Effect of forest fragmentation on bird populations. Pp. 198-212 in DeGraaf, R.M., and K.E. Evans, eds. Management of northcentral and northeastern forests for nongame birds. United States Department of Agriculture, Forest Service General Technical Report NC-51. 268 pp.
W:\active\60960494\reports\Monitoring Report #3 (2010 Jan-June)\Appendices\Appendix J Woodland Area Search Species Lists.xlsx 3 of 3

WOLFE ISLAND WIND PLANT, POST-CONSTRUCTION FOLLOW-UP PLAN BIRD AND BAT RESOURCES MONITORING REPORT NO. 3, JANUARY - JUNE 2010
Appendix K
Notifications and Agency Responses