
with sign Farah Amin Thesis PhD 2018
171
Ph.D. Thesis BIOSORPTION OF TOXIC METALS AND ANIONS FROM AQUEOUS SOLUTIONS BY FUNGAL BIOMASS THESIS SUBMITTED TOWARDS THE PARTIAL FULFILMENT OF THE REQUIREMENT OF THE UNIVERSITY OF SINDH, FOR THE AWARD OF DOCTOR OF PHILOSOPHY DEGREE IN ANALYTICAL CHEMISTRY FARAH AMIN National Centre of Excellence in Analytical Chemistry University of Sindh, Jamshoro Pakistan 2018
Transcript of with sign Farah Amin Thesis PhD 2018

Ph.D. Thesis
BIOSORPTION OF TOXIC METALS AND ANIONS FROM
AQUEOUS SOLUTIONS BY FUNGAL BIOMASS
THESIS SUBMITTED TOWARDS THE PARTIAL FULFILMENT OF THE
REQUIREMENT OF THE UNIVERSITY OF SINDH, FOR THE AWARD OF
DOCTOR OF PHILOSOPHY DEGREE IN ANALYTICAL CHEMISTRY
FARAH AMIN
National Centre of Excellence in Analytical Chemistry
University of Sindh, Jamshoro Pakistan
2018
I
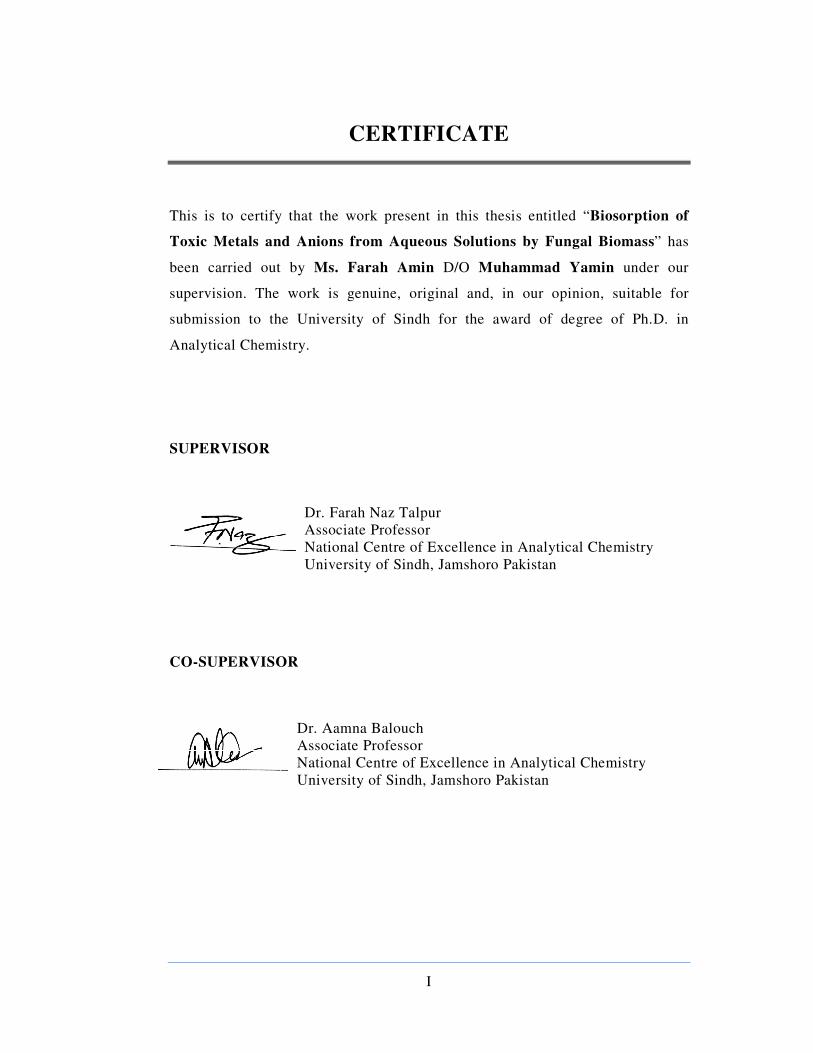
CERTIFICATE
This is to certify that the work present in this thesis entitled “Biosorption of
Toxic Metals and Anions from Aqueous Solutions by Fungal Biomass” has
been carried out by Ms. Farah Amin D/O Muhammad Yamin under our
supervision. The work is genuine, original and, in our opinion, suitable for
submission to the University of Sindh for the award of degree of Ph.D. in
Analytical Chemistry.
SUPERVISOR
Dr. Farah Naz Talpur
Associate Professor
National Centre of Excellence in Analytical Chemistry
University of Sindh, Jamshoro Pakistan
CO-SUPERVISOR
Dr. Aamna Balouch
Associate Professor
National Centre of Excellence in Analytical Chemistry
University of Sindh, Jamshoro Pakistan

II
DEDICATION
With profound love and deep respect, I dedicate the honor of this Degree to my
beloved Father, Mother, Sister and Brothers; whose affection, love,
encouragement and prays are always with me.
III
ACKNOWLEDGEMENTS
I owe my profound thanks to ALLAH (Subhanahu Wa Ta'ala), Who blessed me
with an opportunity for Ph.D. and gave me the strength, determination and
ability to complete this research project. All of my veneration and devotion goes to
our beloved Prophet Muhammad (Peace Be Upon Him) the source of humanity,
kindness and guidance for the whole creatures and who declared it an obligatory duty
of every Muslim to seek and acquire knowledge.
It seems an obligation upon me to record the word of encouragement for my family
and simple words of thankfulness would not cover the genuine affection, absolute
support, remarkable encouragement and profound prayers of my respectable father
Muhammad Yamin Khan and beloved Mother.
I wish to express my deep sense of gratitude to my supervisors Dr. Farah Naz
Talpur & Dr. Aamna Balouch for their guidance, valuable suggestions and
generous co-operation at every stage of this work, without which this work
would not have been possible.
I would like to extend my gratitude to Dr. Muhammad Aqeel Bhutto (Institute of
Biotechnology and Genetic Engineering, University of Sindh Jamshoro, Pakistan) for
providing fungal biomass to carry out this research successfully and for his advices
during the work. I am thankful to Dr. Zaheer Ahmed Chandio (Dr. M. A. Kazi
Institute of Chemistry, University of Sindh Jamshoro, Pakistan) for his sincere
guidance during AAS analysis. I am also greatly thankful to Prof. Dr. Muhammad
Raza Shah (International Center for Chemical and Biological Sciences, H.E.J.
Research Institute of Chemistry University of Karachi) for AFM analysis and Mr.
Muhammad Kashif Samoon (Centre for Pure and Applied Geology, University of
Sindh, Jamshoro, Pakistan) for SEM-EDX analysis. I am thankful to Director,
NCEAC, Prof. Dr. Shahbuddin Memon, for providing the working facilities and
excellent research environment. All Academic Staff of the Centre is also appreciated
for knowledge exchange and providing their help when needed. My Lab Fellows,
Friends and all Colleagues who provided me good company during the course of my
research work are highly anticipated.
I would not have been able to complete this endeavor without the support,
prayers and love of my family (sister and brothers).
Finally, and most of all I would like to thank my maternal uncle Dr. Shah
Nawab Khan for his everlasting encouragement at every moment of life.
Farah Amin

IV
ABSTRACT
Environmental pollution is becoming a serious and challenging problem all over
the world because of high level of industrial development and growth. Various
industries discharge toxic heavy metals and anions into the environment that
considerably enhanced the humiliation of marine environment and significantly
threats the ecosystem. These unwanted chemicals cause severe health problems,
when they exceed the tolerance limit in water. For this reason, the removal of
toxic pollutants is the greatest challenge. Biosorption method based on
utilization of microorganisms has been given a significant attention due to
efficient, rapid, easier, less expensive and environment friendly properties of
biosorbent material for the removal of toxins from aqu eous solution.
Owing to the significance of biosorption technique, the projected work is based
upon the biological preparation of environmental friendly fungal biomass
Pleurotus eryngii (P. eryngii) and their exploitation for the removal of selected
toxic metal ions (Pb, Cd, Hg) and anions (F-, NO3-) from aqueous system. Before
and after sorption the biomass were characterized by FTIR, AFM, SEM and EDX
techniques to verify surface functionality and morphology, whereas the surface
chemistry charge studies (pHPZC) were carried out to measure the approx. pH at
which biosorbent behave as cationic, anionic and neutral species. After
optimization of experimental variables (concentration, time, temperature),
isotherm (Langmuir, Freundlich, Temkin, D-R models), kinetic (Pseudo first,
Pseudo second, Intra particle diffusion models) and thermodynamic (enthalpy,
entropy, Gibbs free energy) parameters were calculated. The presence of
interfering ions during biosorption and re-usability studies after appropriate
desorption were carried out. Response Surface Methodology (RSM) was also
employed in selected part of the studies to decrease the number of experiments,
improved product yields and reduced treatment time and overall research cost.
For the application of P. eryngii on real water samples; toxic pollutant (metals /
anions) contaminated samples were collected from river, canal, lake and streams
of Sindh, Pakistan. It was evaluated that under optimal conditions (at natural pH

V
values) selected ions were removed effectively underneath the permissible limits
of World Health Organization (WHO) drinking water standards.
Briefly, for 30 mg L-1 Pb(II) ions 100% removal with sorption capacity of 2.971
mg g-1 was successfully achieved within 5 min at optimum pH 6.0 and 0.35 g
sorbent dose. The results following the Langmuir isotherm, pseudo second order
kinetic model and were thermodynamically feasible at temperature 30°C. Overall
elution of Pb ions achieved from the biomass utilizing 0.1 N HCl solution. Field test
results established effectiveness of P. eryngii biomass for the decontamination of
Pb(II) ions from drinking water.
Similarly, for Cd(II) ion removal 99.9% results were achieved at pH 5.0, dosage
0.2 g, concentration 20 mg L-1, time 10 min and temperature 50°C. A favorable
biosorbent capacity of 1.51 mg g−1 was achieved that indicated a good capability
of P. eryngii biomass. The sorption efficiency decreased from 99.99 to 56.89 %
as the biomass was re-cycled up to 5 times. However, the efficiency of Cd(II)
removal from real water samples still lies between 85 to 90%.
Correspondingly, the sorption process was relatively fast and > 98% removal of
Hg(II) was achieved within 5 min at pH 7.0 with 34.01 mg g-1 biosorption
capacity. The Langmuir isotherm and pseudo-second order were the best
applicable models to describe the sorption process. The sorption process was
exothermic and spontaneous by increased randomness at the solid-solution
interface. The adsorbed Hg(II) ions easily desorbed using 5 M HCl solution with
higher effectiveness and can be reused up to five cycles. Different
electronegative functionalities involve in the binding of Hg(II) metal ions on the
surface as evident by various characterization techniques. The study revealed
considerable potential of biosorbent for its exploitation in the treatment of
industrial effluents containing Hg(II) ion contamination.
In further study, toxic anions were selected for the biosorption by white - rot
fungal biosorbent P. eryngii. More than 96% removal of F- was achieved at
optimum conditions (pH: 2.0; biosorbent dose: 0.2 g; initial concentration: 5.0
mg L−1; temperature: 30°C; agitation: 100 rpm). Langmuir model with 66.6 mg

VI
g-1 biosorption capacity fitted the equilibrium data better and followed well
pseudo-second order model; while intra particle diffusion was not by any means
the only rate-controlling step. The biosorbent was multiple times reusable and
showed slight decrease in sorption efficiency in presence of foreign impurities.
The application of fungal biomass on F- removal showed satisfactory
performance on water samples collected from a fluoride-endemic area.
A three level, three factors Central Composite Design (CCD) was used to
evaluate the effects and interactions of the process variables removal of NO3-
ions from aqueous solution onto P. eryngii dried fungal biosorbent. ANOVA, F-
test, Student’s t-test and lack of fit test showed that NO3- ions biosorption is only
slightly concentration dependent, but markedly increases with solution pH and
biosorbent dose. The optimum pH (7.0), biosorbent dose (0.24 g) and initial
concentration (700.0 mg L-1) were found by desirability function. Under these
optimum combinations of process parameter conditions, maximum removal of
88.38% was obtained that assisting its use in larger scale.
In final approach of this bio-analytical study, the fungal biomass packed in a
mini glass column was used to remove one of the selected ion (Pb) from water.
After studying the column performance parameters (initial concentration: 20 mg
L-1, flow rate: 1 ml min-1, bed height: 3 cm) maximum Thomas model entrapping
capacity of 3.30 mg g-1 at pH 7.0 was obtained. A laboratory column evaluation
on real contaminated samples also evident the applicability of sorption column
on commercial scale.
Hence, the results indicated that P. eryngii is a good biosorbent for removal of
heavy metals and anions from polluted water. In addition, the spent fungal
biomass can be easily disposed of and can be used as an alternative raw material
for large scale composting process.

VII
TABLE OF CONTENTS
CERTIFICATE...............................................................................................I
DEDICATION ............................................................................................. II
ACKNOWLEDGEMENTS ........................................................................... III
ABSTRACT ................................................................................................ IV
TABLE OF CONTENTS ............................................................................. VII
LIST OF TABLES .................................................................................... XIII
LIST OF FIGURES ..................................................................................... XV
ABBREVIATIONS ................................................................................... XIX
CHAPTER 1 .................................................................................................. 1
INTRODUCTION ......................................................................................... 1
1.1 MOTIVATION................................................................................................ 1
1.2 CONTRIBUTIONS OF THE THESIS .................................................................... 1
1.3 ENVIRONMENTAL POLLUTION ....................................................................... 2
1.3.1 POLLUTION IN AQUEOUS SOLUTIONS ....................................................... 3
1.3.2 HEAVY METAL POLLUTION ...................................................................... 3
1.3.3 ANIONIC POLLUTION............................................................................... 5
1.4 CONVENTIONAL TECHNIQUES USED FOR THE REMOVAL OF TOXIC METALS AND
ANIONS FROM AQUEOUS SOLUTIONS ....................................................................... 7
1.4.1 CHEMICAL PRECIPITATION ...................................................................... 7
1.4.2 ELECTRO-DIALYSIS ................................................................................ 7
1.4.3 REVERSE OSMOSIS .................................................................................. 7
1.4.4 ION-EXCHANGE ...................................................................................... 8
1.4.5 ULTRA-FILTRATION ................................................................................ 8
1.4.6 ADSORPTION .......................................................................................... 8
1.5 THE REQUIREMENT OF NOVEL INNOVATION FOR THE REMOVAL OF TOXIC
METALS AND ANIONS.............................................................................................. 9
1.5.1 HISTORY OF BIOSORPTION ...................................................................... 9
1.5.2 ADVANTAGES OF BIOSORPTION TECHNIQUE ........................................... 10
1.5.3 BIOSORBENTS / BIOLOGICAL MATERIAL / BIOMASS................................. 10
1.6 EXPECTED MECHANISMS INVOLVE IN BIOSORPTION ..................................... 11
1.6.1 METABOLISM DEPENDENT .................................................................... 11

VIII
1.6.2 NON-METABOLISM DEPENDENT ............................................................. 11
1.6.3 EXTRA CELLULAR ACCUMULATION / PRECIPITATION .............................. 11
1.6.4 CELL SURFACE SORPTION / PRECIPITATION ............................................ 12
1.6.5 INTRACELLULAR ACCUMULATION / COMPLEXATION .............................. 12
1.6.6 ION EXCHANGE ..................................................................................... 12
1.6.7 PHYSICAL ADSORPTION ........................................................................ 12
1.7 FACTORS AFFECTING BIOSORPTION ............................................................. 12
1.7.1 PH ....................................................................................................... 12
1.7.2 BIOMASS CONCENTRATION ................................................................... 13
1.7.3 TEMPERATURE ..................................................................................... 13
1.7.4 INTERFERING IONS ................................................................................ 13
1.8 DESORPTION .............................................................................................. 13
1.9 CHOICE OF TOXIC METAL AND ANION FOR BIOSORPTION PROCESS ................ 13
1.10 EVALUATION OF BIOSORPTION PROCESS ...................................................... 14
1.11 ISOTHERM STUDY (BIOSORPTION ISOTHERMS) ............................................. 14
1.11.1 LANGMUIR SORPTION ISOTHERM ........................................................... 14
1.11.2 FREUNDLICH SORPTION ISOTHERM ........................................................ 15
1.11.3 TEMKIN SORPTION ISOTHERM................................................................ 15
1.11.4 D-R SORPTION ISOTHERM ..................................................................... 16
1.12 KINETIC STUDY (BIOSORPTION KINETIC ISOTHERMS) ................................... 17
1.12.1 LAGERGREN’S PSEUDO FIRST ORDER KINETIC MODEL ............................. 17
1.12.2 HO-MCKAY’S PSEUDO SECOND ORDER KINETIC MODEL ......................... 17
1.12.3 WEBER AND MORRIS INTRA PARTICLE DIFFUSION MODEL ...................... 18
1.13 THERMODYNAMIC STUDY ........................................................................... 18
1.14 STATISTICAL DESIGN OF EXPERIMENT ......................................................... 19
1.15 COLUMN MODELS ....................................................................................... 20
1.15.1 THOMAS MODEL ................................................................................... 20
1.15.2 BDST MODEL ........................................................................................ 20
1.16 AIM AND OBJECTIVES OF PRESENT STUDY ................................................... 21
1.17 STRUCTURE OF THE THESIS ......................................................................... 22
CHAPTER 1 INTRODUCTION .......................................................................... 22
CHAPTER 2 LITERATURE REVIEW .................................................................. 22
CHAPTER 3 RESEARCH METHODOLOGY ......................................................... 22
CHAPTER 4 RESULTS AND DISCUSSION .......................................................... 23
CHAPTER 5 CONCLUSION .............................................................................. 23
CHAPTER 2 ................................................................................................ 24

IX
LITERATURE REVIEW .............................................................................. 24
2.1 SYNTHETIC ADSORBENTS USED FOR THE REMOVAL OF METALS AND ANIONS 24
2.2 NATURAL BIOSORBENTS FOR THE REMOVAL OF METALS AND ANIONS .......... 24
2.3 REMOVAL OF TOXIC METALS BY VARIOUS BIOSORBENTS ............................. 25
2.3.1 BACTERIAL BIOSORBENTS ..................................................................... 25
2.3.2 ALGAL BIOSORBENTS ........................................................................... 27
2.3.3 YEAST BIOSORBENTS ............................................................................ 28
2.4 FUNGAL BIOMASS AS NATURAL BIOSORBENT FOR METAL ION REMOVAL ....... 30
2.5 REMOVAL OF ANIONS BY VARIOUS BIOSORBENT .......................................... 31
2.6 PLEUROTUS ERYNGII – A COMMON EDIBLE MACROFUNGI .............................. 33
2.6.1 PHYSICAL DESCRIPTION ........................................................................ 33
2.6.2 GROWTH HABIT .................................................................................... 33
2.6.3 SCIENTIFIC CLASSIFICATION OF P. ERYNGII ............................................ 34
2.6.4 EFFECTIVENESS OF P. ERYNGII AS BIOSORBENT ...................................... 34
2.7 SUMMARY .................................................................................................. 34
CHAPTER 3 ................................................................................................ 36
RESEARCH METHODOLOGY ................................................................... 36
3.1 CHEMICALS AND REAGENTS ....................................................................... 36
3.2 FUNGAL STRAIN ......................................................................................... 36
3.2.1 INOCULUM PREPARATION ..................................................................... 36
3.2.2 DRIED BIOSORBENT PREPARATION ........................................................ 37
3.2.3 PREPARATION OF BIOSORBENT IN DIFFERENT FORMS ............................. 38
3.3 PREPARATION OF STANDARD SOLUTIONS .................................................... 38
3.4 ANALYTICAL INSTRUMENTATION ................................................................ 39
3.5 POINT OF ZERO CHARGE (PHPZC) .................................................................. 41
3.6 BATCH BIOSORPTION EXPERIMENT .............................................................. 41
3.7 CONTINUOUS (PACKED COLUMN) BIOSORPTION EXPERIMENT ....................... 42
3.8 INTERFERENCE STUDIES ............................................................................. 43
3.9 DESORPTION STUDIES ................................................................................. 43
3.10 STATISTICAL METHODOLOGY FOR NO3- IONS ............................................... 43
3.11 CALCULATION OF DATA .............................................................................. 44
3.12 ANALYSIS OF COLUMN DATA ...................................................................... 45
3.13 STATISTICAL ANALYSIS .............................................................................. 45
3.14 REAL WATER SAMPLE FOR ANALYTICAL APPLICATION ................................. 46
CHAPTER 4 ................................................................................................ 48
X
RESULTS AND DISCUSSION .................................................................... 48
4.1 ECO-EFFICIENT FUNGAL BIOMASS FOR THE REMOVAL OF PB(II) IONS FROM
WATER SYSTEM: A SORPTION PROCESS AND MECHANISM ....................................... 48
4.1.1 CHARACTERIZATION OF THE BIOSORBENT ............................................. 48
4.1.2 OPTIMIZATION OF EXPERIMENTAL PARAMETERS .................................... 50
4.1.3 INVESTIGATION OF INTERFERING IONS ................................................... 60
4.1.4 DESORPTION OF PB(II) IONS AND RE-USABILITY OF SPENT BIOMASS ....... 61
4.1.5 ANALYTICAL APPLICATION ................................................................... 62
4.1.6 SUMMARY ............................................................................................ 62
4.2 UTILIZATION OF P. ERYNGII BIOSORBENT AS AN ENVIRONMENTAL BIOREMEDY
FOR THE DECONTAMINATION OF TRACE CD(II) IONS FROM WATER SYSTEM ............ 64
4.2.1 CHARACTERIZATION OF THE BIOSORBENT ............................................. 64
4.2.2 OPTIMIZATION OF BIOSORPTION EXPERIMENTAL PARAMETERS ............... 67
4.2.3 BIOSORPTION ISOTHERM STUDIES ......................................................... 71
4.2.4 THERMODYNAMIC PARAMETERS ........................................................... 73
4.2.5 BIOSORPTION KINETIC STUDIES ............................................................. 74
4.2.6 ELUTION OF CD(II) ION AND RE-USABILITY OF BIOSORBENT ................... 77
4.2.7 INFLUENCE OF INTERFERING IONS ......................................................... 78
4.2.8 ANALYTICAL APPLICATION ................................................................... 79
4.2.9 SUMMARY ............................................................................................ 79
4.3 BIOSORPTION OF HG(II) FROM AQUEOUS SOLUTION BY FUNGAL BIOMASS P.
ERYNGII: ISOTHERM, KINETIC AND THERMODYNAMIC STUDIES ............................... 81
4.3.1 CHARACTERIZATION OF THE BIOSORBENT ............................................. 81
4.3.2 EFFECT OF INITIAL PH .......................................................................... 83
4.3.3 EFFECT OF INITIAL BIOMASS CONCENTRATION ....................................... 84
4.3.4 EFFECT OF INITIAL HG(II) CONCENTRATION .......................................... 85
4.3.5 EFFECT OF CONTACT TIME AND TEMPERATURE ...................................... 86
4.3.6 BIOSORPTION ISOTHERMS ..................................................................... 87
4.3.7 BIOSORPTION KINETICS ........................................................................ 89
4.3.8 BIOSORPTION THERMODYNAMICS ......................................................... 91
4.3.9 EFFECT OF CO-EXISTING IONS ............................................................... 92
4.3.10 DESORPTION EFFICIENCY AND REUSABILITY .......................................... 92
4.3.11 ANALYTICAL APPLICATION ................................................................... 94
4.3.12 SUMMARY ............................................................................................ 94
4.4 BIOSORPTION OF F- FROM AQUEOUS SOLUTION BY WHITE - ROT FUNGUS P.
ERYNGII ATCC 90888 ........................................................................................... 96

XI
4.4.1 CHARACTERIZATION OF THE BIOSORBENT ............................................. 96
4.4.2 CALIBRATION OF IC FOR F- ANALYSIS ................................................... 98
4.4.3 INFLUENCE OF PH ................................................................................. 99
4.4.4 INFLUENCE OF INITIAL F- CONCENTRATION ...........................................100
4.4.5 INFLUENCE OF BIOSORBENT DOSE ........................................................101
4.4.6 BIOSORPTION ISOTHERM MODELS .........................................................101
4.4.7 THERMODYNAMIC STUDIES ..................................................................104
4.4.8 KINETIC STUDIES .................................................................................105
4.4.9 EFFECT OF CO-EXISTING ANIONS ON F- BIOSORPTION ............................107
4.4.10 DESORPTION AND REGENERATION OF BIOSORBENT ...............................108
4.4.11 APPLICATION TO REAL WATER SAMPLES ...............................................109
4.4.12 PROPOSED MECHANISM........................................................................111
4.4.13 SUMMARY ...........................................................................................111
4.5 STATISTICAL METHODOLOGY FOR BIOSORPTION OF NO3- IONS FROM AQUEOUS
SOLUTION BY P. ERYNGII FUNGAL BIOMASS ..........................................................113
4.5.1 CHARACTERIZATION OF THE BIOSORBENT ............................................113
4.5.2 CALIBRATION OF UV-VIS SPECTROPHOTOMETER FOR NO3- ANALYSIS ...116
4.5.3 MODEL FITTING AND STATISTICAL ANALYSIS .......................................117
4.5.4 SELECTION OF A MODEL.......................................................................119
4.5.5 NORMAL PROBABILITY PLOT OF RESIDUALS ..........................................122
4.5.6 EFFECT OF INTERACTIVE VARIABLES ....................................................122
4.5.7 VALIDATION OF THE MODEL ................................................................124
4.5.8 SUMMARY ...........................................................................................125
4.6 EFFICIENT ENTRAPPING OF TOXIC LEAD (PB) IONS FROM AQUEOUS SYSTEM ON
FIXED - BED COLUMN OF FUNGAL BIOSORBENT .....................................................126
4.6.1 COLUMN STUDY ..................................................................................126
4.6.2 COMPARISON OF PB(II) IONS SORPTION CAPACITY DURING BATCH AND
COLUMN MODE ...............................................................................................130
4.6.3 APPLICATION OF COLUMN ON REAL CONTAMINATED WATER SAMPLES...131
4.6.4 SUMMARY ...........................................................................................131
CHAPTER 5 .............................................................................................. 132
CONCLUSION AND FUTURE DIRECTIONS ............................................ 132
5.1 CONCLUSION ............................................................................................132
5.2 SIGNIFICANCE OF THIS RESEARCH ..............................................................134
5.3 RECOMMENDATIONS AND FUTURE DIRECTIONS OF THIS RESEARCH WORK ...134

XII
REFERENCES .......................................................................................... 136
LIST OF PUBLICATIONS ......................................................................... 150

XIII
LIST OF TABLES
TABLE 1.1 COMMON SOURCES, HEALTH PROBLEMS AND MAXIMUM ACCEPTABLE CONCENTRATION
LEVEL BY THE WHO OF SOME TOXIC HEAVY METALS ........................................................ 4
TABLE 1.2 COMMON SOURCES, HEALTH PROBLEMS AND MAXIMUM ACCEPTABLE CONCENTRATION
LEVEL BY THE WHO OF SOME TOXIC ANIONS. .................................................................. 6
TABLE 2.1 OVERVIEW OF BIOSORBENTS AND THEIR SORPTION CAPACITIES FOR SELECTED METALS.
................................................................................................................................... 30
TABLE 2.2 MORPHOLOGY OF P. ERYNGII. ................................................................................ 33
TABLE 2.3 SCIENTIFIC CLASSIFICATION OF P. ERYNGII. ............................................................ 34
TABLE 3.1 METHODS FOR THE PREPARATION OF FUNGAL CELL MASS. ....................................... 38
TABLE 3.2 CONDITIONS OF F-AAS FOR PB(II), CD(II) AND HG-AAS FOR HG(II) ...................... 39
TABLE 3.3 CONDITIONS OF IC FOR F- IONS DETERMINATION. .................................................... 40
TABLE 3.4 EXPERIMENTAL CONDITIONS AND THEIR RANGES USED TO OPTIMIZE THE SORPTION
EFFICIENCY OF METALS AND ANIONS. ............................................................................ 41
TABLE 3.5 EXPERIMENTAL RANGES AND LEVEL OF THE INDEPENDENT VARIABLES..................... 44
TABLE 3.6 DETAIL OF WATER COLLECTION SITES AND GPS CO-ORDINATES MONITORED FOR EACH
ZONE. .......................................................................................................................... 47
TABLE 4.1 THERMODYNAMIC PARAMETERS FOR PB(II) IONS REMOVAL BY P. ERYNGII AT VARIOUS
TEMPERATURES. ........................................................................................................... 53
TABLE 4.2 ISOTHERMS MODEL CONSTANTS AND THEIR RESPECTIVE COEFFICIENTS FOR PB(II) IONS
SORPTION ONTO FUNGAL BIOMASS. ................................................................................ 56
TABLE 4.3 COMPARISON OF SORPTION CAPACITIES OF DIFFERENT ADSORBENTS IN THE
LITERATURE WITH THE CURRENT BIOSORBENT. ............................................................... 57
TABLE 4.4 KINETIC PARAMETERS FOR PB(II) BIOSORPTION ON P. ERYNGII. ............................... 59
TABLE 4.5 INVESTIGATION OF INTERFERING IONS EFFECT ON REMOVAL OF PB(II) IONS (INITIAL
CONCENTRATION = 5 MG L-1) BY P. ERYNGII. .................................................................. 60
TABLE 4.6 REMOVAL OF PB(II) IONS FROM NATURAL WATER SAMPLES. .................................... 62
TABLE 4.7 COMPARISON OF MAXIMUM BIOSORPTION CAPACITY OF P. ERYNGII FOR CD(II) WITH
OTHER REPORTED BIOSORBENTS. ................................................................................... 73
TABLE 4.8 THERMODYNAMIC PARAMETERS FOR CD(II) BIOSORPTION ON P. ERYNGII AT VARIOUS
TEMPERATURES. ........................................................................................................... 74
TABLE 4.9 INFLUENCE OF SOME INTERFERING IONS ON BIOSORPTION OF CD(II). ........................ 78
TABLE 4.10 FIELD TRIAL RESULTS OF BIOSORPTION STUDIES USING REAL WATER SAMPLES. ....... 79
TABLE 4.11 SURFACE FUNCTIONALITIES OBSERVED ON FUNGAL BIOSORBENT BY FTIR
SPECTROSCOPY. ........................................................................................................... 83
TABLE 4.12 HG(II) BIOSORPTION: LANGMUIR AND FREUNDLICH ISOTHERM CONSTANTS. ........... 88

XV
TABLE 4.13 COMPARISON OF BIOSORPTION CAPACITY OF P. ERYNGII FUNGAL BIOMASS FOR HG(II)
IONS WITH OTHER REPORTED BIOSORBENTS. ................................................................... 88
TABLE 4.14 KINETIC MODEL PARAMETERS FOR THE BIOSORPTION OF HG(II) IONS BY ................ 90
TABLE 4.15 EFFECT OF SOME INTERFERING IONS ON THE REMOVAL PROCESS OF HG(II) IONS BY P.
ERYNGII. ...................................................................................................................... 92
TABLE 4.16 DESORPTION OF HG(II) IONS BY P. ERYNGII. ......................................................... 93
TABLE 4.17 ADSORPTION-DESORPTION OF HG(II) IONS BY P. ERYNGII USING 5 M HCL .............. 93
TABLE 4.18 ANALYTICAL RESULTS FOR THE BIOSORPTION OF HG(II) IONS IN NATURAL WATER
SAMPLES. .................................................................................................................... 94
TABLE 4.19 LANGMUIR, FREUNDLICH AND D–R ISOTHERM CONSTANTS ..................................103
TABLE 4.20 COMPARISON OF BIOSORPTION CAPACITY OF P. ERYNGII FUNGAL BIOMASS FOR F- ION
WITH OTHER REPORTED BIOSORBENTS...........................................................................103
TABLE 4.21 THEMODYNAMIC PARAMETERS FOR F- BIOSORPTION ON P. ERYNGII AT VARIOUS
TEMPERATURES. ..........................................................................................................105
TABLE 4.22 KINETIC PARAMETERS FOR F- BIOSORPTION ON P. ERYNGII. ...................................106
TABLE 4.23 THE PHYSICO-CHEMICAL PARAMETERS OF REAL WATER SAMPLES. ........................110
TABLE 4.24 FIELD TRIAL RESULTS OF BIOSORPTION STUDIES USING REAL FIELD WATER. ...........110
TABLE 4.25 EXPERIMENTAL DESIGN AND RESULTS FOR BIOSORPTION EFFICIENCY (%) OF NO3- BY
P. ERYNGII. .................................................................................................................118
TABLE 4.26 SELECTION OF A SATISFACTORY MODEL FOR NO3- BIOSORPTION. ..........................119
TABLE 4.27 ANOVA FOR THE RESPONSE SURFACE REDUCED QUADRATIC MODEL. ...................121
TABLE 4.28 CONDITIONS FOR VALIDATION OF THE DESIGN. ....................................................124
TABLE 4.29 THE THOMAS AND BDST MODEL PARAMETERS FOR THE BIOSORPTION OF PB(II) ON
P. ERYNGII FUNGAL BIOMASS. .......................................................................................128
TABLE 4.30 COMPARISON OF PB(II) IONS SORPTION CAPACITY................................................130
TABLE 4.31 REMOVAL OF PB(II) IONS FROM REAL WATER SAMPLES VIA COLUMN METHOD. ......131

XV
LIST OF FIGURES
FIGURE 3.1 (A) P. ERYNGII MAINTAINED ON PDA PLATE. ......................................................... 36
FIGURE 3.2 (B) WET COLONY SUB-CULTURED ON GPB. ........................................................... 37
FIGURE 3.3 (C) DRIED BIOMASS OF P. ERYNGII. ....................................................................... 37
FIGURE 3.4 BIOSORPTION STUDY BY BATCH EXPERIMENTAL PROCEDURE. ................................. 42
FIGURE 3.5 BIOSORPTION STUDY BY COLUMN EXPERIMENTAL PROCEDURE. .............................. 42
FIGURE 3.6 THE MAP OF SINDH SHOWING SAMPLING ZONE IN RED ARROWS. [IMAGE COURTESY:
GOOGLE MAP]. ............................................................................................................. 46
FIGURE 4.1 FTIR SPECTROMETRY OF FUNGAL BIOMASS BEFORE (A) AND AFTER (B) PB(II) IONS
SORPTION. ................................................................................................................... 49
FIGURE 4.2 AFM MICROSCOPIC IMAGES OF FUNGAL BIOMASS: BEFORE PB(II) EXPOSURE (A:
HEIGHT IMAGE; B: THREE-DIMENSIONAL IMAGE) AND AFTER PB(II) EXPOSURE (C: HEIGHT
IMAGE; D: THREE-DIMENSIONAL IMAGE). ....................................................................... 50
FIGURE 4.3 PERCENTAGE REMOVAL OF PB(II) IONS AS A FUNCTION OF PH (VOLUME: 20 ML;
SORBENT DOSE: 0.2 G; INITIAL CONCENTRATION: 50 MG L−1; CONTACT TIME: 30 MIN;
TEMPERATURE: 27°C). .................................................................................................. 51
FIGURE 4.4 PERCENTAGE REMOVAL OF PB(II) IONS CONCENTRATION AS A FUNCTION OF
BIOSORBENT DOSE (VOLUME: 20 ML; PH: 6.0; INITIAL CONCENTRATION: 50 MG L−1;
CONTACT TIME: 30 MIN; TEMPERATURE: 27°C). .............................................................. 52
FIGURE 4.5 PERCENTAGE REMOVAL OF PB(II) IONS CONCENTRATION AS A FUNCTION OF
TEMPERATURE (VOLUME: 20 ML; PH: 6.0; SORBENT DOSE: 0.35 G; INITIAL CONCENTRATION:
50 MG L−1; CONTACT TIME: 30 MIN). .............................................................................. 52
FIGURE 4.6 VAN’T HOFF PLOT, LOG KC VERSUS 1/T. ............................................................... 53
FIGURE 4.7 EFFECT OF CONCENTRATION OF PB(II) IONS ON THEIR PERCENT REMOVAL OVER P.
ERYNGII (VOLUME: 20 ML; PH: 6.0; SORBENT DOSE: 0.35 G; TEMPERATURE: 30°C; CONTACT
TIME: 30 MIN). ............................................................................................................. 54
FIGURE 4.8 ADSORPTION ISOTHERMS PLOT (A) LANGMUIR, (B) FREUNDLICH, (C) TEMKIN, AND (D)
D-R. ........................................................................................................................... 55
FIGURE 4.9 EFFECT OF CONCENTRATION OF PB(II) IONS ON THEIR PERCENT REMOVAL OVER P.
ERYNGII AS A FUNCTION OF CONTACT TIME (VOLUME: 20 ML; PH: 6.0; SORBENT DOSE: 0.35
G; TEMPERATURE: 30°C; INITIAL CONCENTRATION: 30 MG L−1). ...................................... 58
FIGURE 4.10 PSEUDO FIRST ORDER (A), PSEUDO SECOND ORDER (B), AND INTRA PARTICLE
DIFFUSION KINETIC MODELS PLOTS FOR THE SORPTION OF PB(II) IONS ONTO FUNGAL
BIOMASS. ..................................................................................................................... 58

XV
FIGURE 4.11 A) OPTIMIZATION OF VARIOUS ELUENTS TO CHECK THEIR DESORPTION EFFICIENCY
TOWARD PB(II) IONS. B) DESORPTION – REUSE CYCLES FOR THE REMOVAL OF PB(II) IONS
USING P. ERYNGII BIOMASS. ........................................................................................... 61
FIGURE 4.12 FTIR SPECTRA OF P. ERYNGII FUNGAL BIOMASS (A) BEFORE AND (B) AFTER
BIOSORPTION OF CD(II). ............................................................................................... 65
FIGURE 4.13 SEM MICROGRAPHS OF (A) UNLOADED AND (B) CD(II) LOADED P. ERYNGII FUNGAL
BIOMASS; EDS SPECTRA OF (C) UNLOADED AND (D) CD(II) LOADED P. ERYNGII FUNGAL
BIOMASS. ..................................................................................................................... 66
FIGURE 4.14 AFM IMAGES OF P. ERYNGII FUNGAL BIOSORBENT BEFORE (A) AND AFTER CD(II)
SORPTION (C), THREE-DIMENSIONAL IMAGES OF P. ERYNGII FUNGAL BIOSORBENT BEFORE
AND AFTER CD(II) SORPTION (B AND D). ........................................................................ 67
FIGURE 4.15 INFLUENCE OF P. ERYNGII FUNGAL CELL MASS STATE ON BIOSORPTION OF CD(II). .. 68
FIGURE 4.16 (A) PERCENTAGE REMOVAL OF CD(II) IONS CONCENTRATION AS A FUNCTION OF PH
(BIOSORBENT DOSE: 0.1G; INITIAL CONCENTRATION: 5.0 MG L−1; TEMPERATURE: 30°C;
CONTACT TIME: 20 MIN; AGITATION: 100 RPM). (B) PERCENTAGE REMOVAL OF CD(II)
CONCENTRATION AS A FUNCTION OF BIOSORBENT DOSE (PH: 5.0; INITIAL CONCENTRATION:
5.0 MG L−1; TEMPERATURE: 30°C; CONTACT TIME: 20 MIN; AGITATION: 100 RPM). (C)
EFFECT OF CONCENTRATION OF CD(II) ON THEIR PERCENT REMOVAL OVER P. ERYNGII (PH:
5.0; BIOSORBENT DOSE: 0.2 G; TEMPERATURE: 30°C; CONTACT TIME: 20 MIN; AGITATION:
100 RPM). (D) PERCENTAGE REMOVAL OF CD(II) CONCENTRATION AS A FUNCTION OF
TEMPERATURE (PH: 5.0; BIOSORBENT DOSE: 0.2 G; INITIAL CONCENTRATION: 20 MG L−1;
CONTACT TIME: 20 MIN; AGITATION: 100 RPM). .............................................................. 70
FIGURE 4.17 PERCENTAGE REMOVAL OF CD(II) CONCENTRATION AS A FUNCTION OF CONTACT
TIME (PH: 5.0; BIOSORBENT DOSE: 0.2 G; INITIAL CONCENTRATION: 20 MG L−1;
TEMPERATURE: 50°C; AGITATION: 100 RPM). ................................................................. 71
FIGURE 4.18 (A) LANGMUIR AND (B) FREUNDLICH ISOTHERMS FOR THE BIOSORPTION OF CD(II)
IONS ON P. ERYNGII FUNGAL BIOMASS. ........................................................................... 72
FIGURE 4.19 VAN’T HOFF PLOT, LOG KC VERSUS 1/T. ............................................................. 73
FIGURE 4.20 THE KINETIC FITTING PLOTS (A) PSEUDO FIRST ORDER AND (B) PSEUDO SECOND
ORDER FOR THE BIOSORPTION OF CD(II) IONS ON P. ERYNGII FUNGAL BIOMASS. ................ 75
FIGURE 4.21 INTRA PARTICLE DIFFUSION FOR THE BIOSORPTION OF CD(II) IONS ON P. ERYNGII
FUNGAL BIOMASS. ........................................................................................................ 76
FIGURE 4.22 (A) INFLUENCE OF VARIOUS ELUENTS ON PERCENTAGE RECOVERY OF CD(II) IONS BY
P. ERYNGII FUNGAL BIOMASS. (B) DESORPTION EFFICIENCY OF P. ERYNGII WITH CYCLE
NUMBER. ..................................................................................................................... 77
FIGURE 4.23 SEM IMAGES OF P. ERYNGII BEFORE AND AFTER HG(II) BIOSORPTION (A & B); EDX
ANALYSIS OF P. ERYNGII BEFORE AND AFTER HG(II) BIOSORPTION (C & D). ...................... 81
FIGURE 4.24 FTIR SPECTRA OF P. ERYNGII BEFORE (A) AND AFTER (B) HG(II) IONS BIOSORPTION.
................................................................................................................................... 82

XV
FIGURE 4.25 (A) PERCENTAGE REMOVAL OF HG(II) IONS AS A FUNCTION OF PH (TEMPERATURE:
30°C; AGITATION:100 RPM; BIOSORBENT DOSE: 0.1 G; INITIAL CONCENTRATION: 1.0 MG L−1;
CONTACT TIME: 30 MIN). (B) PLOT OF PHI VS. ΔPH TO OBTAIN POINT OF ZERO CHARGE
(PHPZC) VALUE FOR THE PROPOSED BIOSORBENT P. ERYNGII FUNGAL BIOMASS. .................. 84
FIGURE 4.26 PERCENTAGE REMOVAL OF HG(II) ION AS A FUNCTION OF BIOSORBENT DOSE (PH:
7.0; TEMPERATURE: 30°C; AGITATION: 100 RPM; INITIAL CONCENTRATION: 1.0 MG L−1;
CONTACT TIME: 30 MIN)................................................................................................ 85
FIGURE 4.27 PERCENTAGE REMOVAL OF HG(II) ION AS A FUNCTION OF BIOSORBENT DOSE (PH:
7.0; TEMPERATURE: 30°C; AGITATION: 100 RPM; BIOSORBENT DOSE: 0.25 G; CONTACT TIME:
30 MIN). ...................................................................................................................... 85
FIGURE 4.28 PERCENTAGE REMOVAL OF HG(II) AS A FUNCTION OF CONTACT TIME (PH: 7.0;
TEMPERATURE: 30°C; AGITATION: 100 RPM; BIOSORBENT DOSE: 0.25 G; INITIAL
CONCENTRATION: 7.5 MG L−1). ...................................................................................... 86
FIGURE 4.29 PERCENTAGE REMOVAL OF HG(II) AS A FUNCTION OF CONTACT TIME (PH: 7.0;
AGITATION: 100 RPM; BIOSORBENT DOSE: 0.25 G; CONTACT TIME: 5 MIN; INITIAL
CONCENTRATION: 7.5 MG L−1). ...................................................................................... 87
FIGURE 4.30 LANGMUIR PLOT FOR HG(II) BIOSORPTION ON P. ERYNGII BIOMASS. ...................... 88
FIGURE 4.31 FREUNDLICH PLOT FOR HG(II) BIOSORPTION ON P. ERYNGII BIOMASS. ................... 89
FIGURE 4.32 LAGERGREN / PSEUDO FIRST ORDER PLOTS FOR HG(II) BIOSORPTION ON P. ERYNGII
BIOMASS AT 30°C......................................................................................................... 89
FIGURE 4.33 HO-MCKAY / PSEUDO SECOND ORDER PLOTS FOR HG(II) BIOSORPTION ON ............ 90
FIGURE 4.34 VAN’T HOFF PLOT, LOG KC VERSUS 1/T. ............................................................. 91
FIGURE 4.35 SEM/EDX IMAGES OF P. ERYNGII BIOMASS: (A) AND (C) ARE UNLOADED; WHILE (B)
AND (D) ARE F- LOADED PATTERN OF FUNGAL BIOSORBENT. ............................................ 96
FIGURE 4.36 FTIR SPECTRA OF P. ERYNGII (A) BEFORE AND (B) AFTER F- SORPTION. .................. 98
FIGURE 4.37 IC-CHROMATOGRAM OF F- STANDARDS. ............................................................. 98
FIGURE 4.38 LINEAR CALIBRATION PLOT OF F- AT DIFFERENT CONCENTRATIONS. ...................... 99
FIGURE 4.39 (A) PERCENTAGE REMOVAL OF F- CONCENTRATION AS A FUNCTION OF PH
(BIOSORBENT DOSE: 0.1G; INITIAL CONCENTRATION: 5.0 MG L−1; TEMPERATURE: 30°C;
CONTACT TIME: 240 MIN; AGITATION: 100 RPM). (B) EFFECT OF CONCENTRATION OF F- ON
THEIR PERCENT REMOVAL OVER P. ERYNGII (PH: 2.0; BIOSORBENT DOSE: 0.1 G;
TEMPERATURE: 30°C; CONTACT TIME: 240 MIN; AGITATION: 100 RPM). (C) PERCENTAGE
REMOVAL OF F- CONCENTRATION AS A FUNCTION OF BIOSORBENT DOSE (PH: 2.0; INITIAL
CONCENTRATION: 5.0 MG L−1; TEMPERATURE: 30°C; CONTACT TIME: 240 MIN; AGITATION:
100 RPM). (D) PERCENTAGE REMOVAL OF F- CONCENTRATION AS A FUNCTION OF CONTACT
TIME (PH: 2.0; BIOSORBENT DOSE: 0.2 G; INITIAL CONCENTRATION: 5.0 MG L−1;
TEMPERATURE: 30°C; AGITATION: 100 RPM). ................................................................100
FIGURE 4.40 ADSORPTION ISOTHERMS PLOT (A) LANGMUIR, (B) FREUNDLICH, AND (C) D-R. ....102
FIGURE 4.41 VAN’T HOFF PLOT, LOG KC VERSUS 1/T. ............................................................104

XV
FIGURE 4.42 PSEUDO FIRST ORDER (A), PSEUDO SECOND ORDER (B), AND INTRA PARTICLE
DIFFUSION KINETIC MODELS (C) PLOTS FOR THE SORPTION OF F- IONS ONTO FUNGAL
BIOMASS. ....................................................................................................................106
FIGURE 4.43 EFFECT OF CO-EXISTING ANIONS ON F- REMOVAL (PH: 2.0; BIOSORBENT DOSE: 0.2 G;
INITIAL F- CONCENTRATION: 2.0 MG L−1; CONTACT TIME: 240 MIN; AND TEMPERATURE:
30°C). ........................................................................................................................108
FIGURE 4.44 (A) DESORPTION OF F- BY DIFFERENT DESORBING AGENTS (INITIAL F-
CONCENTRATION 2.0 MG L−1; BIOSORBENT DOSE: 0.2 G; CONTACT TIME 30 MIN; AND
TEMPERATURE 30°C). (B) DESORPTION EFFICIENCY OF P. ERYNGII WITH CYCLE NUMBER. .109
FIGURE 4.45 POSSIBLE MECHANISM ON SURFACE OF BIOMASS. ................................................111
FIGURE 4.46 SEM MICROGRAPHS OF (A) UNLOADED AND (B) NO3- LOADED P. ERYNGII FUNGAL
BIOMASS. ....................................................................................................................114
FIGURE 4.47 EDX SPECTRA OF (A) UNLOADED AND (B) NO3- LOADED P. ERYNGII FUNGAL BIOMASS.
..................................................................................................................................115
FIGURE 4.48 AFM IMAGES OF P. ERYNGII FUNGAL BIOSORBENT BEFORE (A) AND AFTER NO3-
SORPTION (C); THREE-DIMENSIONAL IMAGES OF P. ERYNGII FUNGAL BIOSORBENT BEFORE
AND AFTER NO3- SORPTION (B AND D). ..........................................................................116
FIGURE 4.49 UV-VIS SPECTRA OF NO3- AT DIFFERENT CONCENTRATIONS. ...............................117
FIGURE 4.50 LINEAR CALIBRATION PLOT FOR DIFFERENT NO3- CONCENTRATIONS. ...................117
FIGURE 4.51 PREDICTED RESPONSE VERSUS ACTUAL RESPONSE. .............................................121
FIGURE 4.52 NORMAL % PROBABILITY VERSUS RESIDUAL ERROR. ...........................................122
FIGURE 4.53 3D RESPONSE SURFACE PLOTS OF NO3- BIOSORPTION BY P. ERYNGII FUNGAL BIOMASS
SHOWING VARIABLE INTERACTIONS BETWEEN (A) PH AND BIOSORBENT DOSE; (B) PH AND
CONCENTRATION OF NO3-; AND (C) BIOSORBENT DOSE AND CONCENTRATION OF NO3
-. ....123
FIGURE 4.54 BREAKTHROUGH CURVES FOR DIFFERENT FLOW RATES (INITIAL PB(II) ION
CONCENTRATION: 10 MG L-1; BED HEIGHT: 2 CM). .........................................................127
FIGURE 4.55 BREAKTHROUGH CURVES FOR DIFFERENT PB(II) ION CONCENTRATION (FLOW RATE: 1
ML MIN-1; BED HEIGHT: 2 CM). .....................................................................................128
FIGURE 4.56 (A) BREAKTHROUGH CURVES FOR DIFFERENT BED HEIGHT (FLOW RATE: 1 ML MIN-1;
INITIAL PB(II) ION CONCENTRATION: 20 MG L-1) AND (B) BED DEPTH SERVICE TIME PLOT FOR
THE ADSORPTION OF PB(II) IONS BY FUNGAL BIOMASS IN COLUMN. .................................130
XV
ABBREVIATIONS
Pleurotus eryngii P. eryngii
PDA Potato Dextrose Agar
GPB Glucose Peptone Broth
Pb(NO3)2 Lead Nitrate
3CdSO4·8H2O Cadmium Sulphate
NaF Sodium Fluoride
KNO3 Potassium Nitrate
HgCl2 Mercuric Chloride
WHO World Health Organization
EPA Environmental Protection Agency
ppm Part Per Million
ppb Part Per Billion
F-AAS Flame Atomic Absorption Spectroscopy
HG-AAS Hydride Generation-Atomic Absorption Spectroscopy
IC Ion Chromatograph
UV-Vis Ultraviolet-Visible Spectrophotometry
FTIR Fourier Transform Infrared Spectroscopy
SEM-EDX Scanning Electron Microscope-Energy Dispersive X-ray
EDS Energy Dispersive Spectroscopy
AFM Atomic Force Microscope
D-R Dubinin-Radushkevich
RSM Response Surface Methodology

XV
CCD Central Composite Design
ANOVA Analysis of Variance
BDST Bed Depth Service Time
HCl Hydrochloric Acid
NaOH Sodium Hydroxide
H2SO4 Sulfuric Acid
HNO3 Nitric Acid
NaCl Sodium Chloride
EDTA Ethylenediaminetetraacetic acid
KBr Potassium Bromide
Na2BO4 Sodium Borate (Borax)

1
CHAPTER 1
INTRODUCTION
This chapter contains motivation, contributions of this thesis and general
introduction of environmental pollution. It specifically covers the effect of heavy
metals and anionic contamination of aqueous environment along with their
hazardous impact on human health. Previously reported methods for the removal
of toxic contaminants and their disadvantages were described along with
extensive description of biosorption technique as main objectives in this chapter.
At the end of the chapter, structure of rest of the thesis were present.
1.1 MOTIVATION
The discharge of toxic heavy metals and anions in water system is an emerging
community health related issue existed all over the world but in Pakistan as an under-
developed country and its region like Tharparkar and adjoining areas, the problem
identified as a massive public health issue, which requires the serious response from
the concern authorities. The people getting indulged in severe diseases just
because they have no direct method to decrease the level of toxins in water they
use to drinking purpose. Although extensive work has been done in the developed
world, additionally these studies were provide an awareness and cost-effective
remediation techniques to the community. Hence, the aim of present study was to
provide an efficient, cost effective, and environmental friendly biosorption
method with its potential in removing selected metals and anions from aqueous
system followed by application in real water samples of affected and adjoining
areas.
1.2 CONTRIBUTIONS OF THE THESIS
As water contamination cause severe environmental harm in the earth so new
methodologies with economic viability and easy processing in ecological

2
samples are emerging need. The detailed work in this thesis provides an
importance of fungus as a biosorbent and benefits of using biosorption
technique. It contributes to the removal of toxic metals and anions entered in to
the water system through natural or anthropogenic sources. P. eryngii potential is
explored first time extensively for the removal of toxic pollutant (metals /
anions), after an appropriate optimization of experimental variables and studying
isotherms, thermodynamics and kinetics of the sorption process.
1.3 ENVIRONMENTAL POLLUTION
Environmental pollution has turned into a key concentration of worry for every
one of the countries around the world, as the developing countries as well as
developed nations too are influenced by and experience the ill effects of it.
Pollution has many structures, the air we inhale, the water we drink, the ground
where we cultivate food crops and even the expanding noise we hear ordinary all
add to medical issues and lower personal satisfaction [1]. Among all the
ecological contaminations, contamination of water assets involves incredible
concern. Developing nations are at high hazard because of absence of waste
water treatment advances. The water of aquatic systems gets polluted by
household exercises, mining exercises, municipal wastes, present day rural
practices, marine dumping, radioactive squanders, oil spillage, underground
stockpiling spillages and enterprises. Regardless, the significant offenders
bringing on the contamination of water assets are diverse modern units [2].
Unpredictable release of poisonous chemicals through effluents from an
extensive variety of ventures (i.e. material, steel, oil, tanneries, canneries,
refineries, mines, manures generation units, cleanser creation units,
electroplating units and sugar factories) into water bodies pollutes these assets
and causes hazardous effects on environmental bodies. For these reasons, the
presence of toxic ions in the environment at concentrations above critical values
is unacceptable and their removal from the environment is of primary importance
[3].

3
1.3.1 POLLUTION IN AQUEOUS SOLUTIONS
Contamination of aqueous resources by excessive presence (high concentrations)
of metal ions and anions has become a serious concern worldwide over the past
few decades. These ions enter the water assets through both regular and
anthropogenic sources. Their release into the environment represents a real
concern for human health and environmental toxicology [1-3].
1.3.2 HEAVY METAL POLLUTION
The heavy metals are characteristic part of the earth’s crust. Continuous leaching
of these metals causes the contamination of air, water, and food; due to which a
minor extent of these metals indirectly enter into the human bodies. In
comparison to all, a few heavy metals (e.g. copper, selenium, zinc) played a key
role in up keeping human body digestion. Heavy metal spoiling may possibly
come about because of drinking water desecration; high encompassing air
fixations in close discharge sources, or by means of the natural way of life [5, 6].
The word heavy metal states to any metallic element with relatively high density
(> 5.0 g cm-3). They classified in to three categories: precious metals (i.e.
platinum (Pt), gold (Au), silver (Ag), palladium (Pd), ruthenium (Ru), etc); toxic
metals (i.e. arsenic (As), cadmium (Cd), lead (Pb), mercury (Hg), copper (Cu),
etc); and radio nuclides (uranium (U), thorium (Th), radium (Ra), etc) [7].
Unlike most of the organic toxins, the heavy metals are non-biodegradable type
of test material for remediation process. Owing to its bio-accumulative nature,
their excessive level (concentration) are toxic for living being. The disposal of
waste matter by most of the industries is the major cause of heavy metal
contamination in water system i.e. lakes, streams, groundwater and waterways
[8]. As opposed to other potential toxicants, heavy metals can't be readily
eliminated from a water body. They have strong bonding property to hold on in
silt from where they gradually discharged into the water.

4
Table 1.1 Common sources, health problems and maximum acceptable
concentration level by the WHO of some toxic heavy metals [9].
Pollutant Source of exposure Health aspects Acceptable
concentration level
Toxic metal
Iron (Fe)
Indiscriminate discharge
of toxic chemicals
through effluents from a
wide range of industries.
Poor growth, heart
failure and diabetes. 0.1 mg L−1
Copper (Cu)
Energy and fuel
production, manufacture
of electrical appliances,
aerospace and atomic
energy installation.
Anemia, liver and
kidney diseases,
polyneuritis, and
brain damage.
1.0 mg L−1
Lead (Pb)
Paint and dyes production
industries, mining,
smelting and metal
plating, battery
manufacturing,
ammunition production,
and paper and pulp
processing.
Detrimental effects
on the central
nervous system,
blood circulation
system, basic
cellular processes
and brain functions,
kidneys and
reproductive
system.
0.05 mg L−1
(50 ppb)
Zinc (Zn)
Municipal wastewater
treatment & galvanizing
plants, natural ores, acid -
mine drainage.
Liver, kidney and
pancreas damage. 5.0 mg L−1
Cadmium (Cd)
Incineration of fossil
fuels, manufacturing of
batteries, metal
production plants,
fertilizers, refining
processes, electroplating,
smelting, alloy industries,
mining, pigment and
screens.
Teratogen and
carcinogen with
severe effect on
liver, lungs,
kidneys, and
reproductive organs
when enters in
human body via
food, water,
breathing or
smoking.
0.003 mg L−1
(3 ppb)
Mercury (Hg)
Generated by
pharmaceuticals, textile
industries, pulp and paper
chloralkali, oil refining,
paint, rubber processing,
electrical and fertilizer.
Bio-accumulative
nature affect the
central nervous
systems and
endocrine glands.
Extensive exposure
cause brain damage
and in extreme
circumstances,
death.
0.001 mg L−1
(1 ppb)

5
Being non-biodegradable, these metals collect at tropic levels through natural
pecking order and can bring about human health problems. In people, these
metals gather in living tissues and in this way, replicate the risk. Some health
impacts and wellbeing dangers of some heavy metals to individuals are given in
Table 1.1. The wellbeing dangers of heavy metals ingestion accordingly are of
wide range. A few metal cause physical distresses while others may bring life-
threatening illness, harm to indispensable body framework, or cause different
harms [9-12]. Thus, it is extremely important to control emanation of heavy
metals into the environment.
1.3.3 ANIONIC POLLUTION
Anions are radicals (gatherings of particles) that have a negative charge and can
gain electrons. Various anionic species, (such as fluoride, nitrate, nitrite,
chloride, sulfide, and cyanide) might be considered as toxins when present in
water supplies over specific levels. Additionally, their bioaccumulation turns
into an ecological concern when their focuses in the earth start to influence
human wellbeing and environments [4]. Many of these species occurs naturally
in the atmosphere, water, and soil.
Besides their natural occurrence in the ecosystem, they have extensive
application in several horticultural and industrial sectors which gives
unavoidably ascend to their discharge and scattering into the earth [5].
Contamination of aqueous solutions by these toxic contaminants may represent a
public health problem given their harmful effects on living organisms.
Consequently, many countries and environmental protection agencies have been
forced to implement limiting standards for drinking water and discharges of
industrial wastewaters [6]. As a result, removal of such compounds from
wastewaters becomes crucial toward the conservation of human's wellbeing and
condition. Some normal sources, wellbeing effects to people and restricting
benchmarks of anions are given in Table 1.2.
According to the latest estimation; about 200 million people from 25 nations
across the world are passing through the alarming fate of fluorosis [22].
Meanwhile in Pakistan a few of dry zones are severely under the influence of
fluoride contamination. Predominantly the locality of district Tharparkar, Sindh
6
(Mithi, Diplo, Chachro and Nagarparkar) is severely affected by fluoride
contamination. People in these areas rely heavily on underground water sources
due to unavailability of rivers. Some reports [7, 8] have shown high fluoride
contamination in the water of aforementioned areas of Pakistan and proven to be
the major source of illness.
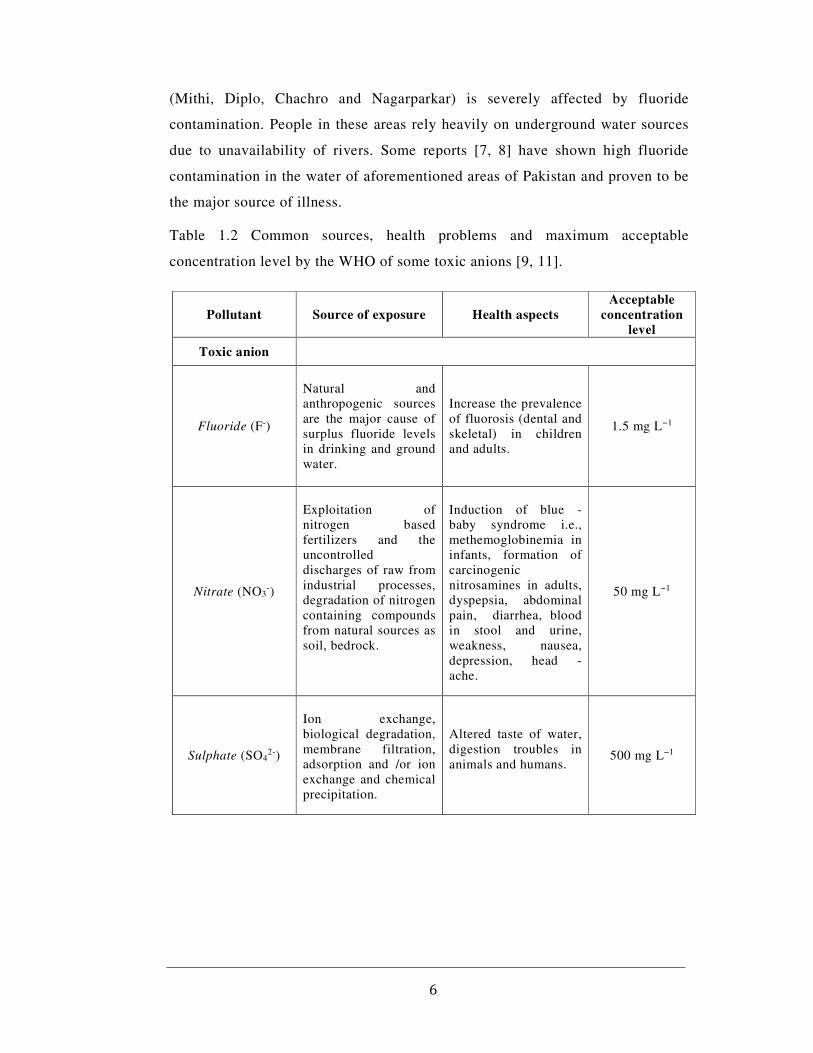
Table 1.2 Common sources, health problems and maximum acceptable
concentration level by the WHO of some toxic anions [9, 11].
Pollutant Source of exposure Health aspects
Acceptable
concentration
level
Toxic anion
Fluoride (F-)
Natural and
anthropogenic sources
are the major cause of
surplus fluoride levels
in drinking and ground
water.
Increase the prevalence
of fluorosis (dental and
skeletal) in children
and adults.
1.5 mg L−1
Nitrate (NO3-)
Exploitation of
nitrogen based
fertilizers and the
uncontrolled
discharges of raw from
industrial processes,
degradation of nitrogen
containing compounds
from natural sources as
soil, bedrock.
Induction of blue -
baby syndrome i.e.,
methemoglobinemia in
infants, formation of
carcinogenic
nitrosamines in adults,
dyspepsia, abdominal
pain, diarrhea, blood
in stool and urine,
weakness, nausea,
depression, head -
ache.
50 mg L−1
Sulphate (SO42-)
Ion exchange,
biological degradation,
membrane filtration,
adsorption and /or ion
exchange and chemical
precipitation.
Altered taste of water,
digestion troubles in
animals and humans. 500 mg L−1

7
1.4 CONVENTIONAL TECHNIQUES USED FOR THE REMOVAL OF
TOXIC METALS AND ANIONS FROM AQUEOUS SOLUTIONS
A few physico-chemical techniques like chemical precipitation, electro-dialysis,
reverse osmosis, ion-exchange, ultra-filtration, adsorption and so forth are usually
utilized for stripping poisonous heavy metals and anions from waste waters. Brief
description of each method is introduced underneath:
1.4.1 CHEMICAL PRECIPITATION
Chemical precipitation is one of the substantial treatment method for the
extraction of metal ions from aqueous solutions [9]. This technique is
accomplished by the expansion of coagulants, for example, lime, alum, press
salts and other natural polymers. The renowned precipitation techniques that’s
utilized by enterprises are sulfide precipitation, carbonate precipitation and
sodium hydroxide precipitation. The disadvantage related to chemical
precipitation technique is the production of large amount of toxic sludge during
the process.
1.4.2 ELECTRO-DIALYSIS
In this process, the ionic constituents of heavy metal were isolated by semi-
permeable ion-selective membranes [10]. Consumption of an electric potential
between the two cathodes causes the movement of cation and anions towards
respective terminals. Because of the alternate spacing of ions in permeable
membranes, cells of concentrated and dilute salts are formed. The disadvantage
of this technique is the arrangement of metal hydroxides, which stop up the layer
and in this way cost included is high.
1.4.3 REVERSE OSMOSIS
The technique of reverse osmosis were generally exploits for the desalination of
drinking water [11]. In earlier decades, a specific exertion has been made in this
technique for the recovery of concentrated metal salt solution and to clean up
aqueous solutions. Normally, the process of metal ion (dissolved solids)
separation via semi-permeable membrane were occur due to the development of

8
pressure more than osmotic pressure between the ions and waste water. The
major disadvantage that limit the application of this process is the cost of
membrane.
1.4.4 ION-EXCHANGE
From quite a few years, the ion exchange technologies have been effectively used for
the interchange of metal ions from dilute solutions on the ion-exchange resin via
electrostatic force of attraction [12]. Typically, the hindrances incorporate excessive
budget and fractional expulsion of specific particles. The process also have limitations
for bulky quantities of opposing monovalent (Na+1) and divalent (Ca+2) ions [13].
1.4.5 ULTRA-FILTRATION
The ultra-filtration process is based upon the utilization of pressure driven
permeable membrane for the discharge of toxic heavy metals [14]. The
generation of extensive sludge is the primary deficit of this process.
1.4.6 ADSORPTION
In the process of adsorption, various adsorbents were used for the removal of
toxic ions from contaminated water phase [15]. Usually amorphous form of
adsorbents were used to increase the surface zone or volume extent.
The above expressed strategies are effective for removal of metals and anions from
aqueous solutions with high concentration of metals while for low concentrations
(ppb, ppm level) of contaminants these methods are not exceptionally
productive. These techniques additionally have other a few inconveniences, such
as incomplete removal, limited tolerance to pH change, expensive equipment and
monitoring system requirements, high reagent or energy requirements and
generation of toxic sludge or other waste products that require disposal [27].

9
1.5 THE REQUIREMENT OF NOVEL INNOVATION FOR THE REMOVAL
OF TOXIC METALS AND ANIONS
To overcome the limitations of physicochemical treatments, an effective and
environmental friendly technique is the fundamental requirement for the removal
of toxic ions.
For this purpose, a green and a cost-effective solution biological treatment i.e.,
biosorption has attained more attention for heavy metals / anions removal [16].
Biosorption is the physicochemical process of toxic pollutant uptake by naturally
available biomass onto its cellular structure [17].
In this process two phases were involved:
• A solid phase of biomass material and
• A liquid phase (normally water) with dissolved quantity of sorbate (metal /
anions).
By means of several complex mechanisms, the sorbate species attract and bound
toward the higher affinity of the sorbent surface. The procedure of sorption
continues till an appropriate equilibrium is achieved among the specific quantity
of sorbent bounded sorbate and its residual portion in contaminated solution.
Typically, the biosorption of heavy metals occurs rapidly (20-60 min), because it
is independent from metabolism. After this period, the uptake of cationic metal
ion becomes slower [18].
1.5.1 HISTORY OF BIOSORPTION
In early 18th and 19th eras, the ionic (metal / anion) uptake capacity of many
important living micro-organisms from contaminated aqueous solution were
examined [19]. A few decades ago, the application of biosorption technique on
aqueous samples was very limited. The process were significantly used by the
industrialists to resolve sewage concerns and to renovate the wastewater that is
produced by the chemical industries [20].

10
1.5.2 ADVANTAGES OF BIOSORPTION TECHNIQUE
The studies of life sciences experts mainly focused on the accumulation effects
of toxic pollutants in microorganisms, whereas an environmental researcher used
this ability of microorganisms (algae, fungi, bacteria) for removal / recovery of
heavy metals or anion from contaminated waters [21].
The significant features of biosorption technique are [22]:
• Offers short capital investment,
• Special selectivity for targeted ions,
• Effective on removal of toxic ions (metals and anions) from effluent,
• The processing is fast, and
• Multiple-time reuse of ion loaded biomass after suitable desorption.
1.5.3 BIOSORBENTS / BIOLOGICAL MATERIAL / BIOMASS
Biosorbents are different sorts of biomaterials (waste or naturally abundant
biomass) that have been utilized in chemical and microbiology research
laboratories for metal and anion adsorption such as; pine barks, wheat bran, tea
leaves, plant tissues, banana pith, tree sawdust, seaweeds, shea butter seed husks,
date stones, brown algae, sugar-beet pulp nut shells, sugarcane bagasse, maize
and rice husks, sunflower stalk, coconut fiber, activated sludge, almond hulls,
and so forth [16, 23, 24]. The majority of these biosorbents are of plant origin
and predominantly agricultural by products. All these biomaterials have been
inspected for their biosorption properties. Diverse level of metal / anion uptakes
has been obtained that are high enough yet low-cost, which added to the pool of
non-tested biomaterial in the world, justifying further research on biosorption
[37].
Recently, numerous biomass of algae, and other microscopic organisms [101-
114] have been utilized as biosorbents. Researches are being made on exploiting
cellulosic nature nonpathogenic biological material as a dynamic asset for
efficient removal of poisonous metals and anions from water system.

11
1.6 EXPECTED MECHANISMS INVOLVE IN BIOSORPTION
Due to the complex cellular structure of microbes (algae, fungi, bacteria), it is
assumed that various pathways may possibly involve in the ionic up take.
The binding mechanism of dead cell (non-living) / inactivated biosorbent depend
upon:
• Physico-chemical nature of contaminant (i.e., size, species type, ionic
charge),
• Nature of the biomass with its definite surface properties, and
• Controlled environmental parameters (i.e., temperature, ionic strength, pH,
existence of competing ions in the solution) [3].
On the basis of cell metabolism, the mechanism of biosorption process were
divided into:
1.6.1 METABOLISM DEPENDENT
Active uptake (slower uptake) is metabolism dependent, causing the transport of
ions across the cell membrane into the cytoplasm for intracellular accumulation
[38]. This biosorption is valid only for viable cells.
1.6.2 NON-METABOLISM DEPENDENT
It is the passive uptake (rapid uptake) of ions on microbial surface within a short
span of time through physico-chemical (ion exchange, complexation,
coordination and chelation) interaction [25]. The basis of uptake is the presence
of functional groups on the cellular surface.
On the basis of ionic removal from contaminated aqueous solution and their
attachment at specific sites of biomass, the biosorption mechanism divided into:
1.6.3 EXTRA CELLULAR ACCUMULATION / PRECIPITATION
This biosorption mechanism may possibly dependent or independent of biomass
cellular metabolism [40].

12
1.6.4 CELL SURFACE SORPTION / PRECIPITATION
In this mechanism [38], the removal of toxic pollutant (either metal or anion)
occurs both in the aqueous phase as well as on the surface of microbe cell wall.
It should also keep in view that, the precipitation process may not be reliant on
cell’s metabolism. But in few circumstances, the presence of toxic metals
enhance the microorganism’s cell metabolism which in turn help releasing the
compounds that favors the precipitation.
1.6.5 INTRACELLULAR ACCUMULATION / COMPLEXATION
The intracellular accumulation [39] involves complexation of ions and reduction
in their toxicity by several species specific processes like phyto-chelatin
reactions, hypertrophying and multiplication of the polyphosphate bodies.
1.6.6 ION EXCHANGE
The cell wall of micro and macro-organisms comprises of polysaccharides which
are responsible for various ionic functionalities on the surface [40]. Usually,
these charged functional groups cause an ion exchange mechanism during
biosorption.
1.6.7 PHYSICAL ADSORPTION
The primary reason of physical adsorption is the presence of Van der Waal’s
forces [25]. In non-living microbial biomass, the process of biosorption in
aqueous system takes place through the electrostatic force of attractions between
the pollutant and the microbe cell surface.
1.7 FACTORS AFFECTING BIOSORPTION
The factors affecting biosorption of a specific metal or anion by a certain
biomass are:
1.7.1 PH
The parameter of solution pH played a significant role in the biosorption process
due to its direct effect on metal - solution chemistry [25]. By means of pH, the

13
expected surface mechanism between the sorption active functionalities of
biomass and that of metallic ions were anticipated.
1.7.2 BIOMASS CONCENTRATION
The specific quantity of biomass (concentration) also had a visible effect on the
biosorption efficiency [26]. Usually in contaminated solution, the lower
concentration of biomass increases the ion uptake while further increment cause
to hinder the particular binding sites.
1.7.3 TEMPERATURE
The temperature had an intermittent effect on the biosorption performance since
most of the reactions are exothermic in nature [27]. However, in some exceptions
metal ions and biomass-metal complex stability and ionization of cell wall
chemical parts can be influenced by temperature.
1.7.4 INTERFERING IONS
The process of biosorption is mainly exploit for the treatment of contaminated
drinking water with more than one type of ion [24]. Therefore, the occurrence of
interfering ions would also had an influence on sorption efficiency of specific
metal of interest.
1.8 DESORPTION
This process is remarkably important together with biosorption. It is use to
recover the biosorbed ion after sorption and to keep the cost of process down
[34]. An ultimate desorption efficiency based upon desorption of sorbed ion from
biosorbent and their regeneration with no physical changes or damage for
another cycle of application.
1.9 CHOICE OF TOXIC METAL AND ANION FOR BIOSORPTION
PROCESS
The process of biosorption is used for the treatment of harmful pollutants (metal
cation and anions) from contaminated drinking water. Generally for biosorption

14
study, the selection of toxic heavy metals and anions ion is highly depend upon
their environmental impact.
For this research, specific metals i.e. Pb, Cd, Hg and anions i.e. F-, NO3- were
chose on the basis of their toxicity level and high degree of anthropogenic
discharge into the environment (Table 1.1, 1.2).
1.10 EVALUATION OF BIOSORPTION PROCESS
Biosorption isotherm, models of column data, kinetic models and
thermodynamic parameters are used to evaluate the sorption phenomenon
between the surface of biosorbent and sorbate during sorption reaction.
1.11 ISOTHERM STUDY (BIOSORPTION ISOTHERMS)
Biosorption isotherms are the way of presentations of amount of solute sorbed per
unit of sorbent. Langmuir, Freundlich, Temkin and D-R sorption isotherm models
were applied to evaluate the sorption phenomenon between surface of sorbent
(biological material) and sorbate (pollutant in solution) during sorption reaction.
These isotherms [43] gives:
• The qualitative statistics of the biosorption progress, and
• The degree of biomass surface coverage by sorbate.
1.11.1 LANGMUIR SORPTION ISOTHERM
This theory assumes a monolayer coverage of sorbate (metal / anion) over a
uniform sorbent surface [28]. The linear form of Langmuir isotherm model is
represented as equation 1:
Cq
= 1Qb + C
Q− − − −(1)
where qe is the amount of metal ion / anion sorbed per unit mass of sorbent (mg
g−1), Ce is the amount of metal ion / anion in liquid phase at equilibrium (mg L-
1), Q0 is the monolayer sorption capacity (mg g−1) and b is the Langmuir constant
related to the free energy of sorption (L mg-1).

15
The essential characteristics of Langmuir isotherm model can be expressed in
terms of dimensionless constant separation factor RL which has four
probabilities:
(1) 0 < RL <1, favorable adsorption; (2) RL > 1, unfavorable adsorption;
(3) RL = 1, linear adsorption; and (4) RL = 0, irreversible adsorption.
The separation factor RL is calculated using equation 2:
R = 1(1 + bC) − − − −(2)
1.11.2 FREUNDLICH SORPTION ISOTHERM
The Freundlich model assumes that stronger binding sites on the biosorbent
surface are occupied first and that the binding strength decreases with increasing
degree of site occupation by sorbate [29]. For fitting the model to experimental
data, the model generally gives a better fit for higher equilibrium concentration
of sorbate in solution.
The linear form of this isotherm describes the formation of multi layers of the
adsorbate on the heterogeneous sorbent surface is represented as equation 3:
lnq = lnK + 1nlnC
− − − −(3)
where KF and n are the constants incorporating all factors affecting the
adsorption process (adsorption capacity and intensity). These constants were
determined from a plot of qe vs. Ce. The n-values (sorption intensity indicator)
are between 1 and 10 represent beneficial adsorption.
1.11.3 TEMKIN SORPTION ISOTHERM
The Temkin isotherm theory assumed that the heat of adsorption (due to sorbent
- sorbate interactions) decrease linearly for all the molecular layer. According to
this model the sorption process is characterized by a uniform distribution of the
maximum bonding energy [30].

16
Here equation 4 represent the linear form of Temkin adsorption isotherm:
q = RTb
lnA + RTb
lnC − − − −(4)
Moreover, the amount of B is usually calculated with equation 5:
B = RTb
− − − −(5)
where R is universal gas constant (8.314J mol-1K-1); T is Temperature in K; bT is
Temkin isotherm constant (KJ mol-1) and is related to the temperature of
adsorption; A is Temkin isotherm equilibrium binding constant (L g-1) and B is
Constant related to heat of sorption.
The A value gives an idea about nature of adsorption, if A value is in between 0
and 8, then the adsorption is physical nature, otherwise it is chemical in nature.
1.11.4 D-R SORPTION ISOTHERM
To evaluate the type of adsorption process [30], the experimental equilibrium
data were applied to D-R sorption isotherm using equation 6:
lnq = lnq ! − K"#Ɛ$ − − − −(6)
where qe is the amount of metal ion / anion sorbed in mg g−1, qmax is the D-R
monolayer sorption capacity (mg g-1), KDR is a constant related to free energy
(mol2 J-2) and ε is Polanyi potential which is related as shown in equation 7:
Ɛ = RTln 1 + 1C
− − − −(7)
where T is temperature (K), R the gas constant (8.314 J mol-1 K-1) and Ce is the
equilibrium concentration of Pb(II) ions in (mg L-1). The sorption energy E (kJ
mol-1) can be obtained by equation 8:
E = 1(−2)*+
− − − −(8)

17
1.12 KINETIC STUDY (BIOSORPTION KINETIC ISOTHERMS)
In order to analyze the sorption kinetics and to calculate adsorbate uptake rate of
metal ion / anion by P. eryngii, two kinetic models i.e. Lagergren’s pseudo-first
order (PFO) and Ho-McKay’s pseudo-second order (PSO) [31] were applied.
These kinetic models give:
• Rate of adsorption process,
• Practical applicability,
• Information about the mechanism of the diffusion.
1.12.1 LAGERGREN’S PSEUDO FIRST ORDER KINETIC MODEL
The first order Lagergren’s rate equation is commonly used for the sorption
process and is calculated using equation 9:
ln(q − q-) = lnq − k/t2.303 − − − −(9)
where qt and qe represents the amounts of metal ion / anion (mg g-1) sorbed at
time t and equilibrium respectively, k1 is the Lagergren rate constant of the
pseudo first order sorption process (min-1).
1.12.2 HO-MCKAY’S PSEUDO SECOND ORDER KINETIC MODEL
The pseudo second-order kinetics of adsorption was applied to check the kinetic
mechanisms between sorbent and sorbate. The parameters k2 and qe was
calculated by using following the equation 10:
tq-
= 1k$q$
+ tq
− − − −(10)
where k2 represents the rate constant of pseudo second order sorption process (g
mg-1 min-1).

18
1.12.3 WEBER AND MORRIS INTRA PARTICLE DIFFUSION MODEL
For further confirmation about the exact mechanism Weber and Morris intra
particle diffusion (IPD) model [32] were applied which define that the intra
particle diffusion varies with the square root of time as equation 11:
q- = k45√t + C − − − −(11)
where kipd is the intra particle diffusion rate constant (mg g-1 min1/2) and C is
constant related to thickness of the boundary layer.
1.13 THERMODYNAMIC STUDY
The biosorption process is associated with several thermodynamic parameters
such as; change in Gibbs free energy (ΔGº), enthalpy (ΔHº), and entropy (ΔSº)
[33]. These parameters were calculated from the Van’t Hoff plot of lnKc versus
1/T according to the equation 12 and 13 respectively:
∆G° = −RTlnKc − − − −(12)
lnKc = − ∆H°
RT + ∆S°
R − − − −(13)
where R is the universal gas constant (0.00831 kJ mol-1 K-1), T is the absolute
temperature (K) and Kc is an equilibrium constant.
If the thermodynamic parameter of sorption process shows the negative value for
ΔGº and ΔHº at the studied temperature range, it confirms the spontaneous and
exothermic nature of biosorption and also indicate the feasibility of reaction at
elevated temperatures. It is reported [47] that enthalpy change data is useful for
distinguishing physio and chemosorption mechanism. Physisorption is typically
associated with heat of adsorption in the range of 2.1-20.9 kJ mol-1, while
chemisorptions are typically associated with much larger ΔHº values (20.9-418.4
kJ mol-1).
The negative value of ΔSº reflects the decreased randomness at the solid-liquid
interface during sorption; while the positive value of ΔS° indicate increased
randomness at the solid / liquid interface, it also illustrate the strong affinity of

19
biosorbent toward sorbate. Similarly, the value of entropy (> 0) demonstrates the
existence of a definite order for the toxic ion on sorbent surface.
1.14 STATISTICAL DESIGN OF EXPERIMENT
Response Surface Methodology (RSM) is an approach that assembles
mathematical and statistical tools for improving the optimization process for
maximum biosorption [34]. It could evaluate the relative significance of several
affecting factors in the presence of complex interactions and offers reduction in
number of experiments when there are several factors integrated in the study.
Central Composite Design (CCD) is one of the most powerful and efficient
experimental design among other response surface designs because of its ability
to find the best set of values for a set of factors giving an optimal response [35].
Since there are only three levels, the quadratic model is suitable.
Coding of the variables was done according to the following equation 14:
x = (X − X)ΔX
− − − −(14)
where Xi is the dimensionless value of an independent variable, Xi is the real
value of an independent variable, X0 is the real value of an independent variable
at the center point, and ΔXi is the step change of the real value of the variable i
corresponding to a variation of a unit for the dimensionless value of the variable
i.
For better accuracy, second-order polynomial response equation 15 was proposed
to correlate the dependent and independent variables:
Y = β + βA + βB + βC + βA$ + βB$ + βC$ + βBAB + βBAC + βBBC − (15)
where Y is the predicted response (biosorption efficiency of sorbate associated
with each factor level combination, β0 is the intercept, bi is the linear coefficient
of the input factor A, B, C; bii is the ith quadratic coefficient of the input factor
A, B, C; and bij is the different interaction coefficient between the input factor
AB, AC, BC.
The data were subjected to Analysis of Variance (ANOVA) and the coefficient
of regression (R2) was calculated to find out the quality of polynomial equation
(i = A, B, C)

20
and goodness of fit of the model. Moreover, investigations over different tests
such as desirability function, sequential model sum of squares, lack of fit tests,
model summary statistics helps in selecting the best model for describing the
relationship between the response and other influencing independent variable.
1.15 COLUMN MODELS
In process applications, a packed bed column is an effective process for cyclic
sorption / desorption, as it makes the best use of the concentration difference
known to be a driving force for pollutant sorption and results in a better quality
of the effluent. Two frequently used models i.e. Thomas and Bed Depth Service
Time (BDST) were used to analyze the compatibility of experimental data of the
tested metals.
1.15.1 THOMAS MODEL
The design of an adsorption packed column requires the determination of column
parameters such as adsorption capacity and the kinetic parameters [36]. The
Thomas model can be implemented to analyze the breakthrough curves and
adsorption capacity for each sorbent. The linearized form of Thomas model
expressed by equation 16:
ln CC − 1 = kCqm
Q − kCCEt − − − −(16)
where C0 and C are the inlet and the effluent solute concentrations at any time t
(m); kTh is the Thomas model constant (mL m-1 mg-1); q0 is the maximum solid-
phase concentration of solute (mg g-1); and M is the total mass of the adsorbent
(g). The model constants kTh and q0 can be determined from slope and intercept
of a plot of ln[(C0/C)-1] against t respectively.
1.15.2 BDST MODEL
The BDST model used to predict the column performance for any bed length, if
data for some depths are known. It relates the service time of a fixed bed with
the height of adsorbent in the bed, hence with its quantity. The measurement of

21
sorbent quantity is more precise than the determination of the respective volume
[37]. Therefore, sorbent quantity is being preferably used, instead of the bed
height.
The linear form of BDST model expressed as equation 17:
t = N ZCϑ − 1
K Cln C
CI− 1 − − − −(17)
where t is the service time (h), N0 is the adsorption capacity (mg cm-3), Z is the
height of column (cm), Cb is the breakthrough sorbate concentration (mg L-1), ϑ
is the linear velocity (cm h-1) and Ka is the rate constant (L mg-1 h-1) at time t. A
plot of t versus bed depth (Z) should yield a straight line and use to evaluate N0
and Ka, respectively. Application of the BDST model requires specification of
the breakthrough time, which was selected arbitrarily.
1.16 AIM AND OBJECTIVES OF PRESENT STUDY
The aim of the present study is to prepare a novel and cost effective fungal
biomass for the removal of toxic metals and anions from aqueous solutions with
following specific objectives:
Characterization of prepared fungal biomass (FTIR, SEM-EDX, AFM) before
and after sorption.
Optimization of a range of factors affecting biosorption (i.e.; pH, initial
concentration, biosorbent dose, temperature, and contact time) for favorable
biosorption of metals and anions under study.
To study the equilibrium, kinetics and thermodynamics of toxic metals i.e.
Pb(II), Hg(II), Cd(II) and anions (F-) removal by dried P. eryngii fungal
biomass in batch system.
Desorption study of sorbed ions from biomass surface and its reusability
studies along with determination of interfering ions during sorption of
targeted ion.

22
To optimize the biosorption capacity of anion (NO3-) removal by fungal
biomass in batch system using statistical Design of Experiments (DoE).
Application of proposed study on real water samples of affected areas along
with column study.
1.17 STRUCTURE OF THE THESIS
There are five chapters in this thesis and each chapter describes the structure of
this research.
CHAPTER 1 INTRODUCTION
This chapter highlights the alarming situation of aqueous environment arising
due to the developing industrialization and technology. It describes the
conventional processes used for the removal of toxic ions and their limitations.
In addition, an eco-friendly and economical treatment technology i.e. biosorption
with its significance and application were described. This chapter also presents
the problem statement, research objectives, scope of research and thesis
organization.
CHAPTER 2 LITERATURE REVIEW
A brief review of the synthetic and natural biosorbents history were covered in
this chapter along with detailed study of different microbial biomass utilized
previously for the removal of toxic heavy metals and anions. The morphology,
growth habitat and effectiveness of newly reported fungal biomass P. eryngii
were also discussed in this chapter of literature review.
CHAPTER 3 RESEARCH METHODOLOGY
All the chemicals, reagents and instruments used throughout the current study
are mentioned in this chapter along with experimental techniques followed in the
research for batch and packed bed column system. In addition, it covers the
investigation methodologies used for characterization of before and after
biosorption

23
CHAPTER 4 RESULTS AND DISCUSSION
The results and discussion chapter covering the experimental data with particular
facts for biosorption studies of toxic metals (Pb, Cd, Hg) and anions (F-, NO3-)
by P. eryngii fungal biomass in batch and packed bed column. The
characterization of the biosorbent and optimization of biosorption process as
well as isotherm, kinetics and thermodynamics were studied. The regeneration of
biosorbent and application to real samples for removal of targeted toxic metals /
anions were also investigated.
CHAPTER 5 CONCLUSION
This chapter states the entire inferences that are based on the outcomes acquired
in “Chapter 4” (Results & discussion). Recommendations for current scenario of
work along with future research directions were also mentioned in this section.

24
CHAPTER 2
LITERATURE REVIEW
In this chapter of literature review, previous reported investigations on synthetic
and naturally available biosorbents for the effective removal of toxic pollutants
from aqueous solutions were present.
2.1 SYNTHETIC ADSORBENTS USED FOR THE REMOVAL OF METALS
AND ANIONS
A broad research has been made on the removal of toxic metals and anions
utilizing synthetic adsorbent materials such as silica materials [38, 39], activated
red mud [40], Amberlite IRA 458 [41], Mg-Al layered double hydroxide [42],
activated alumina [43], fly ash [44], alum sludge [45], chitosan beads [46], red
mud [40, 47], zeolite [48], calcite [49], attapulgite [50], alumina and aluminium
[51, 52], modified activated alumina [53], iron-based adsorbents [54], metal
oxides / hydroxides / oxy hydroxides [52, 55, 56], mixed metal oxides [57],
metal-impregnated oxides [58] and acid treated spent bleaching earth [59], etc.
Yet, high cost, water soluble component nature, hard preparation and generation
of adsorbent waste is a serious environmental problem that cause limit in their
usage [60, 61].
2.2 NATURAL BIOSORBENTS FOR THE REMOVAL OF METALS AND
ANIONS
The biosorption is one of the accessible, reliable, and more affordable technique
to accumulate toxins from aqueous environment and sequester them for large
scale removal [16]. Particularly microbial biomass i.e. bacteria, algae, yeast and
fungi (live, dead or pre-treated) are low cost and efficient natural biosorbents. In
recent years, the screening of cellulosic origin sorbents and their sorption
performance has been studied by many researchers. Their investigations played a

25
key role in the formal application of biosorption technology and to comprehend
the sorption mechanism [33-40].
2.3 REMOVAL OF TOXIC METALS BY VARIOUS BIOSORBENTS
The removal of persistent and non-biodegradable toxic heavy metal ions by
varied micobial origin biomass (bacteria, algae, yeast, and fungi) is becoming an
important integrated approach and have extensively been reported in literature
[101-114].
2.3.1 BACTERIAL BIOSORBENTS
The biosorbents of bacteria were considered as the most abundant biomass
because of their smaller size, ability to grow in bulk (under controlled
conditions) and ubiquity. According to an investigation, most of the bacterial
colonies have versatile capability to constitute a major portion of terrestrial
biomass. During sorption studies of bacteria [101, 102], their resistance against
wide range of environmental conditions were also considered.
Though, the process of bacterial isolation, their appropriate harvesting
and screening for effective sorption is complicated on commercial scale; but still
this microbe has its broad usage as remediating species. It is estimated that the
metal removal capacities of the bacteria were came across in range between 0.70
- 568 mg g-1 [77].
El Bestawy et al. [62] in his studies of metallic bisorption isolate various species
of bacteria like Enterobacter, Stenotrophomonas, Comamonas,
and Ochrobactrum from acclimatized activated sludge. The author reported that
respective species can resist for selected metals Cu (275 mg L-1), Cd (320 mg L-
1), Co (140 mg L-1) and Cr (29 mg L-1) with good sorption capacity. The
proposed activated sludge system augmented with the acclimatized strains also
ensures excessive performance under the metal stress of industrial effluents.
Oves et al. [63] states the metallic biosorption capacity of Bacillus thuringiensis
biomass that were recovered from rhizosphere of cauliflower grown in frequently
industrial effluents irrigated soil. Authors reported that the biosorption ability
of B. thuringiensis were pH and metal concentration dependent. The highest

26
biosorption efficiency were recorded for Ni (94%) followed by Cu (91.8%),
whereas the lowermost sorption for Cd (87%) at 25 mg L-1 initial metal ion
concentration.
Leung et al. [64] isolate and identified twelve aerobic bacteria from activated
sludge i.e. Gram-positive (e.g., Bacillus) and Gram-negative (e.g., Pseudomonas)
bacteria. One of the selected bacterial species P. pseudoalcaligenes were used
for the biosorption of Pb and Cu metallic ions. The result of the study shows that
reaction followed Langmuir isotherm model with biosorption capacity (qmax) of
271.7 mg g-1 (Pb) and 46.8 mg g-1 (Cu) at pH 5.0. However, a slight effect in
sorption capacity were detected possibly due to mutual inhibitory influence of Pb
- Cu system.
Hussein et al. [65] under aseptic conditions prepare dead (non-living) biomass of
various Pseudomonas species for biosorption of Cr, Cu, Cd and Ni ions. The
study revealed maximum adsorption capacity for Ni followed by Cd, Cu and Cr.
Kumar et al. [17] isolate different microorganisms (Bacillus sp., Pseudomonas
sp., Staphylococcus sp., and Aspergillus niger) from soil and sludge through
enrichment process. As a batch culture, the isolated species were grown in
synthetic broth media amended with toxic metal solution. The biosorption
process evaluated that Pseudomonas and Bacillus sp. reduced Cu 4.165 mg L-1
and 3.332 mg L-1 (68% and 56%) and Ni 5.015 mg L-1 and 3.8 mg L-1 (65% and
48%) respectively. Aspergillus niger reduced Cd 0.267 mg L-1 (50%) and Zn
5.988 mg L-1 (58%) whereas Staphylococcus sp. reduced Cr 4.108 mg L-1 (45%),
Cu 2.615 mg L-1 (42%) and Pb 0.813 mg L-1 (93%). The results showed that
Pseudomonas sp. reduced heavy metals more than other microbes but
Staphylococcus sp. reduced 93% Pb which was comparatively higher uptake than
other studied metals.
Parungao et al. [66] investigate Stenotrophomonas maltophilia bacteria for Cu,
Cd, and Pb ions biosorptive removal from single and mixed metal aqueous
environment. Approximately 22% of Cu, 24% of Cd, and 42.75% of Pb were
removed from single metal solutions while 16% of Cu, 8% of Cd, and 35% of
Pb, were removed from three / mixed metal solutions.
Gelagutashvili [67] deliberate the biosorption capacity of cyanobacteria
Spirulina platensis for Cd, Ag and Au; Streptomyces sp. for Au and Arthrobacter

27
sp. for Cr. According to this study, the pH had a significant role in the removal
of Cd, Ag, Au and Cr metals.
2.3.2 ALGAL BIOSORBENTS
Algae were considered as a promising biosorbent because of their definite sorption
properties and copious availability in aqueous environment (e.g., oceans and seas). It
has been reported that the algae uptake efficiencies toward heavy metals are
comparatively higher (~15.3 - 84.6%) than other microbial biosorbents [68].
Unfortunately, the use of algae as a biosorbent material were rarely reported as
compare to fungi and bacteria. Of all species, brown algae have gained an exceptional
distinction as biosorbent because of its maximum adsorption capacity for metals (Cd,
Ni, Pb) due to specific chemical functionalities on their surface such as sulfonate,
carboxyl, and amino group [11].
Hamdy [69] investigate the biosorption capacity of brown and red algae species to
biosorb Cr, Co, Ni, Cu, and Cd heavy metal ions. In this study, author obtained a
significant increase in biosorption rate with the increase of time and biomass
concentration.
Kayalvizhi et al. [70] studied the biosorption of Pb ions onto Rhizoclonium hookeri.
The equilibrium of this study were attained within 30 min reaction time with a
subsequent fit for Freundlich isotherm and Pseudo second order kinetic model.
Thermodynamics verifies that the adsorption process is endothermic and spontaneous.
Prasher et al. [71] used an inexpensive and copious quantity of dried red
algae Palmaria palmata biomass for the removal of heavy metal ions (i.e., Pb, Cu, Ni,
Cd and Zn). The maximum sorption capacity acquired from Langmuir model were
15.17 mg g-1 for Pb and 6.65 mg g-1 for Cu at a pH range of 5.5-6.0. In this study, a
rapid uptake of heavy metals were achieved within first 10 minutes for Cu (70%) and
Pb (100%).
Ching [72] studied the biosorption of Cu, Zn, Cd and Pb metals using nonliving
marine algae (Sargassum sp.) biosorbent via batch and column techniques.
Adsorption of all the metals were rapid within 30 min, however equilibrium attained
after 120 min. The column experiments showed that the efficiency of heavy metal
removal were reduced with the rise of flow rate but improved with the increase of
column bed height.

28
Wilke et al. [73] examined that the cyanophyceae Lyngbya taylorii exhibited higher
uptake capacities for the selected metals from aqueous solutions. They attain
subsequent order of selective sorption: Pb >> Ni > Cd > Zn. It was observed that the
electrolytic metal ions (Na, Ca, K, and Mg) have a small interfering effect on the
sorption abilities of immobilized L. taylorii.
Sulaymon et al. [74] used a mixture of green and blue-green algae for the biosorption
of Pb, Cd, Cu and As in fluidized bed reactor. A higher affinity of the biomass
towards Pb was observed due to high electronegativity of this metal as compared with
others.
Kushwah and Srivastav [75] investigate the biosorption of Cu ions onto the dead
biomass of Spirogyra (green algae) in a batch mode. It was observed that the removal
process of Cu ions from aqueous solution were pH dependent and maximum removal
rate were achieved at pH 8.5.
Apiratikul et al. [24] used dried Caulerpa lentillifera for screening the adsorption
potential of Cu, Cd, Pb and Zn. The adsorption equilibrium follow the Freundlich
isotherm type. The total adsorption capacity of the algae in most of cases decrease by
30-50% when there were more than one heavy metal in the solution. However, the
adsorption of mixtures i.e. Cd and Cu, and of Pb and Cu did not show a reduction in
the total adsorption capacity.
Utomo et al. [76] investigated the capability of marine and freshwater algae biomass
for adsorbing heavy metals Cu, Pb, Zn and Cd from water medium using synthetic
water and industrial water. According to the findings, presence of several
functionalities on marine and freshwater algae surface (i.e., hydroxyl, carboxylic and
amine groups) enabled it to adsorb heavy metals.
2.3.3 YEAST BIOSORBENTS
Yeasts have a wide application in industries for fermentation processes. They
also used as biomass adsorption of toxic metal ions from contaminated water. As
a biosorbent, yeast species display excellent abilities for the metal uptake and
establish a strong complex resistance mechanism to counterbalance metal
toxicity [77].

29
Farhan and Khadom [78] evaluate the performance of Saccharomyces
cerevisiae yeast for the removal of Pb, Zn, Cr, Co, Cd, and Cu heavy metals
from aqueous system. Results of this study revealed rapid metal uptake at pH
range 5.0-6.0. The functionalities on the surface of yeast biomass (i.e. carboxyl,
amine, and phosphate groups) were supposed to the specific sites for metal ion
biosorption.
Infante et al. [79] studied the sorption properties of yeast S. cerevisiae for the
removal of dissolved Pb, Hg, Ni ions from drinking water. It was observed that
the biomass of S. cerevisiae removed a higher percentage of Pb (86.4%) as
compared to Hg and Ni (69.7 and 47.8% respectively) when the pH were set at
5.0.
Mata et al. [80] describe the biosorptive capacity of selected yeast species toward Zn,
Cu, Mn, and Fe ions. The yeast were isolated from continuous system of San Pedro
River. In this study, after 40-days of experimental period a noticeable reduction were
obtained in biosorption of heavy metals (i.e. Zn 81.5%, Cu 76.5%, Mn 95.5%, and Fe
99.8%).
Tálos et al. [81] investigate the biosorption of Cd from synthetically contaminated
aqueous solution by native baker’s yeast. The highest metal uptake value was 110 mg
g-1 in a suspension of 0.3 g L-1 yeast at pH 6.0. The adsorption equilibrium were
reached within 60 minutes and the sorption process followed pseudo second order
kinetics.
Breierova´et al. [82] studied the accumulation of Cd metal in different forms of yeasts
(Hansenul aomala, S. cerevisiae). Result shows, the highest concentration of Cd in
the growth medium were tolerated by H. aomala strain, while the lowest tolerance
were recorded for S. cerevisiae. It is assume that the composition of saccharide
moiety in the extracellular glycoproteins may responsible for the difference in
adsorption tolerance.

30
2.4 FUNGAL BIOMASS AS NATURAL BIOSORBENT FOR METAL ION
REMOVAL
Table 2.1 Overview of biosorbents and their sorption capacities for selected
metals.
Microbial
Group
Microbial
biosorbent Metal pH
Dose
(g)
Temp.
(°C)
Time
(min)
Initial
metal ion
concentration
(mg L-1)
Capacity
(mg g-1) Ref.
Bacteria
Arthrobacter sp. Pb(II) 5.75 9.9 - - 108.79 9.6 [85]
Streptococcus pyogenes
Hg(II) 8 - - - - 4.8 [86]
Algae
Sargassum fusiforme
(a)Hg(II)
(b)Cd(II) 8-10 2.0 - 60 10
(a)30.86
(b)7.69 [87]
Spirulina platensis
Pb(II) 3 2.0 26 60 100 - [88]
Spirulina platensis
Pb(II) 7 2 25 60 50 40 [19]
Chlamydomonas reinhardtii
(a)Hg(II)
(b)Cd(II) (c)Pb(II)
6 5-35
60 -
(a)72.2
(b)42.6 (c)96.3
[89]
Oedogonium urceolatum
Hg(II) 4 0.3 - 90 300 375 [90]
(a) Sargassum glaucescens and
(b)Gracilaria corticated
Hg(II) (a)5
(b)7 - -
(a)90
(b)30
(a)200
(b)1000
(a)147.05
(b)4.71 [91]
Yeast Saccharomyces
cerevisiae Hg(II) 5 - 35 60 200 114.6 [92]
Fungi
Trichoderma harzianum
Cr(II) 2 0.1 - 180 25 50 [93]
Phanerochaete chrysosporium
(a)Cd(II)
(b)Pb(II)
(c)Cu(II)
6 0.2 25 360 100
(a)23.04
(b)69.77
(c)20.23
[94]
Streptomyces fradiae
Pb(II) 5 1 - 120 10-200 138.88 [95]
Rhizopus oligosporus
Hg(II) 6 1 30 360 20-100 33.33 [96]
Penicillium purpurogenum
(a)As(III) (b)Hg(II)
(c)Cd(II)
(d)Pb(II)
5 - 20 240 100
(a)35.6 (b)70.4
(c)110.4
(d)252.8
[94]
Lycoperdon perlatum
Hg(II) 6 4 - 60 10 107.4 [97]
Aspergillus terreus
(a)Hg(II)
(b)Pb(II) (c)Cd(II)
5 - 30 90
(a)800
(b)6000 (c)300
(a)41.26
(b)253.16 (c)25.72
[98]
Aspergillus niger
Hg(II) 3 0.8 40 120 250 405.3 [99]

31
Of all the toxic metal ion adsorbing micro / macro organisms, fungal biomass
were considered as an exceptional biosorbent because of its excessive growth
and informal cultivation [83]. It’s highly filamentous morphology and bulk cell
wall material makes it a proficient adsorbent that can exploit over a wide - range
of pH, temperature and concentration [84]. To get productive outcomes,
numerous fungal species can be used for the biosorption process [100] that:
• Acquired by high fermentation rate,
• Extensively use in food production,
• Require easy cultivation in reasonable broth media,
• Being by-product or industrial fermentation waste in large quantities, and
• Have environment friendly properties.
All these attributes exhibited that the fungal cells have enormous capacity to bind /
aggregate heavy metals and anions. Hence, fungi can actively exploit for the
removal of toxic metal from polluted drinking water and industrial effluents.
In a study by Júnior et al. [101], the effectiveness of a fungal isolate, Aspergillus
niger for concurrent removal of heavy metals from industrial effluent were
examined. Their study inferred that biosorption process with A. niger could be
successfully used for heavy metal removal at a pH of 4.75 from oil field water in
the oil industry.
The biosorption capacity of previously reported biosorbents (bacteria, algae,
yeast, fungi) as presented in Table 2.1, shows that most of the species are able to
absorb appreciable amount of Pb(II), Hg(II), and Cd(II) ions metal ions from the
aqueous solution under optimum conditions.
2.5 REMOVAL OF ANIONS BY VARIOUS BIOSORBENT
The research on biosorptive removal of anions has adopt a less attention since
past two decades. As compare to heavy metals biosorption, only a few studies
were reported on anionic removal. In this section, only available anionic removal
reports were discussed. The removal of F- and NO3- anion as sorbate is part of
this thesis study.

32
Bacteria belongs to Bacillus, Geobacillus, Arthrobacter, Micrococcus,
Pseudomonas genus and fungi like Aspergillus, Rhizopus, Trichoderma,
Neurospora species have revealed a substantial sorption capability for various
ions.
Dwivedi et al. [102] used Shewanella putrefaciens for the sorption of F-ions
from aqueous solutions. In this study, the simultaneous adsorption reduced the
initial concentration of F- from 20 to >1.5 mg L-1 at pH 7.0.
Mohan et al. [103] studied the adsorption performance of non-viable algal
Spirogyra as biosorbent toward F- removal from aqueous phase at lower pH
range. In addition, Hiremath and Theodore [104] used a fixed bed / packed
column to determine the potential of immobilized Chlorella vulgaris in calcium
alginate beads to remove F- from synthetic and real water.
Taziki et al. [105] studied the NO2- and NO3
- removal from contaminated water
using micro-algae Chlorella vulgaris, Neochloris oleoabundans and Dunaliella
tertiolecta. In this study, alternative culture methods, immobilization and biofilm
formation for NO3- remediation were introduced that decrease the costs of
harvesting process.
Merugu et al. [106] investigate Ca and alkali treated Aspergillus nidulans fungal
biomass for the removal of F- from aqueous environment. The defluoridation of
water were strongly pH dependent, it decrease with increase of solution pH.
Prajapat et al. [107] identified saw dust, Aspergillus penicilloides and Mucor
racemosus (Division-Mycota) as a potential biomaterial for removal of Ca and F-
ions. The study revealed that the presence of specific cations on biomass surface
enhance the adsorption of anions. Typically, this increase in sorption is not
possible due to the presence of large number of negative charge on cell-surface.
Chen et al. [108] studied the equilibrium and kinetics of PO43- removal from
aqueous solution on hydro-thermally modified oyster shell material. The optimal
pH 11.0 were used for the maximum phosphate adsorption.
Hrenovic et al. [109] used an immobilized bio-solids to enhance the PO43-
removal from contaminated water in an aerated biological system. They acquired
179.0 meq/100 g of dry bentonite cation exchange capacity (CEC) for the
constructed system.

33
Hence it can be inferred from this detailed survey that there is a potential need of
novel natural material especially micro and macro organisms for the removal of
toxic pollutant from water system.
2.6 PLEUROTUS ERYNGII – A COMMON EDIBLE MACROFUNGI
The fruiting stage of mushroom Pleurotus species occupies 5th position in the
world of all the edible basidiomycetes fungi. Usually they grown in nature as
saprophytic fungi on wood trunks. Pleurotus fungi in fruit form termed as
“oyster mushroom” because of the opening of its eccentric stalk like an oyster
shell during morphogenesis. According to latest reports, in recent years the
production of Pleurotus booming in Taiwan and Japan [110]. Its high cultivation
and yields also made it extra popular in several renowned countries of the world
like - Australia, Canada China Europe, United States, and many Asian parts.
2.6.1 PHYSICAL DESCRIPTION
The main characteristics of Pleurotus eryngii mycelial morphology [111] are
presented in Table 2.2.
Table 2.2 Morphology of P. eryngii.
Characteristics Visual observation
Surface state Cotton fibrous
Compactness Semi-solid
Pigmentation Off-white or whitish
Growth form Regular, plentiful and bulk
2.6.2 GROWTH HABIT
In China, the crop of P. eryngii – mushroom were extensively cultured due to its
rapid environmental adaptations in specific climatic conditions. The strain of
Pleurotus species have capability to colonize a range of higher plants with an
extensive natural ligno-cellulosic wastes [111]. Consequently, its fruit can grow
over a wide range of temperature (usually 15 to 31°C).

34
2.6.3 SCIENTIFIC CLASSIFICATION OF P. ERYNGII
The scientific classification of P. eryngii presented [112] in Table 2.3.
Table 2.3 Scientific classification of P. eryngii.
2.6.4 EFFECTIVENESS OF P. ERYNGII AS BIOSORBENT
Unlike other microorganisms, P. eryngii were applicable as a good biosorbent
because of its semi-solid consistency, bulk structure and some specific physical
features which makes it a favorable biomass for ionic removal without any
modification / immobilization of surface [127-130]. Therefore, the present study
were designed to estimate the maximum adsorption performance of the
infrequently yielding mushroom P. eryngii mycelia as a biosorbent for the
removal of toxic metals and anions from aqueous solutions.
2.7 SUMMARY
Several studies have been reported for the efficient removal of toxic chemical
pollutants from water system using variety adsorbents (natural and synthetic),
but only a few research work has been reported on the removal of toxic ions by
P. eryngii fungal biomass. In previous investigations, P. eryngii were used as
whole mushroom (fresh fruit body of macro fungus), in immobilized form, and
as lyophilized (freeze dried) cells. However, the potential of mycelial form
toward toxic pollutants remains unknown.
Rank Taxonomy
Phylum Basidiomycota
Class Agaricomycetes
Order Agaricales
Family Pleurotaceae
Genus Pleurotus
Species Pleurotus eryngii
Kingdom Fungi

35
Thus, there is a need to study the biosorption performance of Pleurotus fungal
strain to obtain sufficient data for practical application. This research were
developed to study the potential use of P. eryngii for the removal of toxic metal
ions Pb(II), Hg(II), Cd(II) and anions (F-, NO3-) from aqueous solutions.

36
CHAPTER 3
RESEARCH METHODOLOGY
This chapter covers the material and methods which were employed during the
biosorption experiment for batch and packed bed column system. It also consists
of characterization methodologies for fungal biomass by simple and rapid
techniques (FTIR, AFM, SEM-EDX).
3.1 CHEMICALS AND REAGENTS
Concentrated H2SO4, HNO3, HCl and NaOH, Na2BO4 were of analytical grade
acquired from Sigma-Aldrich (Steinheim, Germany) and Merck (Darmstadt,
Germany). Stock standards of Pb, Hg, Cd, F- and NO3- were prepared for
calibration from standard solutions of Fluka Chemika (Bushs, Switzerland). All
plastic and glass wares were thoroughly washed then rinsed with distilled /
deionized water. After washing, the apparatus were dried up in an electric oven.
Potato dextrose agar (PDA), glucose, peptone used were of analytical grade
(Scharlau, Spain & Daejung, Korea).
3.2 FUNGAL STRAIN
For biosorption study, the fungal strain of P. eryngii ATCC® 90888 TM were
procured from Edible Fungi Institute, Shanghai Academy of Agricultural
Sciences, Shanghai, China.
3.2.1 INOCULUM PREPARATION
Figure 3.1 (a) P. eryngii maintained on PDA plate.

37
Fungal culture were routinely maintained on PDA slants / petries (Figure 3.1a).
To yield the bulk quantity of mycelial biomass for biosorption experiments, the
seed culture were prepared by loop inoculation in GPB (glucose peptone broth)
(Figure 3.2b). The formulation of liquid medium (broth) prepared in laboratory
composed of g L−1; glucose (50), peptone (5), KH2PO4 (5) and NaCl (5), adjusted
to pH 6.0 ± 0.2 and incubated for 27 days at 27 ± 2ºC [113].
Figure 3.2 (b) Wet colony sub-cultured on GPB.
3.2.2 DRIED BIOSORBENT PREPARATION
Figure 3.3 (c) Dried biomass of P. eryngii.
After 27 days’ cultivation, the fungal mycelium were harvested by filtration of
liquid medium and washed persistently with ultra-pure water. The process of
cell washing were carried out till the dark brown color of washing fluid (i.e.
water) turns to transparent. The resultant fungal biomass afterward evaporated to
dryness at 60 °C for 24 hours.

38
After suitable drying, the biomass were finely divided (particle size of 0.18 mm)
into powder form and stored in a screw capped plastic bottle for subsequent
usage in biosorption experiment (Figure 3.3c). Before using fungal biosorbent,
no any immobilization / impregnation or activation were performed on biomass
surface.
3.2.3 PREPARATION OF BIOSORBENT IN DIFFERENT FORMS
To estimate the optimum operating state of cell mass, five different techniques
were also applied for the preparation of biosorbent shown in Table 3.1.
Table 3.1 Methods for the preparation of fungal cell mass.
Parts of fungal
cell State of cell mass Preparation method
Dead cell (non-living)
P-1 Oven dried Dehydrated (dried) in hot-air oven at
60ºC for 24 h
P-2 Air dried Dried in direct open-air atmosphere
P-3 Autoclaved Autoclave at 15 lb pressure for 15 min
Living cell (non-growing)
P-4 Living Water was soaked by blotting paper
P-5 Freeze dried Lyophilized for 75 min
3.3 PREPARATION OF STANDARD SOLUTIONS
The stock solutions (1000 mg L-1) of Pb, Cd, F- and NO3- were prepared by
dissolving 4.58, 2.29, 2.21 and 1.63 g of Pb(NO3)2, 3CdSO4·8H2O, NaF and
KNO3 respectively in 1000 mL deionized water (conductivity 0.050 μS cm−1);
however 100 mg L-1 Hg stock solution were prepared by dissolving 0.135 g of
HgCl2 in 1000 mL deionized water. The standard solutions of metal ions were
prepared regularly by dilution of stock solutions. The ionic-Hg were reduced to
metallic-Hg by NaBH4 in an HCl matrix. The reductant solution (reducing agent)
were prepared by NaBH4 (0.2%) (w/v) in NaOH (0.5%) (w/v), while the acid
solution was 10% w/w HCl.

39
The pH of the test solutions were adjusted according to subsequent experimental
design with 0.1 M NaOH or 0.1 M HCl solutions.
3.4 ANALYTICAL INSTRUMENTATION
Innova 4230 Incubator (New Brunswick Scientific Co; Huntingdon, UK) was
used for the batch experiments. The pH meter (InoLab-WTW GmbH; Weilheim,
Germany) with glass electrode and an internal reference electrode was used for
pH measurements.
The quantification of Pb(II) and Cd(II) ions before and after the sorption
equilibrium were carried out by Varian AA 20 spectra atomic absorption
spectrometer (Mulgrave, Victoria, Australia) equipped with cathode lamp of
respective elements.
A system equipped with MHS-15 Mercury / Hydride System were used in this
study for the analysis of Hg(II) ions. The Varian vapor generation accessory
(VGA-77, Australia) uses a peristaltic pump to intermingle sample with a supply
of nitrogen gas. The N2 and Hg volatiles were released from the gas-liquid
separator. The separated gas flows into a flow-through cell arranged on path of
the light from AAS. The optimum conditions used throughout these studies are
given in Table 3.2.
Table 3.2 Conditions of F-AAS for Pb(II), Cd(II) and HG-AAS for Hg(II)
ions determination.
Parameter Pb Cd Hg
Wavelength (nm) 217.0 228.8 253.7
Hollow cathode lamp current (mA) 5 4 4
Type of flame Air-C2H2 Air-C2H2 -
Background correction ON ON ON
Slit width (nm) 1.0 0.5 0.5
Acetylene flow rate (L min-1) 1.5 1.5 -
Air flow rate (L min-1) 3 3 -
Flame condition Oxidizing Oxidizing -
Expansion factor 1 1 -
Reading time (s) - - 60
Nitrogen flow rate (mL min-1) - - 50

40
During column studies, the flow rates of Pb(II) solution were optimized by
peristaltic pump (Eyela MP3, Tokyo Rikakikai Co., Ltd. Japan). The flow system
were made of PTFE 0.5 mm i.d.
For F- analysis, the Ion-Chromatograph (Ω Metrohm; Herisau, Switzerland)
instrument 861 Advance Compact with 833 IC liquid handling unit equipped
with self-regenerating suppressor consists of a double gradient peristaltic pump
along with conductivity detector were used. The anion column (4.0mm×250mm)
METROSEP A SUPP 4-250 with carbonate and bicarbonate buffer mobile phase
were used. The IC conditions for the analysis of F- ions are given in Table 3.3.
Table 3.3 Conditions of IC for F- ions determination.
Perkin Elmer (Shelton, CT 06484, USA) Lambda 35-UV–Vis spectrophotometer
were used to record NO3- ion UV–Vis spectra at an absorbance of 410 nm
following reagent blank. The NO3- ions in the filtrates were measured through
directions of Environmental Protection Agency (EPA) approved Brucine method
[114].
The chemical and morphological characterization of P. eryngii before and after
metal and anions sorption was studied by SEM equipped with EDX analyzer
(JEOL; Tokyo, Japan). FTIR spectra were recorded on a Nicolet 5700 FTIR
spectrometer (Thermo Electron; USA) as KBr pellets; whereas, elemental
IC anion column METROSEP A SUPP 4
Particle size 9.0 µm
Eluent 1.8 mmol Carbonate;
1.7 mmol Bicarbonate.
Eluent flow rate 0.5 mL min-1
Temperature 20°C
Pressure 4-5 MPa
Injection volume 20 µL
Detector Conductivity detector

41
analysis were performed with elemental analyzer (Flash EA 1112; Rodano-
Milan, Italy) and AFM (5500 Agilent; USA) respectively.
3.5 POINT OF ZERO CHARGE (PHPZC)
For pHPZC of the biomass, 50 mL KNO3 (0.1 M) solution were added in a series
of 11 conical flask (100 mL). The initial pH of flasks were adjusted from pH 2.0
to 12.0 by HCl and NaOH (0.1 N) solutions. Subsequently, 0.1 g P. eryngii
biomass were added to all flask. Tightly stoppered flasks were then kept for
agitation at room temperature (for about 48 hours). After completion of 48 hours,
the final pH of the supernatant liquid were record [113].
3.6 BATCH BIOSORPTION EXPERIMENT
The biosorption study were initiated by batch experimental process. Table 3.4
shows different experimental conditions to optimize the sorption efficiency of
metals and anions.
Table 3.4 Experimental conditions and their ranges used to optimize the
sorption efficiency of metals and anions.
In typical procedure, a known quantity of biomass (0.1 g) in each 100 mL
conical flask and 5 mg L-1 Pb(II), 5 mg L-1 Cd(II), 1 mg L-1 Hg(II), 2 mg L-1 F-
solution with suitable volume were agitated at 100 rpm for 20, 15, 30 and 10 min
respectively at pH 7.0 keeping ambient temperature of 27 ± 2ºC. Figure 3.4
showing a batch biosorption study that was conducted in laboratory.
Metal /
anion
Range of parameters
pH Biosorbent
dose (g)
Initial
concentration
(mg L-1)
Time
(min)
Temperature
( C)
Pb(II) 2-9 0.2-0.45 1-10 5-40 30-60
Cd(II) 3-8 0.1-0.5 4-20 1-15 30-70
Hg(II) 3-9 0.15-0.35 0.5-10 1-6 30-60
F- 2-7 0.1-0.5 5-25 60-300 15-30

42
After completion of the sorption process, the mixture were filtered under
Whatman’s filter paper No. 42 and also by 0.45 µm syringe filter. Later on,
metal ion / anions were quantified in the filtrate solution.
Figure 3.4 Biosorption study by batch experimental procedure.
3.7 CONTINUOUS (PACKED COLUMN) BIOSORPTION EXPERIMENT
For continuous biosorption investigation, a mini glass column of 5 mm x 120
mm dimension were filled with the glass wool followed by a layer of glass beads
(~2 cm) at the base. Then a calculated amount of sorbent material were packed in
column to carry on process parameters.
Figure 3.5 Biosorption study by column experimental procedure.

43
From column inlet, the Pb ion solution (influent) of 20, 30 mg L-1 concentrations
were pumped through the packed column of different bad heights (1, 2 and 3
cm), at optimal flow rates (1, 3 and 5 mL min-1). The samples were collected
from outlet portion and examined for remaining Pb concentration. Figure 3.5
showing a column biosorption study that were conducted in laboratory at room
temperature.
3.8 INTERFERENCE STUDIES
In addition to targeted metal ion and anions, an aqueous solution also contain
several other ions. Therefore, to check the selectivity / efficiency of P. eryngii
biomass toward specific ion; sorption experiments of Pb(II), Cd(II), Hg(II), F-
were performed in the existence of supplementary ions respectively, keeping
different combination of folds.
3.9 DESORPTION STUDIES
Desorption and reuse experiments were performed at room temperature to check
the reusability of the spent sorbent for the consecutive cycles. For this study, the
metal ion and anion loaded biomass (washed with ultra-pure water) were shaken
in 0.1 N each HNO3, H2SO4, HCl, and NaOH, EDTA, NaCl desorbing agents /
eluents for 30 min at 100 rpm to desorb loaded Pb(II), Cd(II), and F- ion
respectively from fungal biomass at predetermined temperature, then the
resultant filtrate were analyzed for the residual content. Besides, the Hg(II) ions
were desorbed with 10 mL of HCl with different concentrations (0.1–5.0 M),
followed by deionized water.
The reusability studies of the biosorbent were conducted by introducing desorbed
biomass again in the fresh ionic solution. The procedure can repeat for
consecutive adsorption-desorption cycles.
3.10 STATISTICAL METHODOLOGY FOR NO3- IONS
To determine the factors and interaction effects of various parameters that
influence the biosorption of NO3- ions, a three level-three factors CCD with 17

44
runs to locate the true optimum values of pH (A), biosorbent dose (B), and initial
NO3- concentration (C) combining factorial points as low (-1), medium (0), and
high (+1) of experiment was applied, as shown in Table 3.5.
Table 3.5 Experimental ranges and level of the independent variables.
For each run, weighed amount of sorbent were added to flasks containing 10 mL
of NO3- ion solution and pH was adjusted to the desired value by NaOH or HCl
solutions. The flasks were agitated at a preset temperature (30 ± 3°C) in an
incubated rotary shaker at 100 rpm. The suspension were then filtered and the
NO3- content in the filtrates were determined through UV-Vis spectrophotometer
@ 410 nm absorbance (EPA approved Brucine method) after an appropriate
calibration of the instrument.
3.11 CALCULATION OF DATA
The biosorption capacity i.e., amount of metal ions and anions biosorbed on P.
eryngii were calculated by the following equation (18):
Q = (C − CJ)M V − − − − − (18)
where Q is the metal ions / anion uptake (mg g−1), V is the solution volume (L),
Ci and Cf are the initial and final ionic concentrations in the solution (mg L−1)
respectively, and M is the mass of biosorbent (g).
Biosorption efficiency of metal ions and anions calculated by the following
equation (19):
Biosorption efficiency (%) = C − CJC
x 100 − − − − − (19)
Factor Units Coded
symbols Range and level
1 0 +1
pH - A 2 7 12
Biosorbent dose g B 0.1 0.24 0.4
Initial NO3- concentration mg L-1 C 60 700 1340

45
Desorption efficiency were calculated from the following formula (20):
%Desorption Amountofsorbatedesorbedpereffluent
AmountofsorbateloadedonbiosorbentZ 100 20
3.12 ANALYSIS OF COLUMN DATA
The overall amount of sorbate adsorbed in column (mad) were calculate from the
area above the breakthrough curve multiplied by the flow rate.
Dividing the amount of sorbate (mad) by the amount of biosorbent (M) clues to
the uptake capacity (Q) of biomass.
The whole quantity of sorbate sent to the column were calculate from the
following equation (21):
m-E- [ CFte
1000 21
where C0 is the inlet sorbate concentration (mg L-1); F is the volumetric flow rate
(mL h-1); and te locate the exhaustion time (h).
Total sorbate removal (%) with respect to flow volume were calculate from the
ratio of sorbate mass adsorbed (mad) to the total amount of sorbate sent to the
column (mtotal) as follows (22):
Totalsorbateremoval% m 5
m-E- [
x100 22
3.13 STATISTICAL ANALYSIS
The Design-Expert® software (Version 9.0.6.2, Stat-Ease, Inc., Minneapolis,
USA) were used for designing experiments as well as for regression coefficients
and graphical analysis of the experimental data.

46
3.14 REAL WATER SAMPLE FOR ANALYTICAL APPLICATION
To explore the adsorption performance of P. eryngii at natural conditions, the
sorption experiments were carried out using real water samples collected from
different regions of Sindh Province, Pakistan (Figure 3.6). The details of the
sample collection sites along with geographical coordinates (GPS-Global
Positioning System) are presented in Table 3.6.
Figure 3.6 The map of Sindh showing sampling zone in red arrows. [Image courtesy:
Google map].

47
Table 3.6 Detail of water collection sites and GPS co-ordinates monitored for
each zone.
S.
No.
Water-sample
collection site* GPS co-ordinates
Latitude Longitude
1. Karachi 24.8607° N 67.0011° E
2. Dadu 26.7341° N 67.7795° E
3. Tharparkar 24.8777° N 70.2408° E
4. Kotri 25.3494° N 68.2743° E
5. Jamshoro 25.4304° N 68.2809° E
6. Hyderabad 25.3960° N 68.3578° E
7. Nawabshah 26.2447° N 68.3935° E *Regions of Sindh Province, Pakistan.

48
CHAPTER 4
RESULTS AND DISCUSSION
PART 1
Remarks: All work of this part has been published in J. Int. J. Environ. Res.
3(11):315-325.
4.1 ECO-EFFICIENT FUNGAL BIOMASS FOR THE REMOVAL OF PB(II)
IONS FROM WATER SYSTEM: A SORPTION PROCESS AND MECHANISM
Part 1 describes the Pb(II) ion sorption potential of a newly cultured fungal
biomass P. eryngii from aqueous media. The fungal biomass was prepared by
loop inoculation and incubating the fungus in GPB. The fungal biomass was
characterized by using FTIR and AFM.
4.1.1 CHARACTERIZATION OF THE BIOSORBENT
FTIR ANALYSIS
The FTIR spectra of unloaded and Pb(II) loaded biomass forms was used to
identify the functional groups involved in the adsorbing process, which is
important for elucidation of the surface-bonding mechanism.
The FTIR spectrum of pure fungal biomass (Figure 4.1a) showed several distinct
and sharp absorptions at 3380 cm−1 (−OH or −NH2 groups), 2923-2852 cm−1 (C–
H groups), 1724 cm−1 (C=O of protein bonds), 1654 cm−1 (N–H and C-N of
amide groups), 1558.25 cm-1 (types I and II vibrating amid), 1380 cm−1 (C = O
of amide I) and at 1043 cm−1 (C-O-C and C-O of polysaccharide) [115]. The
FTIR spectra of Pb(II) ions loaded fungal biomass (Figure 4.1b) suggested no
shifts or change in any of the characteristic absorbance bands except for a peak
shift at 3399 cm−1, 1644 cm−1 1547 cm−1, and 1085 cm−1 after loading of Pb(II).
The significant changes in the wave number of these peaks after loading of
Pb(II) indicate that the functional groups i.e.; amido, hydroxyl, and carboxyl
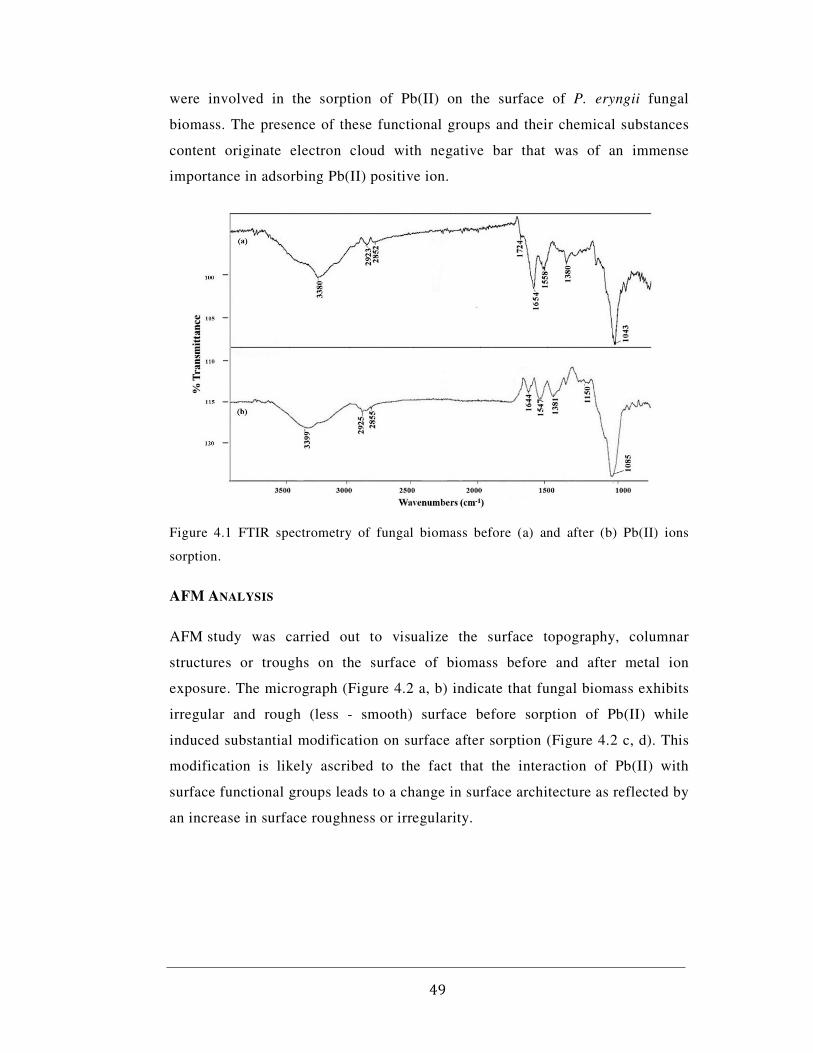
49
were involved in the sorption of Pb(II) on the surface of P. eryngii fungal
biomass. The presence of these functional groups and their chemical substances
content originate electron cloud with negative bar that was of an immense
importance in adsorbing Pb(II) positive ion.
Figure 4.1 FTIR spectrometry of fungal biomass before (a) and after (b) Pb(II) ions
sorption.
AFM ANALYSIS
AFM study was carried out to visualize the surface topography, columnar
structures or troughs on the surface of biomass before and after metal ion
exposure. The micrograph (Figure 4.2 a, b) indicate that fungal biomass exhibits
irregular and rough (less - smooth) surface before sorption of Pb(II) while
induced substantial modification on surface after sorption (Figure 4.2 c, d). This
modification is likely ascribed to the fact that the interaction of Pb(II) with
surface functional groups leads to a change in surface architecture as reflected by
an increase in surface roughness or irregularity.

50
Figure 4.2 AFM microscopic images of fungal biomass: before Pb(II) exposure (a:
height image; b: three-dimensional image) and after Pb(II) exposure (c: height image; d:
three-dimensional image).
4.1.2 OPTIMIZATION OF EXPERIMENTAL PARAMETERS
EFFECT OF PH
The effect of the pH of a solution is a major factor that can significantly affect
the sorption of heavy metals. It is related to the capability of the hydrogen ion
competition with the active site on the sorbent surface. From the results of Pb(II)
ions uptake with respect to varied pH (Figure 4.3) it was inferred that, except at
pH 2 and 3, where there was low level of Pb(II) ion sorption (39.5 and 45%), in
all other pH levels (4, 5, 6, 7) there was more than 50% sorption achieved. The
possible reasons for the lower removal at pH < 4 is that, sorbent are protonated
and restrict the entry of metallic ions; and at pH > 4, the groups responsible for
the retention of metals are negatively charged facilitating the binding of the
metals ions [116]. Therefore, pH 6 (86%) was considered as the optimum pH in

51
which competition of hydrogen ions reaches to minimum and consequently metal
sorption increases.
Figure 4.3 Percentage removal of Pb(II) ions as a function of pH (volume: 20 mL;
sorbent dose: 0.2 g; initial concentration: 50 mg L−1; contact time: 30 min; temperature:
27°C).
EFFECT OF DOSE
The sorption efficiency is highly dependent on the biomass dosage. Figure 4.4
shows that the rate of Pb(II) ion removal increased by 80% with increase of
sorbent concentration from 0.2 to 0.35 g and then decrease after this dosage
level. With sorbent concentration of 0.2 g, the rate of sorption was slightly low
and equilibrium was obtained faster. In lower doses, sorption level is lower due
to less adsorption sites. Moreover, it was observed that maximum sorption of
about 90% Pb(II) ions was attained using 0.35 g biomass compared to other
dosages. This is probably due to increase in number of available adsorption ionic
sites as the sorbent dose increased, since the concentration of metal ions in
solution is fixed, initially more ions get exchanged with the metal ions but after
the saturation is reached adsorption decreases. After this dosage, there was a
decrease in adsorption levels could be attributed to the consequence of partial
aggregation of biomass at higher concentrations.

52
Figure 4.4 Percentage removal of Pb(II) ions concentration as a function of biosorbent
dose (volume: 20 mL; pH: 6.0; initial concentration: 50 mg L−1; contact time: 30 min;
temperature: 27°C).
EFFECT OF TEMPERATURE AND ADSORPTION THERMODYNAMIC STUDIES
The effect of temperature on sorption was carried out from 30-45°C (303-318
K). The Pb(II) removal efficiency changed insignificantly from 90.0% to 75.0%
when the temperature increased above 30°C as shown in Figure 4.5. It is because
elevated temperatures tend to decrease the boundary layer thickness; metal ions
therefore had increased tendency to escape from the biomass surface to the
solution phase.
Figure 4.5 Percentage removal of Pb(II) ions concentration as a function of temperature
(volume: 20 mL; pH: 6.0; sorbent dose: 0.35 g; initial concentration: 50 mg L−1; contact
time: 30 min).

53
The decreased adsorption with increasing temperature also suggests weak adsorption
interaction between biomass surface and the metal ion, which supports physio sorption.
This result indicated that Pb(II) adsorption by the fungal biomass was temperature -
dependent.
To understand the adsorption mechanism of the Pb(II) ions onto fungal biomass,
thermodynamic parameters of the adsorption system were analyzed as given in
Table 4.1. The parameter like Gibbs free energy (ΔGº) was calculated according
to the equation 14, whereas, enthalpy (ΔHº), and entropy (ΔSº) were calculated
from the Van’t Hoff plot of lnKc versus 1/T (Figure 4.6) according to the
equation 15.
Table 4.1 Thermodynamic parameters for Pb(II) ions removal by P. eryngii at
various temperatures.
Figure 4.6 Van’t Hoff plot, log Kc versus 1/T.
T (K) ∆Gº (kJ mol-1) ∆Hº (kJ mol-1) ∆Sº (kJ mol-1 K-1)
303 -5.532
-55.058 -0.164
308 -3.881
313 -3.605
318 -2.903

54
The negative ΔGº values for all temperatures revealed that the adsorption of
Pb(II) onto biomass could occur spontaneously. The negative value of ΔHº
showed that the Pb(II) adsorption is an exothermic process, while the negative
ΔSº value implied that the orderliness at the solid-liquid interface increased
during the adsorption process and this adsorption process was reversible.
EFFECT OF CONCENTRATION AND ADSORPTION ISOTHERM STUDIES
The effect of Pb(II) ion concentration on the sorption efficiency of P. eryngii
fungal biomass was done under optimum conditions as shown in Figure 4.7. The
percentage of Pb(II) ions adsorption decreased with increasing initial
concentration from 30-70 mg L-1 (96% to 69.2%).
Figure 4.7 Effect of concentration of Pb(II) ions on their percent removal over P.
eryngii (volume: 20 mL; pH: 6.0; sorbent dose: 0.35 g; temperature: 30°C; contact time:
30 min).
This is because at lower concentration there are sufficient active sites that Pb(II)
ions can easily occupy. However, at higher concentrations, active sorption sites
are not sufficiently available for the adsorbate to occupy. Hence, Pb(II) ions
were not completely adsorbed from solutions due to the saturation of binding
sites.
Langmuir, Freundlich, Temkin and D-R adsorption isotherm models were
applied to evaluate the sorption phenomenon between surface of P. eryngii and
Pb(II) ions during sorption reaction.

55
The linear form of Langmuir adsorption isotherm is represented as equation 1.
The straight line of plot (Figure 4.8a) indicated that all adsorption processes
could be well described by Langmuir model. Parameters and correlation
coefficients calculated from corresponding models were given in Table 4.2,
suggesting that the adsorption is complex, containing physical and chemical
processes. The adsorption process of Pb(II) ions onto fungal biomass could be
considered as monolayer adsorption.
Figure 4.8 Adsorption isotherms plot (a) Langmuir, (b) Freundlich, (c) Temkin, and (d)
D-R.
The essential characteristics of Langmuir isotherm model can be expressed in
terms of dimensionless constant separation factor RL which has four
probabilities: (1) 0 < RL <1, favorable adsorption; (2) RL > 1, unfavorable
adsorption; (3) RL = 1, linear adsorption; and (4) RL = 0, irreversible adsorption.
The separation factor RL is calculated using equation 2. Because values of RL
obtained under the conditions of 30 °C were between 0 and 1, indicating that the
uptake of Pb(II) by fungal biomass was favorable.

56
The linear form of Freundlich adsorption isotherm describes the formation of
multilayers of the adsorbate on the heterogeneous sorbent surface is represented
as equation 3. These constants were determined from a plot of qevs. Ce (Figure
4.8b) given in Table 4.2.
Table 4.2 Isotherms model constants and their respective coefficients for Pb(II)
ions sorption onto fungal biomass.
The linear form of Temkin adsorption isotherm is represented as equation 4 and
5. The Temkin parameter obtained from plot (Figure 4.8c) are given in Table 4.2.
The A value gives an idea about nature of adsorption, in present study A value is
> 8 which indicate the adsorption is chemical in nature.
To evaluate the adsorption type, equilibrium data were further applied to D-R
isotherm with following equation 6. The calculated parameters of D-R model
(Figure 4.8d) are presented in Table 4.2. The value of E was greater than 8 kJ
mol-1, indicates that the interaction of fungal biomass with Pb(II) ions is
chemisorption in nature.
Langmuir
Qo mg g−1 2.971
B L mg−1 0.574
RL - 0.055-0.024
R2 - 0.99
Freundlich
Kf mg g−1 1.546
N - 5.136
R2 - 0.932
Temkin
bT kJ mol-1 6.018
KT L g-1 34.902
R2 - 0.904
D-R
q max mg g-1 5.959
KDR mol2 J-2 0.0014
E kJ mol-1 18.9
R2 - 0.925

57
Qo is a critical parameter for describing the adsorption performance of
adsorbents. The Pb(II) ion adsorption capacity of P. eryngii fungal biomass and
other adsorbents were compared and shown in Table 4.3. Qe for Pb(II) adsorption
on P. eryngii were better than more of these reports. Nevertheless, the sorption
capacity of fungal biomass can further be increased by modifying the sorbent
surface.
Table 4.3 Comparison of sorption capacities of different adsorbents in the
literature with the current biosorbent.
EFFECT OF TIME AND ADSORPTION KINETIC STUDIES
The plotted results in Figure 4.9 shows that with the increase in contact time
from 0.5-25 min, the rate of Pb(II) ions uptake was fast and maximum removal
of 100% was obtained within 5 min of reaction time. From observation, it is also
exposed that the Pb(II) ions sorption efficiency increases in the initial stage but
progressively decreased and become constant when equilibrium reached. The
trend in Pb(II) ions adsorption gives an indication that the binding may have
occurred due to conjugation with functional groups located on the surface of the
fungal biomass and a few minutes later, unavailable surface sites are hard to be
filled due to repulsive forces between the Pb(II) on the solid and the aqueous
phases.
Biosorbent Sorption capacity (mg g-1) References
Phanerochaete chrysosporium 2.0 [117]
Bagasse fly ash 2.50 [118]
Agave sisalana 1.34 [119]
Yerba mate waste 1.78 [120]
Treated corn (Z. mays) leaves 0.31 [121]
Blighia sapida (Akee apple) 0.38 [122]
Spent coffee grounds 2.46 [2]
P. eryngii 2.97 Present study

58
Figure 4.9 Effect of concentration of Pb(II) ions on their percent removal over P.
eryngii as a function of contact time (volume: 20 mL; pH: 6.0; sorbent dose: 0.35 g;
temperature: 30°C; initial concentration: 30 mg L−1).
To analyze the sorption kinetics and to calculate adsorbate uptake rate of Pb(II)
ions by P. eryngii, two kinetic models i.e. Lagergren’s pseudo first order (PFO)
and Ho McKay’s pseudo-second order (PSO) were applied.
Figure 4.10 Pseudo first order (a), pseudo second order (b), and Intra particle diffusion
kinetic models plots for the sorption of Pb(II) ions onto fungal biomass.

59
The first order rate equation of Lagergren is represented as equation 9. Straight
line plot of t against ln(qe–qt) (Figure 4.10a) was used to determine the PFO
kinetics parameters as given in Table 4.4.
Table 4.4 Kinetic parameters for Pb(II) biosorption on P. eryngii.
The pseudo second-order kinetics of adsorption was applied to check the kinetic
mechanisms between sorbent and sorbate. The parameters were calculated by
using following the equation 10. The straight-line plot (Figure 4.10b) of t versus
t/qt indicate the relevancy of the above equation to Pb(II) sorption on the
biomass. The second-order rate constant and other parameters are given in Table
4.4.
Calculated correlations are closer to unity for pseudo second-order kinetic model
and the predicted value of qe is comparable to the experimental one; therefore,
the sorption kinetics could well be approximated more favorably by second-order
kinetics model rather than pseudo first order kinetics for Pb(II) ions uptake.
For further confirmation about the mechanism, Weber and Morris Intra particle
diffusion (IPD) model were applied as equation 11. The values of IPD model
obtained from the slope of t1/2qt versus plot (Figure 4.10c) are given in Table 4.4.
Model Parameter Values
qe,exp.(mg g-1) 1.71
Pseudo first order
k1 (min-1) 0.64
qe,cal. (mg g-1) 0.068
R2 0.978
Pseudo second order
k2 (g mg-1 min-1) 42.82
q,cal.(mg g-1) 1.687
h (mg g-1 min-1) 121.9
R2 1.0
Intra particle diffusion
kipd(mg g-1 min-0.5) 0.031
C (mg g-1) 1.627
R2 0.977

60
From the plot, it is observed that the intercept does not pass through the origin,
which indicates that the pore diffusion is not only the rate-limiting step for
sorption of Pb(II) on P. eryngii.
However, by comparing constants of all kinetic models, the pseudo second order
kinetic model seems to be best fitted for the experiment.
4.1.3 INVESTIGATION OF INTERFERING IONS
The presence of interfering ions can affect the removal efficiency of the target ion in
any sorption process. In this study, the effect of Pb ions were evaluated separately
under the optimized conditions against different cations. From prior studies it was
proved that if the interfering ions affect the elimination signal less than ±5%, the
interference effects were negligible and would not be considered [123].
The results of these experiments are illustrated in Table 4.5. The ions Fe6+, Co4+, Ni2+,
Cu2+ and Zn2+, considered as interfering ions because they have a detrimental effect
on the uptake of Pb(II) by fungal biomass. While, the presence of electrolytes (Na+,
K+, Ca2+ and Mg2+) have no considerable influence. The hindrance in sorption may
occur due to the competition among the metal ions for the sorption sites.
Table 4.5 Investigation of interfering ions effect on removal of Pb(II) ions
(initial concentration = 5 mg L-1) by P. eryngii.
Interfering
ions Pb(II) ions
removal (%)
Na+ 98.9
K+ 97.8
Ca2+ 97.9
Mg2+ 98.4
Fe6+ 94.0
Co4+ 94.4
Ni2+ 93.8
Cu2+ 93.9
Zn2+ 93.0

61
4.1.4 DESORPTION OF PB(II) IONS AND RE-USABILITY OF SPENT BIOMASS
To reuse the spent fungal biomass, various eluents viz. HCl, HNO3, H2SO4,
NaOH of 0.1 N were used respectively. The results are presented in Figure 4.11a.
As per observation, the order of elution performance is as follows HCl > HNO3 >
H2SO4 > NaOH. Maximum recovery of 95% was obtained with the use of HCl as
eluent, whereas lower desorption was observed in the case of NaOH (77.8%).
This is evident that chemical ion exchange is involved in the sorption mechanism
[124]. Figure 4.11b shows that as the biomass was re-cycled up to 5 times there
are perceptible decrease in sorption efficiency from 97.4 to 85.3%. It is because
the continuous acid treatments alter the surface sites of the biomass and may
affect their binding capacity.
Figure 4.11 a) Optimization of various eluents to check their desorption efficiency
toward Pb(II) ions. b) Desorption – reuse cycles for the removal of Pb(II) ions using P.
eryngii biomass.

62
4.1.5 ANALYTICAL APPLICATION
The sorption capacity of the tested biomass could be significantly lower if real
field water were used instead of synthetic solutions, as Pb ions may compete for
the sorption sites with other ions present in the water samples. The experimental
results on the field trail analysis are given in Table 4.6. From results, it was
evaluated that under optimal conditions (at natural pH values) made in the
aqueous system and batch mode Pb(II) ions were removed successfully below the
permissible limits (0.05 mg L-1) of WHO drinking water standards.
Thus, it is accomplished that this proposed sorption technique and biomass is
feasible, reliable and suitable for the removal of Pb(II) ions at commercial and
household level.
Table 4.6 Removal of Pb(II) ions from natural water samples.
*S-1= Malir River, Karachi; S-2= Korangi Industrial Area, Karachi; S-3= Kotri Industrial Area, Kotri; S-4= Phuleli
Canal, Hyderabad.
4.1.6 SUMMARY
In this bio-analytical study, a fungal biomass P. eryngii was biologically
produce, characterized and exploit to specifically adsorb Pb(II) ions from the
water system. Characterization techniques such as FTIR and AFM were
employed to characterize the pure and Pb(II) ions loaded biomass. Impact of
different equilibrium parameters for the sorption of Pb(II) ions on P. eryngii was
examined. The sorption process followed the Langmuir isotherm model with the
calculated monolayer sorption capacity of 2.971 mg g−1 at temperature 303 K.
The kinetic data illustrate well by the pseudo second order model. With the
dynamic gathering of functionalities (–NH2, –NH–, –OH, and carboxyl) the
sorption reaction occurred both inside and on the upper surface of biomass. This
Sample
I.D.*
Pb(II) concentration (mg L-1) in sample
water
Pb(II) biosorption
(%)
Amount of Pb(II) after biosorption
(mg L-1) S-1 0.189 86.9 0.024 S-2 0.167 84.2 0.026 S-3 0.151 86.7 0.020 S-4 0.072 91.9 0.005

63
study revealed the potential of P. eryngii sorbent for the exclusion of Pb(II) ions
from the water system.

64
PART 2
Remarks: All work of this part has been published in Water Sci. Technol. 78 (5):
1148-1158.
4.2 UTILIZATION OF P. ERYNGII BIOSORBENT AS AN
ENVIRONMENTAL BIOREMEDY FOR THE DECONTAMINATION OF
TRACE CD(II) IONS FROM WATER SYSTEM
In this study, various experimental parameters were conducted and evaluated to
enhance sorption efficiency of P. eryngii for Cd(II). It has been observed that
fungal biomass has high sensitivity as well as specificity for Cd(II) ions in
aqueous system. Besides this, equilibrium isotherm, thermodynamic parameters
and kinetic models were also plotted to elaborate sorption chemistry between
biosorbent and sorbate during soption process. Additionally, reusability,
interference and application to real water samples were also tested using flame
atomic absorption spectroscopic technique. The interference study reveals
pronounced selectivity of fungal biomass toward Cd(II) even in the presence of
different ions.
4.2.1 CHARACTERIZATION OF THE BIOSORBENT
FTIR ANALYSIS
To investigate the changes in functional group regions of fungal biomass (before
and after Cd(II) ions sorption) FT-IR studies were carried out. As shown in
Figure 4.12 (a & b) broad, strong and superimposed bands around 3500–3200
cm-1, indicates overlap of O–H and N–H stretching vibrations. A change in the
peak position of O–H and N–H in the spectrum could be attributed to the binding
of Cd ions with amino and hydroxyl group. The strong absorption peak at 2923
and 2852 cm-1 assigned to –CH stretching vibration, which shows the presence of
–CH3 and –CH2 functional groups respectively. In addition, the strong adsorption
band at 1654 cm-1 represents a C=O stretching vibration and NH deformation
(amide I) was also observed. The peak at 1558 cm-1 was assigned to a motion
combining both−NH bending (amide II) and−CN stretching vibration of the

65
protein. A typical amide III band appeared at 1380 cm-1, and C–N stretching
band at 1229 cm-1. Some absorption bands i.e. P–O stretching at 1153 cm-1; P–
O–C stretching at 1043 cm-1 were indicative of a phosphonate group [133]. After
adsorption, a significant peak at 1724 cm-1, corresponds to C=O was disappeared.
The significant changes in the wave number of above mentioned specific peaks
suggested that amido, hydroxy, C=O and C–O groups could be involved in the
biosorption of Cd(II) ions on P. eryngii biomass.
Figure 4.12 FTIR spectra of P. eryngii fungal biomass (a) before and (b) after
biosorption of Cd(II).
SEM-EDS ANALYSIS
After FTIR the topographical characteristics of P. eryngii were studied by SEM
before and after Cd(II) sorption, as presented in Figure 4.13. It is observed in
Figure 4.13a that the surface of biomass is irregular, porous, rough and
heterogeneous in nature. Figure 4.13b represents the micrographs of Cd(II)
loaded fungal biomass. The slight dotted structure was observed on the surface

66
of sorbent which may due to the sorption of Cd(II) ions. However, the rest of
surface morphology seems similar as before sorption.
Figure 4.13 SEM micrographs of (a) unloaded and (b) Cd(II) loaded P. eryngii fungal
biomass; EDS spectra of (c) unloaded and (d) Cd(II) loaded P. eryngii fungal biomass.
EDS elemental composition of the unloaded (Figure 4.13c) biosorbent,
illustrated the presence of C, O, Na, P, Cl, K and S elements as natural species
on fungal biomass. The presence of these elements may influence the sorption
mechanism through ion-exchange interactions. Furthermore, Figure 4.13d
revealed the sorption of Cd(II) ions on biomass by indicating a strong signal of
Cd at ~3.1 KeV. In addition, the disappearance of Cl, K and Na peaks after
sorption signifies the involvement of an ion exchange mechanism during
biosorption of Cd(II) on fungal biomass.
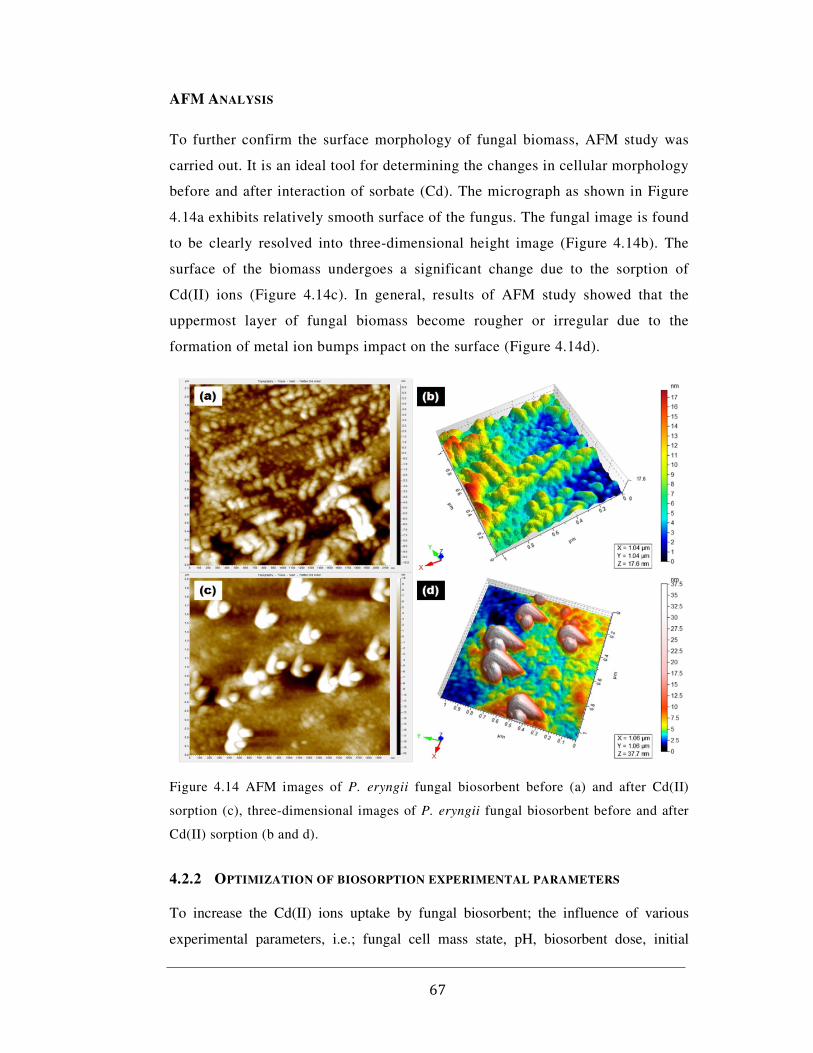
67
AFM ANALYSIS
To further confirm the surface morphology of fungal biomass, AFM study was
carried out. It is an ideal tool for determining the changes in cellular morphology
before and after interaction of sorbate (Cd). The micrograph as shown in Figure
4.14a exhibits relatively smooth surface of the fungus. The fungal image is found
to be clearly resolved into three-dimensional height image (Figure 4.14b). The
surface of the biomass undergoes a significant change due to the sorption of
Cd(II) ions (Figure 4.14c). In general, results of AFM study showed that the
uppermost layer of fungal biomass become rougher or irregular due to the
formation of metal ion bumps impact on the surface (Figure 4.14d).
Figure 4.14 AFM images of P. eryngii fungal biosorbent before (a) and after Cd(II)
sorption (c), three-dimensional images of P. eryngii fungal biosorbent before and after
Cd(II) sorption (b and d).
4.2.2 OPTIMIZATION OF BIOSORPTION EXPERIMENTAL PARAMETERS
To increase the Cd(II) ions uptake by fungal biosorbent; the influence of various
experimental parameters, i.e.; fungal cell mass state, pH, biosorbent dose, initial

68
Cd(II) ion concentration, temperature and time were optimized.
The state of the cell mass is a basic monitoring parameter in the biosorption process.
Therefore, Cd(II) ions biosorption capacity was checked toward different forms of
fungal cell mass (P-1 to P-5). As shown in Figure 4.15, that the maximum biosorption
efficiency was obtained from the oven-dried cell mass (P-1) as compared to other cell
states. Arica et al. [143] explained that during oven-dried biomass preparation, larger
surface area were developed as a result of cell membrane destruction.
Figure 4.15 Influence of P. eryngii fungal cell mass state on biosorption of Cd(II).
Secondly, the biosorption efficiency is considerably influenced by the pH of an
experimental solution. Figure 4.16a illustrates, the effect of pH on the sorption
capacity of P. eryngii biomass for Cd(II) ions. It is demonstrated from Figure
4.16a that the sorption efficiency of P. eryngii was 48% at initial pH 3.0, but
substantial increase in efficiency was observed from 55 to 70% as the pH of the
solution changed from 4.0 to 5.0 respectively. Owing to the high density of
proton (H+) on sorption sites of biomass surface, positively charged metal ions
were restricted as a result of electrostatic repulsion [144]. As the pH increases,
the negatively charged (OH-) group becomes available, which promote the
sorption of the positively charged metal ion.
Later, a drastic decline in the graph was observed as the pH was further
increased from 6.0 to 7.0 which indicate the low efficiency of P. eryngii at
higher pH. This effect attributed to the saturation of negative charge at higher
pH, due to the formation of anionic hydroxide complexes [Cd(OH)2]. These

69
complexes appeared as precipitates in solution and begin their competition with
the active sites [145].
Afterward, the subsequent experiments were continued at pH 5.0 ± 0.2 as
optimum pH. Akhtar et al. [146] demonstrated that carboxylic groups of the
fungal cell wall are major sites for metal ion absorption, as these functionalities
significantly deprotonated and readily bound to Cd(II) ions.
After pH optimization, the results were illustrated in Figure 4.16b showed lower
Cd(II) removal efficiency ~85% at small dose 0.1g of sorbent which significantly
enhanced up to 95% at the use of 0.2 g of P. eryngii fungal biomass. Further
increase in biomass resulted in decreased Cd(II) ions removal. Results of metal-
free control experiments after removal of fungal biomass, indicated that no
Cd(II) ions were present initially, hence cells were free from any Cd(II) ions
contamination.
At a given equilibrium concentration, the biomass takes up more metal ions at
lower cell densities than at higher cell densities [147]. It has been suggested that
electrostatic interaction between cells can be a significant factor in the
relationship between biomass concentration and metal sorption [103]. In this
regard, at a given metal concentration, the lower the biomass concentration in
suspension, the higher will be the metal / biosorbent ratio and the metal retained
by a sorbent unit, unless the biomass reaches saturation, suggesting that high
biomass concentrations can exert a shell effect protecting the active sites from
being occupied by the metal. Thus, a smaller amount of metal uptake per
biomass unit is enabled. In the present study, it was noted that the amount of
adsorbent significantly influenced the extent of Cd (II) biosorption.
Moreover, the effect of Cd(II) ion concentration on the adsorption efficiency of
P. eryngii fungal biomass was also done under optimum conditions as shown in
Figure 4.16c. The sorption efficiency increased from 37.5 to 98.1% for Cd(II)
ions with increasing initial concentration from 4.0 to 20 mg L-1. Tewari et al.
[148] explained that at lower initial concentration adsorption of the metal ions
occurred slowly, but the higher concentration enhanced the driving force

70
between the aqueous and solid phases, thus increase the number of collisions
between metal ions and adsorbents.
Temperature played a vital role in sorption process that is why the effect of
temperature in the range of 25 to 70°C for removal of Cd(II) ions were also
checked. By examining the sorption trend in Figure 4.16d, a significant increase
in percent removal (90 to 96%) was achieved when temperature increased from
25 to 50°C. However, further increase in temperature (>50°C) shows a decline in
the sorption efficiency due to deterioration of biomass boundary layer thickness.
This deterioration alters the active functionalities and attractive forces between
biomass surface and metal ion [149, 150]. Maximum sorption of Cd(II) ions were
achieved at 50 °C, which is similar as reported in the literature of various metal
ions sorption [151-153].
Figure 4.16 (a) Percentage removal of Cd(II) ions concentration as a function of pH
(biosorbent dose: 0.1g; initial concentration: 5.0 mg L−1; temperature: 30°C; contact
time: 20 min; agitation: 100 rpm). (b) Percentage removal of Cd(II) concentration as a
function of biosorbent dose (pH: 5.0; initial concentration: 5.0 mg L−1; temperature:
30°C; contact time: 20 min; agitation: 100 rpm). (c) Effect of concentration of Cd(II) on
their percent removal over P. eryngii (pH: 5.0; biosorbent dose: 0.2 g; temperature:

71
30°C; contact time: 20 min; agitation: 100 rpm). (d) Percentage removal of Cd(II)
concentration as a function of temperature (pH: 5.0; biosorbent dose: 0.2 g; initial
concentration: 20 mg L−1; contact time: 20 min; agitation: 100 rpm).
Contact time for sorbent and sorbate effects the percent removal efficiency of
targeted analyte and simultaneously used to elucidate the kinetics of reaction.
Figure 4.17 shows that the sorption process was slow at 1 to 2 minutes but later
the sorption efficiency was increased gradually with respect to time. The
maximum removal of Cd(II) ions ~99.9% was obtained within 10 min of reaction
time. This apparent change occurs because numerous sites are available for
sorption at the initial stage which provides the space for adsorption. After a few
minutes later, the remaining vacant surface sites were hard to occupy because of
the repulsive forces between Cd(II) ions and the aqueous phases [154-156]. From
the observed sorption trend, it was concluded that agitation time of 10 min is
suitable for complete removal of Cd(II) ions from aqueous system. Further
increase in contact time did not show any change which symbolizes the
attainment of equilibrium condition.
Figure 4.17 Percentage removal of Cd(II) concentration as a function of contact time
(pH: 5.0; biosorbent dose: 0.2 g; initial concentration: 20 mg L−1; temperature: 50°C;
agitation: 100 rpm).
4.2.3 BIOSORPTION ISOTHERM STUDIES
For Langmuir isotherm model, the straight-line graph Ce versus Ce/Cads (g L-1)
were extrapolated according to equation 1 which showed 0.928 regression

72
coefficient along with 1.515 mg g−1 of Q and 2.268 L mg-1 of b. Further
calculations provided RL between 0.002 – 0.099, which confirms the favorable
uptake of Cd(II) ions at all working Cd(II) ion concentrations (Figure 4.18a).
Later, Freundlich model was elaborated for the non-ideal sorption on
heterogeneous surfaces involving multilayer sorption. The graph Log Ce (mg L-1)
versus Log Cads (mg g-1) were plotted (Figure 4.18b) that shows a low value of
R2 0.855 then Langmuir isotherm model with Kf 15.595 mg g-1 and n 1.22.
It is concluded from the obtained data that the biosorption reaction follows
Langmuir isotherm which indicates the monolayer sorption phenomenon and
chemical type of interaction between sorbent surface and sorbate.
Figure 4.18 (a) Langmuir and (b) Freundlich isotherms for the biosorption of
Cd(II) ions on P. eryngii fungal biomass.

73
Moreover, biosorption capacity of P. eryngii was compared with previously
reported work and it is evident from the data that, sorption capacity of P. eryngii
is higher than other reported biosorbents (Table 4.7).
Table 4.7 Comparison of maximum biosorption capacity of P. eryngii for Cd(II)
with other reported biosorbents.
4.2.4 THERMODYNAMIC PARAMETERS
The thermodynamic parameters (ΔGº, ΔHº and ΔSº) were calculated from
Van’t Hoff plot of lnKc versus 1/T (Figure 4.19) according to the equation 12
and 13 respectively:
Figure 4.19 Van’t Hoff plot, log Kc versus 1/T.
Biosorbents Biosorption capacity
(mg g-1) References
Wheat bran 0.67 [125]
Grafted rice husk 0.89 [126]
Saw dust 0.29 [126]
Wheat straw (Triticum aestivum) 1.48 [127]
P. eryngii 1.52 This work

74
The thermodynamic parameters for the sorption of Cd(II) ions on fungal biomass
are given in Table 4.8. The negative values of ΔGº and ΔHº at the studied
temperature range confirmed the spontaneous and exothermic nature of
biosorption process, respectively and indicates the feasibility of reaction against
elevated temperatures [18]. Moreover, Deng et al. [159] reported that enthalpy
change data is useful for distinguishing the physical and chemosorption
mechanism. Physisorption is typically associated with the heat of adsorption in
the range of 2.1-20.9 kJ mol-1, while chemisorption with ΔHº values 20.9-418.4
kJ mol-1. From the enthalpy value represented in tabulated data, it is concluded
that the biosorption of Cd(II) ions on P. eryngii is chemisorptive in nature.
The negative value of ΔSº reflects the decreased randomness at the solid-liquid
interface during sorption. According to Dos Santos et al. [137] the entropy value
less than zero demonstrate the occurrence of a certain order for the metal ions on
the biosorbent surface. This allowed that the biosorption were governed by
enthalpy factors as opposed to entropic factors.
Table 4.8 Thermodynamic parameters for Cd(II) biosorption on P. eryngii at
various temperatures.
4.2.5 BIOSORPTION KINETIC STUDIES
To analyze the biosorption kinetics and to calculate the adsorbate uptake
rate of Cd(II) ions on P. eryngii, two kinetic models i.e. Lagergren’s
pseudo first [160] and Ho-McKay’s pseudo second order [161] were
applied.
The first order rate equation of Lagergren is widely used for the sorption
of solute from a liquid solution and is represented in equation 9. Straight
line plot of t against ln(qe–qt) (Figure 4.20a) was used to determine the
T (K) ∆Gº (kJ mol-1) ∆Hº (kJ mol-1) ∆Sº (kJ mol-1 K-1)
288 -12.05
-67.75 -0.192 293 -11.63 298 -8.885 303 -3.174
343 -2.469

75
rate constant and biosorption capacity. The values of k1 and R2 along with
the calculated uptake capacity qe, cal are 0.202 min-1, 0.866 and 0.290 mg
g-1 respectively.
Figure 4.20 The kinetic fitting plots (a) pseudo first order and (b) pseudo second
order for the biosorption of Cd(II) ions on P. eryngii fungal biomass.
The pseudo second order kinetics of adsorption was applied to verify the
kinetic mechanisms between sorbate and sorbent. The parameters k2 and qe
were calculated by following the equation 10.
The straight-line plot (Figure 4.20b) of t versus t/qt indicate the relevancy of
the above equation for the biosorption of Cd(II) ions on fungal biomass. The
second order rate constant k2 1.867 g mg-1 min-1, correlation constant R2
0.999 along with calculated uptake capacity (qe) is 0.838 mg g-1.

76
Calculated correlations are closer to unity for the pseudo second-order kinetic
model and the predicted value of qe is comparable to the experimental one (q,
exp. 0.889 mg g-1); therefore, the biosorption kinetics could well be
approximated more favorably by second-order kinetics model than pseudo-
first order kinetics.
The results are also analyzed in terms of Weber and Morris intra particle
diffusion model to investigate whether the intra particle diffusion is the rate
controlling step in biosorption of Cd(II) on P. eryngii biomass. According to
this model intra particle diffusion varies with the square root of time as given
in equation 11:
The values of kid 0.073, C 0.547 and R2 0.99 were obtained from the slope of
t1/2 versus qt plot (Figure 4.21). It is observed from the plot that intercept
does not pass through the origin, thus pore diffusion is not only the rate
determining factor for the biosorption of Cd(II) ions on P. eryngii.
Figure 4.21 Intra particle diffusion for the biosorption of Cd(II) ions on P. eryngii
fungal biomass.
By comparing constants of all kinetic models, it is evaluated that pseudo
second order kinetic model best fitted for the biosorption experiment.

77
4.2.6 ELUTION OF CD(II) ION AND RE-USABILITY OF BIOSORBENT
To reuse the biomass for next sorption reaction Cd(II) ions desorption study was
carried out. The results presented in Figure 4.22a showed maximum recovery of
99.89% Cd(II) ions with the use of HNO3 as eluent. The result illustrate following
order of elution performance: HNO3 > HCl > EDTA > H2SO4 > NaOH > NaCl.
For the complete unloading of Cd(II) ions, the biomass was washed with an
excess amount of HNO3 followed by appropriate washing with ultra-pure water to
a maximum removal of H+ ions from the surface of sorbent to maintain the
removal efficiency of sorbent.
Thereafter, the unloaded fungal biomass was re-used for the next set of
experiment. The data present in Figure 4.22b shows that the sorption efficiency
was decreased from 99.99 to 56.89% as the biomass were re-cycled up to 5 times.
Figure 4.22 (a) Influence of various eluents on percentage recovery of Cd(II) ions
by P. eryngii fungal biomass. (b) Desorption efficiency of P. eryngii with cycle
number.

78
The reduction in efficiency could be attributed to the use of HNO3 solution which
enriches the H+ ions on the biomass surface and results in the electrostatic repulsion
of positively charged Cd(II) ion that eventually causes the decrease in sorption
capacity.
4.2.7 INFLUENCE OF INTERFERING IONS
Table 4.9 shows the effect of different interfering ions during biosorption of
Cd(II) from aqueous system. Selected concentration of co-existence ions was
added to 10 mL test solution of Cd(II) ion (5 mg L-1) and then subjected to
the general procedure.
From the results of an interfering study it was found that the ions naturally
existing in real samples (Na+, K+, Ca2+, Mg2+, SO42-, NO3
-, PO43-, Cl-) have no
significant effect on the removal of Cd(II) ions under experimental conditions.
Exceptionally, PO43- anion may severely interfere in the determination of
Cd(II) probably due to the formation of precipitates in the working pH. These
results confirmed that the proposed pre-concentration method could be applied
to samples that contain a high number of interfering ions at ppm (mg L-1)
[162].
Table 4.9 Influence of some interfering ions on biosorption of Cd(II).
S. No. Interfering ions Interfering conc. % Biosorption
Cd(II) : Cation
1. Na+ 100 97
2. K+ 100 99
3. Ca2+ 50 97
4. Mg2+ 50 98
Cd(II) : Anion
5. SO42- 100 97
6. NO3- 100 99
7. PO43- 100 95
8. Cl- 100 99

79
4.2.8 ANALYTICAL APPLICATION
To set up the validity of proposed method, the batch biosorption study was
performed in real field application. Three water samples having a higher
concentration of Cd(II) ions were collected from river, canal, and lake of
Sindh, Pakistan. In general, the removal efficiency for Cd(II) was higher for
synthetic wastewater (>98%) than for real water samples (~90%) as presented
in Table 4.10. It is because in real water samples, on the contrary to synthetic
wastewater, supplementary cations are competing with Cd(II) for active sites
on the fungal biomass and at the same time many anions are in complexation
reaction with Cd(II). Both affect may cause to reduce the sorption efficiency
in real samples.
Table 4.10 Field trial results of biosorption studies using real water samples.
*S-1 = Phuleli canal, Hyderabad; S-2= River indus, Jamshoro; S-3= Manchar Lake, Distt. Dadu.
Though, the efficiency of Cd(II) removal from real water samples lies between
85 to 90% which accomplished that this proposed technique is feasible, reliable
and suitable for the removal of Cd(II) ions from real water samples.
4.2.9 SUMMARY
The present study provides an efficient, cost-effective and environmental
friendly biosorbent with its high potential in removing Cd(II) ions from aqueous
system. The sorption of Cd(II) ions was found to be pH dependent and maximum
removal was observed at pH 5.0. P. eryngii biomass was successfully utilized for
the removal of Cd(II) ions from aqueous solution with 99.9% sorption efficiency.
The sorption was rapid and equilibrium was achieved within 10 min. Langmuir
isotherm offers the best correlation for the adsorption of Cd(II) ions confirming
monolayer coverage. The sorption process obeyed a pseudo second order kinetic
model. Batch elution process revealed that the complete elution of Cd(II) ions
Sample
I.D.* Cd(II) concentration (mg L-1)
in sample water Cd(II) sorption
(%)
Amount of Cd(II)
after biosorption (mg L-1)
S-1 0.04 90 0.003 S-2 0.03 92 0.002 S-3 0.05 91 0.003

80
was achieved from the biomass using 0.1 N HNO3 solution. The used fungal
biomass can be easily disposed of since it is biodegradable and can also be used
as an alternative raw material for the large-scale composting process. Besides,
people of affected areas can take advantage of this natural safe method for
removal of toxic Cd(II) ions from contaminated water.

81
PART 3
Remarks: All work of this part has been published in J. Environ. Prog. Sustain.
Energy 35(5):1274-1282.
4.3 BIOSORPTION OF HG(II) FROM AQUEOUS SOLUTION BY FUNGAL
BIOMASS P. ERYNGII: ISOTHERM, KINETIC AND THERMODYNAMIC
STUDIES
4.3.1 CHARACTERIZATION OF THE BIOSORBENT
SEM-EDX ANALYSIS
SEM micrographs and EDX spectra of pure and Hg(II) loaded P. eryngii biomass
are presented in Figure 4.23.
Figure 4.23 SEM images of P. eryngii before and after Hg(II) biosorption (a & b); EDX
analysis of P. eryngii before and after Hg(II) biosorption (c & d).

82
Obvious morphological changes were seen in the cell wall structure after metal
binding, where metal seems to be deposited on the surface of the biomass as a
glossy film like structure.
Biosorption of Hg(II) was also confirmed by EDX analysis, which revealed the
presence of Hg(II) signal on the metal loaded fungal biomass.
FTIR ANALYSIS
FTIR spectroscopy was carried out to identify the functional groups present on
fungal biomass before and after Hg(II) biosorption (Figure 4.24). The broad band
at 3395 cm-1 before Hg(II) uptake indicate the presence of hydrogen bonded –OH
stretching modes from alcohols or phenols and may also dominate by –NH
stretching. The peak 2920 cm-1 represents –CH stretching on the cell surface of
fungal biomass. The band at 2354 cm-1 is mostly due to atmospheric carbon
dioxide (CO2).
Figure 4.24 FTIR spectra of P. eryngii before (a) and after (b) Hg(II) ions biosorption.
The bands appearing at 1639, 1544, 1380, 1230 and 1073 cm-1 are due to C=C
stretching, –NH bending, alkyl group, –CN stretching and –CO stretching
respectively; indicating major changes in their peak positions after sorption of
Hg(II). All these changes indicate the participation of N or O groups present on
biomass for Hg(II) sorption. The change in 1380 to 1373 cm-1 may be due to the

83
presence of oxygen atom attached with alkyl group that may have coordinated
with Hg(II). The band assignments are shown in Table 4.11.
Table 4.11 Surface functionalities observed on fungal biosorbent by FTIR
spectroscopy.
Before biosorption (cm-1)
After biosorption (cm-1)
Band assignment
3395 3420 -OH, -NH stretch 1639 1645 C=C stretch 1544 1555 -NH bending vibrations 1380 1373 CH3, alkyl groups 1230 1219 -CN stretching vibrations 1073 1027 -C-O stretch
4.3.2 EFFECT OF INITIAL PH
The pH is an important variable governing the biosorption of metal ions by
sorbent that influence both cell-surface metal binding sites and metal chemistry
in water. Effect of pH for the removal of Hg(II) ions by P. eryngii biomass was
studied in the pH range 3.0–9.0 as shown in Figure 4.25a. At low pH values (pH
<5), the cell wall ligands (hydroxyl group or other lone pair carrier groups as
carbonyl) would be closely associated with the hydronium ions (H3O+) that limit
access to ligands by metal ions due to repulsive forces; this repulsion is stronger
as pH decreases. Hence, there arises a competition between H3O+ ions and Hg(II)
metal ions in the solution. As the pH increased, further ligands probably
exposed, i.e. carrying negative charges, with the subsequent attraction of
metallic ions with a positive charge and adsorption onto the cell surface. Beyond
optimum pH, an alkaline condition led to decreased Hg(II) removal efficiency; it
is because at high pH, the solution has an excess number of OH− ions, which
enhance the probability of salt or hydroxide formation with metal ions in the
solution. In case of alkali and alkaline earth metal ions, this probability can be
ignored as their hydroxides are soluble but for heavy metal ions like Hg(II) and
so forth, it contributes significantly. Hence, the optimum pH for maximal Hg(II)
sorption was thus determined to be around 7.0.
The point of zero charge (pHpzc) represents the pH where sorbent surface
becomes electrically neutral. Above the pHpzc value, surface of biosorbent

84
acquired negative charge, whereas below the pHpzc point surface acquired
positive charge [113]. Hence, cationic biosorption will be favorable above the
pHpzc point and anionic will be optimum below the pHpzc point. The value of
pHpzc was found to be 5.75 for P. eryngii (Figure 4.25b). The results are in
agreement with the pH values obtained for the same experiment showing
maximum biosorption at pH 7.0 for P. eryngii.
Figure 4.25 (a) Percentage removal of Hg(II) ions as a function of pH (temperature:
30°C; agitation:100 rpm; biosorbent dose: 0.1 g; initial concentration: 1.0 mg L−1;
contact time: 30 min). (b) Plot of pHi vs. ΔpH to obtain point of zero charge (pHpzc)
value for the proposed biosorbent P. eryngii fungal biomass.
4.3.3 EFFECT OF INITIAL BIOMASS CONCENTRATION
The biosorption efficiency for Hg(II) ions was found to be increased
proportionally with the biosorbent concentration from 0.15 to 0.35 g (Figure
4.26). This result can be explained by the fact that with the increase in biomass
concentration, more sites are available for Hg(II) sorption. The maximum

85
biosorption (77.4%) was achieved at 0.25 g biomass concentration. However,
further increase in sorbent concentration did not result in a sufficient increase in
the biosorption yield due to the aggregation of available binding sites [128].
Figure 4.26 Percentage removal of Hg(II) ion as a function of biosorbent dose (pH: 7.0;
temperature: 30°C; agitation: 100 rpm; initial concentration: 1.0 mg L−1; contact time:
30 min).
4.3.4 EFFECT OF INITIAL HG(II) CONCENTRATION
The initial concentration of Hg(II) ions in the solution remarkably influenced the
sorption process. The biosorption of Hg(II) raised (58 to 83.4%) as the initial
concentration increased from 0.5–7.5 mg L-1 (Figure 4.27), after that no increase
was observed because the system reaches to a saturation point after attaining
equilibrium [129].
Figure 4.27 Percentage removal of Hg(II) ion as a function of biosorbent dose (pH: 7.0;
temperature: 30°C; agitation: 100 rpm; biosorbent dose: 0.25 g; contact time: 30 min).

86
4.3.5 EFFECT OF CONTACT TIME AND TEMPERATURE
Contact time is one of the significant factors, which imparts practical application
of the biomass. Figure 4.28 shows the effect of contact time on the removal of
Hg(II) ions by P. eryngii.
The percent removal rapidly increases up to 96.97% with a rise in contact time.
The rapid biosorption rate at the beginning of the sorption process may be
explained by an increase in the number of active metal binding sites on the
sorbent surface. After an increase in contact time, the saturation of active sites
inhibits the further uptake ability of biosorbent [130].
Figure 4.28 Percentage removal of Hg(II) as a function of contact time (pH: 7.0;
temperature: 30°C; agitation: 100 rpm; biosorbent dose: 0.25 g; initial concentration:
7.5 mg L−1).
The biosorption of Hg(II) by P. eryngii fungus appears to be temperature-
dependent over the temperature range tested. The effect of temperature on Hg(II)
biosorption was studied in range from 30–60ºC.

87
Figure 4.29 Percentage removal of Hg(II) as a function of contact time (pH: 7.0;
agitation: 100 rpm; biosorbent dose: 0.25 g; contact time: 5 min; initial concentration:
7.5 mg L−1).
The observed trend with increasing temperature (Figure 4.29) suggests that the
biosorption process of Hg(II) by the fungal biomass is unfavorable in a higher
temperature. It is because elevated temperatures tend to decrease the boundary-
layer thickness; therefore, escaping tendency of Hg(II) metal ions increased from
the biomass surface to the solution phase and thus less time of interaction
available for Hg(II) ions with biosorbent active sites. The decreased biosorption
efficiency with a rise in temperature also suggests weak sorption interaction
between biomass surface and the metal ion, which supports physiosorption [129,
131].
4.3.6 BIOSORPTION ISOTHERMS
In the present work, the equilibrium data were analyzed by the linear regression
of two isotherm models. That is, Langmuir and Freundlich isotherm.
The Langmuir isotherm theory assumes monolayer coverage of sorbate / Hg(II)
over a homogeneous biosorbent surface. It is valid for single-layer biosorption
and based on the assumption that all the biosorption sites have equal affinity for
sorbate molecules and there is no transmigration of sorbate on the surface. The
linear form of Langmuir isotherm is calculated by equation 1.
The Q value was calculated from the slope of a linear plot of Ce/Cads versus Ce.
The related parameters obtained by calculation from the values of the slope and
intercept of the respective linear plot (Figure 4.30) are shown in Table 4.12.

88
Figure 4.30 Langmuir plot for Hg(II) biosorption on P. eryngii biomass.
Table 4.12 Hg(II) biosorption: Langmuir and Freundlich isotherm constants.
All the values of RL were between 0 and 1indicated that biosorption is favorable
to the conditions being applied [132]. The Langmuir biosorption capacities
obtained in the present study were compared with those reported earlier (Table
4.13).
Table 4.13 Comparison of biosorption capacity of P. eryngii fungal biomass for
Hg(II) ions with other reported biosorbents.
Biosorbents Biosorption
capacity (mg g−1) References
Camel bone charcoal 28.2 [36]
Eucalptus bark 33.1 [37] Streptococcus pyogenes 4.8 [38] Garlic (Allium sativum L.) 0.65 [39]
P. eryngii 34.01 Present study
On the other hand, Freundlich biosorption isotherm is an empirical equation that
describes the biosorption in heterogeneous systems and exponential distribution
of sites and energy. The linearised Freundlich isotherm is given in the following
equation 3.
Langmuir Freundlich Q (mg g−1)
B (L mg−1)
RL R2 Kf (mg g−1)
N R2
34.01 0.25 0.28–0.88 0.925 0.15 1.57 0.99

89
Freundlich isotherm constants of the biosorbent (Figure 4.31) were calculated
from the slope and intercept of the linear plot log Cads vs. log Ce.
Figure 4.31 Freundlich plot for Hg(II) biosorption on P. eryngii biomass.
The value of n is < 1, shows that biosorption of Hg(II) ions on fungal biomass is
a chemical type of interaction. Assuming the regression coefficient, the obtained
data fit the Freundlich adsorption isotherm.
4.3.7 BIOSORPTION KINETICS
Kinetics of metal sorption governs the rate that determines the residence time,
and it is one of the important characteristics defining the efficiency of a sorbent.
Figure 4.32 Lagergren / Pseudo first order plots for Hg(II) biosorption on P. eryngii
biomass at 30°C.

90
In this study, the biosorption kinetics were investigated by using two kinetic
models, Lagergren’s pseudo first and Ho McKay’s pseudo second order model.
The pseudo first order rate equation is stated as in equation 9. The plot of ln (qe–
qt) against t (Figure 4.32) yields a correlation coefficient of 0.879, which
concluded that biosorption of Hg(II) on fungal biomass do not follow pseudo
first order kinetics (Table 4.14).
Table 4.14 Kinetic model parameters for the biosorption of Hg(II) ions by
P. eryngii.
Pseudo first order Pseudo second order Experimental
value
k1
(min-1)
qe, cal.
(mg g-1) R2
k2
(g mg-1 min-1)
q, cal.
(mg g-1) R2
q, exp.
(mg g-1)
2.677 0.115 0.879 6.077 0.310 0.997 0.291
The plot of t/qt versus t for pseudo second order model following equation 10
yields (Figure 4.33) a good correlation coefficient, where; qe, and k can be
determined from the slope and intercept of the plot, respectively.
Figure 4.33 Ho-McKay / Pseudo second order plots for Hg(II) biosorption on
P. eryngii biomass at 30 °C.
Additionally, experimental value is in a good accordance with the calculated
equilibrium biosorption capacity qe, cal. Therefore, it is possible to suggest that
the biosorption of Hg(II) by fungal biomass followed the pseudo second order
reaction, which relies on the assumption that chemisorption may be the rate-

91
limiting step. In chemisorptions, the Hg(II) ions stick to the biosorbent surface
by forming a chemical bond and tend to find sites that maximize their
coordination number at the surface. The biosorption kinetics constant obtained
from the pseudo second order model is given in Table 4.14.
4.3.8 BIOSORPTION THERMODYNAMICS
The thermodynamic behavior of the biosorption of Hg(II) ions on P. eryngii
biomass was investigated using parameters that include; change in free energy
(ΔG°), enthalpy (ΔH°) and entropy (ΔS°). These parameters were calculated
from following equations 12 and 13.
The values of ΔH° and ΔS° were computed from the slope and intercept of lnKc
vs. 1/T (K−1) by Van’t Hoff plot as shown in Figure 4.34.
Figure 4.34 Van’t Hoff plot, log Kc versus 1/T.
Gibbs free energy change (∆Gº) was calculated to be −10.9, −5.83, −4.74, and
−3.92 kJ mol−1 for Hg(II) biosorption. The negative ∆Gº values suggest that
biosorption process is thermodynamically feasible and spontaneous in nature.
The ∆Hº parameter was found to be −78.1 kJ mol−1. The negative ∆Hº shows the
exothermic nature of the biosorption process at 30–60 ºC. The ∆Sº parameter
was found to be −0.226 kJ mol−1 K−1. The negative ∆Sº value intends a decrease
in the randomness at solid/solution interface during the biosorption process of
Hg(II).

92
4.3.9 EFFECT OF CO-EXISTING IONS
The Hg-contaminated water may contain several other ions which may compete
with the sorption process of Hg(II) ions by P. eryngii. The present study assessed
Hg(II) ions sorption behavior in the presence of 2 folds (2 mg L-1) chromium,
lead, copper, cadmium, selenium; 5 folds (5 mg L-1) magnesium, calcium; and 10
folds (10 mg L-1) sodium, potassium, fluoride, chloride, nitrate, sulfate; keeping
initial Hg(II) concentration as 1 fold (1 mg L-1).
As shown in Table 4.15, most of the investigated ions that frequently exist in
natural ground water do not interfere with the sorption of Hg(II) under selected
experimental conditions. The high sorptive selectivity and affinity toward Hg(II)
ions in the present study could be due to relatively high affinity to the binding
groups, that makes P. eryngii fungal biomass a highly suitable sorbent for water
treatment applications.
Table 4.15 Effect of some interfering ions on the removal process of Hg(II) ions
by P. eryngii.
Tolerance ratio Interfering ions % Biosorption
Hg : Cation
1:2
Cr6+ 96
Pb2+ 95
Cu2+ 97
Cd2+ 96
Se4+ 97
1:5 Mg2+ 98
Ca2+ 97
1:10 Na+ 95
K+ 96
Hg : Anion
1:10
F- 98 Cl- 97
NO3- 95
SO42- 95
4.3.10 DESORPTION EFFICIENCY AND REUSABILITY
A batch desorption study was conducted to recover the metal, to regenerate P.
eryngii for repeated use and to recycle the metal-recovered wastewater. After
performing biosorption experiments with 5 mg L-1 of Hg(II) solution and 0.3 g of

93
biomass dose at pH 7.0, the biomass was washed with deionized water for 15
min and left in HCl eluting agent of different concentrations for 5 min agitation
at room temperature. The biomass was separated from the solution by filtration
and washed with deionized water until the pH of the filtrate reached 7.0. Then
the recovered biomass was dried in an oven at 60oC, and the biosorption
efficiency were determined. The results are illustrated in Table 4.16.
Table 4.16 Desorption of Hg(II) ions by P. eryngii.
To show the reusability of the biosorbent, the sorption desorption cycle for
Hg(II) ions was repeated five times using the same fungal biomass (Table 4.17).
In addition, the sorption efficacy of biosorbent reduced up to 14.7% through the
repeated operation. The regeneration of biomass shows that it has good reuse
performance for its possible utilization in continuous systems in industrial
processes. A promising cause of reduction in the biosorption capacity of the
fungal cells could be attributed to the adverse effect of the desorbing agent on
the binding sites of the fungal cell wall components (i.e. HCl hydrolyses most of
the fungal cell macromolecules).
Table 4.17 Adsorption-desorption of Hg(II) ions by P. eryngii using 5 M HCl
as eluent.
Cycle Hg(II) biosorption (%) 1 99.1 2 95.6 3 92.3 4 90.1 5 85.3
Eluent Concentration (M) Desorption (%)
HCl
0.1 54.5 0.5 57.2 1.0 60.5 3.0 77.8 5.0 99.1

94
4.3.11 ANALYTICAL APPLICATION
To validate the performance of newly explored biosorbent, P. eryngii was
applied to natural water samples that were collected from various locations of
Sindh, Pakistan. The amount of Hg(II) in all water samples was found above the
permissible limit (0.001 mg L-1) of WHO drinking water standards.
Table 4.18 Analytical results for the biosorption of Hg(II) ions in natural water
samples.
*S-1= Gajrawah Canal, Nawabshah; S-2= Phuleli Canal, Hyderabad; S-3= Manchar Lake, Distt. Dadu; S-4= Korangi
Creek, Karachi.ꜝN.D. = not detected.
The removal process of water samples was carried out at optimum conditions.
The results are given in Table 4.18 showed that the Hg(II) level in every single
real water sample decreased well below the acceptable limit.
4.3.12 SUMMARY
In the present study, biosorption of Hg(II) ions from aqueous solution on P.
eryngii fungal biomass was investigated. Different experimental parameters such
as the effects of pH, sorbent dose, initial Hg(II) ion concentration, contact time,
and temperature were evaluated systematically. The sorption process was
relatively fast and > 98% removal of Hg(II) was achieved within 5 min at pH
7.0. To analyze the suitability of the process and maximum amount of metal
uptake, Langmuir and Freundlich isotherm models were applied. The biosorption
capacity of P. eryngii fungal biomass was found to be 34.01 mg g-1. Among
kinetic models studied, the pseudo second order was the best applicable model to
describe the sorption process. Thermodynamic parameters of Hg(II) sorption
were evaluated by applying the Van’t Hoff equation which indicates that the
sorption process was exothermic and spontaneous by increased randomness at
the solid-solution interface. The adsorbed Hg(II) ions were easily desorbed from
Sample
I.D.* Hg(II) concentration
(mg L-1) in sample water Hg(II) biosorption
(%)
Amount of Hg(II) after biosorption
(mg L-1) S-1 0.0030 75.0 0.0007 S-3 0.0029 91.3 N.D.ꜝ S-3 0.0019 64.2 0.0006 S-4 0.0020 70.5 0.0005

95
the fungal biomass using 5 M HCl solution with higher effectiveness and can be
reused up to five cycles. The nature of the possible cell-metal ion interactions
was evaluated by FTIR, SEM, EDX and pHpzc analysis. These examinations
indicate that different electronegative functionalities involve in the binding of
Hg(II) metal ions on the surface.

96
PART 4
Remarks: All work of this part has been published in J. Environ. Nanotechnol.
Monit. Manage. 3:30-37.
4.4 BIOSORPTION OF F- FROM AQUEOUS SOLUTION BY WHITE - ROT
FUNGUS P. ERYNGII ATCC 90888
4.4.1 CHARACTERIZATION OF THE BIOSORBENT
SEM AND EDX STUDIES
SEM images of untreated sample of P. eryngii exhibits non-adhesive and matt
appearance (Figure 4.35a) without well-defined porous structure (only few pores
on the surface). After biosorption, the surface of P. eryngii become adhesive in
appearance as evident from Figure 4.35b.
Figure 4.35 SEM/EDX images of P. eryngii biomass: (a) and (c) are unloaded; while (b)
and (d) are F- loaded pattern of fungal biosorbent.
Elemental composition of pure and F- loaded biomass analyzed by SEM / EDX
are shown in Figure 4.35c and d. The weight percent of F- loaded fungal biomass
gives F- peak (0.32% in weight) apart from C (34.85%) and O (22.18%) peaks.

97
The presence of prominent F- peak indicates that F- is superficially biosorbed on
the surface of P. eryngii.
FTIR STUDIES
To determine the characteristic functional groups responsible for biosorption of
F- ions by P. eryngii, FTIR spectroscopy was utilized as a powerful tool.
Biosorption of F- has resulted in several changes like the disappearance of some
bands, shifts and decrease in the percentage of transmittance in the IR spectra of
the solid surface in the range 4000-500 cm−1. Interpretations of the spectra were
based on the information acquired from literature [133].
The FTIR spectra of the biosorbent before and after F- sorption are shown in
Figure 4.36. Very strong broad band at the region of 3500-3200 cm-1 is the
overlapping peak of –NH2 and –OH stretching vibrations [134]. The peak around
2923.0 and 2852.3 cm−1 is due to presence of aliphatic (–CH2) groups in the
biomass. The strong bands at 1724.6 and 1654.1 cm−1 may be due to involvement
of double bond structures such as C=C or C=O groups. The peaks at 1558.0 and
1457.1 cm−1 attributed to N−H bending in the amine group. The band observed at
1043.8 cm−1 was assigned to the C-O stretching of alcohols and carboxylic acids.
Thus, P. eryngii contain hydroxyl, carboxyl, and amine groups on its surface as
important sorption sites.
The peaks for –NH2 were shifted from 1558.0 and 1457.1 to 1539.4 and 1456.1
cm−1 in F- loaded biomass. This decrease in the wave number of the peaks may
indicate the interaction of –NH2 group of biomass with F- ions. The hydrogen
bonding in amines is weaker than that of hydroxyl groups, so –NH2 stretching
bands are not as broad or intense as –OH stretching bands [115]. A slight
broadening of –NH2 stretching band in the F- sorbed P. eryngii (Figure 4.36a)
may be taken as an indicative of hydrogen bonding between the protonated
amine (–NH3+) and F- [19]. Comparable results were reported by other authors
while studying F- sorption on chelating ion exchange resins [18]. After sorption
of F-, the carboxyl peak that observed in unloaded fungal biomass at 1724.6 cm−1
becomes very sharp and shifts to higher wave number 1747.1 cm−1. This could
be due to the interaction of hydrogen atoms in the carboxylic group and F- ions.

98
Consequently, new bands appear at 1078.0, and 999.7 cm−1 after F- biosorption
(Figure 4.36b), may indicate the presence of –C–F stretching modes.
Figure 4.36 FTIR spectra of P. eryngii (a) before and (b) after F- sorption.
4.4.2 CALIBRATION OF IC FOR F- ANALYSIS
F- ion samples were subjected to IC analysis. For ion chromatography, standards
of F- were run consecutively (5-100 mg L-1) as shown in Figure 4.37. They
showed good separation, as evident from Figure 4.38.
Figure 4.37 IC-Chromatogram of F- standards.

99
Figure 4.38 Linear calibration plot of F- at different concentrations.
4.4.3 INFLUENCE OF PH
The solution pH is one of the main factors which affect the biosorption capacity.
The fungal cell wall contains a high number of polysaccharides and some of
them are associated with proteins and other components [135]. These bio-
macromolecules on the fungal cell surfaces have several functional groups (such
as amino, carboxyl, thiol, and phosphate groups) and biosorption phenomena
depends on the protonation or deprotonation of these functional groups on the
surface of the cell wall [89]. The ionic form of F- in solution and the electrical
charge of the fungal cell wall components (i.e. functional groups carrying
polysaccharides and proteins) depend on the solution pH [135]. To study the
effect of pH on F- sorption (5 mg L−1) by P. eryngii, studies were performed at
various solution pH (i.e., 2–7) as shown in Figure 4.39a. The pHpzc of P. eryngii
was found to be 5.75 which suggest that defluoridation capacity of the fungal
biosorbent is appreciable in acidic range (pH<pHpzc). At pH 2, the maximum
percentage (81.2%) of F- removal was achieved. While increase in pH decrease
the sorption capacity of F-. The same trend has been reported in Moringa indica
based activated carbon [136].
At acidic pH due to the protonated effect of surface functionalities such as
amino, carboxyl, thiol etc, positive charges impart on the surface [89, 136, 137]
and hence increase the biosorption of negatively charged F- ions at lower pH.

100
Figure 4.39 (a) Percentage removal of F- concentration as a function of pH (biosorbent
dose: 0.1g; initial concentration: 5.0 mg L−1; temperature: 30°C; contact time: 240 min;
agitation: 100 rpm). (b) Effect of concentration of F- on their percent removal over P.
eryngii (pH: 2.0; biosorbent dose: 0.1 g; temperature: 30°C; contact time: 240 min;
agitation: 100 rpm). (c) Percentage removal of F- concentration as a function of
biosorbent dose (pH: 2.0; initial concentration: 5.0 mg L−1; temperature: 30°C; contact
time: 240 min; agitation: 100 rpm). (d) Percentage removal of F- concentration as a
function of contact time (pH: 2.0; biosorbent dose: 0.2 g; initial concentration: 5.0 mg
L−1; temperature: 30°C; agitation: 100 rpm).
4.4.4 INFLUENCE OF INITIAL F- CONCENTRATION
The effect of initial F- concentration was studied by varying F- concentration
from 5 to 25 mg L−1 at pH 2. Maximum biosorption (92%) was achieved at 5 mg
L−1, which shows that all F- ions present in the solution would interact with
binding sites (Figure 4.39b). At higher concentration, more F- ions are left
unabsorbed in the solution due to the saturation of binding sites [138].

101
4.4.5 INFLUENCE OF BIOSORBENT DOSE
Biosorbent dose is an important parameter owing to its effect on efficiency and
on the amount of F- removed per unit weight of biomass. Biosorbent dosages was
varied from 0.1 to 0.5 g under optimum conditions (pH: 2.0; concentration: 5 mg
L−1; temperature: 30°C; time: 240 min; agitation: 100 rpm). At 0.2 g of
biosorbent maximum F- removal (97.03%) was obtained and remains constant
with the increase in dosage of biosorbent (Figure 4.39c). Therefore 0.2 g of the
biomass was taken as the optimized dose for F- removal and used for further
experiments. The increase in F- removal with increase in biosorbent dose is due
to the greater availability of exchangeable sites or surface area of the biosorbent.
By further increment in sorbent dose, the removal capacity was not increased
possibly due to the aggregation of available binding sites.
4.4.6 BIOSORPTION ISOTHERM MODELS
The biosorption isotherm expresses the specific relation between the
concentration of F- and its degree to accumulate on biosorbent surface at
constant temperature. The equilibrium data was analyzed by the linear regression
of isotherm models, viz., Langmuir, Freundlich and D-R isotherm.
LANGMUIR BIOSORPTION ISOTHERM
The Langmuir isotherm theory assumes monolayer coverage of sorbate (F-) over
a homogeneous biosorbent surface. The Langmuir isotherm model is given in
Figure 4.40a and its linearised form is given in equation 1.

102
Figure 4.40 Adsorption isotherms plot (a) Langmuir, (b) Freundlich, and (c) D-R.

103
Table 4.19 Langmuir, Freundlich and D–R isotherm constants
(Initial F- concentration range = 5 – 25 mg L−1).
The related parameters obtained by calculation shown in Table 4.19. All the
values of RL were between 0 and 1 suggesting biosorption is favorable at the
conditions being applied [10].
The Langmuir biosorption capacities obtained in the present study were
compared with those reported earlier (Table 4.20). The present study shows that
P. eryngii is an effective low-cost biosorbent for the removal of F- from aqueous
solutions.
Table 4.20 Comparison of biosorption capacity of P. eryngii fungal biomass for
F- ion with other reported biosorbents.
Biosorbent Biosorption capacity (mg g−1) References
Used tea leaves 0.51 [139]
Spirodela polyrrhiza 0.91 [140]
Rice husk 0.82 [141]
Pleurotus ostreatus – 1804 1.27 [135]
Spirogyra IO1 1.27 [103]
Moringa indica based activated carbon 0.23 [136]
Ca-treated Chlorococcum humicola 4.50 [142]
P. eryngii 66.6 Present
study
FREUNDLICH BIOSORPTION ISOTHERM
This is an empirical equation that describes biosorption in heterogeneous system
and exponential distribution of sites and energy. The Freundlich biosorption
Langmuir Freundlich D-R
Q (mg g−1)
B (L mg−1)
RL R2 Kf (mg g−1)
N R2 Xm (mol g−1)
E (kJ
mol−1) R2
66.60 1.5 0.025 –
0.117 0.998 36.72 2.33 0.976 0.004 2.056 0.911

104
isotherm is given in Figure 4.40b and its linearised form is given in equation 3.
The value n > 1 indicate that biosorption of F- is favorable [143].
D-R BIOSORPTION ISOTHERM
To evaluate the adsorption type, equilibrium data was applied to D-R isotherm
with following equation 6. While biosorption energy E (kJ mol-1) is calculated by
equation 7 and 8.
The calculated parameters of D-R model from plot (Figure 4.40c) are presented
in Table 4.19. The value E > 8 kJ mol-1, showed that F- - biomass interaction is
chemisorption in nature.
From results obtained, it was established that experimental data fit the Langmuir
adsorption isotherm.
4.4.7 THERMODYNAMIC STUDIES
The uptake of F- is highly dependent on temperature. The percentage biosorption
of F- increased from 78.38 to 97.0% when the temperature changes in the range
of 288˗303 K (15 to 30°C). This is because biosorption get accelerated at higher
temperature, which in turn indicate endothermic nature of reaction.
The change in standard Gibb’s free energy (ΔG°), enthalpy (ΔH°) and entropy
(ΔS°) were evaluated from the thermodynamic study as given in equation 12 and
13.
Figure 4.41 Van’t Hoff plot, log Kc versus 1/T.

105
The values of ΔH° and ΔS° were computed from the slope and intercept of lnKc
vs. 1/T (K−1) by Van’t Hoff plot as shown in Figure 4.41. The negative values of
ΔG° (Table 4.21) indicate the spontaneity of the biosorption reaction,
emphasizing that biosorption is more favorable at higher temperature.
Table 4.21 Themodynamic parameters for F- biosorption on P. eryngii at various
temperatures.
Similarly, the value of ∆H° obtained in present study confirms that biosorption is
endothermic in nature and exhibits chemical mechanism. The positive value of
ΔS° indicates strong affinity of biosorbent toward F- molecule and shows
increasing randomness at the solid / liquid interface during biosorption [144].
4.4.8 KINETIC STUDIES
Figure 4.38d illustrates the removal of F- by fungal biomass as a function of
contact time (60-300 min) at 30 °C. The F- removal efficiency was increased
linearly up to 240 min and thereafter it remains constant indicating the
attainment of biosorption equilibrium. Therefore, 240 min was fixed as optimum
contact time for the defluoridation with maximum F- removal of 97.7%.
To investigate the mechanism of biosorption process, the two main types of
biosorption kinetic models, namely reaction based (pseudo first and pseudo
second order model) and diffusion based (intra particle diffusion) models were
adopted to fit the experimental data.
REACTION BASED MODELS
The pseudo first order rate equation is given in equation 9. Straight line plots of
ln (qe–qt) against t (Figure 4.42a) were used to determine the rate constant k1,
T (K) ∆Gº (kJ mol-1) ∆Hº (kJ mol-1) ∆Sº (kJ mol-1 K-1)
288 -3.083
+107.10 0.379 293 -3.414 298 -5.084 303 -8.752

106
and adsorption capacity. From results (Table 4.22) it was concluded that
biosorption of F- on fungal biomass did not follow pseudo first order kinetics.
The pseudo second order equation is expressed in equation 10.
Table 4.22 Kinetic parameters for F- biosorption on P. eryngii.
(Experimentally obtained qe,exp. value is 0.244 mg g−1 for 5 mg L−1 initial F-
concentration).
Figure 4.42 Pseudo first order (a), pseudo second order (b), and Intra particle diffusion
kinetic models (c) plots for the sorption of F- ions onto fungal biomass.
Pseudo first order model Pseudo second order model
k1
(min-1) qe,cal.
(mg g-1) R2
k2
(g mg-1 min-1)
q,cal.
(mg g-1)
h (mg g-1 min-1)
R2
0.051 0.132 0.843 0.438 0.252 0.028 0.999

107
From Table 4.22, it was found that there is an agreement between experimental
and calculated qe values for the pseudo second order model (Figure 4.42b).
Hence, the pseudo second order model better represents the sorption kinetics.
DIFFUSION BASED MODELS
In a solid-liquid biosorption process, the transfer of solute was characterized by
particle diffusion control. The possible contribution of intra particle diffusion on
F- biosorption is described by Weber-Morris model as equation 11.
The values of kid and C obtained from slope of qt versus t1/2 (Figure 4.42c) are
0.002 mg g-1 min-0.5 and 0.209 respectively. In addition, the straight line did not
pass through its origin which shows that besides intra particle diffusion other
mechanisms are also involved in rate determining step.
4.4.9 EFFECT OF CO-EXISTING ANIONS ON F- BIOSORPTION
Interference experiments were performed to find out the interference of other
species with the binding of target ion on the biomass. The F-contaminated water
may contain several other anions which can compete with the sorption of F-. The
interference studies were carried out in the presence of various co-ions viz., Cl−,
Br−, NO3−, SO4
2−, PO43−, and CO3
2− in 1˗10 folds (binary mixture: fluoride ion 2
mg L−1 with co-ions 2, 4, 10 and 20 mg L−1). Results are presented in Figure
4.43, which shows tolerable effect with 1:1 fold of co-ions, whereas increasing
concentration retarded the F- removal capacity in different extent. The order of
interference in the presence of anions for F- removal is: CO32− > NO3
− > Cl− >
SO42− > PO4
3− > Br−.
The F- sorption amount decreased quickly from 100 to 69.45% in the presence of
10-fold carbonate. The higher concentration of carbonate may decrease F-
removal due to the high columbic repulsive forces, which reduce the probability
of F- interactions with the active sites. In general, presence of competitive anions
may decrease the attraction between F- and biomass surface, because like charges
repel each other and they cause to increase columbic repulsive forces. The
results are in good agreement with Kumar et al.[145].

108
Figure 4.43 Effect of co-existing anions on F- removal (pH: 2.0; biosorbent dose: 0.2 g;
initial F- concentration: 2.0 mg L−1; contact time: 240 min; and temperature: 30°C).
A slight interference was obtained in the presence of nitrate, chloride, sulfate and
phosphate; however, bromide had virtually no impact on F- sorption. The
observed increase in sorption could be due to the increase in ionic strength of the
solution or a weakening of lateral repulsion between adsorbed F- ions.
4.4.10 DESORPTION AND REGENERATION OF BIOSORBENT
Water purification by biosorption technology is economical with the
regeneration of biosorbent. Moreover, reuse of biosorbent helps in reducing
environmental impacts related with biosorbent disposal.
It is found that alkaline solution desorption capacity was higher compared to
acidic ones. For P. eryngii the order of desorption was NaOH > HCl > H2SO4 >
HNO3 > EDTA. Out of the six eluents, NaOH identified as the best eluent as it
desorbed 97.6% F- ions (Figure 4.44a).

109
Figure 4.44 (a) Desorption of F- by different desorbing agents (initial F- concentration
2.0 mg L−1; biosorbent dose: 0.2 g; contact time 30 min; and temperature 30°C). (b)
Desorption efficiency of P. eryngii with cycle number.
The biomass was washed with deionized water, filtered and dried at 60 °C for
next sorption experiment. This sorption-desorption cyclic study was carried out
for four consecutive cycles. In fourth cycle, the F- biosorption capacity was
decreased approx. 30% from 97.6% (Figure 4.43b). Decrease in biosorption
capacity is possibly due to the decomposition of surface active sites as evident
from previous studies [146].
4.4.11 APPLICATION TO REAL WATER SAMPLES
For practical efficacy of the studied biosorbent, three water samples from
fluorosis affected areas of Tharparkar district, Pakistan were collected; the
physico-chemical parameters are reported in Table 4.23.

110
Table 4.23 The physico-chemical parameters of real water samples.
The sorption studies performed at natural pH values shows after biosorption the
F- levels in the ground water samples were decreased well below the permissible
limits (1.5 mg L-1) of WHO drinking water standards as depicted in Table 4.24.
Table 4.24 Field trial results of biosorption studies using real field water.
S. No. Water-quality
parameters S-1 S-2 S-3
1. Fluoride (mg L-1) 2.4 0.69 3.37
2. pH 7.90 7.20 8.10
3. TDS (mg L-1) 1855 550 1214
4. EC (µS cm-1) 3850 1144 2520
5. Hardness (mg L-1) 2.26 1.76 3.38
6. Chloride (mg L-1) 1000 187.5 675
7. Sulphate (mg L-1) 707.7 411.5 625.4
8. Bicarbonate(mg L-1) 462 203 435
Sample
I.D.
Sampling
site*
F− initial
concentration
(mg L-1)
F− final
concentration
(mg L-1)
Removal
efficiency
(%)
S-1 Mithi 2.40 0.83 65.20
S-2 Diplo 0.69 0.23 67.01
S-3 Nagarparkar 3.37 1.20 64.24
*Tharparkar district, Sindh, Pakistan.

111
4.4.12 PROPOSED MECHANISM
The proposed mechanism shows (Figure 4.45) that the cell wall structure of
fungi were responsible for the attachment of anion on biomass surface.
Figure 4.45 Possible mechanism on surface of biomass.
4.4.13 SUMMARY
In present study, the biosorption characteristics of F- anions from aqueous
solution using white rot fungus (P. eryngii) were investigated as a function of
pH, initial F- concentration, biosorbent dose, temperature, and contact time.
Langmuir model fitted the equilibrium data better than the Freundlich isotherm.
The monolayer biosorption capacity of P. eryngii biomass for F- ions was found
to be 66.6 mg g-1. Thermodynamic parameters such as ∆H°, ∆S° and ∆G°
indicate that the removal of F- ions by fungal biomass was endothermic and
spontaneous in nature. The biosorption process of F- ion followed well pseudo
second order model, where, intra particle diffusion was not the only rate-
controlling step. The surface and sorption characteristics were analysed by SEM,
EDX, and FTIR spectrometry. To check the practical utility of the studied
biosorbent, batch studies were carried out with F- contaminated water samples
collected from F- endemic area. Eventually, this fungal biomass recommended to

112
be used as a suitable, environment friendly and low cost biosorbent for removal
of F- ion concentration to standard permissible limit.

113
PART 5
Remarks: All work of this part has been published in Model. Earth Syst. Environ.
3(3):1101–1112.
4.5 STATISTICAL METHODOLOGY FOR BIOSORPTION OF NO3- IONS
FROM AQUEOUS SOLUTION BY P. ERYNGII FUNGAL BIOMASS
To determine the effects of various operating conditions (pH, biosorbent dose and
initial NO3- concentration) and their interactions on the overall sorption of NO3
- ions
by P. eryngii fungal biomass, RSM involving CCD, combined with techniques of
regression was performed. The statistical approach helped in rapidly identifying key
factors, studying the interactions between them and determining their optimum levels.
The second-order polynomial equation model whose validity is agreed upon is
estimated using ANOVA statistical testing, t-test and F test. These tests showed that
solution pH (A), biosorbent dose (B) and initial NO3- concentration (C) and the
interactions of A×B, A×C, B×C, and A×B×C were statistically significant, and the
second-order effect of pH was found to have a significant effect on the biosorption of
NO3-. Following the determination of significant variables through CCD, a
desirability function was employed to achieve the best conditions for NO3- uptake.
The maximum NO3- removal efficiency obtained from the optimization procedure was
88.4%, which was reached in 17 experiments at a pH level of 7, sorbent dose of 0.24
g and initial NO3- concentration of 700.0 mg L-1. EDX study shows the involvement
of ion exchange and complexation processes as the mechanisms of biosorption that
occurred in P. eryngii.
4.5.1 CHARACTERIZATION OF THE BIOSORBENT
The surface characteristics and physical morphologies of P. eryngii fungal
biosorbent were examined by using SEM technique. Figure 4.46 shows the
textural structure investigation of pure and NO3- loaded biosorbent at 550x and
1000x magnification, respectively. SEM images of fungal biosorbent showed
severe differences before and after NO3- biosorption. Pure biosorbent (Figure
4.46a) had a bumpy surface along with an appropriate thick wall structure. A
series of irregular cavitation distributed around the surface of fungal biomass

114
provides large surface area for NO3- sorption. However, no significant changes
occurred in morphology of the biosorbent surface after NO3- biosorption as
shown in Figure 4.46b.
Figure 4.46 SEM micrographs of (a) unloaded and (b) NO3- loaded P. eryngii fungal
biomass.
The EDX analysis was used to analyze the elemental constitution of fungal
biosorbent before and after NO3- sorption as shown in Figure 4.47. Oxygen,
carbon, sulfur, sodium, chlorine, potassium, and phosphorus signals can be
observed as the principal elements of fungal biosorbent (Figure 4.47a) that may
influence the sorption mechanism through ion-exchange interactions.
Furthermore, Figure 4.47b confirms the sorption of NO3- ion on biomass by
indicating strong signal of nitrogen (N) at ~ 0.4 KeV. In addition, Cl and Na
peaks disappeared after NO3- sorption, which signify the involvement of an ion
exchange mechanism during biosorption.
For further characterization, AFM was used to investigate the changes in fungal
cell surface morphology following NO3- sorption. The biosorbent was transferred
on mica surface, air-dried and the images were recorded in tapping mode. The
fungal surface is found to be clearly resolved into two and three-dimensional
height image (Figure 4.48). Imaging of the cells before (Figure 4.48a and b) and

115
after (Figure 4.48c and d) NO3- sorption shown undamaged cell surface with
variation in cell size.
Figure 4.47 EDX spectra of (a) unloaded and (b) NO3- loaded P. eryngii fungal biomass.

116
Figure 4.48 AFM images of P. eryngii fungal biosorbent before (a) and after NO3-
sorption (c); three-dimensional images of P. eryngii fungal biosorbent before and after
NO3- sorption (b and d).
Interaction of NO3- ions with surface proteins and lipo-polysaccharides possibly
leads to a change in surface structural design as reflected by an increase in
surface roughness. Furthermore, possible rupturing of the fungal cell because of
NO3- interaction is also responsible for increase in surface roughness.
4.5.2 CALIBRATION OF UV-VIS SPECTROPHOTOMETER FOR NO3- ANALYSIS
Figure 4.49 shows the standard calibration curve of absorbance vs. NO3-
concentration (covering the range of 1.25-15 mg L-1 NO3-) with good linearity
(Figure 4.50), as evident from excellent regression coefficient (R2=0.983).

117
Figure 4.49 UV-Vis Spectra of NO3- at different concentrations.
Figure 4.50 Linear calibration plot for different NO3- concentrations.
4.5.3 MODEL FITTING AND STATISTICAL ANALYSIS
INTERPRETATION OF REGRESSION MODEL USING CCD
The design matrix of tested variables in 17 experimental runs along with the
experimental responses (using the model equation 14 and 15) is shown in Table
4.25.

118
Table 4.25 Experimental design and results for biosorption efficiency (%) of
NO3- by P. eryngii.
The biosorption efficiency of the fungal biosorbent increased to 88.4% after
running the response surface design using the following conditions: pH 7.0,
biosorbent dose 0.24 g and initial NO3- dye concentration 700 mg L-1.
For comparing and correlating the responses, CCD was applied for the
interpretation of the polynomial regression equations. The model expression was
selected in accordance with sequential model sum of square that is based on the
polynomial's highest order where the model was not aliased and the additional
terms were significant. The correlation between predicted and experimental data
was evident as indicated by the model's R2 values of 0.998 for NO3- which was
also within desirability range. Multiple regression analysis was used to analyze
the data to obtain an empirical model for the best response and thus a second-
order polynomial equation was derived as follows:
Y = + 87.76 + 6.15A + 1.54B + 0.79C + 0.063AB – 0.39AC – 0.79BC – 31.76A2
– 2.31B2 – 2.26C2
Factor 1 Factor 2 Factor 3 Response 1
SD Run A:
pH
B:
Biosorbent
dose (g)
C:
Initial NO3-
concentration (mg L-1)
Biosorption
efficiency
(%)
7 1 2 0.4 1340 48.1
11 2 7 0.1 700 84.3
6 3 12 0.1 1340 58.1
9 4 2 0.24 700 50.2
10 5 12 0.24 700 62.2
12 6 7 0.4 700 87.0
5 7 2 0.1 1340 44.9
8 8 12 0.4 1340 58.1
2 9 12 0.1 60 54.0
14 10 7 0.24 1340 86.0
13 11 7 0.24 60 85.4
15 12 7 0.24 700 88.4
16 13 7 0.24 700 87.2
17 14 7 0.24 700 86.9
3 15 2 0.4 60 45.6
1 16 2 0.1 60 42.2
4 17 12 0.4 60 60.1

119
The synergetic and antagonistic effects of the respective variables were informed
by the positive and negative signs before the terms. The appearance of a single
variable in a term signified a uni-factor effect; two variables imply a double
factor effect and a second order term of variable appearance indicate the
quadratic effect [147].
4.5.4 SELECTION OF A MODEL
To decide about the adequacy of the model for NO3- removal by the biosorbent,
three different tests such as the Sequential Model Sum of Squares, Lack of Fit
Tests and Model Summary Statistics were carried out as shown in Table 4.26. It
is found that the p values for most of the regressions were greater than 0.01.
Table 4.26 Selection of a satisfactory model for NO3- biosorption.
This means that at least one of the terms in the regression equation had an
insignificant correlation with the response variable. As a natural log
transformation was applied to the experimental data, the interaction of two
factors (2FI) and the linear model were suggested to be insignificant using the
response surface methodology. The model summary statistic showed highest
regression coefficient (R2 = 0.9987) for the quadratic model with minimum
Sequential model sum of squares
Source Sum of squares Degree of
freedom Mean square F-value p-value (Prob.> F) Remarks
Mean 74939.04 1 74939.04 - - -
Linear 408.18 3 136.06 0.37 0.7794 -
2FI 6.19 3 2.06 4.266 x 10⁻³ 0.9996 -
Quadratic 4832.36 3 1610.79 1654.56 < 0.0001 suggested
Cubic 5.10 4 1.27 2.23 0.2683 aliased
Residual 1.72 3 0.57 - - -
Total 80192.59 17 4717.21 - - -
Lack of fit tests
Source Sum of squares Degree of
freedom Mean square F-value p-value (Prob.> F) Remarks
Linear 4844.11 11 440.37 699.01 0.0014 -
2FI 4837.91 8 604.74 959.90 0.0010 -
Quadratic 5.55 5 1.11 1.76 0.4002 suggested
Cubic 0.46 1 0.46 0.73 0.4842 aliased
Pure
Error 1.26 2 0.63 - -
-
Model summary statistics
Source Standard
deviation R2 Adj. R2 Pre. R2 PRESS Remarks
Linear 19.31 0.0777 -0.1351 -0.5826 8314.49 -
2FI 22.00 0.0789 -0.4738 -4.5958 29397.96 -
Quadratic 0.99 0.9987 0.9970 0.9785 112.99 suggested
Cubic 0.76 0.9997 0.9983 0.8617 726.55 aliased

120
standard deviation (0.99). ANOVA analysis confirmed that the form of the
model chosen to explain the relationship between the factors and the response is
correct.
ANALYSIS OF VARIANCE (ANOVA)
The test for significance of the regression models, the test for significance on
individual model coefficients and the lack of fit test were performed using the
same statistical package [148]. By selecting the manual regression method,
which eliminated the insignificant model terms automatically, the resulting
ANOVA (Table 4.27) for the reduced quadratic models summarizes the analysis
of variance of each response and shows the significant model terms. In general,
the model terms with value of Prob. > F less than 0.05 are considered as
significant. With respect to NO3- sorption, the model F value is 598.81 and Prob.
> F value of 0.0001 justifying the model's significance. The significant model
terms are A, B, C, A2, B2, and C2, while rest of the terms are considered as
insignificant to the response. Lack of fit test gives idea about fitting of
experimental data. The lack of fit F- value of 1.76 implies that lack of fit is not
significant relative to the pure error and model is capable to optimize the present
removal process significantly. The predicted R2 of 0.978 was in good agreement
with adjusted R2 of 0.997, indicating that the model was significant.
Adequate precision is a measure of signal-to-noise ratio, and ratio of value
greater than 4 is desirable. In this study, the obtained ratio of 60.843 specify an
adequate signal. The coefficient of variance (CV) is the ratio of standard error of
estimate to the mean value and considered as reproducible once it is not greater
than 10%. The CV ratio of 1.49% has found in this study. From the statistical
results obtained, the models were suitable in predicting biosorption of NO3-
within the range of the studied variables.
Additionally, relationship between actual and the predicted values of biosorption
efficiency of NO3- is shown in Figure 4.51. The predicted values versus the
experimental values for NO3- sorption revealed that the developed models
successfully captured the relation between the biosorption process variables to
the responses. The developed model is adequate because the residuals for the

121
prediction for most of the responses are less than 10%, and the residuals tend to
be close to the diagonal line.
Table 4.27 ANOVA for the response surface reduced quadratic model.
R2
= 0.998; adjusted R2
= 0.997; predicted R2
= 0.978; adequate precision = 60.843; CV = 1.49%
Figure 4.51 Predicted response versus actual response.
Source of
variation
Sum of
squares
Degree of
freedom
Mean
square F value Prob. (> F)
Model 5246.73 9 582.97 598.81 < 0.0001
A 378.23 1 378.23 388.50 < 0.0001
B 23.72 1 23.72 24.36 0.0017
C 6.24 1 6.24 6.41 0.0391
AB 0.031 1 0.031 0.032 0.8629
AC 1.20 1 1.20 1.23 0.3033
BC 4.96 1 4.96 5.10 0.0586
A2 2702.28 1 2702.28 2775.72 < 0.0001
B2 14.28 1 14.28 14.67 0.0065
C2 13.67 1 13.67 14.04 0.0072
Residual
error 6.81 7 0.97 - -
Lack of fit 5.55 5 1.11 1.76 0.4002
(not significant)
Pure error 1.26 2 0.63
Correlation
(total) 5253.55 16 - - -

122
4.5.5 NORMAL PROBABILITY PLOT OF RESIDUALS
For the statistical analysis of the experimental data, it is necessary to assume that
the data come from a normal distribution [149].
Figure 4.52 Normal % probability versus residual error.
To determine whether the data set is normally distributed, a normal probability
plot or a dot diagram of these residuals is shown in Figure 4.52. The data set has
normal distribution if the points fall close enough to the straight line. It is
evident from Figure 4.52 that the data points on this plot lie reasonably close to a
straight line suggesting normal distribution of the data.
4.5.6 EFFECT OF INTERACTIVE VARIABLES
To explain the interaction effect of variables and to determine the optimum level
of each variable (biosorbent dose, pH and initial NO3- concentration) for
maximum response in the NO3- biosorption, the three dimensional (3D) graphical
surface plots for the predicted responses were illustrated (Figure 4.53a, b, c).
Here, each response surface plot represented the effect of two independent
variables, holding the other variable at zero level. These surface plots provide a
method to predict the biosorption efficiency for different values of the tested
variables [150].

123
Figure 4.53 3D response surface plots of NO3- biosorption by P. eryngii fungal biomass
showing variable interactions between (a) pH and biosorbent dose; (b) pH and
concentration of NO3-; and (c) biosorbent dose and concentration of NO3
-.
Figure 4.53a clarifies the combined effect of biosorbent dose and pH of solution
at constant initial NO3- concentration. It was observed that at aqueous phase pH
7, increasing biosorbent dose had a slight negative effect on biosorption of NO3-,
but at lower and higher pH values the trend of biosorption was decreased. Thus,
biosorption efficiency was found to be good (> 80%) at biosorbent dose of 0.24 g
and at neutral pH.

124
Figure 4.53b shows the interactive effect of initial NO3- concentration and pH of
the solution. A similar trend as observed for initial NO3- concentration was
obtained. This phenomenon mainly attributed to an increase in the adsorbable
surface area and the accessibility of further sorption sites. The biosorption of
NO3- most likely occurs via surface exchange reaction until the surface efficient
sites are completely occupied. Subsequently, the NO3- molecules diffuse into the
pores of the fungal biomass for promoting reactions. Furthermore, sorption is
found to decrease when moving away from these points, since either increase or
decrease in the pH value results in turn down of the biosorption efficiency. The
three-dimensional response surface of the combined effect of initial NO3-
concentration and biosorbent dose on sorption of NO3- at constant pH (7) is
shown in Figure 4.53c that demonstrate a maximum sorption of NO3- ~ 88% at
optimum values.
4.5.7 VALIDATION OF THE MODEL
An independent run were performed for the validation of RSM based
experimental trials keeping following set of condition (Table 4.28).
Table 4.28 Conditions for validation of the design.
The confirmatory experiment showed a NO3- biosorption efficiency of 88.4%
under optimal conditions compared with the NO3- removal percent obtained by
the model. This indicates the suitability and accuracy of the model.
pH
Biosorbent
Dose
Initial
nitrate concentration
Biosorption
efficiency
- g mg L-1 %
7.0 0.24 700 88.4
125
4.5.8 SUMMARY
In the present study, CCD of RSM was employed to investigate the effects of
different operating conditions on the removal of NO3- ions from aqueous solution
onto P. eryngii dried fungal biosorbent. A three level, three factors CCD was
used to evaluate the effects and interactions of the process variables, i.e.,
solution pH, biosorbent dose and initial NO3- concentration. The second order
mathematical model was developed by regression analysis of the experimental
data of 17 batch runs. ANOVA, F-test, Student’s t-test and lack of fit test
showed that NO3- ions biosorption is only slightly concentration dependent, but
markedly increases with solution pH and biosorbent dose. Under these optimum
combinations of process parameter conditions (pH 7.0, biosorbent dose 0.24 g
and initial concentration 700.0 mg L-1), maximum removal of 88.4% was
obtained that assisting its use in larger scale. Hence, it is suggested that P.
eryngii has potential for biosorption as a low-cost and effective sorbent for NO3-
removal from aqueous solution.

126
PART 6
Remarks: All work of this part has been published in Journal of Geology, Ecology,
and Landscapes 2(1):39–44.
4.6 EFFICIENT ENTRAPPING OF TOXIC LEAD (PB) IONS FROM
AQUEOUS SYSTEM ON FIXED - BED COLUMN OF FUNGAL BIOSORBENT
This study investigate the adsorption capacity of fungal biomass toward Pb(II)
ions in a packed / fixed bed column. In this study, the performance of column
were evaluated by applying various parameters i.e., influence of flow rate, initial
ion concentration and bed height. The experimental (breakthrough) data were
analyzed by means of BDST and Thomas models.
4.6.1 COLUMN STUDY
EFFECT OF FLOW RATE
The adsorption column were operated in 1, 3 and 5 mL min-1 flow rates at a fixed
concentration and bed height till no further Pb(II) ions exclusion were detect.
The breakthrough curve for a column were determined by plotting the ratio of
the Ce/C0 (Ce and C0 are the Pb(II) concentrations of effluent and influent,
respectively) against time, as shown in Figure 4.54. The column performed well
at the lower flow rate (1 mL min-1). Prior breakthrough (Ce/C0=0.05) and
exhaustion time were achieved, when the flow rate increased from 3 to 5 mL
min-1. It is because the decrease in residence time restricted the contact of Pb(II)
solution to the fungal biomass. At higher flow rates the Pb(II) ions did not have
enough time to diffuse into the pores of the fungal biomass and they exited the
column before equilibrium [151].

127
Figure 4.54 Breakthrough curves for different flow rates (Initial Pb(II) ion
concentration: 10 mg L-1; Bed height: 2 cm).
EFFECT OF INITIAL PB(II) IONS CONCENTRATION (THOMAS MODEL)
The adsorption breakthrough curves obtained by changing initial Pb(II)
concentration (20 and 30 mg L-1) at 1 mL min-1 flow rate as given in Figure 4.55.
As estimated, a decrease in Pb(II) concentration gave a later breakthrough curve;
because the treated volume was greatest at the lowest transport due to a
decreased diffusion coefficient or mass transfer coefficient.
Breakthrough time (Ce/C0=0.05) came up after 9.0 min at 20 mg L-1 initial Pb
concentration while the breakthrough time was 3.0 min at 30 mg L-1. The
breakthrough time decreased with increasing Pb concentration as the binding
sites became more quickly saturated in the column [152].

128
Figure 4.55 Breakthrough curves for different Pb(II) ion concentration (Flow rate: 1 mL
min-1; Bed height: 2 cm).
The Thomas model kinetic parameters calculated from equation 16 reveals a
good fit of the experimental data at all concentration examined (Table 4.29). The
correlation coefficient greater than 0.983 showed that the external and internal
diffusions were not the rate limiting step. The rate constant (kTh) decreased with
increasing Pb(II) concentration which indicates that the mass transport resistance
increases due to the driving force between Pb(II) concentration and fungal
biomass.
Table 4.29 The Thomas and BDST model parameters for the biosorption of
Pb(II) on P. eryngii fungal biomass.
Thomas model parameters
Pb(II)
concentration
(mg L-1)
qo
(mg g-1)
kTh
(mL m-1 mg-1) R2
20 2.78 1.42x10⁻³ 0.983
30 3.30 1.39x10⁻³ 0.905
The BDST model parameters
No
(mg cm-3)
Ka
(L mg-1 h-1)x10-3 R2
0.767 5.385 0.964

129
EFFECT OF BED HEIGHT (BDST MODEL)
The accumulation of Pb(II) ions in a fixed-bed column is dependent on the
quantity of biosorbent inside the column. To study the effect of bed height on
Pb(II) retention, fungal biomass of three different bed heights. As depicted by
Figure 4.56a, the breakthrough time varied with bed height. The breakthrough
time decreased with a decreasing bed depth from 3 to 1 cm, as binding sites were
restricted at low bed depths. At low bed depth, the Pb(II) ions do not have
enough time to diffuse into the surface of the biomass, and a reduction in
breakthrough time occurs. Conversely, with an increase in bed depth, the
residence time of Pb(II) solution inside the column was increased, allowing the
Pb(II) ions to diffuse deeper into the fungal biomass.
A plot of service time versus bed depth, at a flow rate of 1 mL min-1 (Figure
4.56b) was linear. The correlation coefficient value (R2=0.964) indicated the
validity of the BDST model for the present system. The values of BDST model
parameters are presented in Table 4.6 calculated from equation 17.
From this model and its obtained constants, feasibility of column structure and
its performance were evaluated using sufficient concentration and flow rate for
sorption of Pb(II) ions onto fungal biomass without further experimental analysis
and data [37].

130
Figure 4.56 (a) Breakthrough curves for different bed height (Flow rate: 1 mL min-1;
Initial Pb(II) ion concentration: 20 mg L-1) and (b) Bed depth service time plot for the
adsorption of Pb(II) ions by fungal biomass in column.
4.6.2 COMPARISON OF PB(II) IONS SORPTION CAPACITY DURING BATCH AND
COLUMN MODE
A relatively high sorption capacity from column has been observed then batch
mode (Table 4.30), which is generally attributed to more time interaction
between the biosorbent and the sorbate surface with column
Table 4.30 Comparison of Pb(II) ions sorption capacity.
Samples* Influent Pb(II)
(mg L-1) Effluent Pb(II)
(mg L-1) Total Pb(II) removal
(%)
Industrial Area, Kotri 0.146±0.005 0.018±0.0026 87.63±1.79
Phuleli Canal,
Hyderabad 0.063±0.0026 0.0049±0.0015 92.28±1.97

131
4.6.3 APPLICATION OF COLUMN ON REAL CONTAMINATED WATER SAMPLES
The removal of toxic ions from real water samples is a link between laboratory
and commercial application of column. In this study, all the laboratory
adsorption column conditions developed (flow rate, bed height) are transferred to
the normal level. Results obtained are given in Table 4.31 suggest that Pb(II)
ions removed successfully below the permissible limits (0.05 mg L-1) of WHO
drinking water standards.
Table 4.31 Removal of Pb(II) ions from real water samples via column method.
(Number of replicates *n=3)
4.6.4 SUMMARY
This study proved that P. eryngii fungal biomass has good potential to be used in
sorption of Pb(II) ions from aqueous solution in fixed bed column. Thomas and
BDST models have been used successfully to evaluate the column performance.
The values of Ka and No indicated that the biosorbent could be used for removal
of Pb(II) metal solutions.
Sorption
capacity Batch mode Column mode
mg g-1 2.97 3.30

132
CHAPTER 5
CONCLUSION AND FUTURE DIRECTIONS
In this chapter conclusion, significance, recommendations and prospects of this
research work were presented.
5.1 CONCLUSION
Present study concluded that the release of hazardous metal ions via industrial
wastewater discharge is the major cause of water pollution. In many parts of the
world, metal and anionic concentration in drinking water is higher than some
international guideline values. To reduce level of toxic ions below the safety
limit from water is a matter of concern because of its extremely high toxicity and
serious threat to human life. For this purpose, a sustainable and environmental
friendly approach is crucial. Work of this thesis introduces an efficient,
environmental friendly, non-pathogenic and a novel fungal biosorbent P. eryngii
for the removal of toxic ions from aqueous system. The study revealed presence
of various functionalities on surface of P. eryngii fungal biomass which were
responsible for attachment of targeted ions toward it.
During sorption process the pH has assumed as an essential part for the removal
of Pb(II) ions. The maximum sorption efficiency monitored in the range of pH 6-
7; thus, optimal pH 7 were selected for further process. From the literature study,
it was accomplished that electrostatic attraction (driving forces) due to ion-
exchange and complexation were responsible for the Pb(II) ions removal. The
equilibrium data for Pb(II) sorption effectively followed the Freundlich isotherm
model for multilayer coverage. P. eryngii biomass was utilized successfully for
the removal of Pb with About 99.9% sorption efficiency from aqueous solution.
The sorption process was rapid and equilibrium was reached after 20 min for
Pb(II) ions. The sorption process obeyed a pseudo second order kinetic model.
All the sorption processes investigated were spontaneous and thermodynamically
feasible. Batch elution tests revealed that complete elution of Pb can be achieved

133
from the biomass using 0.1 N HCl solution. From field trial results it was
concluded that, P. eryngii biomass could be used as an efficient, low cost
biomass for the decontamination of Pb(II) ions from drinking and wastewater at
field level.
Sorption of Cd(II) ions was found to be pH dependent and maximum removal
was observed at pH 5. P. eryngii biomass was utilized successfully for the
removal of Cd with 99.9% sorption efficiency from aqueous solution. The
sorption was rapid and equilibrium was achieved within 10 min. Langmuir
adsorption isotherm was demonstrated to provide the best correlation for the
adsorption of Cd ions confirming monolayer coverage. The sorption process
obeyed a pseudo second order kinetic model. Batch elution tests revealed that
complete elution of Cd can be achieved from the biomass using 0.1 N HNO3
solution. The results are very encouraging for the industrial application of the
technique.
The maximum removal of Hg(II) was achieved at natural water pH. P. eryngii
has rapid and high adsorption-desorption property and reusability in repetitive
cycles. The study revealed that this novel biosorbent exhibit significant potential
for its exploitation in the treatment of industrial effluents containing mercury ion
contamination and can be used for scaling-up existing laboratory-scale
biosorption system to a larger system which are more appropriate for water
purification applications.
Biosorption of F- on fungal biomass was achieved at pH 2. Experimental
equilibrium data best fit to the Langmuir isotherm in contrast with Freundlich
and D-R isotherm models, indicating monolayer biosorption on a homogenous
surface. Thermodynamic parameters revealed that sorption of F- was spontaneous
and endothermic in nature. Modeling of biosorption kinetics showed good
agreement of experimental data with the pseudo second order kinetic model. The
fungal biomass has also shown encouraging results with ground water sample
collected from endemic areas of Tharparkar district, Pakistan.
To determine the effects of various operating conditions (pH, biosorbent dose
and initial NO3- concentration) and their interactions on the overall sorption of

134
NO3- ions by P. eryngii fungal biomass, RSM involving CCD combined with
techniques of regression was performed. The maximum NO3- removal efficiency
obtained from the optimization procedure was 88.4%, which was reached in 17
experiments at a pH level of 7, sorbent dose of 0.24 g and initial NO3-
concentration of 700 mg L-1. Moreover, ion exchange and complexation
processes are the mechanisms of biosorption that occurred in P. eryngii.
Therefore, respective utilization of P. eryngii biomass makes it an effective
sorbent for removal of Pb(II), Cd(II), Hg(II), F- and NO3- ions from aqueous
environment.
5.2 SIGNIFICANCE OF THIS RESEARCH
The present study provides an efficient, cost effective and environmental
friendly biosorbent with its potential in removing metals and anions from
aqueous system.
The used fungal biomass can be easily disposed of since it is biodegradable
or can be used as an alternative raw material for large scale composting
process.
In addition, people of affected areas can take advantage of this natural safe
method for removal of toxic ions from contaminated water.
5.3 RECOMMENDATIONS AND FUTURE DIRECTIONS OF THIS
RESEARCH WORK
•••• The biosorption technique using white-rot fungus Pleurotus eryngii is
reported first time in literature, more novel species of fungal biomasses can
be introduced in future for removal of hazardous ions.
•••• Exploitation of farming waste and other microbial materials may promote the
sustainability of the environment. Particularly in developing countries these
materials will have favorable benefits for commercial persistence.
•••• It is recommended to perform sorption studies on more oxo-anions and
cations using new species of fungal biomass and other natural biosorbents;
subsequently bioremediation seems to be an area which needs broad

135
consideration of scientists and investigators with reference to environmental
pollution.
•••• As present examination have uncovered the alarming level of toxic metals
and anions in aqueous system, that is highly toxic for the health of people
having frequent consumption of it. Henceforth in future a multi-disciplinary
approach by environmentalists and chemists requires for the development of
more state-of-the-art techniques, particularly to detoxify vegetables and food
sources.

136
REFERENCES
[1] S. Nasreen and U. Rafique, "Synthesis, characterization and application of novel nano-adsorbents for the treatment of nitrates and phenols in wastewater," International Journal of Chemical and Environmental Engineering, vol. 3, no. 5, p. 355, 2012.
[2] M. A. Hossain, H. H. Ngo, W. Guo, J. Zhang, and S. Liang, "A laboratory study using maple leaves as a biosorbent for lead removal from aqueous solutions," Water Quality Research Journal, vol. 49, no. 3, pp. 195-209, 2014.
[3] R. Lavecchia, F. Medici, M. S. Patterer, and A. Zuorro, "Lead removal from water by adsorption on spent coffee grounds," Chemical Engineering, vol. 47, 2016.
[4] B. Volesky, "Advances in biosorption of metals: selection of biomass types," FEMS Microbiology Reviews, vol. 14, no. 4, pp. 291-302, 1994.
[5] W. H. Organization, "Guidelines for drinking-water quality. Geneva; WHO. 2008 (1)," ed, 2010.
[6] N. C. Joshi, "Heavy metals, conventional methods for heavy metal removal, biosorption and the development of low cost adsorbent," European Journal Of Pharmaceutical and Medical Research, vol. 4, no. 2, pp. 388-393, 2017.
[7] W. H. Organization, "Guidelines for drinking-water quality [electronic resource]: incorporating 1st and 2nd addenda, vol. 1, Recommendations," 2008.
[8] S. Huang and G. Lin, "Biosorption of Hg(II) and Cu(II) by biomass of dried Sargassum fusiforme in aquatic solution," Journal of Environmental Health Science and Engineering, vol. 13, p. 21, 03/17
[9] W. H. Organization, Guidelines for drinking-water quality. World Health Organization, 2004.
[10] K. A. H. Jin Ho Joo, Sedky H. A. Hassan, "Biosorptive capacity of Cd(II) and Pb(II) by lyophilized cells of Pleurotus eryngii," Korean Journal of Soil Science and Fertilizer, vol. 44, no. 4, pp. 615-624, 2011.
[11] C. D. WHO, "Health hazards from nitrates in drinking-water," 1985.
[12] K. Kadirvelu, K. Thamaraiselvi, and C. Namasivayam, "Removal of heavy metals from industrial wastewaters by adsorption onto activated carbon prepared from an agricultural solid waste," Bioresource Technology, vol. 76, no. 1, pp. 63-65, 2001.
[13] G. Karthikeyan and S. S. Ilango, "Fluoride sorption using Morringa Indica-based activated carbon," Journal of Environmental Health Science & Engineering, vol. 4, no. 1, pp. 21-28, 2007.

137
[14] M. Taziki, H. Ahmadzadeh, M. A. Murry, and S. R. Lyon, "Nitrate and nitrite removal from wastewater using algae," Current Biotechnology, vol. 4, no. 4, pp. 426-440, 2015.
[15] A. Kapoor and T. Viraraghavan, "Nitrate removal from drinking water," Journal of Environmental Engineering, vol. 123, no. 4, pp. 371-380, 1997.
[16] S. Water and W. H. Organization, "Guidelines for drinking-water quality [electronic resource]: Incorporating first addendum. Vol. 1, Recommendations," 2006.
[17] A. M. Arshad and W. Ibrahim, "Phosphate and sulphate adsorptions in Bungor series soil," Journal of Biology, Agriculture and Healthcare, vol. 4, no. 1, 2014.
[18] E. Errais et al., "Efficient anionic dye adsorption on natural untreated clay: Kinetic study and thermodynamic parameters," Desalination, vol. 275, no. 1, pp. 74-81, 2011.
[19] M. Ulibarri, I. Pavlovic, C. Barriga, M. Hermosın, and J. Cornejo, "Adsorption of anionic species on hydrotalcite-like compounds: effect of interlayer anion and crystallinity," Applied Clay Science, vol. 18, no. 1, pp. 17-27, 2001.
[20] A. Dabrowski, Z. Hubicki, P. Podkościelny, and E. Robens, "Selective removal of the heavy metal ions from waters and industrial wastewaters by ion-exchange method," Chemosphere, vol. 56, no. 2, pp. 91-106, 2004.
[21] T. Rafique, S. Naseem, M. I. Bhanger, and T. H. Usmani, "Fluoride ion contamination in the groundwater of Mithi sub-district, the Thar Desert, Pakistan," Environmental Geology, vol. 56, no. 2, pp. 317-326, 2008.
[22] T. Rafique, S. Naseem, T. H. Usmani, E. Bashir, F. A. Khan, and M. I. Bhanger, "Geochemical factors controlling the occurrence of high fluoride groundwater in the Nagar Parkar area, Sindh, Pakistan," Journal of Hazardous Materials, vol. 171, no. 1, pp. 424-430, 2009.
[23] S. Meenakshi and N. Viswanathan, "Identification of selective ion-exchange resin for fluoride sorption," Journal of Colloid and Interface Science, vol. 308, no. 2, pp. 438-450, 2007.
[24] M. Ahemad and M. Kibret, "Recent trends in microbial biosorption of heavy metals: A review," Biochemistry and Molecular Biology, vol. 1, no. 1, pp. 19-26, 2013.
[25] N. Viswanathan and S. Meenakshi, "Enhanced fluoride sorption using La (III) incorporated carboxylated chitosan beads," Journal of Colloid and Interface Science, vol. 322, no. 2, pp. 375-383, 2008.
[26] C. Namasivayam and W. H. Höll, "Quaternized biomass as an anion exchanger for the removal of nitrate and other anions from water," Journal of Chemical Technology and Biotechnology, vol. 80, no. 2, pp. 164-168, 2005.
[27] R. A. Wuana and F. E. Okieimen, "Heavy metals in contaminated soils: a review of sources, chemistry, risks and best available strategies for remediation," ISRN Ecology, vol. 2011, 2011.

138
[28] F. Fu and Q. Wang, "Removal of heavy metal ions from wastewaters: a review," Journal of Environmental Management, vol. 92, no. 3, pp. 407-418, 2011.
[29] N. Ahalya, T. Ramachandra, and R. Kanamadi, "Biosorption of heavy metals," Research Journal of Chemical & Environmental Sciences, vol. 7, no. 4, pp. 71-79, 2003.
[30] A. Kumar, B. S. Bisht, and V. D. Joshi, "Biosorption of heavy metals by four acclimated microbial species, Bacillus spp., Pseudomonas spp., Staphylococcus spp. and Aspergillus niger," Journal of Biological and Environmental Sciences, vol. 4, no. 12, 2010.
[31] B. Volesky and Z. Holan, "Biosorption of heavy metals," Biotechnology Progress, vol. 11, no. 3, pp. 235-250, 1995.
[32] M. Malakootian, Z. Khodashenas Limoni, and M. Malakootian, "The Efficiency of Lead Biosorption from Industrial Wastewater by Micro-alga Spirulina platensis," International Journal of Environmental Research, vol. 10, no. 3, pp. 357-366, 2016.
[33] A. McHale and S. McHale, "Microbial biosorption of metals: potential in the treatment of metal pollution," Biotechnology Advances, vol. 12, no. 4, pp. 647-652, 1994.
[34] V. M. Duarte Zaragoza, R. Carrillo, and C. M. Gutierrez Castorena, "Lead sorption–desorption from organic residues," Environmental Technology, vol. 32, no. 4, pp. 353-361, 2011.
[35] T. Ramachandra, N. Ahalya, and R. Kanamadi, "Biosorption: techniques and mechanisms," A report, http:/ces. iisc. ernet. in/energy, http/ces. iisc. ernet. in/biodiversity, cestvr@ us. iisc. ernet. in, 2005.
[36] S. Amirnia, "Biosorption processes for removal of toxic metals from wastewaters," Electronic Thesis and Dissertation Repository, p. 2929, 2015.
[37] R. Apiratikul, T. F. Marhaba, S. Wattanachira, and P. Pavasant, "Biosorption of binary mixtures of heavy metals by green macro alga, Caulerpa lentillifera," Songklanakarin Journalof Science & Technology, vol. 26, no. 1, pp. 199-207, 2004.
[38] B. Volesky, Biosorption of heavy metals. CRC press, 1990.
[39] D. J. Wase and J. Wase, Biosorbents for metal ions. CRC Press, 2002.
[40] A. Hammaini, F. González, A. Ballester, M. Blázquez, and J. Munoz, "Biosorption of heavy metals by activated sludge and their desorption characteristics," Journal of Environmental Management, vol. 84, no. 4, pp. 419-426, 2007.
[41] I. Langmuir, "The constitution and fundamental properties of solids and liquids. Part I. Solids," Journal of the American Chemical Society, vol. 38, no. 11, pp. 2221-2295, 1916.
[42] H. Freundlich, "Over the adsorption in solution," The Journal of Physical Chemistry, vol. 57, no. 385471, pp. 1100-1107, 1906.

139
[43] K. Foo and B. Hameed, "Insights into the modeling of adsorption isotherm systems," Chemical Engineering Journal, vol. 156, no. 1, pp. 2-10, 2010.
[44] H. Yuh-Shan, "Citation review of Lagergren kinetic rate equation on adsorption reactions," Scientometrics, vol. 59, no. 1, pp. 171-177, 2004.
[45] Y.-S. Ho and G. McKay, "Pseudo-second order model for sorption processes," Process Biochemistry, vol. 34, no. 5, pp. 451-465, 1999.
[46] T. W. Weber and R. K. Chakravorti, "Pore and solid diffusion models for fixed‐bed adsorbers," AIChE Journal, vol. 20, no. 2, pp. 228-238, 1974.
[47] D. Everett, "Thermodynamics of adsorption from solution. Part 1.—Perfect systems," Transactions of the Faraday Society, vol. 60, pp. 1803-1813, 1964.
[48] M. Amini et al., "Statistical modeling of global geogenic fluoride contamination in groundwaters," Environmental Science & Technology, vol. 42, no. 10, pp. 3662-3668, 2008.
[49] J. Antony, Design of experiments for engineers and scientists, 1st ed. Elsevier, 2014, p. 190.
[50] Y. Gao et al., "A facile synthesis of ion imprinted mesoporous silica adsorbents by a co-condensation pathway and application in a fixed-bed column study for lead removal," Australian Journal of Chemistry, vol. 68, no. 7, pp. 1051-1064, 2015.
[51] P. JagadeeshBabu, R. Krishnan, and M. Singh, "Bed depth service time model for the biosorption of reactive red dye using the Portunus sanguinolentus shell," Asia‐Pacific Journal of Chemical Engineering, vol. 5, no. 5, pp. 791-797, 2010.
[52] A. Liu, K. Hidajat, S. Kawi, and D. Zhao, "A new class of hybrid mesoporous materials with functionalized organic monolayers for selective adsorption of heavy metal ions," Chemical Communications, no. 13, pp. 1145-1146, 2000.
[53] J. Aguado, J. M. Arsuaga, A. Arencibia, M. Lindo, and V. Gascón, "Aqueous heavy metals removal by adsorption on amine-functionalized mesoporous silica," Journal of Hazardous Materials, vol. 163, no. 1, pp. 213-221, 2009.
[54] V. K. Gupta, M. Gupta, and S. Sharma, "Process development for the removal of lead and chromium from aqueous solutions using red mud - an aluminium industry waste," Water Research, vol. 35, no. 5, pp. 1125-1134, 2001.
[55] D. Kołodyńska, "Polyacrylate anion exchangers in sorption of heavy metal ions with the biodegradable complexing agent," Chemical Engineering Journal, vol. 150, no. 2, pp. 280-288, 2009.
[56] T. Wen, X. Wu, X. Tan, X. Wang, and A. Xu, "One-pot synthesis of water-swellable Mg-Al layered double hydroxides and graphene oxide nanocomposites for efficient removal of As (V) from aqueous solutions," ACS Applied Materials & Interfaces, vol. 5, no. 8, pp. 3304-3311, 2013.
[57] N. R. Bishnoi, M. Bajaj, N. Sharma, and A. Gupta, "Adsorption of Cr (VI) on activated rice husk carbon and activated alumina," Bioresource Technology, vol. 91, no. 3, pp. 305-307, 2004.

140
[58] I. Alinnor, "Adsorption of heavy metal ions from aqueous solution by fly ash," Fuel, vol. 86, no. 5, pp. 853-857, 2007.
[59] Y.-F. Zhou and R. J. Haynes, "Removal of Pb (II), Cr (III) and Cr (VI) from aqueous solutions using alum-derived water treatment sludge," Water, Air, & Soil Pollution, vol. 215, no. 1, pp. 631-643, 2011.
[60] W. W. Ngah, L. Teong, and M. Hanafiah, "Adsorption of dyes and heavy metal ions by chitosan composites: A review," Carbohydrate Polymers, vol. 83, no. 4, pp. 1446-1456, 2011.
[61] R. Apak, K. Güçlü, and M. H. Turgut, "Modeling of copper (II), cadmium (II), and lead (II) adsorption on red mud," Journal of Colloid and Interface Science, vol. 203, no. 1, pp. 122-130, 1998.
[62] Y. S. Ok, J. E. Yang, Y.-S. Zhang, S.-J. Kim, and D.-Y. Chung, "Heavy metal adsorption by a formulated zeolite-Portland cement mixture," Journal of Hazardous Materials, vol. 147, no. 1, pp. 91-96, 2007.
[63] O. Altın, H. Ö. Özbelge, and T. Doğu, "Use of general purpose adsorption isotherms for heavy metal–clay mineral interactions," Journal of Colloid and Interface Science, vol. 198, no. 1, pp. 130-140, 1998.
[64] P. Liu and T. Wang, "Adsorption properties of hyperbranched aliphatic polyester grafted attapulgite towards heavy metal ions," Journal of Hazardous Materials, vol. 149, no. 1, pp. 75-79, 2007.
[65] M. Luisa Cervera, M. Carmen Arnal, and M. de la Guardia, "Removal of heavy metals by using adsorption on alumina or chitosan," Analytical and Bioanalytical Chemistry, vol. 375, no. 6, pp. 820-825, 2003.
[66] D. Kinniburgh, M. Jackson, and J. Syers, "Adsorption of alkaline earth, transition, and heavy metal cations by hydrous oxide gels of iron and aluminum," Soil Science Society of America Journal, vol. 40, no. 5, pp. 796-799, 1976.
[67] A. Afkhami, M. Saber-Tehrani, and H. Bagheri, "Simultaneous removal of heavy-metal ions in wastewater samples using nano-alumina modified with 2, 4-dinitrophenylhydrazine," Journal of Hazardous Materials, vol. 181, no. 1, pp. 836-844, 2010.
[68] E. Deliyanni, E. Peleka, and K. Matis, "Modeling the sorption of metal ions from aqueous solution by iron-based adsorbents," Journal of Hazardous Materials, vol. 172, no. 2, pp. 550-558, 2009.
[69] R. R. Gadde and H. A. Laitinen, "Heavy metal adsorption by hydrous iron and manganese oxides," Analytical Chemistry, vol. 46, no. 13, pp. 2022-2026, 1974.
[70] K. Spark, B. Johnson, and J. Wells, "Characterizing heavy‐metal adsorption on oxides and oxyhydroxides," European Journal of Soil Science, vol. 46, no. 4, pp. 621-631, 1995.
[71] A. Violante, M. Ricciardella, and M. Pigna, "Adsorption of heavy metals on mixed Fe-Al oxides in the absence or presence of organic ligands," Water, Air, & Soil Pollution, vol. 145, no. 1, pp. 289-306, 2003.

141
[72] M. Jang, E. W. Shin, J. K. Park, and S. I. Choi, "Mechanisms of arsenate adsorption by highly-ordered nano-structured silicate media impregnated with metal oxides," Environmental Science & Technology, vol. 37, no. 21, pp. 5062-5070, 2003.
[73] M. Mana, M. S. Ouali, M. Lindheimer, and L. C. de Menorval, "Removal of lead from aqueous solutions with a treated spent bleaching earth," Journal of Hazardous Materials, vol. 159, no. 2, pp. 358-364, 2008.
[74] S. Kulkarni and D. J. Kaware, "Regeneration and Recovery in Adsorption-a Review," International Journal of Innovative Science, Engineering & Technology, vol. 1, no. 8, pp. 61-65, 2014.
[75] I. K. Shah, P. Pre, and B. J. Alappat, "Steam regeneration of adsorbents: an experimental and technical review," Journal of Chemical Sciences, vol. 2, no. 4, pp. 1078-1088, 2013.
[76] A. B. Norberg and H. Persson, "Accumulation of heavy‐metal ions by Zoogloea ramigera," Biotechnology and Bioengineering, vol. 26, no. 3, pp. 239-246, 1984.
[77] A. Malik, "Metal bioremediation through growing cells," Environment International, vol. 30, no. 2, pp. 261-278, 2004.
[78] E. El Bestawy, S. Helmy, H. Hussien, M. Fahmy, and R. Amer, "Bioremediation of heavy metal-contaminated effluent using optimized activated sludge bacteria," Applied Water Science, vol. 3, no. 1, p. 181, 2012.
[79] M. Oves, M. S. Khan, and A. Zaidi, "Biosorption of heavy metals by Bacillus thuringiensis strain OSM29 originating from industrial effluent contaminated north Indian soil," Saudi Journal of Biological Sciences, vol. 20, no. 2, pp. 121-129, 2013.
[80] W. C. Leung, H. Chua, and W. Lo, "Biosorption of heavy metals by bacteria isolated from activated sludge," Applied Biochemistry and Biotechnology, vol. 91, no. 1, pp. 171-184, 2001.
[81] H. Hussein, S. F. Ibrahim, K. Kandeel, and H. Moawad, "Biosorption of heavy metals from waste water using Pseudomonas sp," Electronic Journal of Biotechnology, vol. 7, no. 1, pp. 30-37, 2004.
[82] M. M. Parungao, P. S. Tacata, C. R. G. Tanayan, and L. C. Trinidad, "Biosorption of copper, cadmium and lead by copper-resistant bacteria isolated from Mogpog River, Marinduque," Philippine Journal of Science, vol. 136, no. 2, p. 155, 2007.
[83] E. Gelagutashvili, "Comparative study on heavy metals biosorption by different types of bacteria," Open Journal of Metal, vol. 3, no. 02, p. 62, 2013.
[84] A. H. Sulaymon, A. A. Mohammed, and T. J. Al-Musawi, "Competitive biosorption of lead, cadmium, copper, and arsenic ions using algae," Environmental Science and Pollution Research, pp. 1-13, 2013.
[85] A. Hamdy, "Biosorption of heavy metals by marine algae," Current Microbiology, vol. 41, no. 4, pp. 232-238, 2000.

142
[86] K. Kayalvizhi, K. Vijayaraghavan, and M. Velan, "Biosorption of Cr (VI) using a novel microalga Rhizoclonium hookeri: equilibrium, kinetics and thermodynamic studies," Desalination and Water Treatment, vol. 56, no. 1, pp. 194-203, 2015.
[87] S. Prasher, M. Beaugeard, J. Hawari, P. Bera, R. Patel, and S. Kim, "Biosorption of heavy metals by red algae (Palmaria palmata)," Environmental Technology, vol. 25, no. 10, pp. 1097-1106, 2004.
[88] M. L. Ching, "Biosorption of heavy metals (Cu, Zn, Cd and Pb) by marine algae biomass," University Malaysia Sabah, 2010.
[89] A. Wilke, R. Buchholz, and G. Bunke, "Selective biosorption of heavy metals by algae," Environmental Biotechnology, vol. 2, pp. 47-56, 2006.
[90] A. Sulaymon, A. Mohammed, and T. Al-Musawi, "Column biosorption of lead, cadmium, copper, and arsenic ions onto algae," Journal of Bioprocessing & Biotechniques, vol. 3, p. 128, 2013.
[91] A. Kushwah and J. Srivastav, "Biosorption of copper ions by green algae Spirogyra," International Journal of Chemical Studies, vol. 3, no. 3, pp. 36-38, 2015.
[92] H. D. Utomo, K. X. D. Tan, Z. Y. D. Choong, J. J. Yu, J. J. Ong, and Z. B. Lim, "Biosorption of heavy metal by algae biomass in surface water," Journal of Environmental Protection, vol. 7, no. 11, p. 1547, 2016.
[93] A. S. Ayangbenro and O. O. Babalola, "A new strategy for heavy metal polluted environments: A review of microbial biosorbents," International Journal of Environmental Research and Public Health, vol. 14, no. 1, p. 94, 2017.
[94] S. N. Farhan and A. A. Khadom, "Biosorption of heavy metals from aqueous solutions by Saccharomyces cerevisiae," International Journal of Industrial Chemistry, vol. 6, no. 2, p. 119, 2015.
[95] J. Infante, R. De Arco, and M. Angulo, "Removal of lead, mercury and nickel using the yeast Saccharomyces cerevisiae," Revista MVZ Córdoba, vol. 19, no. 2, pp. 4141-4149, 2014.
[96] K. M. Hernández Mata, O. Monge Amaya, M. T. Certucha Barragán, F. J. Almendariz Tapia, and E. Acedo Félix, "Metallic biosorption using yeasts in continuous systems," International Journal of Photoenergy, vol. 2013, 2013.
[97] K. Tálos, T. Pernyeszi, C. Majdik, A. Hegedűsova, and C. Páger, "Cadmium biosorption by baker’s yeast in aqueous suspension," Journal of the Serbian Chemical Society, vol. 77, no. 4, pp. 549-561, 2012.
[98] E. Breierová et al., "Biosorption of cadmium ions by different yeast species," Zeitschrift für Naturforschung C, vol. 57, no. 7-8, pp. 634-639, 2002.
[99] D. Park, Y.-S. Yun, and J. M. Park, "Use of dead fungal biomass for the detoxification of hexavalent chromium: screening and kinetics," Process Biochemistry, vol. 40, no. 7, pp. 2559-2565, 2005.

143
[100] A. Javaid, R. Bajwa, and T. Manzoor, "Biosorption of heavy metals by pretreated biomass of Aspergillus niger," Pak J Bot, vol. 43, no. 1, pp. 419-425, 2011.
[101] Y. Jin et al., "Biosorption of Lead (II) by Arthrobacter sp. 25: Process Optimization and Mechanism," Journal of Microbiology & Biotechnology, vol. 26, no. 8, pp. 1428-1438, 2016.
[102] M. Tuzen, O. D. Uluozlu, I. Karaman, and M. Soylak, "Mercury (II) and methyl mercury speciation on Streptococcus pyogenes loaded Dowex Optipore SD-2," Journal of Hazardous Materials, vol. 169, no. 1, pp. 345-350, 2009.
[103] A. A. Al-Homaidan, A. F. Al-Abbad, A. A. Al-Hazzani, A. A. Al-Ghanayem, and J. A. Alabdullatif, "Lead removal by Spirulina platensis biomass," International Journal of Phytoremediation, vol. 18, no. 2, pp. 184-189, 2016.
[104] I. Tüzün, G. Bayramoğlu, E. Yalçın, G. Başaran, G. Celik, and M. Y. Arıca, "Equilibrium and kinetic studies on biosorption of Hg (II), Cd (II) and Pb (II) ions onto microalgae Chlamydomonas reinhardtii," Journal of Environmental Management, vol. 77, no. 2, pp. 85-92, 2005.
[105] A. Yaqub, M. F. Naeem, K. M. Anjum, N. Ali, W. Khan, and Z. Khan, "Biosorption of mercury (Hg II) by Oedogonium urceolatum: equilibrium and kinetics," Biologia (Pakistan), vol. 55, no. 1&2, pp. 99-109, 2009.
[106] A. Esmaeili, B. Saremnia, and M. Kalantari, "Removal of mercury (II) from aqueous solutions by biosorption on the biomass of Sargassum glaucescens and Gracilaria corticata," Arabian Journal of Chemistry, vol. 8, no. 4, pp. 506-511, 2015.
[107] H. Yavuz, A. Denizli, H. Güngüneş, M. Safarikova, and I. Safarik, "Biosorption of mercury on magnetically modified yeast cells," Separation and Purification Technology, vol. 52, no. 2, pp. 253-260, 2006.
[108] A. Shoaib, N. Aslam, and N. Aslam, "Trichoderma harzianum: adsorption, desorption, isotherm and FTIR studies," Journal of Animal and Plant Sciences, vol. 23, no. 5, pp. 1460-1465, 2013.
[109] R. Say, N. Yılmaz, and A. Denizli, "Biosorption of cadmium, lead, mercury, and arsenic ions by the fungus Penicillium purpurogenum," Separation Science and Technology, vol. 38, no. 9, pp. 2039-2053, 2003.
[110] G. Kirova, Z. Velkova, M. Stoytcheva, Y. Hristova, I. Iliev, and V. Gochev, "Biosorption of Pb (II) ions from aqueous solutions by waste biomass of Streptomyces fradiae pretreated with NaOH," Biotechnology & Biotechnological Equipment, vol. 29, no. 4, pp. 689-695, 2015.
[111] H. D. Ozsoy, "Biosorptive removal of Hg (II) ions by Rhizopus oligosporus produced from corn-processing wastewater," African Journal of Biotechnology, vol. 9, no. 51, pp. 8783-8790, 2010.
[112] A. Sarı, M. Tüzen, and D. Cıtak, "Equilibrium, thermodynamic and kinetic studies on biosorption of mercury from aqueous solution by macrofungus (Lycoperdon perlatum) biomass," Separation Science and Technology, vol. 47, no. 8, pp. 1167-1176, 2012.

144
[113] Y.-M. Sun, C.-Y. Horng, F.-L. Chang, L.-C. Cheng, and W.-X. Tian, "Biosorption of lead, mercury and cadmium ions by Aspergillus terreus immobilized in a natural matrix," Polish Journal of Microbiology, vol. 59, no. 1, pp. 37-44, 2010.
[114] Y. Khambhaty, K. Mody, S. Basha, and B. Jha, "Hg (II) removal from aqueous solution by dead fungal biomass of marine Aspergillus niger: Kinetic studies," Separation Science and Technology, vol. 43, no. 5, pp. 1221-1238, 2008.
[115] S. H. Abbas, I. M. Ismail, T. M. Mostafa, and A. H. Sulaymon, "Biosorption of heavy metals: a review," Journal of Chemical Science and Technology, vol. 3, no. 4, pp. 74-102, 2014.
[116] L. Barros Júnior, G. Macedo, M. Duarte, E. Silva, and A. Lobato, "Biosorption of cadmium using the fungus Aspergillus niger," Brazilian Journal of Chemical Engineering, vol. 20, no. 3, pp. 229-239, 2003.
[117] S. Dwivedi, P. Mondal, and C. Balomajumder, "Bioremoval of fluoride from synthetic water using gram-negative bacteria Shewanella putrefaciens," Journal of Hazardous, Toxic, and Radioactive Waste, vol. 21, no. 2, p. 04016023, 2016.
[118] S. V. Mohan, S. Ramanaiah, B. Rajkumar, and P. Sarma, "Removal of fluoride from aqueous phase by biosorption onto algal biosorbent Spirogyra sp.-IO2: Sorption mechanism elucidation," Journal of Hazardous Materials, vol. 141, no. 3, pp. 465-474, 2007.
[119] P. G. Hiremath and T. Theodore, "Biosorption of fluoride from synthetic and ground water using Chlorella vulgaris immobilized in calcium alginate beads in an upflow packed bed column." Periodica Polytechnica Chemical Engineering, vol. 61, no. 3, pp. 188-199, 2017.
[120] R. Merugu, S. S. Garimella, K. R. Kudle, D. Ramesh, and M. P. Rudra, "Optimization studies for defluoridation of water using Aspergillus niger fungal biosorbent," International Journal of ChemTech Research, vol. 4, pp. 1089-93, 2012.
[121] R. Prajapat, A. Bhatnagar, R. K. Gaur, and V. Bajpai, "Fluoride removal from water by sorbing on plant and fungal biomass," International Journal of Biological Technology, vol. 1, pp. 43-46, 2010.
[122] J. Chen, Y. Cai, M. Clark, and Y. Yu, "Equilibrium and kinetic studies of phosphate removal from solution onto a hydrothermally modified oyster shell material," PLoS One, vol. 8, no. 4, p. e60243, 2013.
[123] J. Hrenovic, M. Rozic, T. Ivankovic, and A. Farkas, "Biosorption of phosphate from synthetic wastewater by biosolids," Open Life Sciences, vol. 4, no. 3, pp. 397-403, 2009.
[124] S. Rajarathnam, Z. Bano, and P. G. Miles, "Pleurotus mushrooms. Part I A. Morphology, life cycle, taxonomy, breeding, and cultivation," Critical Reviews in Food Science & Nutrition, vol. 26, no. 2, pp. 157-223, 1987.
[125] J.-S. Ryu et al., "The growth characteristics of Pleurotus eryngii," The Korean Journal of Mycology, vol. 35, no. 1, pp. 47-53, 2007.

145
[126] S.-H. Kan, B.-Y. Sun, F. Xu, Q.-X. Song, and S.-F. Zhang, "Biosorption of aquatic copper (II) by mushroom biomass Pleurotus eryngii: kinetic and isotherm studies," Water Science and Technology, vol. 71, no. 2, pp. 283-288, 2015.
[127] Y. Jiang, R. Hao, and S. Yang, "Equilibrium and kinetic studies on biosorption of Pb(II) by common edible macrofungi: a comparative study," Canadian Journal of Microbiology, vol. 62, no. 4, pp. 329-337, 2016/04/01 2016.
[128] S. H. Kan, B. Y. Sun, F. Xu, Q. X. Song, and S. F. Zhang, "Biosorption of aquatic copper (II) by mushroom biomass Pleurotus eryngii: kinetic and isotherm studies," Water Science & Technology, vol. 71, no. 2, pp. 283-8, 2015.
[129] S. Özdemir, V. Okumuş, E. Kılınç, H. Bilgetekin, A. Dündar, and B. Ziyadanogˇulları, "Pleurotus eryngii immobilized Amberlite XAD-16 as a solid-phase biosorbent for preconcentrations of Cd2+ and Co2+ and their determination by ICP-OES," Talanta, vol. 99, pp. 502-506, 2012/09/15/ 2012.
[130] G. I. Zervakis, G. Venturella, and K. Papadopoulou, "Genetic polymorphism and taxonomic infrastructure of the Pleurotus eryngii species-complex as determined by RAPD analysis, isozyme profiles and ecomorphological characters," Microbiology, vol. 147, no. 11, pp. 3183-3194, 2001.
[131] F. Amin, F. N. Talpur, A. Balouch, M. A. Surhio, and M. A. Bhutto, "Biosorption of fluoride from aqueous solution by white-rot fungus Pleurotus eryngii ATCC 90888," Environmental Nanotechnology, Monitoring & Management, vol. 3, pp. 30-37, 2015.
[132] H. Hein, H. Müller, and I. Witte, "Water and environmental analysis with the UV/vis spectrometer Lambda 2," Perkin-Elmer Überlingen, 1992.
[133] B. C. Smith, Infrared spectral interpretation: a systematic approach. CRC press, 1998.
[134] F. Amin, F. N. Talpur, A. Balouch, and H. I. Afridi, "Eco-efficient fungal biomass for the removal of Pb(II) Ions from water system: A sorption process and mechanism," International Journal of Environmental Research, DOI 10.1007/s41742-017-0029-z
[135] R. Say, A. Denizli, and M. Y. Arıca, "Biosorption of cadmium (II), lead (II) and copper (II) with the filamentous fungus Phanerochaete chrysosporium," Bioresource Technology, vol. 76, no. 1, pp. 67-70, 2001.
[136] V. K. Gupta and I. Ali, "Removal of lead and chromium from wastewater using bagasse fly ash - a sugar industry waste," Journal of Colloid and Interface Science, vol. 271, no. 2, pp. 321-328, 2004.
[137] W. N. dos Santos, D. D. Cavalcante, E. G. P. da Silva, C. F. das Virgens, and F. de Souza Dias, "Biosorption of Pb (II) and Cd (II) ions by Agave sisalana (sisal fiber)," Microchemical Journal, vol. 97, no. 2, pp. 269-273, 2011.
[138] G. Copello et al., "Polyphenol–SiO2 hybrid biosorbent for heavy metal removal. Yerba mate waste (Ilex paraguariensis) as polyphenol source: Kinetics and isotherm studies," Colloids and Surfaces B: Biointerfaces, vol. 102, pp. 218-226, 2013.
146
[139] A. A. Suhaimi, M. A. A. Samah, and S. A. Aziz, "Biosorption of lead (II) ions from aqueous solution by treated corn (Z. mays) leaves biomass," International Journal of Environmental Protection, vol. 3, no. 3, p. 44, 2013.
[140] J. O. Tijani, M. Ndamitso, and B. Aliyu, "Equilibrium and Isotherm studies of the biosorption of potentially toxic elements from aqueous solution by Blighia sapida (Akee apple) seeds," International Journal of Advancements in Research & Technology, vol. 2, no. 3, pp. 1-12, 2013.
[141] S. Samadi, R. Motallebi, and M. Nasiri Nasrabadi, "Synthesis, characterization and application of Lanthanide metal-ion-doped TiO2/bentonite nanocomposite for removal of lead (II) and cadmium (II) from aquatic media," Journal of Water and Environmental Nanotechnology, vol. 1, no. 1, pp. 35-44, 2016.
[142] S. Senniappan, S. Palanisamy, S. Shanmugam, and S. Gobalsamy, "Adsorption of Pb (II) from aqueous solution by Cassia fistula seed carbon: Kinetics, equilibrium, and desorption studies," Environmental Progress & Sustainable Energy, vol. 36, no. 1, pp. 138-146, 2017.
[143] M. Y. Arıca, İ. Tüzün, E. Yalçın, Ö. İnce, and G. Bayramoğlu, "Utilisation of native, heat and acid-treated microalgae Chlamydomonas reinhardtii preparations for biosorption of Cr (VI) ions," Process Biochemistry, vol. 40, no. 7, pp. 2351-2358, 2005.
[144] S. Al-Garni, K. Ghanem, and A. Bahobail, "Biosorption characteristics of Aspergillus fumigatus in removal of cadmium from an aqueous solution," African Journal of Biotechnology, vol. 8, no. 17, 2009.
[145] X. Xiao et al., "Biosorption of cadmium by endophytic fungus (EF) Microsphaeropsis sp. LSE10 isolated from cadmium hyperaccumulator Solanum nigrum L," Bioresource Technology, vol. 101, no. 6, pp. 1668-1674, 2010.
[146] M. N. Akthar, K. S. Sastry, and P. M. Mohan, "Mechanism of metal ion biosorption by fungal biomass," Biometals, vol. 9, no. 1, pp. 21-28, 1996.
[147] M. Ma, Y. Lu, R. Chen, L. Ma, and Y. Wang, "Hexavalent chromium removal from water using heat-acid activated red mud," Open Journal of Applied Sciences, vol. 4, no. 05, p. 275, 2014.
[148] N. Tewari, P. Vasudevan, and B. Guha, "Study on biosorption of Cr (VI) by Mucor hiemalis," Biochemical Engineering Journal, vol. 23, no. 2, pp. 185-192, 2005.
[149] Z. Aksu and T. Kutsal, "A bioseparation process for removing lead (II) ions from waste water by using C. vulgaris," Journal of Chemical Technology and Biotechnology, vol. 52, no. 1, pp. 109-118, 1991.
[150] Z. Aksu and İ. A. İşoğlu, "Removal of copper (II) ions from aqueous solution by biosorption onto agricultural waste sugar beet pulp," Process Biochemistry, vol. 40, no. 9, pp. 3031-3044, 2005.
[151] G. Manju, C. Raji, and T. Anirudhan, "Evaluation of coconut husk carbon for the removal of arsenic from water," Water Research, vol. 32, no. 10, pp. 3062-3070, 1998.

147
[152] G. McKay, Y. Ho, and J. Ng, "Biosorption of copper from waste waters: a review," Separation and Purification Methods, vol. 28, no. 1, pp. 87-125, 1999.
[153] Y. Ho and G. McKay, "A comparison of chemisorption kinetic models applied to pollutant removal on various sorbents," Process Safety and Environmental Protection, vol. 76, no. 4, pp. 332-340, 1998.
[154] Y. Liu, X. Chang, Y. Guo, and S. Meng, "Biosorption and preconcentration of lead and cadmium on waste Chinese herb Pang Da Hai," Journal of Hazardous Materials, vol. 135, no. 1, pp. 389-394, 2006.
[155] A. M. Abdel-Aty, N. S. Ammar, H. H. A. Ghafar, and R. K. Ali, "Biosorption of cadmium and lead from aqueous solution by fresh water alga Anabaena sphaerica biomass," Journal of Advanced Research, vol. 4, no. 4, pp. 367-374, 2013.
[156] A. Pandey and D. Banerjee, "Biosorption of cadmium (II) using discarded biomass of Aspergillus aculeatus DBF9," Terrestrial and Aquatic Environmental Toxicology, vol. 6, no. 1, pp. 8-13, 2012.
[157] K. Singh, A. Singh, and S. Hasan, "Low cost bio-sorbent ‘wheat bran’for the removal of cadmium from wastewater: kinetic and equilibrium studies," Bioresource Technology, vol. 97, no. 8, pp. 994-1001, 2006.
[158] N. Sharma, K. Kaur, and S. Kaur, "Kinetic and equilibrium studies on the removal of Cd2+ ions from water using polyacrylamide grafted rice (Oryza sativa) husk and (Tectona grandis) saw dust," Journal of Hazardous Materials, vol. 163, no. 2, pp. 1338-1344, 2009.
[159] V. Dang, H. Doan, T. Dang-Vu, and A. Lohi, "Equilibrium and kinetics of biosorption of cadmium (II) and copper (II) ions by wheat straw," Bioresource Technology, vol. 100, no. 1, pp. 211-219, 2009.
[160] S. Lagergren, "Zur theorie der sogenannten adsorption geloster stoffe," Kungliga svenska vetenskapsakademiens. Handlingar, vol. 24, pp. 1-39, 1898.
[161] Y.-S. Ho, "Removal of copper ions from aqueous solution by tree fern," Water Research, vol. 37, no. 10, pp. 2323-2330, 2003.
[162] S. Chaiyasith, P. Chaiyasith, and C. Septhum, "Removal of cadmium and nickel from aqueous solution by adsorption onto treated fly ash from Thailand," Thammasat International Journal of Science and Technology, vol. 11, no. 2, pp. 13-20, 2006.
[163] J. Anwar et al., "Removal of chromium on Polyalthia longifolia leaves biomass," International Journal of Phytoremediation, vol. 13, no. 5, pp. 410-420, 2011.
[164] B. Opeolu, O. Bamgbose, and O. S. Fatoki, "Zinc abatement from simulated and industrial wastewaters using sugarcane biomass," Water SA, vol. 37, no. 3, pp. 313-320, 2011.
[165] D. J. Babu, G. Kalyani, H. J. Rao, Y. P. Kumar, and P. King, "Biosorption characteristics of lead onto bentonite clay, as low-cost natural biosorbent,"

148
International Journal of Scientific and Engnineering Research, vol. 3, pp. 1-6, 2012.
[166] M. Horsfall Jnr and A. I. Spiff, "Effects of temperature on the sorption of Pb2+
and Cd2+ from aqueous solution by Caladium bicolor (Wild Cocoyam) biomass," Electronic Journal of Biotechnology, vol. 8, no. 2, pp. 43-50, 2005.
[167] M. Tuzen, I. Karaman, D. Citak, and M. Soylak, "Mercury (II) and methyl mercury determinations in water and fish samples by using solid phase extraction and cold vapour atomic absorption spectrometry combination," Food and Chemical Toxicology, vol. 47, no. 7, pp. 1648-1652, 2009.
[168] C. M. Simonescu and M. Ferdeş, "Fungal Biomass for Cu (II) Uptake from Aqueous Systems," Polish Journal of Environmental Studies, vol. 21, no. 6, 2012.
[169] N. Viswanathan, C. S. Sundaram, and S. Meenakshi, "Removal of fluoride from aqueous solution using protonated chitosan beads," Journal of Hazardous Materials, vol. 161, no. 1, pp. 423-430, 2009.
[170] S. Ramanaiah, S. V. Mohan, and P. Sarma, "Adsorptive removal of fluoride from aqueous phase using waste fungus (Pleurotus ostreatus 1804) biosorbent: Kinetics evaluation," Ecological Engineering, vol. 31, no. 1, pp. 47-56, 2007.
[171] G. Alagumuthu and M. Rajan, "Kinetic and equilibrium studies on fluoride removal by zirconium (IV): impregnated groundnut shell carbon," Hemijska Industrija, vol. 64, no. 4, pp. 295-304, 2010.
[172] S. Chakrabarty and H. Sarma, "Defluoridation of contaminated drinking water using neem charcoal adsorbent: kinetics and equilibrium studies," International Journal of ChemTech Research, vol. 4, no. 2, pp. 511-516, 2012.
[173] P. Methodis and P. Selvapathy, "Studies on removal of fluoride from water by used tea leaves carbon," in 3rd international conference on plants and Environmental Pollution, Lucknow, India, 2005.
[174] P. Shirke and P. Chandra, "Fluoride uptake by duck-weed Spirodela-polyrrhiza," Fluoride, vol. 24, no. 3, pp. 109-112, 1991.
[175] C. V. Vardhan and J. Karthikeyan, "Removal of fluoride from water using low-cost materials," in Fifteenth International Water Technology Conference, IWTC-15, 2011, pp. 1-14.
[176] M. Bhatnagar, A. Bhatnagar, and S. Jha, "Interactive biosorption by microalgal biomass as a tool for fluoride removal," Biotechnology Letters, vol. 24, no. 13, pp. 1079-1081, 2002.
[177] Y. Sag and T. Kutsal, "Biosorption of heavy metals by Zoogloea ramigera: use of adsorption isotherms and a comparison of biosorption characteristics," The Chemical Engineering Journal and the Biochemical Engineering Journal, vol. 60, no. 1-3, pp. 181-188, 1995.
[178] E. Eren, "Removal of copper ions by modified Unye clay, Turkey," Journal of Hazardous Materials, vol. 159, no. 2, pp. 235-244, 2008.

149
[179] E. Kumar et al., "Defluoridation from aqueous solutions by granular ferric hydroxide (GFH)," Water Research, vol. 43, no. 2, pp. 490-498, 2009.
[180] M. A. Khan, M. Ngabura, T. S. Choong, H. Masood, and L. A. Chuah, "Biosorption and desorption of Nickel on oil cake: Batch and column studies," Bioresource Technology, vol. 103, no. 1, pp. 35-42, 2012.
[181] Z. N. Garba and A. A. Rahim, "Process optimization of K2C2O4-activated carbon from Prosopis africana seed hulls using response surface methodology," Journal of Analytical and Applied Pyrolysis, vol. 107, pp. 306-312, 2014.
[182] J. Aravind, P. Kanmani, G. Sudha, and R. Balan, "Optimization of chromium (VI) biosorption using gooseberry seeds by response surface methodology," Global Journal of Environmental Science and Management, vol. 2, no. 1, pp. 61-68, 2016.
[183] J. Antony, Design of experiments for engineers and scientists. Elsevier, 2014.
[184] S. Saraf and V. K. Vaidya, "Statistical optimization of biosorption of Reactive Orange 13 by dead biomass of Rhizopus arrhizus NCIM 997 using response surface methodology," International Journal of Industrial Chemistry, vol. 6, no. 2, p. 93, 2015.
[185] M. Mourabet, A. El Rhilassi, H. El Boujaady, M. Bennani-Ziatni, R. El Hamri, and A. Taitai, "Removal of fluoride from aqueous solution by adsorption on hydroxyapatite (HAp) using response surface methodology," Journal of Saudi Chemical Society, vol. 19, no. 6, pp. 603-615, 2015.
[186] Y. Cengeloglu, A. Tor, M. Ersoz, and G. Arslan, "Removal of nitrate from aqueous solution by using red mud," Separation and Purification Technology, vol. 51, no. 3, pp. 374-378, 2006.
[187] I. Mobasherpour, E. Salahi, and A. Asjodi, "Research on the batch and fixed-bed column performance of red mud adsorbents for lead removal," Soil and Water, vol. 4, p. 5, 2014.
[188] A. Negrea, L. Lupa, M. Ciopec, and P. Negrea, "Experimental and modelling studies on As (III) removal from aqueous medium on fixed bed column," Chemical Bulletin of “Politehnica” University of Timisoara, ROMANIA Series of Chemistry and Environmental Engineering, vol. 56, no. 70, p. 2, 2011.

150
LIST OF PUBLICATIONS
1. Amin F, Talpur FN, Balouch A, Surhio MA, Bhutto MA (2015).
Biosorption of fluoride from aqueous solution by white - rot fungus
Pleurotus eryngii ATCC 90888. Environmental Nanotechnology,
Monitoring & Management 3:30–37.
2. Amin F, Talpur FN, Balouch A, Chandio ZA, Surhio MA, Afridi HI
(2016). Biosorption of mercury(II) from aqueous solution by fungal
biomass Pleurotus eryngii: isotherm, kinetic, and thermodynamic studies.
Environmental Progress & Sustainable Energy 3:1274–1282.
3. Amin F, Talpur FN, Balouch A, Samoon MK, Afridi HI, Surhio MA
(2018). Utilization of Pleurotus eryngii biosorbent as an environmental
bioremedy for the decontamination of trace cadmium(II) ions from water
system. Water Science & Technology 78 (5): 1148-1158.
4. Amin F, Talpur FN, Balouch A, Afridi HI (2017). Eco-efficient fungal
biomass for the removal of Pb(II) ions from water system: A sorption
process and mechanism. International Journal of Environmental Research
3(11):315–325.
5. Amin F, Talpur FN, Balouch A, Afridi HI, Khaskheli AA (2018).
Efficient entrapping of toxic Pb(II) ions from aqueous system on fixed-
bed column of fungal biosorbent, Geology, Ecology, and Landscapes
2(1):39–44.
6. Amin F, Talpur FN, Balouch A, Afridi HI, Surhio MA (2017). Statistical
methodology for biosorption of nitrate (NO3-) ions from aqueous solution
by Pleurotus eryngii fungal biomass, Modeling Earth Systems and
Environment 3:1101–1112.