Winners and losers 141111 final
59
Winners and Losers? ...equality lessons for Budget 2012 2011
description
http://www.tasc.ie/download/pdf/winners_and_losers_141111_final.pdf
Transcript of Winners and losers 141111 final
Winners and Losers?...equality lessons for Budget 2012
2011
Table of Contents Preface .................................................................................................................................................... 2
Section 1 Introduction ........................................................................................................................ 3
Highlighted findings ............................................................................................................................ 4
Section 2 Gender-Impact Assessment of Budgetary Measures ......................................................... 7
Why gender budgeting? ...................................................................................................................... 7
A profile of women and men .............................................................................................................. 8
Income distributions of women and men ......................................................................................... 13
Section 3 2011 Budgetary Measures ................................................................................................ 14
Changes to the system of direct taxation and social security contributions .................................... 14
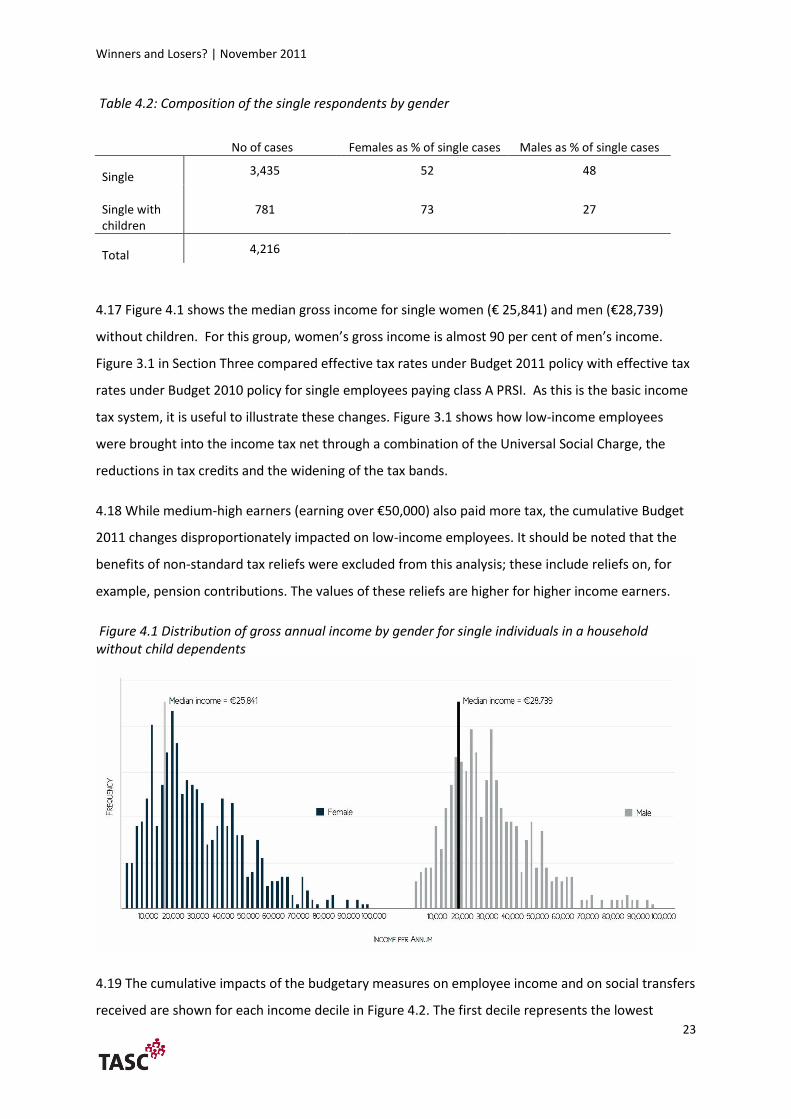
Changes to social welfare payments and general expenditure ........................................................ 17
Section 4 Gender Assessment of Budgetary Impacts ....................................................................... 19
Survey of Income and Living Conditions ........................................................................................... 19
The impacts of taxation and social welfare changes on different income groups ........................... 21
The categories ................................................................................................................................... 22
Single Individuals without Children .............................................................................................. 22
Single Individuals with Children .................................................................................................... 25
Married Individuals ....................................................................................................................... 27
Married individuals – household compositions ............................................................................ 28
Section 5 Sexual Orientation ............................................................................................................ 33
Section 6 Conclusions and Policy Implications ................................................................................. 36
Strategic policymaking ...................................................................................................................... 36
Gender .............................................................................................................................................. 36
Sexual Orientation ............................................................................................................................ 36
Identifying the winners and losers .................................................................................................... 37
Data issues and further research ...................................................................................................... 39
References ............................................................................................................................................ 40
Appendix I: Notes on methodology used ............................................................................................. 43
Appendix II: Representative samples .................................................................................................... 49
Appendix III: Underrating and Overrating Income ............................................................................... 51
Appendix IV: Information on sample .................................................................................................... 53
Appendix V: Towards a comprehensive equality audit: enhancing the analysis .................................. 55
Acknowledgement and Disclaimer ....................................................................................................... 58
Winners and Losers? | November 2011
2
Preface
TASC is an independent, progressive think-tank with the aim of making Ireland a more equal society
with a stronger democracy. TASC’s work has long highlighted Ireland’s high level of economic
inequality.
Tax and spending changes in budgets can have extremely different impacts upon people living on
different levels of income. Likewise, budget decisions can affect men and women very differently, for
a range of reasons.
In TASC’s previous budget proposals, the need to audit both the economic efficiency and the equality
of budget proposals was highlighted. This report presents the results of an initial study to clarify what
is meant by an ‘equality audit’. It explores what effects on equality it is possible to demonstrate using
existing data. The effect of Budget 2011 decisions on lower and higher income households was
examined, as were the effects on people due to their gender or sexual orientation. A full equality
audit would need to cover more areas, such as people with disabilities or people from minority ethnic
backgrounds.
The first observation to be made is that much more comprehensive data is needed on incomes and
wealth in Ireland, as well as on the tax and welfare systems.
However, there is sufficient available data to show that, when the basic tax and welfare changes
from Budget 2011 are examined for employees and for people reliant on state transfers, households
on different income levels were affected in a significantly unequal way. Lower income households lost
proportionately more of their incomes than higher income households. Likewise, the available
evidence shows women to be more badly affected by the last budget than men.
It is a major deficiency in Irish budgets that comprehensive distributional analysis is not carried out to
inform the Dáil before members vote on budget measures. Such analysis is common across Europe
and is considered an essential part of budget debates.
It is absolutely feasible for the Department of Finance to produce an analysis of the distribution of
income and wealth, and to show how this will be changed by the measures in Budget 2012. Austerity
measures in recent budgets have had a disproportionately negative impact on the living standards of
people on lower incomes. It is time that budget decisions are subjected to much more detailed
scrutiny.
Suggestions and constructive criticism from readers is welcome, to help TASC develop the methods
used in this study.
Nat O’Connor
Director, TASC
Winners and Losers? | November 2011
3
Section 1 Introduction
1.1 TASC received support from the EU PROGRESS Fund and the Equality Authority to undertake an
analysis of two groups under the nine grounds in the equality legislation, namely sexual orientation
and gender. TASC undertook a gender-impact assessment of Budget 2011 to quantify the
cumulative effects of the main changes to direct taxation, social insurance and social welfare
payments on the income of women and men. TASC also carried out a comparative analysis of the tax
treatment of same sex couples who are registered civil partners, and married heterosexual couples,
following the introduction of the Civil Partnership Act.
1.2 This project was undertaken as part of TASC’s costed ‘Equality Budget’. The Equality Budget
demonstrates how equality objectives can be reconciled with economic recovery and the need to
close the structural deficit. These goals can be complementary parts of a strategy for ‘recovery with
equality’ based on:
Restoring economic growth and returning people to employment through targeted
investment in human capital and physical infrastructure;
Identifying new and sustainable sources of revenue and implementing gradual equality
proofed tax increases as part of the process of fiscal adjustment;
Identifying efficiency savings in public spending and using these savings to maintain social
benefits at current levels and to ensure the provision of high quality public services.
1.3 National budgets are a reflection of political choices and government priorities, and they have a
number of sometimes competing goals. These include managing the public finances in a responsible
and credible manner, facilitating economic recovery and development, maintaining and enhancing
quality of life without compromising sustainability, and increasing economic equality. In this regard,
enhancing economic equality should be a key budgetary goal. It can be achieved through reform of
the tax system, through changes to the system of social transfers, and/or through the provision of
general public services.
1.4 Increasing economic equality is synonymous with a more equal distribution of society’s
resources. Some of the key questions in determining economic equality are:
What is the distribution of wealth?
What is the distribution of income?
Winners and Losers? | November 2011
4
To what extent do particular groups in society incur significantly higher or lower
costs than others?
To what extent do public services supplement income?
A comprehensive equality audit of a budget requires analysis of how each of these four elements is
impacted by the changes in transfers (tax and benefits), as well as other policy changes, announced
in the budget.
1.5 The purpose of this project is to demonstrate how budgetary measures can exacerbate or
ameliorate economic inequality between various groups in Irish society. Irish governments do not
currently carry out a comprehensive and systematic analysis to quantify what those impacts are, and
whether one or more groups have been disproportionately affected. This project also aims to
demonstrate some of the analytical tools that should be used as part of an ‘equality audit’ of
budgetary measures; other tools are outlined in Appendix V. TASC has long argued that an equality
audit should form part of an annual equality statement, to be included as part of the budget. All
major budgetary decisions should be informed by an equality audit based on a comprehensive
distributional analysis of the impacts on all income groups and household types.
1.6 This report is structured as follow: Sections 2 to 4 comprise the gender-impact assessment of
budgetary measures. Section 5 contains the comparative analysis of the tax treatment of same sex
couples who are registered civil partners and married heterosexual couples. Section 6 sets out
TASC’s conclusions and policy implications. The appendices provide a detailed technical overview of
the methodology used to undertake the gender-impact assessment of budgetary measures.
Highlighted findings
TASC undertook a gender impact assessment of Budget 2011 to quantify the cumulative
effects of the main changes to direct taxation, social insurance and social welfare payments
on the income of women and men.
Overall, those on the lowest incomes were hardest hit by the measured budgetary changes.
They were adversely affected by the cuts to social transfers and by changes to taxation,
specifically the introduction of the Universal Social Charge, widening of tax bands and
reductions in tax credits. As women are concentrated in lower income groups, they suffered
a disproportionate impact.
Winners and Losers? | November 2011
5
The category most adversely affected by the measured Budget 2011 changes was the ‘single
with children’ group. This category has by far the lowest average income of all the
categories studied, and has a very high ratio of females (73 per cent) to males (27 per cent).
The cumulative impact of the budgetary changes on this category caused individuals in this
category to lose five per cent of their income on average.
The least adversely affected category was the ‘married two incomes 70/30 – higher earner’
category, i.e. the higher earner within two earner households. This category had the highest
gross annual income, which was reduced by an average of 1.3 per cent. This was also the
category with the highest ratio of males (80 per cent) to females (20 per cent).
The category ‘single with children’ includes the households and groups that are most ‘at risk
of poverty’ and those experiencing ‘consistent poverty’: lone parent households and
children. The loss of income is likely to further exacerbate income inequalities and result in
ever greater numbers being put at risk of poverty, as this is the group that is least able to
absorb the burden of the adjustment. It is imperative that the budgetary measures chosen
for Budget 2012 do not continue to impose the burden of adjustment on those groups in
society least able to absorb reductions in income, and least able to withstand diminished
access to vital public services.
Single individuals without children were the largest category (58.5 per cent) in the analysed
sample. Single men with no child dependents earning between €15,070 and €19,059 lost
proportionately more of their income (4.25 per cent) as a result of the measured tax
changes and social welfare cuts than any of the other income deciles in this category.
Within this group, the average male earns closer to €19,059 upper limit. Therefore the
lowering of the personal and PAYE tax credits, resulting in the reliefs expiring at earnings of
€16,500 per annum, combined with the introduction of the seven per cent USC rate on
annual earnings above €16,016, impacted proportionately more on the average earning
male in this group.
TASC recommends that all budgetary measures under consideration be subjected to an
equality audit, whereby a full distributional analysis is undertaken to identify how different
groups in society are likely to be affected. This would inform a process of equality-proofing
and gender-proofing the budget.
Winners and Losers? | November 2011
6
TASC carried out a comparative analysis of the tax treatment of same sex couples who are
registered civil partners, and married heterosexual couples, following the introduction of the
Civil Partnership Act. The introduction of civil partnership addressed most of the inequalities
relating to taxation experienced by same sex couples vis-à-vis married heterosexual couples.
However, differences still remain and these differences mean that civil partners and their
families still have fewer rights and protections than their married counterparts. The
realisation of full equality between these groups can only be achieved through access to civil
marriage.
Winners and Losers? | November 2011
7
Section 2 Gender-Impact Assessment of Budgetary Measures
Why gender budgeting?
2.1 Economic inequality between women and men remains persistent and entrenched in Ireland.
Women work fewer hours on average, earn less on average, own less and are more likely to live in
poverty than men. This not only limits women’s financial power and freedom, but also hinders their
full participation in public life at local and national level, including their ability to attain in positions
of power and influence.
2.2 The idea of gender-responsive budgets has developed out of a growing understanding that fiscal
policy can contribute to narrowing or widening gender gaps in areas such as income, health
outcomes and education. Fiscal policy can be a powerful tool for improving the living standards and
opportunities of different groups of women and men. Although budgetary provisions may appear to
be gender-neutral, this appearance of neutrality can more accurately be described as ‘gender
blindness’, since the national budget generally ignores the different socially determined roles and
responsibilities of men and women, and usually overlooks the different impacts that policies have on
men and women.
2.3 A gender-responsive budget is not a separate budget for women. Rather, it is an approach which
can be used to highlight the gap between policy statements and the resources committed to their
implementation, ensuring that public money is spent in more gender-equitable ways. The issue is
not whether we are spending the same on women and men, but whether the spending is adequate
to meet women’s and men's needs1.
2.4 A gender-responsive budgetary analysis is also a tool for testing a government's gender
mainstreaming commitments – associating policy commitments across government departments
with their budgets. Without a suitable economic underpinning and systematic approach, a
government's equality commitments are unlikely to be realised. Essentially, a gender-responsive
analysis of budgetary measures can work by:
Analysing one or more types of public expenditure, or methods of raising revenue, from a
gender perspective.
Identifying the implications and quantifying the impacts of these policies for women and
girls as compared to men and boys.
1 Women’s Budget Group, UK http://www.wbg.org.uk/index.htm
Winners and Losers? | November 2011
8
2.5 A gender budgetary analysis can improve the effectiveness, efficiency, accountability and
transparency of government policy, as well as make a significant contribution towards gender
equality and the realisation of women's rights.
2.6 Expenditure and taxation policies have different implications for, and effects upon, women and
men in terms of their contributions to both the paid and unpaid spheres of work. A gender
budgetary analysis can reveal these discrepancies and provide the government with the opportunity
(in partnership with other actors) to integrate a gender analysis into economic policy.
2.7 Thus, a gender budgetary analysis can benefit society both by reducing social and economic
gender inequalities, and by ensuring that public money is better targeted and spent more efficiently,
thereby improving policy outcomes. This type of analysis also brings internal benefits to
government. By strengthening the collection and analysis of gender-disaggregated data and
enhancing the ability to determine the real value of resources targeted towards women and men,
gender budget analysis can provide a better understanding of how resources are being spent and
thus increase the efficiency of policy.
2.8 Gender budgetary analysis can cover the whole budget in terms of taxation and public spending;
expenditure of selected departments or programmes; or specific changes to the tax system. TASC’s
gender budgetary analysis focuses on the two most significant areas of budgetary transfers.
Specifically, the analysis quantifies the effects of budgetary changes on women’s and men’s
employee income, and quantifies the effects of budgetary changes on women’s and men’s current
transfer receipts obtained through social welfare provision. It is a static analysis. A comprehensive
equality audit would ideally examine budgetary effects dynamically over time, including behavioural
impacts, would incorporate impacts on all sources of income, and would incorporate the impacts of
other budgetary measures such as changes to indirect taxation and changes to public services.
A profile of women and men
2.9 In the context of the current recession, a number of key economic indicators demonstrate the
different positions of women and men. Irish women work fewer hours and earn less than men. In
relation to the labour market, the unemployment rate in Ireland now stands at 14.3 per cent of the
labour force or 304,5002. The male unemployment rate is now 17.5 per cent, while the female
unemployment rate is 10.4 per cent. The employment rate for those aged between 15 and 64 has
fallen from a peak in 2007 of 69.2 per cent, to a rate of just 59.6 per cent in 2011. Total employment
2 CSO, Quarterly National Household Survey, Quarter 2, 2011 www.cso.ie
Winners and Losers? | November 2011
9
fell by 292,600 between the second quarter of 2007 and the second quarter of 2011. The male
employment rate has fallen from over 77 per cent in 2007 to 63.3 per cent in 2011 while the female
employment rate has fallen from over 60 per cent in 2007 to 56 per cent in 2011. The EU target for
women in employment was 60 per cent by 2010, a target that was met by Ireland in 2007 and 2008,
but not in 2009 or 2010. Men worked an average of 39.4 hours a week in 2010 compared with 30.9
for women3.
2.10 Women’s poverty is increasing4. The ‘at risk of poverty’ threshold is the value below which a
person is considered to be at risk of poverty. In 2009, the threshold was €12,0645. Children (those
aged 0 to 17) were the most vulnerable age group with an ‘at risk of poverty’ rate of 18.6 per cent. In
relation to household composition, people living in lone parent households were the most
vulnerable group, with an ‘at risk of poverty’ of 35.5 per cent. Ninty three per cent of lone parents
are women6.
2.11 ‘Consistent poverty’ combines relative income poverty (i.e. the ‘at risk of poverty’ rate) with
material deprivation. The 2009 SILC data shows that consistent poverty levels increased from 4.2 per
cent to 5.5 per cent between 2008 and 2009. Just under 17 per cent (one in six) of people living in
lone parent households were in consistent poverty in 2009. This was the highest rate recorded
among all household types.7
2.12 In 2009, 8.7 per cent of children (aged 0-17) continued to live in consistent poverty and children
accounted for 41.9 per cent of the all those living in consistent poverty. This amounts to 91,954
children. Consistent poverty means that these children are living in households with incomes below
60 per cent of the national median income, and experiencing deprivation based on the agreed
eleven deprivation indicators. Child poverty is a multi-dimensional problem and has knock-on
exclusionary effects for children in terms of access to resources and participation in everyday
activities such as education and play8.
3 CSO, Women and Men in Ireland, 2010 www.cso.ie
4 CSO, Survey of Income and Living Conditions, 2009 www.cso.ie
5 The ‘at risk of poverty’ threshold is calculated using 60 per cent of median income.
6 CSO, Women and Men in Ireland, 2010 www.cso.ie
7 Over 44 per cent of individuals in lone parent households experienced two or more of the forms of
deprivation. 8 www.barnardos.ie
Winners and Losers? | November 2011
10
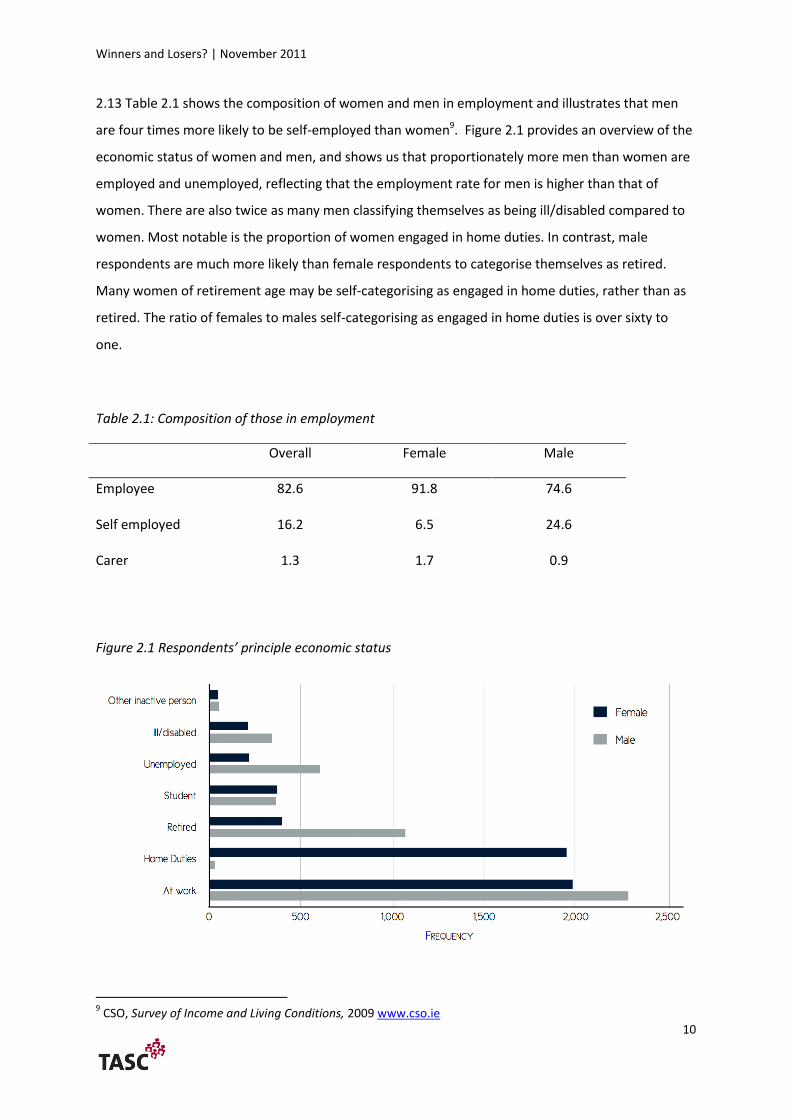
2.13 Table 2.1 shows the composition of women and men in employment and illustrates that men
are four times more likely to be self-employed than women9. Figure 2.1 provides an overview of the
economic status of women and men, and shows us that proportionately more men than women are
employed and unemployed, reflecting that the employment rate for men is higher than that of
women. There are also twice as many men classifying themselves as being ill/disabled compared to
women. Most notable is the proportion of women engaged in home duties. In contrast, male
respondents are much more likely than female respondents to categorise themselves as retired.
Many women of retirement age may be self-categorising as engaged in home duties, rather than as
retired. The ratio of females to males self-categorising as engaged in home duties is over sixty to
one.
Table 2.1: Composition of those in employment
Overall Female Male
Employee 82.6 91.8 74.6
Self employed 16.2 6.5 24.6
Carer 1.3 1.7 0.9
Figure 2.1 Respondents’ principle economic status
9 CSO, Survey of Income and Living Conditions, 2009 www.cso.ie
Winners and Losers? | November 2011
11
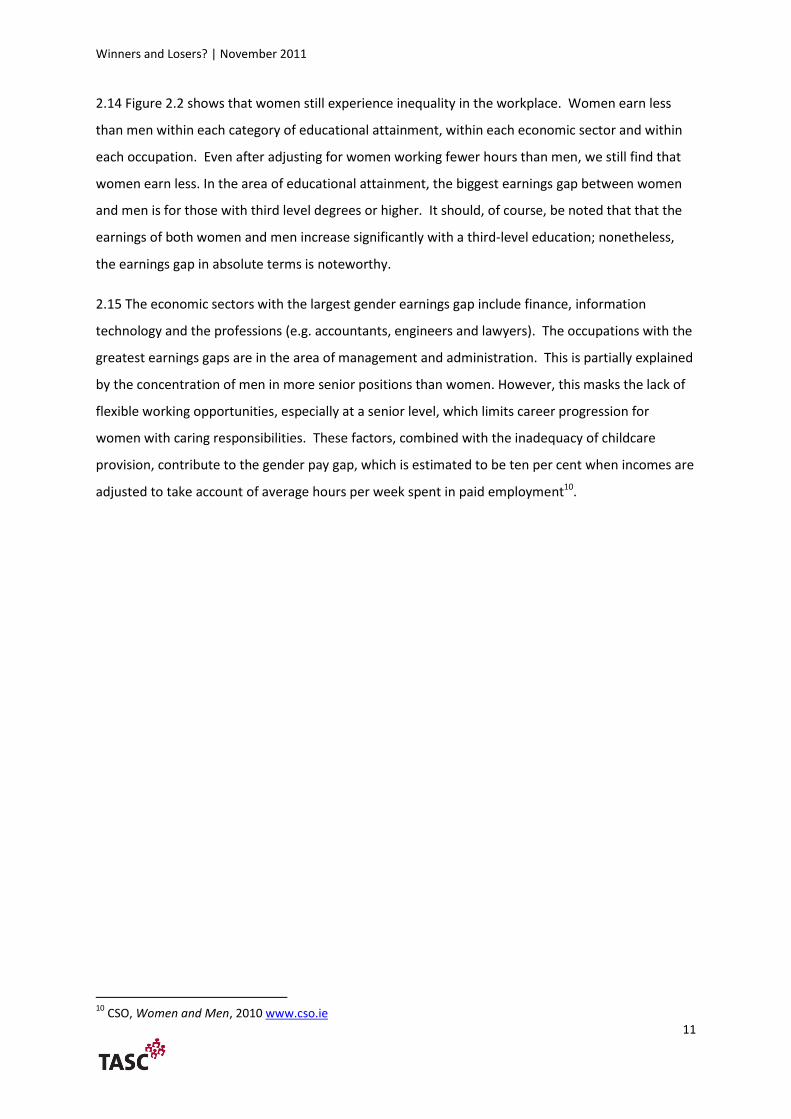
2.14 Figure 2.2 shows that women still experience inequality in the workplace. Women earn less
than men within each category of educational attainment, within each economic sector and within
each occupation. Even after adjusting for women working fewer hours than men, we still find that
women earn less. In the area of educational attainment, the biggest earnings gap between women
and men is for those with third level degrees or higher. It should, of course, be noted that that the
earnings of both women and men increase significantly with a third-level education; nonetheless,
the earnings gap in absolute terms is noteworthy.
2.15 The economic sectors with the largest gender earnings gap include finance, information
technology and the professions (e.g. accountants, engineers and lawyers). The occupations with the
greatest earnings gaps are in the area of management and administration. This is partially explained
by the concentration of men in more senior positions than women. However, this masks the lack of
flexible working opportunities, especially at a senior level, which limits career progression for
women with caring responsibilities. These factors, combined with the inadequacy of childcare
provision, contribute to the gender pay gap, which is estimated to be ten per cent when incomes are
adjusted to take account of average hours per week spent in paid employment10.
10
CSO, Women and Men, 2010 www.cso.ie
Winners and Losers? | November 2011
12
Figure 2.2 Gender comparisons of hours of paid employment and earnings per hour by educational
attainment, by economic sector and by occupation
Winners and Losers? | November 2011
13
Income distributions of women and men
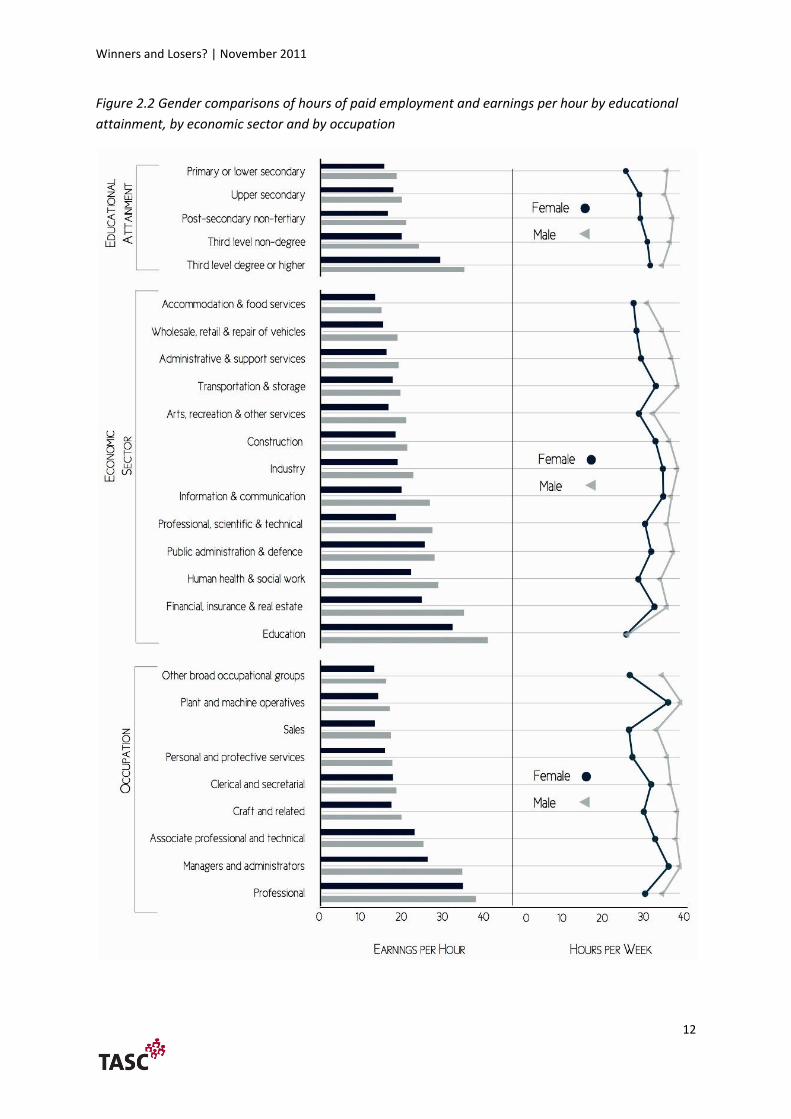
2.16 Figure 2.3 illustrates the overall distribution of gross income per annum for women and men
using 2009 Survey of Income and Living Conditions data. The median income for men is €25,504
while the median income for women is €15,972. Figure 2.3 illustrates the extent to which women
are concentrated in the lower income groups. Consequently, changes to taxes and benefits that
disproportionately impact on low-income groups can also be expected to disproportionately impact
on women.
Figure 2.3: Distribution of gross annual income by gender11
11
Truncated at €100,000 per annum
Winners and Losers? | November 2011
14
Section 3 2011 Budgetary Measures
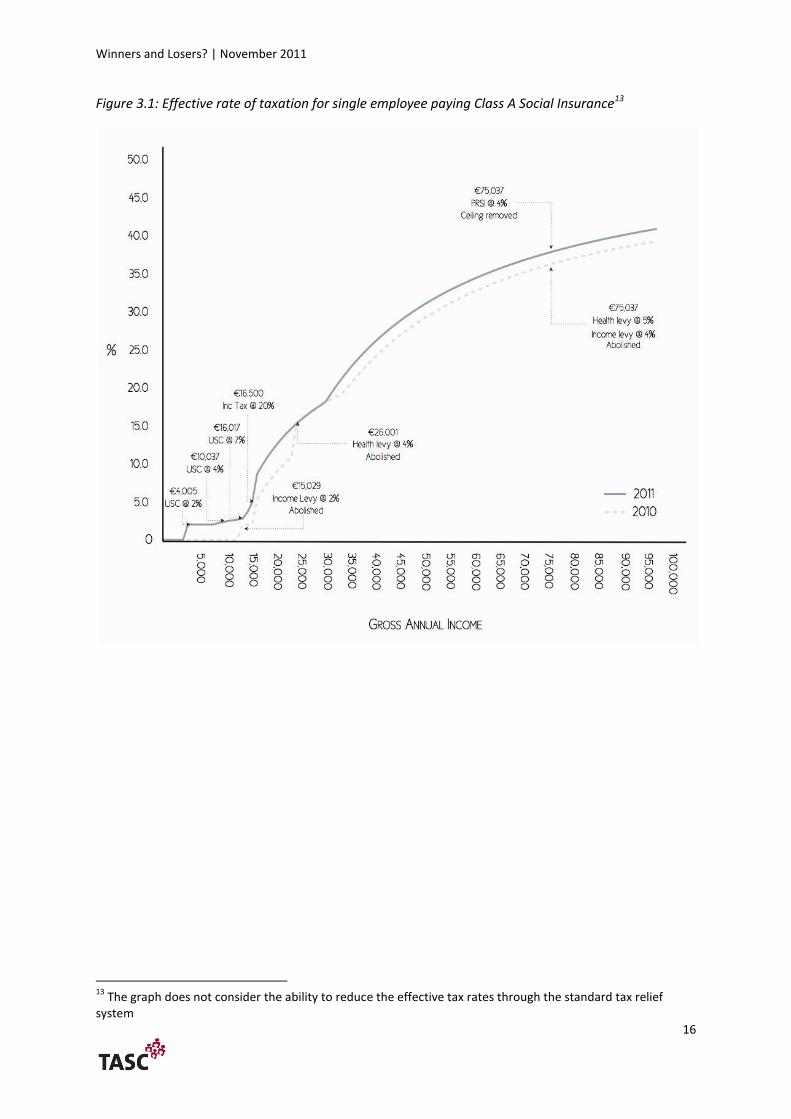
Changes to the system of direct taxation and social security contributions
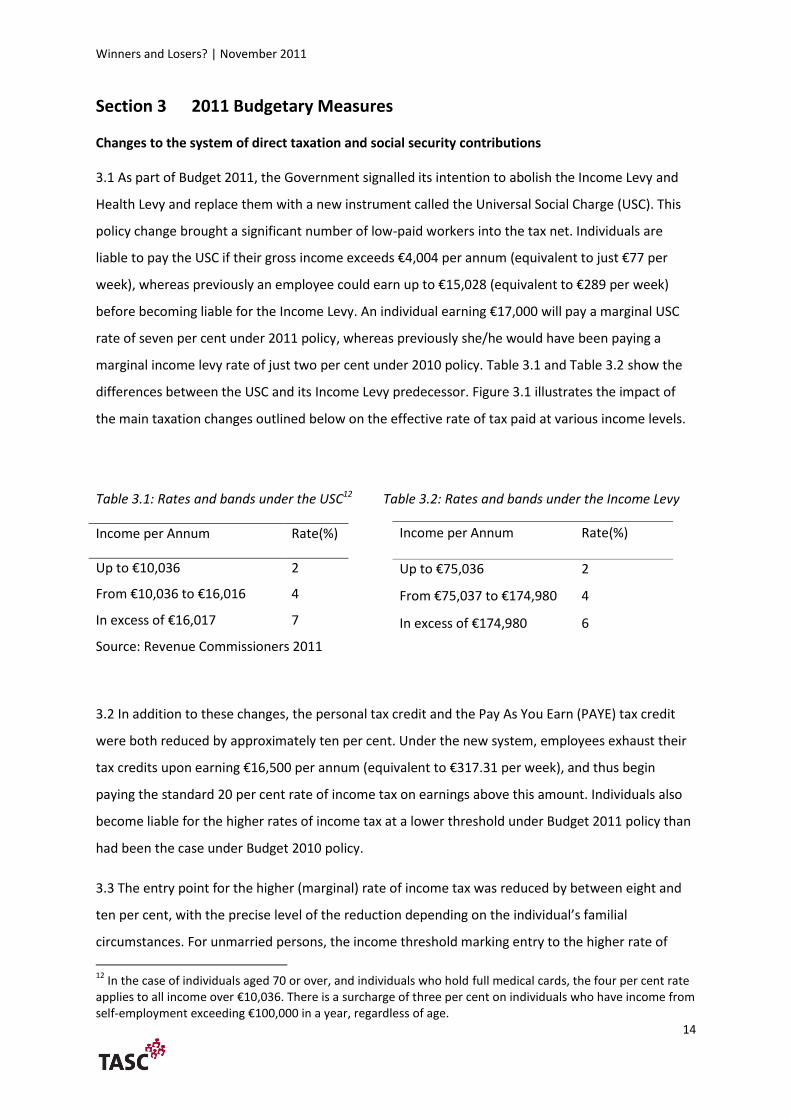
3.1 As part of Budget 2011, the Government signalled its intention to abolish the Income Levy and
Health Levy and replace them with a new instrument called the Universal Social Charge (USC). This
policy change brought a significant number of low-paid workers into the tax net. Individuals are
liable to pay the USC if their gross income exceeds €4,004 per annum (equivalent to just €77 per
week), whereas previously an employee could earn up to €15,028 (equivalent to €289 per week)
before becoming liable for the Income Levy. An individual earning €17,000 will pay a marginal USC
rate of seven per cent under 2011 policy, whereas previously she/he would have been paying a
marginal income levy rate of just two per cent under 2010 policy. Table 3.1 and Table 3.2 show the
differences between the USC and its Income Levy predecessor. Figure 3.1 illustrates the impact of
the main taxation changes outlined below on the effective rate of tax paid at various income levels.
Table 3.1: Rates and bands under the USC12 Table 3.2: Rates and bands under the Income Levy
Income per Annum Rate(%)
Up to €10,036 2
From €10,036 to €16,016 4
In excess of €16,017 7
Source: Revenue Commissioners 2011
3.2 In addition to these changes, the personal tax credit and the Pay As You Earn (PAYE) tax credit
were both reduced by approximately ten per cent. Under the new system, employees exhaust their
tax credits upon earning €16,500 per annum (equivalent to €317.31 per week), and thus begin
paying the standard 20 per cent rate of income tax on earnings above this amount. Individuals also
become liable for the higher rates of income tax at a lower threshold under Budget 2011 policy than
had been the case under Budget 2010 policy.
3.3 The entry point for the higher (marginal) rate of income tax was reduced by between eight and
ten per cent, with the precise level of the reduction depending on the individual’s familial
circumstances. For unmarried persons, the income threshold marking entry to the higher rate of
12
In the case of individuals aged 70 or over, and individuals who hold full medical cards, the four per cent rate applies to all income over €10,036. There is a surcharge of three per cent on individuals who have income from self-employment exceeding €100,000 in a year, regardless of age.
Income per Annum Rate(%)
Up to €75,036 2
From €75,037 to €174,980 4
In excess of €174,980 6
Winners and Losers? | November 2011
15
income tax was reduced by 9.9 per cent. As a result of this particular change, annual earnings
exceeding €32,800 are now subject to the 41 per cent rate of income tax.
3.4 The most significant alteration to the system of social contributions, from an employee’s
perspective, was the decision to abolish the Health Contribution Levy. This measure partially offset
some of the additional charges incurred as a result of the introduction of the USC and the reductions
in the tax bands and tax credits. However, because only those individuals earning over €26,000 per
annum were previously liable to pay the Health Levy, the decision to remove it only benefitted those
earning in excess of this amount. Employee Pay Related Social Insurance (PRSI) rates remained
unchanged in Budget 2011, though the annual earnings ceiling – above which no PRSI was paid – was
abolished. This change means that high-earning employees now continue paying PRSI on annual
earnings in excess of €75,036.
Winners and Losers? | November 2011
16
Figure 3.1: Effective rate of taxation for single employee paying Class A Social Insurance13
13
The graph does not consider the ability to reduce the effective tax rates through the standard tax relief system
Winners and Losers? | November 2011
17
Changes to social welfare payments and general expenditure
3.5 Budget 2011 provided for over €2.1 billion in gross current expenditure reductions. This included
cuts of €307 million to education and skills, and cuts of €765 million to health and children. There is
evidence that suggests women tend to be more reliant on public services than men (Smith, 2009).
Thus, these cuts are likely to have, on average, impacted disproportionately more on women. The
cumulative impact of these cuts to general public services is not quantified in this report.
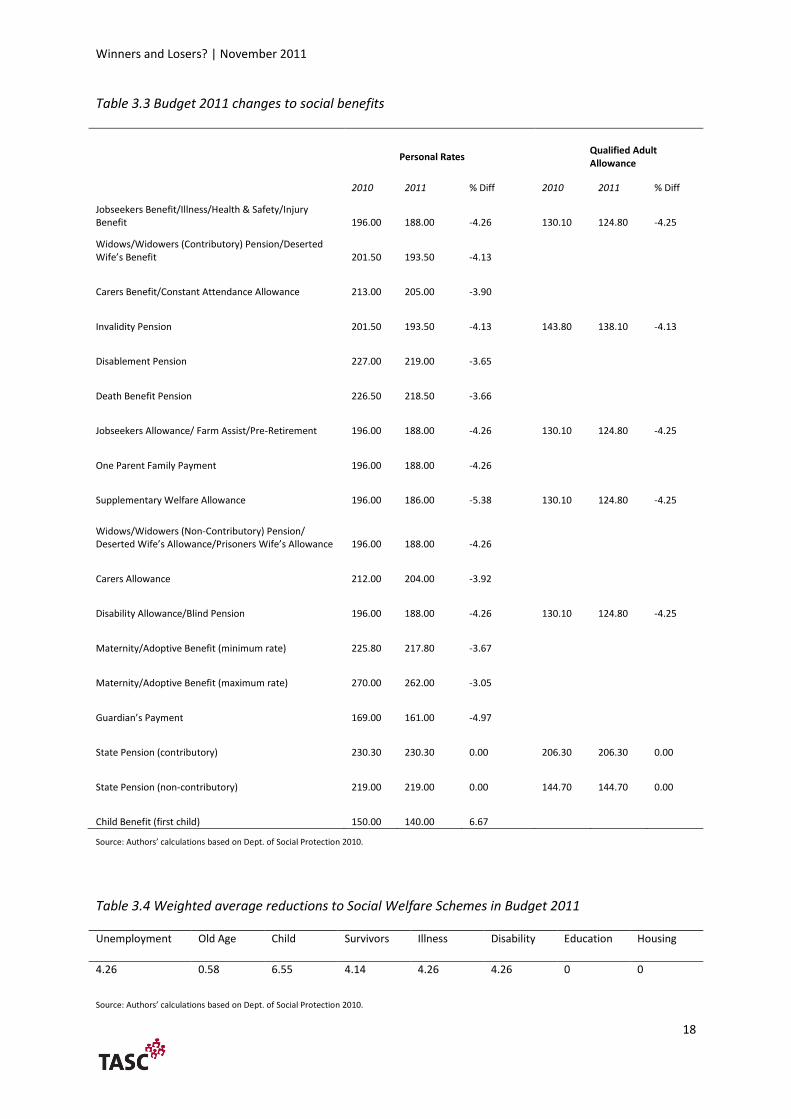
3.6 In addition to the cuts to general public services, there were also substantial reductions to many
of the social welfare rates in Budget 2011. Benefits were not treated even-handedly in this regard.
Certain categories of benefit remained untouched: for example, there was no reduction in the state
pension. However, other benefits (such as child benefit) were reduced by over five per cent. Child
benefit was reduced by €10 per child, with an additional €10 reduction for a third child and further
reductions for subsequent children thereafter. Changes to the rates for social benefits are shown in
Table 3.3 and Table 3.4.
Winners and Losers? | November 2011
18
Table 3.3 Budget 2011 changes to social benefits
Personal Rates
Qualified Adult Allowance
2010 2011 % Diff 2010 2011 % Diff
Jobseekers Benefit/Illness/Health & Safety/Injury Benefit 196.00 188.00 -4.26 130.10 124.80 -4.25
Widows/Widowers (Contributory) Pension/Deserted Wife’s Benefit 201.50 193.50 -4.13
Carers Benefit/Constant Attendance Allowance 213.00 205.00 -3.90
Invalidity Pension 201.50 193.50 -4.13 143.80 138.10 -4.13
Disablement Pension 227.00 219.00 -3.65
Death Benefit Pension 226.50 218.50 -3.66
Jobseekers Allowance/ Farm Assist/Pre-Retirement 196.00 188.00 -4.26 130.10 124.80 -4.25
One Parent Family Payment 196.00 188.00 -4.26
Supplementary Welfare Allowance 196.00 186.00 -5.38 130.10 124.80 -4.25
Widows/Widowers (Non-Contributory) Pension/ Deserted Wife’s Allowance/Prisoners Wife’s Allowance 196.00 188.00 -4.26
Carers Allowance 212.00 204.00 -3.92
Disability Allowance/Blind Pension 196.00 188.00 -4.26 130.10 124.80 -4.25
Maternity/Adoptive Benefit (minimum rate) 225.80 217.80 -3.67
Maternity/Adoptive Benefit (maximum rate) 270.00 262.00 -3.05
Guardian’s Payment 169.00 161.00 -4.97
State Pension (contributory) 230.30 230.30 0.00 206.30 206.30 0.00
State Pension (non-contributory) 219.00 219.00 0.00 144.70 144.70 0.00
Child Benefit (first child) 150.00 140.00 6.67
Source: Authors’ calculations based on Dept. of Social Protection 2010.
Table 3.4 Weighted average reductions to Social Welfare Schemes in Budget 2011
Unemployment Old Age Child Survivors Illness Disability Education Housing
4.26 0.58 6.55 4.14 4.26 4.26 0 0
Source: Authors’ calculations based on Dept. of Social Protection 2010.
Winners and Losers? | November 2011
19
Section 4 Gender Assessment of Budgetary Impacts
Survey of Income and Living Conditions
4.1 The 2009 Survey of Income and Living Conditions (SILC) dataset for Ireland was used to
undertake a gender impact assessment of certain budgetary measures. SILC is a household survey
covering a broad range of issues in relation to income and living conditions. It is the official source of
data on household and individual income and it also provides estimates for a number of key poverty
indicators, such as the ‘at risk of poverty’ rate, the ‘consistent poverty’ rate and rates of ‘enforced
deprivation’. The survey is also carried out in a number of other European states and this allows
comparable statistics across Europe.
4.2 In this study, we focused on the impacts of the Budget 2011 changes on current transfers paid
from employee income, and current transfers received by individuals from social welfare provisions.
We examined the percentage changes to total gross income and net disposable income (see
Appendix I for an explanation of how these were calculated).
4.3 For the purposes of the study, we restricted the analysis to certain components of net disposable
income. Of particular importance is the impact of the Budget 2011 changes on net employee
income. In this regard, we compared Budget 2010 policy governing taxes, levies and other charges
on employee income with the relevant Budget 2011 measures. Similarly, we compare Budget 2010
policy governing the system of employee social insurance contributions with Budget 2011. The
cumulative impacts of the changes in these areas in Budget 2011 impacted on the total current
transfers paid by individuals, and therefore on their net disposable income. The net impact of these
changes varies from individual to individual, depending on the individual’s gross income from
employment.
4.4 Social benefits are of immense significance for income distribution, and are critical sources of
income for a substantial portion of the population. We quantified the cumulative impact of Budget
2011 changes to the system of social benefits. The cumulative change in total social benefits
received by any given individual depends on the specific package of social benefits received by that
individual, and on the cumulative changes to that package of benefits.
4.5 However, it should be noted that there are a number of other income sources that were not
considered as part of this report, as to do so was beyond the scope of what data was easily available
as well as the available resources for the study. The most important of these sources is income from
Winners and Losers? | November 2011
20
self-employment. Other sources not considered include certain types of capital income such as
inheritance or gifts and certain social benefits such Family Income Supplement.
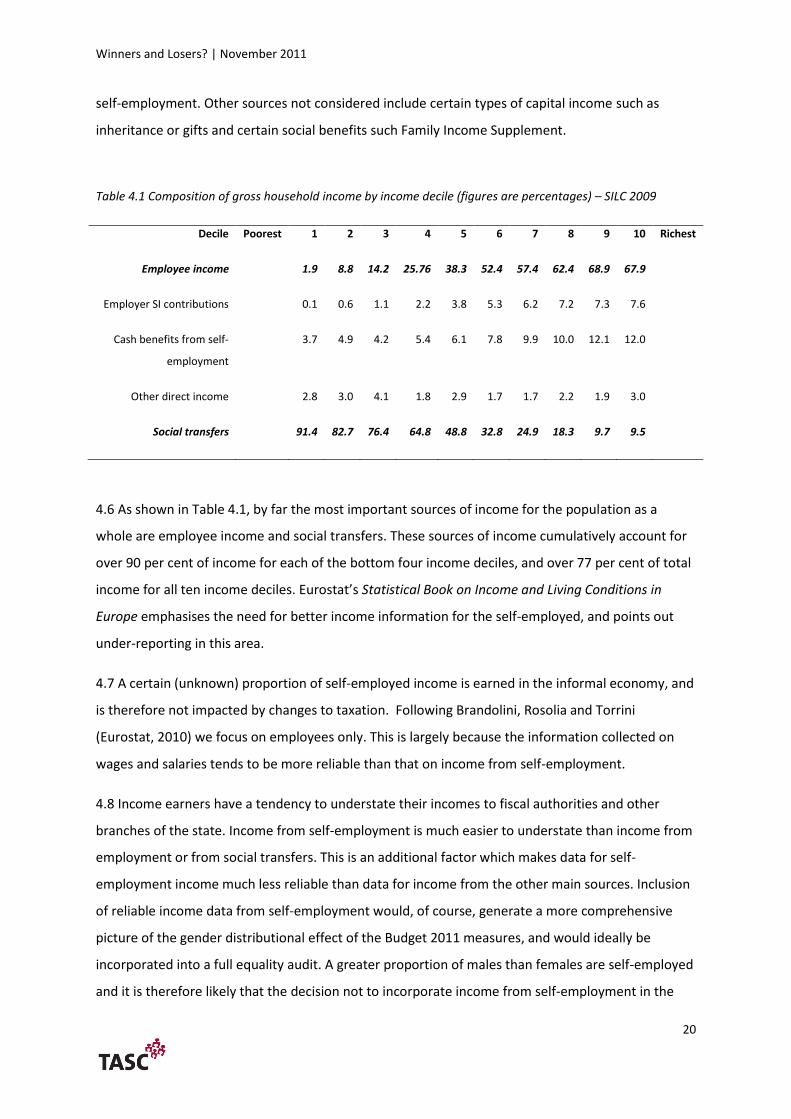
Table 4.1 Composition of gross household income by income decile (figures are percentages) – SILC 2009
Decile Poorest 1 2 3 4 5 6 7 8 9 10 Richest
Employee income 1.9 8.8 14.2 25.76 38.3 52.4 57.4 62.4 68.9 67.9
Employer SI contributions 0.1 0.6 1.1 2.2 3.8 5.3 6.2 7.2 7.3 7.6
Cash benefits from self-
employment
3.7 4.9 4.2 5.4 6.1 7.8 9.9 10.0 12.1 12.0
Other direct income 2.8 3.0 4.1 1.8 2.9 1.7 1.7 2.2 1.9 3.0
Social transfers 91.4 82.7 76.4 64.8 48.8 32.8 24.9 18.3 9.7 9.5
4.6 As shown in Table 4.1, by far the most important sources of income for the population as a
whole are employee income and social transfers. These sources of income cumulatively account for
over 90 per cent of income for each of the bottom four income deciles, and over 77 per cent of total
income for all ten income deciles. Eurostat’s Statistical Book on Income and Living Conditions in
Europe emphasises the need for better income information for the self-employed, and points out
under-reporting in this area.
4.7 A certain (unknown) proportion of self-employed income is earned in the informal economy, and
is therefore not impacted by changes to taxation. Following Brandolini, Rosolia and Torrini
(Eurostat, 2010) we focus on employees only. This is largely because the information collected on
wages and salaries tends to be more reliable than that on income from self-employment.
4.8 Income earners have a tendency to understate their incomes to fiscal authorities and other
branches of the state. Income from self-employment is much easier to understate than income from
employment or from social transfers. This is an additional factor which makes data for self-
employment income much less reliable than data for income from the other main sources. Inclusion
of reliable income data from self-employment would, of course, generate a more comprehensive
picture of the gender distributional effect of the Budget 2011 measures, and would ideally be
incorporated into a full equality audit. A greater proportion of males than females are self-employed
and it is therefore likely that the decision not to incorporate income from self-employment in the
Winners and Losers? | November 2011
21
analysis may understate the cumulative budgetary impact on males relative to the budgetary impact
on females.
The impacts of taxation and social welfare changes on different income groups
4.9 TASC examined the impact of the changes in Budget 2011 to ‘direct taxation’, deemed for the
purposes of this analysis to include changes to social security contributions. We also quantified the
impact of the changes to ‘public expenditures on direct social transfers’ announced in Budget 2011.
For the purpose of this report, we only considered primary social benefits when examining the effect
of the reduction in public spending on social transfers. Secondary social welfare schemes (e.g. Family
Income Supplement) are excluded from the analysis as the level of benefits received is highly
context-dependent. Every change to the structure of the tax and benefit system is likely to
disproportionately impact on one gender to some extent. This will occur because of systemically
differing characteristics such as income, time use and family structure between men and women.
4.10 For the purposes of this report we focus on the two main sources of income. We examine
changes to employee income caused by changes to the direct taxation system (including social
security contributions), and we examine changes to current transfers received caused by changes to
social welfare rates. The vast majority of the workforce, and in particular the female workforce,
comprises employees. Eighty three per cent of people at work, according to the SILC 2009 dataset,
work as employees. The proportion of the workforce made up of employees stood at 92 per cent for
females and at 75 per cent for males.
4.11 In contrast, carers make up 1.3 per cent of the workforce in the SILC dataset (1.7 per cent for
females and 0.9 per cent for males). Finally, 16.2 per cent of the total workforce in the SILC dataset
are self-employed (6.5 per cent for females and 24.6 per cent for males). Self-employed workers are
excluded from this analysis. Focusing on the segment of the work force in employment allows us to
consider the impact of the recent changes to the earning bands and standard tax reliefs to which all
employees are entitled. We only consider earned income that is subject to the Pay as You Earn
(PAYE) system of taxation in this example.
4.12 When calculating respondents’ taxation and social contribution liabilities, we assume that all
individuals are employees under the PAYE system and pay Class A rates of PRSI. The Irish taxation
system is characterized by a range of tax expenditures, sometimes known as tax reliefs or tax breaks,
and this report takes account of the impact of changes to standard tax reliefs.
Winners and Losers? | November 2011
22
4.13 Standard tax reliefs are defined by the OECD as reliefs which are unrelated to the actual
expenditures incurred by the taxpayer and are automatically available to all taxpayers who satisfy
the eligibility rules specified in the legislation. Standard tax reliefs are usually fixed amounts or fixed
percentages of income, and are typically the most important set of reliefs in the determination of
the income tax paid by workers (OECD, 2011). Examples of standard tax breaks include the personal
tax credit granted to all individuals of working age and the credit granted to home carers. Standard
tax reliefs can be considered part of the core taxation system.
4.14 On the other hand, non-standard tax reliefs are measures that are wholly determined by
reference to an expenditure incurred. These include reliefs on contributions to private pension
schemes and tax breaks on interest payments on qualifying loans. Higher income earners tend to
have greater ability to exploit the benefits of non-standard tax reliefs. While TASC’s analysis
incorporates changes to the standard tax reliefs, we have not taken account of changes to the non-
standard tax reliefs since the value of the relief depends on the choices and income level of the
individual. Those on higher incomes are likely to benefit more from such reliefs.
4.15 Using the SILC data, respondents were divided into ten income groups based on their gross
annual income. These ten income groups are called deciles. The first group incorporates individuals
with the lowest annual income, while the tenth and final group incorporates individuals with the
highest annual income. The impact of the tax and benefit changes is estimated by measuring the
impact of the budgetary measures on the average individual within each of the ten income deciles.
The overall gender impact of budgetary measures will differ for single individuals, for married
individuals, for individuals without dependent children and for individuals with children. In the
remainder of this section, we illustrate the impact of the Budget 2011 changes on particular
categories of individual – for example, on single and married individuals, on individuals with
children, and on individuals without children.
The categories
Single Individuals without Children
4.16 We first looked at the most basic category, namely ‘single individuals without children’.
Individuals categorised as single comprise 58.5 per cent of the analysed sample. Table 4.2 illustrates
the composition of the single respondents by gender.
Winners and Losers? | November 2011
23
Table 4.2: Composition of the single respondents by gender
No of cases Females as % of single cases Males as % of single cases
Single 3,435 52 48
Single with children
781 73 27
Total 4,216
4.17 Figure 4.1 shows the median gross income for single women (€ 25,841) and men (€28,739)
without children. For this group, women’s gross income is almost 90 per cent of men’s income.
Figure 3.1 in Section Three compared effective tax rates under Budget 2011 policy with effective tax
rates under Budget 2010 policy for single employees paying class A PRSI. As this is the basic income
tax system, it is useful to illustrate these changes. Figure 3.1 shows how low-income employees
were brought into the income tax net through a combination of the Universal Social Charge, the
reductions in tax credits and the widening of the tax bands.
4.18 While medium-high earners (earning over €50,000) also paid more tax, the cumulative Budget
2011 changes disproportionately impacted on low-income employees. It should be noted that the
benefits of non-standard tax reliefs were excluded from this analysis; these include reliefs on, for
example, pension contributions. The values of these reliefs are higher for higher income earners.
Figure 4.1 Distribution of gross annual income by gender for single individuals in a household without child dependents
4.19 The cumulative impacts of the budgetary measures on employee income and on social transfers
received are shown for each income decile in Figure 4.2. The first decile represents the lowest
Winners and Losers? | November 2011
24
income group while the tenth decile represents the highest income group within a category. The
graphs also show the gender breakdown of each income decile and the percentage loss of income
for women and men within each income decile from the measured budgetary change.
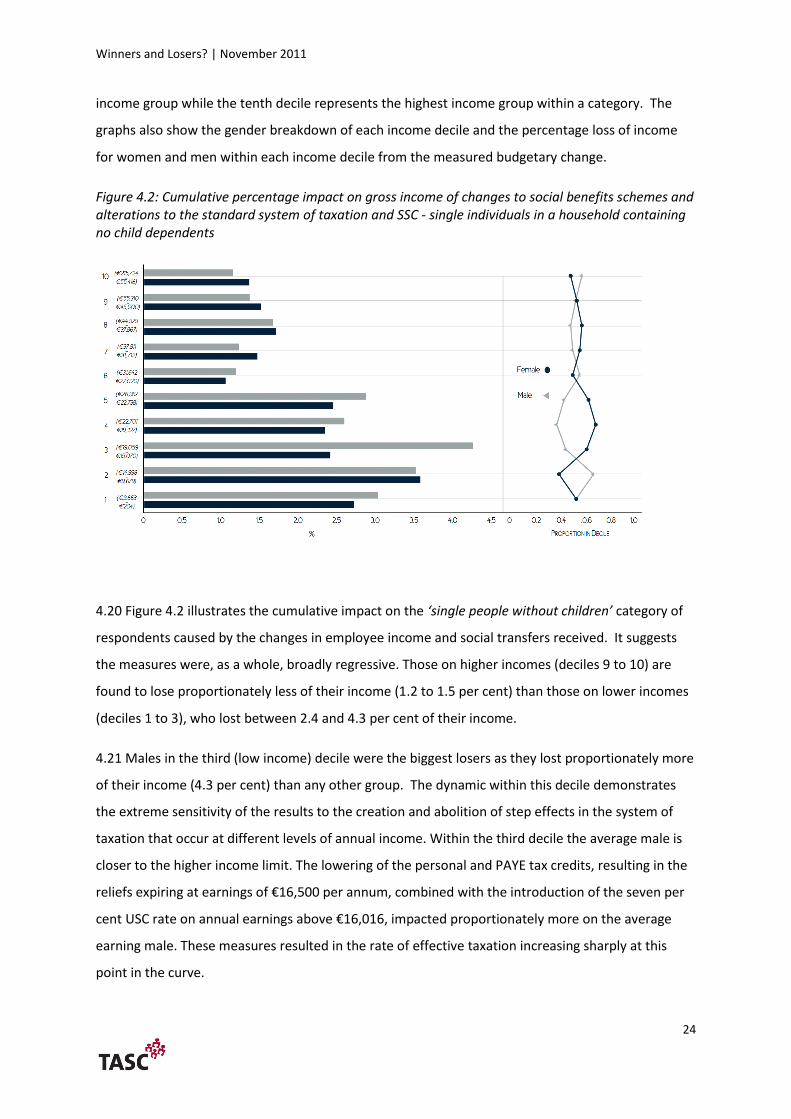
Figure 4.2: Cumulative percentage impact on gross income of changes to social benefits schemes and alterations to the standard system of taxation and SSC - single individuals in a household containing no child dependents
4.20 Figure 4.2 illustrates the cumulative impact on the ‘single people without children’ category of
respondents caused by the changes in employee income and social transfers received. It suggests
the measures were, as a whole, broadly regressive. Those on higher incomes (deciles 9 to 10) are
found to lose proportionately less of their income (1.2 to 1.5 per cent) than those on lower incomes
(deciles 1 to 3), who lost between 2.4 and 4.3 per cent of their income.
4.21 Males in the third (low income) decile were the biggest losers as they lost proportionately more
of their income (4.3 per cent) than any other group. The dynamic within this decile demonstrates
the extreme sensitivity of the results to the creation and abolition of step effects in the system of
taxation that occur at different levels of annual income. Within the third decile the average male is
closer to the higher income limit. The lowering of the personal and PAYE tax credits, resulting in the
reliefs expiring at earnings of €16,500 per annum, combined with the introduction of the seven per
cent USC rate on annual earnings above €16,016, impacted proportionately more on the average
earning male. These measures resulted in the rate of effective taxation increasing sharply at this
point in the curve.
Winners and Losers? | November 2011
25
4.22 Overall, those on the lowest incomes were hardest hit by the measured budgetary changes. The
people in these income groups were adversely affected by the cuts to social transfers and by
increased taxation, yet they did not benefit from the abolition of the health contribution levy
because their gross annual earnings were below the income threshold beyond which employees
previously paid additional social contributions through the health levy.
Single Individuals with Children
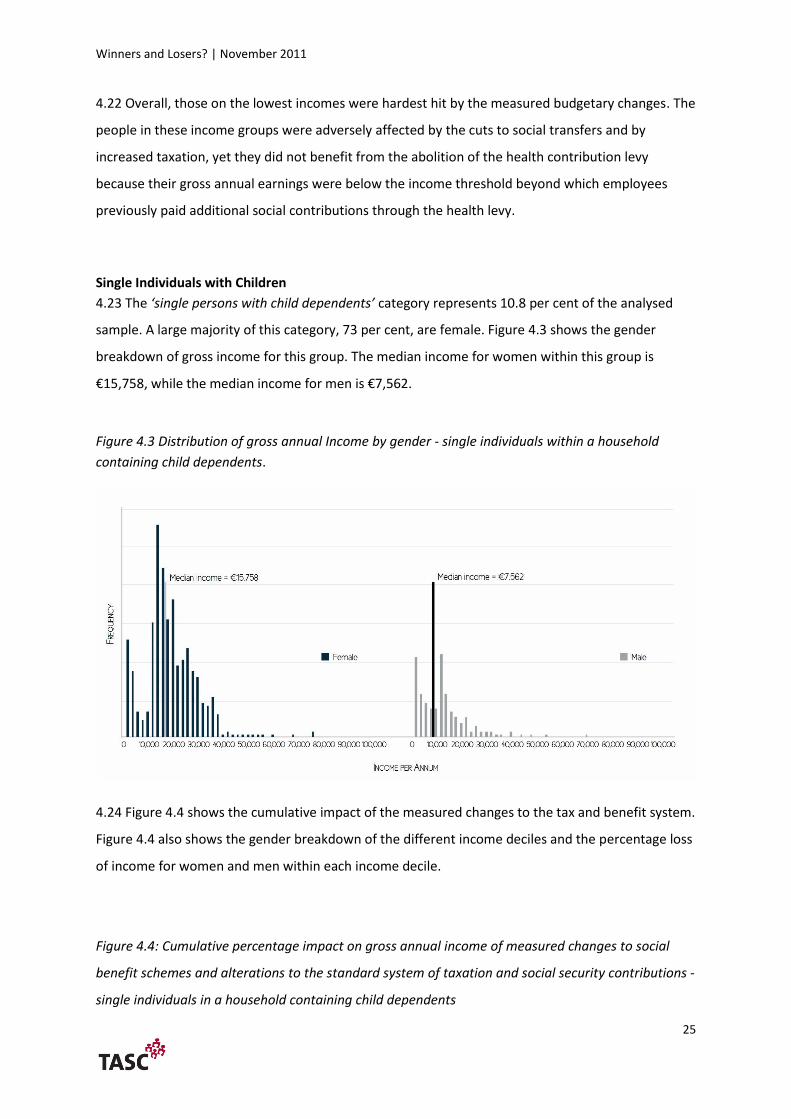
4.23 The ‘single persons with child dependents’ category represents 10.8 per cent of the analysed
sample. A large majority of this category, 73 per cent, are female. Figure 4.3 shows the gender
breakdown of gross income for this group. The median income for women within this group is
€15,758, while the median income for men is €7,562.
Figure 4.3 Distribution of gross annual Income by gender - single individuals within a household
containing child dependents.
4.24 Figure 4.4 shows the cumulative impact of the measured changes to the tax and benefit system.
Figure 4.4 also shows the gender breakdown of the different income deciles and the percentage loss
of income for women and men within each income decile.
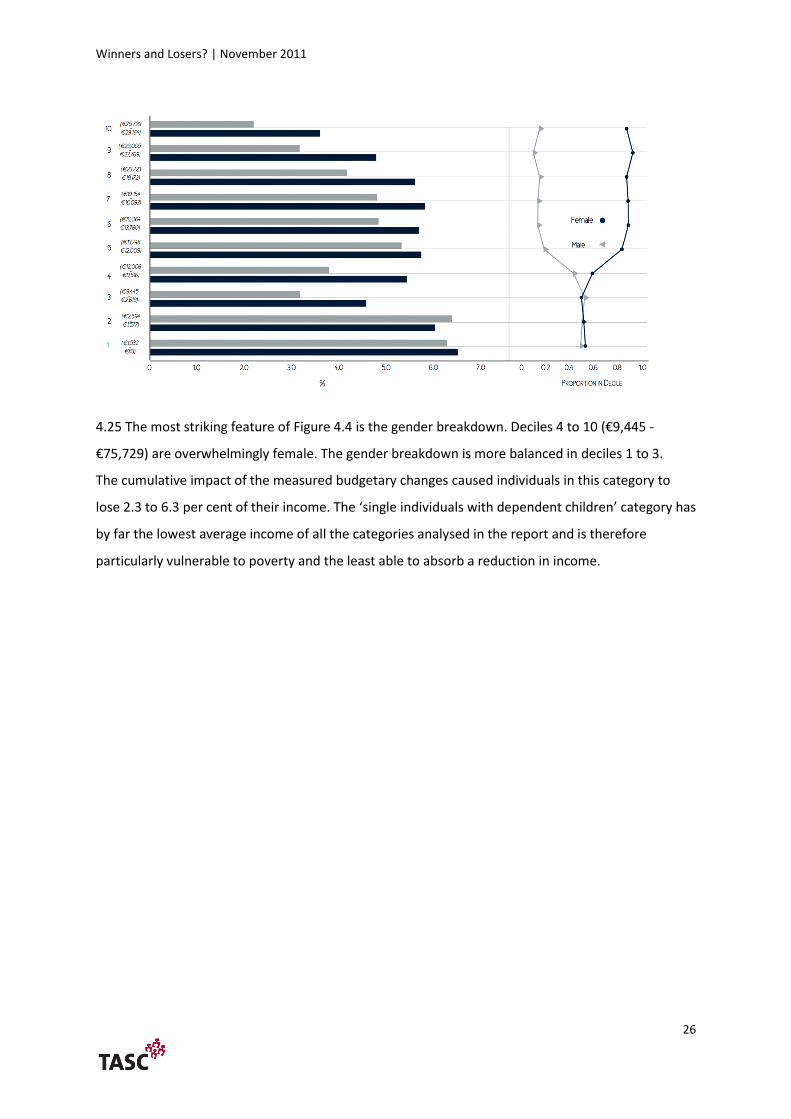
Figure 4.4: Cumulative percentage impact on gross annual income of measured changes to social
benefit schemes and alterations to the standard system of taxation and social security contributions -
single individuals in a household containing child dependents
Winners and Losers? | November 2011
26
4.25 The most striking feature of Figure 4.4 is the gender breakdown. Deciles 4 to 10 (€9,445 -
€75,729) are overwhelmingly female. The gender breakdown is more balanced in deciles 1 to 3.
The cumulative impact of the measured budgetary changes caused individuals in this category to
lose 2.3 to 6.3 per cent of their income. The ‘single individuals with dependent children’ category has
by far the lowest average income of all the categories analysed in the report and is therefore
particularly vulnerable to poverty and the least able to absorb a reduction in income.
Winners and Losers? | November 2011
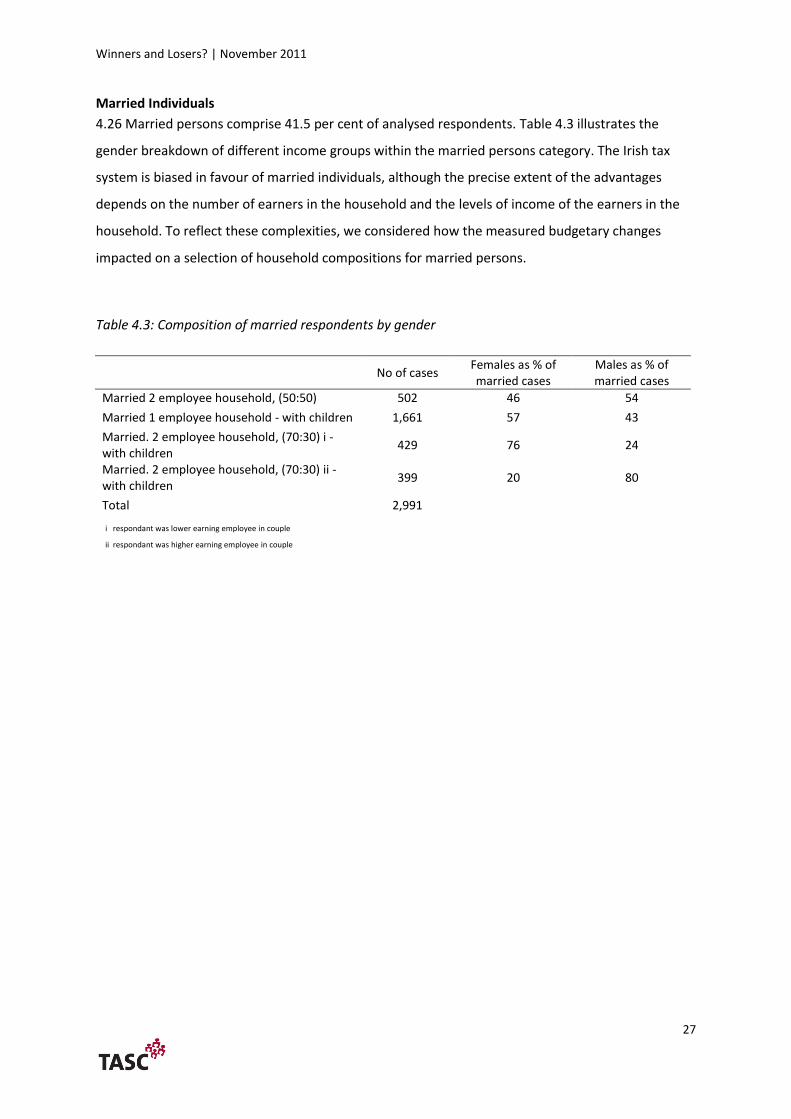
27
Married Individuals
4.26 Married persons comprise 41.5 per cent of analysed respondents. Table 4.3 illustrates the
gender breakdown of different income groups within the married persons category. The Irish tax
system is biased in favour of married individuals, although the precise extent of the advantages
depends on the number of earners in the household and the levels of income of the earners in the
household. To reflect these complexities, we considered how the measured budgetary changes
impacted on a selection of household compositions for married persons.
Table 4.3: Composition of married respondents by gender
No of cases
Females as % of married cases
Males as % of married cases
Married 2 employee household, (50:50) 502 46 54
Married 1 employee household - with children 1,661 57 43
Married. 2 employee household, (70:30) i - with children
429 76 24
Married. 2 employee household, (70:30) ii - with children
399 20 80
Total 2,991
i respondant was lower earning employee in couple
ii respondant was higher earning employee in couple
Winners and Losers? | November 2011
28
Married individuals – household compositions
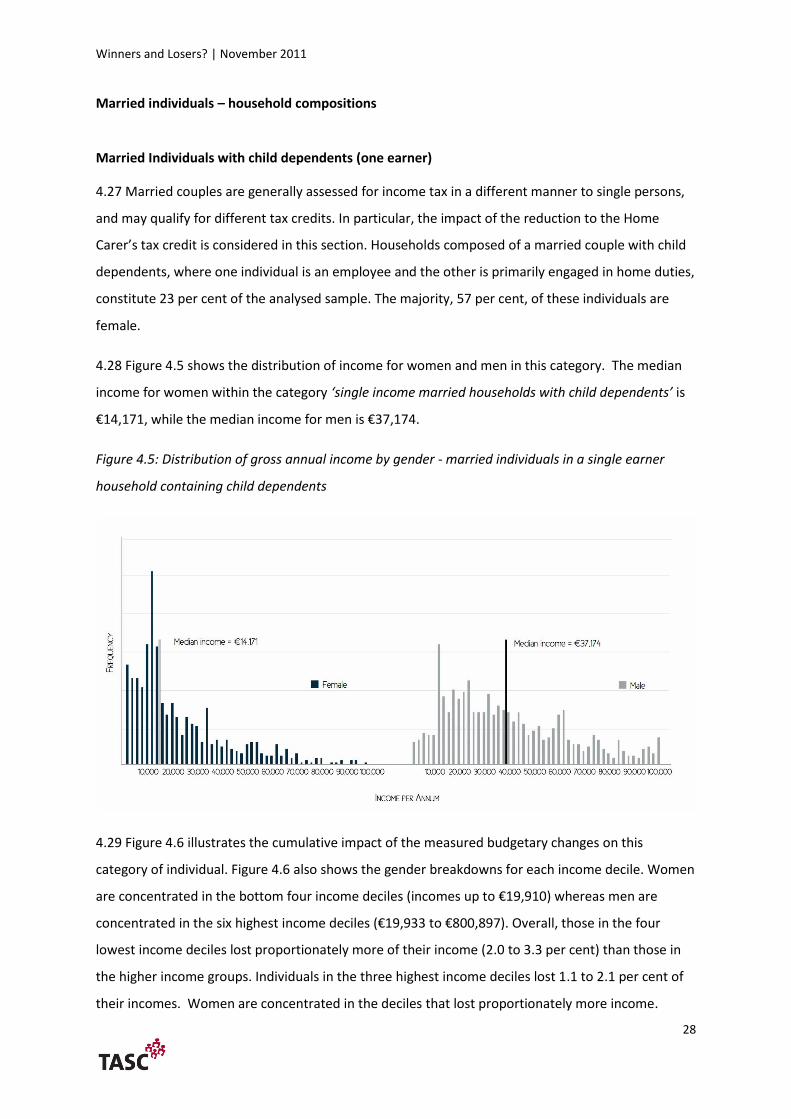
Married Individuals with child dependents (one earner)
4.27 Married couples are generally assessed for income tax in a different manner to single persons,
and may qualify for different tax credits. In particular, the impact of the reduction to the Home
Carer’s tax credit is considered in this section. Households composed of a married couple with child
dependents, where one individual is an employee and the other is primarily engaged in home duties,
constitute 23 per cent of the analysed sample. The majority, 57 per cent, of these individuals are
female.
4.28 Figure 4.5 shows the distribution of income for women and men in this category. The median
income for women within the category ‘single income married households with child dependents’ is
€14,171, while the median income for men is €37,174.
Figure 4.5: Distribution of gross annual income by gender - married individuals in a single earner
household containing child dependents
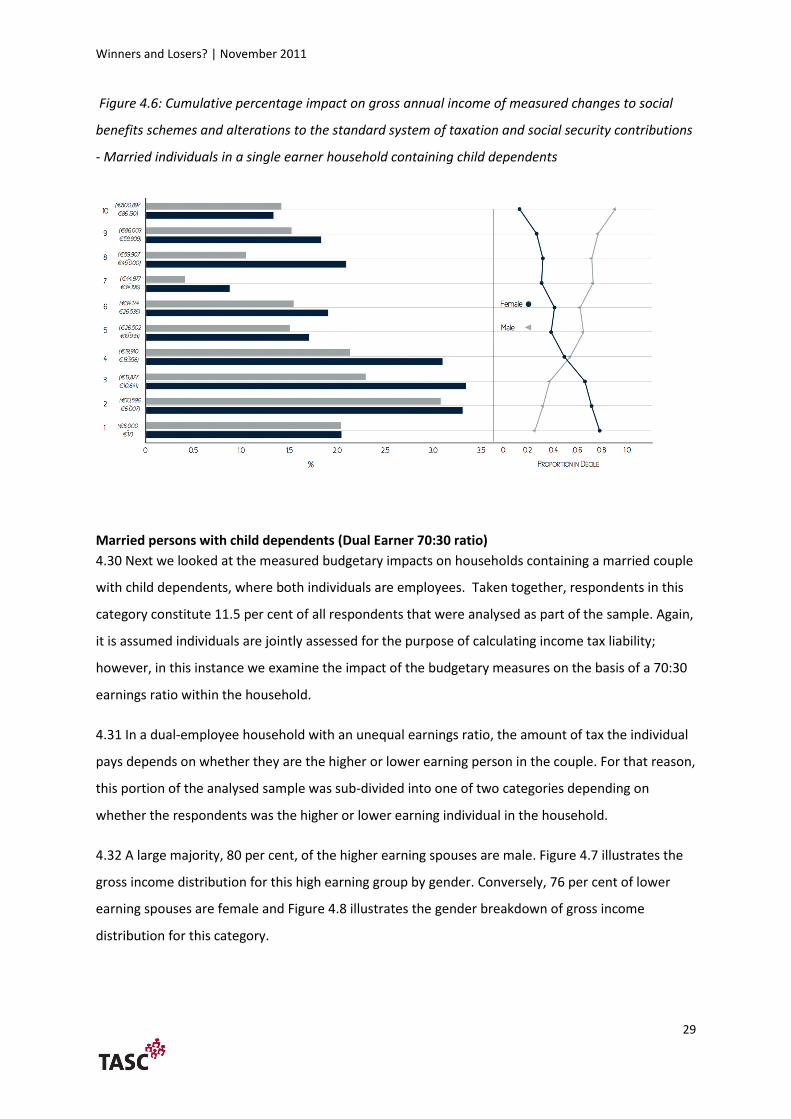
4.29 Figure 4.6 illustrates the cumulative impact of the measured budgetary changes on this
category of individual. Figure 4.6 also shows the gender breakdowns for each income decile. Women
are concentrated in the bottom four income deciles (incomes up to €19,910) whereas men are
concentrated in the six highest income deciles (€19,933 to €800,897). Overall, those in the four
lowest income deciles lost proportionately more of their income (2.0 to 3.3 per cent) than those in
the higher income groups. Individuals in the three highest income deciles lost 1.1 to 2.1 per cent of
their incomes. Women are concentrated in the deciles that lost proportionately more income.
Winners and Losers? | November 2011
29
Figure 4.6: Cumulative percentage impact on gross annual income of measured changes to social
benefits schemes and alterations to the standard system of taxation and social security contributions
- Married individuals in a single earner household containing child dependents
Married persons with child dependents (Dual Earner 70:30 ratio)
4.30 Next we looked at the measured budgetary impacts on households containing a married couple
with child dependents, where both individuals are employees. Taken together, respondents in this
category constitute 11.5 per cent of all respondents that were analysed as part of the sample. Again,
it is assumed individuals are jointly assessed for the purpose of calculating income tax liability;
however, in this instance we examine the impact of the budgetary measures on the basis of a 70:30
earnings ratio within the household.
4.31 In a dual-employee household with an unequal earnings ratio, the amount of tax the individual
pays depends on whether they are the higher or lower earning person in the couple. For that reason,
this portion of the analysed sample was sub-divided into one of two categories depending on
whether the respondents was the higher or lower earning individual in the household.
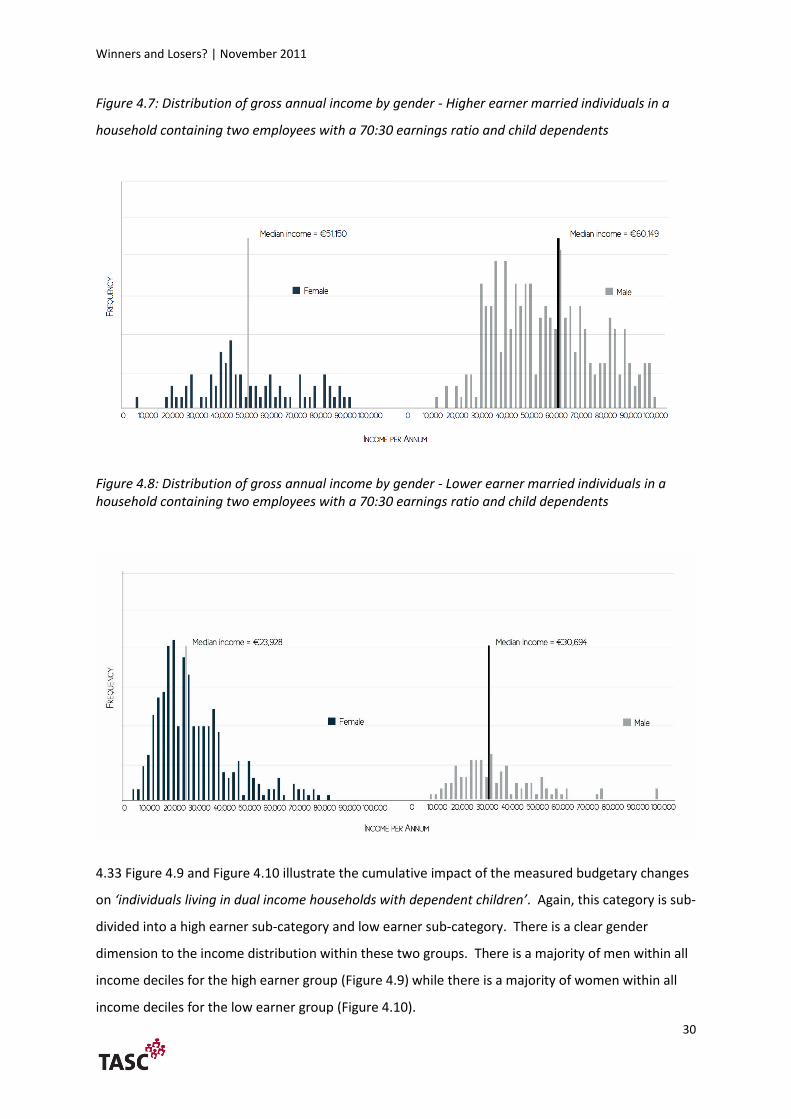
4.32 A large majority, 80 per cent, of the higher earning spouses are male. Figure 4.7 illustrates the
gross income distribution for this high earning group by gender. Conversely, 76 per cent of lower
earning spouses are female and Figure 4.8 illustrates the gender breakdown of gross income
distribution for this category.
Winners and Losers? | November 2011
30
Figure 4.7: Distribution of gross annual income by gender - Higher earner married individuals in a
household containing two employees with a 70:30 earnings ratio and child dependents
Figure 4.8: Distribution of gross annual income by gender - Lower earner married individuals in a household containing two employees with a 70:30 earnings ratio and child dependents
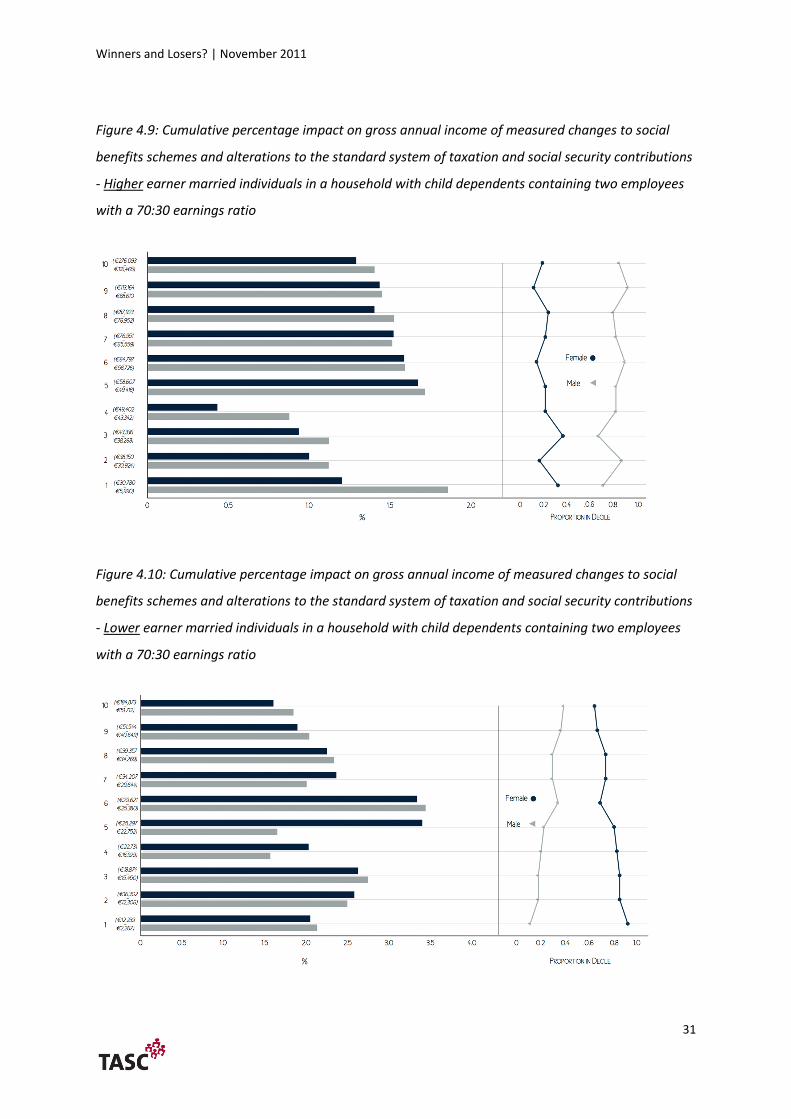
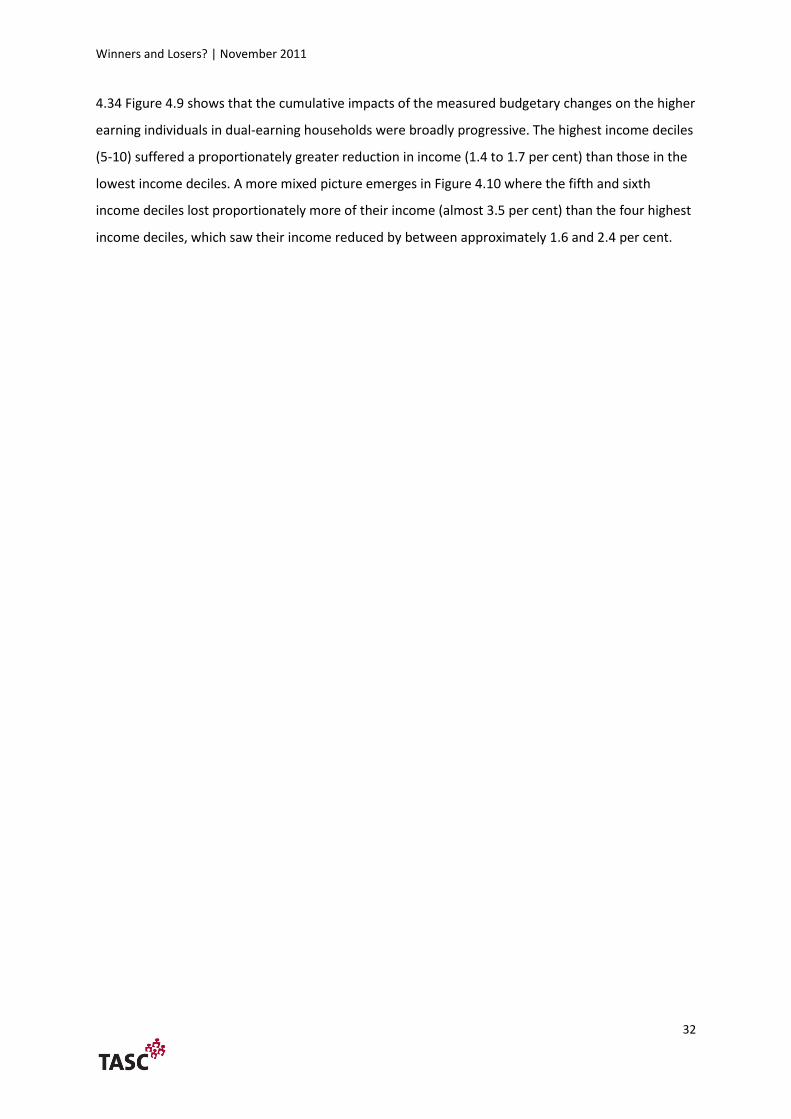
4.33 Figure 4.9 and Figure 4.10 illustrate the cumulative impact of the measured budgetary changes
on ‘individuals living in dual income households with dependent children’. Again, this category is sub-
divided into a high earner sub-category and low earner sub-category. There is a clear gender
dimension to the income distribution within these two groups. There is a majority of men within all
income deciles for the high earner group (Figure 4.9) while there is a majority of women within all
income deciles for the low earner group (Figure 4.10).
Winners and Losers? | November 2011
31
Figure 4.9: Cumulative percentage impact on gross annual income of measured changes to social
benefits schemes and alterations to the standard system of taxation and social security contributions
- Higher earner married individuals in a household with child dependents containing two employees
with a 70:30 earnings ratio
Figure 4.10: Cumulative percentage impact on gross annual income of measured changes to social
benefits schemes and alterations to the standard system of taxation and social security contributions
- Lower earner married individuals in a household with child dependents containing two employees
with a 70:30 earnings ratio
Winners and Losers? | November 2011
32
4.34 Figure 4.9 shows that the cumulative impacts of the measured budgetary changes on the higher
earning individuals in dual-earning households were broadly progressive. The highest income deciles
(5-10) suffered a proportionately greater reduction in income (1.4 to 1.7 per cent) than those in the
lowest income deciles. A more mixed picture emerges in Figure 4.10 where the fifth and sixth
income deciles lost proportionately more of their income (almost 3.5 per cent) than the four highest
income deciles, which saw their income reduced by between approximately 1.6 and 2.4 per cent.
Winners and Losers? | November 2011
33
Section 5 Sexual Orientation
5.1 This section examines the tax treatment of married heterosexual couples and same sex couples
following the introduction of the Civil Partnership Act. Much of the analysis in this section draws on
the recent work ‘Missing Pieces’ undertaken by Marriage Equality, which compared the rights and
responsibilities gained from civil partnership with the rights and responsibilities gained through civil
marriage. This research covers all aspects of the civil partnership legislation, and is also an excellent
example of how an equality audit can be used to highlight inequalities between different groups in
society.
5.2 The Civil Partnership Act came into effect in January 2011. Prior to this, same sex couple were
not legally recognised and did not have access to any of the legal protections that are automatically
accorded to heterosexual couples who enter into marriage. The absence of legal protections
compounded myriad inequalities that impacted on all aspects of the lives of same sex couples. The
introduction of the Civil Partnership Act addressed many of these inequalities, but differences still
remain.
5.3 Marriage Equality’s audit found 169 differences in treatment covering rights and protections
across a range of legislation including: family law, immigration, housing, court procedure,
inheritance, taxation, freedom of information and miscellaneous provisions which apply to married
heterosexual couples, but not to same-sex couples who are registered civil partners. TASC’s analysis
focuses on the tax treatment of these two groups. Twelve provisions were identified where full
equality has not been achieved, specifically in relation to the breakdown of civil partnerships,
maintenance payments for children and the definition of relatives.
5.4 The Finance Act (No. 3) 2011 provided for changes to existing tax legislation following the
introduction of the Civil Partnership Act. Overall, the changes brought into effect through the
Finance Act (No.3) were progressive and resulted in greater economic equality between married
heterosexual couples and same sex couples who are registered civil partners. Significantly, the
Finance Act goes beyond the parameters of the civil partnership legislation by providing the same
tax treatment for a child whose parents are in a civil partnership as for a child of a married
heterosexual couple. This is in the context of a Civil Partnership Act that does not extend any of the
rights or obligations to civil partners and their children, which are automatically accorded to married
heterosexual couples. In this situation, the tax policy appears to be more progressive than the social
Winners and Losers? | November 2011
34
policy. However, an exception exists in relation to maintenance payments; this is outlined in more
detail below.
5.5 The Irish tax system provides for the favourable tax treatment of maintenance payments arising
from the break-up of a marriage whereby legally enforced maintenance payments are tax-
deductible. While this favourable tax treatment has been extended to the dissolution of a civil
partnership, a number of differences have been identified that place limitations on civil partners.
The two main differences relate to how quickly the tax treatment of maintenance payments can be
accessed, and the legislative definition of separation.
5.6 Firstly, in order to qualify for the favourable tax treatment of maintenance payments, civil
partners must have a Court ordered separation or divorce to qualify. For married heterosexual
couples, a deed of separation is required to qualify for the favourable tax treatment of maintenance
payments, which can be accessed much more quickly. Secondly, in relation to the legislative
definition of separation, the definition for spouses includes the situation where separated spouses
live under the same roof. This aspect of the definition has not been extended to separating civil
partners. In practice, this means civil partners would have the additional cost of having to live apart
in order to satisfy the statutory conditions for dissolution or annulment, and in order to access the
tax treatment associated with dissolution.
5.7 The legislation clearly sets out how maintenance payments are to be treated (for taxation
purposes) if those payments relate to the maintenance of children of the marriage. However, there
is no equivalent provision in the case of the children of civil partners, and therefore it is not clear
how maintenance payments for children will be treated for tax purposes.
5.8 The final differences identified in the tax treatment of civil partners and married heterosexual
couples relate to how relatives are defined. In general, the terms ‘relative’ and ‘family’ are based on
blood or marriage unless the use of these terms is supplemented or specifically defined in particular
circumstances. Therefore, the relatives and families of civil partners should be expressly referenced
in the legislation. The Marriage Equality audit identified five instances where the definition was
inadequate or absent in relation to the Tax Consolidation Act (1997) and the Stamp Consolidation
Act (1999).
5.9 The introduction of civil partnership addressed most of the inequalities relating to taxation
experienced by same sex couples vis-à-vis married heterosexual couples. However, differences still
remain and these differences mean that civil partners and their families still have fewer rights and
protections than their married counterparts. Given that taxation policy operates within wider legal

Winners and Losers? | November 2011
35
parameters, the limitations of the civil partnership legislation prevent the achievement of full
equality between married heterosexual couples and civil partners. The realisation of full equality
between these groups can only be achieved through access to civil marriage.
Winners and Losers? | November 2011
36
Section 6 Conclusions and Policy Implications
Strategic policymaking
6.1 When framing the Budget, it would be useful to start by producing an ex ante statement of short
and medium term budgetary goals and principles. One likely benefit of such an approach would be
to reduce the scope for special pleading and manipulation by interest groups. Examples of targets
would be (short-term) stimulating aggregate demand to help maintain existing jobs, or (medium-
term) the provision of a minimum basic guaranteed income.
6.2 Once a target has been identified, the next challenge is to identify policies that can be expected
to facilitate progress towards that goal. To do this, it is first necessary to project the future impact of
existing and announced policies. This sets the baseline against which the range of possible new
policies can be judged.
6.3 TASC undertook an analysis of two groups under the nine grounds in the equality legislation,
namely gender and sexual orientation. TASC’s analysis included:
A gender-impact assessment of certain Budget 2011 measures to quantify the cumulative
effects of the main changes to taxation and social benefits provisions on the income of
women and men.
A comparative analysis of the tax treatment of same sex couples and that of married
heterosexual couples following the introduction of the Civil Partnership Act.
Gender
6.4 TASC’s gender impact assessment examined the impact of the main Budget 2011 measures on
women and men. More specifically, TASC examined the impact of the changes to direct taxation of
employee income and changes to public expenditures on social transfers.
Sexual Orientation
6.5 The introduction of the Civil Partnership Act addressed many of the inequalities that exist
between same sex couple who are registered civil partners and married heterosexual couples.
However differences still remain. Finance Act (No. 3) provided the changes for the tax treatment of
same sex couples following the introduction of the Civil Partnership Act and the provisions within
Winners and Losers? | November 2011
37
the Act were progressive and resulted in much greater economic equality between married
heterosexual couples and same sex couples in a civil partnership.
6.6 Given that taxation policy operates within wider legal parameters, the limitations of the civil
partnership legislation prevent the achievement of full equality between married couples and civil
partners. The realisation of full equality between these groups can only be achieved through access
to civil marriage.
Identifying the winners and losers
6.7 The cumulative impacts of the changes to the system of direct taxation of employee income
(which includes the changes to social security contributions), and the changes to the system of
monetary transfers to individuals, are shown in Figure 6.1 for each of the analysed categories. The
category most negatively affected by the measured Budget 2011 changes is the ‘single with children’
group. This category has by far the lowest average income of all the categories studied and has a
very high ratio of females (73 per cent) to males (27 per cent).
6.8 Individuals within the ‘single with children’ category saw their gross annual incomes fall by an
average of five per cent as a result of the measured changes. The least adversely affected category
was the ‘married two incomes 70:30 – higher earner’ category i.e. the category representing the
higher earner within two earner households. The gross annual income of this category was reduced
by an average of 1.3 per cent. This was the category with the highest ratio of males (80 per cent) to
females (20 per cent).
6.9 The disproportionate impact on the lowest income group, i.e. the single with children group, is
partially explained by the disproportionate cuts to child benefit and the one parent family credit.
These transfers are particularly important for individuals within this group, and child benefit is
important for women more generally. Further cuts to these transfers will exacerbate the level of
income inequality between genders and put growing numbers of adults and children in this
category at risk of poverty.
6.10 It is also important to recognise that this analysis was undertaken in relation to a single budget.
A more comprehensive analysis would examine the effects of budgetary measures on different
groups since at least the start of the crisis in 2008 and the adoption of the current economic
strategy. In addition, the inequality of the baseline distribution of income and wealth would also
have to be examined.
Winners and Losers? | November 2011
38
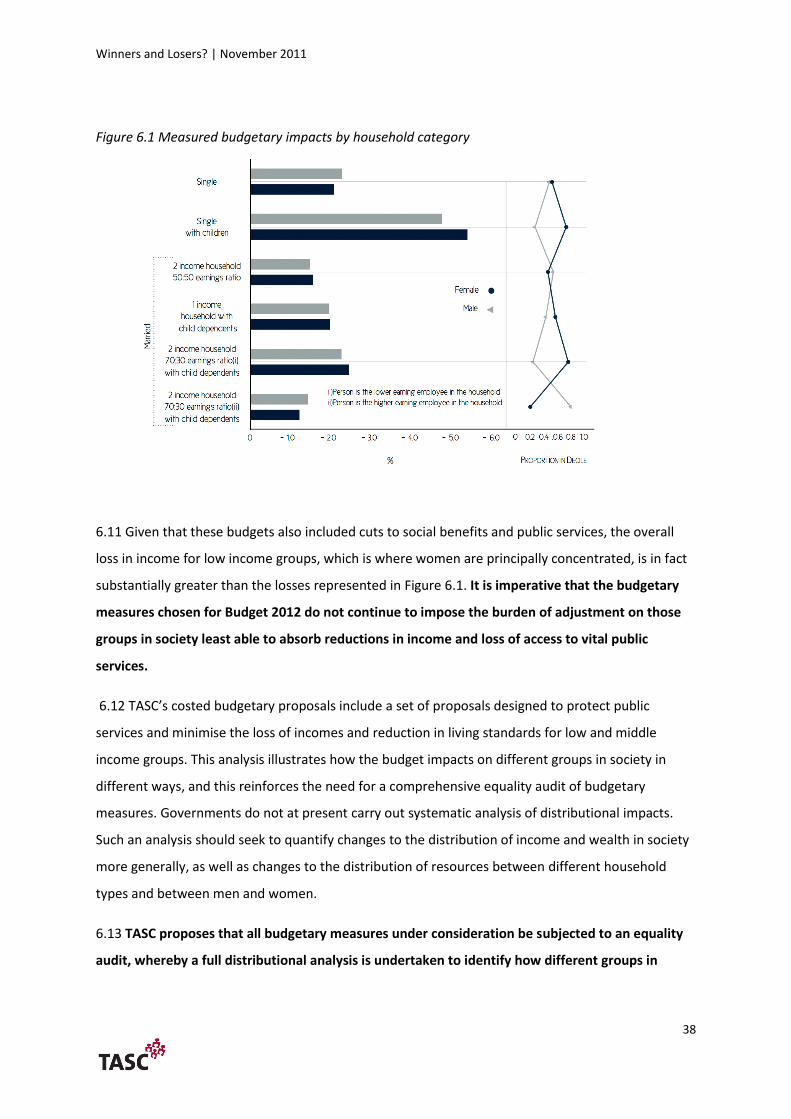
Figure 6.1 Measured budgetary impacts by household category
6.11 Given that these budgets also included cuts to social benefits and public services, the overall
loss in income for low income groups, which is where women are principally concentrated, is in fact
substantially greater than the losses represented in Figure 6.1. It is imperative that the budgetary
measures chosen for Budget 2012 do not continue to impose the burden of adjustment on those
groups in society least able to absorb reductions in income and loss of access to vital public
services.
6.12 TASC’s costed budgetary proposals include a set of proposals designed to protect public
services and minimise the loss of incomes and reduction in living standards for low and middle
income groups. This analysis illustrates how the budget impacts on different groups in society in
different ways, and this reinforces the need for a comprehensive equality audit of budgetary
measures. Governments do not at present carry out systematic analysis of distributional impacts.
Such an analysis should seek to quantify changes to the distribution of income and wealth in society
more generally, as well as changes to the distribution of resources between different household
types and between men and women.
6.13 TASC proposes that all budgetary measures under consideration be subjected to an equality
audit, whereby a full distributional analysis is undertaken to identify how different groups in
Winners and Losers? | November 2011
39
society are likely to be affected. This would inform a process of equality-proofing and gender-
proofing the budget.
6.14 As well as the equality arguments, there are also strong economic arguments for protecting the
incomes of those already on low incomes, particularly in relation to maintaining and boosting
aggregate demand in the domestic economy. One way to increase demand is to increase the
spending power of people who are on the lowest incomes. People on welfare or in low-paid jobs
have high marginal propensities to consume because they must spend all or practically all of their
income to meet their essential needs. By changing the tax and benefit system to increase the
incomes of the low paid and those on welfare we can help protect existing jobs in the local
economy and encourage job creation.
6.15 TASC’s analysis shows the need for an annual comprehensive equality audit of proposed
budgetary measures as well as the need for an equality audit of implemented budgetary
measures.
Data issues and further research
6.16 There are a number of outstanding data issues that still need to be resolved. For example, there
is a need for better information on the relationships between household members. A household
grid or relationship matrix would be particularly helpful in this respect. There is also a need to
refine guidelines on self-employment income, improve the information provided on self-
employment income, and improve of the identification of self-employment activities within
employment activities.
Winners and Losers? | November 2011
40
References
Brandolini, Rosolia and Torrini “The Distribution of Employee’s Labour Earnings in the European Union”. Chapter 12 in Eurostat Income and Living Conditions in Europe, 2010.
Browne, J. and Levell, P, “The Distributional Effect of Tax and Benefit Reforms to be Introduced Between June 2010 and April 2014: A Revised Assessment.” IFS Briefing Note, Institute of Fiscal Studies, 2010. PDF e-booklet.
Browne, J, “Can we Assess the Distributional Impact of Cuts to Public Spending on Public Services?” IFS Observations, Institute of Fiscal Studies. Accessed July 8, 2011. http://www.ifs.org.uk/publications/5611%5D.
Browne, J, “The Impact of Tax and Benefit Reforms by Sex: Some Simple Analysis.” IFS Briefing Note, Institute of Fiscal Studies, 2011. PDF e-booklet.
Budlender, D., Elson, D., Hewitt, G., and Mukhopadhyay, Gender Budget Make Cents. London: Commonwealth Secretariat, 2002.
Central Statistics Office, Census 2006: Household Composition , Family Units and Fertility, Accessed 28 September 2011. http://census.cso.ie/census/ReportFolders/ReportFolders.aspx
Central Statistics Office, National Employment Survey 2008 and 2009, Dublin: Stationary Office. 2011. PDF e-booklet.
Central Statistics Office, Women and Men in Ireland 2009, Dublin: Stationary Office. 2010. PDF e-booklet.
Central Statistics Office, Women and Men in Ireland 2010, Dublin: Stationary Office. 2011. PDF e-booklet.
Central Statistics Office, Quarterly National Household Survey: Quarter 2 2011, Dublin: Stationary Office, PDF e-booklet.
Civil Partnership and Certain Rights and Cohabitants Act 2010, Act No. 24 of 2010.
Cowell, F, A. Measuring Inequality. 3rd ed. Oxford: Oxford University Press, 2011.
Department of Finance. Summary of 2010 Budget Measures. Dublin: Stationary Office, 2010. PDF e-booklet
Department of Finance. Summary of 2011 Budget Measures Policy Changes. Dublin: Stationary Office, 2011. PDF e-booklet.
Department of Finance.EU/IMF Programme of Financial Support for Ireland. Accessed 18 October, 2011. http://www.finance.gov.ie/documents/publications/other/2011/EU%20imf/EUimfJul2011.pdf
Department of Social Protection, Statistical Information on Social Welfare Services 2010. Dublin Stationary Office, PDF e-booklet.
Department of Social Protection. Jobseekers Benefit and Allowance – Frequently Asked Questions. Accessed August 30, 2011. http://www.welfare.ie/EN/Pages/jajbfaq.aspx#maincontent
Winners and Losers? | November 2011
41
Department of Social Protection. PRSI Contribution Rates and Users Guide 2010. Dublin: Stationary Office, 2010. PDF e-booklet.
Department of Social Protection. PRSI Contribution Rates and Users Guide 2011. Dublin: Stationary Office, 2011. PDF e-booklet.
ESRI. Quarterly Economic commentary, Summer 2011.
Eurostat (2010) Living Conditions in Europe and the Europe 2020 Agenda.
Fergus R, Civil Partnership: Your Questions Answered (Dublin: GLEN, 2009). PDF e-book.
Fredriksen, D, “Projections of Population, Education, Labour Supply and Public Pension Benefits. Analyses with the Dynamic Microsimulation Model MOSART,” Oslo, Norway: Statistics Norway, 1998
Gay and Lesbian Equality Network. “Submission to the United Nations Periodic Review: Ireland.” Paper to be presented at the Twelfth Session of the Working Group on the Universal Periodic Review, October 6, 2011. PDF e-book.
Himmelweit, S, “Tools for Budget Impact Analysis,” in Gender Budget Initiatives: Strategies, Concepts and Experiences (New York:United Nations Development Fund for Women,2001, 62-70. PDF e-book.
Iacovou, M and Skew, A (2010) “Household Structure in the EU”. Chapter 4 in Eurostat (2010) Income and Living Conditions in Europe.
Marriage Equality. Missing Pieces (2011) A comparison of the rights and responsibilities gained from civil partnership compared to the rights and responsibilities gained through civil marriage in Ireland.
Marriage Equality. Mythbusters. Accessed August 16, 2011. http://www.marriagequality.ie/getinformed/mythbusters.html
Noise. “Why Civil Marriage.” Accessed August 16, 2011. http://lgbtnoise.ie/?page_id=235
Organisation for Economic Co-operation and Development, Taxing Wages 2009-2010, OECD Publishing. http://dx.doi.org/10.1787/tax_wages-2010-en
Pfeifer, A and Schwendener, P, “Sex-disaggregated expenditure incidence analysis for the Canton of Basel-Stadt” in Gender-responsive budget analysis in the Canton of Basel-Stadt, Switzerland, Statistical Office of the Canton of Basel-Stadt, 2008. PDF e-booklet.
Revenue Commissioners. “One Parent Family Tax Credit.” Accessed June 21, 2011. http://www.revenue.ie/en/tax/it/credits/one-parent-family.html
Revenue Commissioners. “Tax Credits, Reliefs and Rates for the Tax Years 2010 and 2011.” Accessed June 21, 2011. http://www.revenue.ie/en/tax/it/leaflets/it1.html#
Revenue Commissioners. “What to do about Tax when you Separate.” Accessed June 24, 2011. http://www.revenue.ie/en/tax/it/leaflets/it3.html
Revenue Commissioners. Income Levy: Frequently Asked Questions. Dublin: Stationary Office, 2011. PDF e-booklet.
Revenue Commissioners. Taxation and Civil Partnership: Frequently Asked Questions. Dublin: Stationary Office, 2011. PDF e-booklet.
Winners and Losers? | November 2011
42
Revenue Commissioners. Universal Social Charge: Frequently Asked Questions. Dublin: Stationary Office, 2011. PDF e-booklet.
Smith, M (2009) Analysis Note: ‘Gender Equality and the Recession’, prepared for European Commission’s Network of Experts on Employment and Gender Equality Issues.
Van Kerm, P “EU SILC and welfare measurements” in Comparative EU statistics on Income and Living Conditions: Issues and Challenges: Proceedings from the EU-SILC conference, 83 – 95. Luxembourg: Office for Official Publications of the European Communities, 2007.
Verma, V “Issues in data quality and comparability in EU-SILC” in Comparative EU statistics on Income and Living Conditions: Issues and Challenges: Proceedings from the EU-SILC conference, 285 – 310. Luxembourg: Office for Official Publications of the European Communities, 2007.
Williamson, P, “Microsimulation: An Idea whose Time has come?” paper presented at the 39th
European Congress of the European Regional Science Association in Dublin, Ireland, on August 23-27, 1999.
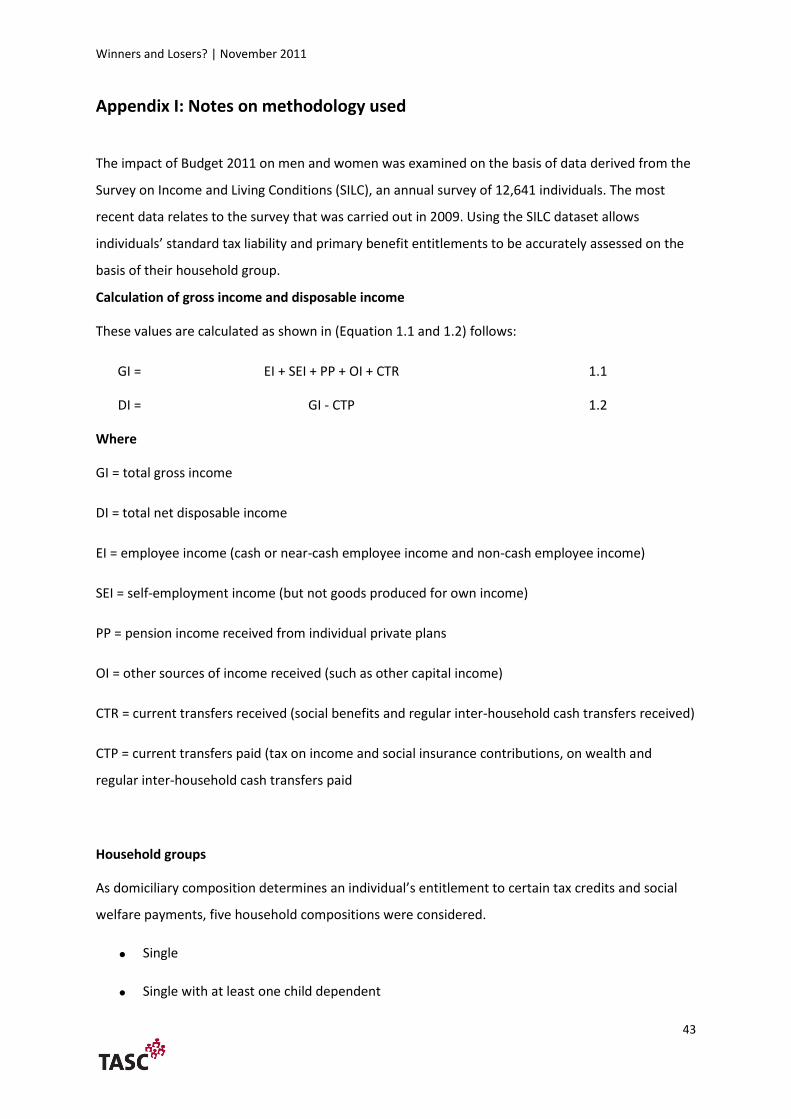
Winners and Losers? | November 2011
43
Appendix I: Notes on methodology used
The impact of Budget 2011 on men and women was examined on the basis of data derived from the
Survey on Income and Living Conditions (SILC), an annual survey of 12,641 individuals. The most
recent data relates to the survey that was carried out in 2009. Using the SILC dataset allows
individuals’ standard tax liability and primary benefit entitlements to be accurately assessed on the
basis of their household group.
Calculation of gross income and disposable income
These values are calculated as shown in (Equation 1.1 and 1.2) follows:
GI = EI + SEI + PP + OI + CTR 1.1
DI = GI - CTP 1.2
Where
GI = total gross income
DI = total net disposable income
EI = employee income (cash or near-cash employee income and non-cash employee income)
SEI = self-employment income (but not goods produced for own income)
PP = pension income received from individual private plans
OI = other sources of income received (such as other capital income)
CTR = current transfers received (social benefits and regular inter-household cash transfers received)
CTP = current transfers paid (tax on income and social insurance contributions, on wealth and
regular inter-household cash transfers paid
Household groups
As domiciliary composition determines an individual’s entitlement to certain tax credits and social
welfare payments, five household compositions were considered.
Single
Single with at least one child dependent
Winners and Losers? | November 2011
44
Married, no child dependent, both individuals working as an employee
Married, with at least one child dependent, one individual working as an employee
Married, with at least one child dependent, both individuals working as an employee,
equal earnings ratio
Married, with at least one child dependent, both individuals work as an employee,
unequal earnings ratio.
Individuals under the age of eighteen were excluded from the analysis on the basis that persons in
this category are primarily engaged in full-time education, and are supported by a parent or
guardian. Of the remaining respondents, persons who reported being separated or divorced were
treated as being single when computing their tax and social contributions liability.
The impact of Budget 2011 on single individuals was the base case in this study. Unmarried
individuals with no child dependents comprised 48 per cent of the total number of respondents, and
were the largest of the five household groups considered. Examining this segment of the sample
ensured that the impact of the changes to the earning bands and standard tax reliefs that all
employees are entitled to was incorporated in the analysis. Single persons who have children were a
significant component, ten per cent, of the total number of cases. This group comprised all single
parents and unmarried cohabiting couples with children. As civil partnership had not yet been
enacted when the survey was conducted, all same-sex couples were categorised as single. This
reflects how the Revenue Commissioners and the Department of Social Protection treated these
couples until the recent legislative changes. As a result of their familial circumstances, individuals in
this category utilize an additional set of welfare entitlements and are subject to different tax
treatment than single respondents without child dependents. For this reason, the impact of the
budgetary changes to the standard system of taxation and primary social transfers on unmarried
persons with children warranted separate analysis.
Approximately 37 per cent of sample respondents registered as being married. The tax treatment of
these individuals is different to that of single persons, as married couples often choose to be
accessed as a single taxable entity by the Revenue Commissioners. The analysis in this paper
assumes that all married individuals are jointly assessed for income tax purposes. This is the default
form of assessment applied by the Revenue Commissioners to newly married couples. In addition, it
tends to be the most favourable, and most popular, option for households where both spouses work
as an employee. When determining income tax liability, persons opting for joint assessment are
Winners and Losers? | November 2011
45
subject to different income thresholds than those applying to unmarried persons. This means that
the amount of tax that they are liable for will differ to that paid by an unmarried individual earning
the same income and paying tax under the PAYE system. In a dual employee household that is jointly
accessed, the amount of tax the individual pays will change depending on whether they are the
higher or lower earning person in the couple.
In this paper, the impact of the taxation changes on individuals in both these sub-groups was
considered on the basis of a seventy-thirty earnings ratio within the couple. Finally, to determine the
effect of the reduction to the Home Carer’s tax credit, we considered the impact of the changes
outlined in Budget 2011 on domicile that was composed of a married couple where one individual
was an employee while the other was primarily engaged in home duties.
Tax and welfare
When calculating respondents’ taxation and social contribution liability, we assume that all
individuals are employees under the PAYE system and pay Class A rates of PRSI. The impact of
changes to standard tax reliefs are accounted for in this paper. Standard reliefs are defined as:
reliefs which are unrelated to actual expenditures incurred by the taxpayer and are automatically
available to all taxpayers who satisfy the eligibility rules specified in the legislation. Standard tax
reliefs are usually fixed amounts or fixed percentages of income and are typically the most important
set of reliefs in the determination of the income tax paid by workers14.
Examples of standard tax breaks include the personal tax credit granted to all individuals of working
age and the credit granted to home carers. Non-standard tax reliefs are measures that are wholly
determined by reference to an expenditure incurred. These include reliefs on contributions to
private pension schemes and tax breaks on interest payments on qualifying loans. The impacts of
changes to non-standard tax reliefs and schemes announced in Budget 2011 are excluded from this
analysis. This is primarily due to a lack of readily available data on their value. In the case of non-
standard tax breaks, various estimates have been made on the overall cost to the state; however,
the methodology behind these estimates is a highly contentious issue. In any event, these estimates
fail to provide an appraisal of the value of the non-standard reliefs on an individual basis, which is
what is required for this type of analysis.
14
Organisation for Economic Co-operation and Development, Taxing Wages 2009-2010, OECD Publishing, http://dx.doi.org/10.1787/tax_wages-2010-en, 2011.
Winners and Losers? | November 2011
46
Changes in the annual income that respondents derive from social welfare were based on reductions
to the headline rates of primary social benefits. For instance, the reduction applied to
unemployment benefits was derived from the 4.02 per cent decrease to the maximum rate available
under the Jobseekers’ schemes. Reductions in income due to a re-specification of the criteria an
individual must meet in order to qualify for the maximum rate are excluded from the analysis.
Information on income arising from social benefit entitlements is recorded under nine broad welfare
categories in the SILC dataset. When assigning social benefit schemes to one of the nine groups, the
aggregate impact of reductions to individual welfare programmes on the each category of benefit
payments specified in the SILC dataset was calculated on a weighted average basis. Data on the
number of individuals reliant on various social welfare schemes was based on the statistics published
by the Department of Social Protection, while information on family size contained in Census 2006
was used to estimate the impact of the decrease to the Child Benefit payments.
Income
Individuals’ gross annual employee income (B50) was used to calculate respondents’ liability under
the standard system of taxation and social contributions. We assume that wages and income from
social transfers remained constant in the period between the survey date and the enactment of the
measures outlined in Budget 2011. Earnings derived from self-employment were omitted from the
analysis. In addition to being subject to a different system of taxation, income from self-employment
is often considered to be the least reliable among the different categories of income sources
included in SILC, as the self-employment variable is subject to a very low rate of response15. In
Ireland the non-response issue is particularly problematic16. Social welfare payments were assumed
to be exempt from the standard rates and bands of taxation as limitations in the data available
prevent more veracious treatment of these sources of income. For instance, the gross annual value
of individuals’ unemployment benefits (B71) does not specify whether the social transfer was
received under the Jobseeker’s Benefit scheme or the Jobseeker’s Allowance scheme. Income
derived from the former scheme may be liable for taxation, depending on the household’s income
from other sources, while support received under the Jobseeker’s Allowance scheme is not taxable.
Earnings from property rental and investments were not included in the analysis, as in order to deal
15
Philippe Van Kerm, “EU SILC and welfare measurements” in Comparative EU statistics on Income and Living Conditions: Issues and Challenges: Proceedings from the EU-SILC conference. Paper presented at the EU-SILC Conference, Helsinki, November 2006. 16
Vijay Verma, “Issues in data quality and comparability in EU-SILC” in Comparative EU statistics on Income and Living Conditions: Issues and Challenges: Proceedings from the EU-SILC conference, 2006. Paper presented at the EU-SILC Conference, Helsinki, November 2006.
Winners and Losers? | November 2011
47
with these sources of income in a robust manner one must consider the effects of changes to the
system of non-standard tax reliefs announced in Budget 2011.
One problematic issue was respondents’ reporting a complete absence of income from all sources.
There is reason to believe that the zero income response reflected either a misunderstanding that
occurred when the data was being entered, or an error that transpired when the results were being
processed. For instance, of the 857 cases recording no income, 604 reported that in the weeks
preceding the survey they had engaged in an activity that cost money, and 185 of the cohort
indicated that they were able to save money on a regular basis. Even if a certain amount of error
occurred when filling out the questionnaire or inputting the results, it remains possible that a certain
proportion of the population genuinely did not have any annual income in 2009, and may have
drawn on personal savings to meet their living expenses. Unfortunately, using the SILC database
there was no way of identifying to what extent this was the case. Finally, while it was improbable
that ten percent of the sample had no form of income whatsoever, for a certain proportion of the
cohort this response may reflect the fact that they are completely reliant on a spouse or partner to
provide them with income. The informal and unreliable nature of this support may result in these
transfers being undervalued. Approximately three per cent of all males reported no income from any
of the listed sources, while 14.4 per cent of female respondents gave a zero income response.
Married females constitute the vast majority, 74.3 per cent, of the individuals reporting no financial
means. The most common economic status of the respondents indicating they had no income was
the ‘home duties’ category. Given the profile of the no-income cohort, a failure to consider inter-
household transfers as a form of income may well be one of the main reasons that they reported a
complete absence of means.
It was necessary to adjust the data to keep the magnitude of potential errors under control.
Assigning income according an equivalence scale was unsuitable for this type of analysis, as it
assumes that domiciles with the same composition distribute the household’s total income amongst
family members in a uniform manner. A combination of the known error and implausibility meant
that zero-income responses were excluded from the analysis. While data adjustments are hazardous
and no one measure can guarantee an estimate that was closer to true distribution of income,
trimming is the most commonly adopted practice for making estimates robust to outlying
observations17.
17
Philippe Van Kerm, 2006.
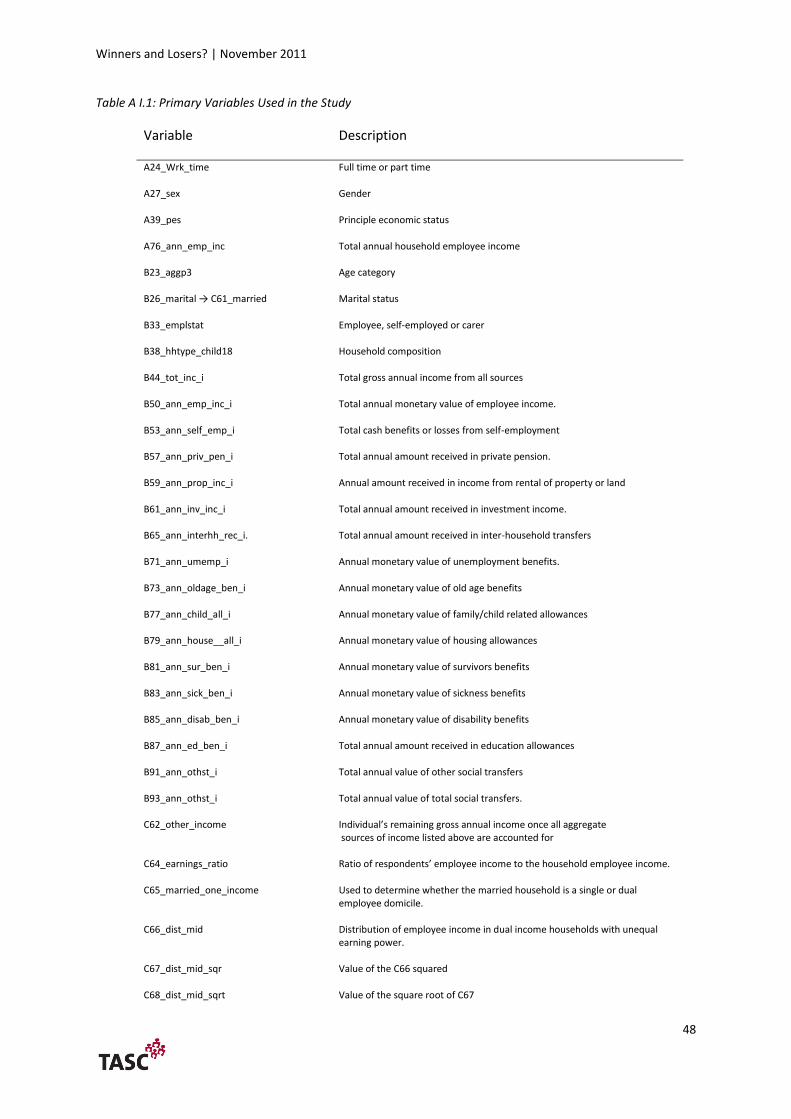
Winners and Losers? | November 2011
48
Table A I.1: Primary Variables Used in the Study
Variable Description
A24_Wrk_time Full time or part time
A27_sex Gender
A39_pes Principle economic status
A76_ann_emp_inc Total annual household employee income
B23_aggp3 Age category
B26_marital → C61_married Marital status
B33_emplstat Employee, self-employed or carer
B38_hhtype_child18 Household composition
B44_tot_inc_i Total gross annual income from all sources
B50_ann_emp_inc_i Total annual monetary value of employee income.
B53_ann_self_emp_i Total cash benefits or losses from self-employment
B57_ann_priv_pen_i Total annual amount received in private pension.
B59_ann_prop_inc_i Annual amount received in income from rental of property or land
B61_ann_inv_inc_i Total annual amount received in investment income.
B65_ann_interhh_rec_i. Total annual amount received in inter-household transfers
B71_ann_umemp_i Annual monetary value of unemployment benefits.
B73_ann_oldage_ben_i Annual monetary value of old age benefits
B77_ann_child_all_i Annual monetary value of family/child related allowances
B79_ann_house__all_i Annual monetary value of housing allowances
B81_ann_sur_ben_i Annual monetary value of survivors benefits
B83_ann_sick_ben_i Annual monetary value of sickness benefits
B85_ann_disab_ben_i Annual monetary value of disability benefits
B87_ann_ed_ben_i Total annual amount received in education allowances
B91_ann_othst_i Total annual value of other social transfers
B93_ann_othst_i Total annual value of total social transfers.
C62_other_income Individual’s remaining gross annual income once all aggregate sources of income listed above are accounted for
C64_earnings_ratio Ratio of respondents’ employee income to the household employee income.
C65_married_one_income Used to determine whether the married household is a single or dual employee domicile.
C66_dist_mid Distribution of employee income in dual income households with unequal earning power.
C67_dist_mid_sqr Value of the C66 squared
C68_dist_mid_sqrt Value of the square root of C67
Winners and Losers? | November 2011
49
Appendix II: Representative samples
The European Survey on Income and Living Conditions (EU-SILC) is a household survey carried out
annually in Ireland by the CSO. SILC aims to provide a nationally representative sample of private
households. The survey design is a two-stage stratified cluster sample. In the first stage, 2,600
geographically defined continuous blocks of households are selected. In the second stage a random
sample and random substitution is selected for each block. The sample is then weighted to
compensate for the effects of clustering and to ensure the sample is representative of the
population. The weights are based on tables of age by sex and by household composition. The
measured effects in this study should be considered representative of the observed sample rather
than representative of the population of Ireland. This is because the analysis is performed using
unweighted data. The ISSDA SILC dataset provides a set of weight variables (euroweight) which,
given the acceptance of certain assumptions about the composition of the population18, can be used
to adjust income variables to compensate for non-response and sampling error. According to
Eurostat, a major limitation of the EU-SILC user’s data base is the absence of information on sample
structure, particularly concerning stratification, necessary to compute sampling errors (Eurostat,
2010)19. Caution is therefore advised in converting the sample results into population results.
So how substantial are the differences between the unweighted and weighted data? The differential
between the unweighted and weighted means for the total individual net disposable income
variable stands at +4.1 per cent for males aged 18+ and +0.5 per cent for females, while the
differential between the unweighted and weighted medians for the total individual net disposable
income variable stands at -.008 per cent for males aged 18+ and +0.2 per cent for females. The
differential between the unweighted and weighted means for the total individual gross income
variable stands at +4.6 per cent for males aged 18+ and -0.1 per cent for females, while the
differential between the unweighted and weighted medians for the total individual gross income
variable stands at -0.7 per cent for males aged 18+ and -0.5 per cent for females. In other words, the
differences between the unweighted and weighted groups are of the order of one per cent or less in
all cases, with the exception of the mean incomes for males, for which the differences are less than
five per cent.
18
The Census 2011 preliminary estimates, which were also produced by the CSO, show the total size of the population of Ireland to be around 100,000 larger (2.2 per cent larger) than might have been expected given the CSO’s previous estimates. This illustrates the fragility of estimates of population size and population composition for non-census years. The longer it has been since the last census, the less accurate the estimates are likely to be. Estimates of the size and composition of the population in 2009 must be regarded as, at best, indicative of the actual size and composition of the population in 2009. 19
Eurostat (2010) Living Conditions in Europe and the Europe 2020 Agenda.
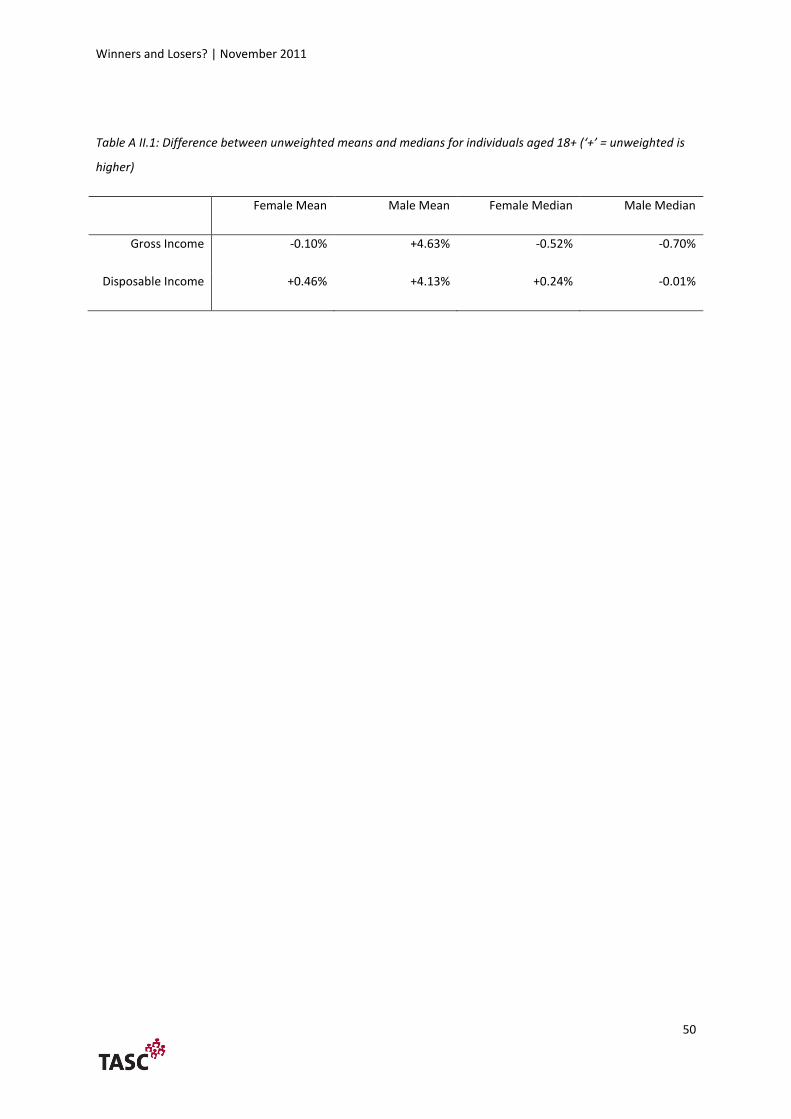
Winners and Losers? | November 2011
50
Table A II.1: Difference between unweighted means and medians for individuals aged 18+ (‘+’ = unweighted is
higher)
Female Mean Male Mean Female Median Male Median
Gross Income -0.10% +4.63% -0.52% -0.70%
Disposable Income +0.46% +4.13% +0.24% -0.01%
Winners and Losers? | November 2011
51
Appendix III: Underrating and Overrating Income
An important consideration is that the changes announced in Budget 2011 are actually applied to
later incomes than those indicated in the SILC 2009 dataset. To increase the robustness of the
findings it is useful to adjust the base data to current income levels by adjusting for changes in
wages, tax and social benefits in the interim period. To bring the 2009 income figures up to date we
can adjust them in line with the changes in average incomes as well as with changes in retail prices
using the Consumer Price Index (see Table A3.1). Budget 2010 introduced a number of changes to
the system of taxes and benefits (Department of Finance, 2010)20. On the taxation side the major
changes were all related to indirect taxation. These changes were the introduction of a carbon tax,
the reduction of excise on alcohol and the reduction of the standard rate of VAT from 21.5 per cent
to 21 per cent. Social benefits were cut in Budget 2010. The maximum personal rate for all weekly
schemes (other than personal rates applicable to those aged 66 and over) were generally reduced by
amounts varying between €8.20 and €8.50 per week from the first week in January 2010 with
proportionate decreases applying in respect of people on reduced rates of payment. A new
maximum personal rate of Jobseeker’s Allowance and basic Supplementary Welfare Allowance was
introduced for new applicants aged 20 to 24 inclusive and child benefit rates were reduced by €16
per month from January 2010. Public sector wages were also impacted in budget 2010. Public Sector
salaries were reduced by 5 per cent on the first €30,000 of salary; by 7.5 per cent on the next
€40,000 of salary and by 10 per cent on the next €55,000 of salary. The implication of these changes
is that the SILC 2009 data likely overrates the actual income levels in 2011. One significant difficulty
involved in adjusting underrated or overrated income is determining the distribution of these
changes. One example of these differential changes is that public sector workers received pay cuts in
excess of 5 per cent whereas wages for the population as a whole declined by just 2.9 per cent.
Unfortunately we cannot tell from the SILC dataset whether someone is a public sector worker.
Clearly an arbitrary reduction of all employee income by 2.9 per cent is problematic.
20
http://budget.gov.ie/budgets/2010/Summary.aspx
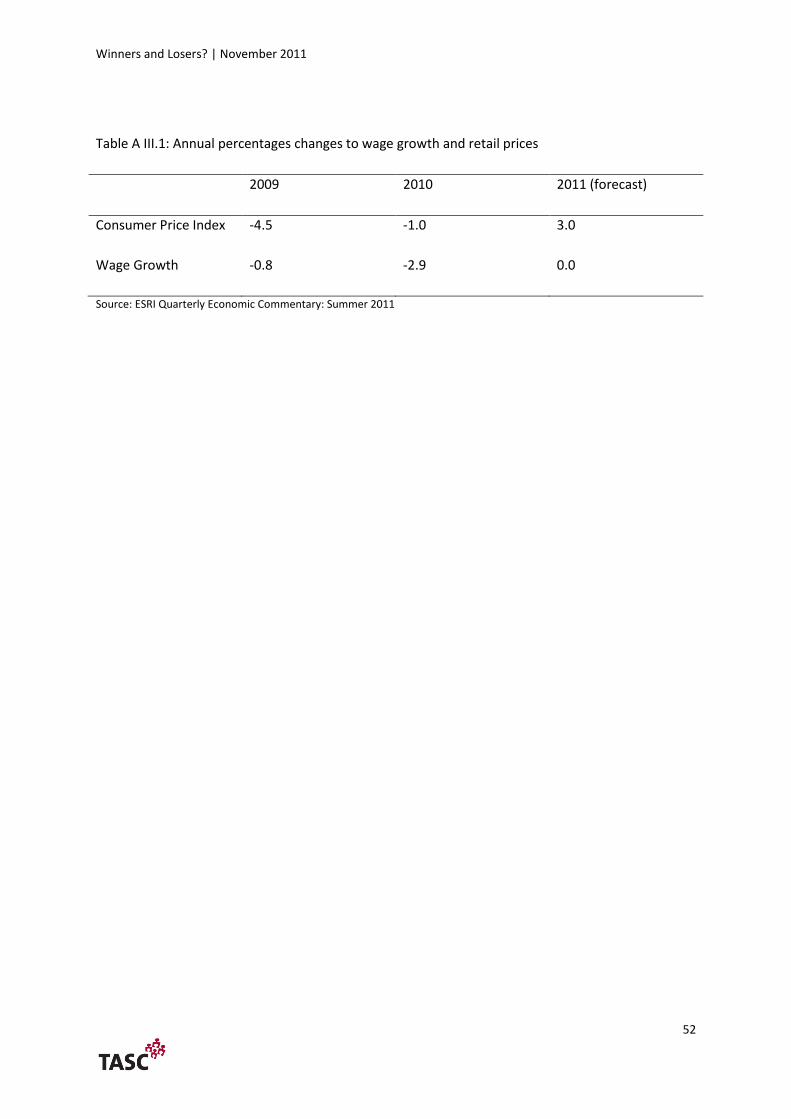
Winners and Losers? | November 2011
52
Table A III.1: Annual percentages changes to wage growth and retail prices
2009 2010 2011 (forecast)
Consumer Price Index -4.5 -1.0 3.0
Wage Growth -0.8 -2.9 0.0
Source: ESRI Quarterly Economic Commentary: Summer 2011

Winners and Losers? | November 2011
53
Appendix IV: Information on sample
Table A IV.1: Composition of the sample according to household type
No. of cases
No. of cases as % of analysed sample
Females
Single 3,435 47.66 1,771
Single with children 781 10.84 569
Married 1 income household 1,661 23.05 948
Married 2 income household (50:50) 502 6.97 232
Married. 2 income household (70:30)i 429 5.95 325
Married 2 incomes household (70:30)ii 399 5.54 81
Totals 7,207 100 54.47 i) person is the lower earning employee in the household
ii) person is the high earning employee in the household
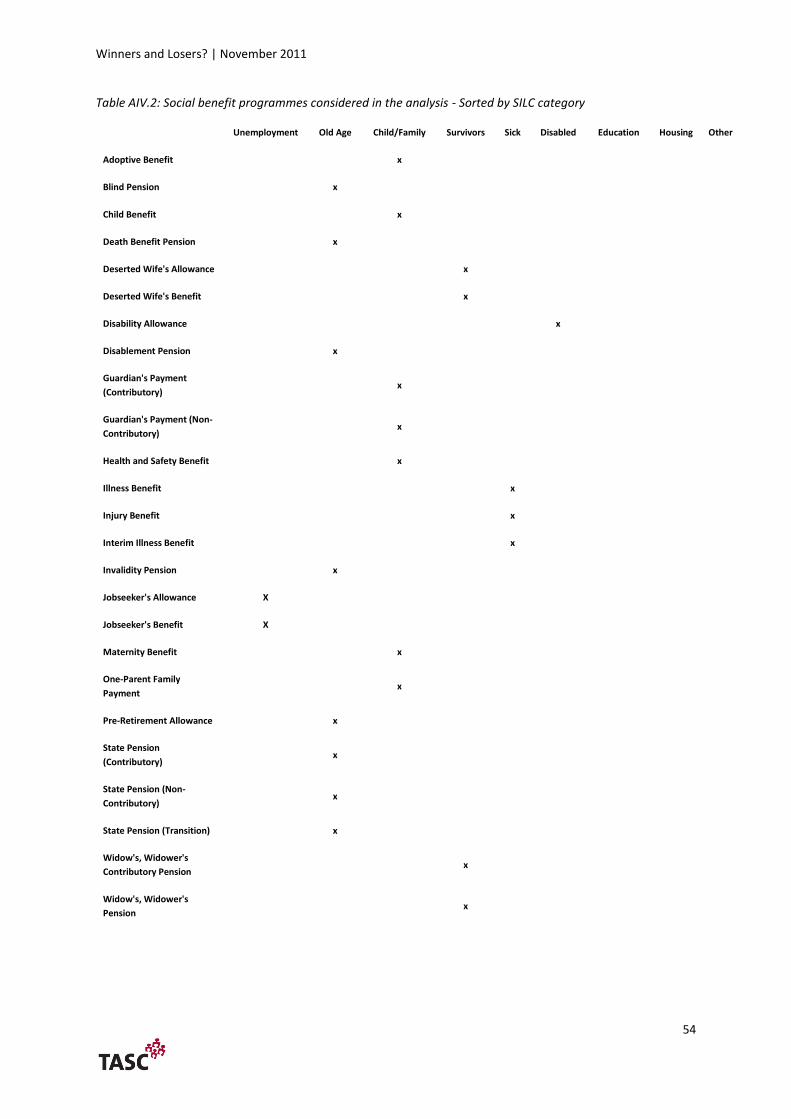
Winners and Losers? | November 2011
54
Table AIV.2: Social benefit programmes considered in the analysis - Sorted by SILC category
Unemployment Old Age Child/Family Survivors Sick Disabled Education Housing Other
Adoptive Benefit x
Blind Pension x
Child Benefit x
Death Benefit Pension x
Deserted Wife's Allowance x
Deserted Wife's Benefit x
Disability Allowance x
Disablement Pension x
Guardian's Payment
(Contributory) x
Guardian's Payment (Non-
Contributory) x
Health and Safety Benefit x
Illness Benefit x
Injury Benefit x
Interim Illness Benefit x
Invalidity Pension x
Jobseeker's Allowance X
Jobseeker's Benefit X
Maternity Benefit x
One-Parent Family
Payment x
Pre-Retirement Allowance x
State Pension
(Contributory) x
State Pension (Non-
Contributory) x
State Pension (Transition) x
Widow's, Widower's
Contributory Pension x
Widow's, Widower's
Pension x
Winners and Losers? | November 2011
55
Appendix V: Towards a comprehensive equality audit: enhancing the analysis
There are a number of ways in which the analysis underlying this report could be enhanced. There is
a need for greater tracking of data over time, as well as a need for further analysis of the lower tail
of the income distribution and of how best to treat negative income components and missing data.
The use of microsimulation modelling and discrete choice modelling can help in this regard, and can
help in modelling behavioural choices and medium-term policy impacts.
The analysis can be made more accurate by (A) weighting the sample data to generate a more
representative sample of the population, by (B) overrating or underrating the income data to adjust
for prior changes in wages, taxes and benefits, and by (C) using empirically informed weighting
scales to equivalise income and thus provide a more accurate picture of the true distribution of
income in the economy.
Microsimulation modelling
A long-term goal of Government should be to develop a transparent and accurate model of the
distributional and employment impacts of all tax and benefit measures under consideration.
Microsimulation modelling is the best practice method for deriving these impacts over time.
Microsimulation is a modelling technique that generates artificial data for the most elemental units
i.e. individuals, in the economic system. The principal advantage of microsimulation modelling over a
more traditional analysis of the type conducted in this report is that microsimulation generates
estimates of not only the usual ‘first-order’ effects of a policy i.e. the direct income effects due to
policy change, but also estimates of the ‘second-order’ effects i.e. induced behavioural effects due
to a policy change. Good examples of medium-term behavioural impacts of interest include changes
to household consumption patterns (with implications for aggregate demand) and changes to labour
supply patterns (with implications for the labour market). Thus microsimulation models if properly
designed are an important tool for understanding the labour market impacts of changes to taxes and
benefits and can add important insights into the longer-term distributional impacts of policy.
There are a number of important data requirements for conducting behavioural analysis via
microsimulation models. These include estimates of income elasticities and of utility functions for
the population. Empirically derived discrete choice models of labour supply decisions are another
important component of microsimulation models. Microsimulation analysis can suffer from the

Winners and Losers? | November 2011
56
“black box” issue common to all complex models and a lack of high-quality, comprehensive,
longitudinal data will generate unreliable sample data, thereby compromising the robustness of the
model. A significant barrier to microsimulation modelling is the substantial development costs
involved. These costs can include an initial investment of several person-years to develop the model
followed by additional person years to maintain the evolving model. There are also substantial up-
front investments (Fredriksen (1998), Williamson (1999). Also, it is emphasised in Eurostat (2010)
that: ‘a substantial amount of imputation and approximation is necessary in using the EU-SILC data
for the EUROMOD21 microsimulation model’. Despite these constraints, microsimulation models are
an important tool for policymakers concerned with the medium-term effects of changes to taxes and
benefits.
Equivalising income
The concept of equivalised income is sometimes used to measure welfare within households.
Equivalised income is an adjusted measure of household income that seeks to take account of the
differences in a household’s size and composition. By adjusting household income in this way we can
look at household incomes on a comparable basis. The idea is that the standard of living of an
individual in a household depends not only upon their own income but also upon the income of the
other household members. An arbitrary assumption of measuring income at the household level is
that all individuals within the household are equally well off. This is unlikely to be true in practice.
Although various other calibrations can be considered just as plausible the ‘Modified OECD
Equivalence Scale’ is commonly used in some countries official income statistics to generate
comparisons of the relative wellbeing of households. The equivalised income is calculated by
dividing the household’s total income from all sources by the household’s equivalent size. Equivalent
size is the sum of the weights of all the members of a given household. The equivalised income of a
lone person household is naturally the same as its unequivalised income. For all other types of
household composition, equivalised total income will be lower than total income. To illustrate this
concept the modified OECD equivalence scale uses the following arbitrary weights:
21
EUROMOD is a static tax-benefit microsimulation model for the European Union
Winners and Losers? | November 2011
57
1.0 - the first adult
0.5 – each subsequent person aged 14 and over
0.3 – each child aged 13 and under
The weighting system is designed to reflect the fact that children have fewer needs than adults and
to reflect economies of scale in general household costs. So a single adult household with child
dependents aged 13 and 4 would have an equivalent size of 1.6. Thus if the adult’s total income is
€16,000 then the equivalised income using this weighting system is estimated to be €10,000. There
is no clear empirical justification for favouring this particular weighting system and no single
definitive standard has emerged from the empirical literature.
Additional factors will impinge on household wellbeing. For example people in the labour force and
individuals living in rural areas may have substantially higher transportation costs than people
outside the labour force or living in urban areas. Older people may have higher medical costs while
children have different needs at different ages. A comprehensive equivalence scale would need to
adjust for these heterogeneous costs and, more contentiously, to also adjust for differences in
preferences.
A further important point is that larger households are likely to have substantially lower ‘per capita’
housing costs than single person households. In this case the equivalised income of the members of
the large household may be underestimated vis-a-vis the un-equivalised income of the single person
householder. This will depend on the weighting scale used. Thus an equivalence income based
purely on household size and composition may well paint a misleading and biased portrait of the
economic resources available to each member of the household.
Nevertheless weighting scales, if properly designed, provide a useful method of describing patterns
of income distribution and poverty within the population. Equivalised weighting scales are less
useful for analysing gender differences because they do not take account of how money is actually
distributed within households and are therefore likely to underplay the actual differences between
genders. A difficulty identified by Iacovou and Skew (2010) is that, unlike some other household
surveys, EU-SILC does not provide a ‘household grid’ or ‘relationship matrix’. This makes it
problematic to delineate household groups. Although we have not estimated equivalised income for
the purposes of this study, reference to equivalised income distributions would probably be a
necessary component of a comprehensive equality audit.

Winners and Losers? | November 2011
58
Acknowledgement and Disclaimer
This publication is supported under the European Union Programme for Employment and Social
Solidarity – PROGRESS (2007–2013).
This programme is managed by the Directorate-General for Employment, Social Affairs and Equal
Opportunities of the European Commission. It was established to financially support the
implementation of the objectives of the European Union in the employment and social affairs area, as
set out in the Social Agenda, and thereby contribute to the achievement of the Lisbon Strategy goals in
these fields.
The seven-year Programme targets all stakeholders who can help shape the development of
appropriate and effective employment and social legislation and policies, across the EU-27, EFTA-EEA
and EU candidate and pre-candidate countries.
PROGRESS mission is to strengthen the EU contribution in support of Member States’ commitment.
PROGRESS will be instrumental in:
Providing analysis and policy advice on PROGRESS policy areas;
Monitoring and reporting on the implementation of EU legislation and policies in PROGRESS
policy areas;
Promoting policy transfer, learning and support among Member States on EU objectives and
priorities; and
Relaying the views of the stakeholders and society at large
For more information see: http://ec.europa.eu/progress
The information contained in this publication does not necessarily reflect the position or opinion of the
European Commission.
The information contained in this publication does not necessarily reflect the position or opinion of the
Equality Authority.