WINDROSE PLAZA FOR LEASE - henrysmiller.com file9434 Katy Fwy Suite 180 Houston, TX 77055 (713)...
15
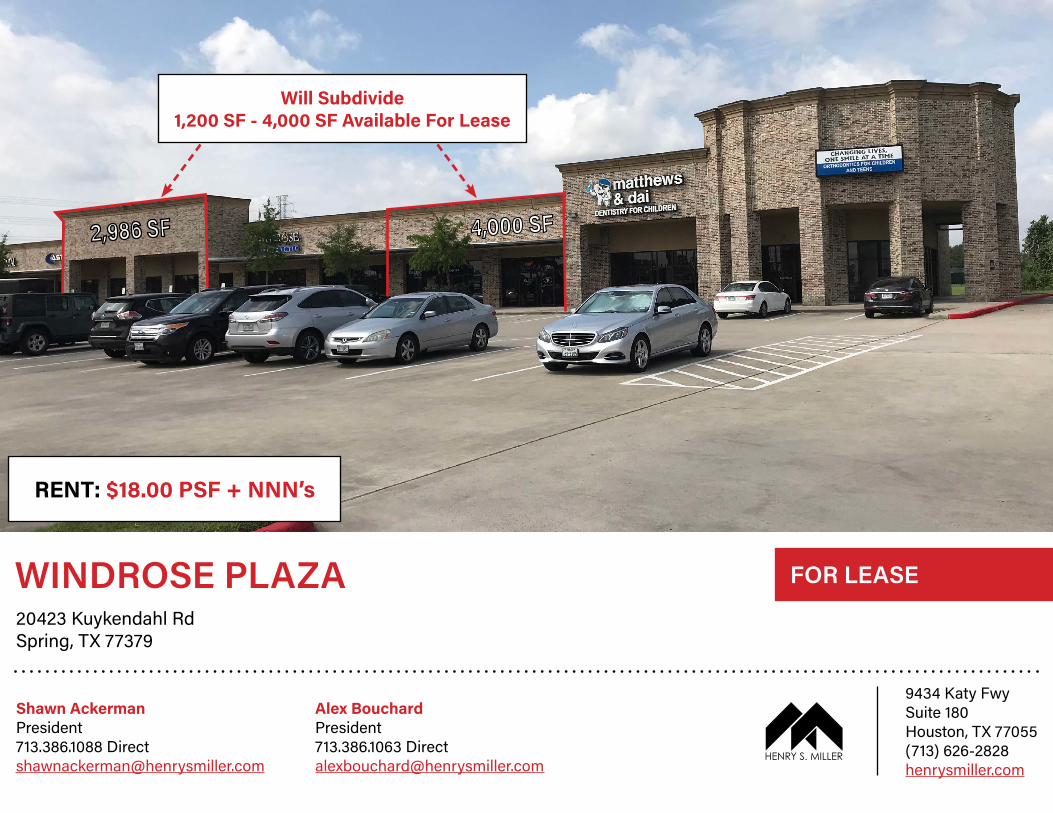
9434 Katy Fwy Suite 180 Houston, TX 77055 (713) 626-2828 henrysmiller.com WINDROSE PLAZA 20423 Kuykendahl Rd Spring, TX 77379 Shawn Ackerman President 713.386.1088 Direct [email protected] Alex Bouchard President 713.386.1063 Direct [email protected] FOR LEASE Will Subdivide 1,200 SF - 4,000 SF Available For Lease RENT: $18.00 PSF + NNN’s
Transcript of WINDROSE PLAZA FOR LEASE - henrysmiller.com file9434 Katy Fwy Suite 180 Houston, TX 77055 (713)...
9434 Katy Fwy Suite 180Houston, TX 77055(713) 626-2828henrysmiller.com
WINDROSE PLAZA20423 Kuykendahl RdSpring, TX 77379
Shawn AckermanPresident713.386.1088 [email protected]
Alex BouchardPresident713.386.1063 [email protected]
FOR LEASE
Will Subdivide1,200 SF - 4,000 SF Available For Lease
RENT: $18.00 PSF + NNN’s
PROPERTY INFORMATION
LOCATION
PROPERTY HIGHLIGHTS
AVAILABLE SPACE
RENT
CPD
TENANTS
AREA RETAILERS
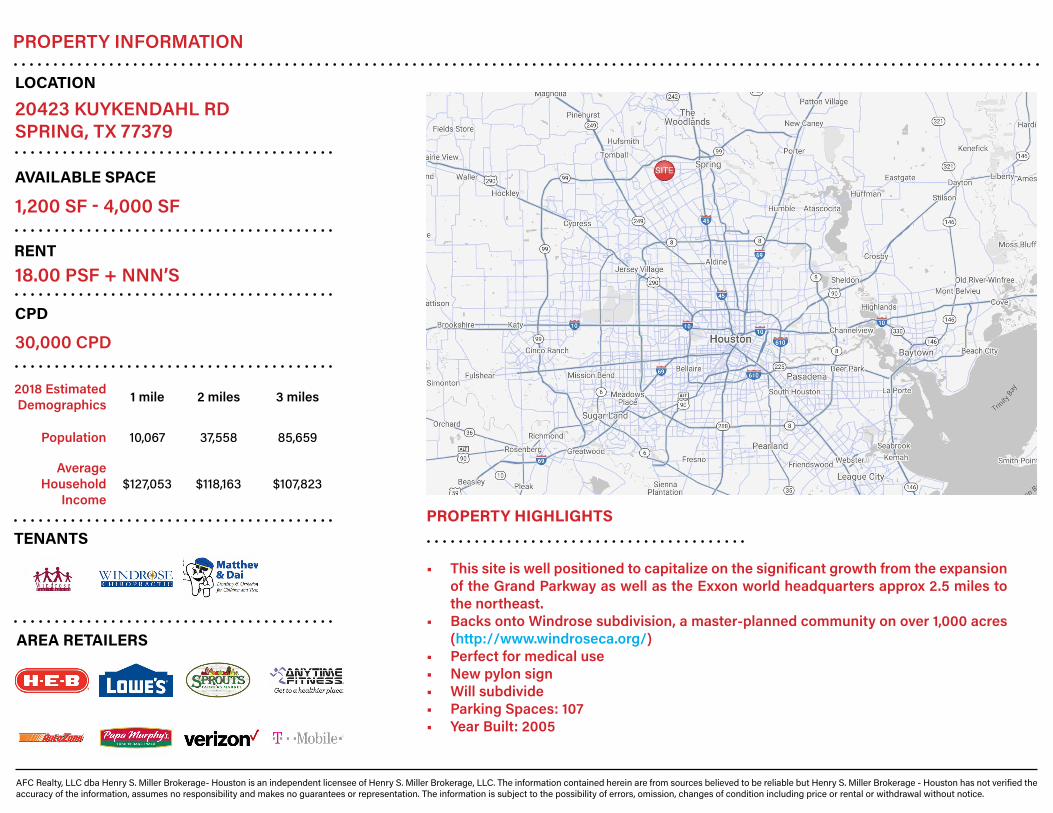
20423 KUYKENDAHL RDSPRING, TX 77379
1,200 SF - 4,000 SF
18.00 PSF + NNN’S
30,000 CPD
• This site is well positioned to capitalize on the significant growth from the expansion of the Grand Parkway as well as the Exxon world headquarters approx 2.5 miles to the northeast.
• Backs onto Windrose subdivision, a master-planned community on over 1,000 acres (http://www.windroseca.org/)
• Perfect for medical use• New pylon sign• Will subdivide• Parking Spaces: 107• Year Built: 2005
AFC Realty, LLC dba Henry S. Miller Brokerage- Houston is an independent licensee of Henry S. Miller Brokerage, LLC. The information contained herein are from sources believed to be reliable but Henry S. Miller Brokerage - Houston has not verified the accuracy of the information, assumes no responsibility and makes no guarantees or representation. The information is subject to the possibility of errors, omission, changes of condition including price or rental or withdrawal without notice.
2018 Estimated Demographics 1 mile 2 miles 3 miles
Population 10,067 37,558 85,659
Average Household
Income$127,053 $118,163 $107,823
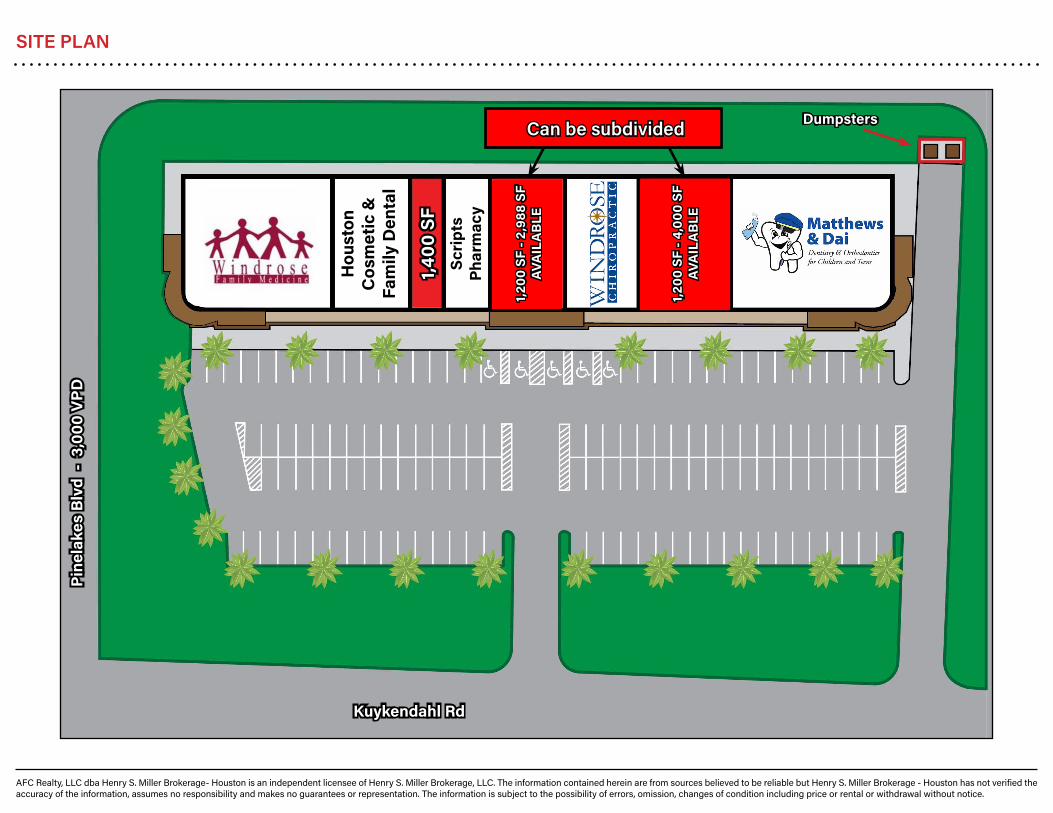
SITE PLAN
AFC Realty, LLC dba Henry S. Miller Brokerage- Houston is an independent licensee of Henry S. Miller Brokerage, LLC. The information contained herein are from sources believed to be reliable but Henry S. Miller Brokerage - Houston has not verified the accuracy of the information, assumes no responsibility and makes no guarantees or representation. The information is subject to the possibility of errors, omission, changes of condition including price or rental or withdrawal without notice.
Kuykendahl Rd
Pine
lake
s B
lvd
- 3
,000
VPD
Dumpsters
Hou
ston
C
osm
etic
&Fa
mily
Den
tal
Scri
pts
Phar
mac
y
1,400
SF
1,200
SF
- 2,9
88 S
F AV
AIL
AB
LE
1,200
SF
- 4,0
00 S
F AV
AIL
AB
LE
Can be subdivided
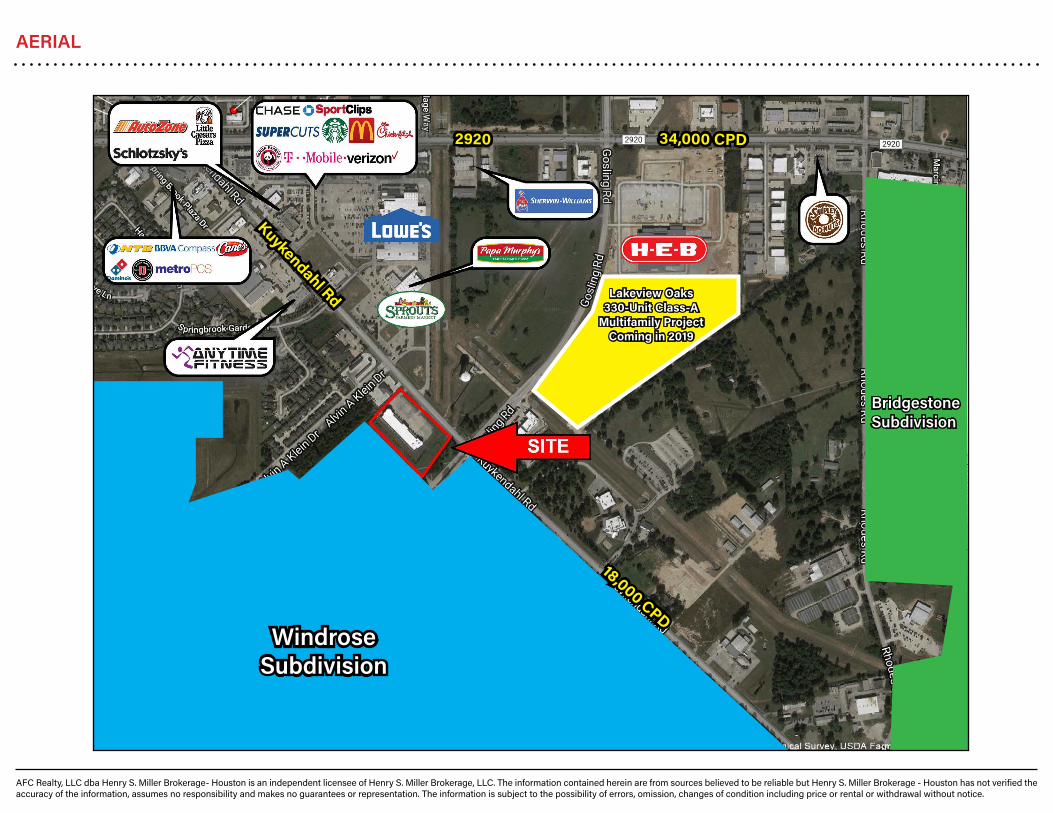
AERIAL
AFC Realty, LLC dba Henry S. Miller Brokerage- Houston is an independent licensee of Henry S. Miller Brokerage, LLC. The information contained herein are from sources believed to be reliable but Henry S. Miller Brokerage - Houston has not verified the accuracy of the information, assumes no responsibility and makes no guarantees or representation. The information is subject to the possibility of errors, omission, changes of condition including price or rental or withdrawal without notice.
WindroseSubdivision
BridgestoneSubdivision
Lakeview Oaks330-Unit Class-A
Multifamily ProjectComing in 2019
Kuykendahl Rd
2920 34,000 CPD
18,000 CPD

PHOTOS
AFC Realty, LLC dba Henry S. Miller Brokerage- Houston is an independent licensee of Henry S. Miller Brokerage, LLC. The information contained herein are from sources believed to be reliable but Henry S. Miller Brokerage - Houston has not verified the accuracy of the information, assumes no responsibility and makes no guarantees or representation. The information is subject to the possibility of errors, omission, changes of condition including price or rental or withdrawal without notice.
Demographic Source: Applied Geographic Solutions 04/2018, TIGER Geography page 1 of 9©2018, Sites USA, Chandler, Arizona, 480-491-1112
Th
is r
ep
ort
wa
s p
rod
uce
d u
sin
g d
ata
fro
m p
riva
te a
nd
go
vern
me
nt
sou
rce
s d
ee
me
d t
o b
e r
elia
ble
. T
he
info
rma
tio
n h
ere
in is
pro
vid
ed
with
ou
t re
pre
sen
tatio
n o
r w
arr
an
ty.
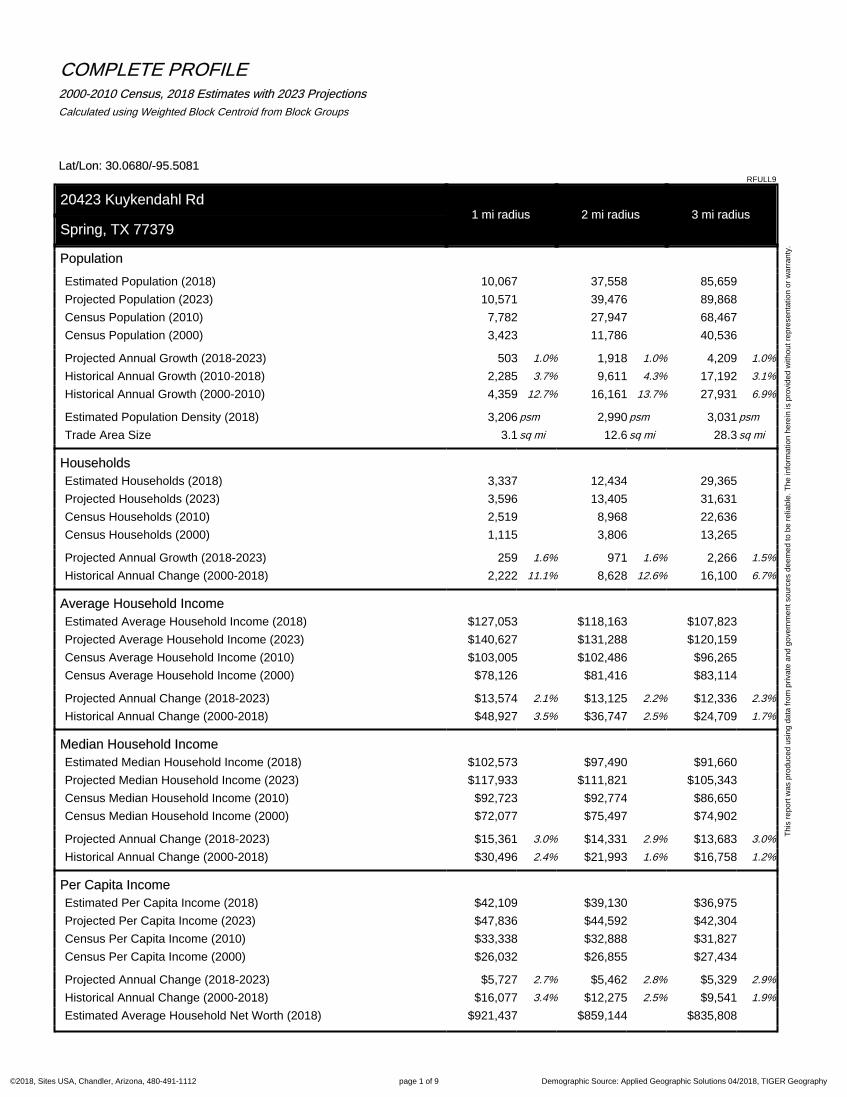
COMPLETE PROFILE2000-2010 Census, 2018 Estimates with 2023 Projections
Calculated using Weighted Block Centroid from Block Groups
Lat/Lon: 30.0680/-95.5081RFULL9
20423 Kuykendahl Rd1 mi radius 2 mi radius 3 mi radius
Spring, TX 77379
Population
Estimated Population (2018) 10,067 37,558 85,659
Projected Population (2023) 10,571 39,476 89,868
Census Population (2010) 7,782 27,947 68,467
Census Population (2000) 3,423 11,786 40,536
Projected Annual Growth (2018-2023) 503 1.0% 1,918 1.0% 4,209 1.0%
Historical Annual Growth (2010-2018) 2,285 3.7% 9,611 4.3% 17,192 3.1%
Historical Annual Growth (2000-2010) 4,359 12.7% 16,161 13.7% 27,931 6.9%
Estimated Population Density (2018) 3,206 psm 2,990 psm 3,031 psm
Trade Area Size 3.1 sq mi 12.6 sq mi 28.3 sq mi
Households
Estimated Households (2018) 3,337 12,434 29,365
Projected Households (2023) 3,596 13,405 31,631
Census Households (2010) 2,519 8,968 22,636
Census Households (2000) 1,115 3,806 13,265
Projected Annual Growth (2018-2023) 259 1.6% 971 1.6% 2,266 1.5%
Historical Annual Change (2000-2018) 2,222 11.1% 8,628 12.6% 16,100 6.7%
Average Household Income
Estimated Average Household Income (2018) $127,053 $118,163 $107,823
Projected Average Household Income (2023) $140,627 $131,288 $120,159
Census Average Household Income (2010) $103,005 $102,486 $96,265
Census Average Household Income (2000) $78,126 $81,416 $83,114
Projected Annual Change (2018-2023) $13,574 2.1% $13,125 2.2% $12,336 2.3%
Historical Annual Change (2000-2018) $48,927 3.5% $36,747 2.5% $24,709 1.7%
Median Household Income
Estimated Median Household Income (2018) $102,573 $97,490 $91,660
Projected Median Household Income (2023) $117,933 $111,821 $105,343
Census Median Household Income (2010) $92,723 $92,774 $86,650
Census Median Household Income (2000) $72,077 $75,497 $74,902
Projected Annual Change (2018-2023) $15,361 3.0% $14,331 2.9% $13,683 3.0%
Historical Annual Change (2000-2018) $30,496 2.4% $21,993 1.6% $16,758 1.2%
Per Capita Income
Estimated Per Capita Income (2018) $42,109 $39,130 $36,975
Projected Per Capita Income (2023) $47,836 $44,592 $42,304
Census Per Capita Income (2010) $33,338 $32,888 $31,827
Census Per Capita Income (2000) $26,032 $26,855 $27,434
Projected Annual Change (2018-2023) $5,727 2.7% $5,462 2.8% $5,329 2.9%
Historical Annual Change (2000-2018) $16,077 3.4% $12,275 2.5% $9,541 1.9%
Estimated Average Household Net Worth (2018) $921,437 $859,144 $835,808
Demographic Source: Applied Geographic Solutions 04/2018, TIGER Geography page 2 of 9©2018, Sites USA, Chandler, Arizona, 480-491-1112
Th
is r
ep
ort
wa
s p
rod
uce
d u
sin
g d
ata
fro
m p
riva
te a
nd
go
vern
me
nt
sou
rce
s d
ee
me
d t
o b
e r
elia
ble
. T
he
info
rma
tio
n h
ere
in is
pro
vid
ed
with
ou
t re
pre
sen
tatio
n o
r w
arr
an
ty.
COMPLETE PROFILE2000-2010 Census, 2018 Estimates with 2023 Projections
Calculated using Weighted Block Centroid from Block Groups
Lat/Lon: 30.0680/-95.5081RFULL9
20423 Kuykendahl Rd1 mi radius 2 mi radius 3 mi radius
Spring, TX 77379
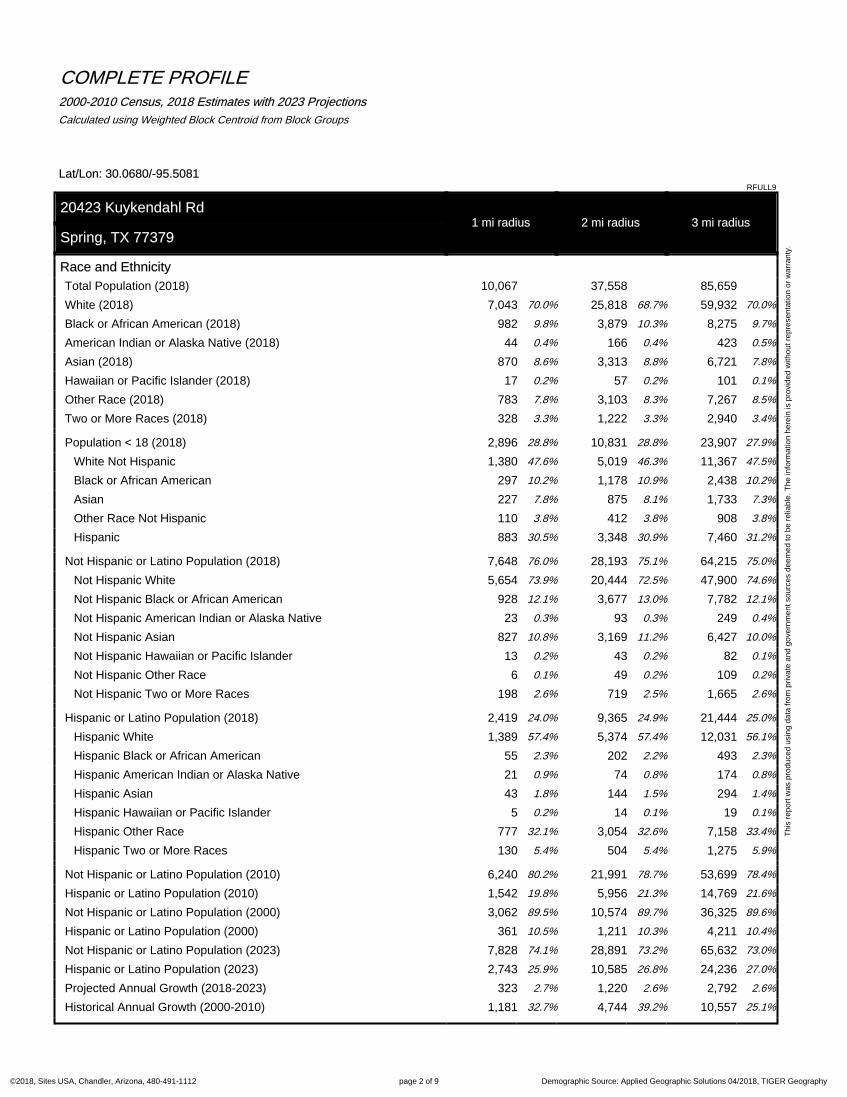
Race and Ethnicity
Total Population (2018) 10,067 37,558 85,659
White (2018) 7,043 70.0% 25,818 68.7% 59,932 70.0%
Black or African American (2018) 982 9.8% 3,879 10.3% 8,275 9.7%
American Indian or Alaska Native (2018) 44 0.4% 166 0.4% 423 0.5%
Asian (2018) 870 8.6% 3,313 8.8% 6,721 7.8%
Hawaiian or Pacific Islander (2018) 17 0.2% 57 0.2% 101 0.1%
Other Race (2018) 783 7.8% 3,103 8.3% 7,267 8.5%
Two or More Races (2018) 328 3.3% 1,222 3.3% 2,940 3.4%
Population < 18 (2018) 2,896 28.8% 10,831 28.8% 23,907 27.9%
White Not Hispanic 1,380 47.6% 5,019 46.3% 11,367 47.5%
Black or African American 297 10.2% 1,178 10.9% 2,438 10.2%
Asian 227 7.8% 875 8.1% 1,733 7.3%
Other Race Not Hispanic 110 3.8% 412 3.8% 908 3.8%
Hispanic 883 30.5% 3,348 30.9% 7,460 31.2%
Not Hispanic or Latino Population (2018) 7,648 76.0% 28,193 75.1% 64,215 75.0%
Not Hispanic White 5,654 73.9% 20,444 72.5% 47,900 74.6%
Not Hispanic Black or African American 928 12.1% 3,677 13.0% 7,782 12.1%
Not Hispanic American Indian or Alaska Native 23 0.3% 93 0.3% 249 0.4%
Not Hispanic Asian 827 10.8% 3,169 11.2% 6,427 10.0%
Not Hispanic Hawaiian or Pacific Islander 13 0.2% 43 0.2% 82 0.1%
Not Hispanic Other Race 6 0.1% 49 0.2% 109 0.2%
Not Hispanic Two or More Races 198 2.6% 719 2.5% 1,665 2.6%
Hispanic or Latino Population (2018) 2,419 24.0% 9,365 24.9% 21,444 25.0%
Hispanic White 1,389 57.4% 5,374 57.4% 12,031 56.1%
Hispanic Black or African American 55 2.3% 202 2.2% 493 2.3%
Hispanic American Indian or Alaska Native 21 0.9% 74 0.8% 174 0.8%
Hispanic Asian 43 1.8% 144 1.5% 294 1.4%
Hispanic Hawaiian or Pacific Islander 5 0.2% 14 0.1% 19 0.1%
Hispanic Other Race 777 32.1% 3,054 32.6% 7,158 33.4%
Hispanic Two or More Races 130 5.4% 504 5.4% 1,275 5.9%
Not Hispanic or Latino Population (2010) 6,240 80.2% 21,991 78.7% 53,699 78.4%
Hispanic or Latino Population (2010) 1,542 19.8% 5,956 21.3% 14,769 21.6%
Not Hispanic or Latino Population (2000) 3,062 89.5% 10,574 89.7% 36,325 89.6%
Hispanic or Latino Population (2000) 361 10.5% 1,211 10.3% 4,211 10.4%
Not Hispanic or Latino Population (2023) 7,828 74.1% 28,891 73.2% 65,632 73.0%
Hispanic or Latino Population (2023) 2,743 25.9% 10,585 26.8% 24,236 27.0%
Projected Annual Growth (2018-2023) 323 2.7% 1,220 2.6% 2,792 2.6%
Historical Annual Growth (2000-2010) 1,181 32.7% 4,744 39.2% 10,557 25.1%
Demographic Source: Applied Geographic Solutions 04/2018, TIGER Geography page 3 of 9©2018, Sites USA, Chandler, Arizona, 480-491-1112
Th
is r
ep
ort
wa
s p
rod
uce
d u
sin
g d
ata
fro
m p
riva
te a
nd
go
vern
me
nt
sou
rce
s d
ee
me
d t
o b
e r
elia
ble
. T
he
info
rma
tio
n h
ere
in is
pro
vid
ed
with
ou
t re
pre
sen
tatio
n o
r w
arr
an
ty.
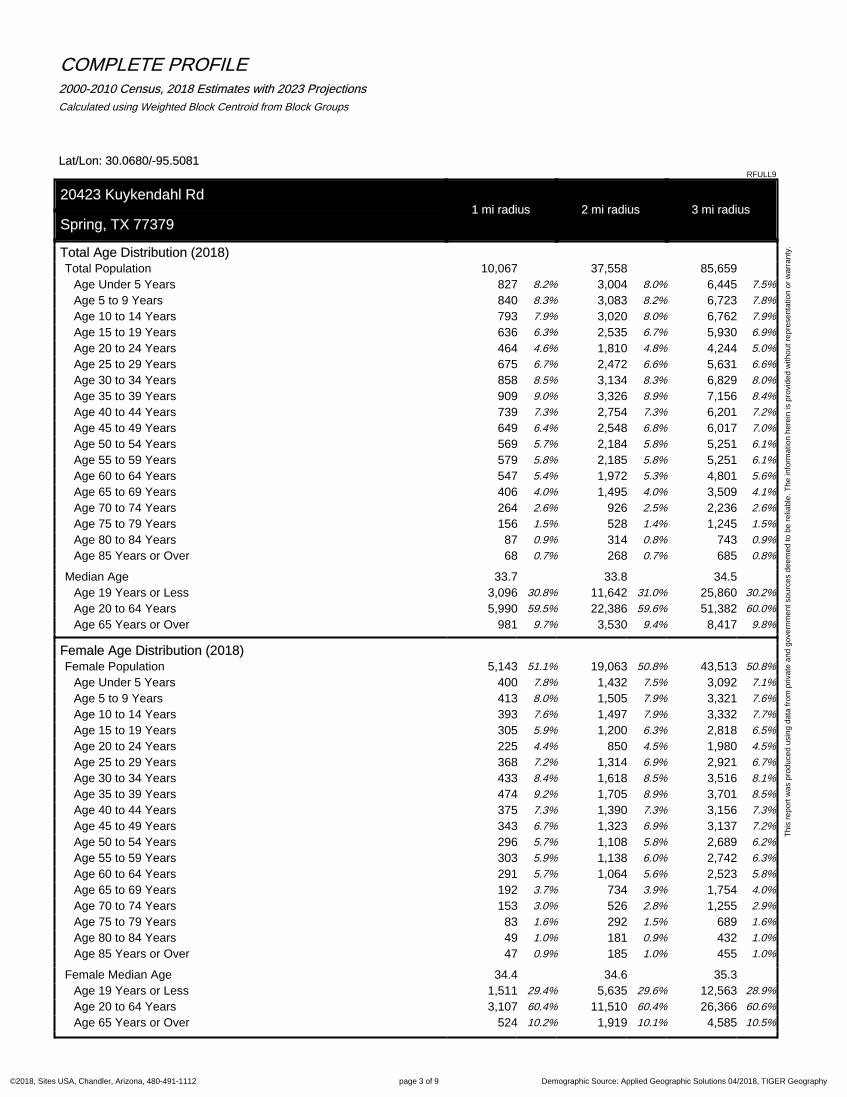
COMPLETE PROFILE2000-2010 Census, 2018 Estimates with 2023 Projections
Calculated using Weighted Block Centroid from Block Groups
Lat/Lon: 30.0680/-95.5081RFULL9
20423 Kuykendahl Rd1 mi radius 2 mi radius 3 mi radius
Spring, TX 77379
Total Age Distribution (2018)Total Population 10,067 37,558 85,659
Age Under 5 Years 827 8.2% 3,004 8.0% 6,445 7.5%
Age 5 to 9 Years 840 8.3% 3,083 8.2% 6,723 7.8%
Age 10 to 14 Years 793 7.9% 3,020 8.0% 6,762 7.9%
Age 15 to 19 Years 636 6.3% 2,535 6.7% 5,930 6.9%
Age 20 to 24 Years 464 4.6% 1,810 4.8% 4,244 5.0%
Age 25 to 29 Years 675 6.7% 2,472 6.6% 5,631 6.6%
Age 30 to 34 Years 858 8.5% 3,134 8.3% 6,829 8.0%
Age 35 to 39 Years 909 9.0% 3,326 8.9% 7,156 8.4%
Age 40 to 44 Years 739 7.3% 2,754 7.3% 6,201 7.2%
Age 45 to 49 Years 649 6.4% 2,548 6.8% 6,017 7.0%
Age 50 to 54 Years 569 5.7% 2,184 5.8% 5,251 6.1%
Age 55 to 59 Years 579 5.8% 2,185 5.8% 5,251 6.1%
Age 60 to 64 Years 547 5.4% 1,972 5.3% 4,801 5.6%
Age 65 to 69 Years 406 4.0% 1,495 4.0% 3,509 4.1%
Age 70 to 74 Years 264 2.6% 926 2.5% 2,236 2.6%
Age 75 to 79 Years 156 1.5% 528 1.4% 1,245 1.5%
Age 80 to 84 Years 87 0.9% 314 0.8% 743 0.9%
Age 85 Years or Over 68 0.7% 268 0.7% 685 0.8%
Median Age 33.7 33.8 34.5
Age 19 Years or Less 3,096 30.8% 11,642 31.0% 25,860 30.2%
Age 20 to 64 Years 5,990 59.5% 22,386 59.6% 51,382 60.0%
Age 65 Years or Over 981 9.7% 3,530 9.4% 8,417 9.8%
Female Age Distribution (2018)Female Population 5,143 51.1% 19,063 50.8% 43,513 50.8%
Age Under 5 Years 400 7.8% 1,432 7.5% 3,092 7.1%
Age 5 to 9 Years 413 8.0% 1,505 7.9% 3,321 7.6%
Age 10 to 14 Years 393 7.6% 1,497 7.9% 3,332 7.7%
Age 15 to 19 Years 305 5.9% 1,200 6.3% 2,818 6.5%
Age 20 to 24 Years 225 4.4% 850 4.5% 1,980 4.5%
Age 25 to 29 Years 368 7.2% 1,314 6.9% 2,921 6.7%
Age 30 to 34 Years 433 8.4% 1,618 8.5% 3,516 8.1%
Age 35 to 39 Years 474 9.2% 1,705 8.9% 3,701 8.5%
Age 40 to 44 Years 375 7.3% 1,390 7.3% 3,156 7.3%
Age 45 to 49 Years 343 6.7% 1,323 6.9% 3,137 7.2%
Age 50 to 54 Years 296 5.7% 1,108 5.8% 2,689 6.2%
Age 55 to 59 Years 303 5.9% 1,138 6.0% 2,742 6.3%
Age 60 to 64 Years 291 5.7% 1,064 5.6% 2,523 5.8%
Age 65 to 69 Years 192 3.7% 734 3.9% 1,754 4.0%
Age 70 to 74 Years 153 3.0% 526 2.8% 1,255 2.9%
Age 75 to 79 Years 83 1.6% 292 1.5% 689 1.6%
Age 80 to 84 Years 49 1.0% 181 0.9% 432 1.0%
Age 85 Years or Over 47 0.9% 185 1.0% 455 1.0%
Female Median Age 34.4 34.6 35.3
Age 19 Years or Less 1,511 29.4% 5,635 29.6% 12,563 28.9%
Age 20 to 64 Years 3,107 60.4% 11,510 60.4% 26,366 60.6%
Age 65 Years or Over 524 10.2% 1,919 10.1% 4,585 10.5%

Demographic Source: Applied Geographic Solutions 04/2018, TIGER Geography page 4 of 9©2018, Sites USA, Chandler, Arizona, 480-491-1112
Th
is r
ep
ort
wa
s p
rod
uce
d u
sin
g d
ata
fro
m p
riva
te a
nd
go
vern
me
nt
sou
rce
s d
ee
me
d t
o b
e r
elia
ble
. T
he
info
rma
tio
n h
ere
in is
pro
vid
ed
with
ou
t re
pre
sen
tatio
n o
r w
arr
an
ty.
COMPLETE PROFILE2000-2010 Census, 2018 Estimates with 2023 Projections
Calculated using Weighted Block Centroid from Block Groups
Lat/Lon: 30.0680/-95.5081RFULL9
20423 Kuykendahl Rd1 mi radius 2 mi radius 3 mi radius
Spring, TX 77379
Male Age Distribution (2018)Male Population 4,925 48.9% 18,495 49.2% 42,146 49.2%
Age Under 5 Years 428 8.7% 1,572 8.5% 3,353 8.0%
Age 5 to 9 Years 427 8.7% 1,578 8.5% 3,402 8.1%
Age 10 to 14 Years 400 8.1% 1,523 8.2% 3,430 8.1%
Age 15 to 19 Years 331 6.7% 1,335 7.2% 3,112 7.4%
Age 20 to 24 Years 240 4.9% 960 5.2% 2,265 5.4%
Age 25 to 29 Years 307 6.2% 1,158 6.3% 2,710 6.4%
Age 30 to 34 Years 425 8.6% 1,516 8.2% 3,313 7.9%
Age 35 to 39 Years 434 8.8% 1,621 8.8% 3,455 8.2%
Age 40 to 44 Years 364 7.4% 1,364 7.4% 3,045 7.2%
Age 45 to 49 Years 306 6.2% 1,225 6.6% 2,880 6.8%
Age 50 to 54 Years 274 5.6% 1,076 5.8% 2,562 6.1%
Age 55 to 59 Years 276 5.6% 1,047 5.7% 2,508 6.0%
Age 60 to 64 Years 256 5.2% 908 4.9% 2,278 5.4%
Age 65 to 69 Years 214 4.3% 760 4.1% 1,755 4.2%
Age 70 to 74 Years 110 2.2% 400 2.2% 980 2.3%
Age 75 to 79 Years 73 1.5% 236 1.3% 556 1.3%
Age 80 to 84 Years 38 0.8% 133 0.7% 311 0.7%
Age 85 Years or Over 21 0.4% 82 0.4% 230 0.5%
Male Median Age 32.9 32.9 33.6
Age 19 Years or Less 1,585 32.2% 6,008 32.5% 13,297 31.6%
Age 20 to 64 Years 2,883 58.5% 10,876 58.8% 25,016 59.4%
Age 65 Years or Over 457 9.3% 1,612 8.7% 3,832 9.1%
Males per 100 Females (2018)Overall Comparison 96 97 97
Age Under 5 Years 107 51.7% 110 52.3% 108 52.0%
Age 5 to 9 Years 103 50.8% 105 51.2% 102 50.6%
Age 10 to 14 Years 102 50.4% 102 50.4% 103 50.7%
Age 15 to 19 Years 108 52.0% 111 52.7% 110 52.5%
Age 20 to 24 Years 107 51.6% 113 53.1% 114 53.4%
Age 25 to 29 Years 83 45.5% 88 46.8% 93 48.1%
Age 30 to 34 Years 98 49.5% 94 48.4% 94 48.5%
Age 35 to 39 Years 92 47.8% 95 48.7% 93 48.3%
Age 40 to 44 Years 97 49.3% 98 49.5% 96 49.1%
Age 45 to 49 Years 89 47.2% 93 48.1% 92 47.9%
Age 50 to 54 Years 93 48.1% 97 49.3% 95 48.8%
Age 55 to 59 Years 91 47.7% 92 47.9% 91 47.8%
Age 60 to 64 Years 88 46.9% 85 46.0% 90 47.5%
Age 65 to 69 Years 112 52.8% 104 50.9% 100 50.0%
Age 70 to 74 Years 72 41.8% 76 43.2% 78 43.9%
Age 75 to 79 Years 89 47.0% 81 44.6% 81 44.7%
Age 80 to 84 Years 77 43.6% 74 42.4% 72 41.9%
Age 85 Years or Over 44 30.7% 44 30.7% 51 33.6%
Age 19 Years or Less 105 51.2% 107 51.6% 106 51.4%
Age 20 to 39 Years 94 48.4% 96 48.9% 97 49.2%
Age 40 to 64 Years 92 47.9% 93 48.3% 93 48.2%
Age 65 Years or Over 87 46.6% 84 45.7% 84 45.5%
Demographic Source: Applied Geographic Solutions 04/2018, TIGER Geography page 5 of 9©2018, Sites USA, Chandler, Arizona, 480-491-1112
Th
is r
ep
ort
wa
s p
rod
uce
d u
sin
g d
ata
fro
m p
riva
te a
nd
go
vern
me
nt
sou
rce
s d
ee
me
d t
o b
e r
elia
ble
. T
he
info
rma
tio
n h
ere
in is
pro
vid
ed
with
ou
t re
pre
sen
tatio
n o
r w
arr
an
ty.
COMPLETE PROFILE2000-2010 Census, 2018 Estimates with 2023 Projections
Calculated using Weighted Block Centroid from Block Groups
Lat/Lon: 30.0680/-95.5081RFULL9
20423 Kuykendahl Rd1 mi radius 2 mi radius 3 mi radius
Spring, TX 77379
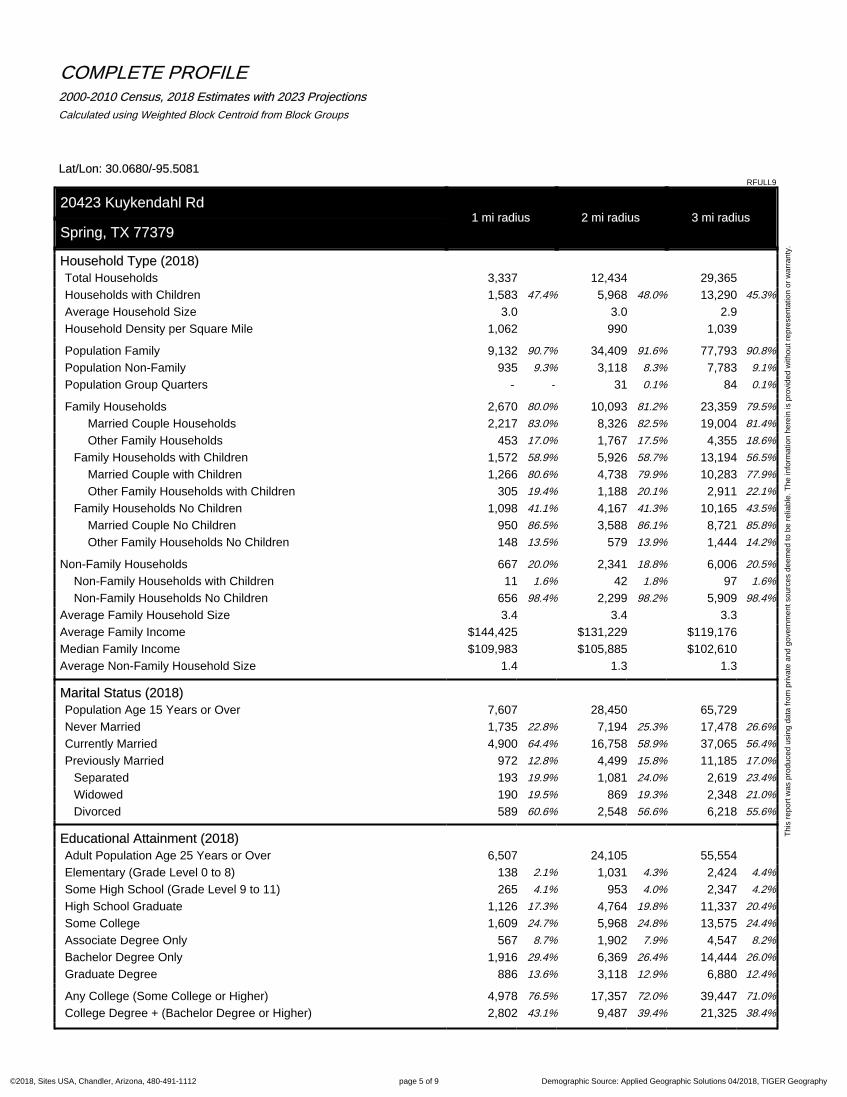
Household Type (2018)Total Households 3,337 12,434 29,365
Households with Children 1,583 47.4% 5,968 48.0% 13,290 45.3%
Average Household Size 3.0 3.0 2.9
Household Density per Square Mile 1,062 990 1,039
Population Family 9,132 90.7% 34,409 91.6% 77,793 90.8%
Population Non-Family 935 9.3% 3,118 8.3% 7,783 9.1%
Population Group Quarters - - 31 0.1% 84 0.1%
Family Households 2,670 80.0% 10,093 81.2% 23,359 79.5%
Married Couple Households 2,217 83.0% 8,326 82.5% 19,004 81.4%
Other Family Households 453 17.0% 1,767 17.5% 4,355 18.6%
Family Households with Children 1,572 58.9% 5,926 58.7% 13,194 56.5%
Married Couple with Children 1,266 80.6% 4,738 79.9% 10,283 77.9%
Other Family Households with Children 305 19.4% 1,188 20.1% 2,911 22.1%
Family Households No Children 1,098 41.1% 4,167 41.3% 10,165 43.5%
Married Couple No Children 950 86.5% 3,588 86.1% 8,721 85.8%
Other Family Households No Children 148 13.5% 579 13.9% 1,444 14.2%
Non-Family Households 667 20.0% 2,341 18.8% 6,006 20.5%
Non-Family Households with Children 11 1.6% 42 1.8% 97 1.6%
Non-Family Households No Children 656 98.4% 2,299 98.2% 5,909 98.4%
Average Family Household Size 3.4 3.4 3.3
Average Family Income $144,425 $131,229 $119,176
Median Family Income $109,983 $105,885 $102,610
Average Non-Family Household Size 1.4 1.3 1.3
Marital Status (2018)Population Age 15 Years or Over 7,607 28,450 65,729
Never Married 1,735 22.8% 7,194 25.3% 17,478 26.6%
Currently Married 4,900 64.4% 16,758 58.9% 37,065 56.4%
Previously Married 972 12.8% 4,499 15.8% 11,185 17.0%
Separated 193 19.9% 1,081 24.0% 2,619 23.4%
Widowed 190 19.5% 869 19.3% 2,348 21.0%
Divorced 589 60.6% 2,548 56.6% 6,218 55.6%
Educational Attainment (2018)Adult Population Age 25 Years or Over 6,507 24,105 55,554
Elementary (Grade Level 0 to 8) 138 2.1% 1,031 4.3% 2,424 4.4%
Some High School (Grade Level 9 to 11) 265 4.1% 953 4.0% 2,347 4.2%
High School Graduate 1,126 17.3% 4,764 19.8% 11,337 20.4%
Some College 1,609 24.7% 5,968 24.8% 13,575 24.4%
Associate Degree Only 567 8.7% 1,902 7.9% 4,547 8.2%
Bachelor Degree Only 1,916 29.4% 6,369 26.4% 14,444 26.0%
Graduate Degree 886 13.6% 3,118 12.9% 6,880 12.4%
Any College (Some College or Higher) 4,978 76.5% 17,357 72.0% 39,447 71.0%
College Degree + (Bachelor Degree or Higher) 2,802 43.1% 9,487 39.4% 21,325 38.4%
Demographic Source: Applied Geographic Solutions 04/2018, TIGER Geography page 6 of 9©2018, Sites USA, Chandler, Arizona, 480-491-1112
Th
is r
ep
ort
wa
s p
rod
uce
d u
sin
g d
ata
fro
m p
riva
te a
nd
go
vern
me
nt
sou
rce
s d
ee
me
d t
o b
e r
elia
ble
. T
he
info
rma
tio
n h
ere
in is
pro
vid
ed
with
ou
t re
pre
sen
tatio
n o
r w
arr
an
ty.
COMPLETE PROFILE2000-2010 Census, 2018 Estimates with 2023 Projections
Calculated using Weighted Block Centroid from Block Groups
Lat/Lon: 30.0680/-95.5081RFULL9
20423 Kuykendahl Rd1 mi radius 2 mi radius 3 mi radius
Spring, TX 77379
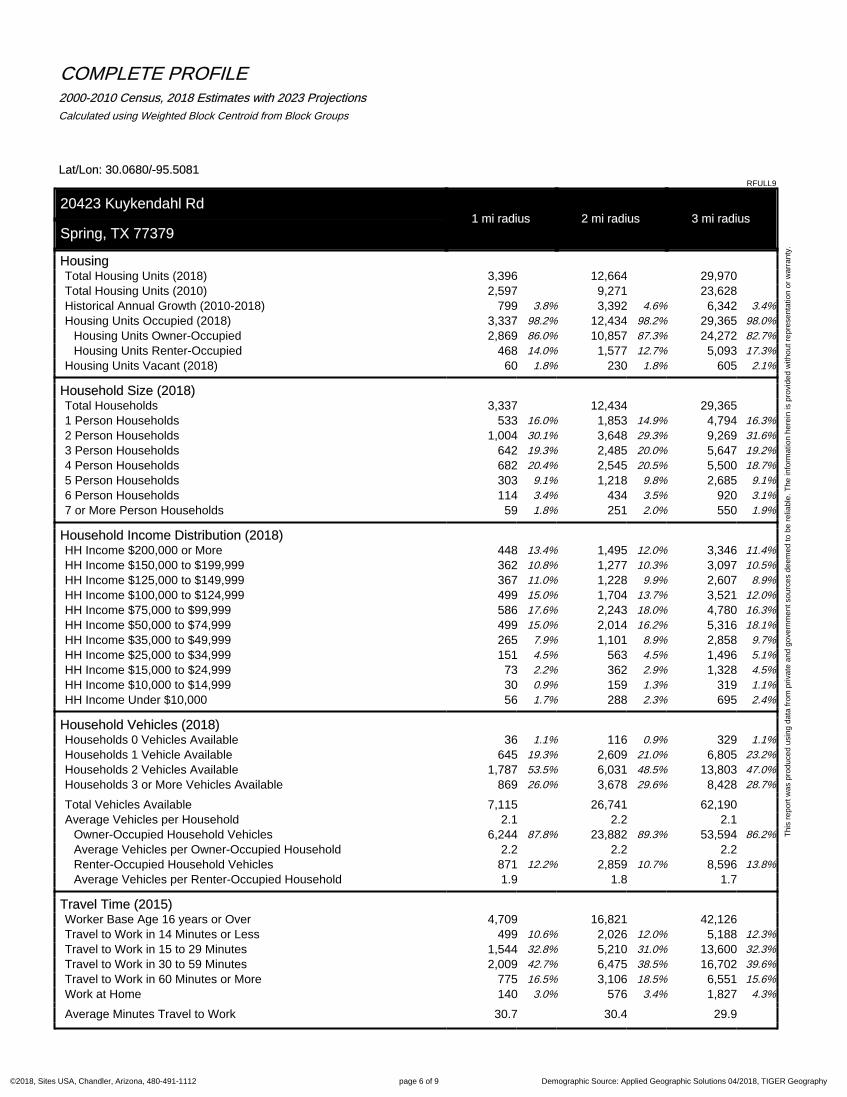
HousingTotal Housing Units (2018) 3,396 12,664 29,970Total Housing Units (2010) 2,597 9,271 23,628Historical Annual Growth (2010-2018) 799 3.8% 3,392 4.6% 6,342 3.4%
Housing Units Occupied (2018) 3,337 98.2% 12,434 98.2% 29,365 98.0%
Housing Units Owner-Occupied 2,869 86.0% 10,857 87.3% 24,272 82.7%
Housing Units Renter-Occupied 468 14.0% 1,577 12.7% 5,093 17.3%
Housing Units Vacant (2018) 60 1.8% 230 1.8% 605 2.1%
Household Size (2018)Total Households 3,337 12,434 29,3651 Person Households 533 16.0% 1,853 14.9% 4,794 16.3%
2 Person Households 1,004 30.1% 3,648 29.3% 9,269 31.6%
3 Person Households 642 19.3% 2,485 20.0% 5,647 19.2%
4 Person Households 682 20.4% 2,545 20.5% 5,500 18.7%
5 Person Households 303 9.1% 1,218 9.8% 2,685 9.1%
6 Person Households 114 3.4% 434 3.5% 920 3.1%
7 or More Person Households 59 1.8% 251 2.0% 550 1.9%
Household Income Distribution (2018)HH Income $200,000 or More 448 13.4% 1,495 12.0% 3,346 11.4%
HH Income $150,000 to $199,999 362 10.8% 1,277 10.3% 3,097 10.5%
HH Income $125,000 to $149,999 367 11.0% 1,228 9.9% 2,607 8.9%
HH Income $100,000 to $124,999 499 15.0% 1,704 13.7% 3,521 12.0%
HH Income $75,000 to $99,999 586 17.6% 2,243 18.0% 4,780 16.3%
HH Income $50,000 to $74,999 499 15.0% 2,014 16.2% 5,316 18.1%
HH Income $35,000 to $49,999 265 7.9% 1,101 8.9% 2,858 9.7%
HH Income $25,000 to $34,999 151 4.5% 563 4.5% 1,496 5.1%
HH Income $15,000 to $24,999 73 2.2% 362 2.9% 1,328 4.5%
HH Income $10,000 to $14,999 30 0.9% 159 1.3% 319 1.1%
HH Income Under $10,000 56 1.7% 288 2.3% 695 2.4%
Household Vehicles (2018)Households 0 Vehicles Available 36 1.1% 116 0.9% 329 1.1%
Households 1 Vehicle Available 645 19.3% 2,609 21.0% 6,805 23.2%
Households 2 Vehicles Available 1,787 53.5% 6,031 48.5% 13,803 47.0%
Households 3 or More Vehicles Available 869 26.0% 3,678 29.6% 8,428 28.7%
Total Vehicles Available 7,115 26,741 62,190Average Vehicles per Household 2.1 2.2 2.1
Owner-Occupied Household Vehicles 6,244 87.8% 23,882 89.3% 53,594 86.2%
Average Vehicles per Owner-Occupied Household 2.2 2.2 2.2Renter-Occupied Household Vehicles 871 12.2% 2,859 10.7% 8,596 13.8%
Average Vehicles per Renter-Occupied Household 1.9 1.8 1.7
Travel Time (2015)Worker Base Age 16 years or Over 4,709 16,821 42,126Travel to Work in 14 Minutes or Less 499 10.6% 2,026 12.0% 5,188 12.3%
Travel to Work in 15 to 29 Minutes 1,544 32.8% 5,210 31.0% 13,600 32.3%
Travel to Work in 30 to 59 Minutes 2,009 42.7% 6,475 38.5% 16,702 39.6%
Travel to Work in 60 Minutes or More 775 16.5% 3,106 18.5% 6,551 15.6%
Work at Home 140 3.0% 576 3.4% 1,827 4.3%
Average Minutes Travel to Work 30.7 30.4 29.9
Demographic Source: Applied Geographic Solutions 04/2018, TIGER Geography page 7 of 9©2018, Sites USA, Chandler, Arizona, 480-491-1112
Th
is r
ep
ort
wa
s p
rod
uce
d u
sin
g d
ata
fro
m p
riva
te a
nd
go
vern
me
nt
sou
rce
s d
ee
me
d t
o b
e r
elia
ble
. T
he
info
rma
tio
n h
ere
in is
pro
vid
ed
with
ou
t re
pre
sen
tatio
n o
r w
arr
an
ty.
COMPLETE PROFILE2000-2010 Census, 2018 Estimates with 2023 Projections
Calculated using Weighted Block Centroid from Block Groups
Lat/Lon: 30.0680/-95.5081RFULL9
20423 Kuykendahl Rd1 mi radius 2 mi radius 3 mi radius
Spring, TX 77379
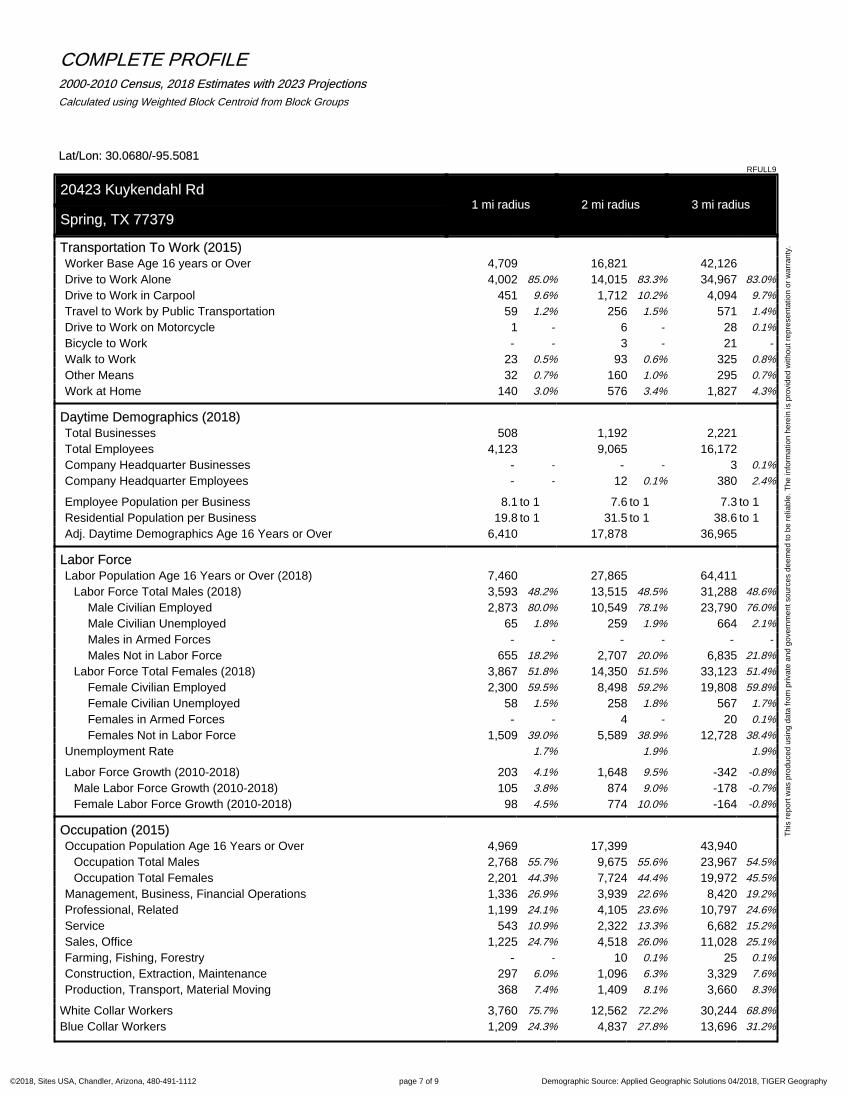
Transportation To Work (2015)Worker Base Age 16 years or Over 4,709 16,821 42,126
Drive to Work Alone 4,002 85.0% 14,015 83.3% 34,967 83.0%
Drive to Work in Carpool 451 9.6% 1,712 10.2% 4,094 9.7%
Travel to Work by Public Transportation 59 1.2% 256 1.5% 571 1.4%
Drive to Work on Motorcycle 1 - 6 - 28 0.1%
Bicycle to Work - - 3 - 21 -
Walk to Work 23 0.5% 93 0.6% 325 0.8%
Other Means 32 0.7% 160 1.0% 295 0.7%
Work at Home 140 3.0% 576 3.4% 1,827 4.3%
Daytime Demographics (2018)Total Businesses 508 1,192 2,221
Total Employees 4,123 9,065 16,172
Company Headquarter Businesses - - - - 3 0.1%
Company Headquarter Employees - - 12 0.1% 380 2.4%
Employee Population per Business 8.1 to 1 7.6 to 1 7.3 to 1
Residential Population per Business 19.8 to 1 31.5 to 1 38.6 to 1
Adj. Daytime Demographics Age 16 Years or Over 6,410 17,878 36,965
Labor ForceLabor Population Age 16 Years or Over (2018) 7,460 27,865 64,411
Labor Force Total Males (2018) 3,593 48.2% 13,515 48.5% 31,288 48.6%
Male Civilian Employed 2,873 80.0% 10,549 78.1% 23,790 76.0%
Male Civilian Unemployed 65 1.8% 259 1.9% 664 2.1%
Males in Armed Forces - - - - - -
Males Not in Labor Force 655 18.2% 2,707 20.0% 6,835 21.8%
Labor Force Total Females (2018) 3,867 51.8% 14,350 51.5% 33,123 51.4%
Female Civilian Employed 2,300 59.5% 8,498 59.2% 19,808 59.8%
Female Civilian Unemployed 58 1.5% 258 1.8% 567 1.7%
Females in Armed Forces - - 4 - 20 0.1%
Females Not in Labor Force 1,509 39.0% 5,589 38.9% 12,728 38.4%
Unemployment Rate 3,593 1.7% 13,515 1.9% 31,288 1.9%
Labor Force Growth (2010-2018) 203 4.1% 1,648 9.5% -342 -0.8%
Male Labor Force Growth (2010-2018) 105 3.8% 874 9.0% -178 -0.7%
Female Labor Force Growth (2010-2018) 98 4.5% 774 10.0% -164 -0.8%
Occupation (2015)Occupation Population Age 16 Years or Over 4,969 17,399 43,940
Occupation Total Males 2,768 55.7% 9,675 55.6% 23,967 54.5%
Occupation Total Females 2,201 44.3% 7,724 44.4% 19,972 45.5%
Management, Business, Financial Operations 1,336 26.9% 3,939 22.6% 8,420 19.2%
Professional, Related 1,199 24.1% 4,105 23.6% 10,797 24.6%
Service 543 10.9% 2,322 13.3% 6,682 15.2%
Sales, Office 1,225 24.7% 4,518 26.0% 11,028 25.1%
Farming, Fishing, Forestry - - 10 0.1% 25 0.1%
Construction, Extraction, Maintenance 297 6.0% 1,096 6.3% 3,329 7.6%
Production, Transport, Material Moving 368 7.4% 1,409 8.1% 3,660 8.3%
White Collar Workers 3,760 75.7% 12,562 72.2% 30,244 68.8%
Blue Collar Workers 1,209 24.3% 4,837 27.8% 13,696 31.2%
Demographic Source: Applied Geographic Solutions 04/2018, TIGER Geography page 8 of 9©2018, Sites USA, Chandler, Arizona, 480-491-1112
Th
is r
ep
ort
wa
s p
rod
uce
d u
sin
g d
ata
fro
m p
riva
te a
nd
go
vern
me
nt
sou
rce
s d
ee
me
d t
o b
e r
elia
ble
. T
he
info
rma
tio
n h
ere
in is
pro
vid
ed
with
ou
t re
pre
sen
tatio
n o
r w
arr
an
ty.
COMPLETE PROFILE2000-2010 Census, 2018 Estimates with 2023 Projections
Calculated using Weighted Block Centroid from Block Groups
Lat/Lon: 30.0680/-95.5081RFULL9
20423 Kuykendahl Rd1 mi radius 2 mi radius 3 mi radius
Spring, TX 77379
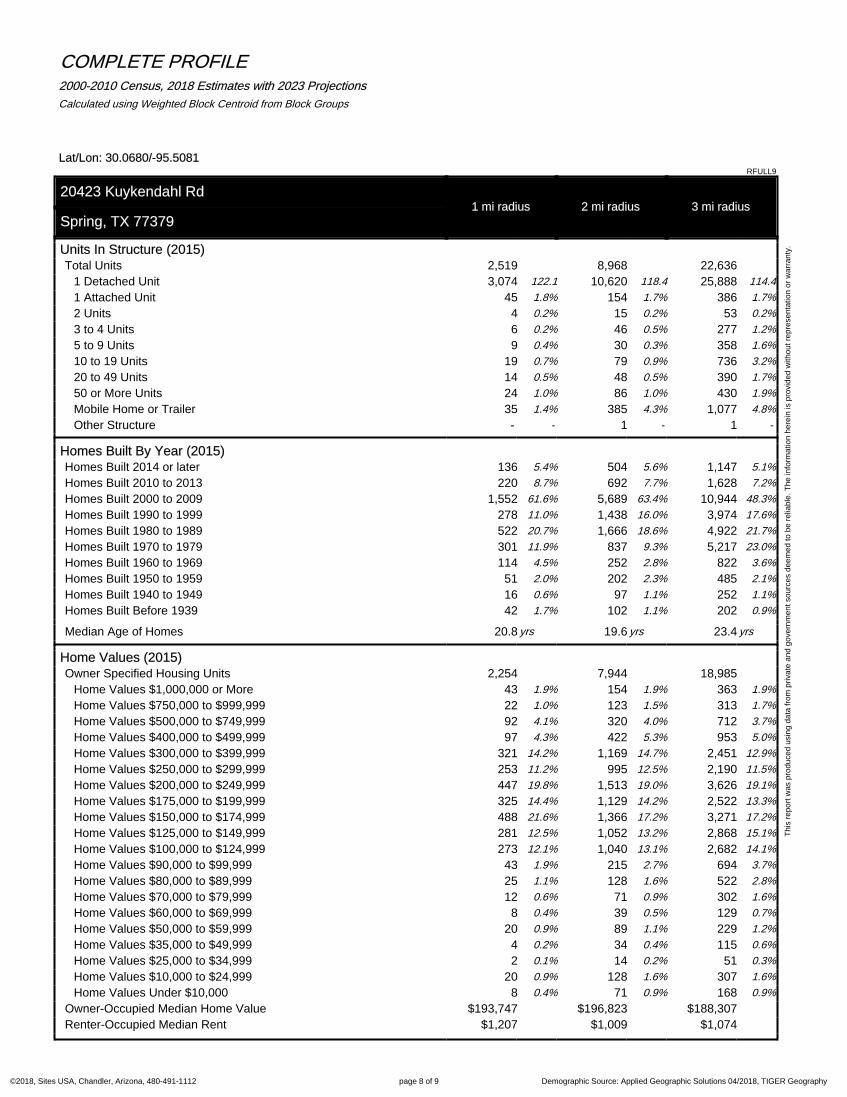
Units In Structure (2015)Total Units 2,519 8,968 22,636
1 Detached Unit 3,074 122.1 10,620 118.4 25,888 114.4
1 Attached Unit 45 1.8% 154 1.7% 386 1.7%
2 Units 4 0.2% 15 0.2% 53 0.2%
3 to 4 Units 6 0.2% 46 0.5% 277 1.2%
5 to 9 Units 9 0.4% 30 0.3% 358 1.6%
10 to 19 Units 19 0.7% 79 0.9% 736 3.2%
20 to 49 Units 14 0.5% 48 0.5% 390 1.7%
50 or More Units 24 1.0% 86 1.0% 430 1.9%
Mobile Home or Trailer 35 1.4% 385 4.3% 1,077 4.8%
Other Structure - - 1 - 1 -
Homes Built By Year (2015)Homes Built 2014 or later 136 5.4% 504 5.6% 1,147 5.1%
Homes Built 2010 to 2013 220 8.7% 692 7.7% 1,628 7.2%
Homes Built 2000 to 2009 1,552 61.6% 5,689 63.4% 10,944 48.3%
Homes Built 1990 to 1999 278 11.0% 1,438 16.0% 3,974 17.6%
Homes Built 1980 to 1989 522 20.7% 1,666 18.6% 4,922 21.7%
Homes Built 1970 to 1979 301 11.9% 837 9.3% 5,217 23.0%
Homes Built 1960 to 1969 114 4.5% 252 2.8% 822 3.6%
Homes Built 1950 to 1959 51 2.0% 202 2.3% 485 2.1%
Homes Built 1940 to 1949 16 0.6% 97 1.1% 252 1.1%
Homes Built Before 1939 42 1.7% 102 1.1% 202 0.9%
Median Age of Homes 20.8 yrs 19.6 yrs 23.4 yrs
Home Values (2015)Owner Specified Housing Units 2,254 7,944 18,985
Home Values $1,000,000 or More 43 1.9% 154 1.9% 363 1.9%
Home Values $750,000 to $999,999 22 1.0% 123 1.5% 313 1.7%
Home Values $500,000 to $749,999 92 4.1% 320 4.0% 712 3.7%
Home Values $400,000 to $499,999 97 4.3% 422 5.3% 953 5.0%
Home Values $300,000 to $399,999 321 14.2% 1,169 14.7% 2,451 12.9%
Home Values $250,000 to $299,999 253 11.2% 995 12.5% 2,190 11.5%
Home Values $200,000 to $249,999 447 19.8% 1,513 19.0% 3,626 19.1%
Home Values $175,000 to $199,999 325 14.4% 1,129 14.2% 2,522 13.3%
Home Values $150,000 to $174,999 488 21.6% 1,366 17.2% 3,271 17.2%
Home Values $125,000 to $149,999 281 12.5% 1,052 13.2% 2,868 15.1%
Home Values $100,000 to $124,999 273 12.1% 1,040 13.1% 2,682 14.1%
Home Values $90,000 to $99,999 43 1.9% 215 2.7% 694 3.7%
Home Values $80,000 to $89,999 25 1.1% 128 1.6% 522 2.8%
Home Values $70,000 to $79,999 12 0.6% 71 0.9% 302 1.6%
Home Values $60,000 to $69,999 8 0.4% 39 0.5% 129 0.7%
Home Values $50,000 to $59,999 20 0.9% 89 1.1% 229 1.2%
Home Values $35,000 to $49,999 4 0.2% 34 0.4% 115 0.6%
Home Values $25,000 to $34,999 2 0.1% 14 0.2% 51 0.3%
Home Values $10,000 to $24,999 20 0.9% 128 1.6% 307 1.6%
Home Values Under $10,000 8 0.4% 71 0.9% 168 0.9%
Owner-Occupied Median Home Value $193,747 $196,823 $188,307
Renter-Occupied Median Rent $1,207 $1,009 $1,074
Demographic Source: Applied Geographic Solutions 04/2018, TIGER Geography page 9 of 9©2018, Sites USA, Chandler, Arizona, 480-491-1112
Th
is r
ep
ort
wa
s p
rod
uce
d u
sin
g d
ata
fro
m p
riva
te a
nd
go
vern
me
nt
sou
rce
s d
ee
me
d t
o b
e r
elia
ble
. T
he
info
rma
tio
n h
ere
in is
pro
vid
ed
with
ou
t re
pre
sen
tatio
n o
r w
arr
an
ty.
COMPLETE PROFILE2000-2010 Census, 2018 Estimates with 2023 Projections
Calculated using Weighted Block Centroid from Block Groups
Lat/Lon: 30.0680/-95.5081RFULL9
20423 Kuykendahl Rd1 mi radius 2 mi radius 3 mi radius
Spring, TX 77379
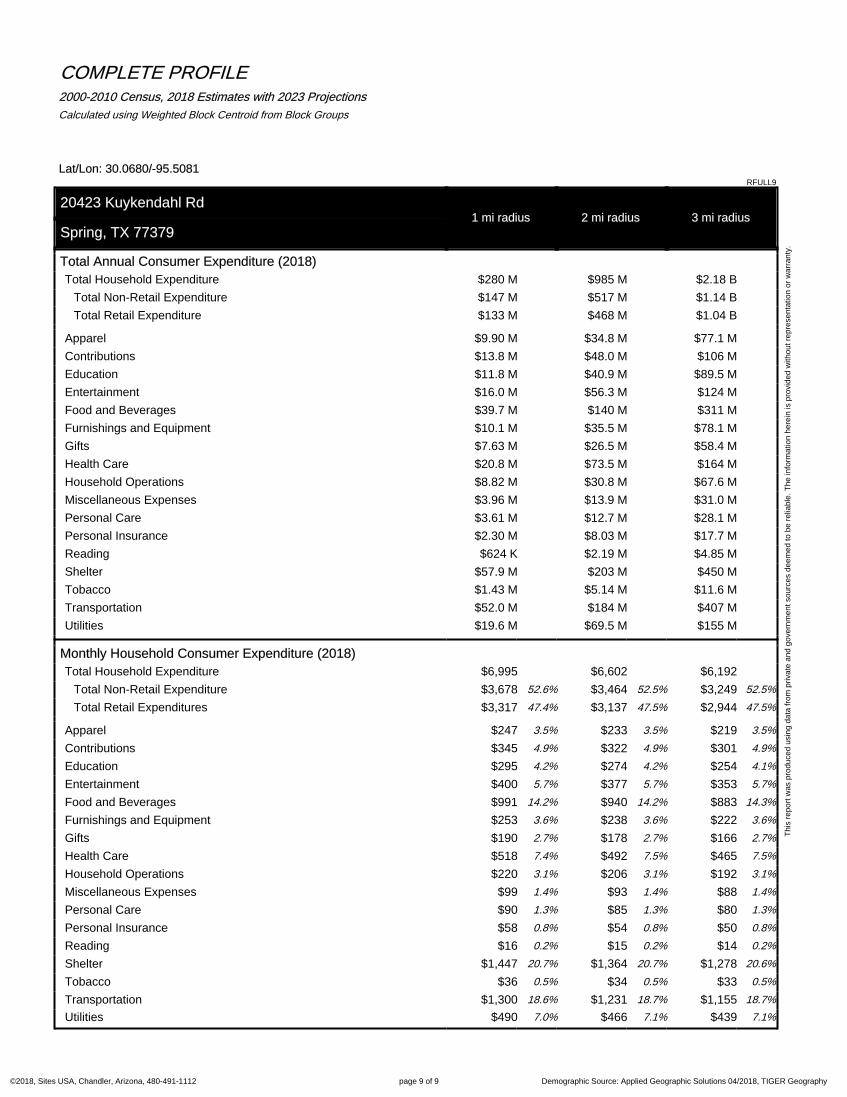
Total Annual Consumer Expenditure (2018)
Total Household Expenditure $280 M $985 M $2.18 B
Total Non-Retail Expenditure $147 M $517 M $1.14 B
Total Retail Expenditure $133 M $468 M $1.04 B
Apparel $9.90 M $34.8 M $77.1 M
Contributions $13.8 M $48.0 M $106 M
Education $11.8 M $40.9 M $89.5 M
Entertainment $16.0 M $56.3 M $124 M
Food and Beverages $39.7 M $140 M $311 M
Furnishings and Equipment $10.1 M $35.5 M $78.1 M
Gifts $7.63 M $26.5 M $58.4 M
Health Care $20.8 M $73.5 M $164 M
Household Operations $8.82 M $30.8 M $67.6 M
Miscellaneous Expenses $3.96 M $13.9 M $31.0 M
Personal Care $3.61 M $12.7 M $28.1 M
Personal Insurance $2.30 M $8.03 M $17.7 M
Reading $624 K $2.19 M $4.85 M
Shelter $57.9 M $203 M $450 M
Tobacco $1.43 M $5.14 M $11.6 M
Transportation $52.0 M $184 M $407 M
Utilities $19.6 M $69.5 M $155 M
Monthly Household Consumer Expenditure (2018)
Total Household Expenditure $6,995 $6,602 $6,192
Total Non-Retail Expenditure $3,678 52.6% $3,464 52.5% $3,249 52.5%
Total Retail Expenditures $3,317 47.4% $3,137 47.5% $2,944 47.5%
Apparel $247 3.5% $233 3.5% $219 3.5%
Contributions $345 4.9% $322 4.9% $301 4.9%
Education $295 4.2% $274 4.2% $254 4.1%
Entertainment $400 5.7% $377 5.7% $353 5.7%
Food and Beverages $991 14.2% $940 14.2% $883 14.3%
Furnishings and Equipment $253 3.6% $238 3.6% $222 3.6%
Gifts $190 2.7% $178 2.7% $166 2.7%
Health Care $518 7.4% $492 7.5% $465 7.5%
Household Operations $220 3.1% $206 3.1% $192 3.1%
Miscellaneous Expenses $99 1.4% $93 1.4% $88 1.4%
Personal Care $90 1.3% $85 1.3% $80 1.3%
Personal Insurance $58 0.8% $54 0.8% $50 0.8%
Reading $16 0.2% $15 0.2% $14 0.2%
Shelter $1,447 20.7% $1,364 20.7% $1,278 20.6%
Tobacco $36 0.5% $34 0.5% $33 0.5%
Transportation $1,300 18.6% $1,231 18.7% $1,155 18.7%
Utilities $490 7.0% $466 7.1% $439 7.1%
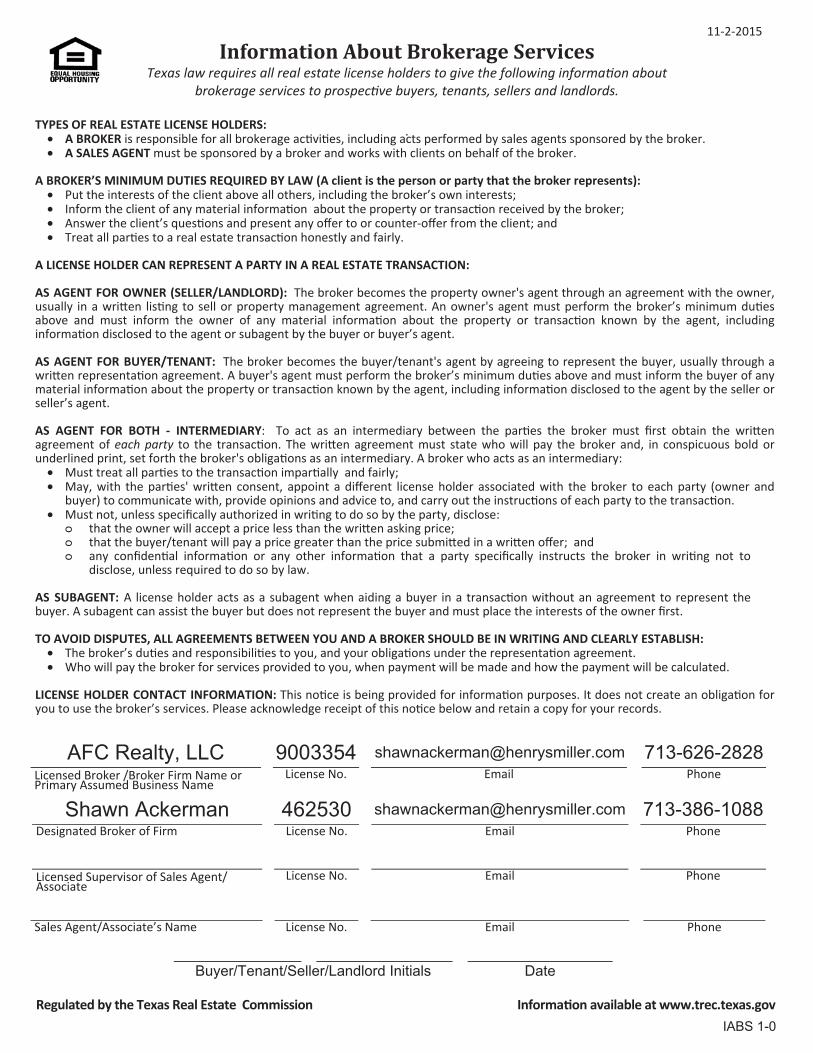
11-2-2015
Information About Brokerage ServicesTexas law requires all real estate license holders to give the following informa on about
brokerage services to prospec ve buyers, tenants, sellers and landlords.
TYPES OF REAL ESTATE LICENSE HOLDERS: .
• A BROKER is responsible for all brokerage ac vi es, including acts performed by sales agents sponsored by the broker. • A SALES AGENT must be sponsored by a broker and works with clients on behalf of the broker.
A BROKER’S MINIMUM DUTIES REQUIRED BY LAW (A client is the person or party that the broker represents): • Put the interests of the client above all others, including the broker’s own interests; • Inform the client of any material informa on about the property or transac on received by the broker; • Answer the client’s ques ons and present any o er to or counter-o er from the client; and • Treat all par es to a real estate transac on honestly and fairly.
A LICENSE HOLDER CAN REPRESENT A PARTY IN A REAL ESTATE TRANSACTION:
AS AGENT FOR OWNER (SELLER/LANDLORD): The broker becomes the property owner's agent through an agreement with the owner, usually in a wri en lis ng to sell or property management agreement. An owner's agent must perform the broker’s minimum du es above and must inform the owner of any material informa on about the property or transac on known by the agent, including informa on disclosed to the agent or subagent by the buyer or buyer’s agent.
AS AGENT FOR BUYER/TENANT: The broker becomes the buyer/tenant's agent by agreeing to represent the buyer, usually through a wri en representa on agreement. A buyer's agent must perform the broker’s minimum du es above and must inform the buyer of any material informa on about the property or transac on known by the agent, including informa on disclosed to the agent by the seller or seller’s agent.
AS AGENT FOR BOTH - INTERMEDIARY: To act as an intermediary between the par es the broker must Þrst obtain the wri en agreement of each party to the transac on. The wri en agreement must state who will pay the broker and, in conspicuous bold or underlined print, set forth the broker's obliga ons as an intermediary. A broker who acts as an intermediary:
• Must treat all par es to the transac on impar ally and fairly; • May, with the par es' wri en consent, appoint a di erent license holder associated with the broker to each party (owner and
buyer) to communicate with, provide opinions and advice to, and carry out the instruc ons of each party to the transac on. • Must not, unless speciÞcally authorized in wri ng to do so by the party, disclose:
that the owner will accept a price less than the wri en asking price; that the buyer/tenant will pay a price greater than the price submi ed in a wri en o er; and any conÞden al informa on or any other informa on that a party speciÞcally instructs the broker in wri ng not to disclose, unless required to do so by law.
AS SUBAGENT: A license holder acts as a subagent when aiding a buyer in a transac on without an agreement to represent the buyer. A subagent can assist the buyer but does not represent the buyer and must place the interests of the owner Þrst.
TO AVOID DISPUTES, ALL AGREEMENTS BETWEEN YOU AND A BROKER SHOULD BE IN WRITING AND CLEARLY ESTABLISH: • The broker’s du es and responsibili es to you, and your obliga ons under the representa on agreement. • Who will pay the broker for services provided to you, when payment will be made and how the payment will be calculated.
LICENSE HOLDER CONTACT INFORMATION: This no ce is being provided for informa on purposes. It does not create an obliga on for you to use the broker’s services. Please acknowledge receipt of this no ce below and retain a copy for your records.
Licensed Broker /Broker Firm Name or Primary Assumed Business Name
License No. Email Phone
Designated Broker of Firm License No. Email Phone
Licensed Supervisor of Sales Agent/Associate
License No. Email Phone
Sales Agent/Associate’s Name License No. Email Phone
Regulated by the Texas Real Estate Commission
Buyer/Tenant/Seller/Landlord Initials
Informa on available at www.trec.texas.gov
IABS 1-0
Date
AFC Realty, LLC 9003354 [email protected] 713-626-2828
Shawn Ackerman 462530 [email protected] 713-386-1088