Windows7 Upgrade Instructions
12
Dardik, I., Branover, H., El-Boher, A., Gazit, D., Golbreich, E., Greenspan, E., Kapusta, A., Khachatorov, B., Krakov, V., Lesin, S., Michailovitch, B., Shani, G., Zilov, T. Intensification Of Low Energy Nuclear Reactions Using Superwave Excitation. in Tenth International Conference on Cold Fusion. 2003. Cambridge, MA: LENR- CANR.org. This paper was presented at the 10th International Conference on Cold Fusion. It may be different from the version published by World Scientific, Inc (2003) in the official Proceedings of the conference. Intensification Of Low Energy Nuclear Reactions Using Superwave Excitation I. Dardik, H. Branover, A. El-Boher, D. Gazit, E. Golbreich, E. Greenspan # , A. Kapusta, B. Khachatorov, V. Krakov, S. Lesin, B. Michailovitch, G. Shani # And T. Zilov Energetics Technologies P.O.Box 3026 Omer Industrial Park Omer, Israel E-mail: [email protected] Energetics Technologies (ET) was recently established to investigate possibilities for inducing Low Energy Nuclear Reactions (LENR) using special wave excitation. Four experimental approaches are being pursued: electrolysis, glow- discharge, gas loading in catalyst cells and high-pressure high-temperature cell with ultrasonic wave excitation. The experimental setups developed by ET are described along with preliminary results obtained. A significant amount of excess heat was measured in the first glow discharge experiment. The power generated during the experiment was up to 3.9 times the input power. When driven with waves the excess heat was higher than when driven with DC. A significant amount of excess heat was also measured after the shutdown of the glow discharge; it lasted for approximately 10 hours. The total excess energy generated is estimated to be 6.7 times the input energy. The “heat- after-death” phenomenon was also observed in another glow discharge experiment. Excess heat up to approximately 80% was measured over a period of over 3 months in yet another glow discharge experiment. Driving the electrolytic cells with waves resulted in a faster loading than when driving them with DC of the same average current. The tritium concentration in the electrolyte measured at the end of the experiments was found to be up to more than 100% the pre- experiment level. No excess heat was measured, so far, in the catalyst cells. Successful loading of Pd target with D was obtained in the high-pressure high-temperature gas cell without going through the α+β phase of the Pd-D system. 1 Introduction Energetics Technologies (ET) was recently established to investigate possibilities for generating energy from Low Energy Nuclear Reactions (LENR) using a new approach of wave excitation. The new approach involves use of so-called “waves-waving-waves” or Superwaves for driving the processes that generate LENR. Four experimental approaches are being pursued: electrolysis (EC), glow-discharge (GD), gas loading in catalyst cells (CC) and high-pressure high-temperature cell (HPTC) with ultrasonic wave excitation. Variants of these approaches have been experimented with since the first disclosure by Pons and Fleischmann of cold fusion in electrolytic cells [1]. A review of the different approaches tried for attainment of cold fusion and of the experiments performed can be found in many publications such as references [2,3]. Among the approaches proposed and tried, in addition to electrolytic cells, [1] are glow-discharge cells [4], catalysis cells [5], electrolysis in high-pressure high-temperature cells [6] and ultrasonic excitation cells [7]. The experimental setups of ET have a number of novel features and the use of superwaves is a novel mode of
Transcript of Windows7 Upgrade Instructions
Dardik, I., Branover, H., El-Boher, A., Gazit, D., Golbreich, E., Greenspan, E., Kapusta, A., Khachatorov, B., Krakov, V., Lesin, S., Michailovitch, B., Shani, G., Zilov, T. Intensification Of Low Energy Nuclear Reactions Using Superwave Excitation. in Tenth International Conference on Cold Fusion. 2003. Cambridge, MA: LENR-CANR.org. This paper was presented at the 10th International Conference on Cold Fusion. It may be different from the version published by World Scientific, Inc (2003) in the official Proceedings of the conference.
Intensification Of Low Energy Nuclear Reactions Using Superwave
Excitation
I. Dardik, H. Branover, A. El-Boher, D. Gazit, E. Golbreich, E. Greenspan#, A. Kapusta, B. Khachatorov, V. Krakov, S. Lesin, B. Michailovitch, G. Shani# And T. Zilov
Energetics Technologies P.O.Box 3026
Omer Industrial Park Omer, Israel
E-mail: [email protected]
Energetics Technologies (ET) was recently established to investigate possibilities for inducing Low Energy Nuclear Reactions (LENR) using special wave excitation. Four experimental approaches are being pursued: electrolysis, glow-discharge, gas loading in catalyst cells and high-pressure high-temperature cell with ultrasonic wave excitation. The experimental setups developed by ET are described along with preliminary results obtained. A significant amount of excess heat was measured in the first glow discharge experiment. The power generated during the experiment was up to 3.9 times the input power. When driven with waves the excess heat was higher than when driven with DC. A significant amount of excess heat was also measured after the shutdown of the glow discharge; it lasted for approximately 10 hours. The total excess energy generated is estimated to be 6.7 times the input energy. The “heat-after-death” phenomenon was also observed in another glow discharge experiment. Excess heat up to approximately 80% was measured over a period of over 3 months in yet another glow discharge experiment. Driving the electrolytic cells with waves resulted in a faster loading than when driving them with DC of the same average current. The tritium concentration in the electrolyte measured at the end of the experiments was found to be up to more than 100% the pre-experiment level. No excess heat was measured, so far, in the catalyst cells. Successful loading of Pd target with D was obtained in the high-pressure high-temperature gas cell without going through the α+β phase of the Pd-D system.
1 Introduction Energetics Technologies (ET) was recently established to investigate possibilities for generating energy from Low Energy Nuclear Reactions (LENR) using a new approach of wave excitation. The new approach involves use of so-called “waves-waving-waves” or Superwaves for driving the processes that generate LENR.
Four experimental approaches are being pursued: electrolysis (EC), glow-discharge (GD), gas loading in catalyst cells (CC) and high-pressure high-temperature cell (HPTC) with ultrasonic wave excitation. Variants of these approaches have been experimented with since the first disclosure by Pons and Fleischmann of cold fusion in electrolytic cells [1]. A review of the different approaches tried for attainment of cold fusion and of the experiments performed can be found in many publications such as references [2,3]. Among the approaches proposed and tried, in addition to electrolytic cells, [1] are glow-discharge cells [4], catalysis cells [5], electrolysis in high-pressure high-temperature cells [6] and ultrasonic excitation cells [7]. The experimental setups of ET have a number of novel features and the use of superwaves is a novel mode of
operation. A number of experiments, such as that reported in [8], used much simpler modulation, in the form of square waves, to drive electrolytic cell experiments.
The purpose of this paper is to describe the experimental systems designed and constructed by ET and to report upon preliminary results obtained.
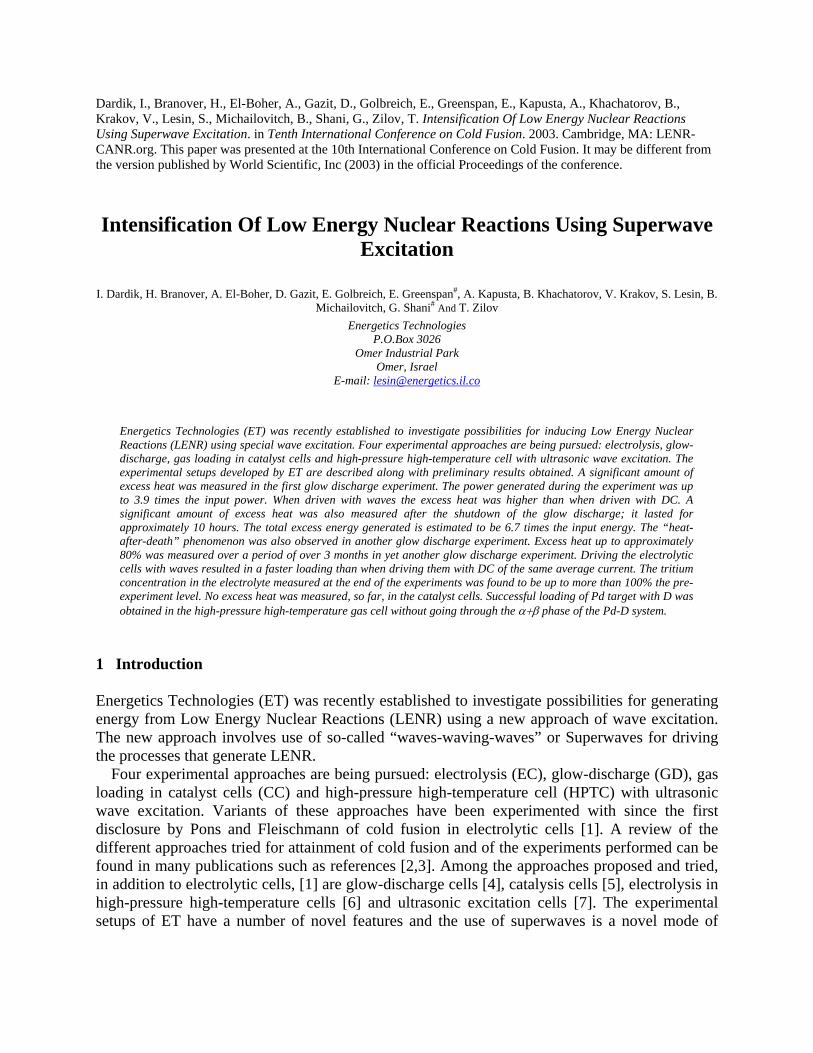
2 Superwaves The idea of Superwaves for enhancing the probability of LENR was first proposed by Dr. Irving I. Dardik. The waves waving waves are a special modulation of several waves of different frequency and amplitude.
Figure 1 illustrates the type of Superwaves being used in the ET experiments. This wave has a fundamental mode, F0(t), on top of which two higher frequency modes – F1(t) and F2(t), are superimposed. An illustration of a more realistic wave used in the ET experiments is given in Figure 8 below.
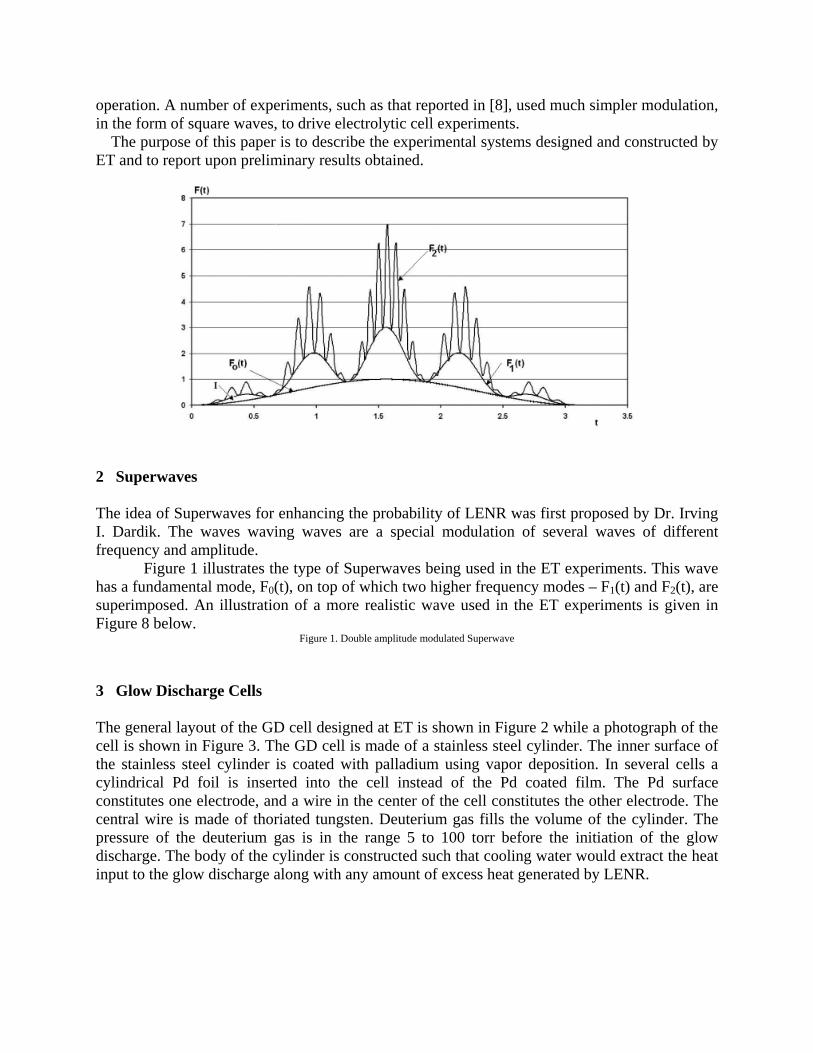
Figure 1. Double amplitude modulated Superwave 3 Glow Discharge Cells The general layout of the GD cell designed at ET is shown in Figure 2 while a photograph of the cell is shown in Figure 3. The GD cell is made of a stainless steel cylinder. The inner surface of the stainless steel cylinder is coated with palladium using vapor deposition. In several cells a cylindrical Pd foil is inserted into the cell instead of the Pd coated film. The Pd surface constitutes one electrode, and a wire in the center of the cell constitutes the other electrode. The central wire is made of thoriated tungsten. Deuterium gas fills the volume of the cylinder. The pressure of the deuterium gas is in the range 5 to 100 torr before the initiation of the glow discharge. The body of the cylinder is constructed such that cooling water would extract the heat input to the glow discharge along with any amount of excess heat generated by LENR.
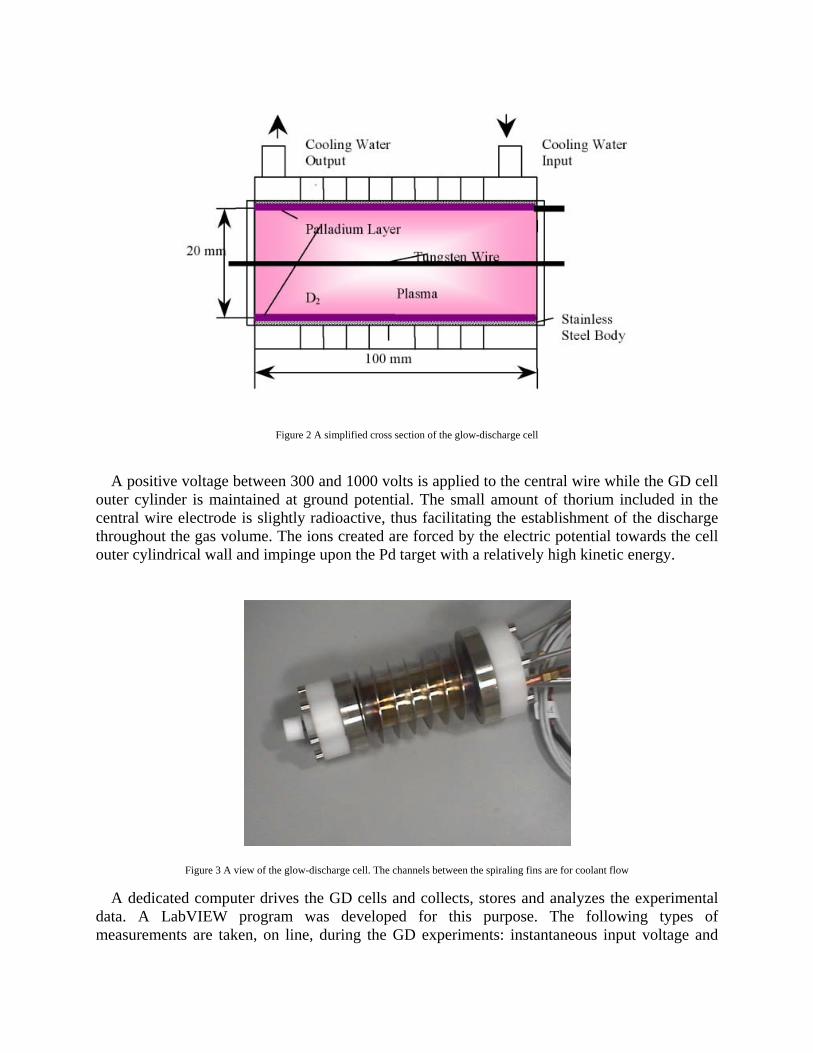
Figure 2 A simplified cross section of the glow-discharge cell
A positive voltage between 300 and 1000 volts is applied to the central wire while the GD cell outer cylinder is maintained at ground potential. The small amount of thorium included in the central wire electrode is slightly radioactive, thus facilitating the establishment of the discharge throughout the gas volume. The ions created are forced by the electric potential towards the cell outer cylindrical wall and impinge upon the Pd target with a relatively high kinetic energy.
Figure 3 A view of the glow-discharge cell. The channels between the spiraling fins are for coolant flow
A dedicated computer drives the GD cells and collects, stores and analyzes the experimental
data. A LabVIEW program was developed for this purpose. The following types of measurements are taken, on line, during the GD experiments: instantaneous input voltage and
electric current, water inlet and outlet temperature, water mass flow rate, gas pressure in the cell, the ambient, gas and cell wall temperatures, and the gas flow rate. The output power is proportional to the water mass flow rate times the water outlet minus inlet temperatures. The input power is calculated as the product of the instantaneous voltage and current at a rate of 50,000 scans per second. The computer also time averages the input power and integrates the instantaneous power to give the accumulated amount of energy invested in the GD cell. The computer power and energy calculations were checked against a precision power meter and found to be accurate.
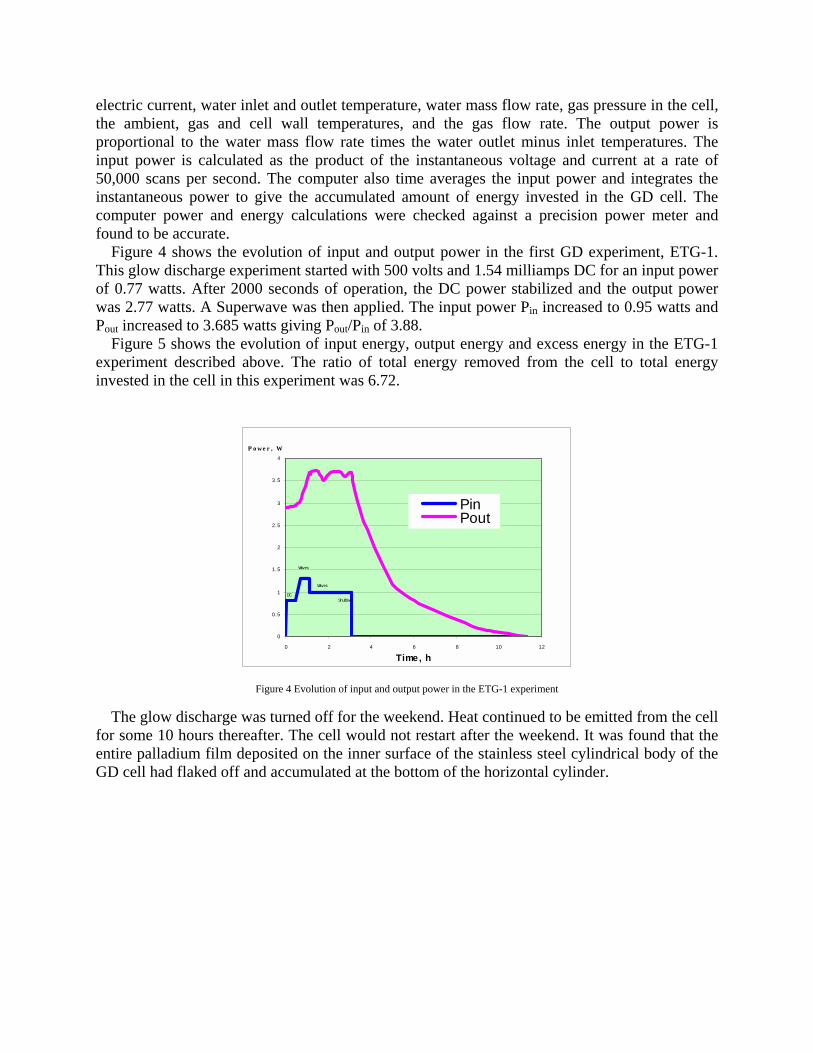
Figure 4 shows the evolution of input and output power in the first GD experiment, ETG-1. This glow discharge experiment started with 500 volts and 1.54 milliamps DC for an input power of 0.77 watts. After 2000 seconds of operation, the DC power stabilized and the output power was 2.77 watts. A Superwave was then applied. The input power Pin increased to 0.95 watts and Pout increased to 3.685 watts giving Pout/Pin of 3.88.
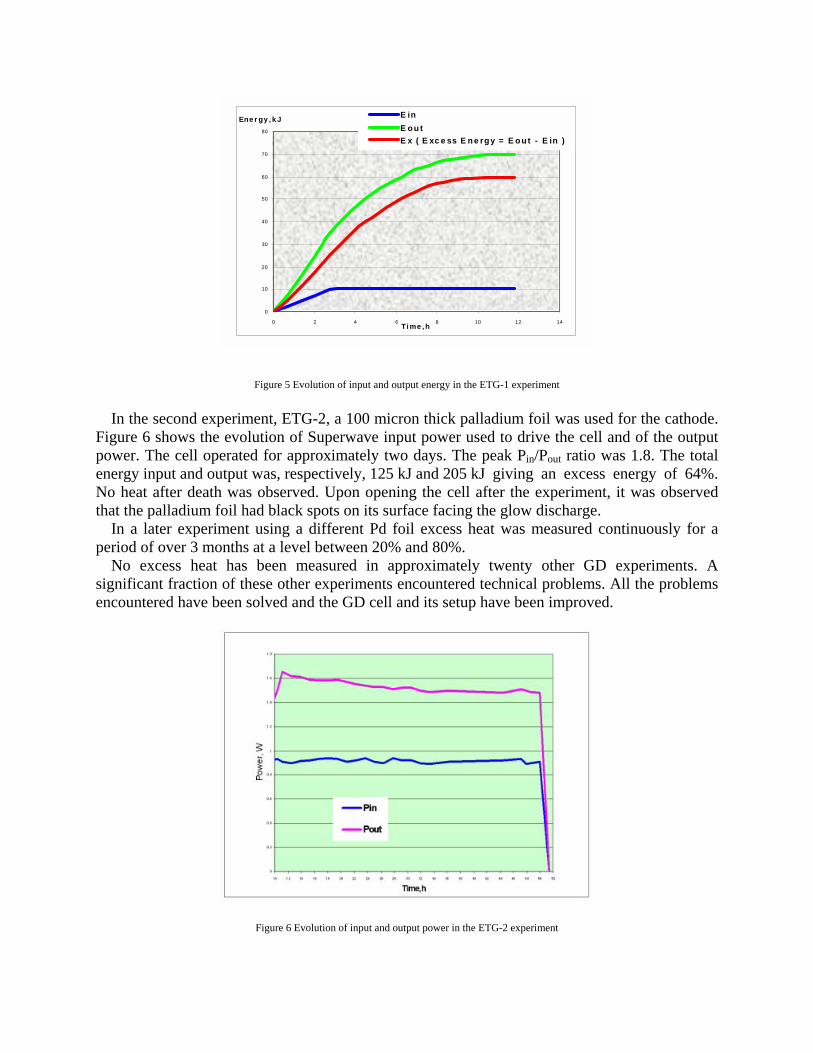
Figure 5 shows the evolution of input energy, output energy and excess energy in the ETG-1 experiment described above. The ratio of total energy removed from the cell to total energy invested in the cell in this experiment was 6.72.
0
0.5
1
1.5
2
2.5
3
3.5
4
0 2 4 6 8 10 12
Time, h
P o we r , W
PinPout
DC
Waves
Waves
Shut Down
Figure 4 Evolution of input and output power in the ETG-1 experiment
The glow discharge was turned off for the weekend. Heat continued to be emitted from the cell for some 10 hours thereafter. The cell would not restart after the weekend. It was found that the entire palladium film deposited on the inner surface of the stainless steel cylindrical body of the GD cell had flaked off and accumulated at the bottom of the horizontal cylinder.
0
10
20
30
40
50
60
70
80
0 2 4 6 8 10 12 14Ti me , h
Ene r gy , k J E inE o u tE x ( E xc e ss E n e rg y = E o u t - E in )
Figure 5 Evolution of input and output energy in the ETG-1 experiment
In the second experiment, ETG-2, a 100 micron thick palladium foil was used for the cathode.
Figure 6 shows the evolution of Superwave input power used to drive the cell and of the output power. The cell operated for approximately two days. The peak Pin/Pout ratio was 1.8. The total energy input and output was, respectively, 125 kJ and 205 k J giving an excess energy of 64%. No heat after death was observed. Upon opening the cell after the experiment, it was observed that the palladium foil had black spots on its surface facing the glow discharge.
In a later experiment using a different Pd foil excess heat was measured continuously for a period of over 3 months at a level between 20% and 80%.
No excess heat has been measured in approximately twenty other GD experiments. A significant fraction of these other experiments encountered technical problems. All the problems encountered have been solved and the GD cell and its setup have been improved.
Figure 6 Evolution of input and output power in the ETG-2 experiment
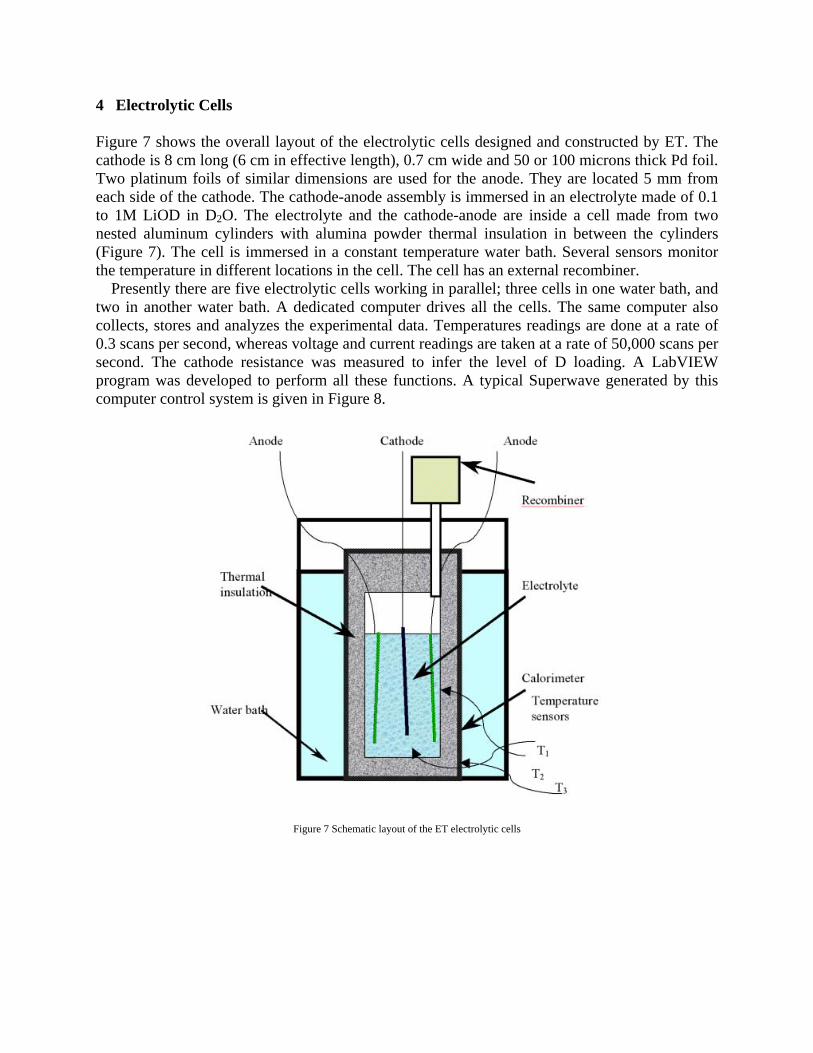
4 Electrolytic Cells Figure 7 shows the overall layout of the electrolytic cells designed and constructed by ET. The cathode is 8 cm long (6 cm in effective length), 0.7 cm wide and 50 or 100 microns thick Pd foil. Two platinum foils of similar dimensions are used for the anode. They are located 5 mm from each side of the cathode. The cathode-anode assembly is immersed in an electrolyte made of 0.1 to 1M LiOD in D2O. The electrolyte and the cathode-anode are inside a cell made from two nested aluminum cylinders with alumina powder thermal insulation in between the cylinders (Figure 7). The cell is immersed in a constant temperature water bath. Several sensors monitor the temperature in different locations in the cell. The cell has an external recombiner.
Presently there are five electrolytic cells working in parallel; three cells in one water bath, and two in another water bath. A dedicated computer drives all the cells. The same computer also collects, stores and analyzes the experimental data. Temperatures readings are done at a rate of 0.3 scans per second, whereas voltage and current readings are taken at a rate of 50,000 scans per second. The cathode resistance was measured to infer the level of D loading. A LabVIEW program was developed to perform all these functions. A typical Superwave generated by this computer control system is given in Figure 8.
Figure 7 Schematic layout of the ET electrolytic cells
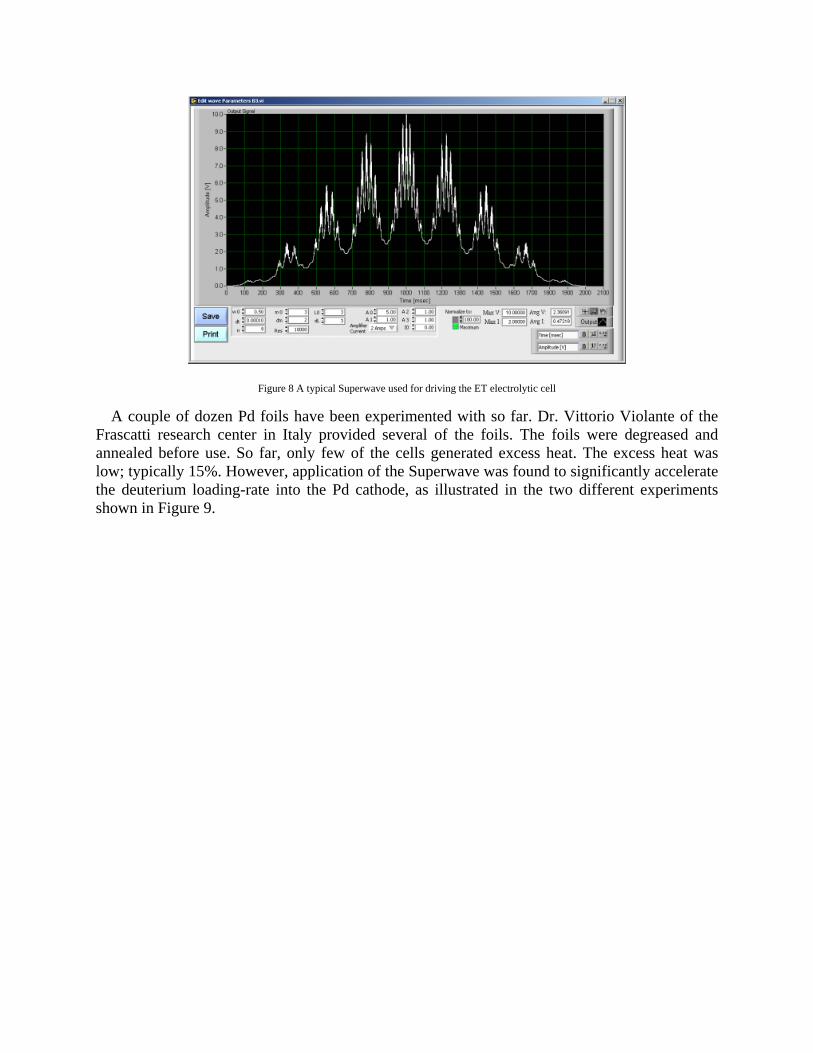
Figure 8 A typical Superwave used for driving the ET electrolytic cell
A couple of dozen Pd foils have been experimented with so far. Dr. Vittorio Violante of the
Frascatti research center in Italy provided several of the foils. The foils were degreased and annealed before use. So far, only few of the cells generated excess heat. The excess heat was low; typically 15%. However, application of the Superwave was found to significantly accelerate the deuterium loading-rate into the Pd cathode, as illustrated in the two different experiments shown in Figure 9.
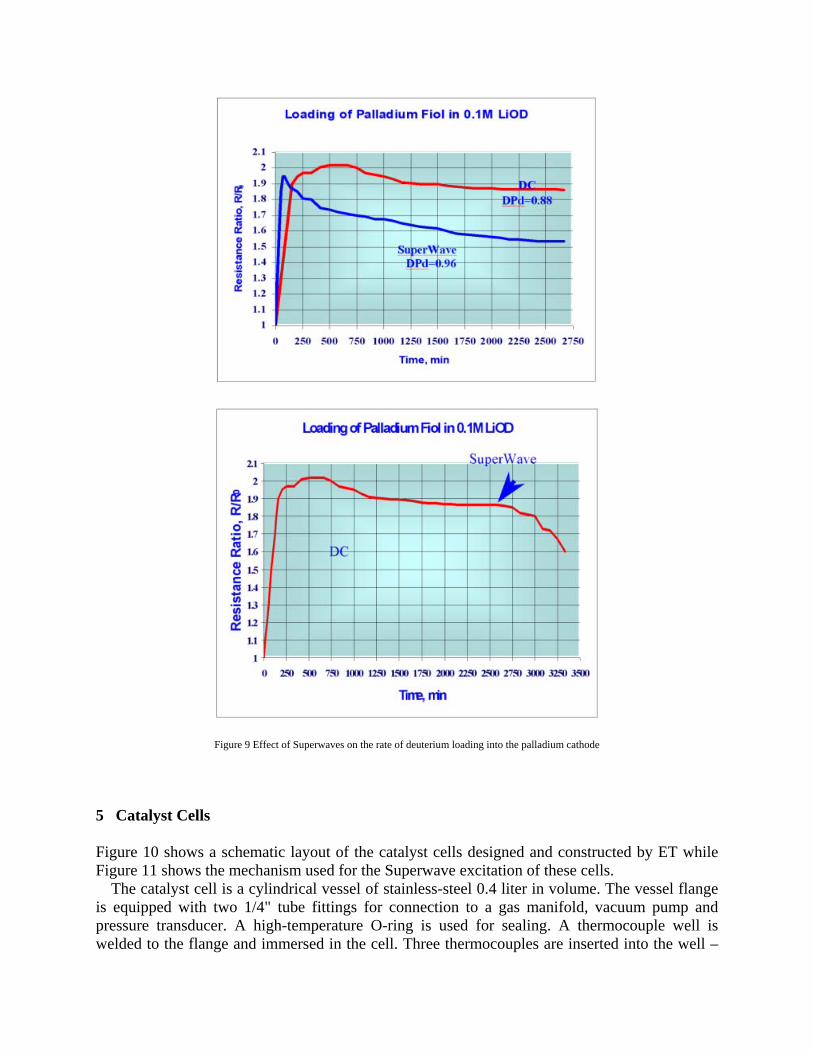
Figure 9 Effect of Superwaves on the rate of deuterium loading into the palladium cathode
Catalyst Cells
igure 10 shows a schematic layout of the catalyst cells designed and constructed by ET while
vessel flange is
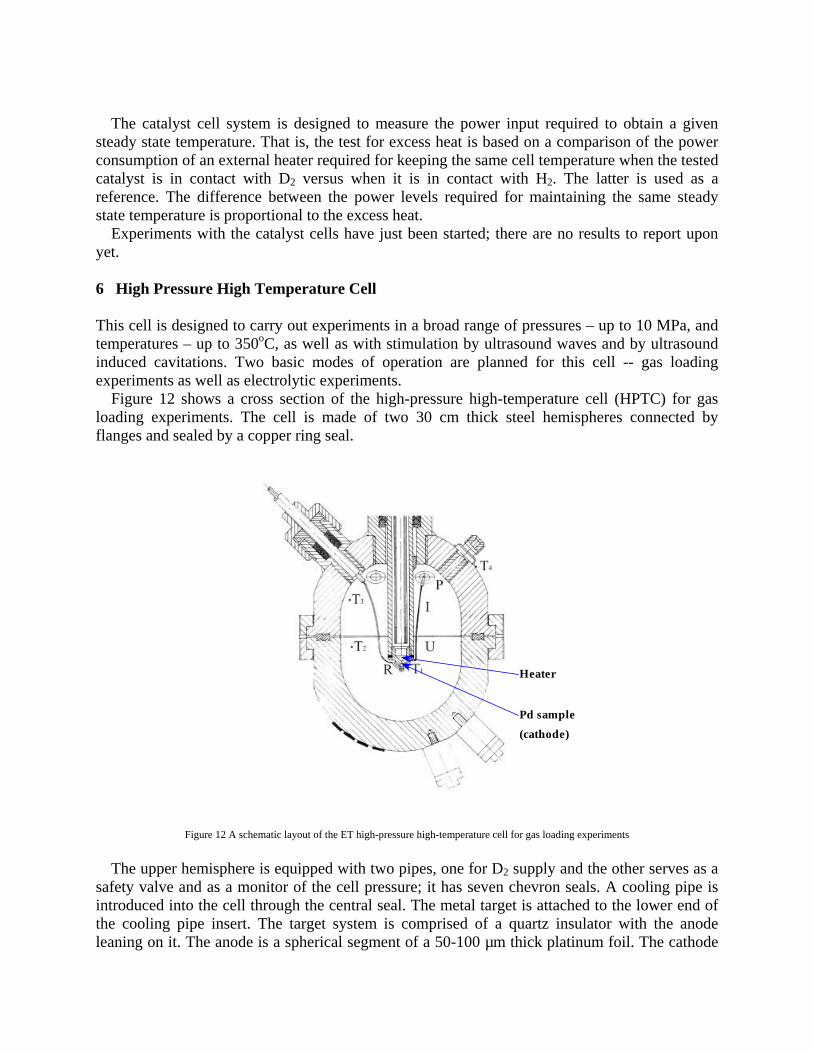
5 FFigure 11 shows the mechanism used for the Superwave excitation of these cells.
The catalyst cell is a cylindrical vessel of stainless-steel 0.4 liter in volume. The equipped with two 1/4" tube fittings for connection to a gas manifold, vacuum pump and
pressure transducer. A high-temperature O-ring is used for sealing. A thermocouple well is welded to the flange and immersed in the cell. Three thermocouples are inserted into the well –
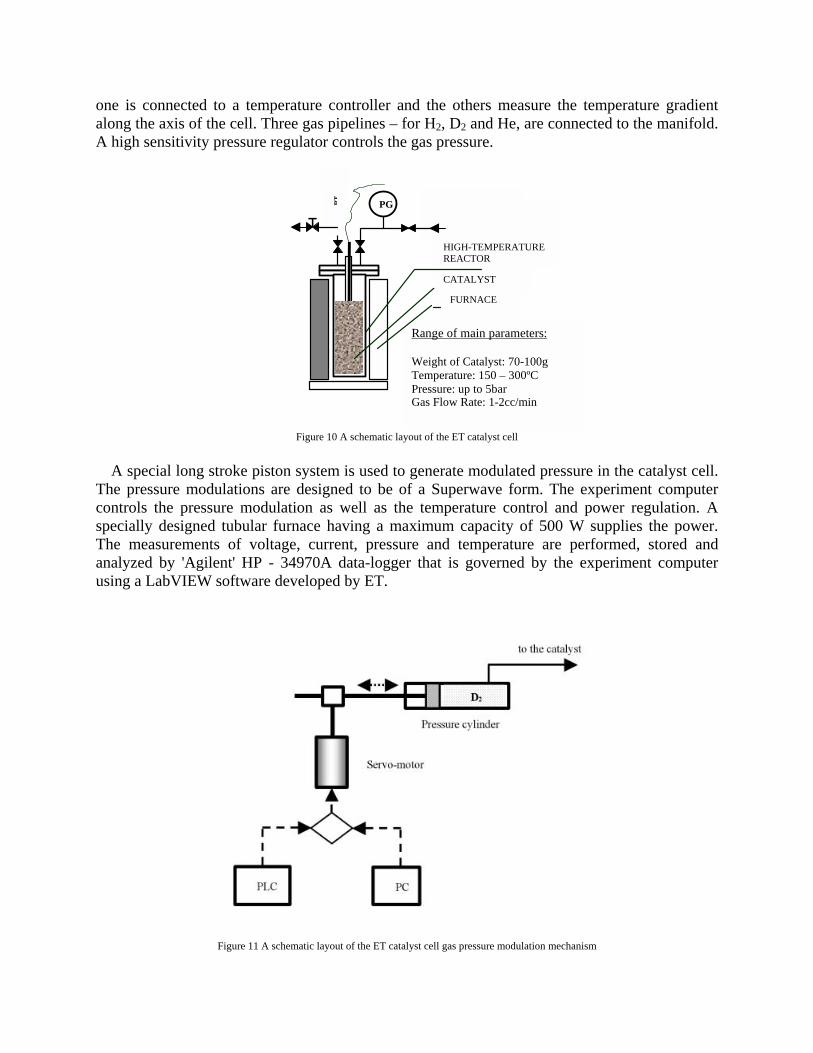
one is connected to a temperature controller and the others measure the temperature gradient along the axis of the cell. Three gas pipelines – for H2, D2 and He, are connected to the manifold. A high sensitivity pressure regulator controls the gas pressure.
Figure 10 A schematic layout of the ET catalyst
cell
A special long stroke piston d pressure in the catalyst cell. e pressure modulations are designed to be of a Superwave form. The experiment computer
co
T
Range of main parameters: Weight of Catalyst: 70-100g Temperature: 150 – 300ºC Pressure: up to 5bar Gas Flow Rate: 1-2cc/min
D2 or H2
PT PG
FURNACE
CATALYST
HIGH-TEMPERATURE REACTOR
system is used to generate modulateTh
ntrols the pressure modulation as well as the temperature control and power regulation. A specially designed tubular furnace having a maximum capacity of 500 W supplies the power. The measurements of voltage, current, pressure and temperature are performed, stored and analyzed by 'Agilent' HP - 34970A data-logger that is governed by the experiment computer using a LabVIEW software developed by ET.
Figure 11 A schematic layout of the ET catalyst cell gas pressure modulation mechanism
The catalyst cel to obtain a given
eady state temperature. That is, the test for excess heat is based on a comparison of the power co
igh Pressure High Temperature Cell
s in a broad range of pressures – up to 10 MPa, and mperatures – up to 350oC, as well as with stimulation by ultrasound waves and by ultrasound
30 cm thick steel hemispheres connected by fla
Figur iments
The upper r serves as a fety valve and as a monitor of the cell pressure; it has seven chevron seals. A cooling pipe is
in
l system is designed to measure the power input required st
nsumption of an external heater required for keeping the same cell temperature when the tested catalyst is in contact with D2 versus when it is in contact with H2. The latter is used as a reference. The difference between the power levels required for maintaining the same steady state temperature is proportional to the excess heat.
Experiments with the catalyst cells have just been started; there are no results to report upon yet.
6 H
This cell is designed to carry out experimentteinduced cavitations. Two basic modes of operation are planned for this cell -- gas loading experiments as well as electrolytic experiments.
Figure 12 shows a cross section of the high-pressure high-temperature cell (HPTC) for gas loading experiments. The cell is made of two
nges and sealed by a copper ring seal.
e 12 A schematic layout of the ET high-pressure high-temperature cell for gas loading exper
Heater
Pd sample(cathode)
Heater
Pd sample(cathode)
hemisphere is equipped with two pipes, one for D2 supply and the othe
satroduced into the cell through the central seal. The metal target is attached to the lower end of
the cooling pipe insert. The target system is comprised of a quartz insulator with the anode leaning on it. The anode is a spherical segment of a 50-100 µm thick platinum foil. The cathode
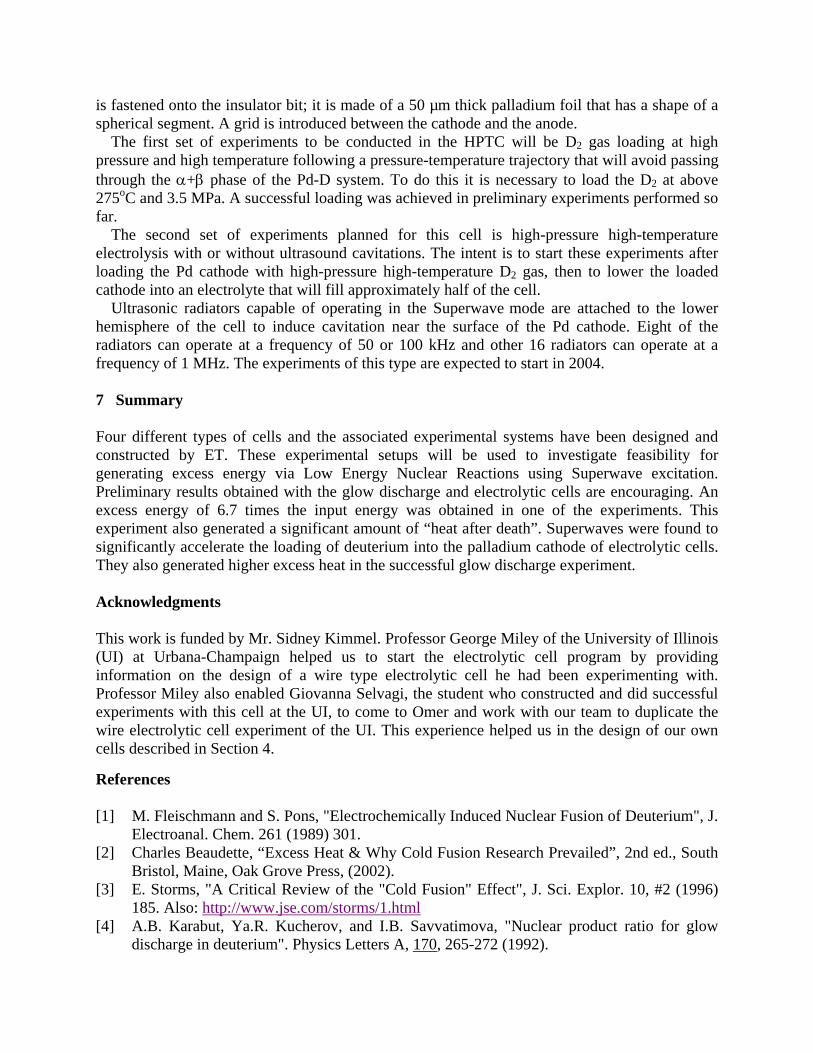
is fastened onto the insulator bit; it is made of a 50 µm thick palladium foil that has a shape of a spherical segment. A grid is introduced between the cathode and the anode.
The first set of experiments to be conducted in the HPTC will be D2 gas loading at high pressure and high temperature following a pressure-temperature trajectory that will avoid passing th
sis with or without ultrasound cavitations. The intent is to start these experiments after lo
Pd cathode. Eight of the ra
types of cells and the associated experimental systems have been designed and onstructed by ET. These experimental setups will be used to investigate feasibility for
by Mr. Sidney Kimmel. Professor George Miley of the University of Illinois I) at Urbana-Champaign helped us to start the electrolytic cell program by providing
schmann and S. Pons, "Electrochemically Induced Nuclear Fusion of Deuterium", J. Electroanal. Chem. 261 (1989) 301.
02).
ml
rough the α+β phase of the Pd-D system. To do this it is necessary to load the D2 at above 275oC and 3.5 MPa. A successful loading was achieved in preliminary experiments performed so far.
The second set of experiments planned for this cell is high-pressure high-temperature electroly
ading the Pd cathode with high-pressure high-temperature D2 gas, then to lower the loaded cathode into an electrolyte that will fill approximately half of the cell.
Ultrasonic radiators capable of operating in the Superwave mode are attached to the lower hemisphere of the cell to induce cavitation near the surface of the
diators can operate at a frequency of 50 or 100 kHz and other 16 radiators can operate at a frequency of 1 MHz. The experiments of this type are expected to start in 2004. 7 Summary Four different cgenerating excess energy via Low Energy Nuclear Reactions using Superwave excitation. Preliminary results obtained with the glow discharge and electrolytic cells are encouraging. An excess energy of 6.7 times the input energy was obtained in one of the experiments. This experiment also generated a significant amount of “heat after death”. Superwaves were found to significantly accelerate the loading of deuterium into the palladium cathode of electrolytic cells. They also generated higher excess heat in the successful glow discharge experiment. Acknowledgments This work is funded (Uinformation on the design of a wire type electrolytic cell he had been experimenting with. Professor Miley also enabled Giovanna Selvagi, the student who constructed and did successful experiments with this cell at the UI, to come to Omer and work with our team to duplicate the wire electrolytic cell experiment of the UI. This experience helped us in the design of our own cells described in Section 4.
References [1] M. Flei
[2] Charles Beaudette, “Excess Heat & Why Cold Fusion Research Prevailed”, 2nd ed., South Bristol, Maine, Oak Grove Press, (20
[3] E. Storms, "A Critical Review of the "Cold Fusion" Effect", J. Sci. Explor. 10, #2 (1996) 185. Also: http://www.jse.com/storms/1.ht
deuterium". Physics Letters A, 1 0[4] A.B. Karabut, Ya.R. Kucherov, and I.B. Savvatimova, "Nuclear product ratio for glow
discharge in 7 , 265-272 (1992).

[5] L.C. Case, “Catalytic Fusion of Deuterium into Helium-4”, the Seventh International Conference on Cold Fusion. 1998. Vancouver, Canada: ENECO, Inc., Salt Lake City, UT.
n Academy, 78
[6] T. Mizuno, “Nuclear Transmutation: The Reality of Cold Fusion,” Chapter 4, Infinite Energy Press, Concord, N.H., USA, 1998.
[7] Y. Arata and Y.C Zhang, “Nuclear Fusion Reacted Inside Metals by Intense Sonoimplantation Effect,“ Proc. of the Japa , Ser. B, No. 3 (2002).
ater: heat [6] L. Bertalot, F. De Marco, A. De Ninno, A. La Barbera, F. Scaramuzzi, V. Violante, P.
Zeppa, "Study of deuterium charging in palladium by the electrolysis of heavy wexcess production", Nuovo Cimento 15 D (1993) 1435.