Wimmera South Mallee1
25
Source:AB S,C ensus ofPopulation and H ousing,2011 Proportion ofpopulation aged 0 to 4 in 2011 H orsham W est W imm era Yarriambiack Hindm arsh N orthern G rampians -10 -8 -5 -3 0 3 5 8 10 (State Average = 6.4% ) D ifference to state average W im m era South M allee
-
Upload
melvin-nichols -
Category
Documents
-
view
29 -
download
0
description
- PowerPoint PPT Presentation
Transcript of Wimmera South Mallee1

Source: ABS, Census of Population and Housing, 2011
Proportion of population aged 0 to 4 in 2011
Hor
sham
Wes
t Wim
mer
a
Yar
riam
biac
k
Hin
dmar
sh
Nor
ther
n G
ram
pian
s
-10
-8
-5
-3
0
3
5
8
10
(State Average = 6.4%)
Difference to state average
Wimmera South Mallee

Source: ABS, Census of Population and Housing, 2011
Proportion of population aged 5 to 11 in 2011
Hor
sham
Wes
t Wim
mer
a
Nor
ther
n G
ram
pian
sH
indm
arsh
Yar
riam
biac
k
-10
-8
-5
-3
0
3
5
8
10
(State Average = 8.5%)
Difference to state average
Wimmera South Mallee

Source: ABS, Census of Population and Housing, 2011
Proportion of population aged 12 to 17 in 2011
Yar
riam
biac
k
Hin
dmar
shH
orsh
am
Nor
ther
n G
ram
pian
s
Wes
t Wim
mer
a
-10
-8
-5
-3
0
3
5
8
10
(State Average = 7.5%)
Difference to state average
Wimmera South Mallee
Source: ABS, Census of Population and Housing, 2011
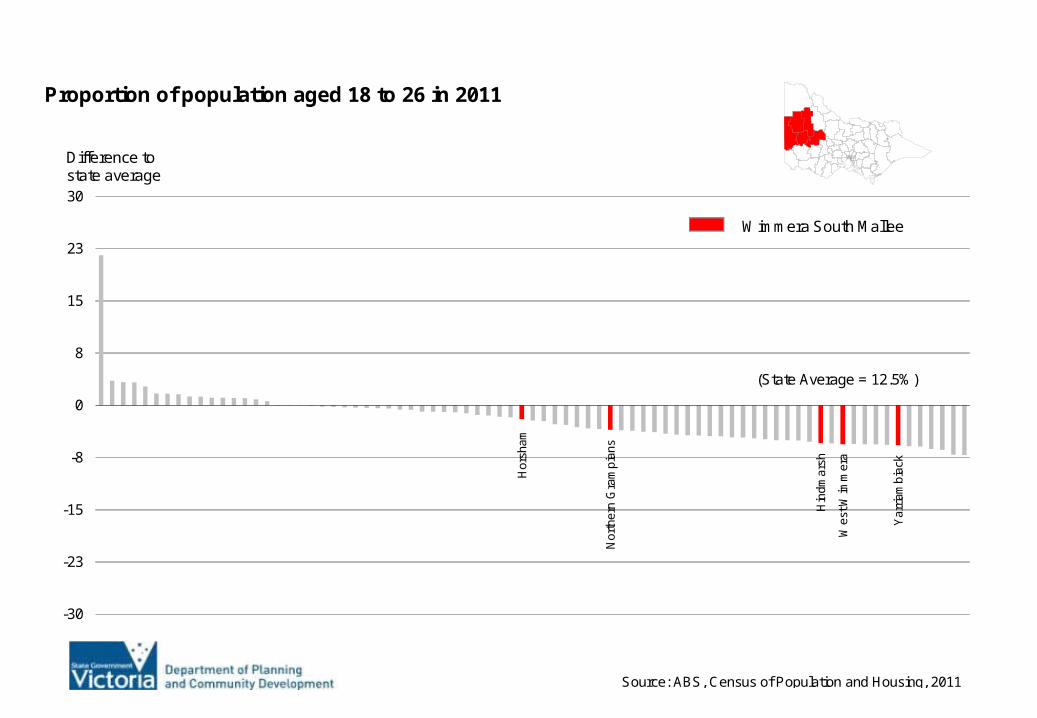
Proportion of population aged 18 to 26 in 2011
Hor
sham
Nor
ther
n G
ram
pian
s
Hin
dmar
sh
Wes
t Wim
mer
a
Yar
riam
biac
k
-30
-23
-15
-8
0
8
15
23
30
(State Average = 12.5%)
Difference to state average
Wimmera South Mallee

Source: ABS, Census of Population and Housing, 2011
Proportion of population aged 65 and over in 2011
Yar
riam
biac
kH
indm
arsh
Wes
t Wim
mer
a
Nor
ther
n G
ram
pian
s
Hor
sham
-20
-15
-10
-5
0
5
10
15
20
(State Average = 14.2%)
Difference to state average
Wimmera South Mallee
Source: ABS, Census of Population and Housing, 2011
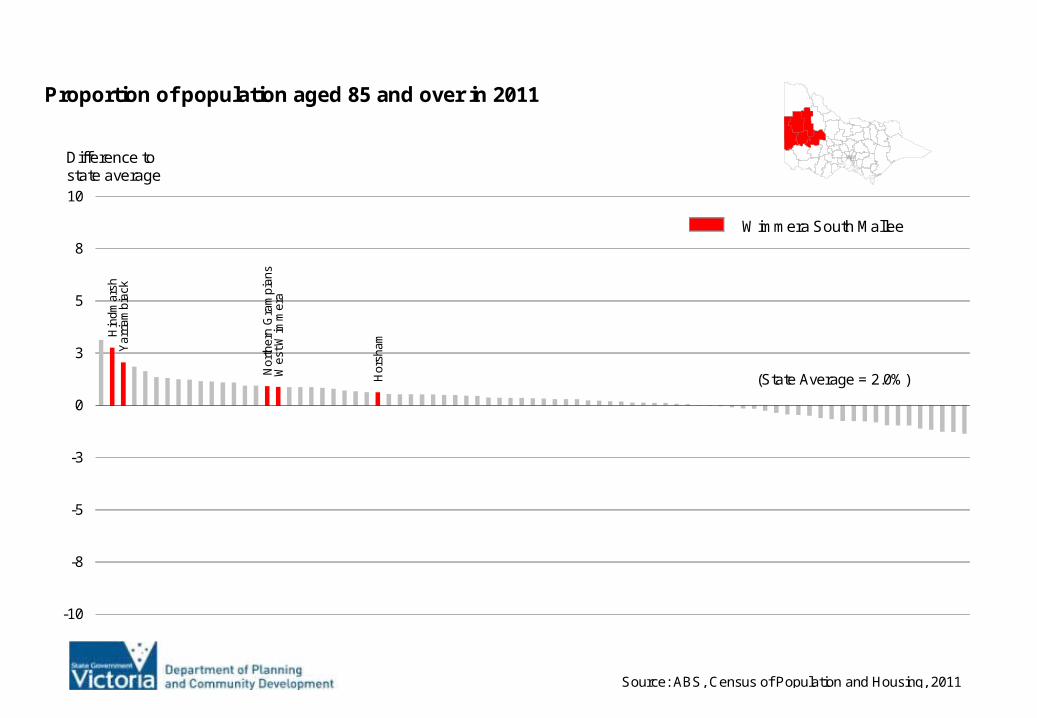
Proportion of population aged 85 and over in 2011H
indm
arsh
Yar
riam
biac
k
Nor
ther
n G
ram
pian
sW
est W
imm
era
Hor
sham
-10
-8
-5
-3
0
3
5
8
10
(State Average = 2.0%)
Difference to state average
Wimmera South Mallee

Source: ABS, Census of Population and Housing, 2011
Proportion of population born overseas in 2011 (excl not stated)
Hin
dmar
sh
Nor
ther
n G
ram
pian
s
Yar
riam
biac
kW
est W
imm
era
Hor
sham
-40
-30
-20
-10
0
10
20
30
40
(State Average = 27.7%)
Difference to state average
Wimmera South Mallee

Source: ABS, Census of Population and Housing, 2011
Proportion of population with low proficiency in English in 2011
Hin
dmar
sh
Hor
sham
Nor
ther
n G
ram
pian
s
Yar
riam
biac
k
Wes
t Wim
mer
a
-10
-8
-5
-3
0
3
5
8
10
(State Average = 3.2%)
Difference to state average
Wimmera South Mallee
Source: ABS, Census of Population and Housing, 2011
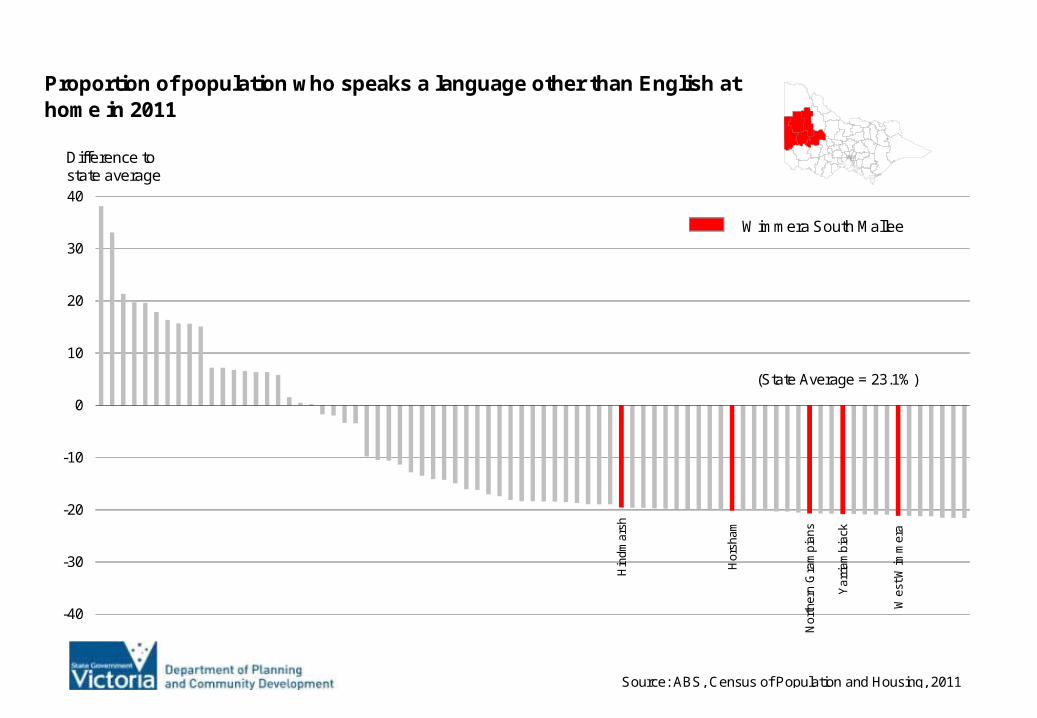
Proportion of population who speaks a language other than English at home in 2011
Hin
dmar
sh
Hor
sham
Nor
ther
n G
ram
pian
s
Yar
riam
biac
k
Wes
t Wim
mer
a
-40
-30
-20
-10
0
10
20
30
40
(State Average = 23.1%)
Difference to state average
Wimmera South Mallee

Source: ABS, Census of Population and Housing, 2011
Proportion of recent migrants (arrived 2006-2011) in population in 2011
Hin
dmar
sh
Hor
sham
Yar
riam
biac
k
Nor
ther
n G
ram
pian
s
Wes
t Wim
mer
a
-20
-15
-10
-5
0
5
10
15
20
(State Average = 5.9%)
Difference to state average
Wimmera South Mallee
Source: ABS, Census of Population and Housing, 2011
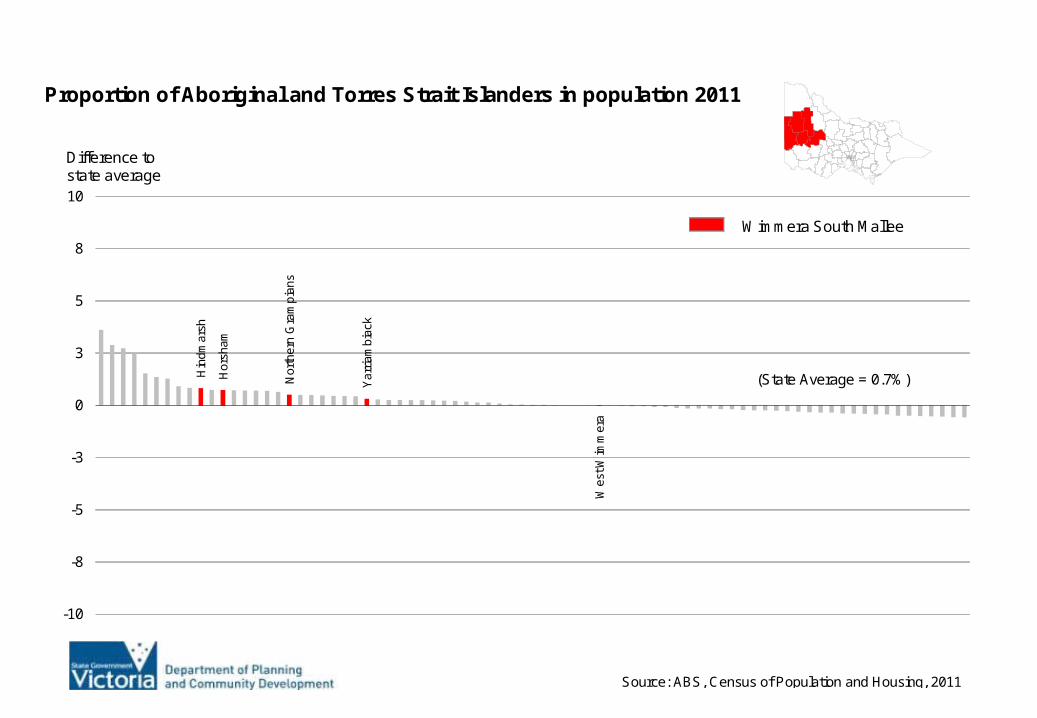
Proportion of Aboriginal and Torres Strait Islanders in population 2011
Hin
dmar
sh
Hor
sham
Nor
ther
n G
ram
pian
s
Yar
riam
biac
k
Wes
t Wim
mer
a-10
-8
-5
-3
0
3
5
8
10
(State Average = 0.7%)
Difference to state average
Wimmera South Mallee
Source: ABS, Census of Population and Housing, 2011
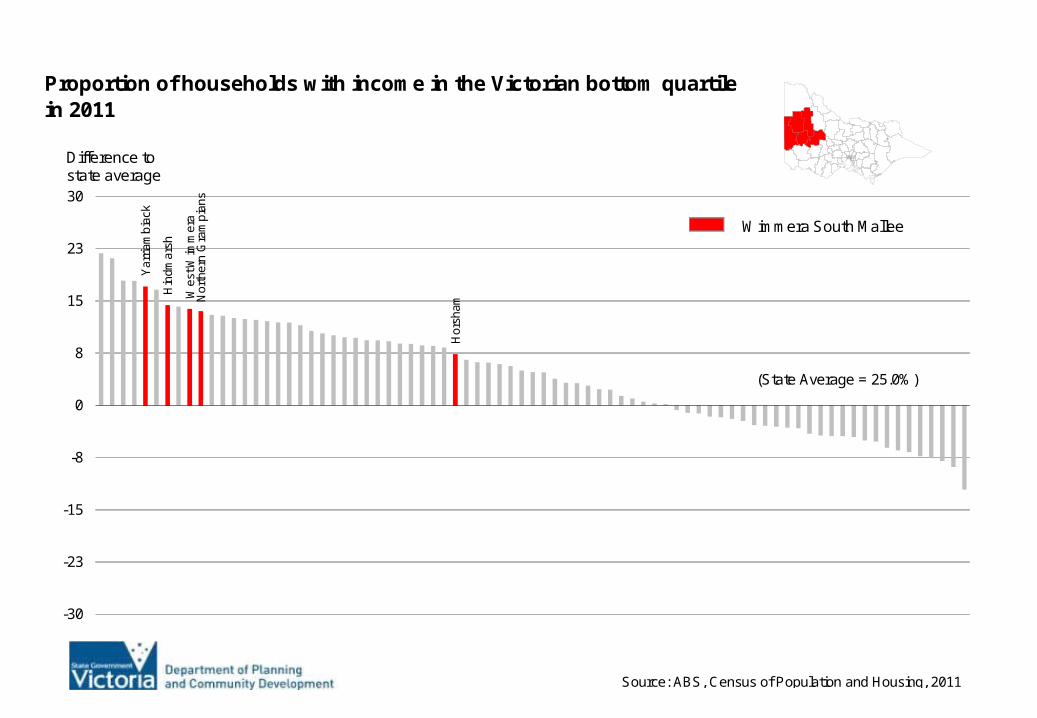
Proportion of households with income in the Victorian bottom quartile in 2011
Yar
riam
biac
k
Hin
dmar
sh
Wes
t Wim
mer
aN
orth
ern
Gra
mpi
ans
Hor
sham
-30
-23
-15
-8
0
8
15
23
30
(State Average = 25.0%)
Difference to state average
Wimmera South Mallee

Source: ABS, Census of Population and Housing, 2011
Proportion of households with income in the Victorian top quartile in 2011
Hor
sham
Wes
t Wim
mer
a
Nor
ther
n G
ram
pian
s
Yar
riam
biac
kH
indm
arsh
-30
-23
-15
-8
0
8
15
23
30
(State Average = 25.0%)
Difference to state average
Wimmera South Mallee

Source: ABS, Census of Population and Housing, 2011
Proportion of couple without children households in total households in 2011
Wes
t Wim
mer
a
Yar
riam
biac
k
Hin
dmar
shN
orth
ern
Gra
mpi
ans
Hor
sham
-20
-15
-10
-5
0
5
10
15
20
(State Average = 24.6%)
Difference to state average
Wimmera South Mallee

Source: ABS, Census of Population and Housing, 2011
Proportion of couple with children households in total households in 2011
Hor
sham
Wes
t Wim
mer
a
Hin
dmar
sh
Nor
ther
n G
ram
pian
s
Yar
riam
biac
k
-30
-23
-15
-8
0
8
15
23
30
(State Average = 31.8%)
Difference to state average
Wimmera South Mallee
Source: ABS, Census of Population and Housing, 2011
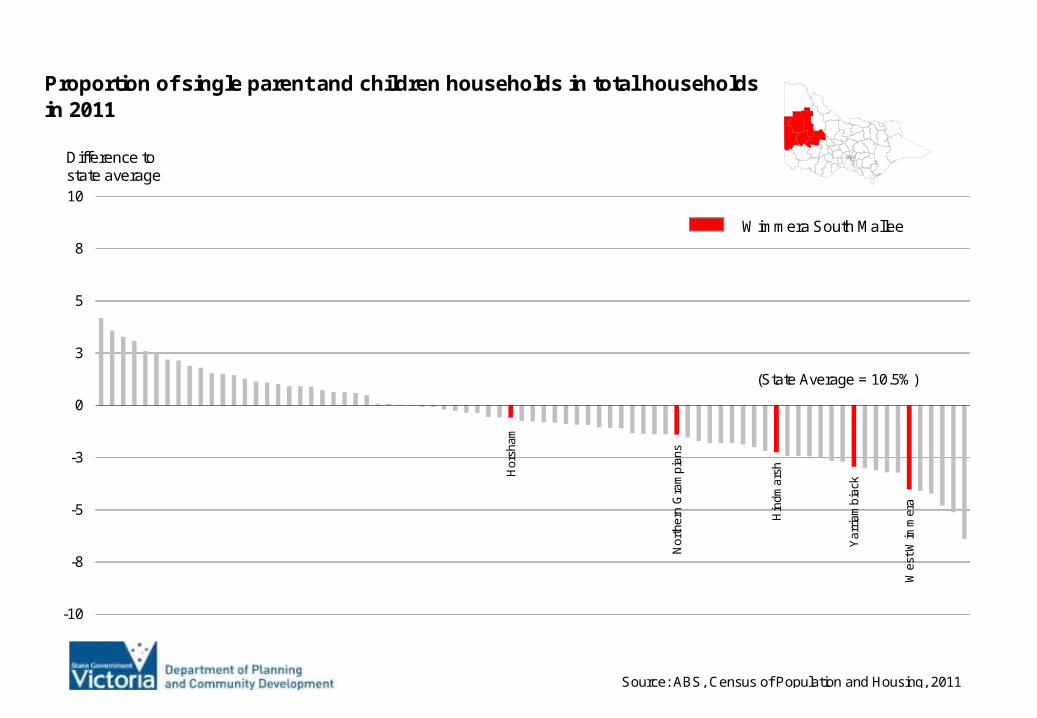
Proportion of single parent and children households in total households in 2011
Hor
sham
Nor
ther
n G
ram
pian
s
Hin
dmar
sh
Yar
riam
biac
k
Wes
t Wim
mer
a
-10
-8
-5
-3
0
3
5
8
10
(State Average = 10.5%)
Difference to state average
Wimmera South Mallee
Source: ABS, Census of Population and Housing, 2011
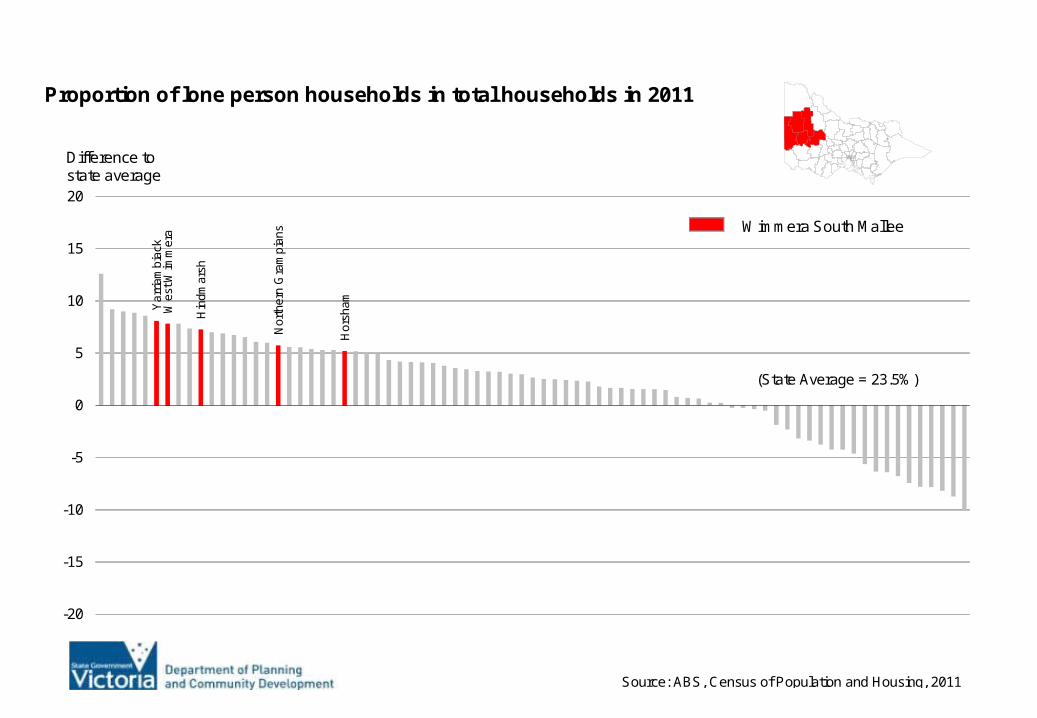
Proportion of lone person households in total households in 2011
Yar
riam
biac
kW
est W
imm
era
Hin
dmar
sh
Nor
ther
n G
ram
pian
s
Hor
sham
-20
-15
-10
-5
0
5
10
15
20
(State Average = 23.5%)
Difference to state average
Wimmera South Mallee
Source: ABS, Census of Population and Housing, 2011
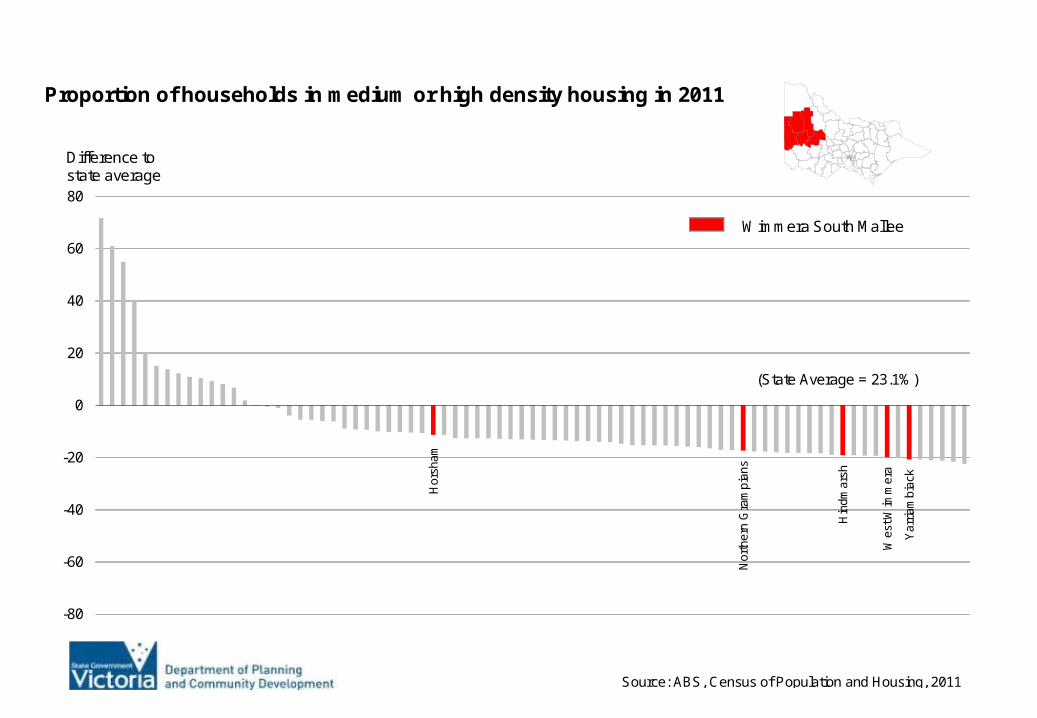
Proportion of households in medium or high density housing in 2011
Hor
sham
Nor
ther
n G
ram
pian
s
Hin
dmar
sh
Wes
t Wim
mer
a
Yar
riam
biac
k
-80
-60
-40
-20
0
20
40
60
80
(State Average = 23.1%)
Difference to state average
Wimmera South Mallee

Source: ABS, Census of Population and Housing, 2011
Proportion of households in privately rented dwellings in 2011
Hor
sham
Nor
ther
n G
ram
pian
s
Hin
dmar
sh
Yar
riam
biac
k
Wes
t Wim
mer
a
-30
-23
-15
-8
0
8
15
23
30
(State Average = 20.9%)
Difference to state average
Wimmera South Mallee

Source: ABS, Census of Population and Housing, 2011
Dwelling vacancy rate in 2011
Wes
t Wim
mer
aH
indm
arsh
Nor
ther
n G
ram
pian
sY
arria
mbi
ack
Hor
sham
-50
-38
-25
-13
0
13
25
38
50
(State Average = 10.8%)
Difference to state average
Wimmera South Mallee

Source: ABS, Census of Population and Housing, 2011
Rate of population growth between 2006 and 2011
Hor
sham
Nor
ther
n G
ram
pian
s
Hin
dmar
sh
Wes
t Wim
mer
aY
arria
mbi
ack
-40
-30
-20
-10
0
10
20
30
40
(State Average = 8.5%)
Difference to state average
Wimmera South Mallee

Source: ABS, Census of Population and Housing, 2011
Rate of household growth between 2006 and 2011
Hor
sham
Nor
ther
n G
ram
pian
s
Wes
t Wim
mer
a
Yar
riam
biac
k
Hin
dmar
sh
-40
-30
-20
-10
0
10
20
30
40
(State Average = 8.7%)
Difference to state average
Wimmera South Mallee

Source: ABS, Census of Population and Housing, 2011
Rate of growth in vacant dwellings between 2006 and 2011
Hin
dmar
sh
Wes
t Wim
mer
a
Yar
riam
biac
k
Nor
ther
n G
ram
pian
s
Hor
sham
-70
-53
-35
-18
0
18
35
53
70
(State Average = 14.4%)
Difference to state average
Wimmera South Mallee

Source: ABS, Census of Population and Housing, 2011
Rate of dwellings growth between 2006 and 2011
Hor
sham
Wes
t Wim
mer
aN
orth
ern
Gra
mpi
ans
Hin
dmar
shY
arria
mbi
ack
-40
-30
-20
-10
0
10
20
30
40
(State Average = 9.2%)
Difference to state average
Wimmera South Mallee

Source: ABS, Census of Population and Housing, 2011
Proportion of population born in LOTE countries in 2011 (excl not stated)
Hin
dmar
sh
Hor
sham
Yar
riam
biac
k
Nor
ther
n G
ram
pian
s
Wes
t Wim
mer
a
-40
-30
-20
-10
0
10
20
30
40
(State Average = 9.2%)
Difference to state average
Wimmera South Mallee