Why First Pacific?...pal businesses are Instant Noodles, Flour and Edible Oils and Fats, as well as...
106
Why First Pacific? FIRST PACIFIC COMPANY LIMITED ANNUAL REPORT 2000
Transcript of Why First Pacific?...pal businesses are Instant Noodles, Flour and Edible Oils and Fats, as well as...

h s h
Why First Pacific?
FIRST PACIFIC COMPANY LIMITED
ANNUAL REPORT 2000
A RESHAPOFFERS ATHROUGHINVESTORTHE OPPOAND MANTHROUGHMANAGEMCOMPANITO BETTEEFFICIENTTO ACHIEVALUE AT OPEN THIS P
FIR
ST
PA
CIF
IC C
OM
PA
NY
LIM
ITE
D A
NN
UA
L RE
PO
RT
2000

A RESHAPED, REFOCUSED, REVITALIZED COMPANY, FIRST PACIFIC OFFERS ACCESS TO SIGNIFICANT INVESTMENTS IN LEADING COMPANIESTHROUGHOUT SOUTHEAST ASIA. AS MACRO ISSUES HAVE DAMPENEDINVESTOR SENTIMENT FOR THE REGION, FIRST PACIFIC HAS TAKEN THE OPPORTUNITY TO POSITION ITSELF AS A LEADING ASIAN INVESTMENT AND MANAGEMENT COMPANY WITH A DIVERSE PORTFOLIO OF ASSETS.THROUGH THE INTERNATIONAL EXPERIENCE AND SKILLS OF ITS MANAGEMENT TEAM, FIRST PACIFIC ACTIVELY ENCOURAGES ITS GROUP COMPANIES TO ADOPT NEW STRATEGIES. TO THINK DIFFERENTLY. TO BETTER LEVERAGE THEIR CONSIDERABLE ASSETS. TO OPERATE MORE EFFICIENTLY. TO REACH OUT TO NEW MARKETS AND OPPORTUNITIES. TO ACHIEVE FIRST PACIFIC STANDARDS. AND IN DOING SO, TO CREATE VALUE AT EVERY TURN.OPEN THIS PAGE FOR AN OVERVIEW OF THE FIRST PACIFIC GROUP AND ITS ACTIVITIES.

p. 1
Executive Chairman’s Message
Review of Goals for 2000
Goals for 2001
The Hong Kong Head Office Team
Board of Directors
Our People. Our Communities.
Review of Operations
Corporate Governance
and Financial Review
Statutory Reports
and Financial Statements
HK GAAP and IAS Reconciliation
Glossary of Terms
Information for Investors
Ten-Year Statistical Summary
Summary of Principal Investments
contents
8
10
11
12
14
15
18
37
53
94
96
98
100
ins ide back cover

Place ofincorporation/
principal Issuedarea of Reporting number Economic Voting
Investment operation currency of shares interest interest Principal activities
CONSUMER
PT Indofood Indonesia Rupiah 9.2 billion 48.0 48.0 Jakarta-based Indofood is Indonesia’s leading processed-foods group.Sukses Makmur Tbk Listed on the Jakarta and Surabaya stock exchanges, Indofood’s princi-
pal businesses are Instant Noodles, Flour and Edible Oils and Fats, aswell as Snack Foods, Baby Foods, Food Seasonings and Distribution.
Further information on Indofood can be found at www.indofood.co.id
The First Pacific Group acquired an additional 8.0 per cent interestin December 2000. The Group’s average economic shareholding dur-ing 2000 was 40.0 per cent.
Berli Jucker Public Thailand Baht 158.8 million 83.5 83.5 Berli Jucker is based and listed in Bangkok. It focuses on the manu-Company Limited facturing, marketing and distribution of glass, consumer, technical
and imaging products.
Further information on Berli Jucker can be found at www.berlijucker.co.th
PT Darya-Varia Indonesia Rupiah 560.0 million 89.5 89.5 Darya-Varia, which is based and listed in Jakarta, is a leading, fully Laboratoria Tbk integrated health care company engaged in the manufacture, market-
ing and distribution of prescription and over-the-counter medicines.
Further information on Darya-Varia can be found at www.darya-varia.com
TELECOMMUNICATIONS
Philippine Philippines Pesos 168.5 million 24.6 31.7 PLDT is the leading supplier of domestic and international telecom-Long Distance munications services in the Philippines. Actively pursuing a conver-Telephone Company gence strategy, PLDT is based and listed in Manila and has ADRs
listed on the New York Stock Exchange and the Pacific Exchange. Its three principal business groups – fixed line, wireless andInternet/multimedia – provide a comprehensive menu of products and services across the most extensive broadband and integratednetworks in the country.
Further information on PLDT can be found at www.pldt.com.ph
In March 2000, the First Pacific Group’s economic and voting inter-ests increased to 23.1 per cent and 31.7 per cent, respectively, follow-ing PLDT’s acquisition of 100 per cent of Smart. In September 2000,First Pacific’s economic interest further increased to 24.6 per centthrough the acquisition of Metro Pacific’s approximate 8.0 per centinterest in PLDT. Voting interest remained unchanged at 31.7 percent. The Group’s average economic shareholding during 2000 was22.1 per cent.
Escotel Mobile India Rupees 366.0 million 49.0 49.0 Escotel, which is based in New Delhi, provides GSM cellular tele-Communications phone services in Uttar Pradesh (West), Haryana and Kerala. Limited
Further information on Escotel can be found atwww.escotelmobile.com
Infrontier Limited Bermuda/ US$ 12.0 thousand 100.0 100.0 Infrontier, a start-up business based in Hong Kong, provides Internet- Asia and wireless-based solutions and services to companies in Asia.
Further information on Infrontier can be found atwww.infrontier.com
PROPERTY
Metro Pacific Philippines Pesos 18.6 billion 80.6 80.6 Metro Pacific, which is based and listed in Manila, has Corporation interests principally in Property (Bonifacio Land Corporation,
Landco Pacific and Pacific Plaza Towers). It also has interests inBanking (First e-Bank) and Transportation (Negros Navigation).
Further information on Metro Pacific can be found at www.metropacific.com
Summary of Principal InvestmentsAs at 31 March 2001
99 0000 0198 9997 98
DEC97
Divested Pacific Link, a Hong Kong cellular provider. Ten-year annualizedcash return of 23 per cent.
JAN98
Issued strategy paper outlining plans todispose of maturing businesses andfocus investments on higher-growth,undervalued Asian companies.
MAR98
Divested Hagemeyer, Netherlands-basedbusiness-to-business distribution services group. Fifteen-year annualizedcash return of 24 per cent.
APR98
Divested mid-sized Californian bankUnited Commercial Bank. Thirteen-yearannualized cash return of 19 per cent.
NOV98
Acquired a 17.2 per cent interest inPLDT, the leading telecommunications operator in the Philippines.
JAN99
Divested Tuntex, a Taiwan cellularprovider. Two-year annualized cashreturn of 40 per cent.
FEB99
Divested Guardforce, a Hong Kong-basedsecurity services group. Six-year annualizedcash return of 19 per cent.
MAR99
Dilution of Smart to provide fundingand enable our partner NTT to increaseshareholding. Six-year annualized cashreturn of 58 per cent.
JUN99
Raised US$200 million in an overnight placement to fund acquisition of Indofood.
SEP99
Acquired a 40 per cent interest inIndofood, Indonesia’s leading processedfoods group.
MAR00
MAR00
Concluded merger of PLDT and Smart; increased interest in PLDT to 23.1 per cent and formed strategicalliance with NTT Com.
Divested cellular GSM joint-ventureinterests in China. Five-year annualizedcash return of four per cent.
APR00
Combined First Pacific Davies with Savills plc; increased interest in Savills plc to 30 per cent from 20 per cent.
JUN00
JUN00
Divested 10 per cent interest in Savills plc to Trammell CrowCompany Limited.
Divested SPORTathlon, a Hong Kong-based integratedleisure services provider.
SEP00
Combined the Group’s interests in PLDT; positioned Metro Pacific as a property-focused company.
DEC00
DEC00
Divested Hong Kong-based First PacificBank. Fourteen-year annualized cashreturn of 15 per cent.
Increased interest in Indofood to 48 per cent.
MAR01
Divested Savills plc. Three-year annualized cash return of 15 per cent.
OCT97
Divested Tech Pacific, a Sydney-based IT distributor. Ten-year annualized cashreturn of 20 per cent.
First Pacific, a Hong Kong-based investment and management company,
holds assets in Indonesia, the Philippines and Thailand, with principal
business interests relating to Consumer, Telecommunications, and Property.
Headquartered and listed in Hong Kong, First Pacific is a constituent of
the Hang Seng Index. Its shares are also available in the United States
through American Depositary Receipts.
First Pacific’s principal investments are detailed on the inside back cover.
Recurring ProfitBefore Exchange
DifferencesUS$millions
96 97
200
150
100
50
098 99 00
MarketCapitalization
US$billions
96 97
3.0
2.5
2.0
1.5
1.0
0.5
098 99 00
Adjusted Net Asset Value by Country –
31 December 2000
61%
6%
26%
7%
US$millions
Philippines 898.0Indonesia 380.4Thailand 80.6Others 102.9Total 1,461.9
Contribution fromOperations by
Line of BusinessUS$millions
96 97
250
200
150
100
50
0
-5098 99 00
ConsumerTelecomPropertyBanking
First Pacific
First Pacific’s Strategic Restructuring
DESIGN BY ADDISON WWW.ADDISON.COM FEATURE SECTION PHOTOGRAPHY BY DAVID DREBIN COMMUNITY SECTION PHOTOGRAPHY BY PAUL HU EXECUTIVE PHOTOGRAPHY BY LINCOLN POTTERPRINTED BY ROMAN FINANCIAL PRESS LIMITEDA CHINESE VERSION OF THIS ANNUAL REPORT IS AVAILABLE FROM THE COMPANY UPON REQUEST.

p. 2

p. 3
INDOFOOD’S NOODLES
ARE REACHING FURTHER FIRST PACIFIC’S PHILOSOPHY OF HOLDING FUNDAMENTALLY
SOUND COMPANIES UNDERPINNED ITS DECISION TO INVEST IN INDOFOOD IN 1999. IN 2000, DESPITE POLITICAL INSTABILITY,
ECONOMIC UNCERTAINTY AND A WEAKENING RUPIAH, INDOFOOD SOLD A RECORD-BREAKING NINE BILLION PACKS
OF INSTANT NOODLES AND INCREASED ITS INSTANT NOODLE EXPORTS BY 77 PER CENT. INDOFOOD GENERATES SIZEABLE
FREE CASH FLOWS, SUFFICIENT IN 2000 TO REPAY OVER US$300 MILLION OF U.S. DOLLAR DENOMINATED DEBT.
WORKING WITH FIRST PACIFIC, INDOFOOD IS CONSIDERING THE BEST USE OF ITS CASH AND WILL SHORTLY RETURN TO PAYING
DIVIDENDS FOR THE FIRST TIME SINCE 1996.

p. 4
PLDT IS COMMUNICATING IN NEW WAYS
UNDER FIRST PACIFIC MANAGEMENT, PLDT MERGED WITH SMART AND SECURED A DURABLE NEW CELLULAR REVENUE STREAM. PLDT EXPANDED ITS TELECOMMUNICATIONS BUSINESS AGGRESSIVELY IN 2000, GROWING ITS CELLULAR GSM SUBSCRIBER BASE BY 2.5 MILLION, AND INCREASING ITS DATA AND OTHER NETWORK SERVICES REVENUE BY 54 PER CENT.

p. 5

p. 6
METRO PACIFIC IS BUILDING
A BETTER FUTUREFIRST PACIFIC HAS ACCELERATED METRO PACIFIC’S TRANSITION FROM A DIVERSE CONGLOMERATE TO A MORE PROPERTY-FOCUSED FIRM.AS THE GLOBAL CITY WELCOMES ITS FIRST RESIDENTS, METRO PACIFIC IS DEDICATING ITSELF TO THE LONG-TERM DEVELOPMENTOF THIS WORLD-CLASS CITY, WHICH OFFERS ADVANCED INFRASTRUCTUREAND FACILITIES CAPABLE OF SUPPORTING PHILIPPINE RESIDENTIAL AND BUSINESS NEEDS FOR DECADES TO COME.

p. 7

p. 8
Executive Chairman’s Message
Dear Fellow Shareholder,
In May 2001, First Pacific will be 20 years old. The company that began as a financial
services provider called First Pacific Finance Limited has transformed and reinvented
itself many times since then. But throughout its history, one objective has grounded and
driven the organization: the development of value.
Without a doubt, the restructuring process we initiated in January 1998 was our
boldest and most wide-reaching ever. Your management, contending with complex issues and
changing operating environments, has successfully charted a course to position the Group
optimally for future value creation. In the process, we completed some US$6 billion of corpo-
rate transactions, and unlocked and crystallized the value of maturing assets.
First Pacific has emerged from this transformation as a refocused, recharged Group.
Each holding in our diverse portfolio of investments is a leader in its market, with a proven
capability to weather difficult economic conditions. And I am pleased to report that all of
them recorded solid results in 2000.
During a period in which entrenched political issues adversely affected the rupiah,
Indofood recorded increased sales volumes in all divisions, including record sales of nine
billion packs of instant noodles. Moreover, the company generated sufficient cash to repay
some US$300 million of loans, meet its own funding needs, and to declare a dividend for the
first time since 1996.
Similarly, PLDT contended with a volatile peso and an unstable political climate, but
still had the vision to forego short-term profits to position itself for long-term growth. Its
cellular services now boast 3.5 million subscribers, having grown by more than two million
during 2000 alone. Moreover, through effective marketing and unparalleled services, PLDT
has been able to reduce subscriber acquisition costs while maintaining subscriber take-up.
During a year in which the economy of the Philippines trended downwards, PLDT has led the
country in cellular growth.
Indeed, all of our businesses have faced daunting challenges. Metro Pacific contended
with a stagnant property market. Berli Jucker experienced lower demand for its glass bottles.
Darya-Varia absorbed escalating costs for imported raw materials as the rupiah weakened.
And Escotel struggled with an uncertain regulatory environment. Yet all responded resolutely –
and all achieved commendable results.
As a result, contribution from operations continued to improve, increasing 24 per cent
to US$88.5 million. Recurring profit also continued its upward trend, growing 23 per cent to
US$51.0 million. These numbers demonstrate that our operating companies have continued
to prosper and grow even in the face of challenging economic conditions and volatile currencies.
However, economic uncertainty, prompted by political instability, had the inevitable
effect of eroding currency exchange rates and, consequently, reported results. We recorded
some US$143 million in largely unrealized exchange losses that offset non-recurring realized
gains on disposals. Nevertheless, recurring earnings per share, which measures the underlying
profitability of the Company’s operations, increased nine per cent to US1.74 cents, and
First Pacific ended the year with the lowest level of Head Office net indebtedness since 1995.
STOCK PERFORMANCE
Strategic progress and operational performance improvements are not always immediately
reflected in a company’s share price. Such has been the case with First Pacific.
Because most of First Pacific’s investments are listed separately, there is a strong correla-
tion between the value of First Pacific stock and the stock values of its operating companies.
Manuel V. Pangilinan
Recurring Profitand Contributionfrom Operations
US$millions
98
100
80
60
40
20
099 00
Recurring ProfitContribution from Operations
Strategic progress illustrated by year on year improvements

p. 9
Despite sound operational performances, macro concerns have adversely affected the stock
values of all of our operating companies. As First Pacific is essentially a reflection of these
combined investments, this negative sentiment has also adversely influenced First Pacific’s
current stock value, which closed the year at HK$2.23 per share.
OUTLOOK
Looking ahead, we expect our true stock value to remain under pressure as long as the econ-
omies of Southeast Asia remain weak and negative sentiment prevails. While there are some
encouraging signs, such as the recent stabilization of the political situation in the Philippines,
First Pacific will not be passively waiting for an upturn in sentiment to develop value. The
same core management attributes that fueled First Pacific these past 20 years will continue
to do so in the future. We continue to build sustainable value at the operating level through
active management participation. We continue to motivate and drive our investments through
coherent, cohesive goal setting. We continue to have the vision, determination and ability to
ensure that our value creation of today will lead to a superior First Pacific tomorrow.
As such, 2001 will see further value enhancement as we put all of our efforts into
growing the recurring profits and cash flows of our strategic businesses. Having essentially
reshaped the Group, our focus is now on taking the steps necessary to recapture historic
levels of growth in profits and cash flows.
FI NAL THOUGHTS
In closing, I would like to recognize everyone who made 2000 such a commendable and defining
year for First Pacific, in particular, our employees, our management team and our Board of
Directors. I would especially like to acknowledge the contributions of David S. Davies, OBE,
and James C. Ng.
David, one of First Pacific’s longest-serving directors, passed away in June 2000.
The passing of this gentleman, who had an enormous capacity for friendship and generosity,
has saddened the entire First Pacific Group, as well as the business communities in which
FPDSavills operates.
James stepped down from his position as a Non-executive Director of First Pacific in
March 2001. In his 15 years with us, James also served on the board of First Pacific Bank,
most recently as Managing Director and Chief Executive Officer. On behalf of the Board,
I am truly grateful for the years of dedicated service and professionalism that characterized
James’ tenure with the Group, and we wish him well in his future endeavors.
Finally, I would like to thank you, our shareholders, for your continued support of
First Pacific. Our efforts over the past three years have demonstrated our willingness – and
our ability – to move quickly and decisively to deal with changing market conditions. Those
same qualities will serve us well as we continue to develop value and pursue new growth
opportunities as they emerge.
Sincerely,
Manuel V. Pangilinan
Executive Chairman
KEY REGIONAL CURRENCIES WEAKENED –
RUPIAH DOWN 28 PER CENT, THE PESO DOWN 19 PER CENT, THE BAHT DOWN 13 PER CENT
EPS UP 9 PER CENT, DESPITE AN INCREASE IN THE NUMBER OF SHARES IN ISSUE
Net DebtUS$millions
91 93 95 97 0092 94 96 98 99
1,000
800
600
400
200
0
Head Office net debt lowest since 1995
Share price out of sync with true value of underlying investments
Share Price vs.Adjusted Net Asset
Value Per ShareHK$
Dec97
6.16
3.75 3.24
2.23
Dec98
Dec99
Dec00
7
6
5
4
3
2
1
0
Share PriceAdjusted net asset value per share

p. 10
FI RST PACIFIC
• Continue the rehabilitation and further enhancement of recurrentprofits and cash flow PARTIALLY ACHIEVED
Recurring profits increased 23 per cent, off increased contri-bution from operations of 24 per cent. Head Office cash at the year-end was up 76 per cent, however, this was principallyreflective of disposal proceeds and not improved recurrentcash flows.
• As restructuring activities decline, return full management focus tobuilding and developing value ACHIEVED
Restructuring activities continued throughout the year,including: PLDT’s acquisition of Smart; the combining of the First Pacific Group’s interests in PLDT; the increasedinvestment in Indofood; and the disposal of First Pacific Bank.In addition, Head Office net indebtedness reduced to its lowest level since 1995. Management focus is now wholly onbuilding and developing value.
• Promote the development of common e-market platforms, and seek opportunities for application service provision ACHIEVED
Infrontier, a provider of rapidly-deployable Internet-based business-to-business solutions for Asian markets, has been established.
• Finalize the evaluation review of Metrosel and execute conclusionsNOT ACHIEVED
The Group continues to evaluate its options regarding thefuture of Metrosel.
INDOFOOD
• Exploit opportunities for value creation from existing businessesACHIEVED
Ongoing market and product developments have resulted inincreased sales volumes for all divisions.
• Expand existing businesses, domestically, regionally or internation-ally, either organically or through acquisition ACHIEVED
All divisions experienced organic, domestic growth in sales volumes, including record high sales of Instant Noodles.Exports remain relatively small; however these are growingwith Instant Noodle export sales volumes increasing 77 percent during 2000.
PLDT
• Focus on diversifying revenue streams ACHIEVED
Significant growth in Cellular, Data and Other NetworkServices has considerably reduced reliance on InternationalLong Distance revenues.
• Continue to grow EBITDA through efficient cost managementACHIEVED
Consolidated EBITDA has grown seven per cent, despite significant marketing expenses incurred to grow the Cellularbusiness.
• Grow Internet-based, data oriented, value added services ACHIEVED
Data and Other Network Services now make up five per cent ofrevenue, representing growth of 54 per cent year on year.
• Grow GSM service in terms of capacity and subscribers ACHIEVED
Subscribers grew twelvefold to 2.7 million GSM subscribers; by year end capacity had increased to support up to 3.95 millionsubscribers.
• Realize synergies through the integration of wireline and wirelessoperations ACHIEVED
PLDT acquired Smart’s local exchange carrier. Smart andPiltel merged and rationalized operations, business functions,and cell sites, resulting in reduced administrative and maintenance costs.
• Accelerate the convergence strategy to develop a multimedia platform for total communications solutions ACHIEVED
ePLDT, the corporate vehicle for PLDT’s Internet, e-commerceand multimedia businesses, has been formed, offeringInternet Data Center, e-business delivery, call center andprocurement services.
METRO PACIFIC
• Continue to position Metro Pacific as a property development andservices company ACHIEVED
As a result of asset disposals, more than 90 per cent of Metro Pacific’s assets now relate to property.
• Continue to develop revenue sources through interim land use programs ACHIEVED & CONTINUING
Construction started on HatchAsia Global City Center, a24,000 sq.m. building that will house incubator firms; 50 percent of the facility is pre-leased to HatchAsia. Metro Pacific’sFort Bonifacio also signed land leases totaling 51,700 sq.m.with a variety of commercial and consumer businesses.
Review of Goals for 2000

p. 11
METRO PACIFIC continued
• Maximize the potential for Information Technology Zone status byoffering e-business solutions to locators and property developersACHIEVED
Metro Pacific launched E-Square, a 25-hectare IT developmentproject registered with the Philippine Economic ZoneAuthority (PEZA).
• Continue to enhance value through the vigorous development of theGlobal City ACHIEVED & CONTINUING
The construction of the Bonifacio Ridge residential high riseproject is underway and 136 units have been sold. Big Delta,Pacific Plaza Towers and the Kalayaan flyover access route wereall completed.
BERLI JUCKER
• Aggressively seek value-creating opportunities to deliver betterreturns on equity ACHIEVED
Certain non-core, non-branded, assets have been sold. Despite concerted efforts, a value enhancing acquisition wasunachievable at realistic valuations. Therefore, to enhancereturns on equity, a special interim dividend, totaling US$62 million, was paid through raising debt.
• Increase focus on branded consumer products ACHIEVED
Significant market share gains achieved in the tissue andsnacks businesses.
DARYA-VARIA
• Achieve organic growth by developing new prescription and over-the-counter products PARTIALLY ACHIEVED
Following extensive streamlining of product lines, salesincreased 21 per cent. New products have been developed, but resource constraints hindered full launch.
• Conclude the implementation of management and distributioninformation systems ACHIEVED
New management systems are in place, affording optimal efficiency and improved competitiveness.
ESCOTEL
• Develop value added services ACHIEVED
Escotel has introduced a range of tailored products and services,including Internet-to-cellular messaging, international auto-matic roaming, and unique mobile to mobile rates.
• Conclude strategic, value enhancing transactions NOT ACHIEVED
A number of acquisitions were identified and accessed.However, unrealistic valuations precluded further progress.
• Achieve break-even by year end 2000 NOT ACHIEVED
Despite subscriber growth, the exponential growth of prepaidservices put ARPU under pressure.
Goals for 2001
FI RST PACIFIC
• Continue to enhance recurrent profits and cash flow• Refinance convertible bonds with long-term debt • Continue to consolidate ownership positions in core businesses• Seek value-enhancing transactions consistent with core
business focus• Enhance recurrent cash flows to Head Office• Finalize the evaluation review of Metrosel and execute conclusions
INDOFOOD
• Reorganize operations to create greater definition betweenbranded consumer products and the commodity businesses
• Explore opportunities for utilizing substantial free cash flows • Continue to implement corporate governance initiatives
to align Indofood’s practices with international best practice• Resume dividend payments to shareholders
PLDT
• Continue to grow consolidated revenue and net profit • Maintain momentum for growing cellular subscribers to achieve
a total of 5.5 million subscribers by year-end• Continue 2000 initiatives in respect of revenue diversification
and efficiencies• Advance ePLDT as a platform for future revenue growth
METRO PACIFIC
• Conclude disposals of remaining non-core assets• Simplify corporate ownership structure• Put long-term financing in place to better match long-term
revenue streams
BERLI JUCKER
• Continue to seek value-enhancing opportunities
DARYA-VARIA
• Grow revenues faster than the total market to increase marketshare
ESCOTEL
• Achieve cash flow break-even• Conclude strategic, value-enhancing transactions to broaden
geographical presence
IN FRONTIER
• Establish the operational infrastructure required to build a sustainable pan-Asian business solutions provider
• Evolve from start-up to develop sustainable revenues to achieveprofitability by year-end 2003

p. 12
Manuel V. PangilinanEXECUTIVE CHAIRMAN
Age 54, born in the Philippines. Mr. Pangilinan received a BA from Ateneo de Manila University and an MBA from the University of Pennsylvania’s WhartonSchool before working in the Philippines and Hong Kong for the PHINMA Group,Bancom International Limited andAmerican Express Bank. He served as First Pacific’s Managing Director afterfounding the company in 1981, and wasappointed Executive Chairman in February1999. Mr Pangilinan was named Presidentand CEO of PLDT in November 1998. Hewas appointed as Governor of The PhilippineStock Exchange in August 2000 andChairman of The Philippine Business forSocial Progress Charity in February 2001.Mr. Pangilinan also serves as PresidentCommissioner of Indofood, as Chairman ofMetro Pacific Corporation and Fort BonifacioDevelopment Corporation, and as a Directorof Bonifacio Land Corporation, Berli Juckerand Escotel.
William J. Scott EXECUTIVE VICE PRESIDENT
AND GROUP FINANCIAL CONTROLLER
Age 35, born in Scotland. Mr. Scott receivedan MA (Hons) from the University ofAberdeen, Scotland. He is a member of theInstitute of Chartered Accountants ofScotland and of the Financial AccountingStandards Committee of the Hong KongSociety of Accountants. Mr. Scott joinedFirst Pacific in March 2000 fromPricewaterhouseCoopers’ audit and businessadvisory department in the United Kingdom.
Joseph H.P. Ng EXECUTIVE VICE PRESIDENT, GROUP FINANCIAL PLANNING
Age 38, born in Hong Kong. Mr. Ng receivedan MBA and a Professional Diploma inAccountancy from the Hong Kong PolytechnicUniversity. He is a member of the Hong Kong Society of Accountants and of the Association of Chartered CertifiedAccountants. Mr. Ng joined First Pacific in1988 from Price Waterhouse’s audit andbusiness advisory department in Hong Kongand served in several senior finance posi-tions prior to being appointed ExecutiveVice President, Group Financial Planning in December 1999. He also serves as aDirector of Escotel.
Michael J.A. Healy CHIEF OPERATING OFFICER
AND FINANCE DIRECTOR
Age 40, born in Scotland. Mr. Healy receiveda BA from the University of Stirling,Scotland. He is a member of the Institute of Chartered Accountants of Scotland and the Hong Kong Society of Accountants. Mr. Healy joined First Pacific in 1994, having served in Price Waterhouse’sGlasgow and Hong Kong audit and businessadvisory departments. Prior to his appoint-ment as Finance Director in February 1999,Mr. Healy held several senior finance posi-tions and, in January 2000, he assumed theadditional responsibilities of Chief OperatingOfficer. He also serves as a Commissioner of Indofood, and as a Director of Berli Jucker,Escotel and Infrontier.
Edward A. TortoriciEXECUTIVE DIRECTOR
Age 61, born in the United States. Mr. Tortorici received a BS from New YorkUniversity and an MS from FairfieldUniversity. He founded EA EdwardsAssociates, an international managementand consulting firm in San Francisco. Mr. Tortorici joined First Pacific as anExecutive Director in 1987 and launchedthe Group’s entry into the telecommunica-tions business. He is responsible for organization and strategic planning, withspecific responsibility for First Pacific’sinvestments in Indonesia and E-commercebusiness. Mr. Tortorici also serves as a Commissioner of Darya-Varia and as aDirector of Indofood and Infrontier.

The Hong Kong Head Office Team
Rebecca G. Brown EXECUTIVE VICE PRESIDENT, GROUP CORPORATE COMMUNICATIONS
Age 36, born in Zimbabwe. Ms. Brown qualified in the United Kingdom and is a fellow of the Association of CharteredCertified Accountants and a member of theNational Investor Relations Institute. After eight years in London with ShellInternational, she joined First Pacific in 1996 and served in several senior financepositions. In September 1999, Ms. Brownwas named Executive Vice President, GroupCorporate Communications.
Ronald A. BrownEXECUTIVE DIRECTOR, GENERAL COUNSEL
AND COMPANY SECRETARY
Age 54, born in the United States. Mr. Brown received an AB from DartmouthCollege and a JD and MPA from HarvardUniversity. He is a member of the CaliforniaState Bar and the District of Columbia Bar.He served on the Board of Governors of theFederal Reserve System’s Washington, D.C.,legal office before joining the Bank ofAmerica, where he headed the Asia DivisionLegal Office in Hong Kong. Mr. Brown joinedFirst Pacific in 1986 as general counseland company secretary and was named anExecutive Director in February 1999. He also serves as a Director of Berli Juckerand Infrontier.
Darryl J. KinneallyEXECUTIVE VICE PRESIDENT
Age 37, born in Australia. Mr. Kinneally received a B.Com. from the University of Queensland and is an associate member of the Institute of Chartered Accountants in Australia. He is a fellow of the Taxation Institute of Australia. Mr. Kinneally is responsible for the Group’s tax function, as well as the development of the Group’s consumer interests. He joined First Pacific in 1996 having served in Arthur Andersen’s Sydney, Tokyo and Brisbane tax depart-ments. Mr. Kinneally also serves as a Commissioner of Indofood and as a Director of Darya-Varia and Metrosel.
Maisie M.S. Lam EXECUTIVE VICE PRESIDENT, GROUP HUMAN RESOURCES
Age 46, born in Hong Kong. Ms. Lamreceived a Diploma from Hong KongPolytechnic University/Hong KongManagement Association. She joined First Pacific in 1983 from Citicorp’s merchant banking arm in Hong Kong.
David G. EastlakeEXECUTIVE DIRECTOR
Age 37, born in England. Mr. Eastlakereceived a BA from the University of Exeter,England. He is a member of the Institute of Chartered Accountants in England & Walesand the Hong Kong Society of Accountants.Mr. Eastlake joined First Pacific in 1997,having served in Price Waterhouse’s Londonand Hong Kong audit and business advisorydepartments. He is responsible for theGroup’s treasury function and, in December1999, was appointed an Executive Director.Mr. Eastlake, who is to be appointed as a Commissioner of Indofood, also serves as a Director of Berli Jucker, Escotel and Infrontier.

p. 14
Board of Directors
OTHER DI RECTORS
Ricardo S. PascuaEXECUTIVE DIRECTOR
Age 52, born in the Philippines. Mr. Pascua received a BA from Ateneo de Manila University and an MBA from the Asian Institute ofManagement, after which he joined Bancom Development. Mr. Pascuajoined First Pacific in 1982 as an Executive Director and has served as Managing Director of First Pacific Bank. He currently serves asChairman and CEO of Bonifacio Land Corporation, Vice Chairman,President and CEO of Fort Bonifacio Development Corporation, andVice Chairman, President and CEO of Metro Pacific Corporation.
Edward K.Y. Chen, CBE, JPNON-EXECUTIVE DIRECTOR
Age 55, born in Hong Kong and educated at the University of HongKong and Oxford University. Mr. Chen serves as President of LingnanUniversity, and is a Director of Asia Satellite Telecommunications andEaton Vance Management Funds. Formerly, he served as Chairman of Hong Kong’s Consumer Council, as an Executive Councilor of theHong Kong Government and as a Legislative Councilor. Mr. Chen joinedFirst Pacific’s Board in 1993.
Sutanto DjuharNON-EXECUTIVE DIRECTOR
Age 72, born in Indonesia. Mr. Djuhar has founded numerousIndonesian companies involved primarily in real estate development. He is a Commissioner of PT Indocement Tunggal Prakarsa Tbk, PTKartika Chandra and PT Metropolitan Kencana, and serves as aDirector of PT Bogasari Flour Mills and PT Inti Petala Bumi. Mr. Djuhar, who is the father of Tedy Djuhar, joined First Pacific’s Board in 1981.
Tedy DjuharNON-EXECUTIVE DIRECTOR
Age 49, born in Indonesia. Mr. Djuhar is a Director of PT IndocementTunggal Prakarsa Tbk and a number of other Indonesian companies.He is the son of Sutanto Djuhar. Mr. Djuhar joined First Pacific’s Board in 1981.
James C. NgNON-EXECUTIVE DIRECTOR
Age 57, born in Hong Kong. Mr. Ng received a BA in Finance fromSan Jose State University and an MBA from Golden Gate University.An Executive Director since February 1999, he joined First Pacific in1986, serving for five years as President and CEO of United CommercialBank in San Francisco before assuming the role of First Pacific Bank’sManaging Director and Chief Executive Officer in 1991. Mr. Ngresigned from the First Pacific Board in March 2001.
Ibrahim RisjadNON-EXECUTIVE DIRECTOR
Age 66, born in Indonesia. Mr. Risjad serves as Commercial Director ofPT Indocement Tunggal Prakarsa Tbk, Chairman of RSI Bank and Vice President of the Board of Commissioners of PT Indofood SuksesMakmur Tbk. He joined First Pacific’s Board in 1981.
Anthoni SalimNON-EXECUTIVE DIRECTOR
Age 51, born in Indonesia. Mr. Salim serves as President and CEO ofthe Salim Group. Mr. Salim is the son of Soedono Salim, and has servedas a Director of First Pacific since 1981.
OTHER DI RECTORS continued
David W.C. Tang, OBENON-EXECUTIVE DIRECTOR
Age 46, born in Hong Kong. Mr. Tang is the founder of the ShanghaiTang stores, the China Club in Hong Kong and Beijing, and The PacificCigar Company. He holds directorships on the boards of Lai SunDevelopment Limited, Free Duty Limited, and Asprey & Garrard, aswell as serving on the International Advisory Board of The Savoy Groupof London. Mr. Tang joined First Pacific’s Board in 1989.
ADVISORS
Soedono SalimHONORARY CHAIRMAN AND ADVISOR TO THE BOARD
Age 84, born in China. Mr. Salim served as First Pacific’s Chairmanfrom 1981 until February 1999, when he assumed his current titles. He serves as Chairman of the Salim Group, and is aCommissioner or Director of numerous other Indonesian companies.
SudwikatmonoADVISOR TO THE BOARD
Age 66, born in Indonesia. Mr. Sudwikatmono served as a Director ofFirst Pacific from 1981 until February 1999, when he assumed his cur-rent title. He is a Director of PT Bogasari Flour Mills, President Directorof PT Indocement Tunggal Prakarsa Tbk, and holds board positions with a number of other Indonesian companies.
Thomas Y. YasudaSENIOR ADVISOR
Age 60, born in the United States. Mr. Yasuda received an AB fromDartmouth College and a JD from Harvard Law School. After servingas an officer in the U.S. Navy and as an advisor in Vietnam, he joinedthe San Francisco law firm of Graham & James, where he became apartner. He joined First Pacific as an Executive Director in 1983 withresponsibility for Consumer and Telecommunications operations.Mr. Yasuda served as Managing Director from February 1999 until his retirement in January 2000, when he assumed his current title. He also serves as a Director of Escotel.
BOARD OF DI RECTORS AS AT 31 MARCH 2001
EXECUTIVE DIRECTORS
Manuel V. Pangilinan (Executive Chairman) Michael J.A. Healy (Chief Operating Officer and Finance Director) Ronald A. Brown David G. EastlakeRicardo S. PascuaEdward A. Tortorici
NON-EXECUTIVE DIRECTORS
Sutanto DjuharTedy DjuharIbrahim RisjadAnthoni Salim
INDEPENDENT NON-EXECUTIVE DIRECTORS
Edward K.Y. Chen, CBE, JPDavid W.C. Tang, OBE

p. 15
Our People. Our Communities.

p. 16
company-sponsored recreational activities and community
service programs. These programs and activities create
strong bonds, not only between employees and their company,
but also between First Pacific people and their communities.
OUR COMMUNI TIES
First Pacific is a company with a strong sense of responsi-
bility to the communities in which our people live and
work. In 2000, our Head Office donated some US$168,000
to a dozen different charitable, community and cultural
organizations in Hong Kong, principally in areas related to
health, youth and culture.
Among them was the Hong Kong Community Chest's
Corporate and Employee Contribution program, which
donates funds to some 140 health and welfare agencies
serving the needs of the less fortunate. Another major
beneficiary of First Pacific contributions was the Hong Kong
Cancer Fund, which provides aid and counseling to cancer
patients and their families, as well as promoting cancer
awareness and conducting related research. First Pacific is
also a “Platinum” donor to The Hong Kong Arts Festival
Society ’s Student Ticket Scheme, and our support enabled
OUR PEOPLE
First Pacific has emerged from three years of restructuring
as a new company – with a stronger portfolio of assets, a
solid balance sheet, and a sharper focus on Asian markets.
Today, the First Pacific workforce comprises approximately
68,500 people, all of whom live and work in Asian countries,
including Indonesia, the Philippines, and Thailand.
First Pacific delivers value to its Group companies –
and its shareholders – by providing strategic guidance
and operational management expertise at both the com-
pany and Head Office levels. Our operating philosophy
and reporting structure are designed to empower Group
companies to manage their businesses autonomously
while taking advantage of direct access to First Pacific’s
experienced management team.
First Pacific supports equal opportunity business
practices and encourages initiative and creativity among
employees at all levels. In addition, First Pacific compa-
nies provide a wide range of benefits to their employees,
including pension plans, health care coverage, on-the-job
training, and performance-related bonus programs.
First Pacific employees also participate in a variety of

some 10,400 students to attend 106 Hong Kong Arts
Festival performances at half price.
But our commitment to community service goes
beyond monetary contributions. A good example is our
annual participation in Hong Kong’s Youth Arts Festival.
The Festival, which is dedicated to bringing together youth
from diverse backgrounds and cultures with local and
international artists, attracted more than 36,000 students
and participants and included some 400 workshops and
performances. In addition to making a corporate donation,
First Pacific people have participated directly in the
Festival, most recently joining college students from
Cheung Chau Island to paint a large mural at the college
through the “Art Angels” program.
In addition to these corporate-level activities, First
Pacific companies donated approximately US$2.6 million
to their communities during 2000 for programs supporting
education, health and the environment. As well as cash
donations, our employees donated their time and energy
to community service activities in 2000.
Here are just a few examples:
• Indofood volunteers support the Red Cross, and Indofood
provides free baking courses to hawkers, as well as agri-
cultural and management training to farmers and supplier
cooperatives.
• PLDT volunteers distributed relief goods, have promoted
outreach programs for needy, hospitalized children, and
cleaned the seashores of litter.
• Volunteers from Metro Pacific’s Fort Bonifacio operation
distributed annual grocery gift bags to some 800 needy
families, as well as coordinating a Christmas party for
400 children. Metro Pacific employees also distributed
relief goods to Philippine flood victims, participated in
reforestation efforts in Antipolo, and contributed to an air
pollution relief campaign.
• Berli Jucker employees built a rural school’s library
and volunteered their assistance to a flood relief program
in Thailand.
• Escotel volunteers helped to distribute garments to
handicapped children in India and supported the campaign
against the unnecessary use of polythene bags.

p. 18
Contribution to
Turnover Group profit
2000 1999 2000 1999
US$m US$m US$m US$m
CONSUMER
Indofood* 1,490.3 440.4 55.7 16.4Berli Jucker 281.3 294.2 9.9 15.6Darya-Varia 50.5 45.7 5.0 5.6
1,822.1 780.3 70.6 37.6TELECOMMUNICATIONS
PLDT* 1,334.5 1,184.7 25.6 18.5Smart (1) 80.5 307.2 (9.0) 13.9Escotel* 35.7 21.6 (11.8) (12.6)China telecom ventures (2) – – – 7.6
1,450.7 1,513.5 4.8 27.4PROPERTY
Metro Pacific 240.0 317.5 (6.4) (4.4)FPDSavills/Savills (3) 37.2 167.4 6.0 7.7SPORTathlon (4) 5.1 10.3 (0.4) (0.2)
282.3 495.2 (0.8) 3.1BANKING
First Pacific Bank 114.3 89.2 13.9 3.5Subtotal 3,669.4 2,878.2 – –Non-consolidated operations* (2,860.5) (1,646.7) – –CONTRIBUTION FROM OPERATIONS
BEFORE EXCHANGE DIFFERENCES (5) 808.9 1,231.5 88.5 71.6Corporate overhead (11.8) (16.0)Finance (charges)/income: net bank interest (1.4) 10.5
convertible bonds (24.3) (24.7)Recurring profit before exchange differences 51.0 41.4Gain on disposal/dilution less provision for investments (6) 143.7 92.6Exchange (losses)/gains (7) (143.5) 4.2PROFIT ATTRIBUTABLE TO ORDINARY SHAREHOLDERS 51.2 138.2
* Associated companies(1) Merged with PLDT on 24 March 2000.(2) Disposed on 10 March 2000.(3) First Pacific Davies’ Asian operations injected into Savills on 7 April 2000.(4) Disposed on 29 June 2000.(5) After taxation and outside interests.(6) Adjusted, as appropriate, for related tax and outside interests. (7) Due to the significance of foreign exchange movements on Group profit in 2000, these have been separately identified.
Comparatives for 1999 have been presented on a similar basis.
Contribution Summary
Contributionfrom Operations
by Country2000
US$millions
Contributionfrom Operations
by Country1999
US$millions
Indo
nesi
a
Ph
ilip
pine
s
Tha
iland
Hon
g K
ong/
Ch
ina
Indi
a
50
30
10
-10
60
40
20
0
-20
50
30
10
-10
60
40
20
-20
Indo
nesi
a
Ph
ilip
pine
s
Tha
iland
Hon
g K
ong/
Ch
ina
Indi
a
0
Review ofOperations
Indofood
PLDT
Smart
MetroPacific
Berli Jucker
Darya-Varia
Escotel
FPDSavills
Disposed
Businesses
Infrontier
contents
19
23
26
27
30
32
34
35
36
36

p. 19
Turnover Profit
2000 1999(1) 2000 1999*(1)
US$m US$m % change US$m US$m % change
Instant Noodles 519.0 553.2 -6.2 103.5 114.6 -9.7Flour 394.4 354.4 +11.3 81.5 84.8 -3.9Edible Oils and Fats 305.2 355.1 -14.1 67.3 79.8 -15.7Others 271.7 221.7 +22.6 19.9 18.2 +9.3Total 1,490.3 1,484.4 +0.4Operating profit 272.2 297.4 -8.5Share of profits less losses of associates 0.1 1.2 -91.7Net borrowing costs (49.7) (55.4) +10.3Profit before taxation 222.6 243.2 -8.5Taxation (68.1) (66.6) -2.3Profit after taxation 154.5 176.6 -12.5Outside interests (15.2) (16.0) +5.0Profit attributable to ordinary shareholders 139.3 160.6 -13.3Average shareholding 40.0% 40.0% –Contribution to Group profit 55.7 16.4 +239.6
* 1999 comparative figures have been restated to exclude the effect of exchange differences.(1) Based on full-year rupiah results, translated at Rupiah 7,780 to US$1, which are not adjusted for Hong Kong GAAP. Hong Kong
GAAP adjustments are not considered to be material.
The single largest contributor to the Group, Indofood contributed US$55.7 million in2000. This compares to US$16.4 million recorded for 1999, reflecting First Pacific’sSeptember 1999 acquisition of a 40 per cent interest. In December 2000, First Pacificincreased its interest in Indofood to 48 per cent.
INSTANT NOODLES
The largest of Indofood’s operating divisions, Instant Noodles sold 9.0 billion packs in 2000
(1999: 8.1 billion packs), eclipsing even pre-crisis sales levels and accounting for 34.8 per cent
of Indofood’s US$1.5 billion turnover, and 38.0 per cent of total operating profit of US$272.2 mil-
lion. In addition to its hugely popular soup-style instant noodles, Indofood produces and markets
more than 100 varieties, for all tastes and dietary requirements, including stir-fry style noodles,
air-dried noodles, cup noodles, snack noodles and egg noodles.
While sales are principally to the domestic market, the Instant Noodles export market
is expanding in both revenues and reach. In 2000, export volumes increased 76.7 per cent
to 129 million packs. Exports now reach 36 countries worldwide, of which the largest markets
are Australia, Malaysia, Brunei, Saudi Arabia, and the Netherlands. Domestically, Indofood
has consolidated its market leadership by launching new products and flavors, and by expanding
its retail sales channels to include minimarkets and hypermarkets.
In 2000, the average selling price per pack declined to Rupiah 494 (1999: Rupiah 538
per pack). This principally reflects the change in accounting for trade discounts, which from
1 January 2000 are deducted from the selling price, where previously these were recorded as
selling expenses. As a result, while sales volume increased 10.8 per cent, the rupiah-based
Indofood
INDOFOOD SOLD 9 BILLION PACKS OF INSTANT NOODLES
IN 2000THIS EQUATES TO 17 THOUSAND
PACKS PER MINUTE

RECONCILIATION OF REPORTED INDOFOODRUPIAH RESULTS TO FIRST PACIFIC GROUP US$ RESULTS
p. 20
turnover did not keep pace, increasing 2.8 per cent. When translated to U.S. dollars, turnover
declined 6.2 per cent due to a weaker rupiah.
To offset this decline, Indofood introduced high-end brands, such as Chatz Mie. The
company also increased prices in the latter months of 2000, which helped increase the
average price per pack to Rupiah 519 by December 2000. Operating profits were further
eroded as certain key input costs, namely packaging and production fuel oil costs, escalated
as the rupiah depreciated 28 per cent against the U.S. dollar. In addition, promotion costs
incurred to support increased marketing activity eroded operating margins to 19.9 per cent
(1999: 20.7 per cent).
2000
RUPIAH
MILLIONS
AS REPORTED BY INDOFOOD 646,172
DIFFERING ACCOUNTING TREATMENTS (1) (81,906)
FOREIGN EXCHANGE (2) 622,648
ADJUSTED NET INCOME 1,186,914
US$
MILLIONS
TRANSLATED AT AN AVERAGE RATE OF US$1:RUPIAH 8,523 139.3
CONTRIBUTION TO GROUP PROFIT, AT AN AVERAGE SHAREHOLDING OF 40.0% 55.7
(1) These adjustments arise because of differences in accounting for certain items under Indonesian GAAP, as appliedby Indofood, and Hong Kong GAAP, as applied by First Pacific. Principal adjustments include:• Pension expenses: Under Indonesian GAAP, Indofood has accounted for such costs on a cash basis. First Pacificaccrues for all related liabilities. As such, First Pacific has adjusted recorded pension costs to reflect accruals.• Foreign exchange: Under Indonesian GAAP, Indofood is permitted to capitalize and amortize certain exchange differences. Under Hong Kong GAAP, the treatment is to recognize such losses, even though unrealized, in the profitand loss. Indofood’s current policy is to record foreign exchange differences through the profit and loss. However, as in previous years certain exchange losses were capitalized, First Pacific has reversed the amortization of thesepreviously capitalized foreign exchange differences.
(2) To illustrate underlying operations, contribution from operations is shown before exchange differences. As such, First Pacific has excluded exchange losses, net of related tax, and presented these items separately.
FLOUR
Bogasari Flour Mills became a division of Indofood on 30 June 1995. Opened in 1971,
Bogasari is best known for its three core brands: Cakra Kembar, Kunci Biru and
Segitiga Biru.
Bogasari also produces by-products in the form of bran, pollard for co-operatives and
the animal feed industry, and industrial flour for the plywood industry. Almost half of all
by-product sales are to export markets.
In December 1991, Bogasari established its Pasta Division, with a capacity of
60,000 metric tons per year, to produce a variety of pastas, 76.6 per cent of which is sold in
export markets.
In 2000, Bogasari contributed 26.5 per cent of Indofood’s turnover of US$1.5 billion,
and 29.9 per cent of total operating profit of US$272.2 million.
Bogasari’s principal business line, food flour, accounts for 75 per cent of its total sales
volume. In addition to its wheat milling facilities, Bogasari has unparalleled technical
support resources, including quality control laboratories, distribution jetties and ports, and
training centers to meet the needs of milling professionals and consumers alike.
Indofood continued

p. 21
Domestic demand for flour reached 3.1 million metric tons in 2000, an increase of
18.8 per cent, and Bogasari, operating the largest flour facilities in the world, retained its
market leader position.
Since the Indonesian wheat milling market was deregulated in July 1998, Bogasari has
moved beyond bulk milling to producing tailored consumer products for both commercial and
domestic use. By offering a range of flour products to meet the wide-ranging manufacturing needs
of noodle, bread, biscuit and snack producers, Bogasari has now captured 68 per cent of the market.
As a consequence, despite having to contend with fierce competition from cheaper,
imported flour, Bogasari actually increased its sales volume by 24.8 per cent to 2.1 million
metric tons. At an average price of Rupiah 1,895 per kilogram, this translated to a 21.9 per
cent growth in turnover to Rupiah 3.4 trillion.
With a declining rupiah, the cost of imported wheat rose. This, in turn, put pressure
on Bogasari’s gross margin, which closed the year at 27.2 per cent (1999: 28.6 per cent). The
expansion of depot and warehouse facilities led to increased support costs, causing operating
margin to decline from 23.9 per cent in 1999 to 20.7 per cent in 2000.
EDIBLE OILS AND FATS
Indofood’s Intiboga Sejahtera is the largest producer of cooking oil, margarine and shortening
in Indonesia offering a range of branded products – Bimoli, Sunrise, Delima, Cornola, Happy
Salad Oil, Simas, Amanda and Palmia – to meet the needs of households, hotels and industry.
The Edible Oils and Fats division consists of two sub-divisions: Branded Products and
Commodity Products.
Edible Oils and Fats contributed 20.5 per cent of Indofood’s of US$1.5 billion turnover,
and 24.7 per cent of total operating profit of US$272.2 million.
Modest growth in consumption helped sales volumes of Branded Products increase by
3.2 per cent in 2000 to 385.5 thousand metric tons. However, declining prices reduced the
average selling price by 19.3 per cent to Rupiah 3,467 per kilogram and, as a consequence,
sales revenue declined 14.3 per cent to Rupiah 941.9 billion. This translated to a 21.8 per
cent decline in translated U.S. dollar terms. There was no significant change in either the
gross or operating margin.
Commodity Products sales volume increased 24.0 per cent to 735.9 thousand metric
tons. Underlying sales increased for both coconut oil (CNO) based products (up 25.5 per cent
to 266.8 thousand metric tons) and crude palm oil (CPO) based products (up 23.1 per cent to
469.1 thousand metric tons). However, the average selling price of CNO declined by more than
a third to Rupiah 2,370 per kilogram, while CPO prices declined 4.1 per cent to Rupiah 2,137
per kilogram, both declines adversely affecting sales revenues. As a consequence, rupiah
sales revenue declined marginally over the year, and U.S. dollar translated revenues declined
8.9 per cent. There was no significant change in either the gross or operating margin.
IndofoodOperating Profit
38%25%
30%
7%
US$millions
Instant Noodles 103.5Flour 81.5Edible Oils and Fats 67.3Others 19.9Total 272.2
IndofoodTurnover
35%
21%
26%
18%
US$millions
Instant Noodles 519.0Flour 394.4Edible Oils and Fats 305.2Others 271.7Total 1,490.3
FOOD FLOUR ACCOUNTS FOR
75 PER CENT OF BOGASARI’S TOTAL SALES VOLUME

p. 22
OTHERS
Collectively, Indofood’s Distribution, Food Seasonings, Baby Foods, Snack Foods and other
businesses contributed 18.2 per cent of Indofood’s US$1.5 billion turnover, and 7.3 per cent
of total operating profit of US$272.2 million.
Distribution, which accounts for 11.8 per cent of total sales, recorded significant
growth year on year. This stemmed from a 29.2 per cent increase in sales to Rupiah 1.5 trillion,
and improved cost controls which enhanced the operating margin to 5.4 per cent (1999:
3.2 per cent).
Food Seasonings recorded a 12.6 per cent increase in sales volume which, together
with increased prices, translated to a 28.6 per cent increase in revenues to Rupiah 230.2 billion.
However, increased promotional activities eroded the operating margin to 10.7 per cent
(1999: 14.9 per cent).
Baby Foods recorded a 52.5 per cent increase in sales volume to 15,831 metric tons.
However, a change in product mix following the introduction of an economy range of products,
resulted in sales revenues increasing by 41.2 per cent to Rupiah 211.4 billion. Both the gross
(37.6 per cent) and operating (20.1 per cent) margins improved, while strong demand
prompted capacity expansion during the year.
Snack Foods recorded a 29.1 per cent growth increase in sales volumes, to 6,411 metric
tons, following the success of its ChiCheJetTen promotional campaign. This growth, coupled
with price increases for Chitato and the introduction of new higher-end products, resulted in
a 36.5 per cent increase in sales revenues to Rupiah 177.1 billion. Higher prices led to
improved gross (37.6 per cent) and operating (20.4 per cent) margins.
OVERVIEW AND OUTLOOK
Indofood continues to grow from strength to strength. In a difficult year with a weakening
rupiah, Indofood recorded increased sales volumes in all divisions, and was able to generate
sufficient cash to repay some US$300 million of bank loans. This will help reduce Indofood’s
future exposure to a volatile rupiah, while reducing annual net financing charges by
10.3 per cent.
Looking ahead, Indofood continues to be a growth-oriented company. With its consider-
able expertise and strong cash flows, Indofood is well positioned to expand either organically
or through acquisition.
IndofoodSales Volume
9.5
9.0
8.5
8.0
7.5
7.0
3.0
2.0
1.5
2.5
Instant Noodles in billions of packsFlour in millions of tons
Instant Noodles Flour
96 9897 99 00
INDOFOOD MAINTAINS 121 INSTANT NOODLE
PRODUCTION LINESIN 17 FACTORIES CAPABLE OF PRODUCING
13 BILLION PACKS A YEAR
All divisions recordedincreased sales volumes in 2000
Indofood continued

p. 23
Turnover Profit
2000 1999 2000 1999*
US$m US$m % change US$m US$m % change
Cellular 287.7 66.8 +330.7 24.5 48.3 -49.3Fixed Line 423.3 417.9 +1.3 (16.9) (166.5) +89.8Long Distance:
International 289.9 378.1 -23.3 136.4 260.6 -47.7National 237.4 257.3 -7.7 209.6 212.3 -1.3
Data and Other Network Services 73.0 47.3 +54.3 20.4 35.6 -42.7
Miscellaneous 23.2 17.3 +34.1 0.6 4.6 -87.0Total 1,334.5 1,184.7 +12.6Operating profit 374.6 394.9 -5.1Share of profits less losses of associates 0.3 (0.2) –Net borrowing costs (230.3) (220.4) -4.5Profit before taxation 144.6 174.3 -17.0Taxation (62.7) (72.8) +13.9Profit after taxation 81.9 101.5 -19.3Outside interests 36.3 29.6 +22.6Profit for the year 118.2 131.1 -9.8Preference share dividends (28.0) (28.0) –Profit attributable to ordinary shareholders 90.2 103.1 -12.5Average shareholding 22.1% 17.5% –Contribution to Group profit 25.6 18.5 +38.4
* 1999 comparative figures have been restated to exclude the effect of exchange differences.
PLDT contributed US$25.6 million (1999: US$18.5 million) as a consequence ofphenomenal growth in its Cellular revenues, and steady, sustained growth in Dataand Other Network Services revenues.
CELLULAR
PLDT’s Cellular group consists of Smart and Piltel. PLDT’s acquisition of Smart, in March
2000, greatly enhanced its cellular credentials and provided the platform for an alliance with
Japan’s NTT Communications, one of the world’s largest telecommunications groups.
Recognizing the enormous potential of GSM, PLDT aggressively pursued the rollout of
Smart’s GSM service to gain market share. Significant network expansion costs were
incurred, as were subscriber acquisition costs – relating to dealer commissions, handset sub-
sidies and marketing costs – which peaked at Pesos 4,400 per subscriber in April 2000. As
a consequence, Smart recorded substantial losses in the first and second quarters, returning
to profitability in July 2000 when critical mass was achieved and subsidies declined. Over
the year, some 2.1 million Smart GSM subscribers were added, equating to 178,000 sub-
scribers per month on average. By the end of the year, reduced handset subsidies led to an 83
PLDT
IN FACT, TEXT MESSAGESOUTNUMBER
VOICE MESSAGES 10 TO ONE
THE PHILIPPINES IS THE TEXT MESSAGING CAPITAL
OF THE WORLD

p. 24
per cent decline in subscriber acquisition costs such that, by year-end, they stood at Pesos
691 per subscriber. This, however, did not impact subscriber uptake, which remained strong.
Piltel, a sister company of Smart, leveraged Smart’s dominant market position to
launch a tailored GSM service called Talk ’N Text in April 2000. Against a backdrop of
unprecedented growth in text messaging, a feature available only through a digital service,
Piltel targeted ‘value for money ’ subscribers by offering select services and less expensive
handsets. Together, these companies had, by year-end, built a GSM customer base of 2.7 mil-
lion subscribers within a total cellular subscriber base of more than 3.5 million. In doing so,
the PLDT Cellular group established itself as the largest and fastest growing mobile service
in the Philippines.
Smart earns its revenues from subscriptions, international and domestic call charges,
prepaid card sales, incoming call revenues, international roaming revenues and ‘value added
service’ revenues. Fully 82 per cent of Smart’s total revenues came from its GSM service.
And 97 per cent of that amount comes from Smart’s prepaid GSM service, Smart Buddy,
which was launched in September 1999. ARPU for Smart Buddy declined over the year to
Pesos 1,033 (1999: Pesos 2,313) reflecting a full year of operation and an expanding subscriber
base that ended the year up 1,399 per cent at 2,263,322 subscribers (1999: 150,961 sub-
scribers). Average monthly churn remains very low at 0.4 per cent.
Smart’s postpaid GSM service, Smart Gold, which was launched in April 1999, recorded
a 68 per cent increase in subscribers, ending the year with 67,683 subscribers (1999: 40,333
subscribers). For reasons similar to Smart Buddy, ARPU for Smart Gold declined to an average
of Pesos 2,541, from Pesos 3,410 at year-end 1999. Monthly average churn was 3.4 per cent
as subscribers switched to the prepaid service.
Smart’s analog service, the backbone of growth during Smart’s formative years, retains
527,474 subscribers (1999: 833,856 subscribers), despite the phenomenal demand for digital
texting. Both ARPU and churn are weaker as analog subscribers migrate to digital services,
with blended ARPU at Pesos 327 (1999: Pesos 712), and average blended churn at 3.9 per cent
per month.
Piltel’s subscriber base increased 44 per cent to close the year at 656,814 subscribers
(1999: 456,957 subscribers). Its market-targeted Talk ’N Text service signed up 368,578
subscribers but, despite extraordinary subscriber growth, revenues did not enjoy comparable
growth as Piltel’s subscriber base shifted from postpaid to prepaid. ARPU for Piltel’s GSM
service, since its April 2000 launch, was Pesos 511.
Piltel’s analog and CDMA prepaid services recorded a decline in subscribers (2000:
200,042 subscribers; 1999: 322,132 subscribers), however revenues held up well as ARPU
increased to Pesos 367, from Pesos 352 a year earlier, as Piltel focused on churn management
measures to retain subscribers. Postpaid subscribers declined to 88,194 (1999: 134,825 sub-
scribers), with a comparable decline in revenues. Postpaid ARPU declined to Pesos 646 (1999:
Pesos 1,233) as subscribers reduced usage despite rate cuts.
PLDTTurnoverPesos billions
96 97 98 99 00
60
50
40
30
20
10
0
International Long DistanceNational Long DistanceFixed LineCellularData and Other Network Services
PLDT CELLULAR HAS 3.5 MILLION SUBSCRIBERS IN AN
ESTIMATED TOTAL MARKET OF 6.3 MILLION SUBSCRIBERS
CELLULAR PENETRATION INCREASED FROM 3.6 TO 8.5 PER CENT IN 2000, REFLECTING ROBUST
MARKET GROWTH
PLDT continues to diversify revenue streams, recording significant growth in Cellular and Data revenues
PLDTNet Income (Loss)
vs. SubscriberAcquisition Cost
Net Income (Loss) in millions of pesos (NI)Subscriber Acquisition Cost in thousands of pesos (SAC)
NI SAC
Jan00
Mar00
Jun00
Sep00
Dec00
400
600
200
-200
-400
0
-600
-800
4.0
4.5
3.5
2.5
3.0
1.5
1.0
2.0
0.5
0
Profitability improved dramatically as subscriberacquisition cost declined
PLDT continued

p. 25
2000
PESOS
MILLIONS
AS REPORTED BY PLDT 1,108
DIFFERING ACCOUNTING TREATMENTS (1) 3,070
INTRAGROUP ITEMS (2) 1,000
ADJUSTED NET INCOME 5,178
US$
MILLIONS
TRANSLATED AT AN AVERAGE RATE OF US$1:PESOS 44.7 115.8
CONTRIBUTION TO GROUP PROFIT, AT AN AVERAGE SHAREHOLDING OF 22.1% 25.6
(1) These adjustments arise because of differences in accounting for certain items under Philippine GAAP, as applied byPLDT, and Hong Kong GAAP, as applied by First Pacific. The most significant item in 2000 is the adjustment maderegarding foreign exchange losses. Under Philippine GAAP, PLDT is permitted to capitalize and amortize exchangedifferences. Under Hong Kong GAAP, the treatment is to recognize such losses, even though unrealized, in the profitand loss account. In 2000, exchange differences are separately disclosed and accordingly no adjustment is necessary.However, an adjustment is required to reverse the amortization of PLDT’s capitalized foreign exchange differences,as the originating exchange difference has already been written off by First Pacific. Other adjustments include: • Preference dividends paid by PLDT: First Pacific’s definition of ‘net income’ is after deduction of dividends. As such,the adjustment is for First Pacific to deduct recorded preference dividends. • Fair value on acquisition: First Pacific made certain fair value adjustments on its acquisition of PLDT, such thatcertain PLDT assets are held at different values. As such, the adjustment is for First Pacific to reverse depreciation inrelation to assets that First Pacific has already written down. • PLDT’s acquisition of Smart: Under Philippine GAAP, PLDT has ‘pooled’ Smart as if Smart has always been part ofthe PLDT group. As such, the adjustment is for First Pacific to reinstate Smart’s quarter one losses (incurred prior toSmart being acquired by PLDT) as these losses are separately reported by First Pacific.
(2) These are standard consolidation adjustments to ensure that transactions between Group companies are eliminatedto present the Group as a single economic entity.
FIXED LI NE
PLDT’s Fixed Line business, which comprises the fixed line operations of PLDT, Smart,
Piltel, PLDT Clark Telecom and Subic Telecom, recorded improved gross and operating
revenues in 2000. Fixed Line added a net total of 118,526 lines excluding the 34,990 lines
added as a result of PLDT’s acquisition of Smart’s fixed line service in September 2000.
In addition, PLDT offered an innovative range of service options, including Quick Install and
Quick Connect, which are designed to maximize fixed line usage by offering a three-day
application-to-installation service in areas of excess capacity. To address billing and collection
issues, PLDT launched Teletipid, the first prepaid fixed line service in the Philippines, in
August 2000. It closed the year with 13,905 subscribers.
LONG DISTANCE
PLDT’s international long distance call volumes grew by 117 per cent to 2,113.8 million billed
minutes in 2000, up from 974.6 million billed minutes in 1999. Inbound call volumes surged
by 134 per cent to 1,977.6 million billed minutes, while outbound call volumes increased by
six per cent to 136.2 million billed minutes.
The strong growth in inbound call traffic was largely driven by PLDT’s adoption of the
benchmark international accounting rate of US$0.38 per minute on 1 January 2000, a year
earlier than the date set by the U.S. Federal Communications Commission. PLDT also
enjoyed considerable success in its efforts to identify and reduce the number of international
simple resale operations that were being used to illegally bypass the local access charge
system in the Philippines.
PLDT’s international long distance revenues include income from foreign carriers
delivering incoming international calls, billings to PLDT customers for outgoing international
calls and access income from other Philippine carriers. Notwithstanding strong volume
RECONCILIATION OF REPORTED PLDT
PESO RESULTS TOFIRST PACIFIC GROUP
US$ RESULTS
PLDTCellular Subscribers
86%
14%
Digital 212,280Analog 1,269,827Total 1,482,107
23%
77%
Digital 2,708,402Analog 806,891Total 3,515,293
2000
1999
PLDT’s cellular subscriber base is now predominantly digital

p. 26
growth, these international long distance service revenues declined to US$289.9 million as
a consequence of lower pricing on both inbound and outbound call traffic.
National long distance call volumes increased by 15 per cent to 3,255.3 million billed
minutes in 2000. However, peso revenue growth was lower than call volume growth due to
lower average revenues per call. This reflected a change in call mix in favor of more calls that
are subject to revenue sharing with other carriers.
DATA AND OTHER NETWORK SERVICES
PLDT’s data and networking revenues continued to grow in 2000, increasing 54 per cent over
1999 to US$73.0 million. Much of the growth came from a range of value-added and broadband
services. One such initiative is @ctiveBill, an online service that enables corporate
customers to make payments over the Internet using a variety of access devices including cell
phones, personal computers and even cable televisions. To support the growing demand for
these services, PLDT has begun to ‘broadband’ its legacy copperwire network with the intro-
duction of ADSL technology in certain commercial and residential districts of Metro Manila.
Because the further development of this business is key to PLDT’s revenue diversification
strategy, the company formally incorporated ePLDT in August 2000 as the principal
corporate vehicle for its Internet, e-commerce and multimedia initiatives and ventures
including Home Cable. Following its inception, ePLDT established VITRO, an Internet Data
Center that provides co-location services, hosting, business continuity services, security
solutions and applications services with secure and reliable high bandwidth Internet access
for its customers.
OVERVIEW AND OUTLOOK
PLDT is successfully reducing its dependence on ‘traditional’ sources of revenue and now
offers a broader and improved range of products and services to maintain its market leader-
ship. Through diversification, it has tapped into wireless and data revenues that will be
central to PLDT’s next cycle of growth, and established ePLDT to drive longer-term growth.
Fixed line is likely to record steady growth and be a source of strong cash generation.
Cellular growth is expected to continue, with estimates placing the potential market at
18 million. And ePLDT will facilitate PLDT’s future growth through the development of
Internet and media-related businesses.
Smart
Smart contributed a loss of US$9.0 million for the first quarter of 2000 prior to its merger with
PLDT. The loss stemmed from substantial subscriber acquisition costs incurred as Smart
aggressively rolled out its GSM service.
PLDTCellular Subscribers
11%
89%
Prepaid 3,114,471Postpaid 400,822Total 3,515,293
58%
42%
Prepaid 858,812Postpaid 623,295Total 1,482,107
2000
1999
SMART AND PILTEL AVERAGED ONE NEW GSM SUBSCRIBEREVERY 13 SECONDS
The majority of cellular customers opt for prepaid

p. 27
Turnover Profit
2000 1999 2000 1999*
US$m US$m % change US$m US$m % change
Property:Bonifacio Land 71.9 121.5 -40.8 21.7 50.1 -56.7Pacific Plaza Towers 70.7 63.5 +11.3 14.7 15.5 -5.2Landco Pacific 10.3 15.7 -34.4 4.7 5.6 -16.1
Subtotal 152.9 200.7 -23.8 41.1 71.2 -42.3Consumer Products 3.9 28.2 -86.2 0.1 0.7 -85.7Packaging 34.9 39.1 -10.7 2.6 4.2 -38.1Transportation 48.3 49.5 -2.4 0.1 (4.9) –Corporate overheads – – – (2.6) (2.0) -30.0Total 240.0 317.5 -24.4Operating profit 41.3 69.2 -40.3Share of profits less losses of associates (7.0) (11.6) +39.7Net borrowing costs (28.2) (32.0) +11.9Profit before taxation 6.1 25.6 -76.2Taxation (8.5) (0.5) -1,600.0(Loss)/profit after taxation (2.4) 25.1 –Outside interests (4.0) (29.5) +86.4Contribution to Group profit (6.4) (4.4) -45.5
* 1999 comparative figures have been restated to exclude the effect of exchange differences.
Metro Pacific returned a loss of US$6.4 million in 2000, against a loss of US$4.4 mil-lion for 1999. These results include Metro Pacific’s non-property businesses, whichwere classified under Consumer and Banking in 1999.
This decline reflects an array of factors that have contributed to the 40.3 percent decline in operating profit to US$41.3 million (1999: US$69.2 million).Increased taxes, primarily at Fort Bonifacio, further eroded the year on year performance. However, losses from associates shrank significantly on animproved performance from First e-Bank. Net finance charges also declined asMetro Pacific repaid debt with proceeds from asset disposals.
PROPERT Y
Metro Pacific is now a property-focused company, following the disposal of its eight per cent
interest in PLDT, to First Pacific, and disposals of its subsidiaries Metrovet, Inc. and Steniel
Manufacturing Corporation. Today, more than 90 per cent of Metro Pacific’s balance sheet
relates to property assets, principally a 66.2 per cent interest in Bonifacio Land Corporation,
a 60.0 per cent interest in Landco Pacific, and a 100.0 per cent interest in Pacific Plaza Towers.
Correspondingly, Property contributed 63.7 per cent of Metro Pacific’s 2000 turnover of
US$240.0 million, and 99.5 per cent of its total operating profit of US$41.3 million.
Bonifacio Land, in a 55/45 per cent partnership with the Philippine Government’s
Bases Convention Development Authority in the Fort Bonifacio Development Corporation
(FBDC), is tasked with developing the former military base, Fort Bonifacio, into the Bonifacio
Global City. Bordered by Manila’s three key arterial roads, the Global City is set to become
the new business center for Manila, covering 440 contiguous hectares. Its location affords
swift and easy access to both the international airport and Makati, Manila’s current business
district less than two kilometers away.
A 25-year project, the development of Fort Bonifacio began in 1996. Since then, FBDC
has recognized aggregate earnings in excess of Pesos 9.2 billion. The first phase of development
Metro Pacific
Metro PacificTurnover
US$millions
96 97
350
300
250
200
150
100
50
098 99 00
Metro PacificContribution
US$millions
96 97
12
8
0
-4
4
-8
-1298 99 00

p. 28
focused on infrastructure and utility installation. This phase, known as ‘Big Delta,’ covered
some 57 hectares of land and was completed on schedule in April 2000.
Bonifacio Land recorded lower results as the completion of Big Delta prompted the
recognition of remaining revenues and profits from previous years’ land sales. No further
land sales were concluded in 2000.
Progress on the project continues. Key access routes were completed during the year,
and work started on ‘Expanded Big Delta,’ as well as the technology zone ‘E-Square.’ The
Bonifacio Ridge residential condominium complex reached third-floor level by year-end, and
almost half of its 288 units have been pre-sold.
Pacific Plaza Towers, Metro Pacific’s signature residential development at the Global
City, was completed and now has its first residents. By year-end, over half of the 393 units
were sold, accounting for increased turnover. However, operating margins came under pres-
sure as economic conditions declined due to political uncertainty, and the subdued property
market became entrenched.
The prevailing weak economic conditions also affected Landco Pacific, the residential
resort development subsidiary of Metro Pacific, resulting in a decline in Landco’s sales and profits.
2000
PESOS
MILLIONS
AS REPORTED BY METRO PACIFIC 2,246
INTRAGROUP ITEMS (1) (4,664)
NON-RECURRING ITEMS (2) 1,069
FOREIGN EXCHANGE (3) 454
REALLOCATION OF SHARE OF SMART’S RESULTS (4) 370
DIFFERING ACCOUNTING TREATMENTS (5) 168
ADJUSTED NET LOSS (357)
US$
MILLIONS
TRANSLATED AT AN AVERAGE RATE OF US$1:PESOS 44.7 (8.0)
CONTRIBUTION TO GROUP PROFIT, AT AN AVERAGE SHAREHOLDING OF 80.6% (6.4)
(1) These are standard consolidation adjustments to ensure that transactions between Group companies are eliminatedto present the Group as a single economic entity. In 2000, this principally related to eliminating an intra-Group gain onMetro Pacific’s sale of its 8.0 per cent interest in PLDT.
(2) Certain items, through occurrence or size, are not considered usual, operating items. In order to illustrate underlyingrecurring operational results, such items are reallocated and presented separately. Adjustments for 2000 related togains on disposals and investments provisions.
(3) To illustrate underlying operations, contribution from operations is shown before exchange differences. As such, FirstPacific has excluded exchange losses, net of related tax, and presented these items separately.
(4) Reallocation as the combined interest of First Pacific and Metro Pacific, in Smart, is separately disclosed.(5) These adjustments arise because of differences in accounting for certain items under Philippine GAAP, as applied by
Metro Pacific, and Hong Kong GAAP, as applied by First Pacific. The most significant item in 2000 related to the recon-ciliation of deferred tax.
RECONCILIATION OF REPORTED METRO PACIFICPESO RESULTS TOFIRST PACIFIC GROUP US$ RESULTS
SINCE 1996, FORT BONIFACIO DEVELOPMENTCORPORATION HAS DELIVERED
PESOS 9.2 BILLION IN CONSOLIDATEDNET EARNINGS
Metro Pacific continued

p. 29
OTHERS
The decline in Metro Pacific’s Consumer businesses principally reflects disposals as the
company pursues its pure property strategy.
Packaging’s 10.7 per cent decline in turnover more reflects translation effects, as opera-
tions performed steadily prior to the disposal of these businesses in 2000. The average peso
rate declined to Pesos 44.7 to the U.S. dollar from Pesos 39.3 a year earlier. However, escalat-
ing costs for paper pulp further deteriorated operating profit.
Translation also obscured an improved performance in Transportation, which recorded
approximately a 10 per cent increase in peso-denominated turnover, despite strong competi-
tion. Although successive price increases contributed to this growth, rising fuel costs eroded
operating profit.
OVERVIEW AND OUTLOOK
Metro Pacific has met the challenges imposed by an uncertain economy and operating
environment. The company has adjusted and refined progress on its projects to ensure optimal
use of resources while furthering the long-term objectives of each development. In particular,
despite many impinging factors, steady progress continues to be made at Fort Bonifacio.
Infrastructure and vertical developments are progressing, and several developments that will
enhance the site’s critical mass are scheduled to culminate in 2001. These include the opening
of HatchAsia’s Global City Center and Rufino-Dupasquier ’s Net-One Center in E-Square, the
opening of key retail developments S&RPrice and Bonifacio StopOver, and the completion
of Bonifacio Ridge. As political uncertainty subsides and market confidence returns, the property
market is likely to show signs of recovery.
FORT BONIFACIO’S 11-KILOMETER UNDERGROUND
FIBER OPTIC NETWORK WILL SUPPORT EVERYTHING
FROM TELEPHONE SERVICES TOTHE MOST DEMANDING
INTERACTIVE VIDEO AND DATATRAFFIC
PHILIPPINE ECONOMIC ZONE APPROVAL GRANTSINCENTIVES TO BUSINESSES THAT LOCATE IN E-SQUARE. THESE INCLUDE INCOME TAX HOLIDAYS, EXEMPTIONS FROM ALL LOCAL GOVERNMENT TAXES, AND EXEMPTIONS FROM DUTIES AND TAXES ON IMPORTEDCAPITAL EQUIPMENT

p. 30
Turnover Profit
2000 1999 2000 1999
US$m US$m % change US$m US$m % change
Packaging and ConsumerProducts 183.3 204.6 -10.4 17.0 32.3 -47.4
Technical Products andImaging 90.6 81.9 +10.6 3.4 3.4 –
Others/corporate 7.4 7.7 -3.9 (1.4) (3.8) +63.2Total 281.3 294.2 -4.4Operating profit 19.0 31.9 -40.4Share of profits less losses of associates – 0.4 –Net borrowing costs (2.7) (4.4) +38.6Profit before taxation 16.3 27.9 -41.6Taxation (3.8) (8.7) +56.3Profit after taxation 12.5 19.2 -34.9Outside interests (2.6) (3.6) +27.8Contribution to Group profit 9.9 15.6 -36.5
Berli Jucker contributed US$9.9 million to the Group in 2000, down 36.5 per centfrom the US$15.6 million reported in 1999. A substantial part of the reduction insales and contribution, in U.S. dollar terms, was due to a weakening of the baht. In baht terms, Berli Jucker achieved revenue growth of five per cent which trans-lates, in U.S. dollar terms, to a reduction of 4.4 per cent.
PACKAGING AND CONSUMER PRODUCTS
Berli Jucker ’s largest businesses, Packaging and Consumer Products, contributed 65.2 per
cent of its turnover of US$281.3 million and 89.5 per cent of its total operating profit of
US$19.0 million.
The Packaging business supplies glass and rigid plastic containers to a small group of
major customers. Consumer Products markets the company ’s range of branded products, as
well as providing manufacturing, marketing, and distribution services to third parties.
In 2000, Packaging recorded a 19 per cent decline in the sale of glass containers.
Second-hand bottle usage increased in the beer sector, leading to a 49 per cent decline in the
production of beer bottles. Because whisky distributors built up inventory in late 1999 in
anticipation of the government’s liberalization of the whisky market, demand for bottles was
notably lower in 2000. However, sustained, notable growth was recorded in the food, energy
drink, soft drink, and wine cooler sectors. Packaging sales were also affected by the deconsol-
idation of rigid plastic container manufacturer Berli Prospack, as Berli Jucker diluted its
interest in this company.
Gross and operating margins were adversely affected by the decline in sales revenues,
a 52 per cent increase in fuel oil costs and increased depreciation costs following furnace
rebuilds undertaken at the start of the year.
Sales of Consumer products increased, as the Cellox and Zilk tissue brands gained
market share. BJC Cellox recorded a 37 per cent growth in tissue paper sales, establishing
itself as the market leader. In addition, BJC Cellox expanded its presence in the Hong Kong
Berli JuckerTurnover
US$millions
96 97
400
300
200
100
098 99 00
Berli JuckerContribution
US$millions
96 97
16
12
8
4
098 99 00
BJC GLASS, LEADING MANUFACTURER OF GLASS PRODUCTS; BERLI PROSPACK, MANUFACTURER OF RIGID PLASTIC CONTAINERS;
BJC CELLOX, MANUFACTURER AND MARKETER OF MARKET-LEADING CELLOX AND ZILK BRAND TISSUE PAPER; RUBIA
INDUSTRIES, MANUFACTURER AND MARKETER OF SOAPS AND SHAMPOOS;BJC FOODS, LEADING PRODUCER OF POTATO CRISPS
AND SNACK FOODS
BERLI JUCKER’S OPERATIONS INCLUDE
Berli Jucker

p. 31
and Indochina markets. Gross margins declined during the year as the cost of local and
imported paper pulp increased by 38 per cent and fuel oil increased by 52 per cent. Although
BJC Cellox increased its selling prices in response, these were insufficient to fully offset
these additional costs.
BJC Foods recorded increased sales in 2000, with Tasto enjoying a 55 per cent volume
increase. However, adverse weather conditions caused a shortage of potatoes thereby limiting
its growth potential.
TECHNICAL PRODUCTS AND IMAGING
This segment recorded a 10.6 per cent increase in turnover to US$90.6 million. BJC
Specialties, the chemical products marketing and distribution arm, enjoyed a successful year
despite facing pricing pressure from low-cost refrigerant products, and achieved significant
growth in its food ingredients and cosmetic businesses by adding new agencies.
BJC Medical also benefited from strong sales growth with sustained demand for its
specialist pharmaceutical products. However, while Imaging recorded a reasonable increase in
the sales of its technical imaging equipment, BJC Engineering had a difficult year as a direct
consequence of the continued economic recession.
Growth in turnover did not translate to a corresponding growth in operating profit, which
remained broadly unchanged, as pricing pressures at Imaging eroded operating margins.
OVERVIEW AND OUTLOOK
Berli Jucker has weathered difficult economic and industry specific conditions. Despite these
challenges, the company was able to repay US$47.1 million of loans in 2000, which had the
added benefit of reducing net borrowing costs by 38.6 per cent, and paid a special interim
cash dividend totaling US$61.9 million in 2000. Berli Jucker ’s proven ability to manage its
businesses in a challenging operational environment, while refining its portfolio of assets,
positions it well for future growth.
2000
BAHT
MILLIONS
AS REPORTED BY BERLI JUCKER 535
NON-RECURRING ITEMS (1) (55)
ADJUSTED NET INCOME 480
US$
MILLIONS
TRANSLATED AT AN AVERAGE RATE OF US$1:BAHT 40.4 11.9
CONTRIBUTION TO GROUP PROFIT, AT AN AVERAGE SHAREHOLDING OF 83.5% 9.9
(1) Certain items, through occurrence or size, are not considered usual, operating items. To illustrate underlying recurring operational results, such items are reallocated and presented separately. Adjustments for 2000 related tothe reclassification of disposal and dilution gains.
RECONCILIATION OF REPORTED
BERLI JUCKER BAHTRESULTS TO
FIRST PACIFIC GROUPUS$ RESULTS
BERLI JUCKER IS THE LEADING INDEPENDENT SUPPLIER OF GLASS CONTAINERS IN THAILAND WITH
A MARKET SHARE OF APPROXIMATELY 40 PER CENT

p. 32
Turnover Profit
2000 1999 2000 1999*
US$m US$m % change US$m US$m % change
Manufacturing andMarketing 32.3 31.6 +2.2 5.3 11.5 -53.9
Distribution 53.0 45.7 +16.0 1.4 1.5 -6.7Others/corporate (34.8) (31.6) -10.1 (0.6) (7.9) +92.4Total 50.5 45.7 +10.5Operating profit 6.1 5.1 +19.6Net borrowing costs (0.2) (0.1) -100.0Profit before taxation 5.9 5.0 +18.0Taxation (0.5) 1.1 –Profit after taxation 5.4 6.1 -11.5Outside interests (0.4) (0.5) +20.0Contribution to Group profit 5.0 5.6 -10.7
* 1999 comparative figures have been restated to exclude the effect of exchange differences.
Darya-Varia contributed US$5.0 million to the Group in 2000, down 10.7 per centfrom the US$5.6 million reported in 1999.
Over the last two years, Darya-Varia has effected a restructuring program, which has reduced its product lines from over 600 to 250, and implementedenhanced management systems that provide appropriate and accurate informationon demand.
Working with fewer, more profitable product lines enabled Darya-Varia toincrease turnover by 21.2 per cent to Rupiah 430.7 billion in 2000 – a 10.5 per centincrease in U.S. dollar terms to US$50.5 million.
2000
RUPIAH
MILLIONS
AS REPORTED BY DARYA-VARIA (16,122)
FOREIGN EXCHANGE (1) 25,707
INTRAGROUP ITEMS (2) 22,408
DIFFERING ACCOUNTING TREATMENTS (3) 15,206
ADJUSTED NET INCOME 47,199
US$
MILLIONS
TRANSLATED AT AN AVERAGE RATE OF US$1:RUPIAH 8,523 5.5
CONTRIBUTION TO GROUP PROFIT, AT AN AVERAGE SHAREHOLDING OF 89.5% 5.0
(1) To illustrate underlying operations, contribution from operations is shown before exchange differences. As such, First Pacific has excluded exchange losses, net of related tax, and presented these items separately.
(2) These are standard consolidation adjustments to ensure that transactions between Group companies are eliminatedto present the Group as a single economic entity.
(3) These adjustments arise because of differences in accounting for certain items under Indonesian GAAP, as appliedby Darya-Varia, and Hong Kong GAAP, as applied by First Pacific. The principal adjustments related to differingaccounting treatments for deferred tax and goodwill.
Darya-Varia
RECONCILIATION OF REPORTED DARYA-VARIA RUPIAHRESULTS TO FIRST PACIFIC GROUPUS$ RESULTS

p. 33
MANUFACTURI NG AND MARKETI NG
Darya-Varia operates two manufacturing facilities in the greater Jakarta area that produce
a range of products, including soft capsules, syrups, dry syrups, tablets, dragees, lozenges,
creams and ointments, injectables, eye drops and contact lens care solutions.
Darya-Varia’s increased turnover in 2000 was largely driven by increased sales volume
as redeployed marketing teams identified and tapped into more profitable markets such as
medical specialty groups. Prescription sales volumes increased 18.3 per cent, and over-the-
counter (OTC) sales volumes grew by 29.3 per cent. Sales uniquely reflected industry product
mix, with prescription accounting for two-thirds and OTC for one-third. Darya-Varia’s OTC
brands have been independently ranked as best performers in their categories.
Improved inventory management, as well as increased capacity for the production of
soft capsules and strip products, greatly enhanced manufacturing operations. Being dependent
on imported raw materials, input costs rose sharply as the rupiah weakened. However,
operational efficiencies partly offset input cost increases, as well as the higher marketing
expenses that were incurred to support additional sales. Accordingly, gross margin was main-
tained, but operating margin declined to 16.4 per cent.
DISTRIBUTION
PT Wigo Distribusi Farmasi has greatly improved its productivity by offering a superior
distribution coverage and improved service to principals. With its activities supported by a new
management information system linking all 28 branches, Wigo is now able to manage sales
and order processing online. Through these enhancements, Distribution was able to achieve
a 16.0 per cent growth in turnover to US$53.0 million.
OVERVIEW AND OUTLOOK
Darya-Varia endured a difficult year in which a declining rupiah eroded earnings. However,
as a newly restructured and streamlined company, Darya-Varia is poised for its next cycle of
growth as it aggressively steps up market activity to gain market share.
Darya-VariaTurnover
US$millions
96 97
100
80
60
40
20
098 99 00
Darya-VariaContribution
US$millions
96 97
7
6
4
5
3
2
1
098 99 00
PRODUCT LINES HAVE BEEN REDUCED
TO 250 FROM OVER 600

p. 34
Turnover Profit
2000 1999 2000 1999*
US$m US$m % change US$m US$m % change
Cellular 35.7 21.6 +65.3Operating loss (2.7) (7.3) +63.0Net borrowing costs (21.4) (18.4) -16.3Loss for the year (24.1) (25.7) +6.2Average shareholding 49.0% 49.0% –Group share of loss (11.8) (12.6) +6.3
* 1999 comparative figures have been restated to exclude the effect of exchange differences.
Escotel contributed a loss of US$11.8 million in 2000, marginally better than lastyear. Based in New Delhi, Escotel provides GSM cellular telephone services inUttar Pradesh (West), Haryana and Kerala.
Turnover increased 65.3 per cent as the company rapidly grew its subscriber base by
over 160 per cent to close the year with 286,800 subscribers, up from 110,200 subscribers at
the end of 1999. Despite increased promotional costs and subsidies, operating losses were nar-
rowed through increased subscriber revenues. The take-up of prepaid schemes fueled the
rapid growth in subscribers, which resulted in a decline in average monthly subscriber rev-
enues from US$18.7 in 1999 to US$15.2 in 2000. However, churn and collection issues have
improved greatly and, with the completion of a major debt refinancing exercise to secure long-
term funding, Escotel is expected to achieve cash break-even in 2001.
EscotelSubscriber Numbers
thousands
Dec98
Jun99
Dec99
Jun00
Dec00
Mar01
350
300
250
200
150
100
50
0
Escotel
ESCOTEL’S SUBSCRIBERS
MORE THAN DOUBLEDOVER 2000

p. 35
Turnover Profit
2000 1999 2000 1999
US$m US$m % change US$m US$m % change
Property Investment 0.5 0.5 – 0.4 0.2 +100.0Property Services 36.7 152.4 -75.9 0.6 7.1 -91.5Business Services – 14.5 – – 1.0 –Corporate overheads – – – (0.5) (4.0) +87.5Total 37.2 167.4 -77.8Operating profit 0.5 4.3 -88.4Share of profits less losses of associates 8.3 8.5 -2.4Net borrowing costs 0.3 (0.3) –Profit before taxation 9.1 12.5 -27.2Taxation (2.8) (3.8) +26.3Profit after taxation 6.3 8.7 -27.6Outside interests (0.3) (1.0) +70.0Contribution to Group profit 6.0 7.7 -22.1
FPDSavills’ contribution declined 22.1 per cent over the year. This reflects one-quarter of Property Services earnings from First Pacific Davies, which wascombined with Savills plc in April 2000, and earnings from associate interna-tional property services company, Savills plc, for the 12-month period ended 31October 2000. Although income from associates marginally declined, earningsfrom Savills plc, itself, improved year on year. Business Services reflectsGuardforce earnings prior to its disposal in February 1999.
As Savills plc reported its results for the eight months ended 31 December 2000 after
First Pacific, profits for November and December 2000 will be included in the First Pacific
Group’s 2001 results. On 12 March 2001, First Pacific disposed of its entire remaining inter-
est in Savills plc.
FPDSavills

p. 36
First Pacific Bank contributed US$13.9 million to the Group prior to its disposal on
28 December 2000, and SPORTathlon contributed a loss of US$0.4 million prior to its
disposal on 29 June 2000.
Infrontier is a business solutions provider that enables Asian businesses to focus on their core
competencies by offering Internet-based applications and services designed for the specific
needs of the Asian business environment.
Infrontier provides integrated solutions across the business value chain, assuming full
responsibility for the hosting, management, operation, and maintenance of applications
and software. In doing so, Infrontier provides its clients with a fast, cost-effective means of
improving business performance, while linking client businesses with partners, customers,
suppliers and employees.
Combining the strengths of First Pacific – industry experience, market penetration,
relationships and business expertise – with the most advanced technologies and e-commerce
processes, Infrontier is initially delivering its solutions in China, Hong Kong, Indonesia,
the Philippines, Singapore and Thailand, with future expansion planned for India, Korea,
Malaysia, Australia and Taiwan.
Infrontier solutions comprise a complete, integrated suite of applications in a hosted
environment, including:
• Supply chain management
• Electronic remote order entry system
• Warehouse management system
• Service management system
• Business-to-business, Internet-based digital marketplaces
• Enterprise resource planning
• Customer relationship management
• Mobile commerce solutions
• E-business consulting
• Systems integration
Infrontier is expected to reach profitability by year-end 2003.
Disposed Businesses
Infrontier

p. 37Corporate Governance
and Financial Review
CORPORATE GOVERNANCE
GOVERNANCE FRAMEWORK 38
INTERNAL FINANCIAL CONTROL 38
COMMUNICATIONS WITH
SHAREHOLDERS 39
DIRECTORS’ REMUNERATION 39
FI NANCIAL REVIEW
SHAREHOLDER VALUE 40
LIQUIDITY AND RESOURCES 43
FINANCIAL RISK MANAGEMENT 46
contents

p. 38
GOVERNANCE FRAMEWORK The Company is committed to a policy of transparency and full disclosure in its business operations and relationships with its shareholders and regulators. It has complied throughout the year with the Code of Best Practice, as set out in Appendix 14 of the Rules Governing the Listing of Securities (“Listing Rules”) issued by The Stock Exchange of Hong Kong Limited.
The Board meets formally at least four times a year. The Executive Directors areresponsible for the day-to-day management of the Company’s operations. In addition,there are regular meetings with the senior management of the Company’s subsidiaryand associated companies, at which Group strategies and policies are formulatedand communicated.
As a decentralized organization in which local management have substantial autonomyto run and develop their businesses, the Group views well developed reporting systemsand internal controls as essential. The Board of Directors plays a key role in the implementationand monitoring of internal financial controls. Their responsibilities include:
• Regular board meetings focusing on business strategy, operational issues and financial performance.
• Active participation on the Boards of subsidiary and associated companies.
• Approval of annual budgets for each operating company covering strategy, financial andbusiness performance, key risks and opportunities.
• Monitoring the compliance with applicable laws and regulations, and also with internal policies with respect to the conduct of business.
• Monitoring the quality, timeliness, relevance and reliability of internal andexternal reporting.
To enable the Company’s Directors to meet their obligations, an appropriate organiza-tional structure is in place with clearly defined responsibilities and limits of authority.
The Company’s Audit Committee is composed of two independent Non-executiveDirectors and written terms of reference which describe the authority and duties of theAudit Committee are regularly reviewed and updated by the Board. The AuditCommittee reports directly to the Board of Directors and reviews matters within thepurview of audit, such as Financial Statements and internal controls, to protect theinterests of the Company’s shareholders. The Audit Committee meets regularly with theCompany’s external auditors to discuss the audit process and accounting issues, andreview the effectiveness of internal controls and risk evaluation.
The Company’s governance framework is applied as appropriate throughout the Group.
INTERNAL FINANCIAL The Directors are required to prepare for each financial year Financial Statements CONTROL which give a true and fair view of the state of affairs of the Company and of the Group at
the end of the year, and of the profit and cash flows for the year to that date.
The Company’s management has prepared the Financial Statements and related noteson pages 59 to 93 in conformity with the disclosure requirements of the Hong KongCompanies Ordinance, disclosure provisions of the Listing Rules and accountingprinciples generally accepted in Hong Kong. These Financial Statements includeamounts that are based on management’s best estimates and judgments. The financialinformation appearing throughout the 2000 Annual Report is consistent with that in the Financial Statements.
Corporate Governance

p. 39
The financial control systems implemented by the management of the Company aredesigned to provide reasonable assurance that assets are safeguarded and transactionsare recorded to permit the preparation of appropriate financial information. The systemsin use provide such assurance, supported by the careful selection and training of quali-fied personnel, the establishment of organizational structures providing an appropriateand well defined division of responsibilities, and the communication of policies and stan-dards of business conduct throughout the Group.
COMMUNICATIONS WITH First Pacific encourages an active and open dialogue with all the Company’s share-SHAREHOLDERS holders, private and institutional, large and small. The Board of Directors acknowledges
that its role is to represent and promote the interests of shareholders and that its mem-bers are accountable to shareholders for the performance and activities of the Company.As such First Pacific is always responsive to the views and preferences of its shareholders.
The formal channels of communication with shareholders are principally through theAnnual Report and the Annual General Meeting (AGM). The Annual Report seeks tocommunicate, both to shareholders and the wider investment community, developmentsin the Company’s businesses over the previous financial year. In addition, strategic goalsfor the coming year are set and management’s performance against predeterminedobjectives are reported and assessed. All of these initiatives are designed to betterinform shareholders and potential investors about the Company’s activities and strate-gic direction.
The AGM is the principal forum for formal dialogue with shareholders, where the Board isavailable to answer questions, both about specific resolutions being proposed at the meet-ing and also about the Group’s business in general. In addition, where appropriate theCompany convenes Special General Meetings to approve transactions in accordance withthe Listing Rules and the Company’s corporate governance procedures. These providefurther opportunities for shareholders to comment and vote on specific transactions.
DIRECTORS’ REMUNERATION The remuneration of Executive Directors is determined annually by the Executive Chairman and certain Non-executive directors who are advised by compensation andbenefits consultants. The Executive Chairman’s remuneration is subject to review byNon-executive Directors representing the major shareholder. Non-executive Directors’fees and emoluments are determined annually by the Executive Chairman.
Executive Directors’ entitlement to share options and option exercise prices are deter-mined by a Special Compensation Committee of the Board.
Details of Directors’ remuneration for the year are set out in Note 31(A) to theFinancial Statements.

p. 40
SHAREHOLDER VALUE INVESTMENT PHILOSOPHY
First Pacific is a long-term investor in leading Asian blue chip companies which com-mand a dominant market position in their respective industries. Over the past threeyears, the Company has implemented this philosophy through the divestment of certainmature businesses and the reinvestment of the proceeds in Asian operations which havegreater growth potential.
First Pacific’s principal investment objective is to provide shareholders with attractivelong-term returns. Despite the obvious political and economic difficulties encounteredduring 2000 in the countries in which the Company has its major investments, manage-ment remains confident of long-term value creation. The steep declines in the equitymarkets of Indonesia, the Philippines and Thailand during 2000 has inevitably had anegative impact on the Company’s underlying net asset value, and a consequent impacton its share price.
Accordingly, the return to shareholders during 2000 has been very disappointing, particu-larly in the context of the Company’s past record. Nevertheless, First Pacific has investedin excellent companies which continue to prosper operationally even in the current chal-lenging circumstances. Management remains focused on improving the operating capabil-ities of the Group’s businesses to ensure that they are well positioned to take advantage ofopportunities which will arise once economic and political conditions improve.
EARNINGS
Recurrent profitability before exchange differences, a traditional gauge of progress ingenerating returns for shareholders, rose 23.2 per cent to US$51.0 million, reflecting theimpact of net acquisitions and the improved operating performance of certain Group com-panies. On a per-share basis, the Group recorded recurrent earnings of U.S. 1.74 cents(HK 13.57 cents) per share, an improvement of 8.8 per cent from 1999. This reflects astronger profit performance and an expanded equity base due to the issue of shares dur-ing the year to fund the acquisition of a further 8.0 per cent interest in Indofood.
The Group’s profitability has, in part, been constrained as a result of value creatingmeasures taken at certain operating companies, the benefit of which has not beenreflected in 2000. For example, in late 1999 Smart took a strategic decision to competeaggressively in the Philippine GSM cellular market which resulted in significant mar-keting costs being incurred in the first half of 2000. The return on Smart’s investmentin the GSM market will be reflected in PLDT’s future earnings as a result of its sub-stantial share of this growing market.
SHAREHOLDERS’ EQUITY
Shareholders’ equity at 31 December 2000 amounted to US$365.5 million compared toUS$591.5 million at 31 December 1999, a decrease of 38.2 per cent. On a per-sharebasis, shareholders’ equity in 2000 fell to U.S. 11.6 cents from U.S. 20.3 cents in 1999,primarily due to an adverse exchange reserve movement (US$163.2 million) and thewrite-off of goodwill principally on the acquisition of additional interests in PLDT andIndofood (US$169.8 million).
Financial Review

p. 41
ADJUSTED NET ASSET VALUE AND INVESTED CAPITAL
The underlying worth of the Group can also be assessed by computing the adjusted netasset value of each separate business as determined by its quoted share price or, in caseswhere a company is not listed, its book carrying cost.
Using this approach, First Pacific’s adjusted net asset value, on a per-share basis, on31 December 2000 stood at US$0.42 or HK$3.24. Our closing share price on that daywas HK$2.23, a discount of 31.3 per cent compared to the adjusted net asset value.Calculated on a pro forma basis at 5 March 2001, the Group’s share price of HK$2.20represented a discount of 33.5 per cent compared to the adjusted net asset value.
The following table summarizes the Company’s adjusted net asset value, calculated at 31 December 2000 and on a pro forma basis at 5 March 2001, together with theCompany’s invested capital at 31 December 2000.
ADJUSTED NET ASSET VALUE PER SHARE
Adjusted
NAV 31 December 2000
5 March Adjusted Invested
2001 NAV capital
Basis US$m US$m US$m
CONSUMER
Indofood (i) 402.3 353.1 706.6Berli Jucker (i) 74.1 80.6 164.2Darya-Varia (i) 24.7 27.3 52.4TELECOMMUNICATIONS
PLDT (i) 691.1 717.9 1,247.8Escotel (ii) 63.0 63.0 63.0PROPERTY
Metro Pacific (i) 186.3 180.1 648.8Savills (i) 49.2 39.9 34.1HEAD OFFICE
– Net indebtedness (150.0) (150.0) (150.0)– Other liabilities (8.6) (8.6) (8.6)TOTAL VALUATION (iii) 1,332.1 1,303.3 2,758.3NUMBER OF ORDINARY SHARES IN ISSUE (millions) 3,139.8 3,139.8 3,139.8Value per share– U.S. dollar 0.42 0.42 0.88– HK dollars 3.31 3.24 6.85Company’s closing share price (HK$) 2.20 2.23 2.23Share price discount to HK$ value per share (%) 33.5 31.3 67.5
(i) Based on quoted share prices applied to the Company’s economic interest.(ii) Based on investment cost less provisions.(iii)No value has been attributed to the Group’s telecom investment in Indonesia or other sundry investments.
Adjusted Net Asset Value by Country –31 December 2000
Philippines61%
Thailand6%
Indonesia26%
Others7%
US$millions
Philippines 898.0Indonesia 380.4Thailand 80.6Others 102.9Total 1,461.9
Share Price vs.Adjusted Net Asset
Value Per ShareHK$
Dec97
6.16
3.75 3.24
2.23
Dec98
Dec99
Dec00
7
6
5
4
3
2
1
0
Share PriceAdjusted net asset value per share
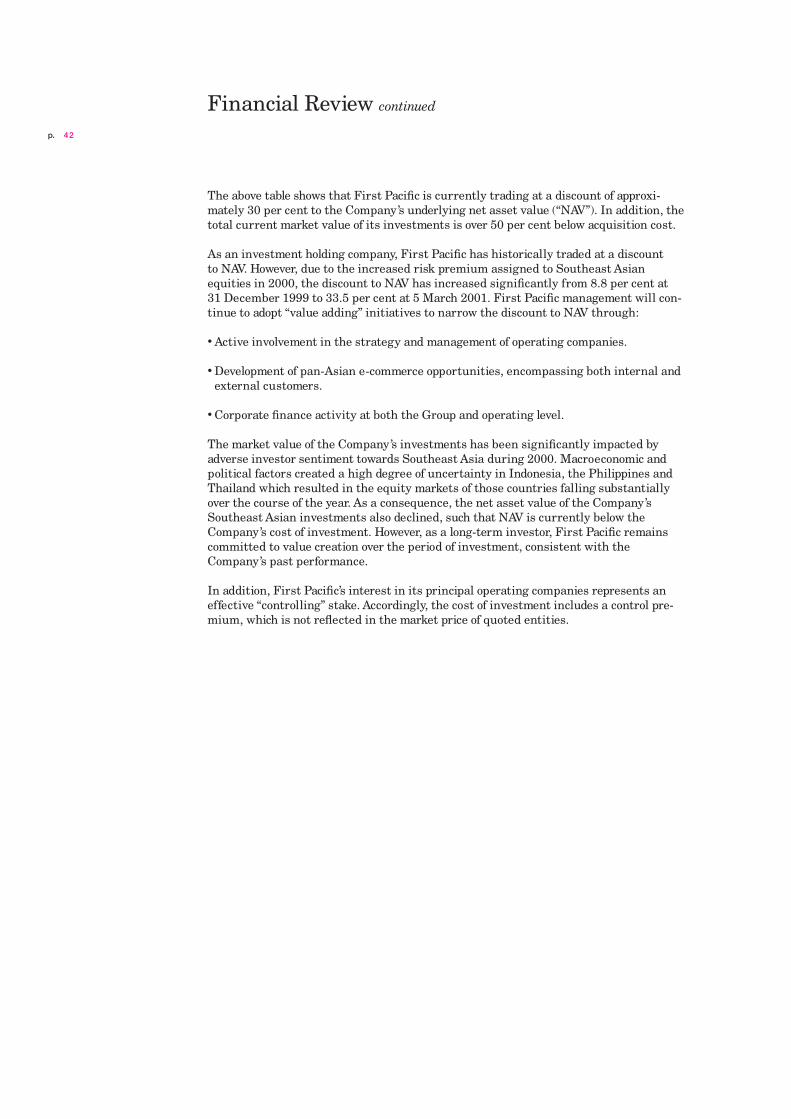
p. 42
The above table shows that First Pacific is currently trading at a discount of approxi-mately 30 per cent to the Company ’s underlying net asset value (“NAV”). In addition, thetotal current market value of its investments is over 50 per cent below acquisition cost.
As an investment holding company, First Pacific has historically traded at a discount to NAV. However, due to the increased risk premium assigned to Southeast Asian equities in 2000, the discount to NAV has increased significantly from 8.8 per cent at31 December 1999 to 33.5 per cent at 5 March 2001. First Pacific management will con-tinue to adopt “value adding” initiatives to narrow the discount to NAV through:
• Active involvement in the strategy and management of operating companies.
• Development of pan-Asian e-commerce opportunities, encompassing both internal andexternal customers.
• Corporate finance activity at both the Group and operating level.
The market value of the Company ’s investments has been significantly impacted byadverse investor sentiment towards Southeast Asia during 2000. Macroeconomic andpolitical factors created a high degree of uncertainty in Indonesia, the Philippines andThailand which resulted in the equity markets of those countries falling substantiallyover the course of the year. As a consequence, the net asset value of the Company ’sSoutheast Asian investments also declined, such that NAV is currently below theCompany ’s cost of investment. However, as a long-term investor, First Pacific remainscommitted to value creation over the period of investment, consistent with theCompany ’s past performance.
In addition, First Pacific’s interest in its principal operating companies represents aneffective “controlling” stake. Accordingly, the cost of investment includes a control pre-mium, which is not reflected in the market price of quoted entities.
Financial Review continued

p. 43
CASH RETURNS ON INVESTMENT
A measure of management’s success in creating long-term value for shareholders is itsability to realize attractive cash returns from its long-term investments. In recentyears, First Pacific has disposed of a number of investments and has consistentlyrecorded superior returns over the period of its shareholding. Set out below is a sum-mary of average annual cash returns realized on the disposal of major investments inrecent years.
Average
Investment annual
Year of period cash return
Investment disposal (years) (%)
Pacific Link 1997 10 23Hagemeyer 1998 15 24Tuntex 1999 2 40Guardforce 1999 6 19China telecom ventures 2000 5 4First Pacific Davies group 2000 15 9First Pacific Bank 2000 14 15
LIQUIDITY AND RESOURCES (A) COMPANY NET INDEBTEDNESS
Head Office borrowings as at 31 December 2000 were US$317.9 million compared toUS$511.4 million in 1999. The only remaining Head Office debt is in respect ofUS$267.9 million convertible bonds repayable in March 2002 and a US$50.0 million con-vertible note, repayable in September 2006. Further details are set out in Note 20 to theFinancial Statements.
Head Office cash increased by US$72.7 million during the year to US$167.9 million at31 December 2000. This primarily reflects the disposal of First Pacific Bank inDecember 2000 for cash proceeds of US$232.3 million.
CHANGES IN HEAD OFFICE NET INDEBTEDNESS
Net
Cash and indebted-
Borrowings bank ness
US$m US$m US$m
At 1 January 2000 511.4 (95.2) 416.2Movement (193.5) (72.7) (266.2)AT 31 DECEMBER 2000 317.9 (167.9) 150.0

p. 44
HEAD OFFICE CASH FLOW
2000 1999
US$m US$m
Net cash inflow from operating activities 29.4 12.6Net cash (outflow)/inflow from servicing of finance (4.5) 5.5Dividends paid to shareholders (8.9) (12.5)Tax paid (14.6) –Investments(i) (105.3) (518.6)Proceeds on disposal(ii) 370.1 352.4Financing activities– Net loan repayment (185.0) (15.0)– Floating rate notes repayment (8.5) (11.0)– Share placement and options – 202.4INCREASE IN CASH AND CASH EQUIVALENTS 72.7 15.8
(i) Investments in 2000 principally include the cash component for the acquisition of an 8.0 per cent interest in PLDT fromMetro Pacific.(ii) Proceeds on disposal in 2000 principally include the Group’s entire interests in First Pacific Bank (US$232.3 million), Chinatelecom ventures (US$81.8 million) and First Pacific Davies Limited (US$28.9 million).
(B) GROUP NET INDEBTEDNESS
An analysis of consolidated net indebtedness and gearing by operating company follows.
CONSOLIDATED NET INDEBTEDNESS AND GEARING
Net Net
indebted- indebted-
ness/ Net ness/ Net
(cash) assets Gearing (cash) assets Gearing
2000 2000 2000 1999 1999 1999
US$m US$m times US$m US$m times
Head Office(i) 150.0 1,590.9 0.1 416.2 1,570.8 0.3Metro Pacific(ii) 303.1 1,287.9 0.2 423.5 1,494.6 0.3Berli Jucker(iii) 70.4 148.5 0.5 29.9 218.3 0.1Darya-Varia (1.6) 10.9 – (3.2) 13.9 –Disposed companies – – – 317.0 388.5 0.8CONSOLIDATED BEFORE
GOODWILL RESERVE 521.9 3,038.2 0.2 1,183.4 3,686.1 0.3Goodwill reserve – (1,913.9) – – (1,744.1) –CONSOLIDATED AFTER
GOODWILL RESERVE 521.9 1,124.3 0.5 1,183.4 1,942.0 0.6
Financial Review continued
Net Indebtednessand Gearing
96 97
5 2.0
1.5
1.0
0.5
0
4
3
2
1
098 99 00
Net IndebtednessGearing before goodwill reserveGearing aftergoodwill reserve
US$billions
Gearing times

p. 45
ASSOCIATED COMPANIES
Net Net Net Net
indebted- assets/ indebted- assets/
ness (liabilities) Gearing ness (liabilities) Gearing
2000 2000 2000 1999 1999 1999
US$m US$m times US$m US$m times
Indofood 494.5 383.1 1.3 536.2 420.4 1.3PLDT (iv) 3,730.3 1,746.1 2.1 3,528.5 1,507.4 2.3Escotel 176.6 (46.0) – 151.1 (19.9) –
(i) Head Office’s gearing improved due to the reduction in borrowings following the disposal of First Pacific Bank and thestrengthening of the capital base from the issue of US$61.1 million of shares as consideration for the acquisition of an addi-tional 8.0 per cent interest in Indofood. (ii) Metro Pacific’s gearing improved marginally as a result of a US$120.4 million reduction in net indebtedness throughasset disposals. (iii)Berli Jucker’s gearing increased principally as a consequence of raising debt finance during the year in order to return fundsto shareholders.(iv)PLDT’s gearing improved to 2.1 times following the merger with Smart in March 2000 due to the cash injection from NTT aspart of this transaction.
The maturity profile of consolidated debt is set out in Notes 20 and 24 to the FinancialStatements and is summarized in percentage terms below. The principal change to thedebt maturity profile during 2000 is the impact of US$267.9 million of convertible bondsat Head Office, which are due for repayment in March 2002.
MATURITY PROFILE OF CONSOLIDATED DEBT
2000 1999
% %
Within one year 42.2 43.2One to two years 43.4 13.1Two to five years 6.5 33.2Over five years 7.9 10.5TOTAL 100.0 100.0
The maturity profile of the borrowings of the Group’s associated companies is as follows.The change to the debt maturity profile of Indofood reflects the repayment of someUS$300 million of loans and issuance of a Rupiah 1 trillion five-year bond in 2000.
Indofood PLDT Escotel
2000 1999 2000 1999 2000 1999
% % % % % %
Within one year 30.1 55.6 8.7 9.7 51.5 40.0One to two years 44.9 16.5 16.8 5.6 13.6 12.9Two to five years 25.0 27.9 38.7 34.7 25.7 36.7Over five years – – 35.8 50.0 9.2 10.4TOTAL 100.0 100.0 100.0 100.0 100.0 100.0
Maturity Profile ofConsolidated Debt
2000
Within 1 year42%1–2 years
43%
2–5 years7%
Over 5 years8%
Maturity Profile ofConsolidated Debt
1999
Within 1 year43%
1–2 years13%
2–5 years33%
Over 5 years11%

p. 46
FINANCIAL RISK FOREIGN CURRENCY RISK
MANAGEMENT (A) COMPANY RISK
First Pacific is exposed to foreign currency fluctuations arising from its portfolio of invest-ments. As all Head Office debts were denominated in U.S. dollars at year-end 2000, thisexposure relates mainly to the receipt of cash dividends, and to the translation of non-U.S.dollar investments in subsidiary and associated companies. The Company actively reviewsthe potential benefits of hedging based on forecast dividend flows.
The Company does not actively seek to hedge risks arising from foreign currency trans-lation of investments in subsidiary and associated companies due to their non-cashnature and the high cost associated with such hedging. Accordingly, First Pacific isexposed to the impact of foreign currency fluctuations on the U.S. dollar value of itsinvestments. As all of the components of the Company ’s NAV (with the exception ofHead Office amounts) relate to investments valued in local currencies, any depreciationof those currencies from their level at 31 December 2000 will have a negative impact onthe NAV in U.S. dollar terms.
The following table illustrates the estimated impact on the Company ’s adjusted NAV fora 1.0 per cent depreciation against the U.S. dollar of the currencies in which the equitiesof subsidiary and associated companies are quoted.
Effect on
Effect on adjusted NAV
adjusted NAV per share
Company US$m HK cents
PLDT (7.2) (1.79)Indofood (3.5) (0.86)Metro Pacific (1.8) (0.47)Berli Jucker (0.8) (0.23)Darya-Varia (0.3) (0.08)TOTAL(i) (13.6) (3.43)
(i) The NAV of the Group’s investment in Escotel is based on the historical U.S. dollar cost and accordingly any depreciation ofthe rupee would not affect the Company’s adjusted NAV.
Financial Review continued

p. 47
(B) GROUP RISK
First Pacific’s policy is for each operating entity to borrow in local currencies where pos-sible. However, it is often necessary for companies to borrow in U.S. dollars whichresults in a translation risk in their local currency results.
An analysis of consolidated net indebtedness by currency follows, together with the rele-vant details for the Group’s associated companies.
ANALYSIS OF CONSOLIDATED NET INDEBTEDNESS
US$ Peso Baht HK$ Rupiah Other(i) Total
US$m US$m US$m US$m US$m US$m US$m
Total borrowings 400.1 267.3 20.5 – 0.1 63.4 751.4Cash and
bank balances (94.9) (31.1) (12.7) (89.1) (1.7) – (229.5)NET INDEBTEDNESS/
(CASH) 305.2 236.2 7.8 (89.1) (1.6) 63.4 521.9REPRESENTING
Head Office 239.1 – – (89.1) – – 150.0Metro Pacific 66.9 236.2 – – – – 303.1Berli Jucker (0.8) – 7.8 – – 63.4 70.4Darya-Varia – – – – (1.6) – (1.6)NET INDEBTEDNESS/
(CASH) 305.2 236.2 7.8 (89.1) (1.6) 63.4 521.9
ASSOCIATED COMPANIES
US$ Peso Baht HK$ Rupiah Other(i) Total
US$m US$m US$m US$m US$m US$m US$m
Indofood 417.4 – – – 76.3 0.8 494.5PLDT 3,468.0 82.7 – – – 179.6 3,730.3Escotel 75.2 – – – – 101.4 176.6
(i) For Berli Jucker and PLDT, “other” represents Japanese yen. For Escotel, “other” represents Indian rupee.
Details of Head Office net indebtedness are set out on page 43.
Analysis of TotalBorrowingsby Currency
US$53%Peso
36%
Others 11%
US$millions
US$ 400.1Peso 267.3Others 84.0Total 751.4

p. 48
Metro Pacific has borrowings denominated in U.S. dollars since its property projectshave been funded through international equity markets. Its remaining U.S. dollar debtprimarily represents a convertible bond which is due for repayment in 2001. Going for-ward, Metro Pacific will seek funding in peso denominated borrowings where possible,while recognizing that long-term finance may be best secured through U.S. dollarequity-linked instruments.
Berli Jucker ’s borrowings are primarily in Japanese yen. Berli Jucker has fully hedgedits currency exposure into baht.
Indofood hedges its U.S. dollar debt through foreign currency swap agreements, rev-enue from exports and U.S. dollar deposits. In addition, US$253.0 million U.S. dollardenominated borrowings were repaid in July 2000 to further reduce its exposure tomovements in the rupiah exchange rate. At the end of 2000, approximately 82 per cent ofIndofood’s US$417.4 million of U.S. dollar denominated net borrowings were hedgedthrough foreign currency swap agreements which mature on various dates between2001 and 2005.
PLDT carries U.S. dollar debt primarily because international vendors of telecommuni-cations equipment quote prices and require payment in U.S. dollars. In addition, largefunding requirements often cannot be satisfied in local currency due to an inherent lackof depth in the financial markets in the Philippines. As a result, finance frequentlyneeds to be sourced from the international capital market, principally in U.S. dollars.PLDT’s U.S. dollar borrowings are unhedged as it is not possible in the Philippines tohedge significant U.S. dollar balances. However, substantial revenues of PLDT are eitherdenominated in, or linked to, the U.S. dollar. For example, PLDT’s U.S. dollar denomi-nated international inbound revenue accounted for approximately US$185.5 million or18.7 per cent of the company ’s total revenue in 2000. In addition, under certain circum-stances, PLDT is able to adjust its monthly recurring rates for the fixed line service by1.0 per cent for every Peso 0.1 change in the U.S. dollar exchange rate.
Escotel carries U.S. dollar borrowings for similar reasons to PLDT. Approximately 50 percent of the debt has been hedged.
Financial Review continued

p. 49
As a result of the relatively large unhedged U.S. dollar net indebtedness, particularly inthe Philippines, the Group’s results are sensitive to fluctuations in U.S. dollar exchangerates. The following table illustrates the estimated impact, arising from unhedged U.S.dollar net indebtedness, on the Group’s reported profitability for a 1.0 per cent deprecia-tion of the principal operating currencies of subsidiary and associated companies againstthe U.S. dollar. This does not reflect the indirect impact on the Group’s operationalresults as a consequence of changes in revenues and cost of sales due to fluctuation inU.S. dollar exchange rates.
Profit
US$ impact
Net of 1% Group
indebted- Hedged Unhedged currency profit
ness amount(i) amount(i) depreciation impact(ii)
US$m US$m US$m US$m US$m
PLDT 3,468.0 – 3,468.0 (34.7) (5.8)Metro Pacific 66.9 – 66.9 (0.7) (0.4)TOTAL PHILIPPINES 3,534.9 – 3,534.9 (35.4) (6.2)Indofood 417.4 343.0 74.4 (0.7) (0.2)Darya-Varia(iii) 9.0 – 9.0 (0.1) (0.1)TOTAL INDONESIA 426.4 343.0 83.4 (0.8) (0.3)Escotel (India) 75.2 37.6 37.6 (0.4) (0.2)Head Office (Hong Kong) 239.1 – 239.1 – –Berli Jucker (Thailand) (0.8) – (0.8) – –TOTAL (6.7)
(i) Excludes the impact of “natural hedges”.(ii) Net of tax effect.(iii)Represents inter-company funding from Head Office.
Key Regional CurrencyClosing Rates
Against the U.S. Dollar
Dec99
Mar00
Jun00
Dec00
Sep00
Feb01
35
39
45
37
41
43
47
49
51
53
6,500
7,000
7,500
8,000
8,500
9,000
9,500
10,000
10,500
PesoBahtRupiah
Peso/Baht Rupiah

p. 50
In summary, the Group manages exposure to exchange movements to the extent towhich it is possible or practicable, including the following:
• PLDT’s revenues are linked to the U.S. dollar, which partially compensates for theeffects of the Peso’s depreciation on unhedged U.S. dollar debt.
• Metro Pacific continues to explore ways to reduce its U.S. dollar debt through its on-going disposal of non-core assets and, where possible, replace U.S. dollar debt withPeso borrowings.
• Indofood is investigating options to repay more of its U.S. dollar denominated debt in2001, thereby eliminating its unhedged exposure.
INTEREST RATE RISK
The Company and the majority of its operating entities are exposed to changes in inter-est rates to the extent that they impact the cost of variable rate borrowings. An analysisof consolidated net indebtedness and interest rate profile, together with details for asso-ciated companies, follows:
Net indebtedness
Fixed Variable
interest interest Cash and
borrowings borrowings bank Total
US$m US$m US$m US$m
Head Office 317.9 – (167.9) 150.0Metro Pacific 154.9 194.6 (46.4) 303.1Berli Jucker 0.6 83.3 (13.5) 70.4Darya-Varia(i) 0.1 – (1.7) (1.6)CONSOLIDATED NET INDEBTEDNESS 473.5 277.9 (229.5) 521.9
(i) Excludes inter-company funding from Head Office of US$9.0 million.
Financial Review continued
Interest Rate Profile
Fixed63%
Floating37%
US$millions
Fixed 473.5Floating 277.9Total 751.4

p. 51
ASSOCIATED COMPANIES
Net indebtedness
Fixed Variable
interest interest Cash and
borrowings borrowings bank Total
US$m US$m US$m US$m
Indofood 177.5 515.7 (198.7) 494.5PLDT 2,557.4 1,366.5 (193.6) 3,730.3Escotel 29.2 149.3 (1.9) 176.6
As a result of variable interest rate debt at a number of operating companies, the Group’sresults are sensitive to fluctuations in interest rates. The following table illustrates theestimated impact on the Group’s reported profitability of a 1.0 per cent increase in aver-age annual interest rates for those entities which hold variable interest rate debt.
Profit
impact of
Variable 1% increase Group
interest in interest profit
borrowings rates impact(i)
US$m US$m US$m
Metro Pacific 194.6 (1.9) (1.1)Berli Jucker 83.3 (0.8) (0.5)Indofood 515.7 (5.2) (1.7)PLDT 1,366.5 (13.7) (2.3)Escotel 149.3 (1.5) (0.7)TOTAL (6.3)
(i) Net of tax effect.

p. 52
EQUITY MARKET RISK
As the majority of its investments are in listed entities, the Company is exposed to fluc-tuations in the equity values for those companies in which it has invested. In addition,the value of the Company ’s investments may be impacted by sentiment towards specificcountries or geographical areas. For example, as PLDT represents approximately 15 percent of the Philippine Composite Index, it is often taken as a proxy for market sentimenttowards Philippine equities as a whole. Indofood represents approximately four per centof the Jakarta Composite Index.
First Pacific’s listed investments are principally in the Philippines, Indonesia andThailand. Accordingly, in addition to operating factors within the Company ’s control, theCompany also has an equity market risk in respect of sentiment towards those coun-tries. Changes in the stock market indices of the Philippines, Indonesia and Thailandduring 2000 may be summarized as follows:
Philippine Jakarta Thailand
Composite Composite SET
Index Index Index
Index at 31 December 1999 2,142.97 676.919 481.92Index at 31 December 2000 1,494.50 416.321 269.19Decline during 2000 30.3% 38.5% 44.1%Index at 5 March 2001 1,616.54 426.127 300.24Increase since 2000 8.2% 2.4% 11.5%
As noted above, the weakness in the above markets during 2000 has had a significantimpact on First Pacific’s share price. The Company attempts to mitigate its exposure toequity market risk by ensuring that its operating companies remain amongst the bestmanaged in Southeast Asia. As a consequence of this and their inherently strong cashflows, management believes that First Pacific’s businesses are significantly undervaluedand are well positioned to benefit from any recovery in local equity markets.
Financial Review continued
Stock Market Indices
2,200
2,000
1,800
1,600
1,400
1,200
700
600
500
400
300
200
Philippine Composite Index (PCI)Jakarta Composite Index (JCI)Thai SET Index (SET)
PCI JCI/SET
Dec99
Mar00
Jun00
Dec00
Sep00
Feb01

p. 53p. 53Statutory Reports
and Financial Statements
STATUTORY REPORTS
REPORT OF THE DIRECTORS 54
REPORT OF THE AUDITORS 58
FI NANCIAL STATEMENTS
PRINCIPAL ACCOUNTING POLICIES 59
CONSOLIDATED PROFIT
AND LOSS STATEMENT 62
CONSOLIDATED STATEMENT
OF RECOGNIZED GAINS
AND LOSSES 62
CONSOLIDATED BALANCE SHEET 63
COMPANY BALANCE SHEET 64
CONSOLIDATED CASH FLOW
STATEMENT 65
Notes to the Financial Statements
CONSOLIDATED PROFIT
AND LOSS STATEMENT
1. TURNOVER AND SEGMENTAL
INFORMATION 66
2. OPERATING PROFIT 66
3. NET BORROWING COSTS 67
4. TAXATION 67
5. PROFIT ATTRIBUTABLE TO
ORDINARY SHAREHOLDERS 68
6. ORDINARY SHARE DIVIDENDS 68
7. EARNINGS PER SHARE 68
CONSOLIDATED AND COMPANY
BALANCE SHEETS
8. PROPERTY AND EQUIPMENT 69
9. SUBSIDIARY COMPANIES 70
10. ASSOCIATED COMPANIES 71
11. LONG-TERM INVESTMENTS 72
12. LONG-TERM RECEIVABLES 73
13. ACCOUNTS RECEIVABLE AND
PREPAYMENTS 73
14. INVENTORIES 73
15. SHARE CAPITAL 74
16. SHARE PREMIUM 74
17. REVENUE AND
OTHER RESERVES 75
18. GOODWILL RESERVE 76
19. OUTSIDE INTERESTS 77
20. LOAN CAPITAL AND LONG-TERM
BORROWINGS 77
21. DEFERRED LIABILITIES
AND PROVISIONS 79
22. DEFERRED TAXATION 79
23. ACCOUNTS PAYABLE
AND ACCRUALS 80
24. SHORT-TERM BORROWINGS 80
25. PROVISION FOR TAXATION 81
CONSOLIDATED CASH FLOW STATEMENT
26. CONSOLIDATED CASH
FLOW STATEMENT 81
27. ACQUISITIONS AND
INVESTMENTS 83
28. DISPOSALS AND DIVESTMENTS 84
OTHER FINANCIAL INFORMATION
29. COMMITMENTS AND
CONTINGENT LIABILITIES 85
30. EMPLOYEE INFORMATION 86
31. DIRECTORS AND
SENIOR EXECUTIVES 87
32. MAJOR CUSTOMERS AND
SUPPLIERS 91
33. RELATED PARTY TRANSACTIONS 91
contents

p. 54
REPORT OF THE DIRECTORS PRINCIPAL ACTIVITIES AND GEOGRAPHICAL ANALYSIS OF OPERATIONS
First Pacific Company Limited (the Company) is an investment and management com-pany. Its principal activities are Consumer, Telecommunications and Property.
An analysis of the Group’s turnover and contribution to operating profit for the year byprincipal activities and markets is set out in Note 1 to the Financial Statements.
INCORPORATION
The Company was incorporated on 25 May 1988 in Bermuda with limited liability.
SHARE CAPITAL AND RESERVES
Details of changes in the share capital of the Company and the reserves of the Companyand the Group (the Company and its subsidiary companies) are set out in Notes 15 to 18to the Financial Statements.
PURCHASE, SALE OR REDEMPTION OF LISTED SECURITIES
In December 2000, 221.8 million new shares were issued by the Company at a price ofHK$2.15 per share, being the 10-day average share price on or before the completiondate, to finance the acquisition of an additional 8.0 per cent interest in Indofood.
Except as described or referred to above, there has been no purchase, sale or redemptionof any of the Company ’s listed securities during the year by the Company or any of itssubsidiary companies.
In December 2000, the Group redeemed early and canceled the remaining US$8.5 mil-lion face value of its 2003 floating rate notes at par.
In December 2000, the Group acquired 421.2 million shares of FPB Bank HoldingCompany Limited at a price of HK$3.50 (US$0.45) per share from MIMET FOTICInvestment Limited. These shares, together with the Group’s original 514.8 millionshareholding, were sold to The Bank of East Asia Limited at the same price, also inDecember 2000.
Except as described or referred to above, there has been no issue, redemption or conversionof any convertible securities or options in issue by the Company ’s subsidiary companies.
RESULTS AND APPROPRIATIONS
The consolidated results of the Company, and particulars of appropriations therefromwhich have been made or recommended, are shown in the Consolidated Profit and LossStatement on page 62 and in Note 6 to the Financial Statements.
CHARITABLE CONTRIBUTIONS
The Group made charitable contributions totaling US$0.5 million in 2000 (1999:US$1.5 million). A description of the range of the Group’s contribution to the communi-ties in which it operates, including charitable activities, can be found on pages 16 to 17of this Annual Report.
PROPERTY AND EQUIPMENT
Details of changes in the Group’s property and equipment are provided in Note 8 to theFinancial Statements.
Statutory Reports

p. 55
BANK LOANS, OVERDRAFTS, LOAN CAPITAL AND OTHER BORROWINGS
Particulars of the bank loans, overdrafts, loan capital and other borrowings of theCompany and the Group are provided in Notes 20 and 24 to the Financial Statements.
DIRECTORS
The names of the Directors who held office at 31 December 2000 are set out in the tablebelow. Directors who retire may offer themselves for re-election. Details of the remuner-ation of Directors are provided in Note 31(A) to the Financial Statements.
As at the date of this report, the Company has 13 Directors, of whom seven are Non-executive Directors. These Non-executive Directors serve for a term of one year, andeach is subject to re-election at the Company ’s annual general meeting. None of theDirectors has a service contract with the Company which is not determinable within oneyear without payment of compensation, other than statutory compensation.
PRE-EMPTIVE RIGHTS
No pre-emptive rights exist in Bermuda in respect of the Company ’s share capital.
INTERESTS OF THE EXECUTIVE CHAIRMAN AND OTHER DIRECTORS
Information in respect of the interests of the Executive Chairman and other Directorsin the share capital of the Company as at 31 December 2000, disclosed pursuant toSection 29 of the Securities (Disclosure of Interests) Ordinance (SDI Ordinance), isdetailed below.
Ordinary
Ordinary share
shares options
Sutanto Djuhar 30.0 per cent interestTedy Djuhar 10.0 per cent interestIbrahim Risjad 10.0 per cent interestAnthoni Salim 10.0 per cent interest
all via First Pacific Investments Limited(i) 910,229,364(C) –
Anthoni Salim 33.3 per cent interestvia First PacificInvestments(BVI) Limited (ii) (iii) 582,076,361(C) –
Anthoni Salim 41.8 per cent interestvia PT Holdiko Perkasa (iv) 25,919,000(C) –
Manuel V. Pangilinan 11,136,759(P) 12,498,000(P)Michael J.A. Healy 147,990(P) 2,968,000(P)Ronald A. Brown 2,452,640(P) 3,864,000(P)David G. Eastlake 108,241(P) 2,060,000(P)Ricardo S. Pascua 3,000,009(P) –Edward A. Tortorici 12,624,129(P) 6,476,000(P)James C. Ng – –David W.C. Tang, OBE – –Prof. Edward K. Y. Chen, CBE, JP – –
(C) = Corporate interest, (P) = Personal interest
(i) Soedono Salim, the former Chairman, and Sudwikatmono, a former Non-executive Director, own 30.0 per cent and 10.0 percent interests, respectively, in the capital of First Pacific Investments Limited.(ii) Soedono Salim, the former Chairman, owns a 33.3 per cent interest in First Pacific Investments (BVI) Limited. (iii)First Pacific Investments (BVI) Limited also owns a US$50,000,000 convertible note of the Company. Details of the convert-ible note are set out in Note 20(B).(iv)Soedono Salim, the former Chairman, owns a 16.3 per cent interest in PT Holdiko Perkasa.

p. 56
Statutory Reports continued
The interests of the Executive Chairman and other Directors in the capital of theCompany ’s associated corporations (within the meaning of the SDI Ordinance) at31 December 2000 were as follows.
– Manuel V. Pangilinan owned 14,948,064 common shares(P) in Metro PacificCorporation (“MPC”) and 20,300 common shares(P) in Philippine Long DistanceTelephone Company (“PLDT”). In addition, he is entitled to 97,571 stock options(P)in PLDT.
– Michael J.A. Healy owned 625,000 ordinary shares(P) in PT Indofood Sukses MakmurTbk (“Indofood”).
– Ronald A. Brown owned 20,000 ordinary shares(P) in PT Darya-Varia Laboratoria and582,500 ordinary shares(P) in Indofood.
– Ricardo S. Pascua owned 16,881,026 common shares(P) in MPC, 6,424 commonshares(P) in PLDT and 370,000 common shares(P) in Fort Bonifacio DevelopmentCorporation (“FBDC”). In addition, he was entitled to 45,067,368 stock options(P) inMPC and 15,582,000 stock options(P) in FBDC.
– Edward A. Tortorici owned 3,051,348 common shares(P) in MPC, 96,880 commonshares(P) in PLDT and 2,450,000 ordinary shares(P) in Indofood.
– Sutanto Djuhar owned 15,520,335 ordinary shares(C) in Indofood.
– Tedy Djuhar owned 15,520,335 ordinary shares(C) in Indofood.
– Ibrahim Risjad owned 6,406,180 ordinary shares(P) in Indofood.
– Anthoni Salim owned 758,845 ordinary shares(C) in Indofood.
(C) = Corporate interest, (P) = Personal interest
INTERESTS OF SUBSTANTIAL SHAREHOLDERS
The register of substantial shareholders maintained under section 16(1) of the Securities(Disclosure of Interests) Ordinance shows that as at 31 December 2000, the companyhad been notified of the following substantial shareholders’ interests, being 10.0 per centor more of the company ’s issued share capital.
A) First Pacific Investments Limited (FPIL-Liberia), which is incorporated in theRepublic of Liberia and is majority owned by four Non-executive Directors of theCompany. Their beneficial indirect interests in the Company, through FPIL-Liberia, asat 31 December 2000, were: Sutanto Djuhar 8.70 per cent, Tedy Djuhar 2.90 per cent,Ibrahim Risjad 2.90 per cent, and Anthoni Salim 2.90 per cent.
B) First Pacific Investments (BVI) Limited (FPIL-BVI), which is incorporated in theBritish Virgin Islands is 33.3 per cent owned by one Non-executive Director of theCompany. His beneficial indirect interest in the Company, through FPIL-BVI, as at31 December 2000, was: Anthoni Salim 6.18 per cent.
C) The Capital Group Companies, Inc held 475,685,288 First Pacific shares, represent-ing 15.15 per cent of the Company ’s issued share capital.

p. 57
As at 31 December 2000, FPIL-Liberia beneficially owned 910,229,364 ordinary sharesin its name. These shares have been included in the interests of four Non-executiveDirectors’ corporate interests via FPIL-Liberia as referred to on page 55 of this Report.The remaining 582,076,361 ordinary shares are beneficially owned by FPIL-BVI andhave been included in the corporate interests of one Non-executive Director,Anthoni Salim.
CONTRACTS OF SIGNIFICANCE
No contracts of significance in relation to the Company ’s business to which the Companyor its subsidiary companies were parties, and in which a Director of the Company had amaterial interest whether directly or indirectly, subsisted at the end of the year or at anytime during the year.
Except for the share option schemes of the Company and its subsidiary companies, at notime during the year were the Company, its holding company, its subsidiary companiesor its fellow subsidiary companies parties to any arrangements to enable the Directors ofthe Company to acquire benefits by means of the acquisition of shares in, or debenturesof, the Company or any other body corporate.
CONNECTED TRANSACTIONS
Significant related party transactions, which also constitute connected transactionsunder the Listing Rules, requiring to be disclosed in accordance with Chapter 14 of theListing Rules, are disclosed in Note 33(A) to (G) to the Financial Statements.
DIRECTORS’ AND OFFICERS’ LIABILITY INSURANCE
The Company has maintained throughout the year insurance coverage for all Directorsand Officers of the Company and its related companies, save in those instances whereindividual companies have maintained their own coverage.
EMPLOYMENT POLICIES
The Company has a policy of non-discrimination in respect of the age, religion, gender,disability or marital status of employees and prospective employees. This ensures thatindividuals are treated equally, given their skills and abilities, in terms of career devel-opment and opportunities for advancement.
AUDITORS
The Financial Statements have been audited by PricewaterhouseCoopers who retireand, being eligible, offer themselves for re-appointment.
By order of the Board
Ronald A. BrownEXECUTIVE DIRECTOR AND COMPANY SECRETARY
5 March 2001

p. 58
REPORT OF THE AUDITORS TO THE SHAREHOLDERS OF FIRST PACIFIC COMPANY LIMITED
(INCORPORATED IN BERMUDA WITH LIMITED LIABILITY)
We have audited the Financial Statements on pages 59 to 93 which have been preparedin accordance with accounting principles generally accepted in Hong Kong.
RESPECTIVE RESPONSIBILITIES OF DIRECTORS AND AUDITORS
The Company ’s Directors are responsible for the preparation of Financial Statementswhich give a true and fair view. In preparing Financial Statements which give a true and fair view it is fundamental that appropriate accounting policies are selected andapplied consistently.
It is our responsibility to form an independent opinion, based on our audit, on thoseFinancial Statements and to report our opinion to you.
BASIS OF OPINION
We conducted our audit in accordance with Statements of Auditing Standards issued bythe Hong Kong Society of Accountants. An audit includes examination, on a test basis, ofevidence relevant to the amounts and disclosures in the Financial Statements. It alsoincludes an assessment of the significant estimates and judgments made by theDirectors in the preparation of the Financial Statements, and of whether the accountingpolicies are appropriate to the Company ’s and the Group’s circumstances, consistentlyapplied and adequately disclosed.
We planned and performed our audit so as to obtain all the information and explanationswhich we considered necessary in order to provide us with sufficient evidence to give rea-sonable assurance as to whether the Financial Statements are free from material mis-statement. In forming our opinion we also evaluated the overall adequacy of thepresentation of information in the Financial Statements. We believe that our audit pro-vides a reasonable basis for our opinion.
OPINION
In our opinion, the Financial Statements give a true and fair view of the state of affairsof the Company and the Group as at 31 December 2000 and of the profit and cash flowsof the Group for the year then ended and have been properly prepared in accordancewith the disclosure requirements of the Hong Kong Companies Ordinance.
PricewaterhouseCoopersCERTIFIED PUBLIC ACCOUNTANTS, HONG KONG
5 March 2001
Statutory Reports continued

p. 59
PRINCIPAL ACCOUNTING The Group comprises First Pacific Company Limited and its subsidiary companies.POLICIES
A) BASIS OF PREPARATION The Financial Statements have been prepared in accordance with generally acceptedaccounting principles in Hong Kong and comply with accounting standards issued by the Hong Kong Society of Accountants, the disclosure requirements of the Hong KongCompanies Ordinance and The Rules Governing the Listing of Securities on the Stock Exchange of Hong Kong Limited. The accounts are prepared under the histori-cal cost convention.
B) BASIS OF CONSOLIDATION The consolidated Financial Statements include the accounts of the Company and its sub-sidiary companies made up to 31 December. All significant intercompany transactionsand balances within the Group are eliminated on consolidation.
The results of subsidiary companies acquired or disposed of during the year are includedin the consolidated profit and loss statement from the effective date of acquisition or upto the effective date of disposal, as appropriate. The gain or loss on the disposal of a sub-sidiary company represents the difference between the proceeds of the sale and theGroup’s share of its net assets together with any goodwill which was not previouslycharged or recognized in the consolidated profit and loss statement.
Outside interests represent the interests of outside shareholders in the operating resultsand net assets of subsidiary companies.
In the Company ’s balance sheet, the investments in subsidiary companies are stated atcost less provision, if necessary, for any permanent diminution in value. The results ofsubsidiary companies are accounted for by the Company on the basis of dividendsreceived and receivable.
C) INVENTORIES Inventories are stated at the lower of cost or net realizable value. Cost is calculatedusing the first-in first-out basis or the weighted-average basis. The cost of goods pur-chased for resale includes costs incurred in bringing the goods to their present location.Net realizable value is determined on the basis of current anticipated sales prices lessestimates of costs to completion and selling expenses.
D) PROPERTY AND Land and buildings are stated at cost or valuation less accumulated depreciation.EQUIPMENT Freehold land is stated at cost or valuation and is not depreciated. Other property and
equipment is stated at cost less accumulated depreciation calculated on the straight-linebasis at annual rates estimated to write off their book values over their expected usefullives. Details of depreciation rates are given in Note 8(A).
Major costs incurred in restoring fixed assets to their normal working condition arecharged to the consolidated profit and loss statement. Improvements are capitalized anddepreciated over their expected useful lives to the Group.
The gain or loss on disposal of property and equipment is the difference between the netsales proceeds and the carrying amount of the relevant asset, and is recognized in theconsolidated profit and loss statement. Any property revaluation reserve balanceremaining attributable to the relevant asset is transferred to the revenue reserve. Withreference to Statement of Standard Accounting Practice No. 17 paragraph 72, land andbuildings have not been revalued to fair value as at the balance sheet date.
Financial Statements

p. 60
Financial Statements continued
E) DEVELOPMENT Development properties are investments in land and buildings under construction, and PROPERTIES are carried at cost less provisions for any permanent diminution in value. Cost includes
the original cost of the land and buildings, borrowing costs incurred in respect ofdevelopment, construction expenditure and other direct costs. Profit is recognized onsales of properties as a percentage of the total estimated profit to completion, with thepercentage used being the proportion of costs incurred to the estimated total costs.
F) ASSOCIATED COMPANIES An associated company is a company, not being a subsidiary company, in which theGroup has a substantial long-term interest in the equity voting rights and over whichthe Group is in a position to exercise significant influence in its management, includingparticipation in the financial and operating policy decisions.
Investments in associated companies are stated in the consolidated balance sheet at theGroup’s share of net assets, and in the Company ’s balance sheet at cost less provisionsfor any permanent diminution in value. Income from associated companies is stated inthe consolidated profit and loss statement as the Group’s share of profits less losses ofassociated companies, and in the Company ’s profit and loss statement to the extent ofdividends received and receivable.
G) INVESTMENTS Investments are stated at cost less any provision for diminution in value. Income isaccounted for only to the extent of dividends received and receivable.
The carrying values of individual investments are reviewed at each balance sheet date toassess whether the fair values have declined below the carrying amounts. When adecline, other than a temporary decline has occurred, the carrying amount of such aninvestment is reduced to its fair value. The amount of the reduction is recognized as anexpense in the consolidated profit and loss statement.
H) DEFERRED TAXATION Deferred taxation is provided using the liability method in respect of material timingdifferences between profit as computed for taxation purposes and profit as stated in theFinancial Statements, except where it is considered that no liability will arise in theforeseeable future.
I) ACCOUNTING FOR I) RESULTS The results of businesses acquired or sold are accounted for from or to theACQUISITIONS AND effective date of acquisition or disposal.DISPOSALS
II) FAIR VALUE ADJUSTMENTS AND ACQUISITION PROVISIONS On the acquisition of a business oran interest in an associated company, the acquisition cost is allocated to the fair value ofthe separable net assets acquired.
III) GOODWILL represents the excess of costs of acquisition over the fair value of the Group’sshare of the separable net assets of businesses and interests in associated companiesacquired and, in the year of acquisition, is included in a goodwill reserve which isdeducted from shareholders’ equity. The carrying amount of the goodwill reserve isreviewed on a regular basis. As appropriate, any deemed permanent impairment isrecorded in the consolidated profit and loss statement for the year. Any impaired good-will will not be reinstated. On disposal, any remaining attributable goodwill previouslydeducted from shareholders’ equity on acquisition is reinstated and included in deter-mining the gain or loss in the consolidated profit and loss statement.
J) FOREIGN CURRENCIES The profit and loss statements of overseas subsidiary and associated companies are trans-lated into U.S. dollars using average rates of exchange for the period. Balance sheets aretranslated at closing rates. Where hedging arrangements are in place, the transactions towhich they are related are translated at the rate determined by those arrangements.

p. 61
Exchange differences, arising on the retranslation at closing rates of the opening netassets and the profits for the year retained by overseas subsidiary and associatedcompanies, and on foreign currency borrowings used to finance long-term foreignequity investments, are taken to reserves.
Foreign currency transactions are translated into U.S. dollars at rates approximatingthose prevalent at the relevant transaction dates. Monetary assets and liabilities aretranslated at the rates of exchange prevailing at the balance sheet date.
Exchange differences are included in the carrying amount of an asset and are recog-nized in the consolidated profit and loss statement when the asset is disposed of, or overthe expected useful life of the asset under the following conditions:
i) where exchange differences fall within the definition of borrowing costs (see (N)below); or
ii) where it is not practically feasible to hedge a foreign currency and this affects liabilities arising directly on the recent acquisition of the related asset invoiced in theforeign currency.
All other exchange differences are dealt with in the consolidated profit and loss statement.
K) TURNOVER Turnover represents the amounts received and receivable from the sale of goods and therendering of services to third parties, falling within the ordinary activities of theGroup’s businesses. Turnover from sales is recognized when ownership of goods sold hastransferred to the buyer. Turnover from services is recognized when it can be measuredreliably by reference to stage of completion for the rendering of services.
L) OPERATING LEASES Leases, where substantially all of the risks and rewards of ownership of assets remainwith the leasing company, are accounted for as operating leases. Rentals payable andreceivable under operating leases are recorded in the consolidated profit and loss state-ment on a straight line basis over the lease term.
M) RETIREMENT BENEFITS The Group operates defined contribution and defined benefit retirement schemes. Thecosts of defined contribution schemes are charged to the consolidated profit and lossstatement as and when contributions fall due. The costs of defined benefit schemes arecharged against profit on a systematic basis with any surpluses and deficits allocated soas to spread them over the expected remaining service lives of the employees affected.
N) BORROWING COSTS Borrowing costs are interest and other costs incurred in connection with the borrowingof funds. Other costs include exchange differences on foreign currency borrowings andredemption premiums on convertible instruments. Exchange differences arising fromforeign currency borrowings are included to the extent that they are regarded as anadjustment to interest costs, and/or where borrowings in local currency are not availableand it is not practically feasible to hedge the foreign currency borrowings. Redemptionpremiums on convertible instruments are provided for over the life of the instrumentswhen it is probable that the premium will become payable.
Borrowing costs are expensed in the consolidated profit and loss statement in the periodin which they are incurred, except to the extent that they are capitalized as beingdirectly attributable to the acquisition, construction or production of an asset which nec-essarily takes a substantial period of time to prepare for its intended use or sale.
O) RELATED PARTIES Related parties are individuals and companies where the individual or company has theability, directly or indirectly, to control the other party or exercise significant influenceover the other party in making financial and operating decisions, or where two partiesare subject to common control or common significant influence.

p. 62
Financial Statements continued
CONSOLIDATED PROFIT For the year ended 31 December 2000 1999
AND LOSS STATEMENT Note US$m US$m
TURNOVER 1 808.9 1,231.5Cost of sales (507.3) (690.6)GROSS PROFIT 301.6 540.9Gain on disposal and dilution of shareholdings
less provision for investments 145.5 98.5Other operating income 8.6 27.0Distribution costs (27.9) (32.4)Administrative expenses (160.1) (214.6)Other operating expenses (58.7) (167.4)OPERATING PROFIT 2 209.0 252.0Share of profits less losses of associated companies (84.4) 67.5Net borrowing costs 3 (58.0) (83.0)PROFIT BEFORE TAXATION 66.6 236.5Taxation 4 (9.9) (48.9)PROFIT AFTER TAXATION 56.7 187.6Outside interests (5.5) (49.4)PROFIT ATTRIBUTABLE TO ORDINARY SHAREHOLDERS 5 51.2 138.2Ordinary share dividends paid and proposed 6 (7.7) (15.0)RETAINED PROFIT FOR THE YEAR 17 43.5 123.2EARNINGS PER SHARE (U.S. Cents) 7Basic 1.75 5.34Diluted 1.75 5.32
The principal accounting policies on pages 59 to 61 and the Notes on pages 66 to 93 forman integral part of the Financial Statements.
CONSOLIDATED STATEMENT For the year ended 31 December 2000 1999
OF RECOGNIZED GAINS Note US$m US$m
AND LOSSES Exchange differences on the translation of the financial statements of foreign entities 17 (180.3) (0.9)
Realization of property revaluation 24.7 –NET LOSSES NOT RECOGNIZED IN THE
PROFIT AND LOSS STATEMENT (155.6) (0.9)Profit attributable to ordinary shareholders 51.2 138.2TOTAL RECOGNIZED (LOSSES)/GAINS FOR THE YEAR (104.4) 137.3Goodwill arising on acquisitions during the year 18 (312.7) (851.0)
(417.1) (713.7)
The principal accounting policies on pages 59 to 61 and the Notes on pages 66 to 93 forman integral part of the Financial Statements.

p. 63
CONSOLIDATED As at 31 December 2000 1999
BALANCE SHEET Note US$m US$m
ASSETS
NON-CURRENT ASSETS
Property and equipment 8 1,464.1 2,605.9Associated companies 10 109.1 133.6Long-term investments 11 5.2 17.6Long-term receivables 12 115.3 147.7
1,693.7 2,904.8ASSETS, OTHER THAN PROPERTY AND EQUIPMENT,
ATTRIBUTABLE TO BANKING OPERATIONS – 2,873.2CURRENT ASSETS
Cash and bank balances 229.5 280.4Short-term investments – 75.0Accounts receivable and prepayments 13 344.4 576.9Inventories 14 54.8 86.7
628.7 1,019.0TOTAL ASSETS 2,322.4 6,797.0EQUITY AND LIABILITIES
EQUITY CAPITAL AND RESERVES
Share capital 15 31.4 29.1Share premium 16 908.7 849.8Revenue and other reserves 17 1,339.3 1,456.7Shareholders’ equity before goodwill reserve 2,279.4 2,335.6Goodwill reserve 18 (1,913.9) (1,744.1)Shareholders’ equity 365.5 591.5Outside interests 19 758.8 1,350.5NON-CURRENT LIABILITIES
Loan capital and long-term borrowings 20 434.2 832.1Deferred liabilities and provisions 21 215.6 360.8Deferred taxation 22 7.7 12.6
657.5 1,205.5LIABILITIES ATTRIBUTABLE TO BANKING OPERATIONS – 2,624.7CURRENT LIABILITIES
Accounts payable and accruals 23 215.0 373.9Short-term borrowings 24 317.2 631.7Provision for taxation 25 4.4 11.7Dividends 6 4.0 7.5
540.6 1,024.8TOTAL LIABILITIES 1,198.1 4,855.0
TOTAL EQUITY AND LIABILITIES 2,322.4 6,797.0
The principal accounting policies on pages 59 to 61 and the Notes on pages 66 to 93 forman integral part of the Financial Statements.
Manuel V. Pangilinan Michael J.A. HealyEXECUTIVE CHAIRMAN CHIEF OPERATING OFFICER AND FINANCE DIRECTOR
5 March 2001

p. 64
Financial Statements continued
COMPANY BALANCE SHEET As at 31 December 2000 1999
Note US$m US$m
ASSETS
NON-CURRENT ASSETS
Subsidiary companies 9 1,445.4 1,491.9Associated companies 10(C) 27.9 26.3
1,473.3 1,518.2CURRENT ASSETS
Cash and bank balances 138.6 15.7Accounts receivable and prepayments 13 2.4 4.2
141.0 19.9TOTAL ASSETS 1,614.3 1,538.1EQUITY AND LIABILITIES
EQUITY CAPITAL AND RESERVES
Share capital 15 31.4 29.1Share premium 16 908.7 849.8Revenue reserve 17 619.0 600.9Shareholders’ equity 1,559.1 1,479.8NON-CURRENT LIABILITY
Loan capital and long-term borrowings 20(B) 50.0 50.0CURRENT LIABILITIES
Accounts payable and accruals 23 1.2 0.8Dividends 6 4.0 7.5
5.2 8.3TOTAL LIABILITIES 55.2 58.3
TOTAL EQUITY AND LIABILITIES 1,614.3 1,538.1
The principal accounting policies on pages 59 to 61 and the Notes on pages 66 to 93 forman integral part of the Financial Statements.
Manuel V. Pangilinan Michael J.A. HealyEXECUTIVE CHAIRMAN CHIEF OPERATING OFFICER AND FINANCE DIRECTOR
5 March 2001

p. 65
CONSOLIDATED CASH FLOW For the year ended 31 December 2000 1999
STATEMENT Note US$m US$m
NET CASH (OUTFLOW)/INFLOW FROM OPERATING ACTIVITIES 26(A) (12.1) 192.7Interest – received 16.2 17.8– paid (65.1) (105.9)Dividends – received from Banking operations 4.0 –– received from associated companies and long-term investments 6.4 7.1– paid to shareholders (8.9) (12.5)– paid to outside interests in subsidiary companies (10.7) (1.3)NET CASH OUTFLOW FROM RETURNS ON INVESTMENTS AND SERVICING OF FINANCE (58.1) (94.8)Hong Kong profits tax paid (0.2) (0.2)Overseas taxation paid (29.7) (9.9)TOTAL TAX PAID 25 (29.9) (10.1)NET CASH (OUTFLOW)/INFLOW BEFORE INVESTING ACTIVITIES (100.1) 87.8Additions of property and equipment (127.1) (219.3)Acquisitions of– subsidiary companies – (5.3)– associated companies – (383.8)Increased investments in– subsidiary companies – (30.2)– associated companies 27 (30.2) (79.2)– long-term investments and others – (3.0)Sale of property and equipment 26.4 10.0Disposals of– subsidiary companies 28(A) 211.2 164.2– investments 28(B) 81.8 74.3Reduced interest in– subsidiary companies – 159.9– associated companies 28(C) 24.5 0.2Loans repaid by/(to) associated companies 87.9 (4.8)NET CASH INFLOW/(OUTFLOW) FROM INVESTING ACTIVITIES 274.5 (317.0)NET CASH INFLOW/(OUTFLOW) BEFORE FINANCING ACTIVITIES 174.4 (229.2)Proceeds from new borrowings 371.6 696.1Borrowings repaid (571.0) (773.5)Shares issued through placement – 199.9Shares issued through the exercise of share options – 2.5Shares issued to outside interests by subsidiary companies 0.2 150.4NET CASH (OUTFLOW)/INFLOW FROM FINANCING ACTIVITIES 26(B) (199.2) 275.4(DECREASE)/INCREASE IN CASH AND CASH EQUIVALENTS (24.8) 46.2Cash and cash equivalents at 1 January 267.5 224.4Exchange translation (22.1) (3.1)CASH AND CASH EQUIVALENTS AT 31 DECEMBER 220.6 267.5REPRESENTING
Cash and bank balances 26(D) 229.5 280.4Overdrafts 26(E) (1.0) (2.8)Other short-term borrowings with an original maturity of
less than 90 days 26(E) (7.9) (10.1)CASH AND CASH EQUIVALENTS AT 31 DECEMBER 220.6 267.5
The principal accounting policies on pages 59 to 61 and the Notes on pages 66 to 93 forman integral part of the Financial Statements.

p. 66
1. TURNOVER AND 2000 1999
SEGMENTAL INFORMATION US$m US$m
TURNOVER
Sale of goods 534.1 664.1Rendering of services 274.8 567.4TOTAL 808.9 1,231.5INCLUDED IN RENDERING OF SERVICES IS TURNOVER RELATING TO BANKING OPERATIONS OF
US$114.3 MILLION (1999 US$89.2 MILLION) WHICH IS STATED AFTER CREDITING
Interest income 216.7 209.2Finance lease and hire-purchase income 21.9 20.5AND CHARGING
Interest expense 145.3 154.9
SEGMENTAL INFORMATION
An analysis of the Group’s turnover and operating profit by principal activities and mar-kets is as follows.
Turnover Operating profit
2000 1999 2000 1999
Principal activities US$m US$m US$m US$m
Consumer 331.8 339.9 25.2 36.5Telecommunications 80.5 307.2 (18.2) 46.1Property 282.3 495.2 3.7 66.5Banking 114.3 89.2 35.1 9.2Head Office and others – – 163.2 93.7TOTAL 808.9 1,231.5 209.0 252.0
Turnover Operating profit
2000 1999 2000 1999
Principal markets US$m US$m US$m US$m
Philippines 320.5 624.7 (14.6) 109.4Indonesia 50.5 45.7 1.8 7.3Thailand 281.3 294.2 23.4 29.2Hong Kong 156.6 266.9 35.2 12.4Head Office and others – – 163.2 93.7TOTAL 808.9 1,231.5 209.0 252.0
2. OPERATING PROFIT 2000 1999
US$m US$m
OPERATING PROFIT IS STATED AFTER CREDITING
Net rental income from investment properties 1.8 1.9Operating lease income less outgoings 1.3 1.1Dividends from unlisted investments 0.1 0.4Gain on sale of property and equipment 0.4 –AND CHARGING
Employee remuneration 124.8 190.3Depreciation 49.1 117.7Doubtful debt provisions 19.8 52.8Net exchange loss on monetary items 18.8 3.7Operating lease rentals– Land and buildings 7.1 17.7– Hire of plant and equipment 1.0 5.3– Other 0.1 0.7Auditors’ remuneration 1.3 2.0Loss on sale of property and equipment – 1.0
Notes to the Financial Statements

p. 67
3. NET BORROWING COSTS Net borrowing costs exclude interest expense and interest income for the Group’sBanking operations (included in Turnover).
2000 1999
US$m US$m
Loan capital– wholly repayable within five years 36.5 12.6– not wholly repayable within five years 1.0 0.2Subtotal 37.5 12.8Bank loans, overdrafts and other loans– wholly repayable within five years 51.0 71.7– not wholly repayable within five years 2.2 23.0Subtotal 53.2 94.7TOTAL INTEREST EXPENSE 90.7 107.5Other borrowing costs– Exchange differences 17.8 2.0– Redemption premium on convertible instruments 23.0 23.2TOTAL BORROWING COSTS 131.5 132.7Less borrowing costs capitalized in– property investments (49.1) (18.1)– plant and equipment (4.2) (6.9)Less interest income (20.2) (24.7)NET BORROWING COSTS 58.0 83.0
4. TAXATION Hong Kong profits tax has been provided at the rate of 16.0 per cent (1999: 16.0 per cent)on the estimated assessable profits for the year. Taxation on assessable profits generatedoutside Hong Kong has been provided at the rates of taxation prevailing in the countriesin which the Company ’s subsidiary and associated companies operate.
2000 1999
US$m US$m
SUBSIDIARY COMPANIES
Current taxation– Hong Kong profits tax 3.8 1.0– Overseas taxation 12.2 11.8Deferred taxation– Hong Kong profits tax – 0.1– Overseas taxation 5.8 2.2Subtotal 21.8 15.1ASSOCIATED COMPANIES
Current taxation– Hong Kong profits tax 0.9 0.3– Overseas taxation 14.6 15.2Deferred taxation– Overseas taxation (27.4) 18.3Subtotal (11.9) 33.8TOTAL 9.9 48.9
Included above is taxation for Banking operations of US$3.5 million (1999: US$0.5 million).

p. 68
Notes to the Financial Statements continued
5. PROFIT ATTRIBUTABLE Profit attributable to ordinary shareholders includes substantial exchange (losses)/gainsTO ORDINARY as set out below.SHAREHOLDERS
ANALYSIS OF EXCHANGE (LOSSES)/GAINS
2000 1999
US$m US$m
Subsidiary companies (36.6) (5.7)Less capitalized within net borrowing costs 17.8 2.0Included in other operating expenses (18.8) (3.7)Associated companies (185.7) 1.4Subtotal (204.5) (2.3)Exchange differences attributable to taxation and outside interests 61.0 6.5TOTAL (143.5) 4.2
An analysis of exchange (losses)/gains by principal operating company is set out below.Exchange losses arose primarily on the translation of unhedged U.S. dollar denominatedborrowings of PLDT and Indofood as a result of the significant depreciation of the pesoand the rupiah during 2000.
2000 1999
US$m US$m
PLDT (103.7) (8.3)Indofood (23.5) 14.6Others (16.3) (2.1)TOTAL (143.5) 4.2
The profit attributable to ordinary shareholders includes US$23.5 million (1999:US$19.5 million) in respect of the Company. After the deduction of dividends totalingUS$7.7 million, the Company ’s retained profit for the year amounted to US$15.8 million(Note 17).
6. ORDINARY SHARE U.S. cent per share US$m
DIVIDENDS 2000 1999 2000 1999
Interim dividend paid 0.13 0.26 3.7 7.5Final dividend proposed 0.13 0.26 4.0 7.5TOTAL 0.26 0.52 7.7 15.0
The interim dividend was settled in scrip with a shareholder ’s option to receive settlementin cash. The final dividend will be paid wholly in cash consistent with the Company ’srevised policy. The 1999 final dividend and the 2000 interim dividend, US$1.5 millionand US$0.8 million, respectively, were settled in scrip.
7. EARNINGS PER SHARE 2000 1999
Basic Basic
Earnings per share are based on– profit attributable to ordinary shareholders of (US$m) 51.2 138.2– and an average number of shares in issue of (million) 2,923.9 2,586.9resulting in earnings per share of (U.S. cents) 1.75 5.34
As the impact of convertible instruments is anti-dilutive, both the basic and dilutedearnings per share figures are the same for 2000. In 1999, the diluted earnings pershare was U.S. 5.32 cents.

p. 69
8. PROPERTY AND Develop- Telecommu- Machinery, Consoli-
EQUIPMENT Investment ment Land and nications equipment dated
properties properties buildings equipment and vessels Total
US$m US$m US$m US$m US$m US$m
COST OR VALUATION
At 1 January 2000 32.8 1,436.6 319.2 733.3 493.4 3,015.3Exchange translation (0.1) (279.2) (34.7) (15.7) (63.0) (392.7)Disposal of subsidiary
companies(i) (32.3) – (115.8) (794.6) (140.7) (1,083.4)Additions – 85.1 0.4 80.2 34.3 200.0Disposals (0.4) (23.4) (3.4) (3.2) (29.5) (59.9)Reclassifications – (42.1) – – – (42.1)AT 31 DECEMBER 2000 – 1,177.0 165.7 – 294.5 1,637.2REPRESENTING
Cost – 1,177.0 57.1 – 294.5 1,528.6Directors’ valuation 1995 – – 21.6 – – 21.6Independent valuation 1995 – – 87.0 – – 87.0TOTAL – 1,177.0 165.7 – 294.5 1,637.2ACCUMULATED DEPRECIATION
At 1 January 2000 – – 35.8 132.4 241.2 409.4Exchange translation – – (4.8) (1.7) (32.2) (38.7)Disposal of subsidiary
companies(i) – – (9.4) (141.3) (70.3) (221.0)Charge for the year – – 5.1 12.7 31.3 49.1Disposals – – (0.3) (2.1) (23.3) (25.7)AT 31 DECEMBER 2000 – – 26.4 – 146.7 173.1NET BOOK AMOUNT
AT 31 DECEMBER 2000 – 1,177.0 139.3 – 147.8 1,464.1AT 31 DECEMBER 1999 32.8 1,436.6 283.4 600.9 252.2 2,605.9
(i) Disposal of subsidiary companies includes the deconsolidation of Smart and First Pacific Davies Limited following their dis-posal to PLDT and Savills, respectively.
A) Principal annual rates of depreciation:Investment and development properties and freehold land NilFreehold buildings 2% to 5%Leasehold land and buildings Lesser of period of lease, or 2%Telecommunications equipment 5% to 10%Machinery, equipment and vessels 2% to 33.3%

p. 70
B) Principal development properties as at 31 December 2000:Approximate Group’s
gross economic Estimated
development interest completion
Location in the Philippines area (sq.m.)(i) % Type Status date
Batulao, Batangas 9,940,000 34.7 R Planning –Costa De Madera,
San Juan, Batangas 3,600,000 37.1 Ro Planning –Lakewood, Cabanatuan 2,167,277 27.4 R Under construction 2003Fort Bonifacio,
Metro Manila 1,377,870 29.4 C,R Under construction 2020Calasiao, Pampanga 1,860,000 38.7 R Planning –Punta Fuego, Batangas 489,640 26.6 R,Ro Under construction 2002Talisay, Cebu 312,649 24.2 R Under construction 2003Urdaneta, Pangasinan 329,183 27.4 R Under construction 2001San Fernando, Pampanga 2,342,432 23.4 R Planning –Pacific Plaza Towers,
Metro Manila 4,851 80.6 R Under construction 2001Stonecrest, San Pedro,
Laguna 343,060 24.2 R Under construction 2001
R = Residential, Ro = Resort, C = Commercial(i) Total area for development and sale as subdivisions, including lots sold under installment terms where full payment has notbeen made, and land designated for parks and open spaces.
C) Net book amount of land and buildings:2000 1999
US$m US$m
Freehold – outside Hong Kong 137.8 192.0Long-term leasehold (over 50 years) – Hong Kong 1.5 91.4TOTAL 139.3 283.4
D) As at 31 December 2000, capitalized interest and exchange differences included in the net book value of development properties amounted to US$131.7 million (1999: US$96.1 million) and US$80.0 million (1999: US$90.9 million), respectively.
9. SUBSIDIARY Company
COMPANIES 2000 1999
US$m US$m
Unlisted shares at cost 991.7 986.8Loans to subsidiary companies 898.7 979.6Balances with subsidiary companies (440.1) (469.6)Less provisions for permanent diminution (4.9) (4.9)TOTAL 1,445.4 1,491.9
The Company ’s listed subsidiaries are held through intermediate holding companies.
Loans to subsidiary companies are unsecured, interest bearing at a range of zero percent to 9.5 per cent per annum and have no fixed terms of repayment.
Balances with subsidiary companies are unsecured, interest bearing at a range of zeroper cent to 8.9 per cent per annum and have no fixed terms of repayment.
Details of subsidiary companies, which in the opinion of the Directors materiallyaffect the results or net assets of the Group, are set out in tabular form on the insideback cover.
Notes to the Financial Statements continued
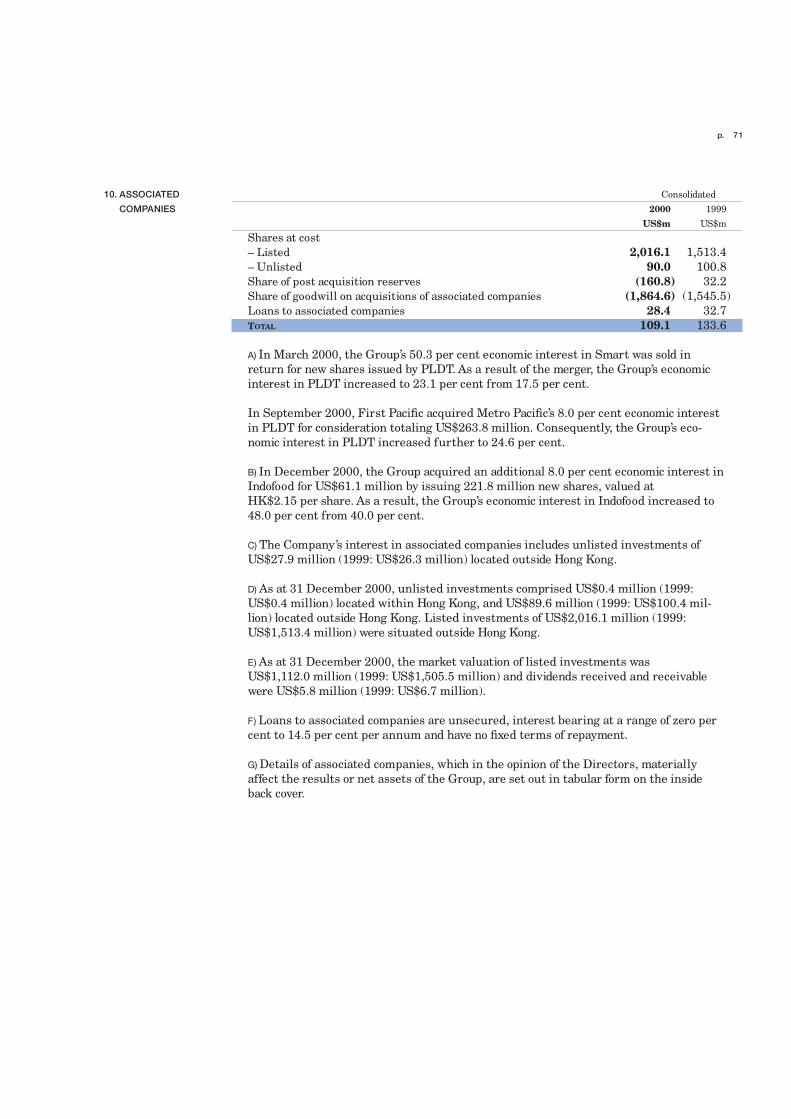
p. 71
10. ASSOCIATED Consolidated
COMPANIES 2000 1999
US$m US$m
Shares at cost– Listed 2,016.1 1,513.4– Unlisted 90.0 100.8Share of post acquisition reserves (160.8) 32.2Share of goodwill on acquisitions of associated companies (1,864.6) (1,545.5)Loans to associated companies 28.4 32.7TOTAL 109.1 133.6
A) In March 2000, the Group’s 50.3 per cent economic interest in Smart was sold inreturn for new shares issued by PLDT. As a result of the merger, the Group’s economicinterest in PLDT increased to 23.1 per cent from 17.5 per cent.
In September 2000, First Pacific acquired Metro Pacific’s 8.0 per cent economic interestin PLDT for consideration totaling US$263.8 million. Consequently, the Group’s eco-nomic interest in PLDT increased further to 24.6 per cent.
B) In December 2000, the Group acquired an additional 8.0 per cent economic interest inIndofood for US$61.1 million by issuing 221.8 million new shares, valued atHK$2.15 per share. As a result, the Group’s economic interest in Indofood increased to48.0 per cent from 40.0 per cent.
C) The Company ’s interest in associated companies includes unlisted investments ofUS$27.9 million (1999: US$26.3 million) located outside Hong Kong.
D) As at 31 December 2000, unlisted investments comprised US$0.4 million (1999:US$0.4 million) located within Hong Kong, and US$89.6 million (1999: US$100.4 mil-lion) located outside Hong Kong. Listed investments of US$2,016.1 million (1999:US$1,513.4 million) were situated outside Hong Kong.
E) As at 31 December 2000, the market valuation of listed investments wasUS$1,112.0 million (1999: US$1,505.5 million) and dividends received and receivablewere US$5.8 million (1999: US$6.7 million).
F) Loans to associated companies are unsecured, interest bearing at a range of zero percent to 14.5 per cent per annum and have no fixed terms of repayment.
G) Details of associated companies, which in the opinion of the Directors, materiallyaffect the results or net assets of the Group, are set out in tabular form on the insideback cover.

p. 72
Notes to the Financial Statements continued
Additional information in respect of the Group’s principal associated companies, as pre-pared under HK GAAP, is set out below.
Consumer Telecommunications Property Banking
First
Indofood PLDT Escotel Savills e-Bank
US$m US$m US$m US$m US$m
OPERATING RESULTS
Turnover 1,490.3 1,334.5 35.7 283.7 22.7Profit/(Loss) before taxation 135.4 (519.9) (30.5) 35.0 (24.9)Profit/(Loss) after taxation 92.5 (383.9) (30.5) 25.1 (24.9)Net profit/(loss) 77.3 (337.0) (30.5) 24.3 (24.9)NET ASSETS/(LIABILITIES)
Current assets 593.4 847.4 12.7 147.6 146.5Long-term assets 626.7 4,140.6 144.8 58.5 77.1TOTAL ASSETS 1,220.1 4,988.0 157.5 206.1 223.6Current liabilities (414.5) (1,195.9) (133.3) (103.7) (212.5)Long-term liabilities and provisions (534.0) (3,761.2) (307.5) (36.5) –TOTAL LIABILITIES (948.5) (4,957.1) (440.8) (140.2) (212.5)Outside interests (63.2) 192.8 – (1.3) –AT 31 DECEMBER 208.4 223.7 (283.3) 64.6 11.1CAPITAL EXPENDITURE COMMITMENTS
Authorized but not contracted for 8.8 384.5 – – –Contracted but not provided for 16.2 314.4 26.6 – –AT 31 DECEMBER 25.0 698.9 26.6 – –CONTINGENT LIABILITIES 19.3 – – – –
Total net liabilities of Escotel arose principally as a consequence of the Group’s accountingpolicy of attributing to goodwill the excess of costs of acquisition of telecommunicationsbusinesses over the fair value of separable net assets, and attributing no value to acquiredtelecommunications licenses.
Escotel has a financial accounting year ending on 31 March which is not coterminouswith the Group. Savills changed its year-end from 30 April to 31 December duringthe year.
11. LONG-TERM Consolidated
INVESTMENTS 2000 1999
US$m US$m
Unlisted investments at cost 11.9 30.5Less provisions (6.7) (12.9)TOTAL 5.2 17.6
The Group’s long-term investments are unlisted and held outside Hong Kong.
Dividends received and receivable totaled US$0.1 million (1999: US$0.4 million) andrelated to unlisted investments outside Hong Kong.
As at 31 December 2000, the underlying values of the Group’s unlisted long-term invest-ments are, in the opinion of the Directors, not less than their book values.

p. 73
12. LONG-TERM Consolidated
RECEIVABLES 2000 1999
US$m US$m
Long-term receivables 188.2 215.1Less current portion included in accounts receivable and prepayments (72.9) (67.4)TOTAL 115.3 147.7
Long-term receivables relate primarily to sales of property on interest bearing (between10.0 per cent and 21.0 per cent) installment terms (between two and 10 years) and aresecured by the relevant property.
13. ACCOUNTS RECEIVABLE Consolidated Company
AND PREPAYMENTS 2000 1999 2000 1999
US$m US$m US$m US$m
Trade receivables 141.2 314.6 – –Other receivables and prepayments 210.4 271.3 2.4 4.2Less provisions (7.2) (9.0) – –TOTAL 344.4 576.9 2.4 4.2
For consumer businesses, there are 60 days of credit for sub-distributors/wholesalersand between 15–60 days of credit for other customers.
For property businesses, contract receivables are collectible by installments for periodsranging from two to 10 years.
At 31 December 2000, the aging analysis of the trade receivables is as follows:
Consolidated
2000 1999
US$m US$m
Less than 30 days 30.5 62.630–60 days 44.5 91.460–90 days 12.7 23.1Over 90 days 53.5 137.5TOTAL 141.2 314.6
14. INVENTORIES Consolidated
2000 1999
US$m US$m
Finished goods 34.6 54.9Raw materials 19.4 30.7Work in progress 2.6 4.0Less provisions (1.8) (2.9)TOTAL 54.8 86.7

p. 74
Notes to the Financial Statements continued
15. SHARE CAPITAL Consolidated
and Company
2000 1999
US$m US$m
Authorized3,499,000,000 (1999: 3,499,000,000) ordinary shares of
U.S. 1 cent each 35.0 35.0Issued and fully paidAt 1 January 29.1 23.8Shares issued for the acquisition of Indofood 2.2 2.6Shares issued through placement – 2.5Shares issued through the exercise of share options – 0.2Shares issued in lieu of dividends 0.1 –AT 31 DECEMBER
3,139,772,765 (1999: 2,910,816,732) ordinary shares of U.S. 1 cent each 31.4 29.1
In December 2000, 221.8 million ordinary shares of US$0.01 each were issued at a valueof HK$2.15 per share as consideration for the acquisition of an additional 8.0 per centinterest in Indofood.
Details of Directors’ and employees’ share options are set out in Note 31.
16. SHARE PREMIUM Consolidated
and Company
2000 1999
US$m US$m
At 1 January 849.8 458.9Shares issued for the acquisition of Indofood 58.9 191.2Shares issued through placement – 197.4Shares issued through the exercise of share options – 2.3AT 31 DECEMBER 908.7 849.8

p. 75
17. REVENUE AND Property Consolidated
OTHER RESERVES Revenue revaluation Exchange Total Company
reserve reserve reserve 2000 2000
US$m US$m US$m US$m US$m
At 1 January 2000 1,600.0 26.0 (169.3) 1,456.7 600.9Exchange translation – – (180.3) (180.3) –Disposals of subsidiary companies 24.4 (24.4) 17.1 17.1 –Transfer upon disposal of property 0.3 (0.3) – – –Shares issued in lieu of dividends 2.3 – – 2.3 2.3Retained profit/(accumulated loss)
for the year– Company 15.8 – – 15.8 15.8– Subsidiary companies 89.5 – – 89.5 –– Associated companies (61.8) – – (61.8) –AT 31 DECEMBER 2000 1,670.5 1.3 (332.5) 1,339.3 619.0Including accumulated reserves of
associated companies (130.5) – (42.5) (173.0) –
Property Consolidated
Revenue revaluation Exchange Total Company
reserve reserve reserve 1999 1999
US$m US$m US$m US$m US$m
At 1 January 1999 1,475.6 26.0 (196.2) 1,305.4 595.2Exchange translation – – (0.9) (0.9) –Reduced interest in
subsidiary companies – – 27.8 27.8 –Shares issued in lieu of dividends 1.2 – – 1.2 1.2Retained profit for the year– Company 4.5 – – 4.5 4.5– Subsidiary companies 92.4 – – 92.4 –– Associated companies 26.3 – – 26.3 –AT 31 DECEMBER 1999 1,600.0 26.0 (169.3) 1,456.7 600.9Including accumulated reserves of
associated companies 2.4 – 17.6 20.0 –
Property revaluation reserve includes nil (1999: US$4.0 million) in respect of invest-ment properties.
The revenue reserve of the Company is distributable.

p. 76
Notes to the Financial Statements continued
An analysis of the exchange reserve by principal operating company is set out below.
2000 1999
US$m US$m
Metro Pacific (253.0) (181.5)PLDT (35.5) (0.5)Berli Jucker (24.8) (5.6)Indofood (23.6) 15.1Darya-Varia (19.7) (16.2)Metrosel (13.4) (13.4)Escotel 37.7 27.9Others (0.2) 4.9TOTAL (332.5) (169.3)
18. GOODWILL RESERVE Consolidated
2000 1999
US$m US$m
At 1 January 1,744.1 976.0Goodwill arising during the year on– increased investments in associated companies (Note 27) 274.2 –– acquisitions of associated companies 38.5 809.1– acquisitions of subsidiary companies – 9.1– increased investments in subsidiary companies – 32.8Goodwill reinstated on– disposals of subsidiary companies (Note 28(A)) (130.4) (59.8)– reduced interest in associated companies (Note 28(C)) (12.5) –– reduced interest in subsidiary companies – (16.9)– dilution of interest in a subsidiary company – (6.2)AT 31 DECEMBER 1,913.9 1,744.1
An analysis of the goodwill reserve by principal operating company is set out below.
2000 1999
US$m US$m
PLDT 1,021.5 792.3Indofood 652.7 569.5Escotel 163.4 163.4Berli Jucker 30.9 30.6Metro Pacific 26.5 81.6FPDSavills 10.8 81.8Darya-Varia 8.1 8.1First Pacific Bank – 16.8TOTAL 1,913.9 1,744.1

p. 77
19. OUTSIDE INTERESTS Consolidated
2000 1999
US$m US$m
At 1 January 1,350.5 1,385.2Exchange translation (162.6) (32.5)Acquisitions of subsidiary companies – (0.5)Disposals of subsidiary companies (404.4) (2.1)Shares issued and change in attributable interests (10.6) (47.5)Share of profit for the year 5.5 49.4Attributable dividends (19.6) (0.6)Others – (0.9)AT 31 DECEMBER 758.8 1,350.5
An analysis of the outside interests by principal operating company is set out below.
2000 1999
US$m US$m
Metro Pacific 728.6 1,077.9Berli Jucker 30.0 44.0First Pacific Bank – 219.8Others 0.2 8.8TOTAL 758.8 1,350.5
20. LOAN CAPITAL Consolidated
AND LONG-TERM Interest Redemption 2000 1999
BORROWINGS Note rate date US$m US$m
UNSECURED LOANS
Loan capital– Convertible bonds (A) 2.0% 2002 267.9 267.9– Convertible note (B) 2.0% 2006 50.0 50.0– Convertible bonds (C) 2.5% 2001 72.1 78.9– Convertible long-term commercial paper (D) 10.0% 2001 38.4 49.4– Convertible notes (E) 9.5% 2002 30.0 37.6– Convertible preferred shares (F) 10.0% 2002 14.4 17.9– Floating rate notes (G) – 8.5Bank loans 15.5 62.1Other loans 9.5 7.9Subtotal 497.8 580.2SECURED LOANS
Loan capital– Long-term commercial paper (H) 13.0% 2001–2002 11.0 24.8Bank loans 34.5 240.5Other loans 21.8 39.9Subtotal 67.3 305.2Total loan capital and long-term borrowings 565.1 885.4Less current portion included in short-term
borrowings (Note 24) (130.9) (53.3)TOTAL 434.2 832.1

p. 78
Notes to the Financial Statements continued
The maturity profile of the Group’s loan capital and long-term borrowings is as follows:
Consolidated
Loan capital Bank loans Other loans Total Total
2000 1999 2000 1999 2000 1999 2000 1999
US$m US$m US$m US$m US$m US$m US$m US$m
Not exceeding one year 117.5 11.2 4.6 39.5 8.8 2.6 130.9 53.3More than one year but not
exceeding two years 316.3 136.9 8.1 49.5 1.5 5.1 325.9 191.5More than two years but not
exceeding five years – 336.9 27.6 109.3 21.0 40.1 48.6 486.3More than five years 50.0 50.0 9.7 104.3 – – 59.7 154.3TOTAL 483.8 535.0 50.0 302.6 31.3 47.8 565.1 885.4Representing amounts repayable
– wholly within five years 433.8 485.0 40.3 198.3 31.3 47.8 505.4 731.1– not wholly within five years 50.0 50.0 9.7 104.3 – – 59.7 154.3
TOTAL 483.8 535.0 50.0 302.6 31.3 47.8 565.1 885.4
Details of loan capital are set out below. Bank and other loans are repayable in variousannual installments at a weighted average annual rate of interest of 9.1 per cent (1999:10.2 per cent).
A) CONVERTIBLE BONDS Issued by First Pacific Capital (1997) Limited totalingUS$350.0 million on 27 March 1997, these bonds bear interest at two per cent and areguaranteed by the Company. A total of US$82.1 million of the bonds have already beenredeemed. The bonds are convertible into shares of the Company at HK$12.25 per share,at a fixed exchange rate of HK$7.7477: US$1, up to 13 March 2002. In the event of non-conversion, these bonds will be redeemed at 134.1 per cent of the par value. At31 December 2000, a premium provision of US$67.8 million had been established for thepurpose of redemption.
B) CONVERTIBLE NOTE Issued by the Company on 17 September 1999, this note bears inter-est at a rate of two per cent, payable semi-annually in arrears, and is repayable at par on12 September 2006. The note can be converted into shares of the Company at HK$8.40 pershare, at a fixed exchange rate of HK$7.765:US$1, at any time by the holder. The issuerhas the option to convert the note at any time after 17 September 2002.
C) CONVERTIBLE BONDS Guaranteed by Metro Pacific, the bonds are convertible into sharesof Metro Pacific (at Pesos 5.08 per share, at a fixed exchange rate of Pesos 26.195: US$1)between June 1996 and March 2003. Any remaining bonds will be redeemed at par inApril 2003. The issuer has the option to redeem at par at any time after October 1998provided that certain conditions are fulfilled, and the bondholder at 128.9 per cent of thepar value in April 2001. At 31 December 2000, a premium provision of US$18.1 millionhad been established for the purpose of redemption.
D) CONVERTIBLE LONG-TERM COMMERCIAL PAPER Issued by Bonifacio Land totalingPesos 3.1 billion (US$61.1 million) on 28 May 1996, of which, Pesos 1.1 billion(US$22.7 million) was acquired by Metro Pacific on 23 August 1999. The holders havethe option to convert into Bonifacio Land shares at a ratio of one paper unit (Pesos 480)to one share. In the event of nonconversion, the principal, together with interest calcu-lated at 10.0 per cent compounded annually, will be payable in full in May 2001.

p. 79
E) CONVERTIBLE NOTES Issued by Metro Pacific totaling Pesos 1.5 billion (US$30.0 million)during September and October 1999, the notes are convertible into shares of MetroPacific between September 1999 and October 2002 at a conversion price of Pesos 2.25 pershare. In the event of nonconversion, these notes will be redeemed, with a premium of8.7 per cent of the par value, in October 2002. At 31 December 2000, a premium provi-sion of US$1.0 million had been established for the purpose of redemption.
F) CONVERTIBLE PREFERRED SHARES Issued by Metro Pacific on 23 July 1999, these preferredshares are peso denominated, carry a dividend rate of 10 per cent and can be converted,within three years from the date of issue into shares of Metro Pacific at a conversionprice of Pesos 2.25 per share. In the event of nonconversion, these preferred shares willbe redeemed after three years with a premium that will equate to a cumulative yieldover the full term of 15 per cent. At 31 December 2000, a premium provision ofUS$0.9 million had been established for the purpose of redemption.
G) FLOATING RATE NOTES The remaining notes of US$8.5 million were redeemed early inDecember 2000.
H) LONG-TERM COMMERCIAL PAPER Issued by Metro Pacific totaling Pesos 550 million(US$11.0 million), these papers are secured over shares in certain subsidiary companiesof Metro Pacific.
21. DEFERRED LIABILITIES Consolidated
AND PROVISIONS 2000 1999
US$m US$m
Redemption premium on convertible instruments 87.8 64.8Reorganization and rationalization 47.6 83.8Deferred income 41.4 62.5Long-term payables 24.9 116.4Others 49.0 104.0Subtotal 250.7 431.5Less current portion included in accounts payable and accruals (35.1) (70.7)TOTAL 215.6 360.8
22. DEFERRED TAXATION Consolidated
2000 1999
US$m US$m
At 1 January 12.6 15.7Exchange translation (2.3) (0.5)Acquisition of subsidiary companies – (0.7)Disposal of subsidiary companies (5.8) (0.1)Additions 3.7 –Payment and utilization (0.5) (1.8)AT 31 DECEMBER 7.7 12.6
Provision is made for taxation expected to be payable in respect of planned distributionsof retained profits of overseas subsidiary and associated companies. Except for the mat-ters described below, deferred taxation has been fully provided for.
Taxation losses available at 31 December 2000, to reduce future income tax arising inthe entities to which they relate, amount to US$49.8 million (1999: US$119.9 million) inrespect of non-Hong Kong tax losses, and US$88.7 million (1999: US$105.1 million) inrespect of Hong Kong tax losses. No deferred tax assets have been recognized in respectof these losses.

p. 80
Notes to the Financial Statements continued
23. ACCOUNTS PAYABLE Consolidated Company
AND ACCRUALS 2000 1999 2000 1999
US$m US$m US$m US$m
Trade payables 61.5 145.2 – –Other payables and accruals 153.5 228.7 1.2 0.8TOTAL 215.0 373.9 1.2 0.8
At 31 December 2000, the aging analysis of the trade payables is as follows:
Consolidated
2000 1999
US$m US$m
Less than 30 days 22.7 51.130–60 days 19.2 39.960–90 days 11.0 19.8Over 90 days 8.6 34.4TOTAL 61.5 145.2
24. SHORT-TERM Consolidated
BORROWINGS 2000 1999
US$m US$m
Bank loans and overdrafts– Secured 126.3 376.7– Unsecured 60.0 167.2Total bank loans and overdrafts 186.3 543.9Unsecured other loans and advances – 34.5Current portion of loan capital and long-term borrowings (Note 20) 130.9 53.3TOTAL 317.2 631.7
Included is US$8.9 million (1999: US$12.9 million) of debt with an original maturity ofless than 90 days.
Certain bank loans and overdrafts are secured by the Group’s property and equipmentwith a net book amount of US$47.6 million (1999: US$218.9 million) and interest in subsidiary and associated companies.

p. 81
25. PROVISION FOR Consolidated
TAXATION 2000 1999
US$m US$m
At 1 January 11.7 7.8Exchange translation (1.4) 0.1Acquisition of subsidiary companies – 1.6Disposal of subsidiary companies (1.7) (1.2)Provision for taxation on estimated assessable profits for the year 12.5 12.3Transfer from deferred taxation 0.5 1.2Reclassifications 12.7 –TOTAL 34.3 21.8Tax paid (29.9) (10.1)AT 31 DECEMBER 4.4 11.7
26. CONSOLIDATED CASH A) RECONCILIATION OF OPERATING PROFIT TO NET CASH (OUTFLOW)/INFLOW FROM OPERATING ACTIVITIES
FLOW STATEMENT
2000 1999
US$m US$m
Operating profit 209.0 252.0Gain on disposal and dilution of shareholdings less
provision for investments (145.5) (98.5)Exchange losses 18.8 3.7Dividend income (0.1) (0.4)Depreciation 49.1 117.7Payments in respect of deferred liabilities and provisions (53.6) (56.4)(Gain)/loss on sale of property and equipment (0.4) 1.0Increase in inventories (16.0) (7.0)Decrease in long-term receivables 3.5 51.9Increase in accounts receivable and prepayments (21.9) (42.7)Decrease in accounts payable and accruals (22.9) (8.3)Others 2.0 (11.7)Less operating profit attributable to Banking operations (34.1) (8.6)NET CASH (OUTFLOW)/INFLOW FROM OPERATING ACTIVITIES (12.1) 192.7
Changes in working capital are stated after excluding movements due to acquisitionsand disposals of subsidiary companies.

p. 82
Notes to the Financial Statements continued
B) ANALYSIS OF CHANGES IN FINANCING
Share
capital Bank and
and share Outside other Total
premium interests borrowings financing
US$m US$m US$m US$m
At 1 January 2000 878.9 1,350.5 1,450.9 3,680.3Attributable to Banking operations – (219.8) – (219.8)Sources of financing activities 878.9 1,130.7 1,450.9 3,460.5Exchange translation – (162.6) (93.4) (256.0)Net cash inflow/(outflow) – 0.2 (199.4) (199.2)Increased shareholding in an
associated company 61.1 – – 61.1Balances in disposed subsidiary companies – (173.7) (422.6) (596.3)Attributable profit less dividends – (25.9) – (25.9)Other movements 0.1 (9.9) 7.0 (2.8)AT 31 DECEMBER 2000 940.1 758.8 742.5 2,441.4
Share
capital Bank and
and share Outside other Total
premium interests borrowings financing
US$m US$m US$m US$m
At 1 January 1999 482.7 1,385.2 1,520.7 3,388.6Attributable to Banking operations – (215.9) – (215.9)Sources of financing activities 482.7 1,169.3 1,520.7 3,172.7Exchange translation – (32.5) (24.4) (56.9)Net cash inflow/(outflow) 202.4 150.4 (77.4) 275.4Acquisition of an associated company 193.8 – 50.0 243.8Balances in acquired subsidiary companies – (0.5) 0.3 (0.2)Balances in disposed subsidiary companies – (2.1) (36.0) (38.1)Attributable profit less dividends – 49.4 – 49.4Goodwill arising during the year – (0.9) – (0.9)Other movements – (202.4) 17.7 (184.7)AT 31 DECEMBER 1999 878.9 1,130.7 1,450.9 3,460.5
C) MAJOR NON-CASH TRANSACTIONS
The consideration for the purchase of an additional 8.0 per cent interest in Indofood com-prised 221.8 million new ordinary shares valued at US$61.1 million.
On 18 September 2000, First Pacific acquired Metro Pacific’s 8.0 per cent interest inPLDT. Of the total consideration of US$263.8 million, approximately US$121.1 millionhas been accounted for by settlement of an intercompany loan from First Pacific toMetro Pacific.

p. 83
D) RESTRICTED CASH
The Group has pledged bank deposits of US$8.0 million (1999: US$30.4 million) assecurity for the Group’s banking facilities.
E) ANALYSIS OF BANK AND OTHER BORROWINGS
2000 1999
US$m US$m
Loan capital and long-term borrowings 434.2 832.1Short-term borrowings 317.2 631.7Amounts reclassified as cash and cash equivalents– Overdrafts (1.0) (2.8)– Other short-term borrowings with an original maturity of
less than 90 days (7.9) (10.1)TOTAL 742.5 1,450.9
27. ACQUISITIONS AND INCREASED INVESTMENTS IN ASSOCIATED COMPANIES
INVESTMENTS
Savills
Indofood PLDT and others 2000
US$m US$m US$m US$m
CONSIDERATION
Cash and cash equivalents 23.0 – 7.2 30.2Equity share issue 61.1 – – 61.1Fair value of subsidiary companies disposed of – 257.3 23.8 281.1Decrease in consideration payable (22.4) – – (22.4)TOTAL CONSIDERATION 61.7 257.3 31.0 350.0Net assets acquired at fair value 17.0 47.0 11.8 75.8GOODWILL (Note 18) 44.7 210.3 19.2 274.2
On 24 March 2000, PLDT issued 35.1 million new common shares at a value of approxi-mately US$931.2 million in exchange for all of the issued share capital of Smart, includ-ing the Group’s 50.3 per cent interest. As a result of the transaction, the Group’seconomic interest in PLDT increased to 23.1 per cent from 17.5 per cent.
On 7 April 2000, First Pacific combined First Pacific Davies Limited with Savills inreturn for 7.8 million new shares in Savills and HK$225.0 million (US$28.9 million) incash. The Group’s interest in Savills increased to just under 30.0 per cent from 19.8 percent. Following the subsequent disposal of a 10.0 per cent interest, the Group’s interestin Savills become 19.9 per cent.
On 15 December 2000, First Pacific acquired from the Liem Investors 146,440,690Indofood shares, representing approximately an 8.0 per cent interest in Indofood. FirstPacific issued 221,818,023 new shares valued at HK$2.15 per share (US$61.1 million) tothe Liem Investors as consideration for the acquisition.

p. 84
Notes to the Financial Statements continued
28. DISPOSALS AND A) DISPOSALS OF SUBSIDIARY COMPANIES
DIVESTMENTS First Total FPD
Pacific First Guardforce
Davies Pacific Total others
Smart Limited Bank Others 2000 1999
US$m US$m US$m US$m US$m US$m
NET ASSETS
Property and equipment 702.7 8.8 118.1 32.8 862.4 64.2Associated companies (74.0) 5.7 – (1.3) (69.6) 1.4Long-term investments 17.7 – – – 17.7 –Long-term receivables 4.9 – – 0.4 5.3 0.1Assets, other than property and
equipment, attributable to Banking operations – – 2,854.2 – 2,854.2 –
Cash and cash equivalents 38.9 24.3 – 3.0 66.2 3.4Accounts receivable and
prepayments 117.5 32.9 – 14.7 165.1 38.3Inventories 27.9 0.3 – 9.0 37.2 14.9Outside interests (159.4) (0.8) (230.6) (13.6) (404.4) (2.1)Loan capital and long-term
borrowings (182.0) – – (25.7) (207.7) (10.8)Deferred liabilities
and provisions (68.6) (3.7) – (14.1) (86.4) (1.4)Deferred taxation (13.7) 0.4 – 7.5 (5.8) (0.1)Liabilities attributable to
Banking operations – – (2,579.9) – (2,579.9) –Accounts payable and accruals (26.2) (36.2) 10.3 (14.0) (66.1) (27.4)Amount due to Group companies (87.6) – – – (87.6) –Short-term borrowings (203.7) (10.5) – (0.7) (214.9) (25.2)Provision for taxation (0.8) (1.5) – 0.6 (1.7) (1.2)TOTAL NET ASSETS DISPOSED OF 93.6 19.7 172.1 (1.4) 284.0 54.1Goodwill reinstated from
reserves (Note 18) 29.6 77.6 16.8 6.4 130.4 59.8Exchange reserve reinstated 17.1 – – – 17.1 –Gain/(loss) on disposal 117.0 (41.1) 43.4 7.7 127.0 53.7CONSIDERATION
Cash and cash equivalents – 33.3 232.3 11.8 277.4 167.6Additional interest in associated
companies 257.3 22.9 – 0.9 281.1 –TOTAL CONSIDERATION 257.3 56.2 232.3 12.7 558.5 167.6NET (OUTFLOW)/INFLOW OF CASH
AND CASH EQUIVALENTS PER
CONSOLIDATED CASH FLOW
STATEMENT (38.9) 9.0 232.3 8.8 211.2 164.2
Details of the disposals of Smart and First Pacific Davies Limited are set out in Note 27.
B) DISPOSALS OF INVESTMENTS mainly represents the sale of the Group’s entire interest inChina telecom ventures. At 31 December 2000, there was an outstanding receivable bal-ance of US$7.8 million in respect of the disposal of these investments.
C) REDUCED INTEREST IN ASSOCIATED COMPANIES mainly represents the disposal of a 10.0 percent interest in Savills (US$22.6 million) and certain associated companies of BerliJucker (US$1.9 million).

p. 85
29. COMMITMENTS AND A) CAPITAL EXPENDITURE Commitments in respect of subsidiary companies not provided for CONTINGENT in the Financial Statements are set out below.LIABILITIES
Consolidated
2000 1999
US$m US$m
Authorized but not contracted for 4.7 139.5Contracted but not provided for 19.2 157.1TOTAL 23.9 296.6
Commitments are in respect of:
Consolidated
2000 1999
US$m US$m
Consumer 2.7 3.8Telecommunications – 215.9Property 21.2 75.9Banking – 1.0TOTAL 23.9 296.6
At 31 December 2000, there were no Company commitments in respect of capital expen-diture (1999: Nil).
B) LEASING COMMITMENTS Annual commitments under operating lease agreements are setout below.
Consolidated
2000 1999
US$m US$m
LAND AND BUILDINGS, EXPIRING
– within one year 0.6 3.9– between two and five years inclusive 0.1 5.5– in over five years 0.8 2.9Total land and buildings 1.5 12.3PLANT AND OTHER, EXPIRING
– within one year – 0.6– between two and five years inclusive – 2.0– in over five years – 0.1Total plant and other – 2.7TOTAL 1.5 15.0
C) CONTINGENT LIABILITIES
Consolidated Company
2000 1999 2000 1999
US$m US$m US$m US$m
Guarantees for credit facilities given to– wholly owned subsidiaries – – – 193.5– non-wholly owned subsidiaries – – 1.0 104.4– associated companies 100.4 91.6 100.4 91.6TOTAL 100.4 91.6 101.4 389.5

p. 86
Notes to the Financial Statements continued
30. EMPLOYEE INFORMATION A) REMUNERATION
2000 1999
US$m US$m
Basic salaries 86.7 143.0Bonuses 20.4 21.7Benefits in kind 12.0 16.8Pension contribution 5.7 8.8TOTAL 124.8 190.3AVERAGE NUMBER OF EMPLOYEES 12,344 25,385
The above includes remuneration paid to Directors. Detailed disclosures in respect ofDirectors remuneration are set out in Note 31.
B) RETIREMENT BENEFITS There are no schemes that are individually significant to the Group.
C) LOANS TO OFFICERS Particulars of loans made by the Group to Officers and disclosed pur-suant to Section 161B of the Hong Kong Companies Ordinance are as follows.
Maximum
balance
Balance outstanding during
31 December 1 January the year
US$m US$m US$m
Aggregate amount outstanding – 2000 0.8 16.2 16.2– 1999 16.2 15.4 19.4
The loans outstanding at 31 December 2000 are unsecured, interest free and have nofixed terms of repayment.

p. 87
31. DIRECTORS AND SENIOR The Company aims to attract, motivate, reward and retain high-caliber executives in a EXECUTIVES manner consistent with the creation of long-term value for shareholders. The remuneration package
for senior executives, including Executive Directors, consists of the following:
SALARY AND BENEFITS
Salary reflects an executive’s experience, responsibility and market value. Increases arebased on effective management of the Company and on increased responsibility.Benefits principally comprise housing allowance, educational support and health care,and are consistent with those provided by comparable companies.
BONUS AND LONG-TERM INCENTIVES
Bonuses are based on targets linked to profit and individual accomplishments againstobjectives, and do not necessarily correlate with annual profit movements. Long-termincentives comprise share options and/or monetary payments that link reward to addedshareholder value. The value of the long-term incentive offered to each executive isrelated to job grade and contribution to the management of the business. Long-termmonetary incentive awards are disclosed once vested and paid, and are apportioned overthe performance cycle.
FEES
Fees are paid to only two independent Non-executive Directors in accordance with theCompany ’s Memorandum of Association and Bye-laws.
PENSION CONTRIBUTIONS
The Company operates a defined contribution scheme, in respect of which contributionsare determined on the basis of salary and length of service.
REMUNERATION, SHARE OPTIONS AND DIRECTORS’ INTERESTS
Remuneration of Executive Directors and senior executives is determined annually bythe Executive Chairman and certain Non-executive Directors who are advised by com-pensation and benefit consultants. The Executive Chairman’s salary is reviewed by Non-executive Directors representing the major shareholders.
Executive Directors’ and senior executives’ remuneration disclosed in Notes (A) and (C)exclude the benefits arising from the exercise of share options.

p. 88
Notes to the Financial Statements continued
A) DIRECTORS’ REMUNERATION
Total
2000 1999
Executive Directors US$m US$m
Non-performance based– Salary and benefits 4.0 5.4– Fees – 0.1– Pension contributions 0.3 0.4– Compensation for contract severance(i) 1.8 –Performance based– Bonus and long-term monetary incentive awards(ii) 5.9 1.2TOTAL (iii) (iv) 12.0 7.1
(i) Represents an amount paid to a Director, under a “change of control” provision of his service contract, upon the disposal ofa subsidiary company.(ii) Includes an amount of approximately US$1.8 million paid to the Executive Chairman in respect of deferred incentive awardsrelating to prior years’ performance.(iii)Not included above or below are:– an amount of approximately US$1.0 million which is reimburseable by an associated company in respect of the services of the
Executive Chairman; and– an ex-gratia payment of approximately US$0.7 million, representing the proceeds from a “Key Man” insurance policy, made to
the estate of a former Director.(iv)Not included above or below is an amount of approximately US$1.1 million paid by the Company to the former ManagingDirector in respect of deferred incentive awards relating to the period in which he served as a Director.
The table below shows the number of Directors whose remuneration was within thebands stated.
2000 1999
Number Number
US$NIL–US$125,000 6 9US$381,001–US$445,000 1 –US$445,001–US$509,000 – 1US$509,001–US$573,000 – 1US$573,001–US$637,000 – 1US$637,001–US$701,000 1 1US$829,001–US$893,000 – 1US$1,085,001–US$1,149,000 1 2US$1,213,001–US$1,277,000 1 –US$1,405,001–US$1,469,000 1 –US$1,661,001–US$1,725,000 – 1US$1,725,001–US$1,789,000 1 –US$2,109,001–US$2,173,000 1 –US$3,069,001–US$3,133,000 1 –

p. 89
The Company ’s independent Non-executive Directors received a total of US$30,000(1999: US$40,000) in fees for meetings attended in 2000, and emoluments of US$76,923(1999: US$77,420) for consultancy services provided to the Company in 2000.
B) DIRECTORS’ SHARE OPTIONS The Company had at 31 December 2000 outstanding ordi-nary share options granted to the Executive Chairman and Executive Directors. All out-standing options are exercisable within 10 years of their various dates of issue. Underthe current share option scheme, the Board of Directors can grant to full-time execu-tives of the Company options to subscribe in aggregate for shares representing up to 10 per cent of the issued share capital of the Company from time to time.
The aggregate number of options awarded, individual entitlements and option exerciseprices were determined by a Special Compensation Committee of the Board of Directorspursuant to Chapter 17 of the Listing Rules of The Stock Exchange of Hong Kong Limited.
The table below gives particulars of the options granted to the Directors.
Option Market
Number exercise price at date
of share Fully price of grant
Directors Date of issue options vested by HK$ HK$
Manuel V. Pangilinan 19 December 1996 12,498,000 January 2000 9.47 9.60Michael J.A. Healy 19 December 1996 964,000 January 2000 9.47 9.60
25 June 1999 2,004,000 June 2003 5.38 6.80Ronald A. Brown 19 December 1996 1,360,000 January 2000 9.47 9.60
25 June 1999 2,504,000 June 2003 5.38 6.80David G. Eastlake 1 February 1997 562,000 February 2001 10.61 10.50
25 June 1999 1,498,000 June 2003 5.38 6.80Edward A. Tortorici 16 July 1997 920,000 July 1998 9.22 9.15
25 June 1999 5,556,000 January 2004 6.72 6.80

p. 90
C) SENIOR EXECUTIVES’ REMUNERATION AND SHARE OPTIONS As similar remuneration schemesoperate for the senior executives of the Group, their remuneration may exceed that ofthe Company ’s Directors. No (1999: two) senior executives were among the Group’s fivehighest earning employees.
2000 1999
US$m US$m
Non-performance based– Salary and benefits – 1.2– Pension contributions – 0.1Performance based– Bonus and long-term monetary incentive awards – 1.3TOTAL – 2.6
The table below shows the remuneration of the two senior executives who were amongthe Group’s five highest earning employees in 1999.
2000 1999
Remuneration bands Number Number
US$1,277,001–US$1,341,000 – 1US$1,341,001–US$1,405,000 – 1
At 31 December 2000, 12,226,000 options granted to senior executives of the Companywere outstanding, details of which are set out below.
Number of share options 7,496,000 4,198,000 532,000Option exercise price (HK$) 5.38 9.47 9.66
During 2000, no options were exercised by senior executives, 1,648,000 options weregranted and 1,764,000 options were canceled.
Notes to the Financial Statements continued

p. 91
32. MAJOR CUSTOMERS Due to the considerable diversification of the Group’s businesses, no customers or sup-AND SUPPLIERS pliers represent more than 30.0 per cent of the Group’s turnover or purchases.
33. RELATED PARTY Significant related party transactions entered by the Group during the year ended TRANSACTIONS 31 December 2000, which also constitute connected transactions under the Listing Rules,
are disclosed in Notes (A) to (G). Other related party transactions, which do not consti-tute connected transactions under the Listing Rules, are disclosed in Notes (H) to (J).
A) On 28 February 2000, the Company announced that an agreement for sale and pur-chase was entered into between FPB Bank Holding Company Limited (“FPB”), a41.3 per cent owned subsidiary of the Company and Mr. James C. Ng, a director of boththe Company and FPB, pursuant to which FPB agreed to sell a property located atTai Tam, Hong Kong, for a total cash consideration of US$3.1 million (HK$24.5 million),based upon two independent third party valuations.
B) On 24 March 2000, the Company and Metro Pacific separately announced that eachhad sold their respective interests in Smart in exchange for new PLDT shares afterobtaining all government and regulatory approvals. As a result, the Group’s economicinterest in PLDT increased to 23.1 per cent.
C) On 29 June 2000, the Company announced the sale of its 53.0 per cent interest in theJSS Pinnacle Group Limited (“JSSPinnacle”) and of certain businesses and assets ofFirst Pacific Davies (UK) Limited (“FPDUK”) and UK Pacific Holdings Limited(“UKPAC”) for £2.5 million (US$3.8 million) to a management led consortium headed byGodfrey Blott, a former director of First Pacific Davies Limited. JSSPinnacle, FPDUKand UKPAC were subsidiaries of the Company engaged in providing property manage-ment services for residential and commercial properties located in the London area.
D) On 12 July 2000, the Company announced that it had agreed to purchase MetroPacific’s entire interest in PLDT, representing approximately 8.0 per cent of PLDT’sissued capital, for Pesos 12.1 billion (US$263.8 million). Under the terms of the agree-ment, First Pacific acquired Metro Pacific’s direct and indirect interests, totaling13,438,220 PLDT shares, at Pesos 900 (US$20) per share. On 10 August 2000, theCompany ’s independent shareholders approved the transaction at a special general meet-ing. After obtaining all government and regulatory approvals, the transaction was for-mally completed on 18 September 2000. As a result, the Group’s economic interest inPLDT increased to 24.6 per cent.

p. 92
E) On 7 September 2000, the Company announced that it had agreed to acquire, fromthe Liem Investors, an additional 8.0 per cent interest in Indofood. Total considerationfor the transaction amounted to US$61.1 million, settled by the issue of 221.8 millionnew First Pacific shares, valued at HK$2.15 per share. After obtaining approval from theCompany ’s independent shareholders on 16 October 2000, the transaction was formallycompleted on 15 December 2000. As a result, the Group’s economic interest in Indofoodincreased to 48.0 per cent.
F) On 20 November 2000, the Company announced that it had agreed to sell its entire41.25 per cent interest in FPB Bank Holding Company Limited (“FPB”) to The Bank ofEast Asia Limited (“BEA”) for cash consideration equivalent to a price of HK$3.50(US$0.45) per share. In order to facilitate the transaction, the Company agreed to pur-chase MIMET FOTIC Investment Limited’s (“MFIL”) entire 33.75 per cent attributableinterest in FPB at the same price. Since both the Company and MFIL were substantialshareholders of FPB, this transaction required approval from the Company ’s sharehold-ers which was obtained on 13 December 2000. The acquisition of MFIL’s 33.75 per centinterest in FPB was formally completed on 19 December 2000 and the combined inter-est in FPB of 75.0 per cent, was offered to BEA on 21 December 2000. The transactionwas completed on 28 December 2000.
G) On 20 December 2000, the Company and FPB Bank Holding Company Limited(“FPB”) entered into an agreement for the transfer of the FPB’s 3.6 per cent interest inChina Investment Incorporations (BVI) Limited, whose primary asset is the China Clubin Hong Kong to the Company for a consideration of approximately US$0.3 million.
H) On 8 December 2000, the Company entered into a sale and purchase agreement withFPB to acquire all of its interest, being 5,000,000 Class B shares, in the capital of BankConsortium Holding Limited at a consideration of HK$1 plus future disposal price.
I) As at 31 December 2000, PT Salim Ivomas Pratama (“SIMP”), a subsidiary of Indofood, and certain of SIMP’s indirect subsidiaries had pledged deposits totalingRupiah 489.1 billion (US$50.7 million) in favor of Bank Danamon International (“BDI”),which is supervised by the Indonesian Bank Restructuring Agency (“IBRA”). At thetime of the transaction, IBRA was a shareholder in First Pacific. The deposits werepledged as security in connection with loans advanced by BDI to certain companies,which are indirectly owned by PT Holdiko Perkasa (a Salim company that is undersupervision by IBRA). PT Holdiko Perkasa is in discussions with BDI to replace SIMP’sdeposits with an alternative security acceptable to BDI.
Notes to the Financial Statements continued

p. 93
J) In the ordinary course of business, Indofood has engaged in trade and financial trans-actions with certain of its associated and affiliated companies, the majority of which arerelated to the Salim family either through direct and/or common share ownership.Mr. Soedono Salim is a former director and Mr. Anthoni Salim is a current director whileboth are also substantial shareholders of the Company.
Indofood believes that these transactions are conducted under normal terms/prices andconditions similar to those with non-related parties. The more significant of such trans-actions with these related parties are summarized below.
As at 31 December 2000 1999
Nature of transactions US$m US$m
BALANCE SHEET ITEMS
Cash and cash equivalents with affiliated companies – 281.2Accounts receivable – trade– from associated companies 3.8 4.8– from affiliated companies 2.8 1.4Accounts receivable – non-trade– from associated companies – 0.5– from affiliated companies 35.0 24.2Accounts payable – trade– to associated companies 1.3 1.0– to affiliated companies 21.6 30.5Accounts payable – non-trade– to affiliated companies 0.1 0.6Short-term bank loans and overdrafts from affiliated companies – 164.2Long-term bank loans from affiliated companies – 0.2
Year Quarter
ended ended
31December 31December
2000 1999
Nature of transactions US$m US$m
PROFIT AND LOSS ITEMS
Sales of finished goods – to affiliated companies 18.2 20.2– to associated companies 37.7 15.2Purchase of raw materials – from affiliated companies 84.1 55.7– from associated companies 9.6 –Interest income– Loans to affiliated companies 0.2 0.4– Deposits placed at affiliated companies – 4.7Interest expense– Loans from affiliated companies – 3.1– Finance lease obligations due to affiliated companies 0.2 0.2Royalty income from affiliated companies 0.3 0.1Management and technical services fee expenses to affiliated companies 0.7 0.2Management and technical services fee income – from affiliated companies 1.4 0.5– from associated companies 0.3 –Insurance premiums paid to affiliated companies 0.1 0.3Rental expense to affiliated companies 0.7 0.4Principal only swap transaction with affiliated companies – 0.6
Approximately four per cent of Indofood’s sales and nine per cent of its purchases weremade to/from these related companies.

p. 94
HK GAAP AND IAS The Financial Statements of the Company are prepared in accordance with Hong KongGenerally Accepted Accounting Principles (HK GAAP). For the benefit of internationalinvestors, there follows a reconciliation between HK GAAP and International AccountingStandards (IAS) which sets out the principal differences between HK GAAP and IAS thatwould materially impact consolidated profit attributable to ordinary shareholders and share-holders’ equity.
Goodwill, which is the difference between the consideration paid and the fair value ofthe identifiable net assets acquired, can be deducted from shareholders’ equity underHK GAAP. This is the accounting treatment adopted by the Group. IAS requires suchpurchased goodwill to be recorded as an asset on the balance sheet and amortizedthrough the profit and loss statement over the estimated useful life of the goodwill,which should not exceed 20 years.
HK GAAP requires that deferred tax liabilities and assets be recorded on the basis ofthe probability that such timing differences will reverse in the foreseeable future (par-tial recognition). However, deferred tax assets are recognized under HK GAAP only invery restrictive circumstances. IAS requires that liabilities and assets in respect ofdeferred taxation be accounted for in full (full recognition), except where it is “morelikely than not” that an asset will not be realized. Therefore, under IAS, deferred taxassets should be recognized if it is probable a tax benefit will be realized.
Under HK GAAP, ordinary dividends are provided for in the same period in which theyare recommended. Under IAS, dividends are not provided for until declared.
The following is a summary of the estimated material adjustments between HK GAAPand IAS.
HK GAAP and IAS Reconciliation

p. 95
IAS RECONCILIATION
2000 1999
US$m US$m
PROFIT ATTRIBUTABLE TO ORDINARY SHAREHOLDERS
AS REPORTED UNDER HK GAAP 51.2 138.2Estimated material IAS adjustments– Reversal of goodwill reinstated on disposals and dilutions 82.2 13.7– Purchased goodwill amortization(i) (91.2) (68.5)– Net deferred tax liabilities recognized – (1.5)ESTIMATED PROFIT ATTRIBUTABLE TO ORDINARY
SHAREHOLDERS UNDER IAS 42.2 81.9
U.S. cents U.S. cents
ESTIMATED BASIC EARNINGS PER SHARE UNDER IAS 1.4 3.2
2000 1999
US$m US$m
SHAREHOLDERS’ EQUITY AS REPORTED UNDER HK GAAP 365.5 591.5Estimated material IAS adjustments– Capitalization of purchased goodwill 1,785.0 1,621.1– Proposed dividends 4.0 7.5– Net deferred tax liabilities recognized (18.1) (14.4)ESTIMATED SHAREHOLDERS’ EQUITY UNDER IAS 2,136.4 2,205.7
U.S. cents U.S. cents
ESTIMATED SHAREHOLDERS’ EQUITY PER SHARE UNDER IAS 68.0 75.8
(i) Assumes goodwill is amortized over 20 years.

p. 96
FINANCIAL TERMS DEFINED BENEFIT SCHEME A retirement scheme in which the rules specify the benefits to bepaid and the scheme is financed accordingly. Generally, benefits are determined by a for-mula which takes account of the years of service and final salary of each member.
DEFINED CONTRIBUTION SCHEME A retirement scheme under which the benefits are directlydetermined by the value of contributions paid in respect of each member.
EBITDA Earnings before interest, tax, depreciation and amortization.
NET ASSETS Total assets less total liabilities, equivalent to the sum of shareholders’ equityand outside interests.
NET INDEBTEDNESS Total of short-term and long-term borrowings, including loan capital,net of cash and bank balances.
RECURRING PROFIT Profit attributable to ordinary shareholders excluding gain on disposaland dilution of shareholdings less provision for investments and exchange differences.
FINANCIAL RATIOS CURRENT RATIO Current assets/current liabilities.
DIVIDEND PAYOUT RATIO Ordinary share dividends paid and proposed/recurring profit.
EARNINGS PER SHARE (BASIC) Profit attributable to ordinary shareholders/weighted averagenumber of shares outstanding during the year.
GEARING RATIO Net indebtedness/net assets.
INTEREST COVER Profit before taxation (excluding gain on disposal and dilution of share-holdings less provision for investments and exchange differences) and net financingcharges/net financing charges.
ORDINARY SHAREHOLDERS’ EQUITY PER SHARE Ordinary shareholders’ equity/year end out-standing number of ordinary shares.
RETURN ON AVERAGE NET ASSETS Profit after taxation (excluding gain on disposal and dilu-tion of shareholdings less provision for investments and exchange differences)/averagenet assets.
RETURN ON ORDINARY SHAREHOLDERS’ AVERAGE EQUITY Recurring profit/average ordinaryequity before goodwill reserve.
Glossary of Terms

p. 97
TELECOMMUNICATIONS ANALOG Technology that carries traffic in the form of a continuous electronic signal.TERMS
BROADBAND A communication line that has a greater bandwidth than a voice line, whichallows voice, video and data signals to travel at a faster speed.
CDMA Code Division Multiple Access. Refers to a digital cellular system that separatescommunications by code. Voice is broken into digitized bits and groups of bits are taggedwith a code that is unique with a single cell.
CELLULAR Wireless network configured in cells, which supports a high number of usersby reusing the same frequency in each cell.
CELLULAR PENETRATION The number of cellular telephones per hundred inhabitants.
CHURN RATE The rate, usually expressed on a monthly basis, at which existing sub-scribers cancel their service.
DIGITAL Transmission technology that carries signals as a stream of binary bits ratherthan in a continuous form.
GSM Global System for Mobile Communication. A digital cellular network technology,widely used in Europe and Asia, that operates in the 900 MHz or 1,800 MHz range.
INTERNATIONAL GATEWAY FACILITY A switch (or telephone exchange) that routes callsbetween the domestic and the international networks.
LOCAL EXCHANGE CARRIER Refers to an entity primarily providing transmission andswitching of telecommunications services, but is not limited to voice-to-voice service,within a contiguous geographic area anywhere in the country.
NATIONAL LONG DISTANCE Pertains to the telecom service, which transfers a call from oneexchange to another within domestic geographical boundaries.
SWITCHING SYSTEM The network system where traffic is routed between customers. Alsoknown as telephone exchange or central office.

p. 98
FINANCIAL DIARY Preliminary announcement of 2000 results 5 March 2001Annual report posted to shareholders 28 April 2001Last day to register for final dividend 16 May 2001Annual General Meeting 28 May 2001Payment of final dividend 29 May 2001Preliminary announcement of 2001 interim results 3 September 2001*
Interim report posted to shareholders 8 September 2001*
Last day to register for interim dividend 21 September 2001*
Payment of interim dividend 22 October 2001*
Financial year end 31 December 2001Preliminary announcement of 2001 results 4 March 2002*
*Subject to confirmation
HEAD OFFICE 24th Floor, Two Exchange Square8 Connaught PlaceCentral, Hong Kong
Telephone: (852) 2842 4388Fax: (852) 2845 9243Email: [email protected]
REGISTERED OFFICE Cedar House, 41 Cedar AvenueHamilton HM12, Bermuda
Telephone: (1 441) 295 2244Fax: (1 441) 292 8666
TO CONSOLIDATE Write to our principal share registrar and transfer office in Bermuda at:SHAREHOLDINGS Butterfield Corporate Services Limited
Rosebank Centre11 Bermudiana RoadPembroke, Bermuda
Or the Hong Kong branch at:Central Registration Hong Kong LimitedRooms 1901–5, Hopewell Centre183 Queen’s Road EastWanchai, Hong Kong
Information for Investors

p. 99
STOCK CODES The Stock Exchange of Hong Kong: 142Bloomberg: 142 HKReuters: 0142.HKADR Code: FPAFYCUSIP reference number: 335889200
TO RECEIVE ADDITIONAL Rebecca G. BrownINFORMATION, CONTACT Executive Vice President
Group Corporate CommunicationsFirst Pacific Company Limited24th Floor, Two Exchange Square8 Connaught PlaceCentral, Hong Kong
Telephone: (852) 2842 4374Fax: (852) 2845 9243Email: [email protected]
TO RECEIVE THE CHINESE Group Corporate CommunicationsVERSION OF THIS REPORT, First Pacific Company LimitedCONTACT 24th Floor, Two Exchange Square
8 Connaught PlaceCentral, Hong Kong
Telephone: (852) 2842 4424Fax: (852) 2845 9243Email: [email protected]
WEB SITE www.firstpacco.com
SHARE LISTINGS First Pacific’s shares are listed on The Stock Exchange of Hong Kong and are traded over-the-counter in the U.S. in the form of American Depositary Receipts issued by The Bank of New York.
AUDITORS PricewaterhouseCoopers22nd Floor, Prince’s BuildingCentral, Hong Kong
SOLICITORS Richards Butler20th Floor, Alexandra HouseCentral, Hong Kong
PRINCIPAL BANKERS ING Bank NVABN AMRO Bank NVBank of AmericaThe Hongkong and Shanghai Banking Corporation LimitedJPMorganStandard Chartered Bank

p. 100
Ten-Year Statistical Summary
2000 1999 1998 1997 1996 1995 1994 1993 1992 1991
RESULTS (US$ millions)
Turnover 808.9 1,231.5 2,894.4 8,308.4 7,025.7 5,249.7 3,804.6 3,217.8 2,913.7 2,527.9Profit for the year 51.2 138.2 360.5 212.0 204.7 260.5 135.3 101.2 63.1 34.5Profit attributable to
ordinary shareholders 51.2 138.2 360.5 212.0 204.2 257.0 130.3 94.5 55.5 28.7Recurring profit 51.0 41.4 40.5 166.2 201.7 152.5 109.5 79.4 56.6 31.3Ordinary share dividends 7.7 15.0 13.8 51.9 64.1 49.7 34.4 25.5 17.8 14.7PER ORDINARY SHARE DATA (U.S. cents)
Earnings – Basic 1.75 5.34 15.21 8.98 8.73 12.50 7.06 5.88 3.74 2.06– Diluted 1.75 5.32 15.12 8.89 8.59 11.78 6.37 4.54 2.92 1.70– Basic recurring 1.74 1.60 1.71 7.04 8.62 7.42 5.93 4.94 3.81 2.25– Diluted recurring 1.74 1.76 1.70 6.99 8.49 7.06 5.40 3.88 2.96 1.83
Dividends 0.26 0.52 0.58 2.19 2.71 2.24 1.79 1.47 1.15 1.03Ordinary shareholders’ equity 11.64 20.32 34.18 2.72 8.48 18.77 10.42 8.30 1.39 1.92FINANCIAL RATIOS
Return on average net assets (%) 1.96 2.82 3.41 14.75 18.53 18.47 18.69 18.45 17.86 11.67
Return on ordinary shareholders’average equity (%) 2.21 2.01 2.58 11.86 14.90 15.33 16.85 16.03 14.18 8.57
Dividend payout ratio (%) 15.09 36.26 34.14 31.25 31.80 32.61 31.42 32.11 31.42 47.12Dividend cover (times) 6.63 2.76 2.93 3.20 3.14 3.07 3.18 3.11 3.18 2.13Interest cover (times) 3.19 2.73 2.38 3.65 4.78 5.02 4.98 5.25 3.59 2.50Current ratio (times) 1.16 0.99 0.89 1.17 1.06 1.34 1.23 1.22 1.21 1.27Gearing ratio (times)
– Consolidated before goodwill reserve 0.17 0.32 0.41 0.92 0.85 0.60 0.65 0.64 0.87 0.92
– Consolidated after goodwill reserve 0.46 0.61 0.59 1.54 1.79 0.99 1.13 1.09 1.73 1.83
– Company 0.10 0.28 0.38 0.82 0.41 0.16 0.33 0.34 0.31 0.38CONSOLIDATED BALANCE SHEET DATA (US$ millions)
Capital expenditure 200.0 304.2 374.1 887.3 500.9 388.1 218.8 132.6 181.4 215.2Total assets 2,322.4 6,797.0 7,646.3 11,386.3 8,491.8 6,821.1 6,089.6 4,996.1 4,432.3 3,837.5Net indebtedness 521.9 1,183.4 1,296.3 2,937.1 2,024.8 1,238.6 817.8 634.7 694.3 648.2Total liabilities 1,198.1 4,855.0 5,449.0 9,487.7 7,361.7 5,567.4 5,363.6 4,416.1 4,030.1 3,482.4Total assets less
current liabilities 1,781.8 5,772.2 6,592.3 8,232.8 5,614.9 5,000.6 4,880.4 4,154.8 3,671.4 3,110.7Net assets 1,124.3 1,942.0 2,197.3 1,898.6 1,130.1 1,253.7 726.0 580.0 402.2 355.1Shareholders’ equity before
goodwill reserve 2,279.4 2,335.6 1,788.1 1,353.6 1,449.6 1,282.9 814.9 668.3 517.7 488.3Shareholders’ equity 365.5 591.5 812.1 64.5 200.0 458.5 285.2 251.3 171.5 140.2COMPANY BALANCE SHEET DATA (US$ millions)
Total assets 1,614.3 1,538.1 1,084.5 1,115.8 909.9 801.0 520.4 452.1 447.9 510.6Net indebtedness (i) 150.0 416.2 408.0 880.3 326.9 118.5 159.2 139.9 125.4 137.6Total liabilities 55.2 58.3 6.6 38.8 102.2 41.9 38.3 40.0 43.9 153.0Shareholders’ equity 1,559.1 1,479.8 1,077.9 1,077.0 807.7 759.1 482.1 412.1 404.0 357.6OTHER INFORMATION (at 31 December)
Number of shares in issue (millions) 3,139.8 2,910.8 2,375.6 2,367.3 2,358.2 2,310.0 1,936.2 1,822.4 1,547.8 1,441.1
Weighted average no. of shares in issue (millions)
– Basic 2,923.9 2,586.9 2,370.9 2,362.2 2,339.0 2,056.8 1,846.8 1,606.7 1,484.9 1,392.3– Diluted 2,923.9 2,603.3 2,383.7 2,416.1 2,375.0 2,212.3 2,125.4 2,176.5 2,076.7 1,892.7
Share price (HK$) 2.225 6.000 3.700 3.750 10.050 8.600 5.650 4.225 1.090 1.000Market capitalization
(US$ millions) 895.6 2,239.1 1,126.9 1,138.1 3,038.4 2,546.9 1,402.5 987.1 216.3 184.8Number of shareholders 5,581 5,632 6,116 5,077 4,897 5,063 5,479 6,000 8,681 6,755Number of employees 8,560 22,210 30,673 51,270 52,880 45,911 30,808 26,060 19,823 19,621
(i) Includes net indebtedness of certain wholly owned financing and holding companies.See page 96 for a glossary of terms.

Place ofincorporation/
principal Issuedarea of Reporting number Economic Voting
Investment operation currency of shares interest interest Principal activities
CONSUMER
PT Indofood Indonesia Rupiah 9.2 billion 48.0 48.0 Jakarta-based Indofood is Indonesia’s leading processed-foods group.Sukses Makmur Tbk Listed on the Jakarta and Surabaya stock exchanges, Indofood’s princi-
pal businesses are Instant Noodles, Flour and Edible Oils and Fats, aswell as Snack Foods, Baby Foods, Food Seasonings and Distribution.
Further information on Indofood can be found at www.indofood.co.id
The First Pacific Group acquired an additional 8.0 per cent interestin December 2000. The Group’s average economic shareholding dur-ing 2000 was 40.0 per cent.
Berli Jucker Public Thailand Baht 158.8 million 83.5 83.5 Berli Jucker is based and listed in Bangkok. It focuses on the manu-Company Limited facturing, marketing and distribution of glass, consumer, technical
and imaging products.
Further information on Berli Jucker can be found at www.berlijucker.co.th
PT Darya-Varia Indonesia Rupiah 560.0 million 89.5 89.5 Darya-Varia, which is based and listed in Jakarta, is a leading, fully Laboratoria Tbk integrated health care company engaged in the manufacture, market-
ing and distribution of prescription and over-the-counter medicines.
Further information on Darya-Varia can be found at www.darya-varia.com
TELECOMMUNICATIONS
Philippine Philippines Pesos 168.5 million 24.6 31.7 PLDT is the leading supplier of domestic and international telecom-Long Distance munications services in the Philippines. Actively pursuing a conver-Telephone Company gence strategy, PLDT is based and listed in Manila and has ADRs
listed on the New York Stock Exchange and the Pacific Exchange. Its three principal business groups – fixed line, wireless andInternet/multimedia – provide a comprehensive menu of products and services across the most extensive broadband and integratednetworks in the country.
Further information on PLDT can be found at www.pldt.com.ph
In March 2000, the First Pacific Group’s economic and voting inter-ests increased to 23.1 per cent and 31.7 per cent, respectively, follow-ing PLDT’s acquisition of 100 per cent of Smart. In September 2000,First Pacific’s economic interest further increased to 24.6 per centthrough the acquisition of Metro Pacific’s approximate 8.0 per centinterest in PLDT. Voting interest remained unchanged at 31.7 percent. The Group’s average economic shareholding during 2000 was22.1 per cent.
Escotel Mobile India Rupees 366.0 million 49.0 49.0 Escotel, which is based in New Delhi, provides GSM cellular tele-Communications phone services in Uttar Pradesh (West), Haryana and Kerala. Limited
Further information on Escotel can be found atwww.escotelmobile.com
Infrontier Limited Bermuda/ US$ 12.0 thousand 100.0 100.0 Infrontier, a start-up business based in Hong Kong, provides Internet- Asia and wireless-based solutions and services to companies in Asia.
Further information on Infrontier can be found atwww.infrontier.com
PROPERTY
Metro Pacific Philippines Pesos 18.6 billion 80.6 80.6 Metro Pacific, which is based and listed in Manila, has Corporation interests principally in Property (Bonifacio Land Corporation,
Landco Pacific and Pacific Plaza Towers). It also has interests inBanking (First e-Bank) and Transportation (Negros Navigation).
Further information on Metro Pacific can be found at www.metropacific.com
Summary of Principal InvestmentsAs at 31 March 2001
99 0000 0198 9997 98
DEC97
Divested Pacific Link, a Hong Kong cellular provider. Ten-year annualizedcash return of 23 per cent.
JAN98
Issued strategy paper outlining plans todispose of maturing businesses andfocus investments on higher-growth,undervalued Asian companies.
MAR98
Divested Hagemeyer, Netherlands-basedbusiness-to-business distribution services group. Fifteen-year annualizedcash return of 24 per cent.
APR98
Divested mid-sized Californian bankUnited Commercial Bank. Thirteen-yearannualized cash return of 19 per cent.
NOV98
Acquired a 17.2 per cent interest inPLDT, the leading telecommunications operator in the Philippines.
JAN99
Divested Tuntex, a Taiwan cellularprovider. Two-year annualized cashreturn of 40 per cent.
FEB99
Divested Guardforce, a Hong Kong-basedsecurity services group. Six-year annualizedcash return of 19 per cent.
MAR99
Dilution of Smart to provide fundingand enable our partner NTT to increaseshareholding. Six-year annualized cashreturn of 58 per cent.
JUN99
Raised US$200 million in an overnight placement to fund acquisition of Indofood.
SEP99
Acquired a 40 per cent interest inIndofood, Indonesia’s leading processedfoods group.
MAR00
MAR00
Concluded merger of PLDT and Smart; increased interest in PLDT to 23.1 per cent and formed strategicalliance with NTT Com.
Divested cellular GSM joint-ventureinterests in China. Five-year annualizedcash return of four per cent.
APR00
Combined First Pacific Davies with Savills plc; increased interest in Savills plc to 30 per cent from 20 per cent.
JUN00
JUN00
Divested 10 per cent interest in Savills plc to Trammell CrowCompany Limited.
Divested SPORTathlon, a Hong Kong-based integratedleisure services provider.
SEP00
Combined the Group’s interests in PLDT; positioned Metro Pacific as a property-focused company.
DEC00
DEC00
Divested Hong Kong-based First PacificBank. Fourteen-year annualized cashreturn of 15 per cent.
Increased interest in Indofood to 48 per cent.
MAR01
Divested Savills plc. Three-year annualized cash return of 15 per cent.
OCT97
Divested Tech Pacific, a Sydney-based IT distributor. Ten-year annualized cashreturn of 20 per cent.
First Pacific, a Hong Kong-based investment and management company,
holds assets in Indonesia, the Philippines and Thailand, with principal
business interests relating to Consumer, Telecommunications, and Property.
Headquartered and listed in Hong Kong, First Pacific is a constituent of
the Hang Seng Index. Its shares are also available in the United States
through American Depositary Receipts.
First Pacific’s principal investments are detailed on the inside back cover.
Recurring ProfitBefore Exchange
DifferencesUS$millions
96 97
200
150
100
50
098 99 00
MarketCapitalization
US$billions
96 97
3.0
2.5
2.0
1.5
1.0
0.5
098 99 00
Adjusted Net Asset Value by Country –
31 December 2000
61%
6%
26%
7%
US$millions
Philippines 898.0Indonesia 380.4Thailand 80.6Others 102.9Total 1,461.9
Contribution fromOperations by
Line of BusinessUS$millions
96 97
250
200
150
100
50
0
-5098 99 00
ConsumerTelecomPropertyBanking
First Pacific
First Pacific’s Strategic Restructuring
DESIGN BY ADDISON WWW.ADDISON.COM FEATURE SECTION PHOTOGRAPHY BY DAVID DREBIN COMMUNITY SECTION PHOTOGRAPHY BY PAUL HU EXECUTIVE PHOTOGRAPHY BY LINCOLN POTTERPRINTED BY ROMAN FINANCIAL PRESS LIMITEDA CHINESE VERSION OF THIS ANNUAL REPORT IS AVAILABLE FROM THE COMPANY UPON REQUEST.

h s h
FIR
ST
PA
CIF
IC C
OM
PA
NY
LIM
ITE
D A
NN
UA
L RE
PO
RT
2000