
WHO STEPS Noncommunicable Disease Risk Factor Survey
108
Part 6: Templates and Forms 6-3C-1 Section 3C: Data Book Template WHO STEPS Surveillance WHO STEPS Noncommunicable Disease Risk Factor Survey DATA BOOK FOR <INSERT COUNTRY NAME>
Transcript of WHO STEPS Noncommunicable Disease Risk Factor Survey

Part 6: Templates and Forms 6-3C-1
Section 3C: Data Book Template WHO STEPS Surveillance
WHO STEPS
Noncommunicable Disease Risk Factor Survey
DATA BOOK FOR
<INSERT COUNTRY NAME>

Part 6: Templates and Forms 6-3C-2
Section 3C: Data Book Template WHO STEPS Surveillance
Table of Contents
Introduction ......................................................................................................................... 3 Sampling and Response Proportions ................................................................................... 6
Demographic Information Results ...................................................................................... 7 Tobacco Use ...................................................................................................................... 14 Alcohol Consumption ....................................................................................................... 34 Diet .................................................................................................................................... 50 Physical Activity ............................................................................................................... 61
History of Raised Blood Pressure ..................................................................................... 72 History of Diabetes ............................................................................................................ 75 History of Raised Total Cholesterol .................................................................................. 78
History of Cardiovascular Diseases .................................................................................. 81 Lifestyle Advice ................................................................................................................ 83 Cervical Cancer Screening ................................................................................................ 85 Physical Measurements ..................................................................................................... 86
Biochemical Measurements .............................................................................................. 95 Cardiovascular disease risk ............................................................................................. 105 Summary of Combined Risk Factors .............................................................................. 107
IMPORTANT:
• ALL analyses use the variables AgeRange, Sex, and Valid. You may use the AgeRange1869
and MissingAgeSex programs to generate these variables from C1, C2, and C3.
• ALL weighted programs use the variables PSU, Stratum, and one of either WStep1,
WStep2, or WStep3.
• Unweighted tables will not have confidence intervals associated with them.

Part 6: Templates and Forms 6-3D-3
Section 3D: Data Book Template WHO STEPS Surveillance
Introduction
Purpose of the
data book This data book is a tool used to compile a complete set of data results relating
to each question and measurement in the STEPS Instrument. The STEPS
data book
• Provides detailed information for the data analyst on producing the
results for the tables.
• Provides examples of which tables to use in the country report.
• Provides examples and suggestions on the layout of tables.
Format of the
data book
Each page in the data book contains a different table with:
• Title and description of the table
• Data tables for men, women and both sexes
• Questions used to produce the table (actual question text)
• Analysis information (Epi Info program name to produce the table).
Global Action
Plan 2013-2020
and Global
Monitoring
Framework
STEPS captures 11 of the 25 indicators outlined in the Global Action Plan
2013-2020 and the Comprehensive Global Monitoring Framework for the
Prevention and Control of NCDs1, relating to 7 of the 9 global targets.
Indicators captured in STEPS are marked in bold and italic in the table
below.
Tables in the
data book
relating to the
Global
Monitoring
Framework
Tables in the data book relating to the Global Monitoring Framework are
identified with this symbol:
1 World Health Organization. Global action plan for the prevention and control of NCDs 2013-
2020. Geneva: World Health Organization; 2013.

Part 6: Templates and Forms 6-3D-4
Section 3D: Data Book Template WHO STEPS Surveillance
Framework Element
Target Indicator
MORTALITY AND MORBIDITY
Premature mortality from noncommunicable disease
1. A 25% relative reduction in the overall mortality from CVDs, cancer, diabetes, or chronic respiratory diseases
1. Unconditional probability of dying between ages of 30 and 70 from cardiovascular diseases, cancer, diabetes or chronic respiratory diseases
Additional indicator 2. Cancer incidence, by type of cancer, per 100 000 population
BEHAVIOURAL RISK FACTORS
Harmful use of alcohol
2. At least 10% relative reduction in the harmful use of alcohol, as appropriate, within the national context
3. Total (recorded and unrecorded) alcohol per capita (aged 15+ years old) consumption within a calendar year in litres of pure alcohol, as appropriate, within the national context 4. Age-standardized prevalence of heavy episodic drinking among adolescents and adults, as appropriate, within the national context 5. Alcohol-related morbidity and mortality among adolescents and adults, as appropriate, within the national context
Physical inactivity 3. A 10% relative reduction in prevalence of insufficient physical activity
6. Prevalence of insufficiently physically active adolescents, defined as less than 60 minutes of moderate to vigorous intensity activity daily 7. Age-standardized prevalence of insufficiently physically active persons aged 18+ years (defined as less than 150 minutes of moderate-intensity activity per week, or equivalent)
Salt/sodium intake 4. A 30% relative reduction in mean population intake of salt/sodium
8. Age-standardized mean population intake of salt (sodium chloride) per day in grams in persons aged 18+ years
Tobacco use 5. A 30% relative reduction in prevalence of current tobacco use
9. Prevalence of current tobacco use among adolescents 10. Age-standardized prevalence of current tobacco use among persons aged 18+ years
BIOLOGICAL RISK FACTORS
Raised blood pressure
6. A 25% relative reduction in the prevalence of raised blood pressure or contain the prevalence of raised blood pressure, according to national circumstances
11. Age-standardized prevalence of raised blood pressure among persons aged 18+ years (defined as systolic blood pressure ≥140 mmHg and/or diastolic blood pressure ≥90 mmHg) and mean systolic blood pressure
Diabetes and obesity
7. Halt the rise in diabetes & obesity
12. Age-standardized prevalence of raised blood glucose/diabetes among persons aged 18+ years (defined as fasting plasma glucose concentration ≥ 7.0 mmol/l (126 mg/dl) or on medication for raised blood glucose) 13. Prevalence of overweight and obesity in adolescents (defined according to the WHO growth reference for school-aged children and adolescents, overweight – one standard deviation body mass index for age and sex, and obese – two standard deviations body mass index for age and sex) 14. Age-standardized prevalence of overweight and obesity in persons aged 18+ years (defined as body mass index ≥ 25 kg/m² for overweight and body mass index ≥ 30 kg/m² for obesity)
Additional indicators 15. Age-standardized mean proportion of total energy intake from saturated fatty acids in persons aged 18+ years 16. Age-standardized prevalence of persons (aged 18+ years) consuming less than five total servings (400 grams) of fruit and vegetables per day 17. Age-standardized prevalence of raised total cholesterol among persons aged 18+ years (defined as total cholesterol ≥5.0 mmol/l or 190 mg/dl); and mean total cholesterol concentration
Part 6: Templates and Forms 6-3D-5
Section 3D: Data Book Template WHO STEPS Surveillance
Framework Element
Target Indicator
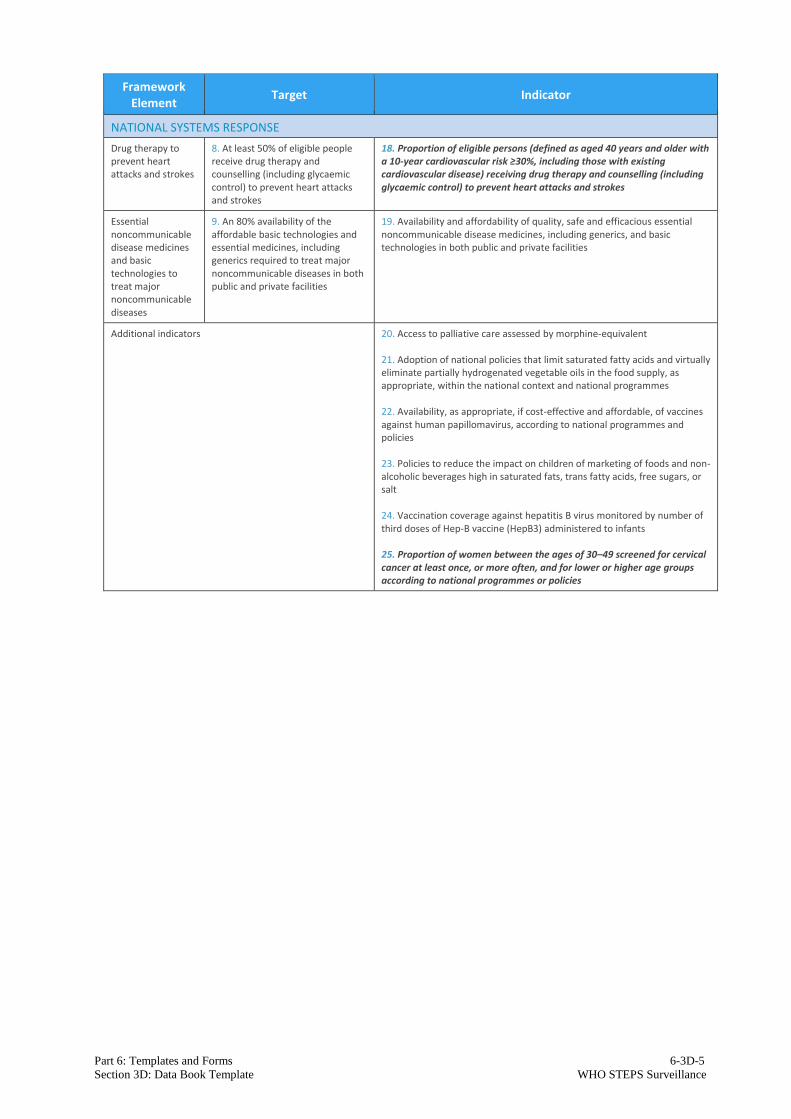
NATIONAL SYSTEMS RESPONSE
Drug therapy to prevent heart attacks and strokes
8. At least 50% of eligible people receive drug therapy and counselling (including glycaemic control) to prevent heart attacks and strokes
18. Proportion of eligible persons (defined as aged 40 years and older with a 10-year cardiovascular risk ≥30%, including those with existing cardiovascular disease) receiving drug therapy and counselling (including glycaemic control) to prevent heart attacks and strokes
Essential noncommunicable disease medicines and basic technologies to treat major noncommunicable diseases
9. An 80% availability of the affordable basic technologies and essential medicines, including generics required to treat major noncommunicable diseases in both public and private facilities
19. Availability and affordability of quality, safe and efficacious essential noncommunicable disease medicines, including generics, and basic technologies in both public and private facilities
Additional indicators 20. Access to palliative care assessed by morphine-equivalent 21. Adoption of national policies that limit saturated fatty acids and virtually eliminate partially hydrogenated vegetable oils in the food supply, as appropriate, within the national context and national programmes 22. Availability, as appropriate, if cost-effective and affordable, of vaccines against human papillomavirus, according to national programmes and policies 23. Policies to reduce the impact on children of marketing of foods and non-alcoholic beverages high in saturated fats, trans fatty acids, free sugars, or salt 24. Vaccination coverage against hepatitis B virus monitored by number of third doses of Hep-B vaccine (HepB3) administered to infants 25. Proportion of women between the ages of 30–49 screened for cervical cancer at least once, or more often, and for lower or higher age groups according to national programmes or policies
Part 6: Templates and Forms 6-3D-6
Section 3D: Data Book Template WHO STEPS Surveillance
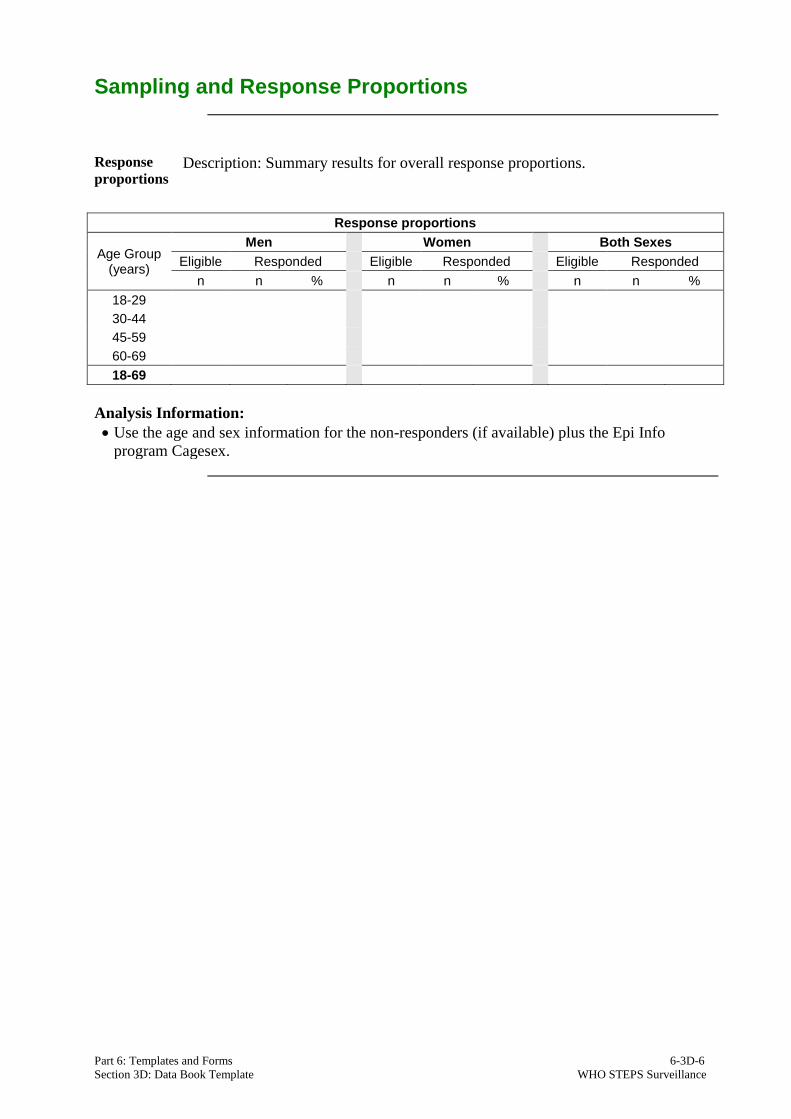
Sampling and Response Proportions
Response
proportions Description: Summary results for overall response proportions.
Response proportions
Age Group (years)
Men Women Both Sexes
Eligible Responded Eligible Responded Eligible Responded
n n % n n % n n %
18-29
30-44
45-59
60-69
18-69
Analysis Information:
• Use the age and sex information for the non-responders (if available) plus the Epi Info
program Cagesex.
Part 6: Templates and Forms 6-3D-7
Section 3D: Data Book Template WHO STEPS Surveillance
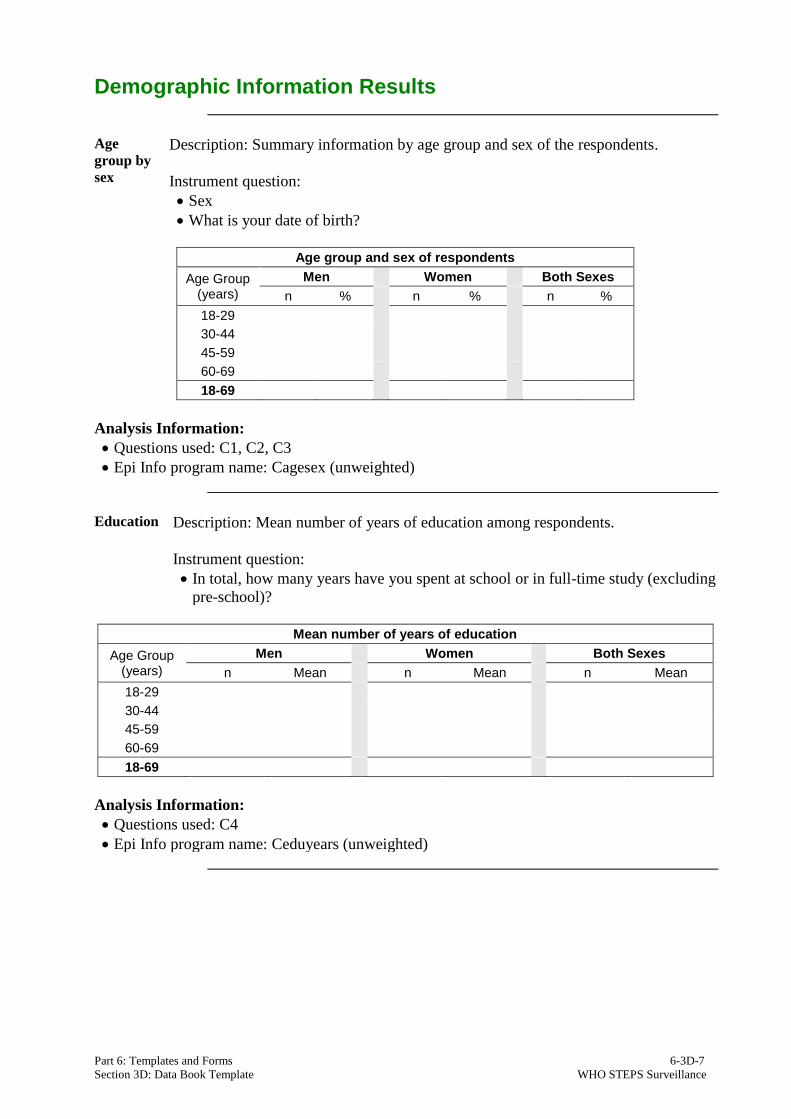
Demographic Information Results
Age
group by
sex
Description: Summary information by age group and sex of the respondents.
Instrument question:
• Sex
• What is your date of birth?
Age group and sex of respondents
Age Group (years)
Men Women Both Sexes
n % n % n %
18-29
30-44
45-59
60-69
18-69
Analysis Information:
• Questions used: C1, C2, C3
• Epi Info program name: Cagesex (unweighted)
Education Description: Mean number of years of education among respondents.
Instrument question:
• In total, how many years have you spent at school or in full-time study (excluding
pre-school)?
Mean number of years of education
Age Group (years)
Men Women Both Sexes
n Mean n Mean n Mean
18-29
30-44
45-59
60-69
18-69
Analysis Information:
• Questions used: C4
• Epi Info program name: Ceduyears (unweighted)

Part 6: Templates and Forms 6-3D-8
Section 3D: Data Book Template WHO STEPS Surveillance
Highest
level of
education
Description: Highest level of education achieved by the survey respondents.
Instrument question:
• What is the highest level of education you have completed?
Highest level of education
Age Group (years)
Men
n % No formal
schooling
% Less than
primary school
% Primary school
completed
% Secondary
school completed
% High school
completed
% College/ University completed
% Post graduate degree
completed
18-29
30-44
45-59
60-69
18-69
Highest level of education
Age Group (years)
Women
n % No formal
schooling
% Less than
primary school
% Primary school
completed
% Secondary
school completed
% High school
completed
% College/ University completed
% Post graduate degree
completed
18-29
30-44
45-59
60-69
18-69
Highest level of education
Age Group (years)
Both Sexes
n % No formal
schooling
% Less than
primary school
% Primary school
completed
% Secondary
school completed
% High school
completed
% College/ University completed
% Post graduate degree
completed
18-29
30-44
45-59
60-69
18-69
Analysis Information:
• Questions used: C5
• Epi Info program name: Ceduhigh (unweighted)

Part 6: Templates and Forms 6-3C-9
Section 3C: Data Book Template WHO STEPS Surveillance
Ethnicity Description: Summary results for the ethnicity of the respondents.
Instrument Question:
• What is your [insert relevant ethnic group/racial group/cultural subgroup/others]
background?
Ethnic group of respondents
Age Group (years)
Both Sexes
n % Ethnic group 1
% Ethnic group 2
% Ethnic group 3
% Other ethnic group
18-29
30-44
45-59
60-69
18-69
Analysis Information:
• Questions used: C6
• Epi Info program name: Cethnic (unweighted)
Part 6: Templates and Forms 6-3C-10
Section 3C: Data Book Template WHO STEPS Surveillance
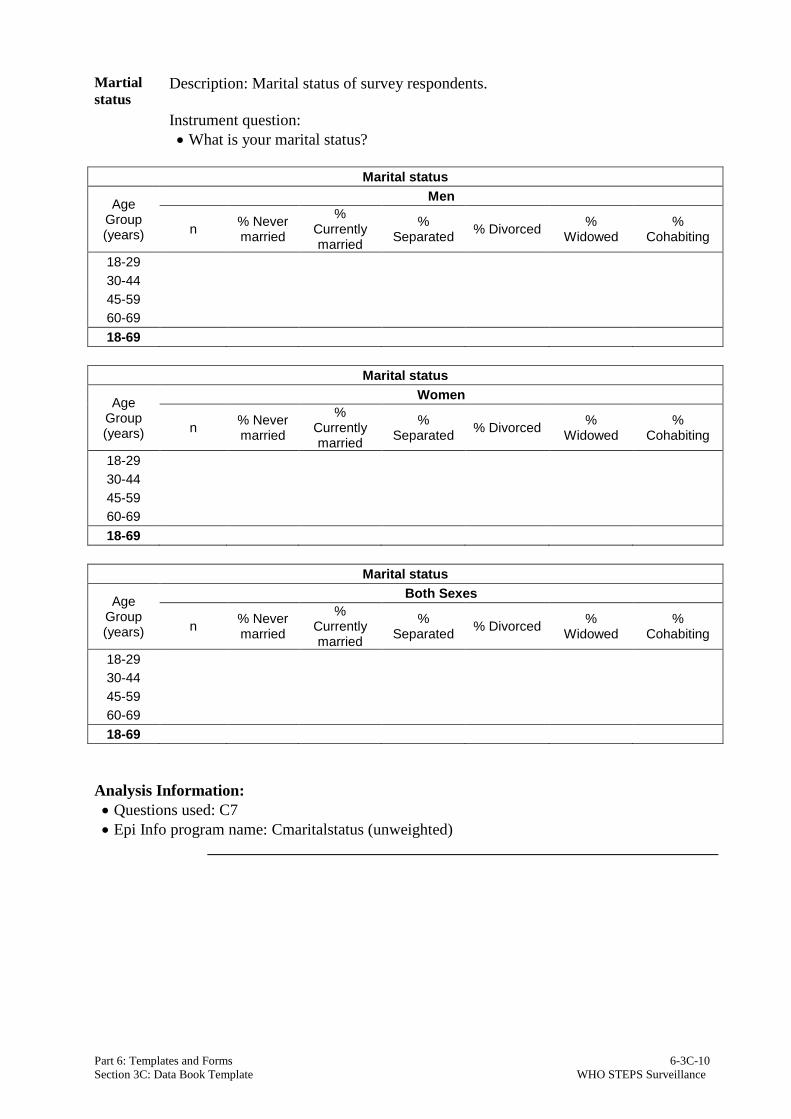
Martial
status Description: Marital status of survey respondents.
Instrument question:
• What is your marital status?
Marital status
Age Group (years)
Men
n % Never married
% Currently married
% Separated
% Divorced %
Widowed %
Cohabiting
18-29
30-44
45-59
60-69
18-69
Marital status
Age Group (years)
Women
n % Never married
% Currently married
% Separated
% Divorced %
Widowed %
Cohabiting
18-29
30-44
45-59
60-69
18-69
Marital status
Age Group (years)
Both Sexes
n % Never married
% Currently married
% Separated
% Divorced %
Widowed %
Cohabiting
18-29
30-44
45-59
60-69
18-69
Analysis Information:
• Questions used: C7
• Epi Info program name: Cmaritalstatus (unweighted)

Part 6: Templates and Forms 6-3C-11
Section 3C: Data Book Template WHO STEPS Surveillance
Employment
status Description: Proportion of respondents in paid employment and those who are
unpaid. Unpaid includes persons who are non-paid, students, homemakers,
retired, and unemployed.
Instrument question:
• Which of the following best describes your main work status over the past 12
months?
Employment status
Age Group (years)
Men
n %
Government employee
% Non-government employee
% Self-employed
% Unpaid
18-29
30-44
45-59
60-69
18-69
Employment status
Age Group (years)
Women
n %
Government employee
% Non-government employee
% Self-employed
% Unpaid
18-29
30-44
45-59
60-69
18-69
Employment status
Age Group (years)
Both Sexes
n %
Government employee
% Non-government employee
% Self-employed
% Unpaid
18-29
30-44
45-59
60-69
18-69
Analysis Information:
• Questions used: C8
• Epi Info program name: Cworkpaid (unweighted)

Part 6: Templates and Forms 6-3C-12
Section 3C: Data Book Template WHO STEPS Surveillance
Unpaid
work and
unemployed
Description: Proportion of respondents in unpaid work.
Instrument question:
• Which of the following best describes your main work status over the past 12
months?
Unpaid work and unemployed
Age Group (years)
Men
n % Non-
paid % Student
% Home- maker
% Retired
Unemployed
% Able to work
% Not able to work
18-29
30-44
45-59
60-69
18-69
Unpaid work and unemployed
Age Group (years)
Women
n % Non-
paid % Student
% Home- maker
% Retired Unemployed
% Able to work
% Not able to work
18-29
30-44
45-59
60-69
18-69
Unpaid work and unemployed
Age Group (years)
Both Sexes
n % Non-
paid % Student
% Home- maker
% Retired
Unemployed
% Able to work
% Not able to work
18-29
30-44
45-59
60-69
18-69
Analysis Information:
• Questions used: C8
• Epi Info program name: Cworknotpaid (unweighted)

Part 6: Templates and Forms 6-3C-13
Section 3C: Data Book Template WHO STEPS Surveillance
Per
capita
annual
income
Description: Mean reported per capita annual income of respondents in local
currency.
Instrument questions:
• How many people older than 18 years, including yourself, live in your household?
• Taking the past year, can you tell me what the average earning of the household
has been?
Mean annual per capita
income
n Mean
Analysis Information:
• Questions used: C9, C10a-c
• Epi Info program name: Cmeanincome (unweighted)
Estimated
household
earnings
Description: summary of participant household earnings by quintile.
Instrument question:
• If you don't know the amount, can you give an estimate of the annual household
income if I read some options to you?
Estimated household earnings
n % Quintile 1: Under $........
% Quintile 2: $......-$......
% Quintile 3: $......-$......
% Quintile 4: $......-$......
% Quintile 5: Over $......
Analysis Information:
• Questions used: C11
• Epi Info program name: Cquintile (unweighted)

Part 6: Templates and Forms 6-3C-14
Section 3C: Data Book Template WHO STEPS Surveillance
Tobacco Use
Current
smoking Description: Current smokers among all respondents.
Instrument question:
• Do you currently smoke any tobacco products, such as cigarettes, cigars, or pipes?
Percentage of current smokers
Age Group (years)
Men Women Both Sexes
n %
Current smoker
95% CI n %
Current smoker
95% CI n %
Current smoker
95% CI
18-29
30-44
45-59
60-69
18-69
Analysis Information:
• Questions used: T1, T2, T8
• Epi Info program name: Tsmokestatus (unweighted); TsmokestatusWT (weighted)

Part 6: Templates and Forms 6-3C-15
Section 3C: Data Book Template WHO STEPS Surveillance
Smoking
Status Description: Smoking status of all respondents.
Instrument questions:
• Do you currently smoke any tobacco products, such as cigarettes, cigars, or pipes?
• Do you currently smoke tobacco products daily?
• In the past, did you ever smoke any tobacco products?
Smoking status
Age Group (years)
Men
n
Current smoker Non-smokers
% Daily 95% CI % Non-
daily 95% CI
% Former smoker
95% CI % Never smoker
95% CI
18-29
30-44
45-59
60-69
18-69
Smoking status
Age Group (years)
Women
n
Current smoker Non-smokers
% Daily 95% CI % Non-
daily 95% CI
% Former smoker
95% CI % Never smoker
95% CI
18-29
30-44
45-59
60-69
18-69
Smoking status
Age Group (years)
Both Sexes
n
Current smoker Non-smokers
% Daily 95% CI % Non-
daily 95% CI
% Former smoker
95% CI % Never smoker
95% CI
18-29
30-44
45-59
60-69
18-69
Analysis Information:
• Questions used: T1, T2, T8
• Epi Info program name: Tsmokestatus (unweighted); TsmokestatusWT (weighted)

Part 6: Templates and Forms 6-3C-16
Section 3C: Data Book Template WHO STEPS Surveillance
Daily
smoking Description: Percentage of current daily smokers among smokers.
Instrument questions:
• Do you currently smoke any tobacco products, such as cigarettes, cigars, or pipes?
• Do you currently smoke tobacco products daily?
Current daily smokers among smokers
Age Group (years)
Men Women Both Sexes
n % Daily smokers
95% CI n % Daily smokers
95% CI n % Daily smokers
95% CI
18-29
30-44
45-59
60-69
18-69
Analysis Information:
• Questions used: T1, T2
• Epi Info program name: Tsmokefreq (unweighted); TsmokefreqWT (weighted)
Initiation
and
duration
of
smoking
Description: Mean age of initiation and mean duration of smoking, in years, among
daily smokers (no total age group for mean duration of smoking as age influences
these values).
Instrument questions:
• Do you currently smoke any tobacco products, such as cigarettes, cigars, or pipes?
• Do you currently smoke tobacco products daily?
• How old were you when you first started smoking?
• Do you remember how long ago it was?
Mean age started smoking
Age Group (years)
Men Women Both Sexes
n Mean age
95% CI n Mean age
95% CI n Mean age
95% CI
18-29
30-44
45-59
60-69
18-69
Mean duration of smoking
Age Group (years)
Men Women Both Sexes
n Mean
duration 95% CI n
Mean duration
95% CI n Mean
duration 95% CI
18-29
30-44
45-59
60-69
Analysis Information:
• Questions used: T1, T2, T3, T4a-c
• Epi Info program name: Tsmokeagetime (unweighted); TsmokeagetimeWT (weighted)

Part 6: Templates and Forms 6-3C-17
Section 3C: Data Book Template WHO STEPS Surveillance
Manufactured
cigarette
smokers
Description: Percentage of smokers who use manufactured cigarettes among
daily smokers and among current smokers.
Instrument questions:
• Do you currently smoke any tobacco products, such as cigarettes, cigars, or
pipes?
• Do you currently smoke tobacco products daily?
• On average, how many of the following products do you smoke each day?
Manufactured cigarette smokers among daily smokers
Age Group (years)
Men Women Both Sexes
n
% Manu-
factured cigarette smoker
95% CI n
% Manu-
factured cigarette smoker
95% CI n
% Manu-
factured cigarette smoker
95% CI
18-29
30-44
45-59
60-69
18-69
Manufactured cigarette smokers among current smokers
Age Group (years)
Men Women Both Sexes
n
% Manu-
factured cigarette smoker
95% CI n
% Manu-
factured cigarette smoker
95% CI n
% Manu-
factured cigarette smoker
95% CI
18-29
30-44
45-59
60-69
18-69
Analysis Information:
• Questions used: T1, T2, T5a, T5aw
• Epi Info program name: Tsmokeman (unweighted); TsmokemanWT (weighted)

Part 6: Templates and Forms 6-3C-18
Section 3C: Data Book Template WHO STEPS Surveillance
Amount
of
tobacco
used
among
daily
smokers
by type
Description: Mean amount of tobacco used by daily smokers per day, by type.
Instrument questions:
• Do you currently smoke any tobacco products, such as cigarettes, cigars, or pipes?
• Do you currently smoke tobacco products daily?
• On average, how many of the following products do you smoke each day?
Mean amount of tobacco used by daily smokers by type
Age Group (years)
Men
n Mean # of
manufactured cig.
95% CI n Mean # of
hand-rolled cig.
95% CI n Mean # of pipes of tobacco
95% CI
18-29
30-44
45-59
60-69
18-69
Mean amount of tobacco used by daily smokers by type
Age Group (years)
Men
n
Mean # of cigars,
cheerots, cigarillos
95% CI n Mean # of
shisha sessions
95% CI n Mean # of other type of tobacco
95% CI
18-29
30-44
45-59
60-69
18-69
Mean amount of tobacco used by daily smokers by type
Age Group (years)
Women
n Mean # of
manufactured cig.
95% CI n Mean # of
hand-rolled cig.
95% CI n Mean # of pipes of tobacco
95% CI
18-29
30-44
45-59
60-69
18-69

Part 6: Templates and Forms 6-3C-19
Section 3C: Data Book Template WHO STEPS Surveillance
Mean amount of tobacco used by daily smokers by type
Age Group (years)
Women
n
Mean # of cigars,
cheerots, cigarillos
95% CI n Mean # of
shisha sessions
95% CI n Mean # of other type of tobacco
95% CI
18-29
30-44
45-59
60-69
18-69
Mean amount of tobacco used by daily smokers by type
Age Group (years)
Both Sexes
n Mean # of
manufactured cig.
95% CI n Mean # of
hand-rolled cig.
95% CI n Mean # of pipes of tobacco
95% CI
18-29
30-44
45-59
60-69
18-69
Mean amount of tobacco used by daily smokers by type
Age Group (years)
Both Sexes
n
Mean # of cigars,
cheerots, cigarillos
95% CI n Mean # of
shisha sessions
95% CI n Mean # of other type of tobacco
95% CI
18-29
30-44
45-59
60-69
18-69
Analysis Information:
• Questions used: T1, T2, T5a-T5f
• Epi Info program name: Tsmoketype (unweighted); TsmoketypeWT (weighted)

Part 6: Templates and Forms 6-3C-20
Section 3C: Data Book Template WHO STEPS Surveillance
Smoked
tobacco
consump-
tion
Description: Percentage of current smokers who smoke each of the following
products.
Instrument questions:
• Do you currently smoke any tobacco products, such as cigarettes, cigars, or pipes?
• Do you currently smoke tobacco products daily?
• On average, how many of the following products do you smoke each day/week?
Percentage of current smokers smoking each of the following products
Age Group (years)
Men
n % Manuf. cigs. 95% CI n % Hand-
rolled cigs.
95% CI n % Pipes
of tobacco
95% CI
18-29
30-44
45-59
60-69
18-69
Percentage of current smokers smoking each of the following products
Age Group (years)
Men
n % Cigars, cheroots, cigarillos
95% CI n % Shisha 95% CI n % Other 95% CI
18-29
30-44
45-59
60-69
18-69
Percentage of current smokers smoking each of the following products
Age Group (years)
Women
n % Manuf. cigs. 95% CI n % Hand-
rolled cigs.
95% CI n % Pipes
of tobacco
95% CI
18-29
30-44
45-59
60-69
18-69

Part 6: Templates and Forms 6-3C-21
Section 3C: Data Book Template WHO STEPS Surveillance
Percentage of current smokers smoking each of the following products
Age Group (years)
Women
n % Cigars, cheroots, cigarillos
95% CI n % Shisha 95% CI n % Other 95% CI
18-29
30-44
45-59
60-69
18-69
Percentage of current smokers smoking each of the following products
Age Group (years)
Both Sexes
n % Manuf. cigs. 95% CI n % Hand-
rolled cigs.
95% CI n % Pipes
of tobacco
95% CI
18-29
30-44
45-59
60-69
18-69
Percentage of current smokers smoking each of the following products
Age Group (years)
Both Sexes
n % Cigars, cheroots, cigarillos
95% CI n % Shisha 95% CI n % Other 95% CI
18-29
30-44
45-59
60-69
18-69
Analysis Information:
• Questions used: T1, T2, T5a-T5fw
• Epi Info program name: Tsmoketypeprev (unweighted); TsmoketypeprevWT (weighted)

Part 6: Templates and Forms 6-3C-22
Section 3C: Data Book Template WHO STEPS Surveillance
Frequency
of daily
cigarette
smoking
Description: Percentage of daily cigarette smokers smoking given quantities of
manufactured or hand-rolled cigarettes per day.
Instrument questions:
• Do you currently smoke any tobacco products, such as cigarettes, cigars, or pipes?
• Do you currently smoke tobacco products daily?
• On average, how many of the following products do you smoke each day?
Percentage of daily smokers smoking given quantities of manufactured or hand-rolled cigarettes per day
Age Group (years)
Men
n % <5 Cigs.
95% CI % 5-9 Cigs.
95% CI % 10-14
Cigs. 95% CI
% 15-24 Cigs.
95% CI %
≥ 25 Cigs.
95% CI
18-29
30-44
45-59
60-69
18-69
Percentage of daily smokers smoking given quantities of manufactured or hand-rolled cigarettes per day
Age Group (years)
Women
n % <5 Cigs.
95% CI % 5-9 Cigs.
95% CI % 10-14
Cigs. 95% CI
% 15-24 Cigs.
95% CI %
≥ 25 Cigs.
95% CI
18-29
30-44
45-59
60-69
18-69
Percentage of daily smokers smoking given quantities of manufactured or hand-rolled cigarettes per day
Age Group (years)
Both Sexes
n % <5 Cigs.
95% CI % 5-9 Cigs.
95% CI % 10-14
Cigs. 95% CI
% 15-24 Cigs.
95% CI %
≥ 25 Cigs.
95% CI
18-29
30-44
45-59
60-69
18-69
Analysis Information:
• Questions used: T1, T2, T5a, T5b
• Epi Info program name: Tcig (unweighted); TcigWT (weighted)

Part 6: Templates and Forms 6-3C-23
Section 3C: Data Book Template WHO STEPS Surveillance
Former
daily
smokers
and
former
smokers
Description: Percentage of former daily smokers among all respondents and among
ever daily smokers, and the mean duration, in years, since former smokers quit
smoking.
Instrument questions:
• Do you currently smoke any tobacco products, such as cigarettes, cigars, or pipes?
• Do you currently smoke tobacco products daily?
• In the past did you ever smoke any tobacco products?
• In the past, did you ever smoke daily?
• How old were you when you stopped smoking?
Former daily smokers (who don’t smoke currently) among all respondents
Age Group (years)
Men Women Both Sexes
n
% Former
daily smokers
95% CI n
% Former
daily smokers
95% CI n
% Former
daily smokers
95% CI
18-29
30-44
45-59
60-69
18-69
Former daily smokers (who don’t smoke currently) among ever daily smokers
Age Group (years)
Men Women Both Sexes
n
% Former
daily smokers
95% CI n
% Former
daily smokers
95% CI n
% Former
daily smokers
95% CI
18-29
30-44
45-59
60-69
18-69
Mean years since cessation
Age Group (years)
Men Women Both Sexes
n Mean years
95% CI n Mean years
95% CI n Mean years
95% CI
18-29
30-44
45-59
60-69
18-69
Analysis Information:
• Questions used: T1, T2, T8, T9, T10, T11a-c
• Epi Info program name: Tsmokeexdaily (unweighted); TsmokeexdailyWT (weighted)

Part 6: Templates and Forms 6-3C-24
Section 3C: Data Book Template WHO STEPS Surveillance
Cessation Description: Percentage of current smokers who have tried to stop smoking during
the past 12 months.
Instrument questions:
• Do you currently smoke any tobacco products, such as cigarettes, cigars, or pipes?
• During the past 12 months, have you tried to stop smoking?
Current smokers who have tried to stop smoking
Age Group (years)
Men Women Both Sexes
n % Tried to stop
smoking 95% CI n
% Tried to stop
smoking 95% CI n
% Tried to stop
smoking 95% CI
18-29
30-44
45-59
60-69
18-69
Analysis Information:
• Questions used: T1, T2, T6
• Epi Info program name: Tcessation (unweighted); TcessationWT (weighted)
Advice to
stop
smoking
Description: Percentage of current smokers who have been advised by a doctor or
other health worker to stop smoking, among those smokers who have had a visit to
a doctor or other health worker in the past 12 months.
Instrument questions:
• Do you currently smoke any tobacco products, such as cigarettes, cigars, or
pipes?
• During any visit to a doctor or other health worker in the past 12 months, were
you advised to quit smoking tobacco?
Current smokers who have been advised by doctor to stop smoking
Age Group (years)
Men Women Both Sexes
n
% Advised to stop
smoking
95% CI n
% Advised to stop
smoking
95% CI n
% Advised to stop
smoking
95% CI
18-29
30-44
45-59
60-69
18-69
Analysis Information:
• Questions used: T1, T2, T7
• Epi Info program name: Tcessation (unweighted); TcessationWT (weighted)

Part 6: Templates and Forms 6-3C-25
Section 3C: Data Book Template WHO STEPS Surveillance
Current
users of
smokeless
tobacco
Description: Percentage of current users of smokeless tobacco among all
respondents.
Instrument question:
• Do you currently use any smokeless tobacco such as [snuff, chewing tobacco,
betel]?
Current users of smokeless tobacco
Age Group (years)
Men Women Both Sexes
n %
Current users
95% CI n %
Current users
95% CI n %
Current users
95% CI
18-29
30-44
45-59
60-69
18-69
Analysis Information:
• Questions used: T12, T13, T15
• Epi Info program name: Tsmokelessstatus (unweighted); TsmokelessstatusWT (weighted)

Part 6: Templates and Forms 6-3C-26
Section 3C: Data Book Template WHO STEPS Surveillance
Status of
smokeless
tobacco
use
Description: Status of using smokeless tobacco among all respondents.
Instrument questions:
• Do you currently use any smokeless tobacco such as [snuff, chewing tobacco,
betel]?
• Do you currently use smokeless tobacco products daily?
• In the past, did you ever use smokeless tobacco such as [snuff, chewing tobacco,
betel]?
Smokeless tobacco use
Age Group (years)
Men
n
Current user Non user
% Daily 95% CI % Non-
daily 95% CI
% Past user
95% CI % Never
used 95% CI
18-29
30-44
45-59
60-69
18-69
Smokeless tobacco use
Age Group (years)
Women
n
Current user Non user
% Daily 95% CI % Non-
daily 95% CI
% Past user
95% CI % Never
used 95% CI
18-29
30-44
45-59
60-69
18-69
Smokeless tobacco use
Age Group (years)
Both Sexes
n
Current user Non user
% Daily 95% CI % Non-
daily 95% CI
% Past user
95% CI % Never
used 95% CI
18-29
30-44
45-59
60-69
18-69
Analysis Information:
• Questions used: T12, T13, T15
• Epi Info program name: Tsmokelessstatus (unweighted); TsmokelessstatusWT (weighted)

Part 6: Templates and Forms 6-3C-27
Section 3C: Data Book Template WHO STEPS Surveillance
Former
daily users
of
smokeless
tobacco
Description: Percentage of former daily users of smokeless tobacco among all
respondents and among ever daily users.
Instrument questions:
• Do you currently use any smokeless tobacco such as [snuff, chewing tobacco,
betel]?
• Do you currently use smokeless tobacco products daily?
• In the past, did you ever use smokeless tobacco such as [snuff, chewing tobacco,
betel]?
• In the past, did you ever use smokeless tobacco such as [snuff, chewing tobacco,
betel] daily?
Former daily smokeless tobacco users (who don't use tobacco currently) among all respondents
Age Group (years)
Men Women Both Sexes
n
% Former
daily users
95% CI n
% Former
daily users
95% CI n
% Former
daily users
95% CI
18-29
30-44
45-59
60-69
18-69
Analysis Information:
• Questions used: T12, T13, T15, T16
• Epi Info program name: Tsmokelessexdaily (unweighted); TsmokelessexdailyWT (weighted)
Former daily smokeless tobacco users (who don’t use tobacco currently) among ever daily users
Age Group (years)
Men Women Both Sexes
n
% Former
daily users
95% CI n
% Former
daily users
95% CI n
% Former
daily users
95% CI
18-29
30-44
45-59
60-69
18-69

Part 6: Templates and Forms 6-3D-28
Section 3D: Data Book Template WHO STEPS Surveillance
Amount
of
smokeless
tobacco
used
among
daily
users by
type
Description: Mean times per day smokeless tobacco used by daily smokeless tobacco
users per day, by type.
Instrument questions:
• Do you currently use any smokeless tobacco such as [snuff, chewing tobacco,
betel]?
• Do you currently use smokeless tobacco products daily?
• On average, how many times a day do you use…?
Mean times per day smokeless tobacco used by daily smokeless tobacco users by type
Age Group (years)
Men
n Snuff by mouth
95% CI n Snuff by
nose 95% CI n
Chewing tobacco
95% CI
18-29
30-44
45-59
60-69
18-69
Mean times per day smokeless tobacco used by daily smokeless tobacco users by type
Age Group (years)
Men
n Betel, quid 95% CI n Other 95% CI
18-29
30-44
45-59
60-69
18-69
Mean times per day smokeless tobacco used by daily smokeless tobacco users by type
Age Group (years)
Women
n Snuff by mouth
95% CI n Snuff by
nose 95% CI n
Chewing tobacco
95% CI
18-29
30-44
45-59
60-69
18-69
Mean times per day smokeless tobacco used by daily smokeless tobacco users by type
Age Group (years)
Women
n Betel, quid 95% CI n Other 95% CI
18-29
30-44
45-59
60-69
18-69

Part 6: Templates and Forms 6-3C-29
Section 3C: Data Book Template WHO STEPS Surveillance
Mean times per day smokeless tobacco used by daily smokeless tobacco users by type
Age Group (years)
Both Sexes
n Snuff by mouth
95% CI n Snuff by
nose 95% CI n
Chewing tobacco
95% CI
18-29
30-44
45-59
60-69
18-69
Mean times per day smokeless tobacco used by daily smokeless tobacco users by type
Age Group (years)
Both Sexes
n Betel, quid 95% CI n Other 95% CI
18-29
30-44
45-59
60-69
18-69
Analysis Information:
• Questions used: T12, T13, T14a-otherw
• Epi Info program name: Tsmokelesstype (unweighted); TsmokelesstypeWT (weighted)

Part 6: Templates and Forms 6-3C-30
Section 3C: Data Book Template WHO STEPS Surveillance
Smokeless
tobacco
consump-
tion
Description: Percentage of current users of smokeless tobacco who use each of the
following products.
Instrument questions:
• Do you currently use any smokeless tobacco such as [snuff, chewing tobacco,
betel]?
• Do you currently use smokeless tobacco products daily?
• On average, how many times a day/week do you use…?
Percentage of current users of smokeless tobacco using each of the following products
Age Group (years)
Men
n % Snuff by
mouth 95% CI
% Snuff by nose
95% CI %
Chewing tobacco
95% CI Chewing tobacco
95% CI
18-29
30-44
45-59
60-69
18-69
Percentage of current users of smokeless tobacco using each of the following products
Age Group (years)
Men
n % Betel, quid 95% CI %
Other 95% CI 95% CI
18-29
30-44
45-59
60-69
18-69
Percentage of current users of smokeless tobacco using each of the following products
Age Group (years)
Women
n % Snuff by
mouth 95% CI
% Snuff by nose
95% CI %
Chewing tobacco
95% CI Chewing tobacco
95% CI
18-29
30-44
45-59
60-69
18-69
Percentage of current users of smokeless tobacco using each of the following products
Age Group (years)
Women
n % Betel, quid 95% CI %
Other 95% CI 95% CI
18-29
30-44
45-59
60-69
18-69

Part 6: Templates and Forms 6-3C-31
Section 3C: Data Book Template WHO STEPS Surveillance
Percentage of current users of smokeless tobacco using each of the following products
Age Group (years)
Both Sexes
n % Snuff by
mouth 95% CI
% Snuff by nose
95% CI %
Chewing tobacco
95% CI Chewing tobacco
95% CI
18-29
30-44
45-59
60-69
18-69
Percentage of current users of smokeless tobacco using each of the following products
Age Group (years)
Both Sexes
n % Betel, quid 95% CI %
Other 95% CI 95% CI
18-29
30-44
45-59
60-69
18-69
Analysis Information:
• Questions used: T12, T13, T14a-otherw
• Epi Info program name: Tsmokelesstypeprev (unweighted); TsmokelesstypeprevWT
(weighted)
Part 6: Templates and Forms 6-3C-32
Section 3C: Data Book Template WHO STEPS Surveillance
Current
tobacco users
Description: Percentage of daily and current (daily plus non-daily) tobacco
users, includes smoking and smokeless, among all respondents.
Instrument questions:
• Do you currently smoke any tobacco products, such as cigarettes, cigars, or
pipes?
• Do you currently smoke tobacco products daily?
• Do you currently use any smokeless tobacco such as [snuff, chewing
tobacco, betel]?
• Do you currently use smokeless tobacco products daily?
Current tobacco users
Age Group (years)
Men Women Both Sexes
n %
Current users
95% CI n %
Current users
95% CI n %
Current users
95% CI
18-29
30-44
45-59
60-69
18-69
Daily tobacco users
Age Group (years)
Men Women Both Sexes
n %
Daily users
95% CI n % Daily users
95% CI n %
Daily users
95% CI
18-29
30-44
45-59
60-69
18-69
Analysis Information:
• Questions used: T1, T2, T12, T13
• Epi Info program name: Tdailyuser (unweighted); TdailyuserWT (weighted)
Part 6: Templates and Forms 6-3C-33
Section 3C: Data Book Template WHO STEPS Surveillance
Exposure
to second-
hand
smoke in
home in
past 30
days
Description: Percentage of respondents exposed second-hand smoke in the home in
the past 30 days.
Instrument question:
• In the past 30 days, did someone smoke in your home?
Exposed to second-hand smoke in home during the past 30 days
Age Group (years)
Men Women Both Sexes
n %
Exposed 95% CI n
% Exposed
95% CI n %
Exposed 95% CI
18-29
30-44
45-59
60-69
18-69
Analysis Information:
• Questions used: T17
• Epi Info program name: Tetshome (unweighted); TetshomeWT (weighted)
Exposure
to second-
hand
smoke in
the
workplace
in past 30
days
Description: Percentage of respondents exposed to second-hand smoke in the
workplace in the past 30 days.
Instrument question:
• During the past 30 days, did someone smoke in closed areas in your workplace
(in the building, in a work area or a specific office)?
Exposed to second-hand smoke in the workplace during the past 30 days
Age Group (years)
Men Women Both Sexes
n %
Exposed 95% CI n
% Exposed
95% CI n %
Exposed 95% CI
18-29
30-44
45-59
60-69
18-69
Analysis Information:
• Questions used: T18
• Epi Info program name: Tetswork (unweighted); TetsworkWT (weighted)

Part 6: Templates and Forms 6-3D-34
Section 3D: Data Book Template WHO STEPS Surveillance
Alcohol Consumption
Alcohol
consumption
status
Description: Alcohol consumption status of all respondents.
Instrument questions:
• Have you ever consumed any alcohol such as …?
• Have you consumed any alcohol in the past 12 months?
• Have you consumed any alcohol in the past 30 days?
Alcohol consumption status
Age Group (years)
Men
n
% Current drinker (past 30
days)
95% CI
% Drank in past 12 months,
not current
95% CI
% Past 12
months abstainer
95% CI %
Lifetime abstainer
95% CI
18-29
30-44
45-59
60-69
18-69
Alcohol consumption status
Age Group (years)
Women
n
% Current drinker (past 30
days)
95% CI
% Drank in past 12 months,
not current
95% CI
% Past 12
months abstainer
95% CI %
Lifetime abstainer
95% CI
18-29
30-44
45-59
60-69
18-69
Alcohol consumption status
Age Group (years)
Both Sexes
n
% Current drinker (past 30
days)
95% CI
% Drank in past 12 months,
not current
95% CI
% Past 12
months abstainer
95% CI %
Lifetime abstainer
95% CI
18-29
30-44
45-59
60-69
18-69
Analysis Information:
• Questions used: A1, A2, A5
• Epi Info program name: Aconsumption (unweighted); AconsumptionWT (weighted)

Part 6: Templates and Forms 6-3C-35
Section 3C: Data Book Template WHO STEPS Surveillance
Stopping
drinking
due to
health
reasons
Description: Percentage of former drinkers (those who did not drink during the past
12 months) who stopped drinking due to health reasons, such as a negative impact of
drinking on your health or as per advice of a doctor or other health worker among
those respondents who drank in their lifetime, but not in the last 12 months.
Instrument questions:
• Have you consumed any alcohol in the past 12 months?
• Did you stop drinking due to health reasons, such as a negative impact of drinking
on your health or as per advice of your doctor or other health worker?
Stopping drinking due to health reasons
Age Group (years)
Men Women Both Sexes
n
% stopping due to health
reasons
95% CI n
% stopping due to health
reasons
95% CI n
% stopping due to health
reasons
95% CI
18-29
30-44
45-59
60-69
18-69
Analysis Information:
• Questions used: A1, A2, A3
• Epi Info program name: Astopdrink (unweighted); AstopdrinkWT (weighted)
Part 6: Templates and Forms 6-3C-36
Section 3C: Data Book Template WHO STEPS Surveillance
Frequency
of alcohol
consumption
Description: Frequency of alcohol consumption in the past 12 months among
those respondents who drank in the last 12 months.
Instrument question:
• During the past 12 months, how frequently have you had at least one alcoholic
drink?
Frequency of alcohol consumption in the past 12 months
Age Group (years)
Men
n %
Daily 95% CI
% 5-6 days/ week
95% CI
% 3-4 days/ week
95% CI
% 1-2 days/ week
95% CI
% 1-3 days/ month
95% CI
% < once
a month
95% CI
18-29
30-44
45-59
60-69
18-69
Frequency of alcohol consumption in the past 12 months
Age Group (years)
Women
n %
Daily 95% CI
% 5-6 days/ week
95% CI
% 3-4 days/ week
95% CI
% 1-2 days/ week
95% CI
% 1-3 days/ month
95% CI
% < once
a month
95% CI
18-29
30-44
45-59
60-69
18-69
Frequency of alcohol consumption in the past 12 months
Age Group (years)
Both Sexes
n %
Daily 95% CI
% 5-6 days/ week
95% CI
% 3-4 days/ week
95% CI
% 1-2 days/ week
95% CI
% 1-3 days/ month
95% CI
% < once
a month
95% CI
18-29
30-44
45-59
60-69
18-69
Analysis Information:
• Questions used: A1, A2, A4
• Epi Info program name: Afrequency (unweighted); AfrequencyWT (weighted)

Part 6: Templates and Forms 6-3C-37
Section 3C: Data Book Template WHO STEPS Surveillance
Drinking
occasions
in the
past 30
days
Description: Mean number of occasions with at least one drink in the past 30 days
among current (past 30 days) drinkers.
Instrument question:
• During the past 30 days, on how many occasions did you have at least one
alcoholic drink?
Mean number of drinking occasions in the past 30 days among current (past 30 days) drinkers
Age Group (years)
Men Women Both Sexes
n Mean 95% CI n Mean 95% CI n Mean 95% CI
18-29
30-44
45-59
60-69
18-69
Analysis Information:
• Questions used: A1, A2, A5, A6
• Epi Info program name: Aoccasions (unweighted); AoccasionsWT (weighted)
Standard
drinks
per
drinking
occasion
Description: Mean number of standard drinks consumed on a drinking occasion
among current (past 30 days) drinkers.
Instrument question:
• During the past 30 days, when you drank alcohol, on average, how many standard
alcoholic drinks did you have during one occasion?
Mean number of standard drinks per drinking occasion among current (past 30 days) drinkers
Age Group (years)
Men Women Both Sexes
n Mean 95% CI n Mean 95% CI n Mean 95% CI
18-29
30-44
45-59
60-69
18-69
Analysis Information:
• Questions used: A1, A2, A5, A7
• Epi Info program name: Anumdrinkperday (unweighted); AnumdrinkperdayWT (weighted)

Part 6: Templates and Forms 6-3C-38
Section 3C: Data Book Template WHO STEPS Surveillance
Average
volume
drinking
levels
among all
respondents
Description: Percentage of respondents with different drinking levels.
A standard drink contains approximately 10g of pure alcohol.
Instrument questions:
• During the past 30 days, when you drank alcohol, on average, how many
standard alcoholic drinks did you have during one occasion?
Drinking at high-end level among all respondents (≥60g of pure alcohol on average per occasion among men
and ≥40g of pure alcohol on average per occasion among women)
Age Group (years)
Men Women Both Sexes
n % ≥60g 95% CI n % ≥40g 95% CI n % high-
end level 95% CI
18-29
30-44
45-59
60-69
18-69
Drinking at intermediate level among all respondents (40-59.9g of pure alcohol on average per occasion among
men and 20-39.9g of pure alcohol on average per occasion among women)
Age Group (years)
Men Women Both Sexes
n % 40-59.9g
95% CI n % 20-39.9g
95% CI n %
intermediate level
95% CI
18-29
30-44
45-59
60-69
18-69
Drinking at lower-end level among all respondents (<40g of pure alcohol on average per occasion among men
and <20g of pure alcohol on average per occasion among women)
Age Group (years)
Men Women Both Sexes
n % <40g 95% CI n % <20g 95% CI n % lower-end level
95% CI
18-29
30-44
45-59
60-69
18-69
Analysis Information:
• Questions used: A1, A2, A5, A7
• Epi Info program name: Acategories (unweighted); AcategoriesWT (weighted)

Part 6: Templates and Forms 6-3C-39
Section 3C: Data Book Template WHO STEPS Surveillance
Average
volume
drinking
levels
among
current
(past 30
days)
drinkers
Description: Percentage of current (past 30 days) drinkers with different drinking
levels.
A standard drink contains approximately 10g of pure alcohol.
Instrument questions:
• During the past 30 days, when you drank alcohol, on average, how many
standard alcoholic drinks did you have during one occasion?
High-end, intermediate, and lower-end level drinking among current (past 30 days) drinkers
Age Group (years)
Men
n % high-
end (≥60g)
95% CI %
intermediate (40-59.9g)
95% CI % lower-
end (<40g)
95% CI
18-29
30-44
45-59
60-69
18-69
High-end, intermediate, and lower-end level drinking among current (past 30 days) drinkers
Age Group (years)
Women
n % high-
end (≥40g)
95% CI %
intermediate (20-39.9g)
95% CI % lower-
end (<20g)
95% CI
18-29
30-44
45-59
60-69
18-69
High-end, intermediate, and lower-end level drinking among current (past 30 days) drinkers
Age Group (years)
Both sexes
n % high-
end 95% CI
% intermediate
95% CI % lower-
end 95% CI
18-29
30-44
45-59
60-69
18-69
Analysis Information:
• Questions used: A1, A2, A5, A7
• Epi Info program name: Acategories (unweighted); AcategoriesWT (weighted)

Part 6: Templates and Forms 6-3C-40
Section 3C: Data Book Template WHO STEPS Surveillance
Largest
number
of drinks
in the
past 30
days
Description: Largest number of drinks consumed during a single occasion in the past
30 days among current (past 30 days) drinkers.
Instrument question:
• During the past 30 days, what was the largest number of standard alcoholic drinks
you had on a single occasion, counting all types of alcoholic drinks together?
Mean maximum number of standard drinks consumed on one occasion in the past 30 days
Age Group (years)
Men Women Both Sexes
n Mean
maximum number
95% CI n Mean
maximum number
95% CI n Mean
maximum number
95% CI
18-29
30-44
45-59
60-69
18-69
Analysis Information:
• Questions used: A1, A2, A5, A8
• Epi Info program name: Alargestnum (unweighted); AlargestnumWT (weighted)

Part 6: Templates and Forms 6-3C-41
Section 3C: Data Book Template WHO STEPS Surveillance
Six or more
drinks on a
single occasion
(“heavy
episodic
drinking”)
Description: Percentage of respondents who had six or more drinks on any
occasion in the past 30 days during a single occasion among the total
population.
Instrument question:
• During the past 30 days, how many times did you have six or more
standard alcoholic drinks in a single drinking occasion?
Six or more drinks on a single occasion at least once during the past 30 days among total population
Age Group (years)
Men Women Both Sexes
n % ≥ 6 drinks
95% CI n % ≥ 6 drinks
95% CI n % ≥ 6 drinks
95% CI
18-29
30-44
45-59
60-69
18-69
Analysis Information:
• Questions used: A1, A2, A5, A9
• Epi Info program name: Aepisodic (unweighted); AepisodicWT (weighted)
Six or
more
drinks on
a single
occasion
Description: Mean number of times in the past 30 days on which current (past 30
days) drinkers consumed six or more drinks during a single occasion.
Instrument question:
• During the past 30 days, how many times did you have six or more
standard alcoholic drinks in a single drinking occasion?
Mean number of times with six or more drinks during a single occasion in the past 30 days among current drinkers
Age Group (years)
Men Women Both Sexes
n Mean
number of times
95% CI n Mean
number of times
95% CI n Mean
number of times
95% CI
18-29
30-44
45-59
60-69
18-69
Analysis Information:
• Questions used: A1, A2, A5, A9
• Epi Info program name: Aepisodic (unweighted); AepisodicWT (weighted)

Part 6: Templates and Forms 6-3C-42
Section 3C: Data Book Template WHO STEPS Surveillance
Past 7
days
drinking
Description: Frequency of alcohol consumption in the past 7 days by current (past
30 days) drinkers.
Instrument question:
• During each of the past 7 days, how many standard drinks of any alcoholic drink
did you have each day?
Frequency of alcohol consumption in the past 7 days
Age Group (years)
Men
n % Daily 95% CI % 5-6 days
95% CI % 3-4 days
95% CI % 1-2 days
95% CI % 0 days
95% CI
18-29
30-44
45-59
60-69
18-69
Frequency of alcohol consumption in the past 7 days
Age Group (years)
Women
n % Daily 95% CI % 5-6 days
95% CI % 3-4 days
95% CI % 1-2 days
95% CI % 0 days
95% CI
18-29
30-44
45-59
60-69
18-69
Frequency of alcohol consumption in the past 7 days
Age Group (years)
Both Sexes
n % Daily 95% CI % 5-6 days
95% CI % 3-4 days
95% CI % 1-2 days
95% CI % 0 days
95% CI
18-29
30-44
45-59
60-69
18-69
Analysis Information:
• Questions used: A1, A2, A5, A10a-g
• Epi Info program name: Apastweek (unweighted); ApastweekWT (weighted)

Part 6: Templates and Forms 6-3C-43
Section 3C: Data Book Template WHO STEPS Surveillance
Standard
drinks
per day
in the
past 7
days
Description: Mean number of standard drinks consumed on average per day in the
past 7 days among current (past 30 days) drinkers.
Instrument question:
• During each of the past 7 days, how many standard drinks of any alcoholic drink
did you have each day?
Mean number of standard drinks consumed on average per day in the past 7 days among current drinkers
Age Group (years)
Men Women Both Sexes
n Mean
number 95% CI n
Mean number
95% CI n Mean
number 95% CI
18-29
30-44
45-59
60-69
18-69
Analysis Information:
• Questions used: A1, A2, A5, A10a-g
• Epi Info program name: Apastweek (unweighted); ApastweekWT (weighted)
Consumption
of
unrecorded
alcohol
Description: Percentage of respondents that consumed unrecorded alcohol
(homebrewed alcohol, alcohol brought over the border, not intended for drinking
or other untaxed alcohol) during the past 7 days among current (past 30 days)
drinkers.
Instrument questions:
• Have you consumed any alcohol within the past 30 days?
• During the past 7 days, did you consume any homebrewed alcohol, any
alcohol brought over the border, not intended for drinking or other untaxed
alcohol?
Consumption of unrecorded alcohol
Age Group (years)
Men Women Both Sexes
n
% consuming unrecorded
alcohol
95% CI n
% consuming unrecorded
alcohol
95% CI n
% consuming unrecorded
alcohol
95% CI
18-29
30-44
45-59
60-69
18-69
Analysis Information:
• Questions used: A1, A2, A5, A10a-g, A11
• Epi Info program name: Aunrecorded (unweighted); AunrecordedWT (weighted)
Part 6: Templates and Forms 6-3C-44
Section 3C: Data Book Template WHO STEPS Surveillance
Standard
drinks of
unrecorded
alcohol per
day in the
past 7 days
Description: Mean number of standard drinks of unrecorded alcohol consumed on
average per day in the past 7 days among current (past 30 days) drinkers.
Instrument question:
• On average, how many standard drinks of the following did you consume
during the past 7 days?
Mean number of standard drinks of unrecorded alcohol consumed on average per day in the past 7 days
among current drinkers
Age Group (years)
Men Women Both Sexes
n Mean
number 95% CI n
Mean number
95% CI n Mean
number 95% CI
18-29
30-44
45-59
60-69
18-69
Analysis Information:
• Questions used: A1, A2, A5, A10a-g, A11, A12a-e
• Epi Info program name: Ameanunrecorded (unweighted); AmeanunrecordedWT (weighted)
Percent of
unrecorded
alcohol
from all
alcohol
consumed
Description: Percentage of unrecorded alcohol from all alcohol consumed during
the past 7 days among current (past 30 days) drinkers.
Instrument questions:
• During each of the past 7 days, how many standard drinks did you have each
day?
• During the past 7 days, did you consume any homebrewed alcohol, any alcohol
brought over the border, not intended for drinking or other untaxed alcohol?
• On average, how many standard drinks of the following did you consume
during the past 7 days?
Percentage of unrecorded alcohol from all alcohol consumed during past 7 days
Age Group (years)
Men Women Both Sexes
n
% unrecorded alcohol of all alcohol
95% CI n
% unrecorded alcohol of all alcohol
95% CI n
% unrecorded alcohol of all alcohol
95% CI
18-29
30-44
45-59
60-69
18-69
Analysis Information:
• Questions used: A1, A2, A5, A10a-g, A11, A12a-e
• Epi Info program name: Please contact the STEPS team.

Part 6: Templates and Forms 6-3C-45
Section 3C: Data Book Template WHO STEPS Surveillance
Types of
unrecorded
alcohol
Description: Percentage of each type of unrecorded alcohol of all unrecorded
alcohol consumed in the past 7 days among current (past 30 days) drinkers.
Instrument questions:
• During the past 7 days, did you consume any homebrewed alcohol, any
alcohol brought over the border, not intended for drinking or other untaxed
alcohol?
• On average, how many standard drinks of the following did you consume
during the past 7 days?
Unrecorded alcohol consumption during the past 7 days by type
Age Group (years)
Men
n
% home-brewed spirits
95% CI
% home-brewed beer/ wine
95% CI
% brought
over border
95% CI
% surro-gate
alcohol
95% CI %
other 95% CI
18-29
30-44
45-59
60-69
18-69
Unrecorded alcohol consumption during the past 7 days by type
Age Group (years)
Women
n
% home-brewed spirits
95% CI
% home-brewed beer/ wine
95% CI
% brought
over border
95% CI
% surro-gate
alcohol
95% CI %
other 95% CI
18-29
30-44
45-59
60-69
18-69
Unrecorded alcohol consumption during the past 7 days by type
Age Group (years)
Both Sexes
n
% home-brewed spirits
95% CI
% home-brewed beer/ wine
95% CI
% brought
over border
95% CI
% surro-gate
alcohol
95% CI %
other 95% CI
18-29
30-44
45-59
60-69
18-69
Analysis Information:
• Questions used: A1, A2, A5, A11, A12a-e
• Epi Info program name: Please contact the STEPS team.

Part 6: Templates and Forms 6-3C-46
Section 3C: Data Book Template WHO STEPS Surveillance
Frequency
of
impaired
control
over
drinking
Description: Frequency of not being able to stop drinking once started during the
past 12 months among past 12 month drinkers.
Instrument questions:
• Have you consumed any alcohol within the past 12 months?
• How often during the past 12 months have you found that you were not able to
stop drinking once you had started?
Frequency of not being able to stop drinking once started during the past 12 months among past 12
month drinkers
Age Group (years)
Men
n
% monthly or more
frequently
95% CI % less than
monthly 95% CI % never 95% CI
18-29
30-44
45-59
60-69
18-69
Frequency of not being able to stop drinking once started during the past 12 months among past 12
month drinkers
Age Group (years)
Women
n
% monthly or more
frequently
95% CI % less than
monthly 95% CI % never 95% CI
18-29
30-44
45-59
60-69
18-69
Frequency of not being able to stop drinking once started during the past 12 months among past 12
month drinkers
Age Group (years)
Both Sexes
n
% monthly or more
frequently
95% CI % less than
monthly 95% CI % never 95% CI
18-29
30-44
45-59
60-69
18-69
Analysis Information:
• Questions used: A1, A2, A13
• Epi Info program name: Anotabletostop (unweighted); AnotabletostopWT (weighted)
Part 6: Templates and Forms 6-3C-47
Section 3C: Data Book Template WHO STEPS Surveillance
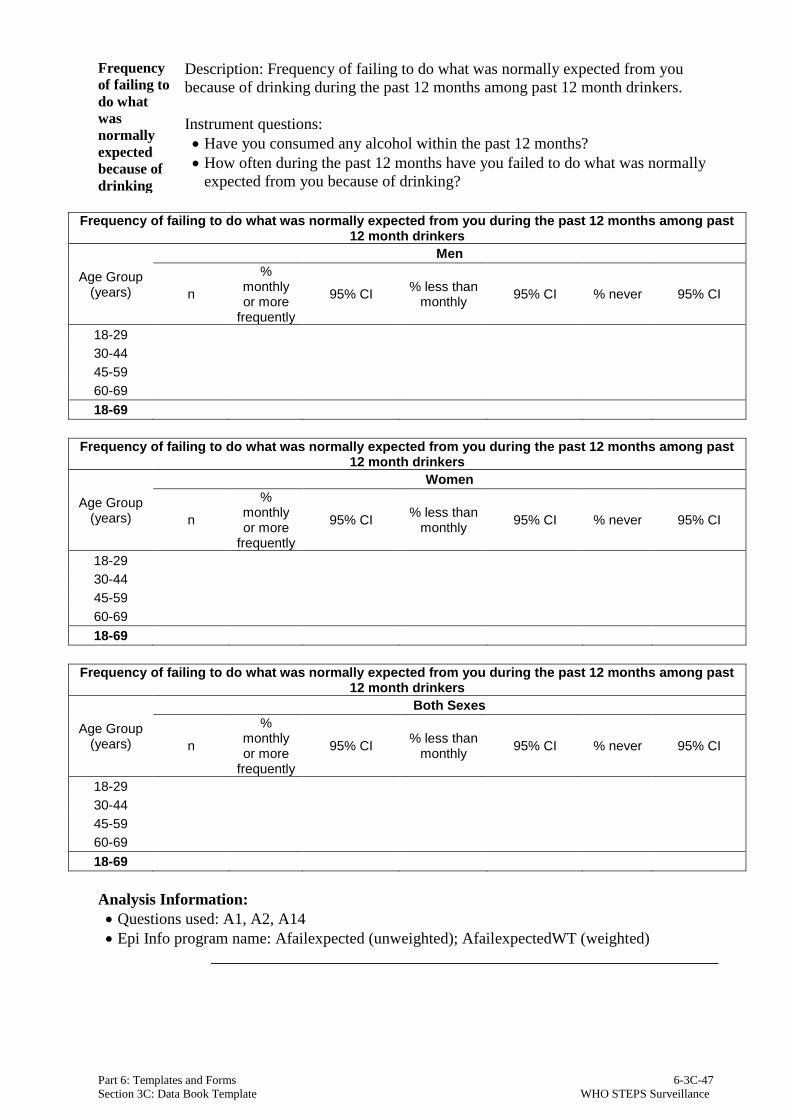
Frequency
of failing to
do what
was
normally
expected
because of
drinking
Description: Frequency of failing to do what was normally expected from you
because of drinking during the past 12 months among past 12 month drinkers.
Instrument questions:
• Have you consumed any alcohol within the past 12 months?
• How often during the past 12 months have you failed to do what was normally
expected from you because of drinking?
Frequency of failing to do what was normally expected from you during the past 12 months among past
12 month drinkers
Age Group (years)
Men
n
% monthly or more
frequently
95% CI % less than
monthly 95% CI % never 95% CI
18-29
30-44
45-59
60-69
18-69
Frequency of failing to do what was normally expected from you during the past 12 months among past
12 month drinkers
Age Group (years)
Women
n
% monthly or more
frequently
95% CI % less than
monthly 95% CI % never 95% CI
18-29
30-44
45-59
60-69
18-69
Frequency of failing to do what was normally expected from you during the past 12 months among past
12 month drinkers
Age Group (years)
Both Sexes
n
% monthly or more
frequently
95% CI % less than
monthly 95% CI % never 95% CI
18-29
30-44
45-59
60-69
18-69
Analysis Information:
• Questions used: A1, A2, A14
• Epi Info program name: Afailexpected (unweighted); AfailexpectedWT (weighted)
Part 6: Templates and Forms 6-3C-48
Section 3C: Data Book Template WHO STEPS Surveillance
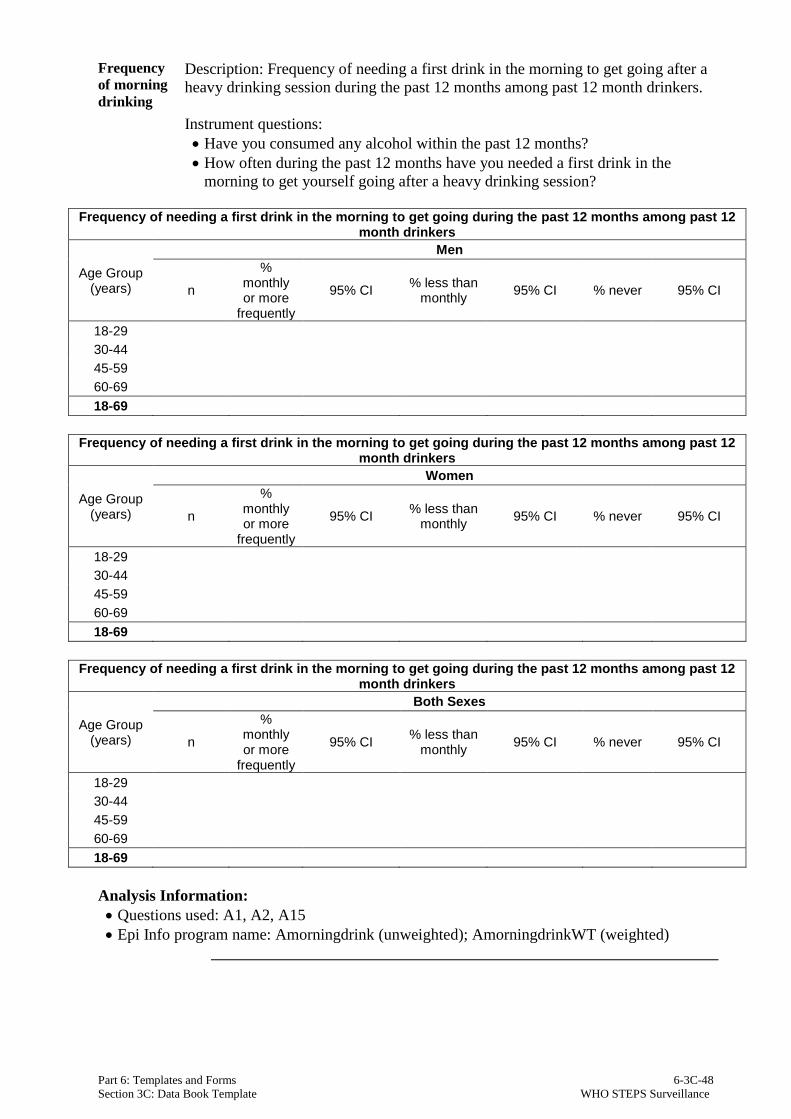
Frequency
of morning
drinking
Description: Frequency of needing a first drink in the morning to get going after a
heavy drinking session during the past 12 months among past 12 month drinkers.
Instrument questions:
• Have you consumed any alcohol within the past 12 months?
• How often during the past 12 months have you needed a first drink in the
morning to get yourself going after a heavy drinking session?
Frequency of needing a first drink in the morning to get going during the past 12 months among past 12
month drinkers
Age Group (years)
Men
n
% monthly or more
frequently
95% CI % less than
monthly 95% CI % never 95% CI
18-29
30-44
45-59
60-69
18-69
Frequency of needing a first drink in the morning to get going during the past 12 months among past 12
month drinkers
Age Group (years)
Women
n
% monthly or more
frequently
95% CI % less than
monthly 95% CI % never 95% CI
18-29
30-44
45-59
60-69
18-69
Frequency of needing a first drink in the morning to get going during the past 12 months among past 12
month drinkers
Age Group (years)
Both Sexes
n
% monthly or more
frequently
95% CI % less than
monthly 95% CI % never 95% CI
18-29
30-44
45-59
60-69
18-69
Analysis Information:
• Questions used: A1, A2, A15
• Epi Info program name: Amorningdrink (unweighted); AmorningdrinkWT (weighted)

Part 6: Templates and Forms 6-3C-49
Section 3C: Data Book Template WHO STEPS Surveillance
Frequency of
problems with
family/ partner
due to someone
else’s drinking
Description: Frequency of having had problems with family or partner due to
someone else’s drinking in the past 12 months among all respondents.
Instrument question:
• Have you had family problems or problems with your partner due to
someone else’s drinking within the past 12 months?
Frequency of family/partner problems due to someone else’s drinking during the past 12 months among
all respondents
Age Group (years)
Men
n
% monthly or more
frequently
95% CI % less than
monthly 95% CI % never 95% CI
18-29
30-44
45-59
60-69
18-69
Frequency of family/partner problems due to someone else’s drinking during the past 12 months among
all respondents
Age Group (years)
Women
n
% monthly or more
frequently
95% CI % less than
monthly 95% CI % never 95% CI
18-29
30-44
45-59
60-69
18-69
Frequency of family/partner problems due to someone else’s drinking during the past 12 months among
all respondents
Age Group (years)
Both Sexes
n
% monthly or more
frequently
95% CI % less than
monthly 95% CI % never 95% CI
18-29
30-44
45-59
60-69
18-69
Analysis Information:
• Question used: A16
• Epi Info program name: Afamproblem (unweighted); AfamproblemWT (weighted)

Part 6: Templates and Forms 6-3C-50
Section 3C: Data Book Template WHO STEPS Surveillance
Diet
Mean
number of
days of fruit
and
vegetable
consumption
Description: mean number of days fruit and vegetables consumed.
Instrument questions:
• In a typical week, on how many days do you eat fruit?
• In a typical week, on how many days do you eat vegetables?
Mean number of days fruit consumed in a typical week
Age Group (years)
Men Women Both Sexes
n Mean
number of days
95% CI n Mean
number of days
95% CI n Mean
number of days
95% CI
18-29
30-44
45-59
60-69
18-69
Mean number of days vegetables consumed in a typical week
Age Group (years)
Men Women Both Sexes
n Mean
number of days
95% CI n Mean
number of days
95% CI n Mean
number of days
95% CI
18-29
30-44
45-59
60-69
18-69
Analysis Information:
• Questions used: D1, D3
• Epi Info program name: Ddays (unweighted); DdaysWT (weighted)

Part 6: Templates and Forms 6-3C-51
Section 3C: Data Book Template WHO STEPS Surveillance
Mean
number of
servings of
fruit and
vegetable
consumption
Description: mean number of fruit, vegetable, and combined fruit and vegetable
servings on average per day.
Instrument questions:
• In a typical week, on how many days do you eat fruit?
• How many servings of fruit do you eat on one of those days?
• In a typical week, on how many days do you eat vegetables?
• How many servings of vegetables do you eat on one of those days?
Mean number of servings of fruit on average per day
Age Group (years)
Men Women Both Sexes
n
Mean number
of servings
95% CI n
Mean number
of servings
95% CI n
Mean number
of servings
95% CI
18-29
30-44
45-59
60-69
18-69
Mean number of servings of vegetables on average per day
Age Group (years)
Men Women Both Sexes
n
Mean number
of servings
95% CI n
Mean number
of servings
95% CI n
Mean number
of servings
95% CI
18-29
30-44
45-59
60-69
18-69
Mean number of servings of fruit and/or vegetables on average per day
Age Group (years)
Men Women Both Sexes
n
Mean number
of servings
95% CI n
Mean number
of servings
95% CI n
Mean number
of servings
95% CI
18-29
30-44
45-59
60-69
18-69
Analysis Information:
• Questions used: D1, D2 , D3, D4
• Epi Info program name: Dservings (unweighted); DservingsWT (weighted)

Part 6: Templates and Forms 6-3C-52
Section 3C: Data Book Template WHO STEPS Surveillance
Fruit and
vegetable
consumption
per day
Description: Frequency of fruit and/or vegetable consumption.
Instrument questions:
• In a typical week, on how many days do you eat fruit?
• How many servings of fruit do you eat on one of those days?
• In a typical week, on how many days do you eat vegetables?
• How many servings of vegetables do you eat on one of those days?
Number of servings of fruit and/or vegetables on average per day
Age Group (years)
Men
n % no fruit
and/or vegetables
95% CI % 1-2
servings 95% CI
% 3-4 servings
95% CI % ≥5
servings 95% CI
18-29
30-44
45-59
60-69
18-69
Number of servings of fruit and/or vegetables on average per day
Age Group (years)
Women
n % no fruit
and/or vegetables
95% CI % 1-2
servings 95% CI
% 3-4 servings
95% CI % ≥5
servings 95% CI
18-29
30-44
45-59
60-69
18-69
Number of servings of fruit and/or vegetables on average per day
Age Group (years)
Both Sexes
n % no fruit
and/or vegetables
95% CI % 1-2
servings 95% CI
% 3-4 servings
95% CI % ≥5
servings 95% CI
18-29
30-44
45-59
60-69
18-69
Analysis Information:
• Questions used: D1, D2 , D3, D4
• Epi Info program name: Dfiveormore (unweighted); DfiveormoreWT (weighted)

Part 6: Templates and Forms 6-3C-53
Section 3C: Data Book Template WHO STEPS Surveillance
Fruit and
vegetable
consumption
per day
Description: Percentage of those eating less than five servings of fruit and/or
vegetables on average per day.
Instrument questions:
• In a typical week, on how many days do you eat fruit?
• How many servings of fruit do you eat on one of those days?
• In a typical week, on how many days do you eat vegetables?
• How many servings of vegetables do you eat on one of those days?
Less than five servings of fruit and/or vegetables on average per day
Age Group (years)
Men Women Both Sexes
n % < five servings per day
95% CI n % < five servings per day
95% CI n % < five servings per day
95% CI
18-29
30-44
45-59
60-69
18-69
Analysis Information:
• Questions used: D1, D2 , D3, D4
• Epi Info program name: Dfiveormore (unweighted); DfiveormoreWT (weighted)

Part 6: Templates and Forms 6-3C-54
Section 3C: Data Book Template WHO STEPS Surveillance
Adding
salt at
meal
Description: Percentage of all respondents who always or often add salt or salty
sauce to their food before eating or as they are eating.
Instrument question:
• How often do you add salt or a salty sauce such as soya sauce to your food
right before you eat it or as you are eating it?
Add salt always or often before eating or when eating
Age Group (years)
Men Women Both Sexes
n % 95% CI n % 95% CI n % 95% CI
18-29
30-44
45-59
60-69
18-69
Analysis Information:
• Question used: D5
• Epi Info program name: Deating (unweighted); DeatingWT (weighted)
Adding
salt when
cooking
Description: Percentage of all respondents who always or often add salt to their food
when cooking or preparing foods at home.
Instrument question:
• How often is salt, salty seasoning or a salty sauce added in cooking or
preparing foods in your household?
Add salt always or often when cooking or preparing food at home
Age Group (years)
Men Women Both Sexes
n % 95% CI n % 95% CI n % 95% CI
18-29
30-44
45-59
60-69
18-69
Analysis Information:
• Question used: D6
• Epi Info program name: Dooking (unweighted); DcookingWT (weighted)

Part 6: Templates and Forms 6-3C-55
Section 3C: Data Book Template WHO STEPS Surveillance
Salty
processed
food
consumption
Description: Percentage of all respondents who always or often eat processed
foods high in salt.
Instrument question:
• How often do you eat processed food high in salt?
Always or often consume processed food high in salt
Age Group (years)
Men Women Both Sexes
n % 95% CI n % 95% CI n % 95% CI
18-29
30-44
45-59
60-69
18-69
Analysis Information:
• Question used: D7
• Epi Info program name: Dprocessed (unweighted); DprocessedWT (weighted)
Salt
consumption Description: Percentage of all respondents who think they consume far too much
or too much salt.
Instrument question:
• How much salt or salty sauce do you think you consume?
Think they consume far too much or too much salt
Age Group (years)
Men Women Both Sexes
n % 95% CI n % 95% CI n % 95% CI
18-29
30-44
45-59
60-69
18-69

Part 6: Templates and Forms 6-3C-56
Section 3C: Data Book Template WHO STEPS Surveillance
Self-reported quantity of salt consumed
Age Group (years)
Men
n % Far
too much
95% CI % Too much
95% CI
% Just the right
amount
95% CI % Too little
95% CI % Far
too little 95% CI
18-29
30-44
45-59
60-69
18-69
Self-reported quantity of salt consumed
Age Group (years)
Women
n % Far
too much
95% CI % Too much
95% CI
% Just the right
amount
95% CI % Too little
95% CI % Far
too little 95% CI
18-29
30-44
45-59
60-69
18-69
Self-reported quantity of salt consumed
Age Group (years)
Both Sexes
n % Far
too much
95% CI % Too much
95% CI
% Just the right
amount
95% CI % Too little
95% CI % Far
too little 95% CI
18-29
30-44
45-59
60-69
18-69
Analysis Information:
• Question used: D8
• Epi Info program name: Dsaltquantity (unweighted); DsaltquantityWT (weighted)

Part 6: Templates and Forms 6-3C-57
Section 3C: Data Book Template WHO STEPS Surveillance
Lowering
salt Description: Percentage of respondents who think lowering salt in diet is very,
somewhat or not at all important.
Instrument question:
• How important to you is lowering the salt in your diet?
Importance of lowering salt in diet
Age Group (years)
Men
n % Very
important 95% CI
% Somewhat important
95% CI %
Not at all important
95% CI
18-29
30-44
45-59
60-69
18-69
Importance of lowering salt in diet
Age Group (years)
Women
n % Very
important 95% CI
% Somewhat important
95% CI %
Not at all important
95% CI
18-29
30-44
45-59
60-69
18-69
Importance of lowering salt in diet
Age Group (years)
Both Sexes
n % Very
important 95% CI
% Somewhat important
95% CI %
Not at all important
95% CI
18-29
30-44
45-59
60-69
18-69
Analysis Information:
• Question used: D9
• Epi Info program name: Dlower (unweighted); DlowerWT (weighted)

Part 6: Templates and Forms 6-3C-58
Section 3C: Data Book Template WHO STEPS Surveillance
Salt
knowledge Description: Percentage of respondents who think consuming too much salt could
cause a serious health problem.
Instrument question:
• Do you think that too much salt or salty sauce in your diet could cause a
health problem?
Think consuming too much salt could cause serious health problem
Age Group (years)
Men Women Both Sexes
n % 95% CI n % 95% CI n % 95% CI
18-29
30-44
45-59
60-69
18-69
Analysis Information:
• Question used: D10
• Epi Info program name: Dhealth (unweighted); DhealthWT (weighted)

Part 6: Templates and Forms 6-3C-59
Section 3C: Data Book Template WHO STEPS Surveillance
Controlling
salt intake Description: Percentage of respondents who take specific action on a regular basis
to control salt intake.
Instrument question:
• Do you do any of the following on a regular basis to control your salt
intake?
Limit consumption of processed foods
Age Group (years)
Men Women Both Sexes
n % 95% CI n % 95% CI n % 95% CI
18-29
30-44
45-59
60-69
18-69
Look at the salt or sodium content on food labels
Age Group (years)
Men Women Both Sexes
n % 95% CI n % 95% CI n % 95% CI
18-29
30-44
45-59
60-69
18-69
Buy low salt/sodium alternatives
Age Group (years)
Men Women Both Sexes
n % 95% CI n % 95% CI n % 95% CI
18-29
30-44
45-59
60-69
18-69
Use spices other than salt when cooking
Age Group (years)
Men Women Both Sexes
n % 95% CI n % 95% CI n % 95% CI
18-29
30-44
45-59
60-69
18-69

Part 6: Templates and Forms 6-3C-60
Section 3C: Data Book Template WHO STEPS Surveillance
Avoid eating foods prepared outside of a home
Age Group (years)
Men Women Both Sexes
n % 95% CI n % 95% CI n % 95% CI
18-29
30-44
45-59
60-69
18-69
Do other things specifically to control your salt intake
Age Group (years)
Men Women Both Sexes
n % 95% CI n % 95% CI n % 95% CI
18-29
30-44
45-59
60-69
18-69
Analysis Information:
• Questions used: D11a-f
• Epi Info program name: Dcontrol (unweighted); DcontrolWT (weighted)

Part 6: Templates and Forms 6-3C-61
Section 3C: Data Book Template WHO STEPS Surveillance
Physical Activity
Introduction A population's physical activity (or inactivity) can be described in different ways.
The two most common ways are
(1) to estimate a population's mean or median physical activity using a continuous
indicator such as MET-minutes per week or time spent in physical activity, and
(2) to classify certain percentages of a population in specific groups by setting up
cut-points for a specific amount of physical activity.
When analyzing GPAQ data, both continuous as well as categorical indicators are
used.
Metabolic
Equivalent
(MET)
METs (Metabolic Equivalents) are commonly used to express the intensity of
physical activities, and are also used for the analysis of GPAQ data.
Applying MET values to activity levels allows us to calculate total physical
activity. MET is the ratio of a person's working metabolic rate relative to the
resting metabolic rate. One MET is defined as the energy cost of sitting quietly,
and is equivalent to a caloric consumption of 1 kcal/kg/hour. For the analysis of
GPAQ data, existing guidelines have been adopted: It is estimated that, compared
to sitting quietly, a person's caloric consumption is four times as high when being
moderately active, and eight times as high when being vigorously active.
Therefore, for the calculation of a person's total physical activity using GPAQ data,
the following MET values are used:
Domain MET value
Work • Moderate MET value = 4.0
• Vigorous MET value = 8.0
Transport Cycling and walking MET value = 4.0
Recreation • Moderate MET value = 4.0
• Vigorous MET value = 8.0
WHO
global
recommen-
dations on
physical
activity for
health
For the calculation of the categorical indicator on the recommended amount of
physical activity for health, the total time spent in physical activity during a
typical week and the intensity of the physical activity are taken into account.
Throughout a week, including activity for work, during transport and leisure time,
adults should do at least
• 150 minutes of moderate-intensity physical activity OR
• 75 minutes of vigorous-intensity physical activity OR
• An equivalent combination of moderate- and vigorous-intensity physical
activity achieving at least 600 MET-minutes.

Part 6: Templates and Forms 6-3C-62
Section 3C: Data Book Template WHO STEPS Surveillance
Former
recommen-
dations for
comparison
purposes
For comparison purposes, tables presenting cut-offs from former
recommendations are also included in GPAQ data analysis.
The three levels of physical activity suggested for classifying populations were
low, moderate, and high. The criteria for these levels are shown below.
• High
A person reaching any of the following criteria is classified in this category:
- Vigorous-intensity activity on at least 3 days achieving a minimum of at
least 1,500 MET-minutes/week OR
- 7 or more days of any combination of walking, moderate- or vigorous-
intensity activities achieving a minimum of at least 3,000 MET-minutes per
week.
• Moderate
A person not meeting the criteria for the "high" category, but meeting any of
the following criteria is classified in this category:
- 3 or more days of vigorous-intensity activity of at least 20 minutes per day
OR
- 5 or more days of moderate-intensity activity or walking of at least 30
minutes per day OR
- 5 or more days of any combination of walking, moderate- or vigorous-
intensity activities achieving a minimum of at least 600 MET-minutes per
week.
• Low
A person not meeting any of the above mentioned criteria falls in this
category.

Part 6: Templates and Forms 6-3C-63
Section 3C: Data Book Template WHO STEPS Surveillance
Not meeting WHO
recommendations on
physical activity for
health (“Insufficient
physical activity”)
Description: Percentage of respondents not meeting WHO
recommendations on physical activity for health (respondents doing less
than 150 minutes of moderate-intensity physical activity per week, or
equivalent).
Instrument questions
• activity at work
• travel to and from places
• recreational activities
Not meeting WHO recommendations on physical activity for health
Age Group (years)
Men Women Both Sexes
n % not
meeting recs
95% CI n % not
meeting recs
95% CI n % not
meeting recs
95% CI
18-29
30-44
45-59
60-69
18-69
Analysis Information:
• Questions used: P1-P15b
• Epi Info program name: Pnotmeetingrecs (unweighted); PnotmeetingrecsWT (weighted)

Part 6: Templates and Forms 6-3D-64
Section 3D: Data Book Template WHO STEPS Surveillance
Levels of
total
physical
activity
according
to former
recommen-
dations
Description: Percentage of respondents classified into three categories of total
physical activity according to former recommendations.
Instrument questions:
• activity at work
• travel to and from places
• recreational activities
Level of total physical activity according to former recommendations
Age Group (years)
Men
n % Low 95% CI %
Moderate 95% CI % High 95% CI
18-29
30-44
45-59
60-69
18-69
Level of total physical activity according to former recommendations
Age Group (years)
Women
n % Low 95% CI %
Moderate 95% CI % High 95% CI
18-29
30-44
45-59
60-69
18-69
Level of total physical activity according to former recommendations
Age Group (years)
Both Sexes
n % Low 95% CI %
Moderate 95% CI % High 95% CI
18-29
30-44
45-59
60-69
18-69
Analysis Information:
• Questions used: P1-P15b
• Epi Info program name: Ptotallevels (unweighted); PtotallevelsWT (weighted)

Part 6: Templates and Forms 6-3C-65
Section 3C: Data Book Template WHO STEPS Surveillance
Total
physical
activity-
mean
Description: Mean minutes of total physical activity on average per day.
Instrument questions
• activity at work
• travel to and from places
• recreational activities
Mean minutes of total physical activity on average per day
Age Group (years)
Men Women Both Sexes
n Mean
minutes 95% CI n
Mean minutes
95% CI n Mean
minutes 95% CI
18-29
30-44
45-59
60-69
18-69
Analysis Information:
• Questions used: P1-P15b
• Epi Info program name: Ptotal (unweighted); PtotalWT (weighted)
Total
physical
activity-
median
Description: Median minutes of total physical activity on average per day.
Instrument questions
• activity at work
• travel to and from places
• recreational activities
Median minutes of total physical activity on average per day
Age Group (years)
Men Women Both Sexes
n Median minutes
Inter-quartile range
(P25-P75)
n Median minutes
Inter-quartile range
(P25-P75)
n Median minutes
Inter-quartile range
(P25-P75)
18-29
30-44
45-59
60-69
18-69
Analysis Information:
• Questions used: P1-P15b
• Epi Info program name: Ptotal (unweighted); PtotalmedianWT (weighted)

Part 6: Templates and Forms 6-3C-66
Section 3C: Data Book Template WHO STEPS Surveillance
Domain-
specific
physical
activity-
mean
Description: Mean minutes spent in work-, transport- and recreation-related physical
activity on average per day.
Instrument questions:
• activity at work
• travel to and from places
• recreational activities
Mean minutes of work-related physical activity on average per day
Age Group (years)
Men Women Both Sexes
n Mean
minutes 95% CI n
Mean minutes
95% CI n Mean
minutes 95% CI
18-29
30-44
45-59
60-69
18-69
Mean minutes of transport-related physical activity on average per day
Age Group (years)
Men Women Both Sexes
n Mean
minutes 95% CI n
Mean minutes
95% CI n Mean
minutes 95% CI
18-29
30-44
45-59
60-69
18-69
Mean minutes of recreation-related physical activity on average per day
Age Group (years)
Men Women Both Sexes
n Mean
minutes 95% CI n
Mean minutes
95% CI n Mean
minutes 95% CI
18-29
30-44
45-59
60-69
18-69
Analysis Information:
• Questions used: P1-P15b
• Epi Info program name: Psetspecific (unweighted); PsetspecificWT (weighted)

Part 6: Templates and Forms 6-3C-67
Section 3C: Data Book Template WHO STEPS Surveillance
Domain-
specific
physical
activity -
median
Description: Median minutes spent on average per day in work-, transport- and
recreation-related physical activity.
Instrument questions:
• activity at work
• travel to and from places
• recreational activities
Median minutes of work-related physical activity on average per day
Age Group (years)
Men Women Both Sexes
n Median minutes
Inter-quartile range
(P25-P75)
n Median minutes
Inter-quartile range
(P25-P75)
n Median minutes
Inter-quartile range
(P25-P75)
18-29
30-44
45-59
60-69
18-69
Median minutes of transport-related physical activity on average per day
Age Group (years)
Men Women Both Sexes
n Median minutes
Inter-quartile range
(P25-P75)
n Median minutes
Inter-quartile range
(P25-P75)
n Median minutes
Inter-quartile range
(P25-P75)
18-29
30-44
45-59
60-69
18-69
Median minutes of recreation-related physical activity on average per day
Age Group (years)
Men Women Both Sexes
n Median minutes
Inter-quartile range
(P25-P75)
n Median minutes
Inter-quartile range
(P25-P75)
n Median minutes
Inter-quartile range
(P25-P75)
18-29
30-44
45-59
60-69
18-69
Analysis Information:
• Questions used: P1-P15b
• Epi Info program name: Psetspecific (unweighted); PsetspecificmedianWT (weighted)
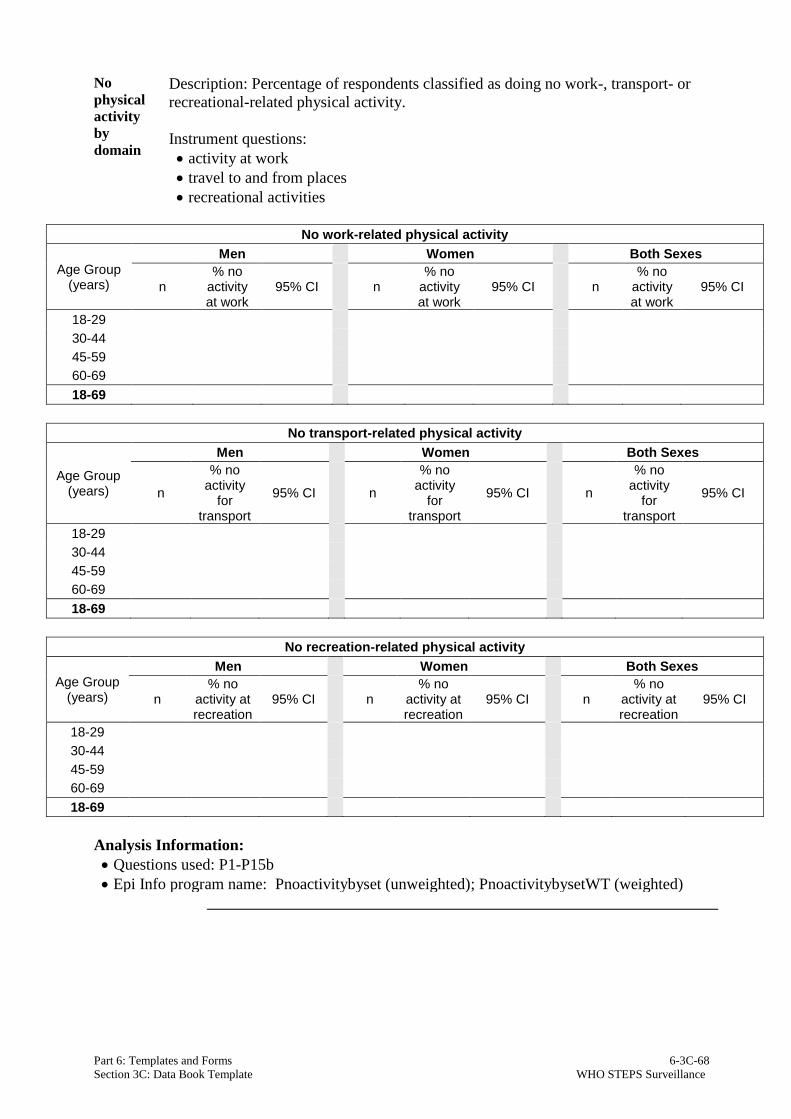
Part 6: Templates and Forms 6-3C-68
Section 3C: Data Book Template WHO STEPS Surveillance
No
physical
activity
by
domain
Description: Percentage of respondents classified as doing no work-, transport- or
recreational-related physical activity.
Instrument questions:
• activity at work
• travel to and from places
• recreational activities
No work-related physical activity
Age Group (years)
Men Women Both Sexes
n % no
activity at work
95% CI n % no
activity at work
95% CI n % no
activity at work
95% CI
18-29
30-44
45-59
60-69
18-69
No transport-related physical activity
Age Group (years)
Men Women Both Sexes
n
% no activity
for transport
95% CI n
% no activity
for transport
95% CI n
% no activity
for transport
95% CI
18-29
30-44
45-59
60-69
18-69
No recreation-related physical activity
Age Group (years)
Men Women Both Sexes
n % no
activity at recreation
95% CI n % no
activity at recreation
95% CI n % no
activity at recreation
95% CI
18-29
30-44
45-59
60-69
18-69
Analysis Information:
• Questions used: P1-P15b
• Epi Info program name: Pnoactivitybyset (unweighted); PnoactivitybysetWT (weighted)

Part 6: Templates and Forms 6-3C-69
Section 3C: Data Book Template WHO STEPS Surveillance
Composition
of total
physical
activity
Description: Percentage of work, transport and recreational activity contributing
to total activity.
Instrument questions:
• activity at work
• travel to and from places
• recreational activities
Composition of total physical activity
Age Group (years)
Men
n % Activity from work
95% CI % Activity
for transport
95% CI
% Activity during leisure time
95% CI
18-29
30-44
45-59
60-69
18-69
Composition of total physical activity
Age Group (years)
Women
n % Activity from work
95% CI % Activity
for transport
95% CI
% Activity during leisure time
95% CI
18-29
30-44
45-59
60-69
18-69
Composition of total physical activity
Age Group (years)
Both Sexes
n % Activity from work
95% CI % Activity
for transport
95% CI
% Activity during leisure time
95% CI
18-29
30-44
45-59
60-69
18-69
Analysis Information:
• Questions used: P1-P15b
• Epi Info program name: Pcomposition(unweighted); PcompositionWT (weighted)

Part 6: Templates and Forms 6-3C-70
Section 3C: Data Book Template WHO STEPS Surveillance
No
vigorous
physical
activity
Description: Percentage of respondents not engaging in vigorous physical activity.
Instrument questions:
• activity at work
• recreational activities
No vigorous physical activity
Age Group (years)
Men Women Both Sexes
n % no
vigorous activity
95% CI n % no
vigorous activity
95% CI n % no
vigorous activity
95% CI
18-29
30-44
45-59
60-69
18-69
Analysis Information:
• Questions used: P1-P15b
• Epi Info program name: Pnovigorous(unweighted); PnovigorousWT (weighted)

Part 6: Templates and Forms 6-3C-71
Section 3C: Data Book Template WHO STEPS Surveillance
Sedentary Description: Minutes spent in sedentary activities on a typical day.
Instrument question:
• sedentary behaviour
Minutes spent in sedentary activities on average per day
Age Group (years)
Men
n Mean
minutes 95% CI
Median minutes
Inter-quartile range
(P25-P75)
18-29
30-44
45-59
60-69
18-69
Minutes spent in sedentary activities on average per day
Age Group (years)
Women
n Mean
minutes 95% CI
Median minutes
Inter-quartile range
(P25-P75)
18-29
30-44
45-59
60-69
18-69
Minutes spent in sedentary activities on average per day
Age Group (years)
Both Sexes
n Mean
minutes 95% CI
Median minutes
Inter-quartile range
(P25-P75)
18-29
30-44
45-59
60-69
18-69
Analysis Information:
• Question used : P16a-b
• Epi Info program name: Psedentary (unweighted); PsedentaryWT and
PsedentarymedianWT (weighted)

Part 6: Templates and Forms 6-3C-72
Section 3C: Data Book Template WHO STEPS Surveillance
History of Raised Blood Pressure
Blood
pressure
measurement
and
diagnosis
Description: Blood pressure measurement and diagnosis among all respondents.
Instrument questions:
• Have you ever had your blood pressure measured by a doctor or other health
worker?
• Have you ever been told by a doctor or other health worker that you have
raised blood pressure or hypertension?
• Have you been told in the past 12 months?
Blood pressure measurement and diagnosis
Age Group (years)
Men
n % Never
measured 95% CI
% measured,
not diagnosed
95% CI
% diagnosed,
but not within past 12 months
95% CI
% diagnosed within past 12 months
95% CI
18-29
30-44
45-59
60-69
18-69
Blood pressure measurement and diagnosis
Age Group (years)
Women
n % Never
measured 95% CI
% measured,
not diagnosed
95% CI
% diagnosed,
but not within past 12 months
95% CI
% diagnosed within past 12 months
95% CI
18-29
30-44
45-59
60-69
18-69
Blood pressure measurement and diagnosis
Age Group (years)
Both sexes
n % Never
measured 95% CI
% measured,
not diagnosed
95% CI
% diagnosed,
but not within past 12 months
95% CI
% diagnosed within past 12 months
95% CI
18-29
30-44
45-59
60-69
18-69
Analysis Information:
• Questions used: H1, H2a, H2b
• Epi Info program name: Hbloodpressure (unweighted); HbloodpressureWT (weighted)

Part 6: Templates and Forms 6-3C-73
Section 3C: Data Book Template WHO STEPS Surveillance
Blood
pressure
treatment
among
those
diagnosed
Description: Raised blood pressure treatment results among those previously
diagnosed with raised blood pressure.
Instrument questions:
• Have you ever had your blood pressure measured by a doctor or other health
worker?
• Have you ever been told by a doctor or other health worker that you have raised
blood pressure or hypertension?
• In the past two weeks, have you taken any drugs (medication) for raised blood
pressure prescribed by a doctor or other health worker?
Currently taking drugs (medication) for raised blood pressure prescribed by doctor or health worker among
those diagnosed
Age Group (years)
Men Women Both Sexes
n % taking
meds 95% CI n
% taking meds
95% CI n % taking
meds 95% CI
18-29
30-44
45-59
60-69
18-69
Analysis Information:
• Questions used: H1, H2a, H3
• Epi Info program name: Hbloodpressure (unweighted); HbloodpressureWT (weighted)

Part 6: Templates and Forms 6-3C-74
Section 3C: Data Book Template WHO STEPS Surveillance
Blood
pressure
advice by
a
traditional
healer
Description: Percentage of respondents who have sought advice or received
treatment from a traditional healer for raised blood pressure among those previously
diagnosed with raised blood pressure.
Instrument questions:
• Have you ever had your blood pressure measured by a doctor or other health
worker?
• Have you ever been told by a doctor or other health worker that you have raised
blood pressure or hypertension?
• Have you ever seen a traditional healer for raised blood pressure?
• Are you currently taking any herbal or traditional remedy for your high blood
pressure?
Seen a traditional healer among those previously diagnosed
Age Group (years)
Men Women Both Sexes
n
% seen trad.
healer
95% CI n
% seen trad.
healer
95% CI n
% seen trad.
healer
95% CI
18-29
30-44
45-59
60-69
18-69
Currently taking herbal or traditional remedy for raised blood pressure among those previously diagnosed
Age Group (years)
Men Women Both Sexes
n
% taking trad. meds
95% CI n
% taking trad. meds
95% CI n
% taking trad. meds
95% CI
18-29
30-44
45-59
60-69
18-69
Analysis Information:
• Questions used: H1, H2a, H4, H5
• Epi Info program name: Hraisedbptrad (unweighted); HraisedbptradWT (weighted)
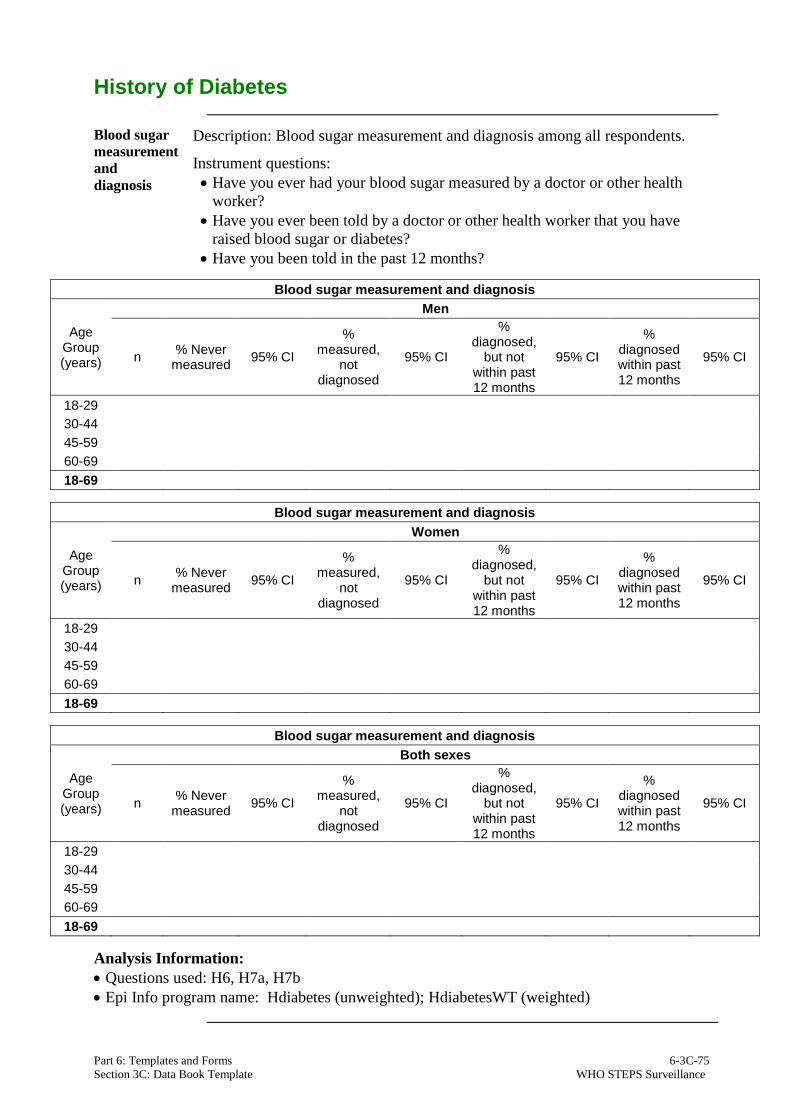
Part 6: Templates and Forms 6-3C-75
Section 3C: Data Book Template WHO STEPS Surveillance
History of Diabetes
Blood sugar
measurement
and
diagnosis
Description: Blood sugar measurement and diagnosis among all respondents.
Instrument questions:
• Have you ever had your blood sugar measured by a doctor or other health
worker?
• Have you ever been told by a doctor or other health worker that you have
raised blood sugar or diabetes?
• Have you been told in the past 12 months?
Blood sugar measurement and diagnosis
Age Group (years)
Men
n % Never
measured 95% CI
% measured,
not diagnosed
95% CI
% diagnosed,
but not within past 12 months
95% CI
% diagnosed within past 12 months
95% CI
18-29
30-44
45-59
60-69
18-69
Blood sugar measurement and diagnosis
Age Group (years)
Women
n % Never
measured 95% CI
% measured,
not diagnosed
95% CI
% diagnosed,
but not within past 12 months
95% CI
% diagnosed within past 12 months
95% CI
18-29
30-44
45-59
60-69
18-69
Blood sugar measurement and diagnosis
Age Group (years)
Both sexes
n % Never
measured 95% CI
% measured,
not diagnosed
95% CI
% diagnosed,
but not within past 12 months
95% CI
% diagnosed within past 12 months
95% CI
18-29
30-44
45-59
60-69
18-69
Analysis Information:
• Questions used: H6, H7a, H7b
• Epi Info program name: Hdiabetes (unweighted); HdiabetesWT (weighted)

Part 6: Templates and Forms 6-3C-76
Section 3C: Data Book Template WHO STEPS Surveillance
Diabetes
treatment
among
those
diagnosed
Description: Diabetes treatment results among those previously diagnosed with
raised blood sugar or diabetes.
Instrument questions:
• Have you ever had your blood sugar measured by a doctor or other health
worker?
• Have you ever been told by a doctor or other health worker that you have raised
blood sugar or diabetes?
• In the past two weeks, have you taken any drugs (medication) for diabetes
prescribed by a doctor or other health worker?
• Are you currently taking insulin for diabetes prescribed by a doctor or other
health worker?
Currently taking drugs (medication) prescribed for diabetes among those previously diagnosed
Age Group (years)
Men Women Both Sexes
n % taking insulin
95% CI n % taking insulin
95% CI n % taking insulin
95% CI
18-29
30-44
45-59
60-69
18-69
Currently taking insulin prescribed for diabetes among those previously diagnosed
Age Group (years)
Men Women Both Sexes
n % taking
meds 95% CI n
% taking meds
95% CI n % taking
meds 95% CI
18-29
30-44
45-59
60-69
18-69
Analysis Information:
• Questions used: H6, H7a, H8, H9
• Epi Info program name: Hdiabetes (unweighted); HdiabetesWT (weighted)
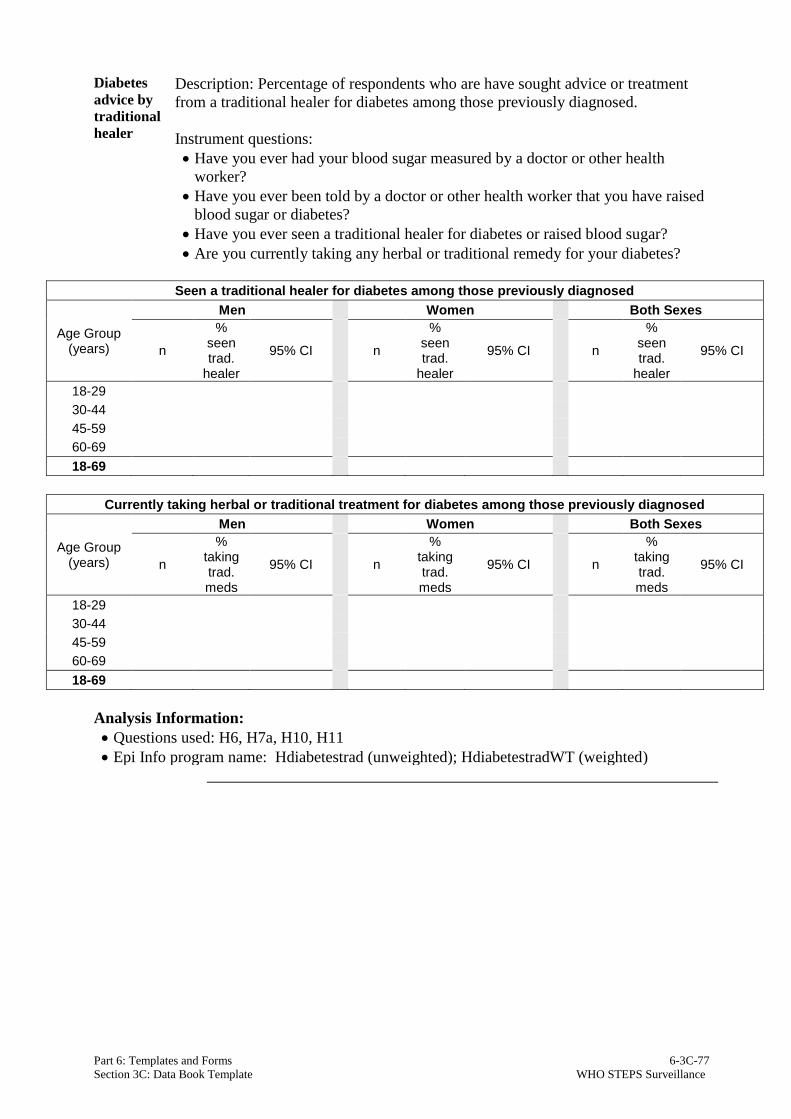
Part 6: Templates and Forms 6-3C-77
Section 3C: Data Book Template WHO STEPS Surveillance
Diabetes
advice by
traditional
healer
Description: Percentage of respondents who are have sought advice or treatment
from a traditional healer for diabetes among those previously diagnosed.
Instrument questions:
• Have you ever had your blood sugar measured by a doctor or other health
worker?
• Have you ever been told by a doctor or other health worker that you have raised
blood sugar or diabetes?
• Have you ever seen a traditional healer for diabetes or raised blood sugar?
• Are you currently taking any herbal or traditional remedy for your diabetes?
Seen a traditional healer for diabetes among those previously diagnosed
Age Group (years)
Men Women Both Sexes
n
% seen trad.
healer
95% CI n
% seen trad.
healer
95% CI n
% seen trad.
healer
95% CI
18-29
30-44
45-59
60-69
18-69
Currently taking herbal or traditional treatment for diabetes among those previously diagnosed
Age Group (years)
Men Women Both Sexes
n
% taking trad. meds
95% CI n
% taking trad. meds
95% CI n
% taking trad. meds
95% CI
18-29
30-44
45-59
60-69
18-69
Analysis Information:
• Questions used: H6, H7a, H10, H11
• Epi Info program name: Hdiabetestrad (unweighted); HdiabetestradWT (weighted)

Part 6: Templates and Forms 6-3C-78
Section 3C: Data Book Template WHO STEPS Surveillance
History of Raised Total Cholesterol
Cholesterol
measurement
and
diagnosis
Description: Total cholesterol measurement and diagnosis among all respondents.
Instrument questions:
• Have you ever had your cholesterol (fat levels in your blood) measured by a
doctor or other health worker?
• Have you ever been told by a doctor or other health worker that you have
raised cholesterol?
• Have you been told in the past 12 months?
Total cholesterol measurement and diagnosis
Age Group (years)
Men
n % Never
measured 95% CI
% measured,
not diagnosed
95% CI
% diagnosed,
but not within past 12 months
95% CI
% diagnosed within past 12 months
95% CI
18-29
30-44
45-59
60-69
18-69
Total cholesterol measurement and diagnosis
Age Group (years)
Women
n % Never
measured 95% CI
% measured,
not diagnosed
95% CI
% diagnosed,
but not within past 12 months
95% CI
% diagnosed within past 12 months
95% CI
18-29
30-44
45-59
60-69
18-69
Total cholesterol measurement and diagnosis
Age Group (years)
Both sexes
n % Never
measured 95% CI
% measured,
not diagnosed
95% CI
% diagnosed,
but not within past 12 months
95% CI
% diagnosed within past 12 months
95% CI
18-29
30-44
45-59
60-69
18-69
Analysis Information:
• Questions used: H12, H13a, H13b
• Epi Info program name: Hchol (unweighted); HcholWT (weighted)

Part 6: Templates and Forms 6-3C-79
Section 3C: Data Book Template WHO STEPS Surveillance
Cholesterol
treatment
among
those
diagnosed
Description: Cholesterol treatment results among those previously diagnosed with
raised cholesterol.
Instrument questions:
• Have you ever had your cholesterol (fat levels in your blood) measured by a
doctor or other health worker?
• Have you ever been told by a doctor or other health worker that you have raised
cholesterol?
• In the past two weeks, have you taken oral treatment (medication) for raised
total cholesterol prescribed by a doctor or other health worker?
Currently taking oral treatment (medication) prescribed for raised total cholesterol among those previously
diagnosed
Age Group (years)
Men Women Both Sexes
n % taking
meds 95% CI n
% taking meds
95% CI n % taking
meds 95% CI
18-29
30-44
45-59
60-69
18-69
Analysis Information:
• Questions used: H12, H13a, H14
• Epi Info program name: Hchol (unweighted); HcholWT (weighted)

Part 6: Templates and Forms 6-3C-80
Section 3C: Data Book Template WHO STEPS Surveillance
Cholesterol
advice by
traditional
healer
Description: Percentage of respondents who are have sought advice or treatment
from a traditional healer for raised cholesterol among those previously diagnosed.
Instrument questions:
• Have you ever had your cholesterol (fat levels in your blood) measured by a
doctor or other health worker?
• Have you ever been told by a doctor or other health worker that you have raised
cholesterol?
• Have you ever seen a traditional healer for raised cholesterol?
• Are you currently taking any herbal or traditional remedy for your raised
cholesterol?
Seen a traditional healer for raised cholesterol among those previously diagnosed
Age Group (years)
Men Women Both Sexes
n
% seen trad.
healer
95% CI n
% seen trad.
healer
95% CI n
% seen trad.
healer
95% CI
18-29
30-44
45-59
60-69
18-69
Currently taking herbal or traditional treatment for raised cholesterol among those previously diagnosed
Age Group (years)
Men Women Both Sexes
n
% taking trad. meds
95% CI n
% taking trad. meds
95% CI n
% taking trad. meds
95% CI
18-29
30-44
45-59
60-69
18-69
Analysis Information:
• Questions used: H12, H13a, H15, H16
• Epi Info program name: Hcholtrad (unweighted); HcholtradWT (weighted)

Part 6: Templates and Forms 6-3C-81
Section 3C: Data Book Template WHO STEPS Surveillance
History of Cardiovascular Diseases
History of
cardio-
vascular
diseases
Description: Percentage of respondents who have ever had a heart attack or chest
pain from heart disease (angina) or a stroke among all respondents.
Instrument questions:
• Have you ever had a heart attack or chest pain from heart disease (angina) or a
stroke (cerebrovascular accident or incident)?
Having ever had a heart attack or chest pain from heart disease or a stroke
Age Group (years)
Men Women Both Sexes
n %
CVD history
95% CI n %
CVD history
95% CI n %
CVD history
95% CI
18-29
30-44
45-59
60-69
18-69
Analysis Information:
• Question used: H17
• Epi Info program name: Hcvd (unweighted); HcvdWT (weighted)

Part 6: Templates and Forms 6-3C-82
Section 3C: Data Book Template WHO STEPS Surveillance
Prevention
and
treatment
of heart
disease
Description: Percentage of respondents who are currently taking aspirin or statins
regularly to prevent or treat heart disease.
Instrument questions:
• Are you currently taking aspirin regularly to prevent or treat heart disease?
• Are you currently taking statins (Lovostatin/Simvastatin/Atorvastatin or any
other statin) regularly to prevent or treat heart disease?
Currently taking aspirin regularly to prevent or treat heart disease
Age Group (years)
Men Women Both Sexes
n % taking aspirin
95% CI n % taking aspirin
95% CI n % taking aspirin
95% CI
18-29
30-44
45-59
60-69
18-69
Currently taking statins regularly to prevent or treat heart disease
Age Group (years)
Men Women Both Sexes
n % taking statins
95% CI n % taking statins
95% CI n % taking statins
95% CI
18-29
30-44
45-59
60-69
18-69
Analysis Information:
• Questions used: H18, H19
• Epi Info program name: Hcvdmeds (unweighted); HcvdmedsWT (weighted)

Part 6: Templates and Forms 6-3C-83
Section 3C: Data Book Template WHO STEPS Surveillance
Lifestyle Advice
Lifestyle
advice Description: Percentage of respondents who received lifestyle advice from a doctor
or health worker during the past three years among all respondents.
Instrument question:
• During the past three years, has a doctor or other health worker advised you to do
any of the following?
Advised by doctor or health worker to quit using tobacco or don’t start
Age Group (years)
Men Women Both Sexes
n %
advised 95% CI n
% advised
95% CI n %
advised 95% CI
18-29
30-44
45-59
60-69
18-69
Advised by doctor or health worker to reduce salt in the diet
Age Group (years)
Men Women Both Sexes
n %
advised 95% CI n
% advised
95% CI n %
advised 95% CI
18-29
30-44
45-59
60-69
18-69
Advised by doctor or health worker to eat at least five servings of fruit and/or vegetables each day
Age Group (years)
Men Women Both Sexes
n %
advised 95% CI n
% advised
95% CI n %
advised 95% CI
18-29
30-44
45-59
60-69
18-69
Advised by doctor or health worker to reduce fat in the diet
Age Group (years)
Men Women Both Sexes
n %
advised 95% CI n
% advised
95% CI n %
advised 95% CI
18-29
30-44
45-59
60-69
18-69

Part 6: Templates and Forms 6-3C-84
Section 3C: Data Book Template WHO STEPS Surveillance
Advised by doctor or health worker to start or do more physical activity
Age Group (years)
Men Women Both Sexes
n %
advised 95% CI n
% advised
95% CI n %
advised 95% CI
18-29
30-44
45-59
60-69
18-69
Advised by doctor or health worker to maintain a healthy body weight or to lose weight
Age Group (years)
Men Women Both Sexes
n %
advised 95% CI n
% advised
95% CI n %
advised 95% CI
18-29
30-44
45-59
60-69
18-69
Analysis Information:
• Questions used: H20a-f
• Epi Info program name: Hlifestyle (unweighted); HlifestyleWT (weighted)
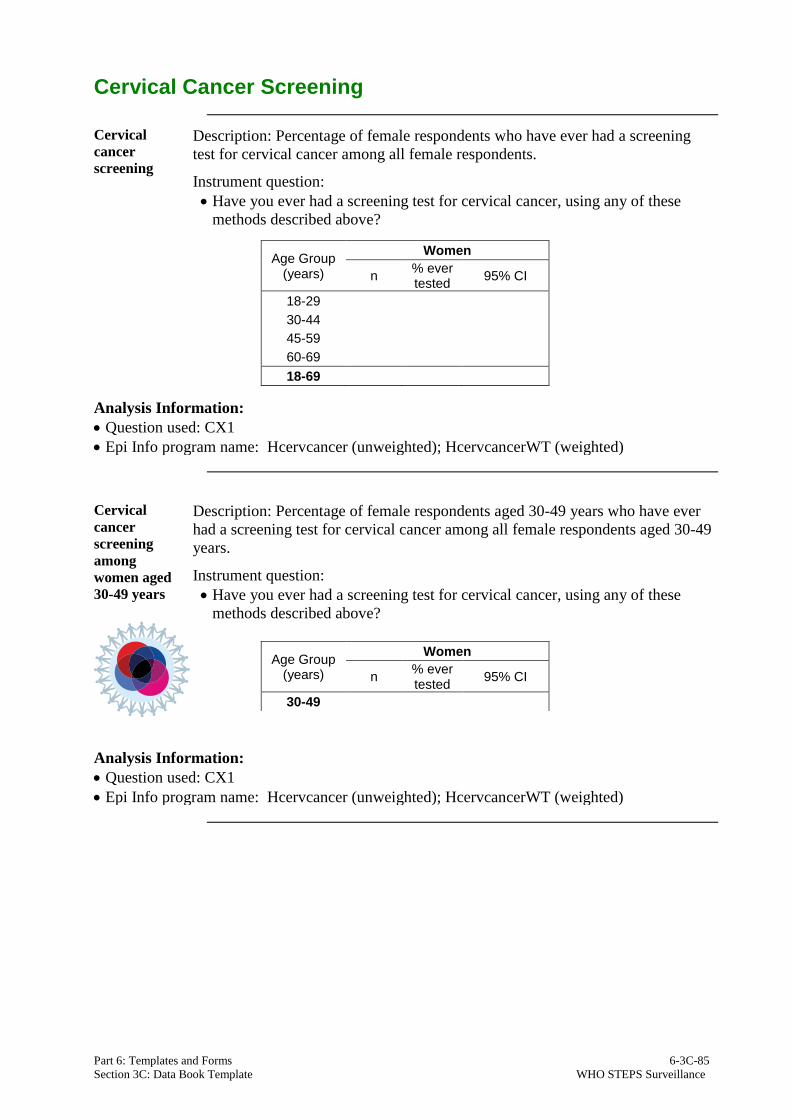
Part 6: Templates and Forms 6-3C-85
Section 3C: Data Book Template WHO STEPS Surveillance
Cervical Cancer Screening
Cervical
cancer
screening
Description: Percentage of female respondents who have ever had a screening
test for cervical cancer among all female respondents.
Instrument question:
• Have you ever had a screening test for cervical cancer, using any of these
methods described above?
Age Group (years)
Women
n % ever tested
95% CI
18-29
30-44
45-59
60-69
18-69
Analysis Information:
• Question used: CX1
• Epi Info program name: Hcervcancer (unweighted); HcervcancerWT (weighted)
Cervical
cancer
screening
among
women aged
30-49 years
Description: Percentage of female respondents aged 30-49 years who have ever
had a screening test for cervical cancer among all female respondents aged 30-49
years.
Instrument question:
• Have you ever had a screening test for cervical cancer, using any of these
methods described above?
Analysis Information:
• Question used: CX1
• Epi Info program name: Hcervcancer (unweighted); HcervcancerWT (weighted)
Age Group (years)
Women
n % ever tested
95% CI
30-49

Part 6: Templates and Forms 6-3C-86
Section 3C: Data Book Template WHO STEPS Surveillance
Physical Measurements
Blood pressure
Description: Mean blood pressure among all respondents, including those
currently on medication for raised blood pressure.
Instrument question:
• Reading 1-3 systolic and diastolic blood pressure
Mean systolic blood pressure (mmHg)
Age Group (years)
Men Women Both Sexes
n Mean 95% CI n Mean 95% CI n Mean 95% CI
18-29
30-44
45-59
60-69
18-69
Mean diastolic blood pressure (mmHg)
Age Group (years)
Men Women Both Sexes
n Mean 95% CI n Mean 95% CI n Mean 95% CI
18-29
30-44
45-59
60-69
18-69
Analysis Information:
• Questions used: M4a, M4b, M5a, M5b, M6a, M6b
• Epi Info program name: Mbloodpressure (unweighted); MbloodpressureWT (weighted)

Part 6: Templates and Forms 6-3C-87
Section 3C: Data Book Template WHO STEPS Surveillance
Raised blood
pressure
Description: Percentage of respondents with raised blood pressure.
Instrument question:
• Reading 1-3 systolic and diastolic blood pressure
• During the past two weeks, have you been treated for raised blood pressure
with drugs (medication) prescribed by a doctor or other health worker?
SBP ≥140 and/or DBP ≥ 90 mmHg
Age Group (years)
Men Women Both Sexes
n % 95% CI n % 95% CI n % 95% CI
18-29
30-44
45-59
60-69
18-69
SBP ≥160 and/or DBP ≥ 100 mmHg
Age Group (years)
Men Women Both Sexes
n % 95% CI n % 95% CI n % 95% CI
18-29
30-44
45-59
60-69
18-69
SBP ≥140 and/or DBP ≥ 90 mmHg or currently on medication for raised blood pressure
Age Group (years)
Men Women Both Sexes
n % 95% CI n % 95% CI n % 95% CI
18-29
30-44
45-59
60-69
18-69
SBP ≥160 and/or DBP ≥ 100 mmHg or currently on medication for raised blood pressure
Age Group (years)
Men Women Both Sexes
n % 95% CI n % 95% CI n % 95% CI
18-29
30-44
45-59
60-69
18-69
Analysis Information:
• Questions used: H1, H2a, H3, M4a, M4b, M5a, M5b, M6a, M6b, M7
• Epi Info program name: Mraisedbp (unweighted); MraisedbpWT (weighted)

Part 6: Templates and Forms 6-3C-88
Section 3C: Data Book Template WHO STEPS Surveillance
Blood
pressure
diagnosis,
treatment
and control
Description: Raised blood pressure diagnosis, treatment and control among those
with raised blood pressure (SBP ≥ 140 and/or DBP ≥ 90 mmHg) or on
medication for raised blood pressure.
Instrument questions:
• Have you ever had your blood pressure measured by a doctor or other health
worker?
• Have you ever been told by a doctor or other health worker that you have
raised blood pressure or hypertension?
• During the past two weeks, have you been treated for raised blood pressure
with drugs (medication) prescribed by a doctor or other health worker?
• Reading 1-3 systolic and diastolic blood pressure
Raised blood pressure diagnosis, treatment and control among those with raised blood pressure (SBP ≥ 140
and/or DBP ≥ 90 mmHg) or on medication for raised blood pressure
Age Group (years)
Men
n
% with raised blood
pressure, not
previously diagnosed
95% CI
% with previously diagnosed
raised blood
pressure, not on
medication
95% CI
% with previously diagnosed
raised blood
pressure, on
medication but not
controlled
95% CI
% with previously diagnosed
raised blood
pressure, on
medication and blood pressure controlled
95% CI
18-29
30-44
45-59
60-69
18-69
Raised blood pressure diagnosis, treatment and control among those with raised blood pressure (SBP ≥ 140
and/or DBP ≥ 90 mmHg) or on medication for raised blood pressure
Age Group (years)
Women
n
% with raised blood
pressure, not
previously diagnosed
95% CI
% with previously diagnosed
raised blood
pressure, not on
medication
95% CI
% with previously diagnosed
raised blood
pressure, on
medication but not
controlled
95% CI
% with previously diagnosed
raised blood
pressure, on
medication and blood pressure controlled
95% CI
18-29
30-44
45-59
60-69
18-69
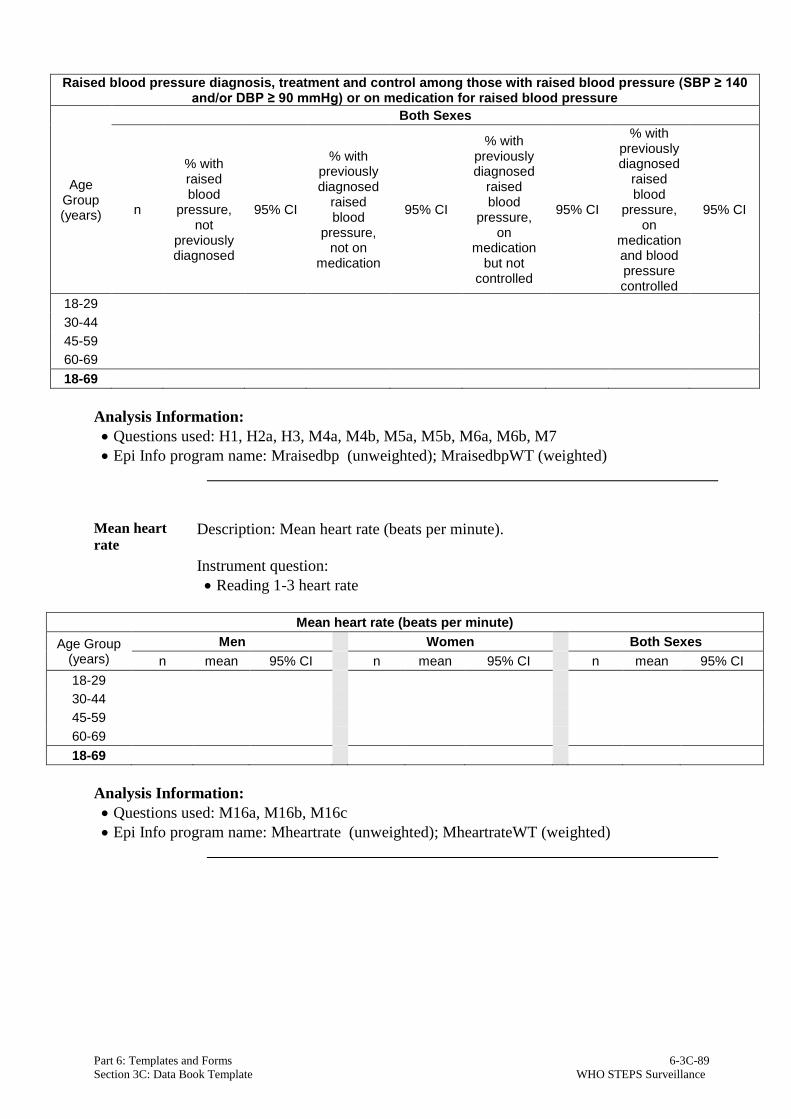
Part 6: Templates and Forms 6-3C-89
Section 3C: Data Book Template WHO STEPS Surveillance
Raised blood pressure diagnosis, treatment and control among those with raised blood pressure (SBP ≥ 140 and/or DBP ≥ 90 mmHg) or on medication for raised blood pressure
Age Group (years)
Both Sexes
n
% with raised blood
pressure, not
previously diagnosed
95% CI
% with previously diagnosed
raised blood
pressure, not on
medication
95% CI
% with previously diagnosed
raised blood
pressure, on
medication but not
controlled
95% CI
% with previously diagnosed
raised blood
pressure, on
medication and blood pressure controlled
95% CI
18-29
30-44
45-59
60-69
18-69
Analysis Information:
• Questions used: H1, H2a, H3, M4a, M4b, M5a, M5b, M6a, M6b, M7
• Epi Info program name: Mraisedbp (unweighted); MraisedbpWT (weighted)
Mean heart
rate Description: Mean heart rate (beats per minute).
Instrument question:
• Reading 1-3 heart rate
Mean heart rate (beats per minute)
Age Group (years)
Men Women Both Sexes
n mean 95% CI n mean 95% CI n mean 95% CI
18-29
30-44
45-59
60-69
18-69
Analysis Information:
• Questions used: M16a, M16b, M16c
• Epi Info program name: Mheartrate (unweighted); MheartrateWT (weighted)

Part 6: Templates and Forms 6-3C-90
Section 3C: Data Book Template WHO STEPS Surveillance
Height,
weight
and BMI
Description: Mean height, weight, and body mass index among all respondents
(excluding pregnant women).
Instrument questions:
• For women: Are you pregnant?
• Height
• Weight
Mean height (cm)
Age Group (years)
Men Women
n Mean 95% CI n Mean 95% CI
18-29
30-44
45-59
60-69
18-69
Mean weight (kg)
Age Group (years)
Men Women
n Mean 95% CI n Mean 95% CI
18-29
30-44
45-59
60-69
18-69
Mean BMI (kg/m2)
Age Group (years)
Men Women Both Sexes
n Mean 95% CI n Mean 95% CI n Mean 95% CI
18-29
30-44
45-59
60-69
18-69
Analysis Information:
• Questions used: M8, M11, M12
• Epi Info program name: Mbmi (unweighted); MbmiWT (weighted)

Part 6: Templates and Forms 6-3C-91
Section 3C: Data Book Template WHO STEPS Surveillance
BMI categories
Description: Percentage of respondents (excluding pregnant women) in each
BMI category.
Instrument questions:
• For women: Are you pregnant?
• Height
• Weight
BMI classifications
Age Group (years)
Men
n % Under-
weight <18.5
95% CI % Normal
weight 18.5-24.9
95% CI % BMI
25.0-29.9 95% CI
% Obese ≥30.0
95% CI
18-29
30-44
45-59
60-69
18-69
BMI classifications
Age Group (years)
Women
n % Under-
weight <18.5
95% CI % Normal
weight 18.5-24.9
95% CI % BMI
25.0-29.9 95% CI
% Obese ≥30.0
95% CI
18-29
30-44
45-59
60-69
18-69
BMI classifications
Age Group (years)
Both Sexes
n % Under-
weight <18.5
95% CI % Normal
weight 18.5-24.9
95% CI % BMI
25.0-29.9 95% CI
% Obese ≥30.0
95% CI
18-29
30-44
45-59
60-69
18-69
Analysis Information:
• Questions used: M8, M11, M12
• Epi Info program name: Mbmiclass (unweighted); MbmiclassWT (weighted)

Part 6: Templates and Forms 6-3C-92
Section 3C: Data Book Template WHO STEPS Surveillance
BMI ≥25
Description: Percentage of respondents (excluding pregnant women) classified
as overweight (BMI≥25).
Instrument questions:
• For women: Are you pregnant?
• Height
• Weight
BMI≥25
Age Group (years)
Men Women Both Sexes
n %
BMI≥25 95% CI n
% BMI≥25
95% CI n %
BMI≥25 95% CI
18-29
30-44
45-59
60-69
18-69
Analysis Information:
• Questions used: M8, M11, M12
• Epi Info program name: Mbmiclass (unweighted); MbmiclassWT (weighted)

Part 6: Templates and Forms 6-3C-93
Section 3C: Data Book Template WHO STEPS Surveillance
Waist
circumference Description: Mean waist circumference among all respondents (excluding
pregnant women).
Instrument questions:
• For women: Are you pregnant?
• Waist circumference measurement
Waist circumference (cm)
Age Group (years)
Men Women
n Mean 95% CI n Mean 95% CI
18-29
30-44
45-59
60-69
18-69
Analysis Information:
• Questions used: M8, M14
• Epi Info program name: Mwaist (unweighted); MwaistWT (weighted)
Hip
circumference Description: Mean hip circumference among all respondents (excluding
pregnant women).
Instrument questions:
• For women: Are you pregnant?
• Hip circumference measurement
Hip circumference (cm)
Age Group (years)
Men Women
n Mean 95% CI n Mean 95% CI
18-29
30-44
45-59
60-69
18-69
Analysis Information:
• Questions used: M8, M15
• Epi Info program name: Mhip (unweighted); MhipWT (weighted)

Part 6: Templates and Forms 6-3C-94
Section 3C: Data Book Template WHO STEPS Surveillance
Waist /
hip ratio Description: Mean waist-to-hip ratio among all respondents (excluding pregnant
women).
Instrument questions:
• For women: Are you pregnant?
• Waist circumference measurement
• Hip circumference measurement
Mean waist / hip ratio
Age Group (years)
Men Women
n Mean 95% CI n Mean 95% CI
18-29
30-44
45-59
60-69
18-69
Analysis Information:
• Questions used: M8, M14, M15
• Epi Info program name: Mwaisthipratio (unweighted); MwaisthipratioWT (weighted)

Part 6: Templates and Forms 6-3C-95
Section 3C: Data Book Template WHO STEPS Surveillance
Biochemical Measurements
Mean
fasting
blood
glucose
Description: mean fasting blood glucose results including those currently on
medication for diabetes (non-fasting recipients excluded).
Instrument questions:
• During the last 12 hours have you had anything to eat or drink, other than
water?
• Blood glucose measurement
Mean fasting blood glucose (mmol/L)
Age Group (years)
Men Women Both Sexes
n Mean 95% CI n Mean 95% CI n Mean 95% CI
18-29
30-44
45-59
60-69
18-69
Mean fasting blood glucose (mg/dl)
Age Group (years)
Men Women Both Sexes
n Mean 95% CI n Mean 95% CI n Mean 95% CI
18-29
30-44
45-59
60-69
18-69
Analysis Information:
• Questions used: B1, B5
• Epi Info program name:
• measurement in mmol/L: Bglucose (unweighted); BglucoseWT (weighted)
• measurement in mg/dl: BglucoseMg (unweighted); BglucoseMgWT (weighted)

Part 6: Templates and Forms 6-3C-96
Section 3C: Data Book Template WHO STEPS Surveillance
Raised blood
glucose
Description: Categorization of respondents into blood glucose level categories
and percentage of respondents currently on medication for raised blood glucose
(non-fasting recipients excluded).
Instrument questions:
• In the past two weeks, have you taken any drugs (medication) for diabetes
prescribed by a doctor or other health worker?
• Are you currently taking insulin for diabetes prescribed by a doctor or other
health worker?
• During the last 12 hours have you had anything to eat or drink, other than
water?
• Blood glucose measurement
• Today, have you taken insulin or other drugs (medication) that have been
prescribed by a doctor or other health worker?
Impaired Fasting Glycaemia*
Age Group (years)
Men Women Both Sexes
n % 95% CI n % 95% CI n % 95% CI
18-29
30-44
45-59
60-69
18-69
Raised blood glucose or currently on medication for diabetes**
Age Group (years)
Men Women Both Sexes
n % 95% CI n % 95% CI n % 95% CI
18-29
30-44
45-59
60-69
18-69
Currently on medication for diabetes
Age Group (years)
Men Women Both Sexes
n % 95% CI n % 95% CI n % 95% CI
18-29
30-44
45-59
60-69
18-69
Analysis Information:
• Questions used: H8, H9, B1, B5, B6
Epi Info program name:
• measurement in mmol/L: Bglucose (unweighted); BglucoseWT (weighted)
• measurement in mg/dl: BglucoseMg (unweighted); BglucoseMgWT (weighted)
* Impaired fasting glycaemia is defined as either
• plasma venous value: ≥6.1mmol/L (110mg/dl) and <7.0mmol/L (126mg/dl)
• capillary whole blood value: ≥5.6mmol/L (100mg/dl) and <6.1mmol/L (110mg/dl)
** Raised blood glucose is defined as either
• plasma venous value: ≥ 7.0 mmol/L (126 mg/dl)
• capillary whole blood value: ≥ 6.1 mmol/L (110 mg/dl)

Part 6: Templates and Forms 6-3C-97
Section 3C: Data Book Template WHO STEPS Surveillance
Blood glucose
diagnosis and
treatment
Description: Raised blood glucose diagnosis and treatment among all
respondents.
Instrument questions:
• Have you ever had your blood sugar measured by a doctor or other health
worker?
• Have you ever been told by a doctor or other health worker that you have
raised blood sugar or diabetes?
• In the past two weeks, have you taken any drugs (medication) for diabetes
prescribed by a doctor or other health worker?
• Are you currently taking insulin for diabetes prescribed by a doctor or other
health worker?
• During the last 12 hours have you had anything to eat or drink, other than
water?
• Blood glucose measurement
• Today, have you taken insulin or other drugs (medication) that have been
prescribed by a doctor or other health worker?
Raised blood glucose diagnosis and treatment among all respondents
Age Group (years)
Men
n
% with raised blood
glucose, not
previously diagnosed
95% CI
% with previously diagnosed
raised blood
glucose, not on
medication
95% CI
% with previously diagnosed
raised blood
glucose, on
medication
95% CI
18-29
30-44
45-59
60-69
18-69
Raised blood glucose diagnosis and treatment among all respondents
Age Group (years)
Women
n
% with raised blood
glucose, not
previously diagnosed
95% CI
% with previously diagnosed
raised blood
glucose, not on
medication
95% CI
% with previously diagnosed
raised blood
glucose, on
medication
95% CI
18-29
30-44
45-59
60-69
18-69

Part 6: Templates and Forms 6-3C-98
Section 3C: Data Book Template WHO STEPS Surveillance
Raised blood glucose diagnosis and treatment among all respondents
Age Group (years)
Both Sexes
n
% with raised blood
glucose, not
previously diagnosed
95% CI
% with previously diagnosed
raised blood
glucose, not on
medication
95% CI
% with previously diagnosed
raised blood
glucose, on
medication
95% CI
18-29
30-44
45-59
60-69
18-69
Analysis Information:
• Questions used: H6, H7a, H8, H9, B1, B5, B6
• Epi Info program name:
• measurement in mmol/L: Bglucose (unweighted); BglucoseWT (weighted)
• measurement in mg/dl: BglucoseMg (unweighted); BglucoseMgWT (weighted)

Part 6: Templates and Forms 6-3C-99
Section 3C: Data Book Template WHO STEPS Surveillance
Total
cholesterol
Description: Mean total cholesterol among all respondents including those
currently on medication for raised cholesterol.
Instrument question:
• Total cholesterol measurement
Mean total cholesterol (mmol/L)
Age Group (years)
Men Women Both Sexes
n Mean 95% CI n Mean 95% CI n Mean 95% CI
18-29
30-44
45-59
60-69
18-69
Mean total cholesterol (mg/dl)
Age Group (years)
Men Women Both Sexes
n Mean 95% CI n Mean 95% CI n Mean 95% CI
18-29
30-44
45-59
60-69
18-69
Analysis Information:
• Questions used: B8
• Epi Info program name:
• measurement in mmol/L: Btotallipids (unweighted); BtotallipidsWT (weighted)
• measurement in mg/dl: BtotallipidsMg (unweighted); BtotallipidsMgWT (weighted)

Part 6: Templates and Forms 6-3C-100
Section 3C: Data Book Template WHO STEPS Surveillance
Raised total
cholesterol
Description: Percentage of respondents with raised total cholesterol.
Instrument questions:
• Total cholesterol measurement
Total cholesterol ≥ 5.0 mmol/L or ≥ 190 mg/dl
Age Group (years)
Men Women Both Sexes
n % 95% CI n % 95% CI n % 95% CI
18-29
30-44
45-59
60-69
18-69
Total cholesterol ≥ 6.2 mmol/L or ≥ 240 mg/dl
Age Group (years)
Men Women Both Sexes
n % 95% CI n % 95% CI n % 95% CI
18-29
30-44
45-59
60-69
18-69
Analysis Information:
• Questions used: B8
• Epi Info program name:
• measurement in mmol/L: Btotallipids (unweighted); BtotallipidsWT (weighted)
• measurement in mg/dl: BtotallipidsMg (unweighted); BtotallipidsMgWT (weighted)

Part 6: Templates and Forms 6-3C-101
Section 3C: Data Book Template WHO STEPS Surveillance
Raised
total
cholesterol
Description: Percentage of respondents with raised total cholesterol and percentage
of respondents currently on medication for raised cholesterol.
Instrument questions:
• Total cholesterol measurement
• During the past two weeks, have you been treated for raised cholesterol with
drugs (medication) prescribed by a doctor or other health worker?
Total cholesterol ≥ 5.0 mmol/L or ≥ 190 mg/dl or currently on medication for raised cholesterol
Age Group (years)
Men Women Both Sexes
n % 95% CI n % 95% CI n % 95% CI
18-29
30-44
45-59
60-69
18-69
Total cholesterol ≥ 6.2 mmol/L or ≥ 240 mg/dl or currently on medication for raised cholesterol
Age Group (years)
Men Women Both Sexes
n % 95% CI n % 95% CI n % 95% CI
18-29
30-44
45-59
60-69
18-69
Analysis Information:
• Questions used: B8, B9
• Epi Info program name:
• measurement in mmol/L: Btotallipids (unweighted); BtotallipidsWT (weighted)
• measurement in mg/dl: BtotallipidsMg (unweighted); BtotallipidsMgWT (weighted)

Part 6: Templates and Forms 6-3C-102
Section 3C: Data Book Template WHO STEPS Surveillance
Introduction
to intake of
salt per day
Levels of sodium and creatinine in spot urine samples are used in STEPS to
estimate population 24 hour salt intake, using the INTERSALT equation:
Estimated 24 hour sodium (Na) intake in mmol for males: 23.51+0.45*spot Na
concentration (mmol/L) -3.09*spot creatinine concentration
(mmol/L)+4.16*BMI+0.22*Age
Estimated 24 hour sodium (Na) intake in mmol for females: 3.74+0.33* spot Na
concentration (mmol/L)-2.44* spot creatinine concentration (mmol/L)+2.42* BMI
+2.34* Age -0.03* Age ^2
The 24 hour sodium values in mmol are divided by 17.1 in order to get grams of salt.
WHO
recommen-
dation
The WHO recommendation is less than 5 grams of salt or 2 grams of sodium per
person per day.
Intake of salt
per day
Description: Mean intake of salt in grams per day among all respondents
Instrument question:
• Are you pregnant?
• Had you been fasting prior to urine collection?
• Urinary sodium measurement
• Urinary creatinine measurement
Mean salt intake (g/day)
Age Group (years)
Men Women Both Sexes
n Mean 95% CI n Mean 95% CI n Mean 95% CI
18-29
30-44
45-59
60-69
18-69
Analysis Information:
• Questions used: M8, B10, B14, B15
• Epi Info program name: Bsalt (unweighted); BsaltWT (weighted)

Part 6: Templates and Forms 6-3C-103
Section 3C: Data Book Template WHO STEPS Surveillance
Mean HDL (mmol/L)
Age Group (years)
Men Women Both Sexes
n Mean 95% CI n Mean 95% CI n Mean 95% CI
18-29
30-44
45-59
60-69
18-69
Mean HDL (mg/dl)
Age Group (years)
Men Women Both Sexes
n Mean 95% CI n Mean 95% CI n Mean 95% CI
18-29
30-44
45-59
60-69
18-69
Percentage of respondents with HDL
<1.03mmol/L or <40 mg/dl
Age Group (years)
Men
n % 95% CI
18-29
30-44
45-59
60-69
18-69
Analysis Information:
• Questions used: B16
• Epi Info program name:
• measurement in mmol/L: Bhdlipids (unweighted); BhdlipidsWT (weighted)
• measurement in mg/dl: BhdlipidsMg (unweighted); BhdlipidsMgWT (weighted)
High
density
lipoprotein
(HDL)
Description: Mean HDL among all respondents and percentage of respondents with
low HDL.
Instrument question:
• HDL cholesterol measurement
Percentage of respondents with HDL <1.29mmol/L or <50 mg/dl
Age Group (years)
Women
n % 95% CI
18-29
30-44
45-59
60-69
18-69

Part 6: Templates and Forms 6-3C-104
Section 3C: Data Book Template WHO STEPS Surveillance
Triglycerides Description: Mean fasting triglycerides among all respondents and percentage of
respondents with raised fasting triglycerides (non-fasting recipients excluded).
Instrument questions:
• During the last 12 hours have you had anything to eat or drink, other than
water?
• Triglyceride measurement
Mean fasting triglycerides (mmol/L)
Age Group (years)
Men Women Both Sexes
n Mean 95% CI n Mean 95% CI n Mean 95% CI
18-29
30-44
45-59
60-69
18-69
Mean fasting triglycerides (mg/dl)
Age Group (years)
Men Women Both Sexes
n Mean 95% CI n Mean 95% CI n Mean 95% CI
18-29
30-44
45-59
60-69
18-69
Percentage of respondents with fasting triglycerides ≥ 1.7 mmol/L or ≥ 150 mg/dl
Age Group (years)
Men Women Both Sexes
n % 95% CI n % 95% CI n % 95% CI
18-29
30-44
45-59
60-69
18-69
Percentage of respondents with fasting triglycerides ≥ 2.0 mmol/L or ≥ 180 mg/dl
Age Group (years)
Men Women Both Sexes
n % 95% CI n % 95% CI n % 95% CI
18-29
30-44
45-59
60-69
18-69
Analysis Information:
• Questions used: B1, B17
• Epi Info program name:
• measurement in mmol/L: Btriglyceride (unweighted); BtriglycerideWT (weighted)
• measurement in mg/dl: BtriglycerideMg (unweighted); BtriglycerideMgWT
(weighted)

Part 6: Templates and Forms 6-3C-105
Section 3C: Data Book Template WHO STEPS Surveillance
Cardiovascular disease risk
CVD risk of
≥30% or
existing
CVD
Description: Percentage of respondents aged 40-69 years with a 10-year
cardiovascular disease (CVD) risk* ≥30% or with existing CVD
Instrument questions: combined from Step 1, 2 and 3
• Gender, age
• Current and former smoking
• History of diabetes, CVD
• Systolic blood pressure measurements
• Fasting status, glucose and total cholesterol measurements.
Percentage of respondents with a 10-year CVD risk ≥30% or with existing CVD
Age Group (years)
Men Women Both Sexes
n % 95% CI n % 95% CI n % 95% CI
40-54
55-69
40-69
Analysis Information:
• Questions used: C1, C2, C3, T1, T8T10, T11a-c, H6, H7a, H17, M4a, M5a, M6a, M7, B1, B5,
B8
• Epi Info program name: CVDrisk (unweighted); CVDriskWT (weighted)
* A 10-year CVD risk of ≥30% is defined according to age, sex, blood pressure, smoking status (current smokers OR those
who quit smoking less than 1 year before the assessment), total cholesterol, and diabetes (previously diagnosed OR a fasting
plasma glucose concentration >7.0 mmol/l (126 mg/dl)).
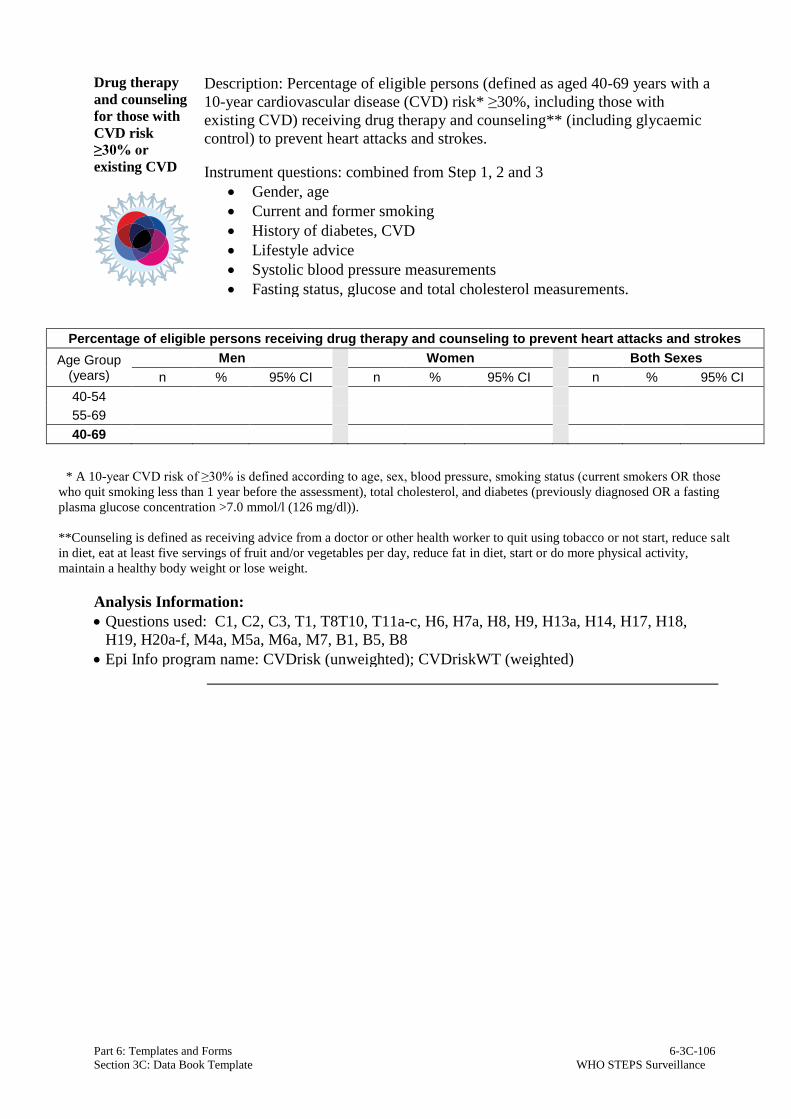
Part 6: Templates and Forms 6-3C-106
Section 3C: Data Book Template WHO STEPS Surveillance
Drug therapy
and counseling
for those with
CVD risk
≥30% or
existing CVD
Description: Percentage of eligible persons (defined as aged 40-69 years with a
10-year cardiovascular disease (CVD) risk* ≥30%, including those with
existing CVD) receiving drug therapy and counseling** (including glycaemic
control) to prevent heart attacks and strokes.
Instrument questions: combined from Step 1, 2 and 3
• Gender, age
• Current and former smoking
• History of diabetes, CVD
• Lifestyle advice
• Systolic blood pressure measurements
• Fasting status, glucose and total cholesterol measurements.
Percentage of eligible persons receiving drug therapy and counseling to prevent heart attacks and strokes
Age Group (years)
Men Women Both Sexes
n % 95% CI n % 95% CI n % 95% CI
40-54
55-69
40-69
Analysis Information:
• Questions used: C1, C2, C3, T1, T8T10, T11a-c, H6, H7a, H8, H9, H13a, H14, H17, H18,
H19, H20a-f, M4a, M5a, M6a, M7, B1, B5, B8
• Epi Info program name: CVDrisk (unweighted); CVDriskWT (weighted)
* A 10-year CVD risk of ≥30% is defined according to age, sex, blood pressure, smoking status (current smokers OR those
who quit smoking less than 1 year before the assessment), total cholesterol, and diabetes (previously diagnosed OR a fasting
plasma glucose concentration >7.0 mmol/l (126 mg/dl)).
**Counseling is defined as receiving advice from a doctor or other health worker to quit using tobacco or not start, reduce salt
in diet, eat at least five servings of fruit and/or vegetables per day, reduce fat in diet, start or do more physical activity,
maintain a healthy body weight or lose weight.
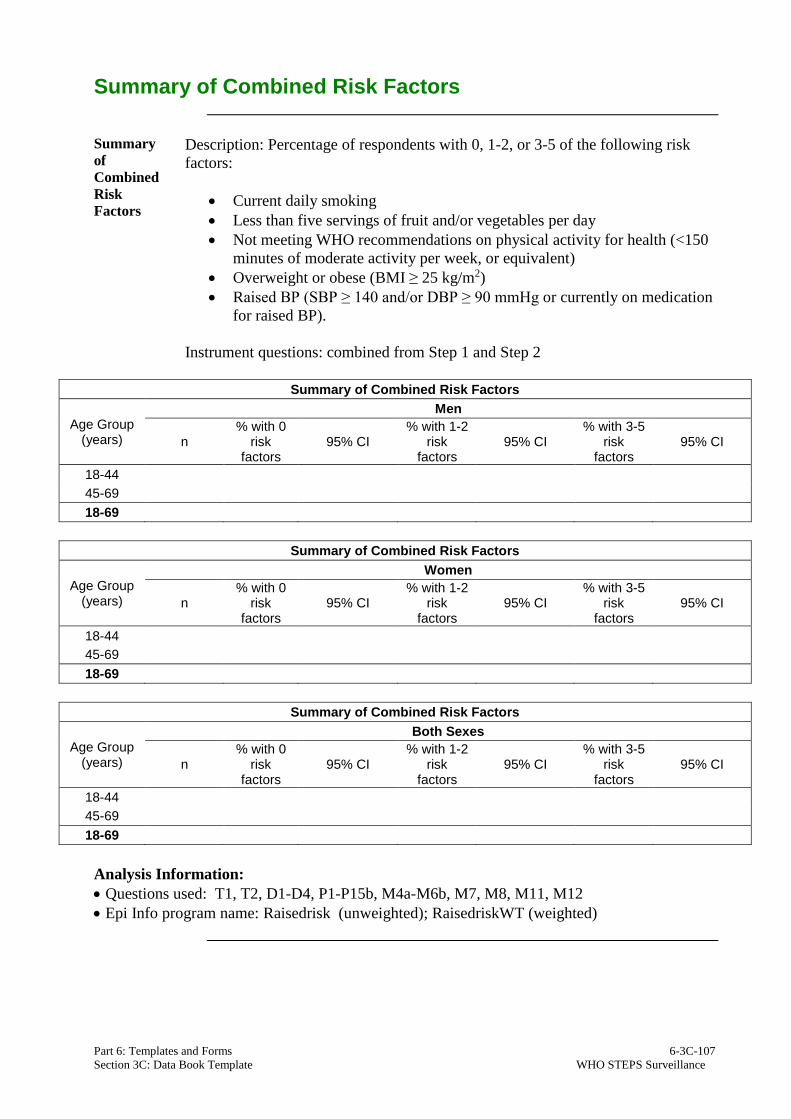
Part 6: Templates and Forms 6-3C-107
Section 3C: Data Book Template WHO STEPS Surveillance
Summary of Combined Risk Factors
Summary
of
Combined
Risk
Factors
Description: Percentage of respondents with 0, 1-2, or 3-5 of the following risk
factors:
• Current daily smoking
• Less than five servings of fruit and/or vegetables per day
• Not meeting WHO recommendations on physical activity for health (<150
minutes of moderate activity per week, or equivalent)
• Overweight or obese (BMI ≥ 25 kg/m2)
• Raised BP (SBP ≥ 140 and/or DBP ≥ 90 mmHg or currently on medication
for raised BP).
Instrument questions: combined from Step 1 and Step 2
Summary of Combined Risk Factors
Age Group (years)
Men
n % with 0
risk factors
95% CI % with 1-2
risk factors
95% CI % with 3-5
risk factors
95% CI
18-44
45-69
18-69
Summary of Combined Risk Factors
Age Group (years)
Women
n % with 0
risk factors
95% CI % with 1-2
risk factors
95% CI % with 3-5
risk factors
95% CI
18-44
45-69
18-69
Summary of Combined Risk Factors
Age Group (years)
Both Sexes
n % with 0
risk factors
95% CI % with 1-2
risk factors
95% CI % with 3-5
risk factors
95% CI
18-44
45-69
18-69
Analysis Information:
• Questions used: T1, T2, D1-D4, P1-P15b, M4a-M6b, M7, M8, M11, M12
• Epi Info program name: Raisedrisk (unweighted); RaisedriskWT (weighted)

Part 6: Templates and Forms 6-3C-108
Section 3C: Data Book Template WHO STEPS Surveillance


