REPORT ON 2007 STEPS SURVEY FOR RISK FACTORS … · REPORT ON 2007 STEPS SURVEY FOR RISK FACTORS...
102
ROYAL GOVERNMENT OF BHUTAN MINISTRY OF HEALTH REPORT ON 2007 STEPS SURVEY FOR RISK FACTORS AND PREVALENCE OF NONCOMMUNICABLE DISEASES IN THIMPHU AUGUST 2009
Transcript of REPORT ON 2007 STEPS SURVEY FOR RISK FACTORS … · REPORT ON 2007 STEPS SURVEY FOR RISK FACTORS...

ROYAL GOVERNMENT OF BHUTAN MINISTRY OF HEALTH
REPORT ON 2007 STEPS SURVEY FOR RISK FACTORS ANDPREVALENCE OF NONCOMMUNICABLE DISEASES
IN THIMPHU
AUGUST 2009

StepS Survey report 2009 Bhutan
- ii -
Final analysis and report writing by:
1. MelanieCowan,MPH,WHO,HQ,Geneva([email protected]),2. GampoDorji,MBBS,MPH-AppliedEpidemiology,MinistryofHealth ([email protected])3. DorjiPelzom,B.Sc.Statistics,MinistryofHealth([email protected])
Prepared by theLife StyleRelatedDisease Program (LSRDP) ofDepartment of PublicHealth,Ministry ofHealth,ThimphuBhutan.Cover design and layout:WangchukDukpaPrinted @KUENSELCorporationLtd.www.health.gov.bt
© Ministry of Health 2009 AllRightsReserved
Publication of the Reports on 2007 STEPS Survey for Risk Factors and Prevelance ofNoncommunicableDiseasesinThimphucanbeobtainedfromResearch&EpidemiologyUnit,PolicyandPlanningDivision,MinistryofHealth,Thimphu Bhutan (Tel +975-2-328091/3280892, Fax : +975-2-322941, email: [email protected]). Request forpermissiontoreproduceortranslateforsaleornon-commercialpurposeshouldbeaddressedtotheaboveaddress.

Bhutan StepS Survey report 2009
- iii -
Table of contents
Foreword.......................................................................................................................................... vAcknowledgement.......................................................................................................................... viExecutive summary......................................................................................................................... 1Result................................................................................................................................................ 1Recommendation.............................................................................................................................. 4Conclusion........................................................................................................................................ 4Resultsforadultsagerange25-64.................................................................................................... 5Resultsforadultsagerange25-74.................................................................................................... 7Countryprofile................................................................................................................................ 11Introduction..................................................................................................................................... 11Generalobjective............................................................................................................................ 12Specificobjective............................................................................................................................ 12Surveymethodology....................................................................................................................... 12Definitionsanddiagnosticcriteria.................................................................................................. 14Results Socio-demographic......................................................................................................................... 17Tobaccouse..................................................................................................................................... 17Alcohol........................................................................................................................................... 18Dietaryhabits,fruitsandvegetableconsumption........................................................................... 19Physicalactivity.............................................................................................................................. 20Bloodpressureanddiabeteshistory............................................................................................... 21Physicalmeasurement..................................................................................................................... 21Biochemicalmeasurement.............................................................................................................. 22Raisedrisk....................................................................................................................................... 22Discussion....................................................................................................................................... 23Limitation........................................................................................................................................ 24Challengesfacedduringthesurvey................................................................................................ 24Recommendation............................................................................................................................ 25Conclusion...................................................................................................................................... 25References....................................................................................................................................... 25Annexure AnnexIPhysicalactivity................................................................................................................ 26AnnexIIQuestionnaire................................................................................................................... 27AnnexIII Data book....................................................................................................................... 40

StepS Survey report 2009 Bhutan
- iv -

Bhutan StepS Survey report 2009
- v -
FOREWORD
Althoughthesurveywascarriedoutin2007,reportcouldnotbepublishedforwantofproperanalysisofdata.Giventheimportanceofthefindings,Iampleasedtoreleasethedocumenton“STEPSsurveyforriskfactorsandprevalenceofnoncommunicablediseaseinThimphu(2007)”withthehopetobenefitthegeneralpublic.
Thissurveyof2484peopleisthefirsteversurveytoassessriskfactorsandprevalenceofNCDsinourBhutanesepopulationandprovidesvaluableinformationthatwillassisttheGovernmenttobuildbetterstrategiestocontrolofNCDs.
Iamparticularlydrawnbythefactthatalthoughthenoncommunicablediseasesprevalencemaybecomparativelylowerthanothercountries,thesurveyrevealsthattheexposuretoNCDriskfactorsisrelativelyhighwith93.1%oftherespondentswereexposedtooneoftheriskfactors;56.5%exposedto1-2riskfactorsand38.4%exposedto3-5riskfactors.This,Ispeculate,willleadtofurtherupsurgeofNCDsinthefuture.
TheMinistryofHealthwillurgently scaleupourpublichealth interventionsonhealthy lifestyleamongstourpeople.Habitsarehuman’ssecondnatureandattimesnoteasilychanged,IhopethatmoreBhutanesewillsoonbephysicallyactive,haveaccesstoevidencebasedinformationonhealthydietarychoices,andmaintainstatusquoamongnontobaccousersandnon-alcoholicgroups.
Noncommunicable diseases have profound implication on the quality of life of the individuals,familiesandthesocietyatlarge.Coststohealthcarefinancingalsoescalates.Theonlysustainableandcosteffectivemethodisprevention.Therefore,theGovernmentwillgiveduepriorityandprovidefinancialsupportformultisectoralinterventionstopreventandcontrolnoncommunicablediseasesasbestaswecansoastoenableourpeopleofallagestoleadhealthierandhappierlife.
(Zangley Dukpa)HealthMinisterRoyalGovernmentofBhutan August,2009

StepS Survey report 2009 Bhutan
- vi -
Acknowledgement:
Dr.BhaktarajGiri,SeniorMedicalSpecialist,JigmeDorjiWangchuckNationalReferralHospital,actedastheprincipalinvestigatorforthesurveyduringthedesignanddatacollectionprocesses.
WeofferourappreciationposthumouslytolateNimaYoezer,Epidemiologist,MinistryofHealth,forcoordinatingduringtheconductofthesurvey.
WRandthecountryofficeteam,WHOcountryofficeinBhutan,Dr.JerzyLeowski,RegionalAdvisorforNCD,WHO,SEAROinNewDelhiassistedtheMoHwithfinancialandtechnicalsupportforthesurvey.
DepartmentofChronicDiseaseandHealthPromotion,WHO,HeadQuarters,Genevaassistedinthedataanalysisandreportcompilation.
WorldDiabeticFoundationforfinancialsupportforthesurvey.
Dasho(Dr.)GadoTshering,Hon’bleSecretary,Dr.DorjiWangchuk,DirectorGeneral,DepartmentofMedicalServices,Dr.UgenDophu,Director,DepartmentofPublicHealth,MinistryofHealthfortheirguidanceandkeensupportforthesurvey.
OfficialsoftheMinistryofHealth,researchassistants,enumeratorsandlaboratorytechnicianswhoweredirectlyorindirectlyinvolvedinmakingthissurveycometolight.

Bhutan StepS Survey report 2009
- 1 -
EXECUTIVE SUMMARY
BhutanissituatedintheeasternHimalayas,borderedbyTibet(China’sXizangAutonomousRegion)tonorthandtheIndianStateofSikkimtothewest,WestBengaltothesouthwest,AssamtothesouthandsoutheastandArunachalPradeshtotheeast.Thetotallandsurfaceareaofthecountryis38,816sq.km.
Bytheendof2007,thetotalpopulationwasprojectedat658,888fromthepopulationandhousingcensusof2005.Over69.1%resideinruralareaswhile30.9%liveinurbansettlements.ThehighesturbansettlersarefoundinThimphu,thecapitalcityofthecountrywith79,185persons(80.3%)ofthepopulationlivinginurbanThimphu.
Mainobjectiveof the surveywas to study the exposure to risk factorsnamely: tobacco, alcohol,physicalinactivity,dietandestablishbaselineforprevalenceofraisedbloodpressure,raisedbloodglucose,raisedbloodcholesterollevelofpopulationinThimphucity.
ThiscrosssectionalstudywasconductedwithslightmodificationoftheWHOSTEPsurveychronicdisease risk factor surveillance tool.Out of projected sample of 2500 among25- 74 years, 2484(male=45.8%,female=54.2%)participatedinthesurvey.Outof46samplingblocks,19wereselectedthroughprobabilityproportionatetosize(PPS).Participantswereselectedthroughtwostageclustersampling.SurveywasdoneinAugustthroughSeptember2007bytheMinistryofHealthwiththetechnicalandfinancialassistanceofWHO.
The pre-survey informationwas disseminated to the people throughmassmedia and householdsselectedforthesurveywasinformedthroughofficeofthrompon,themayorofthecity.
EthicalclearancewasapprovedbytheethicalboardoftheMinistryofHealth.Individualconsentwastakenandparticipantscouldwithdrawvoluntarilyontheirchoicealthoughnopeoplewithdrewfromthestudy.
Thethreestepsurveycollectedthefollowinginformation:
Step1:Socio-demographicinformationandbehaviors(tobaccouse,alcoholconsumption,dietandphysicalactivity)andhistoryofhypertensionanddiabetes.
Step2:Physicalmeasurement(height,weight,waist,hipcircumferenceratio,bloodpressure,andheartrate)
Step 3: Biochemical measurement (blood glucose, serum cholesterol, triglycerides, high densitylipoprotein).Participantswhosebloodpressure,bloodsugarandcholesterollevelsweredetectedtobeabnormalwerecounseledandadvisedtoattendthenearesthealthfacility.
Results:
Tobacco use:
Althoughtheoverallprevalenceofsmokerswasrelativelylow(6.8%),mostpeoplewhosmokeddidsoonadailybasis(82.2%).Amongthedailysmokers,themeanageofinitiatingdailysmokingwas

StepS Survey report 2009 Bhutan
- 2 -
20.9yearswithnostatisticallysignificantdifferencebetweenmalesandfemales.Theprevalenceofdailysmokingwassignificantlygreateramongtheyoungestagegroup25-34years(9.8%)thaninanyoftheotheragegroupssuggestingapotentialforanincreaseinoverallsmokingprevalence.
About one fifth (19.4%) used smokeless tobacco products, most of whom (83.0%) used daily(combinedexposure to throughdaily consumption isveryhigh (83.3%).Amongdaily smokelesstobaccousers,betelnutwasused7.5timesperdayonaverageandchewingtobaccowasused7.2timesperdayonaverage.
Overallnearly20%(19.6%)ofThimphupopulationisexposedtohealthriskthroughtobaccousemostofwhomwereusingthesmokelessformeventhoughtheBhutaneselawrestrictssaleofalltobaccoproducts.
Alcohol
Ofthetotalrespondents30.8%drankalcoholinthelast30dayswithsignificantlyhigherprevalenceof consumption of alcohol inmales as compared to females (34.9%vs 25.5%). Therewas alsosignificant difference in drinking frequency with 7.9% of males drinking 5-6 days per week ascomparedto3.2%offemalesdrinking5-6daysperweek(seefigure3).
Among thosewhodrank in the last12months,while themeanstandarddrinkonadrinkingdaywas2.6,withthemajorityofrespondents(45.2%)consuming2-3standarddrinksperdrinkingday.Malesweresignificantlyheavydrinkerswith29.2%ofmalesdrinkingmorethan4standarddrinksasopposedtoonly11.1%ofthefemalesonadrinkingday(seefigure4).
Ofthosewhodrankinthelast7days,11.9%ofmenand12.1%offemaleshadabinge-drinkonanyday.Thereisageneraltrendofgreaterprevalenceofbingedrinkingwithincreasingage.
Dietary habits, fruits and vegetable consumption
Overalltwothirdofthepopulation(66.6%)arenoteatingenoughfruitsandvegetables(lessthanfivecombinedservingsperday).Theconsumptionsoffruitareparticularlylow(1.2servingaday)andnotveryfrequent(3.7daysperweek).Themeannumberofvegetableconsumptionis3.2servingsperday,andthemeannumberofdaysinofvegetableconsumptioninaweekis6.4.
Ofthe1133households,vegetableoilwasmostwidelyused(96.8%)formealpreparationfollowedbygheeorbutter(1.5%).Themeanconsumptionoffat/oilinamonthis1.6litresperadultperhousehold.Overhalfthepopulationconsumedezay(56.7%)andsuja(55.5%)atleastonceaweek.Sujausemayincreasetheconsumptionofbutterandsaltwhileezay maybeagoodsourceofsaltandotherharmfulpreservatives.Overquarter(25.1%)eatdriedmeatatleastonceaweek.However,thestudydidnotcollectthepracticeofwhethertherewasconsumptionofsmokedorburntdriedmeat,whichincaseisaknownriskfactorforcancers.
Physical activity
Themajorityofthepopulation(58.6%)isnotattainingtheminimumrequirementofhealthenhancingphysicalactivity.Inaddition,17.7%arejustbarelyattainingthislevelofphysicalactivity.Halfthepopulationisonlygetting17.1minutesorlessphysicalactivityonaverageperday.

Bhutan StepS Survey report 2009
- 3 -
Femalesaresignificantlymoreinactivethanmales.Almosttwothird(63.2%)arenotgettinganyphysicalactivityfromtransport(eg,theydonotwalkorcycletotransportthemselves).Overthreequarters(78.7%)donotgetanyphysicalactivityduringtheirrecreationtimeorfreetime.
Whiletherewasgeneraltrendtowardsincreasingprevalenceofnovigorousphysicalactivitywithincreasingage,theonlyconsecutiveagegroupsthatweresignificantlydifferentwere35-44and45-54years(80.4%vs88.3%).
50%oftherespondentsspent2hoursormoreinsedentaryactivitiesonaverageperday.Thisincludes25%ofrespondentswhospent4hoursormoreinsedentaryactivitiesonaverageperday.
Blood pressure and diabetes history
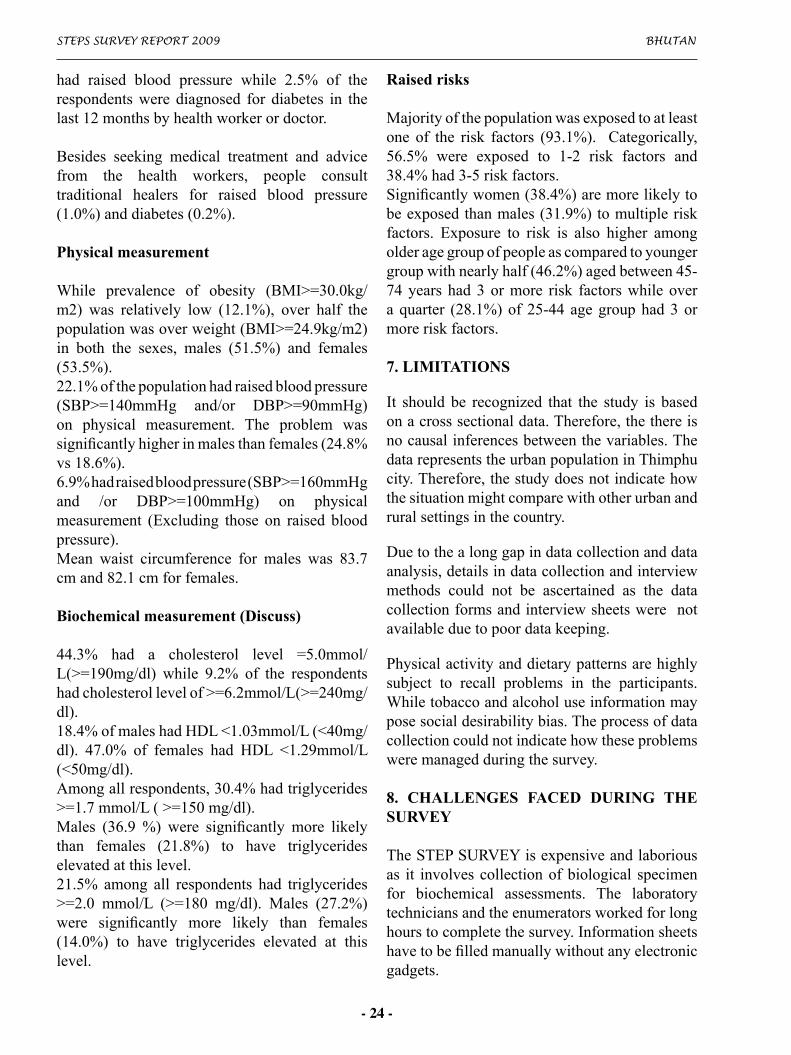
Nearlyonefifth(17.1%)oftherespondentshadraisedbloodpressurewhile2.5%oftherespondentswerediagnosedfordiabetesinthelast12monthsbyhealthworkerordoctor.Besidesseekingmedicaltreatment and advice from the healthworkers, people consult traditional healers for raised bloodpressure(1.0%)anddiabetes(0.2%).
Physical measurement
Prevalenceofobesity(BMI>=30.0kg/m2)wasrelativelylow(12.1%),whileoverhalfthepopulationwasoverweight(BMI>=24.9kg/m2)inboththesexes,males(51.5%)andfemales(53.5%).
22.1%ofthepopulationhadraisedbloodpressure(SBP>=140mmHgand/orDBP>=90mmHg)onphysicalmeasurement.Thiswassignificantlyhigherinmalesthanfemales(24.8%vs18.6%).
6.9%hadraisedbloodpressurelevelwithSBP>=160mmHgand/orDBP>=100mmHg.Meanwaistcircumferenceformaleswas83.7cmand82.1cmforfemales.
Biochemical measurement
44.3% had a cholesterol level =5.0mmol/L(>=190mg/dl) while 9.2% of the respondents hadcholesterollevelof>=6.2mmol/L(>=240mg/dl).18.4%ofmaleshadHDL<1.03mmol/L(<40mg/dl).47.0%offemaleshadHDL<1.29mmol/L(<50mg/dl).
Amongallrespondents,30.4%hadtriglycerides>=1.7mmol/L(>=150mg/dl).Males(36.9%)weresignificantlymorelikelythanfemales(21.8%)tohavetriglycerideselevatedat this level.21.5%amongallrespondentshadtriglycerides>=2.0mmol/L(>=180mg/dl).Males(27.2%)weresignificantlymorelikelythanfemales(14.0%)tohavetriglycerideselevatedat thislevel.
Raised risks Majorityofthepopulationwasexposedtoatleastoneoftheriskfactors(93.1%). Categorically,56.5%wereexposedto1-2riskfactorsand38.4%had3-5riskfactors.

StepS Survey report 2009 Bhutan
- 4 -
Significantlywomen (38.4%) aremore likely to be exposed thanmales (31.9%) tomultiple riskfactors.Exposuretoriskisalsohigheramongolderagegroupofpeopleascomparedtoyoungergroupwithnearlyhalf(46.2%)agedbetween45-74yearshad3ormoreriskfactorswhileoveraquarter(28.1%)of25-44agegrouphad3ormoreriskfactors.
Recommendations
TheThimphu survey though limited to Thimphu city dwellers, suggests that high proportion ofBhutanesemaybeexposedtomultipleNCDriskfactors.Inordertoreducethehealthrisks,intensehealthpromotiontopreventfromNCDsandtominimizeexposureofpopulationtoNCDrisks isimperative. Inparticular, good strategiesmustbedesignedand implemented topromotephysicalactivity,healthydiet,saferuseofalcohol,andtobaccocessationacrosscommunitiesinBhutan.
Due to themulti-factorial determinants of the NCDs, prevention ismost effective when tackledthrougha truemulti-sectoral approach.The current informationof theNCD risk factorsmust bedisseminated towide rangingaudiencesofpolicymakers, relevant institutions,dzongkhagmulti-sectoraltaskforcesforHIV,healthprofessionals,ruralandurbancommunitiestogenerategreaterunderstandingformulti-sectoralcollaborationinfuture.
Analyticalepidemiologicalstudiesmustbeconductedinfuturetounderstandmoreonbehavioralandattitudestotobacco,alcohol,physicalactivityanddietarypracticesandotherNCDriskfactorssothatappropriatebehavioralinterventionscanbedesignedamongthepopulation.
Conclusion
GiventhatvastmajorityofthepopulationinThimphuisexposedtoatleastoneoftheriskfactors(93.1%) or 56.5% exposed to 1-2 risk factors and 38.4% exposed to 3-5 risk factors, it can bespeculatedthatthereisahugepotentialofupsurgeofNCDs.
Bhutan must pay attention to implement evidence based public health interventions urgently topreventandcontroltheepidemicofNCDloomingoverthepopulation.

Bhutan StepS Survey report 2009
- 5 -
Bhutan (Thimphu) STEPS Survey 2007Fact Sheet
Results for adults aged 25-64 years (incl.95%CI) Both Sexes Males Females
Step 1 Tobacco Use
Percentagewhocurrentlysmoketobacco7.0%
(5.7-8.3)8.7%
(6.7-10.7)4.9%
(3.5-6.3)
Percentagewhocurrentlysmoketobaccodaily5.8%
(4.6-7.0)7.2%
(5.4-9.0)4.1%
(2.7-5.4)
For those who smoke tobacco daily
Averageagestartedsmoking(years)20.8
(19.4-22.1)20.8
(19.1-22.5)*
Percentagesmokingmanufacturedcigarettes62.0%
(51.8-72.1)68.1%
(55.7-80.4)*
Meannumberofmanufacturedcigarettessmokedperday4.5
(3.6-5.5)* *
Step 1 Alcohol Consumption
Percentageofabstainers(whodidnotdrinkalcoholinthelastyear)63.3%
(61.1-65.6)59.6%
(56.3-62.9)68.1%
(65.1-71.0)
Percentageofcurrentdrinkers(whodrankalcoholinthepast30days)
31.1%(28.9-33.3)
35.2%(32.0-38.4)
25.9%(23.2-28.7)
Among current drinkers
Percentagewhodrankalcoholon4ormoredaysinthelastweek34.7%
(29.7-39.8)39.2%
(32.4-45.9)26.1%
(19.2-32.9)
Percentagewhobingedrink(menwhohad5ormore/womenwhohad4ormoredrinksonanydayinthelastweek)
--11.4%
(7.2-15.5)12.2%
(7.4-16.9)
Step 1 Fruit and Vegetable Consumption (in a typical week)
Meannumberofdaysfruitconsumed3.7
(3.6-3.9)3.7
(3.5-3.8)3.8
(3.7-4.0)
Meannumberofservingsoffruitconsumedonaverageperday1.2
(1.1-1.3)1.2
(1.1-1.3)1.2
(1.1-1.3)
Meannumberofdaysvegetablesconsumed6.4
(6.3-6.5)6.4
(6.3-6.5)6.4
(6.3-6.5)
Meannumberofservingsofvegetablesconsumedonaverageperday
3.3(3.2-3.4)
3.4(3.3-3.6)
3.1(3.0-3.2)
StepS Survey report 2009 Bhutan
- 6 -
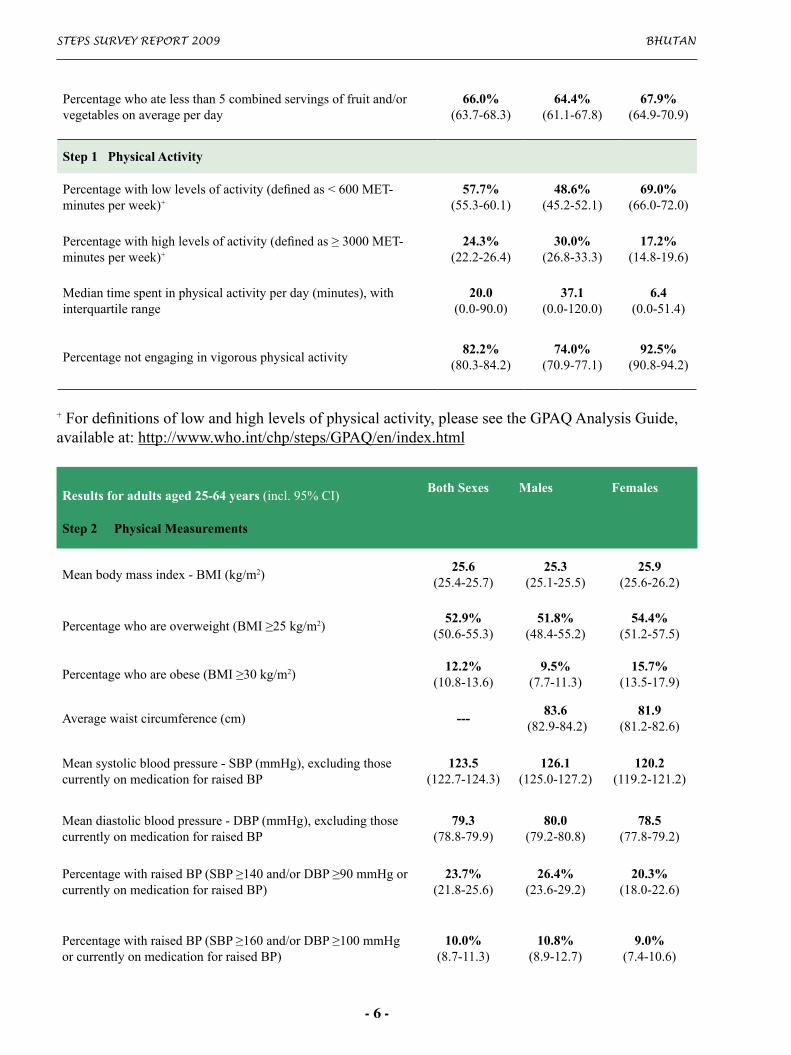
Percentagewhoatelessthan5combinedservingsoffruitand/orvegetablesonaverageperday
66.0%(63.7-68.3)
64.4%(61.1-67.8)
67.9%(64.9-70.9)
Step 1 Physical Activity
Percentagewithlowlevelsofactivity(definedas<600MET-minutesperweek)+
57.7%(55.3-60.1)
48.6%(45.2-52.1)
69.0%(66.0-72.0)
Percentagewithhighlevelsofactivity(definedas≥3000MET-minutesperweek)+
24.3%(22.2-26.4)
30.0%(26.8-33.3)
17.2%(14.8-19.6)
Mediantimespentinphysicalactivityperday(minutes),withinterquartilerange
20.0(0.0-90.0)
37.1(0.0-120.0)
6.4(0.0-51.4)
Percentagenotengaginginvigorousphysicalactivity82.2%
(80.3-84.2)74.0%
(70.9-77.1)92.5%
(90.8-94.2)
+Fordefinitionsoflowandhighlevelsofphysicalactivity,pleaseseetheGPAQAnalysisGuide,availableat:http://www.who.int/chp/steps/GPAQ/en/index.html
Results for adults aged 25-64 years (incl.95%CI)Both Sexes Males Females
Step 2 Physical Measurements
Meanbodymassindex-BMI(kg/m2)25.6
(25.4-25.7)25.3
(25.1-25.5)25.9
(25.6-26.2)
Percentagewhoareoverweight(BMI≥25kg/m2)52.9%
(50.6-55.3)51.8%
(48.4-55.2)54.4%
(51.2-57.5)
Percentagewhoareobese(BMI≥30kg/m2)12.2%
(10.8-13.6)9.5%
(7.7-11.3)15.7%
(13.5-17.9)
Averagewaistcircumference(cm) ---83.6
(82.9-84.2)81.9
(81.2-82.6)
Meansystolicbloodpressure-SBP(mmHg),excludingthosecurrentlyonmedicationforraisedBP
123.5(122.7-124.3)
126.1(125.0-127.2)
120.2(119.2-121.2)
Meandiastolicbloodpressure-DBP(mmHg),excludingthosecurrentlyonmedicationforraisedBP
79.3(78.8-79.9)
80.0(79.2-80.8)
78.5(77.8-79.2)
PercentagewithraisedBP(SBP≥140and/orDBP≥90mmHgorcurrentlyonmedicationforraisedBP)
23.7%(21.8-25.6)
26.4%(23.6-29.2)
20.3%(18.0-22.6)
PercentagewithraisedBP(SBP≥160and/orDBP≥100mmHgorcurrentlyonmedicationforraisedBP)
10.0%(8.7-11.3)
10.8%(8.9-12.7)
9.0%(7.4-10.6)

Bhutan StepS Survey report 2009
- 7 -
Step 3 Biochemical Measurement
Meanfastingbloodglucose(mmol/L),excludingthosecurrentlyonmedicationforraisedbloodglucose
5.9(5.8-6.0)
5.9(5.8-6.0)
5.9(5.8-6.0)
PercentagewithimpairedfastingglycaemiaasdefinedbelowFastingglucose:≥6.1mmol/L(110mg/dl)and<7.0mmol/L(126mg/dl)ANDPost-glucoseload:<7.8mmol/L(140mg/dl)
21.7%(19.8-23.5)
20.9%(18.3-23.5)
22.7%(20.2-25.3)
PercentagewithraisedfastingbloodglucoseasdefinedbeloworcurrentlyonmedicationforraisedbloodglucoseFastingglucose:≥7.0mmol/L(126mg/dl)ORPost-glucoseload::≥11.1mmol/L(200mg/dl)
7.5%(6.4-8.6)
7.8%(6.2-9.4)
7.2%(5.7-8.7)
Meantotalbloodcholesterol(mmol/L)4.8
(4.8-4.9)4.9
(4.8-4.9)4.8
(4.7-4.8)
Percentagewithraisedtotalcholesterol(≥5.0mmol/Lor≥190mg/dl)
43.9%(41.6-46.2)
46.0%(42.6-49.3)
41.2%(38.2-44.3)
Percentagewithraisedtotalcholesterol(≥6.2mmol/Lor≥240mg/dl)
9.3%(7.9-10.6)
11.1%(9.0-13.2)
7.0%(5.5-8.5)
Summary of combined risk factors
currentdailysmokerslessthan5servingsoffruitsand/orvegetablesonaverageperdayLowlevelofactivity
overweight(BMI≥25kg/m2)raisedBP(SBP≥140and/orDBP≥90mmHgorcurrentlyonmedicationforraisedBP)
Percentagewithnoneoftheriskfactorsincludedabove,aged25to64years
6.3%(5.0-7.7)
7.2%(5.2-9.2)
5.2%(3.6-6.8)
Percentagewithatleastthreeoftheriskfactorsincludedabove,aged25to44years
28.1%(25.1-31.1)
25.5%(21.3-29.7)
31.5%(27.4-35.7)
Percentagewithatleastthreeoftheriskfactorsincludedabove,aged45to64years
44.3%(40.9-47.6)
41.6%(36.7-46.5)
47.5%(43.0-52.0)
Percentagewithatleastthreeoftheriskfactorsincludedabove,aged25to64years
33.3%(31.0-35.6)
30.5%(27.3-33.8)
36.8%(33.6-40.0)
Results for adults aged 25-74 years (incl.95%CI) Both Sexes Males Females
Percentagewhocurrentlysmoketobacco6.8%
(5.6-8.0)8.4%
(6.5-10.3)4.7%
(3.4-6.1)
Percentagewhocurrentlysmoketobaccodaily5.6%
(4.5-6.7)6.9%
(5.2-8.6)3.9%
(2.6-5.1)
For those who smoke tobacco daily

StepS Survey report 2009 Bhutan
- 8 -
Averageagestartedsmoking(years)20.9
(19.5-22.2)20.6
(18.9-22.3)*
Percentagesmokingmanufacturedcigarettes61.2%
(51.3-71.2)67.6%
(55.5-79.7)*
Meannumberofmanufacturedcigarettessmokedperday4.6
(3.6-5.5)* *
Step 1 Alcohol Consumption
Percentageofabstainers(whodidnotdrinkalcoholinthelastyear)
63.7%(61.5-65.8)
59.9%(56.8-63.0)
68.5%(65.7-71.3)
Percentageofcurrentdrinkers(whodrankalcoholinthepast30days)
30.8%(28.7-32.8)
34.9%(31.9-38.0)
25.5%(22.9-28.1)
Among current drinkers
Percentagewhodrankalcoholon4ormoredaysinthelastweek35.8%
(31.0-40.7)40.0%
(33.5-46.4)27.7%
(21.1-34.3)
Percentagewhobingedrink(menwhohad5ormore/womenwhohad4ormoredrinksonanydayinthelastweek)
--11.9%
(7.9-15.8)12.1%
(7.6-16.7)
Step 1 Fruit and Vegetable Consumption (in a typical week)
Meannumberofdaysfruitconsumed3.7
(3.6-3.8)3.7
(3.5-3.8)3.8
(3.7-4.0)
Meannumberofservingsoffruitconsumedonaverageperday1.2
(1.1-1.3)1.2
(1.1-1.3)1.2
(1.1-1.3)
Meannumberofdaysvegetablesconsumed6.4
(6.3-6.4)6.4
(6.3-6.4)6.4
(6.3-6.5)
Meannumberofservingsofvegetablesconsumedonaverageperday
3.2(3.2-3.3)
3.4(3.3-3.6)
3.0(2.9-3.1)
Percentagewhoatelessthan5combinedservingsoffruitand/orvegetablesonaverageperday
66.6%(64.5-68.8)
65.0%(61.9-68.2)
68.7%(65.8-71.5)
Step 1 Physical Activity
Percentagewithlowlevelsofactivity(definedas<600MET-minutesperweek)+
58.6%(56.4-60.9)
49.8%(46.5-53.1)
69.6%(66.8-72.4)
Percentagewithhighlevelsofactivity(definedas≥3000MET-minutesperweek)+
23.7%(21.7-25.7)
29.3%(26.2-32.3)
16.8%(14.5-19.0)
Mediantimespentinphysicalactivityperday(minutes),withinterquartilerange
17.1(0.0-85.7)
34.3(0.0-120.0)
4.3(0.0-51.4)
Percentagenotengaginginvigorousphysicalactivity82.9%
(81.1-84.7)74.9%
(71.9-77.8)92.9%
(91.3-94.4)

Bhutan StepS Survey report 2009
- 9 -
Results for adults aged 25-74 years (incl.95%CI)Both Sexes Males Females
Step 2 Physical Measurements
Meanbodymassindex-BMI(kg/m2)25.5
(25.3-25.7)25.3
(25.1-25.5)25.8
(25.6-26.1)
PercentagewithBMI≥25kg/m2 52.4%(50.2-54.6)
51.6%(48.4-54.8)
53.5%(50.5-56.5)
PercentagewithBMI≥30kg/m2 12.1%(10.7-13.4)
9.5%(7.8-11.3)
15.3%(13.2-17.3)
Averagewaistcircumference(cm) --83.7
(83.1-84.3)82.1
(81.4-82.7)
Meansystolicbloodpressure-SBP(mmHg),excludingthosecurrentlyonmedicationforraisedBP
124.7(123.9-125.4)
127.0(125.9-128.1)
121.7(120.7-122.7)
Meandiastolicbloodpressure-DBP(mmHg),excludingthosecurrentlyonmedicationforraisedBP
79.5(79.0-80.0)
80.1(79.3-80.9)
78.8(78.1-79.4)
PercentagewithraisedBP(SBP≥140and/orDBP≥90mmHgorcurrentlyonmedicationforraisedBP)
26.0%(24.2-27.8)
28.3%(25.6-31.0)
23.2%(20.9-25.4)
PercentagewithraisedBP(SBP≥160and/orDBP≥100mmHgorcurrentlyonmedicationforraisedBP)
11.6%(10.4-12.9)
12.2%(10.3-14.0)
11.0%(9.4-12.6)
Step 3 Biochemical Measurement
Meanfastingbloodglucose(mmol/L),excludingthosecurrentlyonmedicationforraisedbloodglucose
5.9(5.8-6.0)
5.9(5.8-6.0)
6.0(5.9-6.1)
PercentagewithimpairedfastingglycaemiaasdefinedbelowFastingglucose:≥6.1mmol/L(110mg/dl)and<7.0mmol/L(126mg/dl)ANDPost-glucoseload:<7.8mmol/L(140mg/dl)
21.6%(19.8-23.3)
20.8%(18.3-23.3)
22.5%(20.1-24.9)
PercentagewithraisedfastingbloodglucoseasdefinedbeloworcurrentlyonmedicationforraisedbloodglucoseFastingglucose:≥7.0mmol/L(126mg/dl)ORPost-glucoseload::≥11.1mmol/L(200mg/dl)
8.2%(7.1-9.3)
8.6%(7.1-10.2)
7.7%(6.2-9.1)
Meantotalbloodcholesterol(mmol/L)4.8
(4.8-4.9)4.9
(4.8-4.9)4.8
(4.7-4.8)
Percentagewithraisedtotalcholesterol(≥5.0mmol/Lor≥190mg/dl)
44.3%(42.1-46.5)
45.7%(42.6-48.9)
42.5%(39.6-45.4)

StepS Survey report 2009 Bhutan
- 10 -
Percentagewithraisedtotalcholesterol(≥6.2mmol/Lor≥240mg/dl)
9.2%(7.9-10.5)
10.5%(8.5-12.4)
7.6%(6.2-9.0)
Summary of combined risk factors
currentdailysmokerslessthan5servingsoffruitsand/orvegetablesonaverageperdayLowlevelofactivity
overweight(BMI≥25kg/m2)raisedBP(SBP≥140and/orDBP≥90mmHgorcurrentlyonmedicationforraisedBP)
Percentagewithnoneoftheriskfactorsincludedabove,aged25to74years
6.1%(4.8-7.3)
6.9%(5.0-8.7)
5.1%(3.6-6.6)
Percentagewithatleastthreeoftheriskfactorsincludedabove,aged25to44years
28.1%(25.2-31.1)
25.5%(21.3-29.7)
31.5%(27.4-35.7)
Percentagewithatleastthreeoftheriskfactorsincludedabove,aged45to74years
46.2%(43.3-49.1)
43.3%(39.0-47.6)
49.7%(45.8-53.6)
Percentagewithatleastthreeoftheriskfactorsincludedabove,aged25to74years
34.8%(32.6-37.0)
31.9%(28.8-35.0)
38.4%(35.4-41.4)
*indicateslessthan50respondents

Bhutan StepS Survey report 2009
- 11 -
STEP SURVEY FOR RISK FACTORS AND PREVALENCE OF NON-COMMUNICABLE DISEASE IN THIMPHU (2007)
1. COUNTRY PROFILE Bhutan is situated in the eastern Himalayas,borderedbyTibet(China’sXizangAutonomousRegion)tonorthandtheIndianstateofSikkimtothewest,WestBengaltothesouthwest,AssamtothesouthandsoutheastandArunachalPradeshto the east. The total land surface area of thecountryis38,816sq.km
By the end of 2007, the total population wasprojected at 658,888 from the population andhousingcensusof2005.50%of theBhutanesepopulation was under the age of 23.3 yearsindicating a young population (Population andhousing census of Bhutan 2005). Bhutaneseare mostly an agrarian society with 66.6% ofthelabourforceengagedinagriculture(BhutanLivingStandardSurvey(BLSS)2007).
Over69.1% reside in rural areaswhile 30.9%live in urban settlements. The highest urbansettlersarefoundinThimphu,thecapitalcityofthecountrywith79,185persons(80.3%)ofthepopulationlivinginurbanThimphu.
Thefirstmotor vehicles appeared inBhutan in1962withtheconstructionofthefirstroadlinksfromIndia.Todaymorethan4,946.70kilometersofroadhavebeenconstructedprovidingthekeymeansoftransportstretchingthroughtheruggedmountainsofthecountry.
The average life span ofBhutan is 66.1 years.Underfivemortalityrateis61.6/1000livebirthsandinfantmortalityrateis40.10/1000livebirths(United Nations Population Division, 2007).Approximatelyover90%of thepopulationhashealthcoverage(AnnualHealthBulletin,2008).
Ledbytheyoungestrulingmonarch,HisMajestythe King, Jigme Khesar NamgyelWangchuck,Bhutan came into the limelight of nations as
theworld’snewestparliamentarydemocracy in2008.
2. INTRODUCTION
Noncommunicable diseases are an emergingproblem worldwide across countries of allincomegroups.Contrarytothebeliefthatchronicnoncommunicable diseases such as diabetes,hypertension, heart diseases and strokes arethe diseases of the affluent society, 80% of allchronicdiseasedeathsoccurinlowandmiddleincomecountries(WHOvitalinvestment).WHOestimates that the totalnumberofpeopledyingfrom chronic disease which noncommunicablediseases is double the number dying from allinfectious diseases (including HIV/AIDS,tuberculosis, malaria), maternal and perinatalconditions,andnutritionaldeficienciescombined.
No epidemiological studies were conducted sofarinBhutantoascertaintheprevalenceofNCDssuchasDiabetes,Hypertension,CardiovascularDiseases, Cerebro-vascular Diseases, andChronic Renal Failure and chronic respiratorydiseases.Mostofthedataavailablearehospitalbasedwhichdoesnotgiveatruerepresentationof the problem in the population. The hospitalmorbidity data in Bhutan indicates that NCDsaccountformorethan50%ofinpatientmortality.Thisisanimportantcauseofalargeproportionofmid-lifepreventabledeath.
Noncommunicable diseases occur on exposureofthepopulationtotheirriskfactorsoveraspanoftime.Itisequallydependentonintensityandmultiplicityofexposure to these factors.Whilecertain risk factors like age, sex, and ethnicityarenon-modifiablebuthowever, thereareasetof common modifiable risk factors that under-liemost noncommunicable diseases. These areharmful alcohol consumption, unhealthy diet,physical inactivity and obesity, tobacco use,

StepS Survey report 2009 Bhutan
- 12 -
raisedbloodpressure, raisedbloodglucoseandabnormallipids.
Thisstudywasaimedtodeterminetheprevalenceof these risk factors in theurbanpopulationofThimphu,thecapitalcityofBhutan.TheWHOSTEPSquestionnairewasmodified tomeet thelocalneedsandappliedinthestudy.
General Objective:
To establish the prevalence of themajor NCDriskfactorsinurbanThimphuwhichcanbeusedinplanningandevaluatingtheimpactofanNCDpreventionprograminurbansettings,particularlyinThimphu.
Specific objectives:
To determine the prevalence of the major,modifiable risk factors of NCDs in the urbanpopulationofThimphu.
Toassessthedistributionoftheseriskfactorsbyage and sex in the urbanThimphu population.To study cultural and social habits of urbanBhutanese population that adds up to the riskfactorsofNCD
3. SURVEY METHODOLOGY
Study Area
The studywas conducted in the capital city ofThimphu. As resources were not available toconductanationalsurvey,Thimphuwasselectedas the survey site as it has the largest urbanpopulation,consistingofindividualsoriginatingfromeverypartofthecountry,andwaslogisticallytheeasiestareainwhichtoconductthesurvey.
Futuresurveyswillbeconductedinotherurbansettlementsaswellastoinperi-urbanandruralareas.Conductingthecurrentsurveyinthemostpopulous urban area provided higher advocacyvalue as well as repeatability in the future toassess trends and evaluate the impact of NCD
preventionactivities.
Study population
Any able-bodied Bhutanese individual, bothmaleandfemale,residinginThimphucity,atthetimeofstudy(JulytoSeptember2007),between25to74yearsofage.
Sample sizeA sample size of 2800 people was targetedfor the study. Sample size was determinedaccordingtotheSTEPSapproachestimationofminimum sample size andwas inflated to takeinto consideration an expected of 12% non-responserate.
Sample Design
The Research Unit of the Ministry of Healthdrewthesamplefor thestudy.Astratifiedtwo-stage samplewas drawn using data from 2005populationandhousingcensus as the samplingframewiththehelpofanexpertfromthenationalstatisticalbureau.Inthefirststageofsampling,19blocksoutofatotalof46wereselectedusingprobabilityproportionatetosize(PPS)samplingamongtheBhutanesepopulation.Inthesecondstage of sampling, individuals were selectedfromeachblock.Selectionofindividualswithineachselectedblockproceededasfollows:
A map of each selected block was providedshowingdistinctivefeatureslikedzongs,streams,rivers, roads, hospitals, BHUs, footpaths andbuildings.
A listingofhouseholdsandpersonsaged25 to74yearswaspreparedforeverysampleblocktoserveassamplingframe.
Theresearchunitprovidedtheresearcherswiththe list of persons selected for the study. Thiswasdonefollowingenlistingindividualsbyagegroup and sex and selecting individuals fromeachage-sexgroupbyintervalsampling.

Bhutan StepS Survey report 2009
- 13 -
Training
A total of twenty nine research assistants andfive laboratory technicians were trained fordata collection for the study. The researchassistantsweretrainedinitiallyinMay2006anda subsequent refreshergivenprior to the study.Theyweretrainedonthefollowing:• Registration• Applicationofthequestionnaire• Performing measurement of blood pressure,height,weight,waistandhipcircumference• Dataentrytothesurveyform• Checkingfordataandresults• Handsontrainingonquestionnaireinstitution• Asmallpilotsurveywasconductedbeforetheinitiationofthestudy.
Survey instrument
TheWHOSTEPsinstrumentwasadaptedtothelocalcontextforthisstudytoincludeappropriateinformation. Information gathered includedidentificationofthesubject;demography;tobaccouse;alcoholconsumption;nutritionandphysicalactivity.Aquestionnaireusefieldguidelinewasdevelopedandglossaryofimportanttermsinthequestionnairewasmade and issued to theRAsforreference.ThesurveyinstrumentsaswellasthesefieldguidesareavailableinAnnexureII
Data collection
Data collection was started in early August2007 and completed in mid September of thesameyear. A totalof29HealthAssistantandBasic Health Worker/Nurses, who worked asenumerators, five laboratory technicians and 8supervisorsconductedthestudy.
Physical Measurements
Height was measured using stadiometer (withsensitivity to ±0.1 cm) shoes removed. Bodyweightwasrecordedinkilogramswithelectronicweighing machine (SECA 843, range 140kg)which were standardized and checked every
week. Participants were measured in lightclothing.
OmronBPapparatuswasusedtomeasurebloodpressure.Theapparatuseshadmedium,largeandpediatriccuffandthesewereusedaccordingtoarmcircumference.Aftertakingrestforatleast10 minutes, blood pressure measurement wascarried out with a digital BP apparatus. Threereadingsweremade at aminimal interval of 3minuteseachandenteredintheform.
Waistandhipcircumferenceweremeasured,tothe nearest centimeter, in a private area usingmeasuringtape.Waistwasmeasuredatthelevelof themidpointbetween inferiormarginof lastribandtheuppermarginoftheiliaccrestatthemid-axillaryplanewiththesubjectstanding.Themeasurewasgenerallytakenoverlightclothing.In subjects with pendulous abdomen the truecircumference was estimated by inclining thetapedownwardsanteriorlytotheumbilicus.
Blood sample collection
Venousbloodsamplesweretakenandthebloodwasstoredat2to80CcollectedinacoldboxinSodiumFluorinatedvaccuntainertubesforbloodglucose estimation before being transferred tothe laboratory. Plasma glucose estimation wasdoneusingaHitachi912bio-analyzer.Venous blood samples for cholesterol andtriglyceridewere collected in plain vaccutainertubeswithgelseparatorandanalyzedinaHitachi912bio-analyzer.Fasting blood glucose and Oral glucose tolerance test (OGTT)
Fasting blood glucose was measured in themorningafteratleast3daysofunrestricteddiet(more than 150 g of carbohydrate daily) andusualphysicalactivity.Thetestwasprecededbyanovernightfastof8-14hours. Smokingwasnotpermittedduring the test.Tenminutesaftercollectionofthefastingbloodsample,thesubjecthad to take 75 g of anhydrous glucose in 300mlofwateroveracourseof5minutes.Second
StepS Survey report 2009 Bhutan
- 14 -
sampleofbloodwascollected120minutesaftertheglucoseload.
Determination of serum lipid profile
Totalcholesterol,triglycerideandfastingglucosewas determined from fasting blood sample.These were analyzed using Hitachi 912 bio-analyzer.Report dissemination to the participants
All blood reports were distributed to theparticipants the next morning and necessaryadvice regarding high blood pressure, obesity,hyperglycemia, hyper-triglyceridemia andhypercholesterolemia were given, whereverrequired. Health education materials weredistributed about risk factors of NCDs toany one who were detected of having theseduring questionnaire institution and physicalmeasurements.
Ethical issues
Ethical clearance was sought from the ethicalcommitteeoftheMinistryofHealth.
The households participating in the study wasinformedofthestudythrough“Thrompon”, themayorofthecity.Messagesontheactivityweretransmitted throughmassmedia.Subsequent tothis, the concerned enumerators alongwith thesupervisorsvisitedthehouseholdandexplainedaboutthestudyandinformedtheindividualstobepresentontheplanneddateofstudyatthepre-determinedcampfor thestudy.Consentfor thestudywastakenandthesubjectcouldvolunteeroutofthestudyiftheyfeelsoinduecourseoftime.Thosesubjectswhosebloodpressure,bloodsugarandcholesterollevelsweredetectedtobeabnormalwerecounseledandadvisedtoattendthenearesthealthfacility.
4. DEFINITIONS AND DIAGNOSTIC CRITERIA
Hypertension
Ameanofthelatertwobloodpressurereadingsof140mmHgsystolicbloodpressure(SBP)and/or90mmHgdiastolicbloodpressure(DBP),orgreater, was defined as hypertension. Subjectstaking antihypertensive medicines irrespectiveof blood pressure were also considered to behypertensive.
Hyperlipidaemia
Hypercholesterolemia is defined as a totalcholesterol concentration of 250mg/dl (6.5mmol/l) or greater.Values of 200- 249mg/dl (5.2- 6.4 mmol/l is defined as “borderlinehypercholesterolemia”andvaluesbelow200mg/dl(5.2mmol/l)areconsiderednormal.
Borderline hypertriglyceridemia is defined asa triglyceride value of 200-399mg/dl (2.3-4.5mmol/l) and high triglycerides as a value of400mg/dl(4.5mmol/l)orgreater.
Glucose intolerance
Diabetesmellitusandimpairedglucosetolerance(IGT) inadultsarebestdefinedon thebasisofbloodglucoseconcentrationmeasuredtwohoursaftera75goralglucosechallenge,followinganovernight fast of 8-14 hours and three days ofunrestricteddiet.
WHOcriteria(1999)fordiabetes,IGTandIFT

Bhutan StepS Survey report 2009
- 15 -
Anthropometry
Body mass index (BMI) is defined as weight(kg)dividedbysquareofheight(m)andwaist-hipratio(WHR),definedaswaistcircumference(cm)dividedbyhipcircumference(cm).
Normal BMI (18.5–24.9)kg/m2Grade1overweight BMI (25.0–29.9)kg/m2Grade2overweight BMI (30.0–39.9)kg/m2Grade3overweight BMI >40kg/m2
Waist Hip Ratio (WHR) is measured as anindicatorofcentralobesity.WHRofgreaterthan0.95formenandgreaterthan0.85forwomenisabnormal.
Unit of alcohol
Followingmeasureswereregardedasoneunitofalcoholfordifferenttypesofalcoholicbeverageeachcontaining10gramsofabsolutealcohol.Beer-285ml,otherspirits-30ml,Wine-120ml,Ara-120ml,Bangchang-285ml,Singchang-120ml.
Vegetable serving
Following measure of vegetable made one
serving.Raw,greenleafyvegetables 1cup(240ml).Cookedvegetable ½cup(120ml)
Fruit serving
Followingquantityoffruitmadeoneservingoffruit:
Mediumsizedapple,banana,orange: 1pieceChopped,cooked,cannedfruit: ½cup (120ml)Fruitjuice: ½cup (120ml)
The WHO recommends intake of at least 5servingsoffruitsandvegetablesaday.
METS
The symbol MET comes from metabolicequivalents of task. It is commonly used inmedicine to express metabolic rates measuredduring a treadmill test. Two definitions of theMETaremetwith,essentiallyequivalent:• 1 MET is equivalent to a metabolic rate
consuming 3.5 milliliters of oxygen perkilogramofbodyweightperminute.
• 1 MET is equivalent to a metabolic rate
Glucose concentration, mol/L (mg/dl)
Whole blood Plasma
Venous Capillary Venous
Diabetes MellitusFastingor2-hpostglucoseload
≥6.1(≥110)≥10.0(≥180)
≥6.1(≥110)≥11.1(≥200)
≥7.0(≥126)≥11.1(≥200)
Impaired Glucose Tolerance (IGT)Fasting(ifmeasured)and2-hpostglucoseload
<6.1(<110)&≥6.7(≥120)
<6.1(<110)&≥7.8(≥140)
<7.0(<126)&≥7.8(≥140)
Impaired Fasting Glycaemia (IFG)Fasting
and(ifmeasured)2-hpostglucoseload
≥5.6(≥100)&<6.1(<110)
<6.7(<120)
≥5.6(≥100)&<6.1(<110)
<7.8(<140)
≥6.1(≥110)&<7.0(<126)
<7.8(<140)
Valuesforvenousplasmaweretakenfordiagnosisofdiabetesmellitusinthestudy.

StepS Survey report 2009 Bhutan
- 16 -
consuming 1 kilocalorie per kilogram ofbodyweightperhour
• METs can be converted to kilocaloriesconsumed per minute: kcal/min =METs ×bodyweightinkilograms÷60.
• Oxygenconsumptioninlitersperhour=METs×bodyweightinkilograms÷0.21
Physical Activity
ThephysicalactivityperformedbyindividualsisconvertedintoMETminutes.QuestionsusedforMETestimationareP1toP15a&b.P1-P6a&b: activityatworkP7-P9a&b: traveltoandfroworkP10–P15a&b: recreationalactivities
TotalPhysicalActivityMET-minute/week(=thesumofthetotalMETminutesofactivitycomputedforeachsetting)
Equation:TotalPhysicalActivity=[(P2*P3*8)+(P5*P6*4)+(P8*P9*4)+(P11*P12*8)+(P14*P15*4)]
Level of total physical activity Physical activity cutoff value
High
If:(P2+P11)>=3daysANDTotalPhyiscalActivityMETminutesperweekis>=1500ORIf(P2+P5+P8+P11+P14)>=7daysANDtotalphysicalactivityMETminutesperweekis>=3000
Moderate
If:LevelofphysicalactivitydoesnotreachcriteriaforhighlevelsofphysicalactivityANDIf:(P2+P11)>=3daysAND{(P2*P3)+(P118P12)}>+60minutesORIf:(P5+P8+P14)>=5daysAND{9P5*P6)+(P8*P9)+(P14*P15)>=150minutesORIf:(P2+P5+P8+P11+P14)>=5daysANDTotalPhysicalActivityMETminutesperweek>=600
LowIflevelofphysicalactivitydoesnotreachthecriteriaforeitherhighormoderatelevelsofphysicalactivity
Data management
Datacollectedthroughinstitutionofquestionnaire,anthropometryandbiochemicalparametersweresimultaneously entered in computer by doubleentrymethodbyusingEpidata.Itwascompletedby the timedata collectionwas over.Thiswascarried out by a teamof threemembers of theResearchunit.ThisrawdatawascleanedinthenextfewmonthsandthefinalanalysiswasdoneinMay2009.
Statistical analysis
Data was analyzed using Epi Info. Poststratificationadjustmentweightswerecalculatedprior to the analysis to correct for differencesbetween the age-sex structures of the sampleversus the target population (2007 projectionsfrom the 2005 Thimphu census). Epi InfoprogramsprovidedbytheWHO,HeadQuartersinGenevawereusedtoproducethedescriptiveanalysis.

Bhutan StepS Survey report 2009
- 17 -
Datawasanalyzedforsubpopulationgroups(25to34males,35to44males,45to54males,55to64males,65to74malesand25to34females,35to44females,45to54females,55to64females,65to74females).Descriptiveanalysiswasalsodonefor25-64yearold.
5. RESULTS
Socio-demographic profile
2484respondentsofaged25-74yearsparticipatedin the survey. Of them 45.8%weremales and54.2 % were females. The distribution of therespondentsacrosstheagegroupsinbothsexeswasfairlyuniform(Seetable1).Whiletherewereslightlylessrespondentsin55-64and65-74agegroups, thenumberswere representativeof thesampleofthesourcepopulationofThimphucity.
Table 1: Age group and sex of respondents 25-74 including 25-64
AgeGroup(years)
Men Women Both Sexes
n % n % N %
25-34 259 46.9 293 53.1 552 22.2
35-44 260 47.4 288 52.6 548 22.145-54 259 46.0 304 54.0 563 22.755-64 206 45.2 250 54.8 456 18.465-74 154 42.2 211 57.8 365 14.7
25-74 1138 45.8 1346 54.2 2484 100.025-64 984 46.4 1135 53.6 2119 100.0
The respondents comprisedof followingethnicgroups: Ngalong(32.4%), Sharchop(38.0%),Bumtap/Kheng(8.3%),Lhotshampa(17.8%)andothers(3.6%).
Themeannumberofyearsoffulltimestudyatschoolforallrespondentswas3.1years.Malesattained mean of 4.6 years of education whilefemalesattained1.8yearsatschool.
By highest level of education achievementamong the respondents, 54.8% did not attendanyformalschooling,25.0%completedprimaryschool or less, 12.3% completed secondary or
high school, 4.4% completed either universityorpostgraduateeducationand3.5%non-formaleducationormonasticeducation.
Of the respondents, 18.4 % were governmentemployees, 7.0% non-government employee,13.6% self employed, 5.4 % in agriculture,7.0% inuniformed force and48.5%comprisedof non-paid, students, homemakers, retired orunemployedpeople.Outofthenon-paidgroup,72.0%werehomemakers.
Out of the households, 7.9% earned annualhousehold income of less than Nu.3000, 2.6%earnedNu3001-Nu.5000,3.9%earnedNu.5001-Nu.12,000, 7.1% earned Nu.12001-Nu.19000and78.5%earnedgreaterthanNu.19000.
Tobacco use
Outofalltherespondents,19.6%currentlyusedtobaccoproductseitherbysmokingorbyusingsmokelessproducts.83.3%ofthemweredailyusers.
Outofallrespondents,6.8%currentlysmokedany tobacco products such as cigarettes, bidi,cigars or pipes. Significantly more men thanwomensmoked(8.4%vs4.7%).
Whileonly5.6%ofthetotalrespondentssmokedanytobaccoproductsdaily,thevastmajorityof

StepS Survey report 2009 Bhutan
- 18 -
thecurrentsmokerssmokeddaily(82.2%).
Theprevalenceofdailysmokingwassignificantlygreater among the youngest age group 25-34years(9.8%)thaninanyoftheotheragegroups.(Seefigure1)
Among the daily smokers, the mean age ofinitiating daily smokingwas 20.9 years. Therewasnostatisticallysignificantdifferenceinageofsmokinginitiationamongmalesandfemales.
Among the daily tobacco smokers, 61.2 %smoked manufactured cigarette. The meannumber ofmanufactured cigarettes smokedperdaywas4.6while themeandailyconsumptionofrolledcigaretteswas3.5.
19.4% of respondents are current users ofsmokeless tobacco (snuff or chew tobacco orbetel nuts). Of these, 83.0% use smokelessformsoftobaccodaily.Amongdailysmokelesstobaccousers,betelnutwasused7.5 timesper
dayonaverageandchewingtobaccowasused7.2timesperdayonaverage(Seefigure2).Therewasnostatisticallysignificantdifferenceindailymean consumption betweenmales and femalesforbetelnutandchewingtobacco.
Alcohol
Of the total respondents 30.8% drank alcoholin the last 30 days. The prevalence of alcoholconsumption in this period was significantlyhigherformalesascomparedtofemales(34.9%vs25.5%).
Ofthosewhodrankinthelast12months,21.2%consumedatleastonedrinkperday.However,there was significant difference in drinkingfrequency with 7.9% of males drinking 5-6daysperweekascomparedto3.2%offemalesdrinking5-6daysperweek(seefigure3).
Amongthosewhodrank in the last12months,whilethemeanstandarddrinkonadrinkingdaywas2.6,withthemajorityofrespondents(45.2%)consuming2-3standarddrinksperdrinkingday.Males were significantly heavy drinkers with29.2%ofmales drinkingmore than 4 standarddrinksasopposedtoonly11.1%ofthefemalesonadrinkingday(seefigure4).Thenumberofstandard drinks increased among the older agepeople although this trend is not statisticallysignificant.
Ofthosewhodrankinthelast7days,11.9%ofmen and 12.1% of females had a binge-drinkon anyday.There is a general trendof greaterprevalence of binge drinking with increasingage. However these trendsonbingingneed tobeusedwithcautionduetothelessernumberofthepeople.
Ofmenwhodrankinthelast30days,4.9%ofmen who engaged in harmful drinking (>= 60gramsofpurealcoholperday)inthelast7dayswhile 3.6% of the females engaged in harmfuldrinking(>=40gramsofpurealcoholperday).Thedifferencewasnotstatisticallysignificant.
Figure2:Meantimeperdaysmokelesstobaccousedbytype
Bhutan StepS Survey report 2009
- 19 -
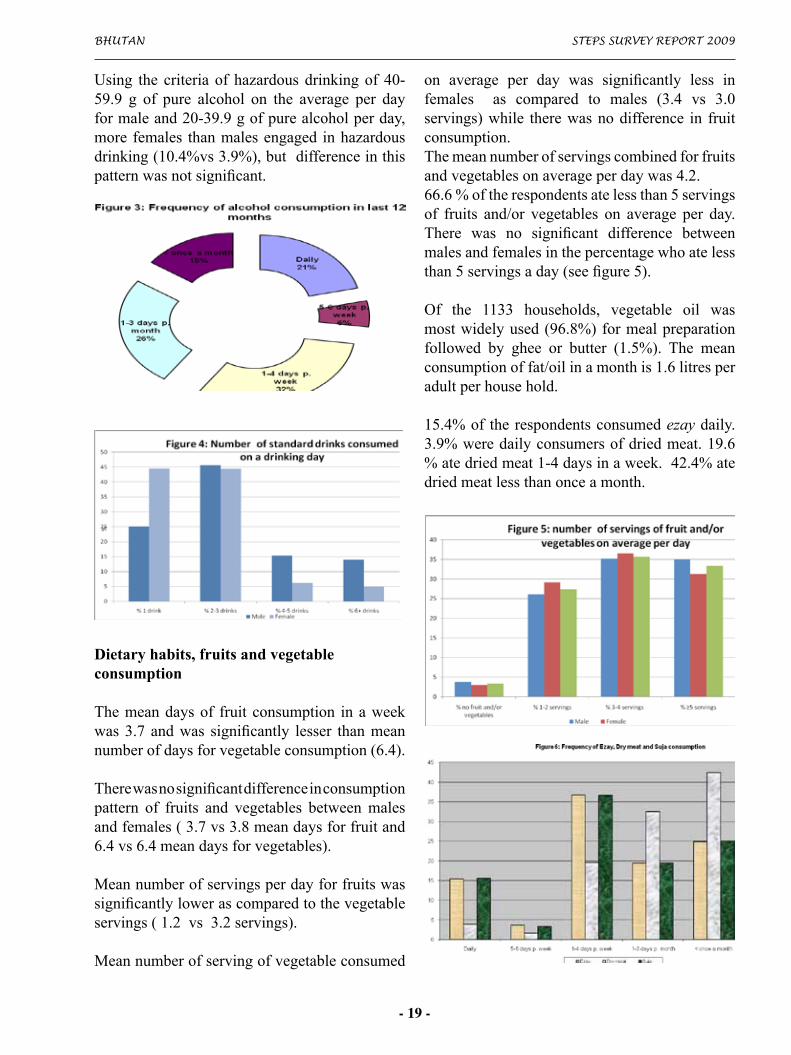
Using the criteriaof hazardousdrinkingof40-59.9 g of pure alcohol on the average per dayformaleand20-39.9gofpurealcoholperday,morefemales thanmalesengaged inhazardousdrinking(10.4%vs3.9%),butdifferenceinthispatternwasnotsignificant.
Dietary habits, fruits and vegetable consumption
Themeandaysof fruit consumption inaweekwas3.7 andwas significantly lesser thanmeannumberofdaysforvegetableconsumption(6.4).
Therewasnosignificantdifferenceinconsumptionpattern of fruits and vegetables betweenmalesandfemales(3.7vs3.8meandaysforfruitand6.4vs6.4meandaysforvegetables).
Meannumberofservingsperdayforfruitswassignificantlylowerascomparedtothevegetableservings(1.2vs3.2servings).
Meannumberofservingofvegetableconsumed
on average per day was significantly less infemales as compared to males (3.4 vs 3.0servings)while therewasnodifference in fruitconsumption.Themeannumberofservingscombinedforfruitsandvegetablesonaverageperdaywas4.2.66.6%oftherespondentsatelessthan5servingsof fruits and/or vegetables on average per day.There was no significant difference betweenmalesandfemalesinthepercentagewhoatelessthan5servingsaday(seefigure5).
Of the 1133 households, vegetable oil wasmostwidelyused(96.8%)formealpreparationfollowed by ghee or butter (1.5%). The meanconsumptionoffat/oilinamonthis1.6litresperadultperhousehold.
15.4%of therespondentsconsumedezaydaily.3.9%weredailyconsumersofdriedmeat.19.6%atedriedmeat1-4daysinaweek.42.4%atedriedmeatlessthanonceamonth.
StepS Survey report 2009 Bhutan
- 20 -
15.5%oftherespondentsdranksujadailywhile25%ofthemdranklessthanonceinamonth(seefigure6).
Physical activity
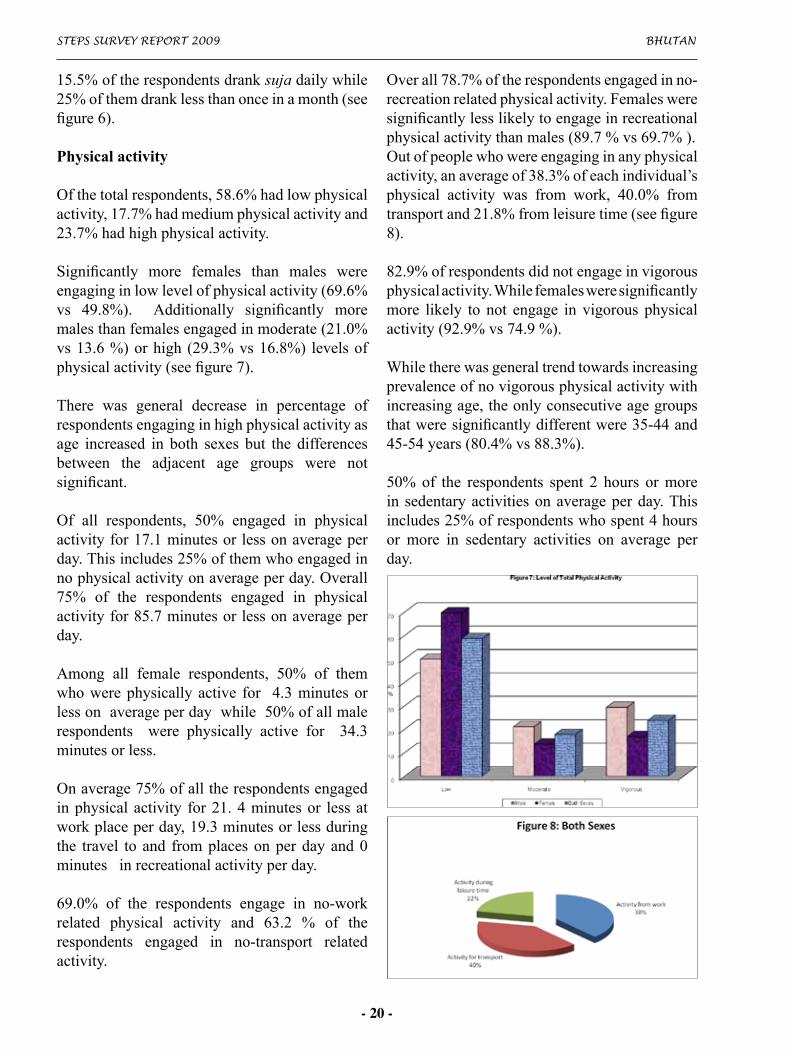
Ofthetotalrespondents,58.6%hadlowphysicalactivity,17.7%hadmediumphysicalactivityand23.7%hadhighphysicalactivity.
Significantly more females than males wereengaginginlowlevelofphysicalactivity(69.6%vs 49.8%). Additionally significantly moremalesthanfemalesengagedinmoderate(21.0%vs13.6%)orhigh (29.3%vs16.8%) levelsofphysicalactivity(seefigure7).
There was general decrease in percentage ofrespondentsengaginginhighphysicalactivityasage increased in both sexes but the differencesbetween the adjacent age groups were notsignificant.
Of all respondents, 50% engaged in physicalactivityfor17.1minutesorlessonaverageperday.Thisincludes25%ofthemwhoengagedinnophysicalactivityonaverageperday.Overall75% of the respondents engaged in physicalactivityfor85.7minutesorlessonaverageperday.
Among all female respondents, 50% of themwhowerephysicallyactive for 4.3minutesorlessonaverageperdaywhile50%ofallmalerespondents were physically active for 34.3minutesorless.
Onaverage75%ofalltherespondentsengagedinphysicalactivity for21.4minutesor lessatworkplaceperday,19.3minutesorlessduringthe travel to and fromplacesonperdayand0minutesinrecreationalactivityperday.
69.0% of the respondents engage in no-workrelated physical activity and 63.2 % of therespondents engaged in no-transport relatedactivity.
Overall78.7%oftherespondentsengagedinno-recreationrelatedphysicalactivity.Femalesweresignificantlylesslikelytoengageinrecreationalphysicalactivitythanmales(89.7%vs69.7%).Outofpeoplewhowereengaginginanyphysicalactivity,anaverageof38.3%ofeachindividual’sphysical activity was from work, 40.0% fromtransportand21.8%fromleisuretime(seefigure8).
82.9%ofrespondentsdidnotengageinvigorousphysicalactivity.Whilefemalesweresignificantlymore likely to not engage in vigorous physicalactivity(92.9%vs74.9%).Whiletherewasgeneraltrendtowardsincreasingprevalenceofnovigorousphysicalactivitywithincreasingage,theonlyconsecutiveagegroupsthatweresignificantlydifferentwere35-44and45-54years(80.4%vs88.3%).
50%of the respondents spent 2 hours ormoreinsedentaryactivitiesonaverageperday.Thisincludes25%ofrespondentswhospent4hoursor more in sedentary activities on average perday.

Bhutan StepS Survey report 2009
- 21 -
Blood pressure and diabetes history
17.1%oftherespondentshavebeendiagnosedwith raisedbloodpressureby ahealthworkersoradoctorinthepast12months.Therewasnosignificantdifferenceinpercentageindiagnosedinpast12monthsbetweenmalesandfemales.
Of the total respondents, 9.4% were currentlytaking drugs prescribed by doctor or healthworker.Forthosewhohavebeendiagnosedandon treatment, there is a general trend towardsincreasingprevalencewithincreasingagebutthedifferencebetweentheconsecutiveagegroupsisonlysignificantfor35-44and45-54years.
Aspartofhighbloodpressuretreatment,12.3%oftherespondentswerebeingadvisedbydoctoror health worker to have a special prescribeddiet,6.8%toloseweight,3.4%tostopsmokingand6.3%todoexercise.
1.0% of the respondents had consulted atraditionalhealerforraisedbloodpressureinthepast12monthswhile0.6%werecurrentlytakingherbal or traditional remedy for high bloodpressure.
1.0% of the respondents were seen by anindigenousphysicianinthelast12monthswhile0.7%werecurrentlytakingindigenousremedyforhighbloodpressure.
2.5%oftherespondentshadbeendiagnosedfordiabetesbydoctororhealthworkerinthelast12months.
0.4% of the respondents were currently takinginsulinprescribedfordiabetesbydoctororhealthworker.
1.9 % of the total respondents were currentlytakingoraldrugsprescribedbydoctororhealthworker.
As part of the diabetic treatment, 2.1% of therespondents were being advised by doctor or
healthworker tohaveaspecialprescribeddiet,1.6%toloseweight,0.8%tostopsmokingand1.7%todoexercise.
0.2% of the respondents had consulted atraditionalhealerforraisedbloodpressureinthepast12monthswhile0.2%werecurrentlytakingherbal or traditional remedy for high bloodpressure.
0.2 % of the respondents were seen by anindigenousphysicianinthelast12monthswhile0.2%werecurrentlytakingindigenousremedyforhighbloodpressure.
Physical measurement
12.1%ofrespondentswereobese(BMI>=30.0kg/m2).Femalesweresignificantlymoreobesedthan males (15.3 % vs 9.5%). 2.0% wereunderweight(BMI<18.5kg/m2).
51.5%ofmenwereoverweight(BMI>25kg/m2)while53.5%offemaleswereoverweight.Therewasnosignificantdifferencebetweenmalesandfemalesinbeingoverweight.
Mean waist circumference for males was 83.7cmand82.1cmforfemales.
Meanhipcircumferenceformaleswas92.9cmand 94.6 cm for females. Mean waist and hipratiowas0.9cmforbothmalesandfemales.
Overallmeansystolicbloodpressurewas124.7mmHg and mean diastolic blood pressure was79.5mmHg.
22.1% of the respondents had raised bloodpressure (SBP>=140mmHg and /or DBP>=90mmHg). Significantly males had higherprevalenceofraisedbloodpressureascomparedtofemales(24.8%vs18.6%).
26.0% of the respondents had raised bloodpressureorwereoncurrentlyonmedicationforraisedbloodpressure.

StepS Survey report 2009 Bhutan
- 22 -
5.1%arecurrentlyonmedicationforraisedbloodpressure.
6.9%oftherespondentshadraisedbloodpressure(SBP>=160mmHgand /orDBP>=100mmHg),excluding on those on raised blood pressure.11.6%hadraisedbloodpressureorarecurrentlyundermedicationforraisedbloodpressure.
Meanheartrateamongtherespondentswas75.8beats perminute. 2.4% of the respondents hadheartrateofover100beatsperminute.
Biochemical measurement
The mean fasting glucose level for all therespondentsexcludingthosecurrentlyondiabetesmedicationwas5.9mmol/L (106.7mg/dl). 8.2%of the respondents had either been previouslydiagnosed with diabetes or had been found tohaveraisedfastingorpostprandialglucosebloodsugar.Agreaterpercentageofmalesthanfemaleshad raised fasting or post prandial blood sugarbutthedifferencewasnotsignificant.
4.0% of respondents had impaired glucosetoleranceand21.6%werefoundtohaveimpairedfastingglycemia.Greaterpercentageoffemalesthanmaleshadhigherimpairedfastingglycemiabutthedifferenceisnotsignificant.
Meancholesterolamongallrespondentswas4.8mmol/Lor186.5mg/dl.
44.3%oftherespondentshadacholesterollevel>=5.0mmol/L(>=190mg/dl)while9.2%oftherespondentshadcholesterollevel>=6.2mmol/L(>=240mg/dl).
Among all respondents, mean high densitylipoprotein (HDL)was 1.3mmol/L ( 51.1mg/dl).
18.4%ofmaleshadHDL<1.03mmol/L (<40mg/dl).47.0%offemalerespondentshadHDL<1.29mmol/L(<50mg/dl).
Mean fasting triglyceride among all therespondentsis1.6mmol/L(141.2mg/dl).Meantriglyceride level for males was 1.8mmol/L(156.0mg/dl)whilemean for femaleswas 1.4mmol/L(121.6mg/dl).
Amongall respondents,30.4%had triglyceides>=1.7mmol/L(>=150mg/dl).
Males (36.9 %) were significantly more likelythan females (21.8%) to have triglycerideselevatedatthislevel.
21.5% among all respondents had triglycerides>=2.0 mmol/L (>=180 mg/dl). Males (27.2%)were significantly more likely than females(14.0%) to have triglycerides elevated at thislevel.
Raised risk
Thefollowingriskfactorswere included in thecombinedanalysistoassesstheraisedrisk:currentdailysmokersLessthan5servingsoffruitsand/orvegetablesonaverageperdayLowlevelofactivityOverweight(BMI>25kg/m2)Raised blood pressure (SBP>140 and/or DBP>=90mmHgorcurrentlyonmedicationforraisedbloodpressure)Among all respondents, 6.1 % had no riskfactors, 59.1%had 1-2 risk factors, 34.8%had3-5 risk factors.Among females, 5.1% had norisk factors, 56.5%had1-2 risk factors, 38.4%had3-5riskfactors.Amongmales, 6.9% had no risk factor, 61.2%had1-2riskfactors,31.9%had3-5riskfactors.Women were significantly more likely to have3-5riskfactorsascomparedtomales.Nearlyhalf(46.2%)oftherespondentsaged45-74yearshave3ormoreriskfactorsandoveraquarter(28.1%)ofrespondentsaged24-44have3ormoreriskfactors.

Bhutan StepS Survey report 2009
- 23 -
6. DISCUSSIONS
The objective of the survey was to establishbaseline for selected risk factors for non-communicablediseasesThimphuforintroducingeffective interventions for the population. Fivemodifiableriskfactorstobaccouse,alcoholuse,vegetableand/orfruitconsumption,andphysicalactivity have been studied. Further diabetes,raised blood pressure and raised cholesterolprevalenceisalsostudiedtoestablishasurrogatemeasurefornon-communicablediseasesituation.
Tobacco use:
Althoughtheoverallprevalenceofsmokerswasrelativelylow(6.8%),mostpeoplewhosmokeddid so on a daily basis (82.2%). About onefifth (19.4%)used smokeless tobaccoproducts,most of whom (83.0%) used daily (combinedexposure to through daily consumption is veryhigh (83.3%). Overall nearly 20 %(19.6%) ofThimphupopulation isexposed tohealth riskthrough tobaccousemostofwhomwereusingthe smokeless formeven though theBhutaneselawrestrictssaleofalltobaccoproducts.Giventhehigherprevalenceofsmokingamongtheyoungeragegroupascomparedtoolderagegroup, suggests a potential for an increase inoverallsmokingprevalence.
Alcohol use
While the prevalence of alcohol consumptionis not very high (30.8%), over 10% of current
drinkers(thosewhodrankinthelast30days)haveengaged in binge drinking within the previousweek, indicating relatively high occurrence ofunsafedrinkingpracticeamongthosewhodrank.
Dietary habits, fruits and vegetable consumption Overalltwothirdofthepopulation(66.6%)arenot eating enough fruits and vegetables(lessthan five combined servings per day). Theconsumptions of fruit are particularly low (1.2serving a day) and not very frequent (3.7 daysperweek).
Overhalfthepopulationconsumedezay(56.7%)andsuja(55.5%)atleastonceaweek.Sujausemayincreasetheconsumptionofbutterandsaltwhileezaymaybeagoodsourceofsaltandotherharmfulpreservatives.
Overquarter(25.1%)eatdriedmeatatleastonceaweek.However, the studydidnot collect thepractice of whether there was consumption ofsmokedorburntdriedmeat,which incase isaknownriskfactorforcancers.
Physical activity
The majority of the population (58.6%) is notattaining the minimum requirement of healthenhancing physical activity. In addition, 17.7%are just barely attaining this level of physicalactivity.Halfthepopulationisonlygetting17.1minutesorlessphysicalactivityonaverageperday.
Females are significantly more inactive thanmales.Almosttwothird(63.2%)arenotgettinganyphysicalactivityfromtransport(eg,theydonotwalkorcycletotransportthemselves).Overthree quarters (78.7%) do not get any physicalactivityduringtheirrecreationtimeorfreetime.
Blood pressure and diabetes history
Nearly one fifth (17.1%) of the respondents
StepS Survey report 2009 Bhutan
- 24 -
had raised blood pressure while 2.5% of therespondentswere diagnosed for diabetes in thelast12monthsbyhealthworkerordoctor.
Besides seeking medical treatment and advicefrom the health workers, people consulttraditional healers for raised blood pressure(1.0%)anddiabetes(0.2%).
Physical measurement
While prevalence of obesity (BMI>=30.0kg/m2) was relatively low (12.1%), over half thepopulationwasoverweight(BMI>=24.9kg/m2)in both the sexes, males (51.5%) and females(53.5%).22.1%ofthepopulationhadraisedbloodpressure(SBP>=140mmHg and/or DBP>=90mmHg)on physical measurement. The problem wassignificantlyhigherinmalesthanfemales(24.8%vs18.6%).6.9%hadraisedbloodpressure(SBP>=160mmHgand /or DBP>=100mmHg) on physicalmeasurement (Excluding those on raised bloodpressure).Mean waist circumference for males was 83.7cmand82.1cmforfemales.
Biochemical measurement (Discuss)
44.3% had a cholesterol level =5.0mmol/L(>=190mg/dl) while 9.2% of the respondentshadcholesterollevelof>=6.2mmol/L(>=240mg/dl).18.4%ofmaleshadHDL<1.03mmol/L(<40mg/dl). 47.0% of females had HDL <1.29mmol/L(<50mg/dl).Amongallrespondents,30.4%hadtriglycerides>=1.7mmol/L(>=150mg/dl).Males (36.9 %) were significantly more likelythan females (21.8%) to have triglycerideselevatedatthislevel.21.5% among all respondents had triglycerides>=2.0 mmol/L (>=180 mg/dl). Males (27.2%)were significantly more likely than females(14.0%) to have triglycerides elevated at thislevel.
Raised risks
Majorityofthepopulationwasexposedtoatleastone of the risk factors (93.1%). Categorically,56.5% were exposed to 1-2 risk factors and38.4%had3-5riskfactors.Significantlywomen(38.4%)aremorelikelytobeexposedthanmales(31.9%)tomultipleriskfactors. Exposure to risk is also higher amongolderagegroupofpeopleascomparedtoyoungergroupwithnearlyhalf(46.2%)agedbetween45-74yearshad3ormore risk factorswhileoveraquarter (28.1%)of25-44agegrouphad3ormoreriskfactors.
7. LIMITATIONS
It should be recognized that the study is basedonacrosssectionaldata.Therefore,thethereisnocausalinferencesbetweenthevariables.ThedatarepresentstheurbanpopulationinThimphucity.Therefore,thestudydoesnotindicatehowthesituationmightcomparewithotherurbanandruralsettingsinthecountry.
Duetothealonggapindatacollectionanddataanalysis,detailsindatacollectionandinterviewmethods could not be ascertained as the datacollectionformsandinterviewsheetswerenotavailableduetopoordatakeeping.
Physicalactivityanddietarypatternsarehighlysubject to recall problems in the participants.Whiletobaccoandalcoholuseinformationmayposesocialdesirabilitybias.Theprocessofdatacollectioncouldnotindicatehowtheseproblemsweremanagedduringthesurvey.
8. CHALLENGES FACED DURING THE SURVEY
TheSTEPSURVEYisexpensiveandlaboriousas it involvescollectionofbiological specimenfor biochemical assessments. The laboratorytechniciansandtheenumeratorsworkedforlonghourstocompletethesurvey.Informationsheetshavetobefilledmanuallywithoutanyelectronicgadgets.

Bhutan StepS Survey report 2009
- 25 -
DuetothelackofanypriorexperienceinSTEPsurvey, the Ministry of Health had to rely ontheexternalsupportoftheWHOfordesignandanalysis.
9. RECOMMENDATIONS
TheWHOSTEP survey to compareNCD riskfactors in rural and urban setting is highlydesirableinfuture.
Inaddition, tomonitor thechangeinNCDriskfactorsandevaluatetheimpactsinthepopulationasaresultofinterventions,WHOSTEPsurveymustbedoneonaroutinebasis(eg,threeorfiveyearly)bytheMinistryofHealth.
TheThimphusurveythoughlimitedsuggeststhathigh proportion of Bhutanese may be exposedtomultipleNCDriskfactors.Inordertoreducethe health risks, intense health promotion topreventfromNCDsandtominimizeexposureofpopulationrisksisimperative.Inparticular,goodstrategies must be designed and implementedtopromotephysical activity, healthydiet, saferuse of alcohol, and tobacco cessation acrosscommunitiesinBhutan.
Duetothemulti-factorialcausationoftheNCDs,preventionismosteffectivewhentackledthrougha true multi-sectoral approach. The currentinformation of the NCD risk factors must bedisseminatedtowiderangingaudiencesofpolicymakers, relevant institutions, dzongkhagmulti-sectoraltaskforcesforHIV,healthprofessionals,ruralandurbancommunitiestogenerategreaterunderstandingformulti-sectoralcollaborationinfuture.
Analytical epidemiological studies andqualitative studiesmust be conducted in futuretounderstandmoreonbehavioral andattitudestotobacco,alcohol,physicalactivityanddietarypractices and other NCD risk factors so thatappropriate behavioral interventions can bedesignedamongthepopulation.
10. CONCLUSION
Given that vast majority of the population inThimphu is exposed to at least one of the riskfactors (93.1%) or 56.5% exposed to 1-2 riskfactorsand38.4%exposedto3-5riskfactors,itcanbespeculatedthatthereisahugepotentialofupsurgeofNCDs.
The down-stream NCDs as a result of suchrisk exposures is already being manifestedwith prevalence of raised blood pressure ofnearly one fifth (17.1%) and diabetes of 2.5%among the respondents.Nearlyhalf (44.3%)ofthe respondents had high level of cholesterol(>=190mg/dl). Although the prevalence isrelativelylow,thefigurescanrise.
Bhutanmustpayattentiontoimplementevidencebased public health interventions urgentlyto prevent and control the epidemic of NCDloomingoverthepopulation.
References:GlobalPhysicalActivityQuestionnaire(GPAQ)AnalysisGuidePreventingCHRONICDISEASESavitalinvestment,WorldHealthOrganizationStatisticalYearbookofBhutan2008PopulationandHousingCensusofBhutan2005AnnualHealthBulletin2008BhutanLivingStandardSurvey(BLSS)2007

StepS Survey report 2009 Bhutan
- 26 -
ANNEXI(Physicalactivity)
For calculation of a person’s overall energyexpenditure using GPAQ data, the followingMETvaluesareused:
Domain METvalue
WorkModerateMETvalue=4.0VigorousMETvalue=8.0
Transport CyclingandwalkingMETvalue=4.0
RecreationModerateMETvalue=4.0VigorousMETvalue=8.0
Forcalculationofacategoricalindicator,thetotaltime spent in physical activity during a typicalweek,classifyingpopulationsarelow.Moderatethe numbers of day as well as the intensity ofthephysicalactivityaretakenintoaccount.Thethree levels of physical activity suggested forclassifying populations are low, moderate andhigh. The criteria for these levels are shownbelow.
HighApersonreachinganyofthiscategory:• Vigorous–intensityactivityonatleast3days
achievingaminimumofatleast1500METminutes/weekOR
• 7ormoredaysofanycombinationofwalking,moderate or vigorous intensity activitiesachieving aminimumof at least 3000METminutesperweek.
ModerateApersonnotmeetingthecriteriaforthe“high”category, but meeting any of the followingcriteria:• 3ormoredaysofvigorous–intensityactivity
ofatleast20minutesperdayOR• 5ormoredaysofmoderate-intensityactivity
orwalkingofatleast30minutesperdayOR• 5 or more days of any combination of
walking, moderate-or vigorous intensityactivities achieving a minimum of at least600MET–minutesperweek
LowApersonnotmeetinganyoftheabovementionedcriteriafallsinthiscategory.

Bhutan StepS Survey report 2009
- 27 -
ANNEXII Participant Identification Number:
WHOSTEPSINSTRUMENTFORCHRONICDISEASERISKFACTORSURVEILLANCEROYALGOVERNMENTOFBHUTANTHIMPHU/BHUTAN
LocationandDate Response Code
1 Town I1
2 Block I2
3 Household I3
4 Person I4
5 Date of completion of the instrument ddmmyear
I5
Participant Identification Number :
Consent,InterviewLanguageandName Response Code
6 ConsenthasbeenreadouttoparticipantYes 1
I6No
2If NO, read consent
7 Consenthasbeenobtained(verbalorwritten)
Yes 1
I7No 2If NO, END
8InterviewLanguage[InsertLanguage]
English 1
I8
Dzongkha 2Sharchhop 3LhotshamBumtap/KhenghaOthers
456
9Timeofinterview(24hourclock)
hrsmins
I9
10 NameofRespondent I10
AdditionalInformationthatmaybehelpful
11 Contactphonenumberwherepossible I12
12 Specifywhosephone
Work 1
I13
Home 2
Neighbour 3
Other (specify)
4

StepS Survey report 2009 Bhutan
- 28 -
ParticipantIdentificationNumber:
Step 1 Demographic Information
CORE: Demographic Information
Questions Response Code
13Sex(Record Male / Female as observed
Male 1
C1Female 2
14Whatisyourdateofbirth?Don’t Know 77 777 7777
If known, go to C4ddmmyear
C2
15 Howoldareyou? Years C3
16Intotal,howmanyyearshaveyouspentatschoolorinfull-timestudy(excludingpre-school)?
Years C4
EXPANDED: Demographic Information Response Code
17Whatethnic/culturalgroupdoyoubelongto?
Ngalong 01
C5
Sharchop 02
Bumtap/Kheng 03
Lhotshampa 04
Others 05Refused 08
18
Whatisthehighestlevelofeducationyouhavecompleted?
Noformalschooling 01
C6
Lessthanprimaryschool 02
Primaryschoolcompleted 03
Secondaryschoolcompleted 04
Highschoolcompleted 05
College/Universitycompleted 06
Postgraduatedegree 07
Non-FormalEducation&Monastic 08
Refused 88

Bhutan StepS Survey report 2009
- 29 -
19
Whichofthefollowingbestdescribesyourmainworkstatusoverthelast12months?
Governmentemployee 01
C7
Non-governmentemployee 02
Self-employed 03
Agriculture 04
Student 05
Homemaker/Housewife 06
Retired 07
Clergy/LayMonks 08
UniformedForce 09
Unemployed(abletowork) 10Unemployed(unabletowork) 11Refused 88
20Howmanypeopleolderthan18years,includingyourself,liveinyourhousehold?
Numberofpeople C8
21
CanyougiveanestimateoftheannualhouseholdincomeifIreadsomeoptionstoyouifyoudon’tknow?Isit
[INSERT QUINTILE VALUES](READ OPTIONS)
Lessthan3000 01
C10
Nu.3001toNu5000 02
Nu5001to12,000 03
Nu.12001toNu.19000 04
Nu19,000above 05
Don’tKnow 07
Participant Identification Number:
Step 1 Behavioural Measurements
CORE: Tobacco Use
NowIamgoingtoaskyousomequestionsaboutvarioushealthbehaviours.Thisincludesthingslikesmoking,drinkingalcohol,eatingfruitsandvegetablesandphysicalactivity.Let’sstartwithtobacco.
Questions Response Code
23Doyoucurrentlysmokeanytobacco products,suchascigarettes,bidi,cigarsorpipes?
Yes 1
T1No 2If No, go to T6
24Doyoucurrentlysmoketobaccoproductsdaily
Yes 1T2
No 2If No, go to T6
25Howoldwereyouwhenyoufirst started smokingdaily?
Age(years)If Known, go to T5a T3
Don’tremember777

StepS Survey report 2009 Bhutan
- 30 -
26
Doyourememberhowlongagoitwas?
(RECORD ONLY 1, NOT ALL 3)
Don’tremember777
InYearsIf Known, go to T5a T4a
ORinMonthsIf Known, go to T5a T4b
ORinWeeks
T4c
27Onaverage,how manyofthefollowingdoyousmokeeachday?
Manufacturedcigarettes T5a
Hand-rolledcigarettesorbidi
T5b
(RECORD FOR EACH TYPE)Pipesfulloftobacco T5c
Don’tremember777Cigars,cheroots, T5d
Other T5e
EXPANDED: Tobacco Use
Questions Response Code
28 Inthepast,didyoueversmokedailyYes 1
T6No 2 If No, go to T9
29Howoldwereyouwhenyoustoppedsmokingdaily?
Age(years)
If Known, go to T9T7
Don’tremember777
30
Howlong agodidyoustopsmokingdaily? (RECORD ONLY 1, NOT ALL 3)
Don’tremember777
Yearsago If Known, go to T9 T8a
ORMonthsago If Known, go to T9 T8b
ORWeeksago T8c
31
Doyoucurrently use anysmokeless tobaccosuchas[snuff, khaini (chewing tobacco), doma (betel)]?(
Yes 1
T9No 2 If No, go to T12
32Doyoucurrently usesmokeless tobaccoproductssuchas[snuff, khaini (chewing tobacco), doma (betel) daily?
Yes 1
T10
No2 If No, go to T12
Participant Identification Number :
EXPANDED: Tobacco Use, contd.
Questions Response Code
33Onaverage,howmanytimes a daydoyouuse…. Snuff,bymouth T11a

Bhutan StepS Survey report 2009
- 31 -
Snuff,bynose T11b
Khaini(Chewingtobacco)
T11c
(RECORD FOR EACH TYPE) Doma(Betel,quid) T11dDon’tKnow777 Other If Other, go to T11 other T11e
Don’tKnow
34
Inthepast,didyouever usesmokelesstobaccosuchas[snuff, khaini (chewing tobacco), doma (betel)]daily?
Yes 1
T12No 2
CORE: Alcohol Consumption
Thenextquestionsaskabouttheconsumptionofalcohol.
Questions Response Code
35
Haveyouconsumedalcohol(suchasbeer,wine,spirits,fermentedcider(ara, bangchang, singchang)withinthe past 12 months?
Yes1
A1No 2 If No, go to D1
36
Inthepast12months,how frequentlyhaveyouhadatleastonedrink?(READ RESPONSESUSE SHOWCARD)
Daily 1
A2
5-6daysperweek 21-4daysperweek 31-3dayspermonth 4Lessthanonceamonth
5
37Whenyoudrinkalcohol,on average,howmanydrinksdoyouhaveduringoneday.
NumberDon’tknow77
A3
38
Haveyouconsumedalcohol(suchasbeer,wine,spirits,fermentedcider,ara,bangchang,singchang]withinthe past 30 days?(USE SHOWCARD OR SHOW EXAMPLES)
Yes 1
A4
No 2 If No, go to A 6
39
Duringeachofthepast 7 days,howmanystandarddrinksofanyalcoholicdrinkdidyouhaveeachday?
(RECORD FOR EACH DAY USE SHOWCARD)
Monday A5a
Tuesday A5b
Wednesday A5c
Thursday A5d
Friday A5e
Saturday A5f
Sunday A5g
Don’tKnow77
Participant Identification Number :

StepS Survey report 2009 Bhutan
- 32 -
CORE: Diet
The next questions ask about the fruits and vegetables that you usually eat. I have a nutrition card here that shows you some examples of local fruits and vegetables. Each picture represents the size of a serving. As you answer these questions please think of a typical week in the last year.
Questions Response Code
40Inatypicalweek,onhowmanydaysdoyoueat fruit?
NumberofdaysIfZerodays,gotoD3 D1
Don’tKnow77
41Howmanyservingsoffruitdoyoueatononeofthosedays?(USE SHOWCARD)
NumberofservingsDon’tKnow77
D2
42
Inatypicalweek,onhowmanydaysdoyoueat vegetables?
(USE SHOWCARD)
NumberofdaysDon’tKnow77
If Zero days, go to D5 D3
43Howmany servingsofvegetablesdoyoueatononeofthosedays?(USE SHOWCARD)
Numberofservings
D4Don’tKnow77
EXPANDED: Diet
44
Whattypeofoil or fat is most oftenusedformealpreparationinyourhousehold?
(USE SHOWCARDSELECT ONLY ONE)
Vegetableoil 01
D5
AnimalFat 02
Butterorghee 03
Margarine 04
Other 05 If Other, go to D5 other
Noneinparticular 06
Noneused 07Don’tknow 77
Other D5other
45Totalamountoffat/oilusedinamonth(allformstogether)
Numberinlitres X1
46Howmanymembersofthefamilyeatfromthesamepot?
Numberofpeople X2
47Howfrequentlydoyoueat“Ezay”?
Daily 01
X3
5-6daysperweek 02
1-4daysperweek 03
1-3dayspermonth 04
Lessthanonceamonth 05

Bhutan StepS Survey report 2009
- 33 -
48Howfrequentlydoyoueatdrymeat?
Daily 1
X4
5-6daysperweek 2
1-4daysperweek 3
1-3dayspermonth 4
Lessthanonceamonth 5
49Howfrequentlydoyoudrinksuja?
Daily 1
X5
5-6daysperweek 2
1-4daysperweek 3
1-3dayspermonth 4
Lessthanonceamonth 5
ParticipantIdentificationNumber
CORE: Physical Activity
NextIamgoingtoaskyouaboutthetimeyouspenddoingdifferenttypesofphysicalactivityinatypicalweek.Pleaseanswerthesequestionsevenifyoudonotconsideryourselftobeaphysicallyactiveperson.Thinkfirstaboutthetimeyouspenddoingwork.Thinkofworkasthethingsthatyouhavetodosuchaspaidorunpaidwork,study/training,householdchores,harvestingfood/crops,fishingorhuntingforfood,seekingemployment.[Insert other examples if needed]. Inansweringthefollowingquestions‘vigorous-intensityactivities’areactivitiesthatrequirehardphysicaleffortandcauselargeincreasesinbreathingorheartrate,‘moderate-intensityactivities’areactivitiesthatrequiremoderatephysicaleffortandcausesmallincreasesinbreathingorheartrate.
Questions Response Code
Activity at work
50
Doesyourworkinvolvevigorous-intensityactivitythatcauseslargeincreasesinbreathingorheartratelike[carrying or liftingheavy loads, digging or construction work]foratleast10minutescontinuously?
Yes 1
P1
No 2 If No, go to P 4
51Inatypicalweek,onhowmanydaysdoyoudovigorous-intensityactivitiesaspartofyourwork?
NumberofdaysP2
52Howmuchtimedoyouspenddoingvigorous-intensityactivitiesatworkonatypicalday?
Hours:minutes
HoursMins
P3(a-b)

StepS Survey report 2009 Bhutan
- 34 -
53
Doesyourworkinvolvemoderate-intensityactivitythatcausessmallincreasesinbreathingorheartratesuchasbriskwalking [or carrying light loads]foratleast10minutescontinuously
Yes 1
P4
No 2 If No, go to P 7
54Inatypicalweek,onhowmanydaysdoyoudomoderate-intensityactivitiesaspartofyourwork?
Numberofdays P5
55Howmuchtimedoyouspenddoingmoderate-intensityactivitiesatworkonatypicalday?
Hours:minutes
hrsmins
P6(a-b)
Travel to and from places
Thenextquestionsexcludethephysicalactivitiesatworkthatyouhavealreadymentioned.NowIwouldliketoaskyouabouttheusualwayyoutravel to and from places.Forexampletowork,forshopping,tomarket,toplaceofworship.[insertotherexamplesifneeded]
56
Doyouwalkoruseabicycle(pedal cycle)foratleast10minutecontinuouslytogettoandfromplaces?
Yes 1 P7
No 2 If No, go to P 10
57
Inatypicalweek,onhowmanydaysdoyouwalkorbicycleforatleast10minutescontinuouslytogettoandfromplaces?
Numberofdays P8
58Howmuchtimedoyouspendwalkingorbicyclingfortravelonatypicalday?
Hours:minutes hoursmins
P9(a-b)
Recreational activities
Thenextquestionsexcludetheworkandtransportactivitiesthatyouhavealreadymentioned.NowIwouldliketoaskyouaboutsports,fitnessandrecreationalactivities(leisure),[insertrelevantterms].
59
Doyoudoanyvigorous-intensitysports,fitnessorrecreational(leisure)activitiesthatcauselargeincreasesinbreathingorheartratelike[running or football, aerobics,]foratleast10minutescontinuously?
Yes 1
P10
No 2 If No, go to P 13

Bhutan StepS Survey report 2009
- 35 -
60Inatypicalweek,onhowmanydaysdoyoudovigorous-intensitysports,fitnessorrecreational(leisure)activities?
Numberofdays P11
61Howmuchtimedoyouspenddoingvigorous-intensitysports,fitnessorrecreationalactivitiesonatypicalday?
Hours:minutes
hrsmins
P12(a-b)
CORE: Physical Activity (recreational activities) contd.
Questions Response Code
62
Doyoudoanymoderate-intensitysports,fitnessorrecreational(leisure)activitiesthatcausesasmallincreaseinbreathingorheartratesuchasbriskwalking,(cycling, swimming, archery, dego, khuru, volleyball)foratleast10minutescontinuously
Yes 1
P13
No 2If No, go to P16
63Inatypicalweek,onhowmanydaysdoyoudomoderate-intensitysports,fitnessorrecreational(leisure)activities?
Numberofdays P14
64Howmuchtimedoyouspenddoingmoderate-intensitysports,fitnessorrecreational(leisure)activitiesonatypicalday?
Hours:minuteshrsmins
P15(a-b)
Sedentary behaviour
Thefollowingquestionisaboutsittingorrecliningatwork,athome,gettingtoandfromplaces,orwithfriendsincludingtimespent[sittingatadesk,sittingwithfriends,travellingincar,bus,train,reading,playingcardsorwatchingtelevision],butdonotincludetimespentsleeping.
65Howmuchtimedoyouusuallyspendsittingorrecliningonatypicalday?(both at home and at work place)
Hours:minuteshours
mins
P16(a-b)
EXPANDED: History of Raised Blood Pressure
Questions Response Code
66Whenwasyourbloodpressurelastmeasuredbyahealthprofessional?
Withinpast12months 1
H11-5yearsago 2
Notwithinpast5years 3

StepS Survey report 2009 Bhutan
- 36 -
67Duringthepast12monthshaveyoubeentoldbyadoctororotherhealthworkerthatyouhaveraisedbloodpressureorhypertension?
Yes 1
H2No 2
68Areyoucurrentlyreceivinganyofthefollowingtreatmentsforraisedbloodpressureprescribedbyadoctororotherhealthworkeraswellasanyadvice?
Drugs(medication)thatyouhavetakeninthelast2weeks
Yes 1H3a
No 2
SpecialprescribeddietYes 1
H3bNo 2
AdviceortreatmenttoloseweightYes 1
H3cNo 2
AdviceortreatmenttostopsmokingYes 1
H3dNo 2
AdvicetostartordomoreexerciseYes 1
H3eNo 2
69Duringthepast12monthshaveyouseenatraditionalhealerforraisedbloodpressureorhypertension
Yes 1
H4No 2
70Areyoucurrentlytakinganyherbalortraditionalremedyforyourraisedbloodpressure?
Yes 1
H5No 2
71Duringthepast12monthshaveyouseenanIndigenousPhysician(Drungtso/Menpa)forraisedbloodpressureorhypertension
Yes 1
X6No 2
72AreyoucurrentlytakinganyIndigenousremedyforyourraisedbloodpressure?
Yes 1X7
No 2
ParticipantIdentificationNumber
EXPANDED: History of Diabetes
Questions Response Code
73Haveyouhadyourbloodsugarmeasuredinthelast12months?
Yes 1H6
No 2
74Duringthepast12months,haveyoueverbeentoldbyadoctororotherhealthworkerthatyouhavediabetes?
Yes 1
H7No 2
75Areyoucurrentlyreceivinganyofthefollowingtreatmentsfordiabetesprescribedbyadoctororotherhealthworkeraswellasanyadvice?

Bhutan StepS Survey report 2009
- 37 -
InsulinYes 1
H8aNo 2
Oraldrug(Oralhypoglycemicmedication)thatyouhavetakeninthelast2weeks
Yes 1H8b
No 2
SpecialprescribeddietYes 1
H8cNo 2
AdviceortreatmenttoloseweightYes 1
H8dNo 2
AdviceortreatmenttostopsmokingYes 1
H8eNo 2
Advicetostartordomoreexercise Yes 1 H8fNo 2
76Duringthepast12monthshaveyouseenaTraditionalHealerfordiabetes?
Yes 1H9
No 2
77Areyoucurrentlytakinganyherbalortraditionalremedyforyourdiabetes?
Yes 1H10
No 2
78Duringthepast12monthshaveyouseenanIndigenousPhysician(Drungtso/Menpa)fordiabetes?
Yes 1X8
No 2
79AreyoucurrentlytakinganyIndigenousremedyforyourdiabetes?
Yes 1X9
No 2
ParticipantIdentificationNumber:Step 2 Physical Measurements
CORE: Height and Weight Response Code
80 InterviewerIDM1
81 DeviceIDsforheightandweightHeight M2a
Weight M2b
82 Height inCentimetres(cm) . M3
83WeightIf too large for scale, code 666.6
inKilograms(kg) . M4
84(For women)Areyoupregnant? Yes 1 If Yes, go to M 8
M5No 2
CORE: Waist
85 DeviceIDforwaist M6
86Waistcircumference(Measure at the level of umbilicus)
inCentimetres(cm) . M7
CORE: Blood Pressure
87 InterviewerID M8
88 DeviceIDforbloodpressure M9

StepS Survey report 2009 Bhutan
- 38 -
89 Cuffsizeused
Small
M10Medium 2
Large 3
90 Reading1 Systolic(mmHg) M11a
Diastolic(mmHg) M11b
91 Reading2 Systolic(mmHg) M12a
Diastolic(mmHg) M12b
2 Reading3 Systolic(mmHg) M13a
Diastolic(mmHg) M13b
93
Duringthepasttwoweeks,haveyoubeentreatedforraisedbloodpressurewithdrugs(antihypertensivemedication)prescribedbyadoctororotherhealthworker?
Yes 1
M14No 2
EXPANDED: Hip Circumference and Heart Rate
94 HipCircumference InCentimeters(cm) . M15
95
HeartRate(Recordifautomaticbloodpressuredeviceisused)
Reading1 Beatsperminute M16a
Reading2 Beatsperminute M16b
Reading3 Beatsperminute M16c
ParticipantIdentificationNumber:
Step 3Biochemical Measurements
CORE: Blood Glucose Response Code
96Duringthelast8hourshaveyouhadanythingtoeatordrink,otherthanwater?
Yes 1B1
No 2
97 TechnicianID B2
98Timeofdayfastingbloodspecimentaken(24hourclock) Hours:minutes
Hoursmins
B4
99 Fastingbloodglucose Mg/dl B5
100 Timeofstartingglucoseintake(24hourclock)Hours:minutes
Hoursmins
X10

Bhutan StepS Survey report 2009
- 39 -
101Timeofpostglucosechallengebloodspecimentaken Hours:minutes
Hoursmins
X11
102 BloodGlucose(2hoursafterglucoseload) Mg/dl X12
103 Totalcholesterol Mg/dl B7
104 TotalTriglyceride Mg/dl B8
105 HighDensityLipoprotein Mg/dl B9
Signatureoftheinterviewer:___________________________
Signatureoflaboratorytechnician:_______________________
Formcross-checkedby:________________________________

StepS Survey report 2009 Bhutan
- 40 -
Annex III
Agegroupbysex
Description:Summaryinformationbyagegroupandsexoftherespondents.
Instrumentquestion:SexWhatisyourdateofbirth?
Age group and sex of respondents
AgeGroup(years)
Men Women Both Sexesn % n % n %
25-34 259 46.9 293 53.1 552 22.235-44 260 47.4 288 52.6 548 22.145-54 259 46.0 304 54.0 563 22.755-64 206 45.2 250 54.8 456 18.465-74 154 42.2 211 57.8 365 14.725-74 1138 45.8 1346 54.2 2484 100.025-64 984 46.4 1135 53.6 2119 100.0
Ethnicity Description:Summaryresultsfortheethnicityoftherespondents.
InstrumentQuestion:Whatethnic/culturalgroupdoyoubelongto?
Ethnic group of respondents
AgeGroup(years)
Both Sexes
n %Ngalong %Sharchop %Bumtap/Kheng %Lhotshampa %Othergroups
25-34 552 26.1 41.7 9.1 19.7 3.435-44 547 26.9 41.5 8.2 20.7 2.745-54 561 31.4 37.1 8.4 19.8 3.455-64 456 34.4 36.8 7.0 16.4 5.365-74 365 49.3 29.9 8.5 9.0 3.325-74 2481 32.4 38.0 8.3 17.8 3.625-64 2116 29.5 39.4 8.2 19. 3 3.6
Education Description:Meannumberofyearsofeducationamongrespondents.
Instrumentquestion:Intotal,howmanyyearshaveyouspentatschoolorinfull-timestudy(excludingpre-school)?
Mean number of years of education
AgeGroup(years)
Men Women Both Sexesn Mean n Mean n Mean
25-34 247 6.8 269 4.4 516 5.535-44 248 5.7 273 2.6 521 4.145-54 252 4.4 293 1.0 545 2.655-64 194 3.6 238 0.6 432 1.965-74 149 0.5 208 0.2 357 0.3

Bhutan StepS Survey report 2009
- 41 -
25-74 1090 4.6 1281 1.8 2371 3.125-64 941 5.2 1073 2.2 2014 3.6
Highestlevelofeducation
Description:Highestlevelofeducationachievedbythesurveyrespondents.
Instrumentquestion:Whatisthehighestlevelofeducationyouhavecompleted?
Highest level of education
AgeGroup(years)
Men
n%Noformalschooling
%Lessthanprimaryschool
%Primaryschoolcompleted
%Secondaryschoolcompleted
%Highschoolcompleted
%College/Universitycompleted
%Postgraduatedegreecompleted
%Non-FormalEducationandMonastic
25-34 256 18.4 22.3 21.1 16.0 10.2 8.2 2.0 2.035-44 257 28.4 21.4 16.0 11.3 8.6 3.1 8.6 2.745-54 250 38.4 19.2 11.2 8.4 7.2 5.2 4.4 6.055-64 203 46.8 13.3 9.4 13.3 4.9 3.4 1.5 7.465-74 151 84.8 5.3 2.6 1.3 2.0 0.0 0.0 4.025-74 1117 39.3 17.5 13.1 10.7 7.1 4.4 3.7 4.325-64 966 32.2 19.4 14.7 12.2 7.9 5.1 4.2 4.3
Highest level of education
AgeGroup(years)
Women
n%Noformalschooling
%Lessthanprimaryschool
%Primaryschoolcompleted
%Secondaryschoolcompleted
%Highschoolcompleted
%College/Universitycompleted
%Postgraduatedegreecompleted
%Non-FormalEducationandMonastic
25-34 289 41.9 15.6 15.2 14.5 4.8 4.2 0.3 3.535-44 278 58.6 15.8 12.2 6.1 2.2 0.7 0.0 4.345-54 295 76.3 11.2 5.4 2.7 0.7 0.3 0.3 3.155-64 245 84.9 9.8 1.2 1.2 1.6 0.0 0.0 1.265-74 199 86.9 9.5 1.0 0.5 0.5 0.0 0.0 1.525-74 1306 68.1 12.6 7.6 5.4 2.1 1.1 0.2 2.825-64 1107 64.8 13.2 8.8 6.3 2.3 1.4 0.2 3.1
Highest level of education
AgeGroup(years)
Both Sexes
n%Noformalschooling
%Lessthanprimaryschool
%Primaryschoolcompleted
%Secondaryschoolcompleted
%Highschoolcompleted
%College/Universitycompleted
%Postgraduatedegreecompleted
%Non-FormalEducationandMonastic
25-34 545 30.8 18.7 18.0 15.2 7.3 6.1 1.1 2.835-44 535 44.1 18.5 14.0 8.6 5.2 1.9 4.1 3.645-54 545 58.9 14.9 8.1 5.3 3.7 2.6 2.2 4.455-64 448 67.6 11.4 4.9 6.7 3.1 1.6 0.7 4.065-74 350 86.0 7.7 1.7 0.9 1.1 0.0 0.0 2.625-74 2423 54.8 14.9 10.1 7.9 4.4 2.6 1.8 3.525-64 2073 49.6 16.1 11.8 9.1 4.9 3.1 2.1 3.7

StepS Survey report 2009 Bhutan
- 42 -
Employmentstatus
Description:Proportionofrespondentsinpaidemploymentandthosewhoareunpaid.Unpaidincludespersonswhoarenon-paid,students,homemakers,retired,andunemployed.
Instrumentquestion:Whichofthefollowingbestdescribesyourmainworkstatusoverthelast12months?
Employment status
AgeGroup(years)
Men
n%Governmentemployee
%Non-governmentemployee
%Self-employed
%Agriculture
%UniformedForce
%Unpaid
25-34 258 35.7 21.7 11.2 1.6 20.5 9.335-44 260 44.6 12.7 16.5 1.2 21.5 3.545-54 258 34.5 8.9 18.2 6.6 19.0 12.855-64 206 23.8 9.2 27.2 8.7 3.9 27.265-74 147 4.1 3.4 13.6 17.7 0.7 60.525-74 1129 31.2 12.0 17.3 6.0 14.8 18.725-64 982 35.2 13.3 17.8 4.3 16.9 12.4
Employment status
AgeGroup(years)
Women
n%Governmentemployee
%Non-governmentemployee
%Self-employed
%Agriculture
%UniformedForce
%Unpaid
25-34 292 15.1 4.1 14.0 2.1 1.0 63.735-44 288 9.4 3.8 13.5 2.4 0.7 70.145-54 301 6.3 2.3 12.3 5.3 0.0 73.855-64 246 2.8 2.0 6.9 7.7 0.4 80.165-74 204 2.0 1.0 2.9 7.8 0.0 86.325-74 1331 7.6 2.8 10.5 4.8 0.5 73.925-64 1127 8.6 3.1 11.9 4.3 0.5 71.6
Employment status
AgeGroup(years)
Both Sexes
n%Governmentemployee
%Non-governmentemployee
%Self-employed
%Agriculture
%UniformedForce
%Unpaid
25-34 550 24.7 12.4 12.7 1.8 10.2 38.235-44 548 26.1 8.0 15.0 1.8 10.6 38.545-54 559 19.3 5.4 15.0 5.9 8.8 45.655-64 452 12.4 5.3 16.2 8.2 2.0 56.065-74 351 2.8 2.0 7.4 12.0 0.3 75.525-74 2460 18.4 7.0 13.6 5.4 7.0 48.525-64 2109 21.0 7.9 14.7 4.3 8.2 44.0
Unpaidworkandunemployed
Description:Proportionofrespondentsinunpaidwork.Instrumentquestion:Whichofthefollowingbestdescribesyourmainworkstatusoverthelast12months?

Bhutan StepS Survey report 2009
- 43 -
Unpaid work and unemployed
AgeGroup(years)
Men
n %Student%Home-Maker
%Retired%Clergy/LayMonks
Unemployed
%Abletowork
%Notabletowork
25-34 24 4.2 29.2 0.0 25.0 41.7 0.035-44 9 0.0 44.4 22.2 22.2 11.1 0.045-54 33 0.0 15.2 42.4 27.3 6.1 9.155-64 56 0.0 16.1 35.7 10.7 26.8 10.765-74 89 0.0 12.4 27.0 10.1 34.8 15.725-74 211 0.5 17.1 28.4 15.2 28.0 10.925-64 122 0.8 20.5 29.5 18.9 23.0 7.4
Unpaid work and unemployed
AgeGroup(years)
Women
n %Student%Home-Maker
%Retired%Clergy/LayMonks
Unemployed
%Abletowork
%Notabletowork
25-34 186 1.6 95.2 0.0 0.0 2.7 0.535-44 202 0.0 96.0 1.5 0.5 2.0 0.045-54 222 0.5 91.9 0.9 0.9 5.4 0.555-64 197 0.0 77.2 0.5 1.5 15.7 5.165-74 176 0.0 55.1 0.6 2.3 12.5 29.525-74 983 0.4 83.8 0.7 1.0 7.5 6.525-64 807 0.5 90.1 0.7 0.7 6.4 1.5
Unpaid work and unemployed
AgeGroup(years)
Both Sexes
n %Student%Home-Maker
%Retired%Clergy/LayMonks
Unemployed
%Abletowork
%Notabletowork
25-34 210 1.9 87.6 0.0 2.9 7.1 0.535-44 211 0.0 93.8 2.4 1.4 2.4 0.045-54 255 0.4 82.0 6.3 4.3 5.5 1.655-64 253 0.0 63.6 8.3 3.6 18.2 6.365-74 265 0.0 40.8 9.4 4.9 20.0 24.925-74 1194 0.4 72.0 5.6 3.5 11.1 7.325-64 929 0.5 80.9 4.5 3.1 8.6 2.3
Estimatedhouseholdearnings
Description:summaryofparticipanthouseholdearningsbyquintile.
Instrumentquestion:Ifyoudon’tknowtheamount,canyougiveanestimateoftheannualhouseholdincomeifIreadsomeoptionstoyou?

StepS Survey report 2009 Bhutan
- 44 -
Estimated household earnings
n %<3000Nu%3001Nu.-5000Nu
%5001Nu.-12,000Nu.
%12,001Nu.-19,000Nu.
%>19,000Nu.
1440 7.9 2.6 3.9 7.1 78.51306 7.4 2.8 3.4 7.1 79.4
TobaccoUse
Currentsmoking
Description:Currentsmokersamongallrespondents.
Instrumentquestions:Doyoucurrentlysmokeanytobaccoproducts,suchascigarettes,cigars,orpipes?
Percentage of current smokers
AgeGroup(years)
Men Women Both Sexes
n%Currentsmoker
95%CI n%Currentsmoker
95%CI n% Current smoker
95% CI
25-34 258 14.0 9.7-18.2 291 7.2 4.2-10.2 549 11.0 8.3-13.735-44 259 3.9 1.5-6.2 287 2.4 0.7-4.2 546 3.2 1.7-4.845-54 259 6.6 3.5-9.6 303 4.6 2.3-7.0 562 5.7 3.7-7.755-64 205 5.4 2.3-8.5 249 3.2 1.0-5.4 454 4.4 2.4-6.465-74 154 4.5 1.3-7.8 209 2.9 0.6-5.1 363 3.8 1.7-5.825-74 1135 8.4 6.5-10.3 1339 4.7 3.4-6.1 2474 6.8 5.6-8.025-64 981 8.7 6.7-10.7 1130 4.9 3.5-6.3 2111 7.0 5.7-8.3
SmokingStatus
Description:Smokingstatusofallrespondents.
Instrumentquestions:Doyoucurrentlysmokeanytobaccoproducts,suchascigarettes,cigars,orpipes?Doyoucurrentlysmoketobaccoproductsdaily?
Smoking status
AgeGroup(years)
Men
nCurrentsmoker
%Doesnotsmoke
95%CI%Daily 95%CI
%Non-daily
95%CI
25-34 258 12.4 8.4-16.4 1.6 0.0-3.1 86.0 81.8-90.335-44 259 1.5 0.0-3.0 2.3 0.5-4.1 96.1 93.8-98.545-54 259 5.8 2.9-8.6 0.8 0.0-1.8 93.4 90.4-96.555-64 205 5.4 2.3-8.5 0.0 0.0-0.0 94.6 91.5-97.765-74 154 2.6 0.1-5.1 1.9 0.0-4.1 95.5 92.2-98.725-74 1135 6.9 5.2-8.6 1.5 0.7-2.3 91.6 89.7-93.525-64 981 7.2 5.4-9.0 1.4 0.6-2.3 91.3 89.3-93.3

Bhutan StepS Survey report 2009
- 45 -
Smoking status
AgeGroup(years)
Women
n
Currentsmoker%Doesnotsmoke
95%CI%Daily 95%CI
%Non-daily
95%CI
25-34 291 6.5 3.7-9.4 0.7 0.0-1.6 92.8 89.8-95.835-44 287 1.7 0.2-3.3 0.7 0.0-1.7 97.6 95.8-99.345-54 303 3.3 1.3-5.3 1.3 0.0-2.6 95.4 93.0-97.755-64 249 2.4 0.5-4.3 0.8 0.0-1.9 96.8 94.6-99.065-74 209 1.4 0.0-3.0 1.4 0.0-3.0 97.1 94.9-99.425-74 1339 3.9 2.6-5.1 0.9 0.3-1.4 95.3 93.9-96.625-64 1130 4.1 2.7-5.4 0.8 0.3-1.4 95.1 93.7-96.5
Smoking status
AgeGroup(years)
Both Sexes
n
Currentsmoker%Doesnotsmoke
95%CI%Daily 95%CI
%Non-daily
95%CI
25-34 549 9.8 7.2-12.4 1.2 0.2-2.1 89.0 86.3-91.735-44 546 1.6 0.6-2.7 1.6 0.5-2.7 96.8 95.2-98.345-54 562 4.7 2.9-6.5 1.0 0.2-1.8 94.3 92.3-96.355-64 454 4.0 2.1-5.9 0.4 0.0-0.9 95.6 93.6-97.665-74 363 2.1 0.5-3.6 1.7 0.3-3.1 96.2 94.2-98.325-74 2474 5.6 4.5-6.7 1.2 0.7-1.7 93.2 92.0-94.425-64 2111 5.8 4.6-7.0 1.2 0.6-1.7 93.0 91.7-94.3
Frequencyofsmoking
Description:Percentageofcurrentdailysmokersamongsmokers.
Instrumentquestion:Doyoucurrentlysmokeanytobaccoproducts,suchascigarettes,cigars,orpipes?Doyoucurrentlysmoketobaccoproductsdaily?
Current daily smokers among smokers
AgeGroup(years)
Men Women Both Sexes
n%Dailysmokers
95%CI n%Dailysmokers
95%CI n% Daily smokers
95% CI
25-74 81 82.5 73.6-91.4 56 81.6 71.1-92.2 137 82.2 75.4-89.1
25-64 74 83.5 74.4-92.5 50 83.1 72.3-93.9 124 83.4 76.3-90.4
Manufacturedcigarettesmokers
Description:Percentageofsmokerswhousemanufacturedcigarettesamongdailysmokers.
Instrumentquestion:Onaverage,howmanyofthefollowingdoyousmokeeachday?

StepS Survey report 2009 Bhutan
- 46 -
Manufactured cigarette smokers among daily smokers
AgeGroup(years)
Men Women Both Sexes
n
%Manu-facturedcigarettesmoker
95%CI n
%Manu-facturedcigarettesmoker
95%CI n
% Manu-factured cigarette smoker
95% CI
25-74 66 67.6 55.5-79.7 43 46.9 30.1-63.7 109 61.2 51.3-71.2
25-64 62 68.1 55.7-80.4 40 48.2 34.5-69.1 102 62.0 51.8-72.1
Amountoftobaccousedamongsmokersbytype
Description:Meanamountoftobaccousedbydailysmokersperday,bytype.
Instrumentquestion:Onaverage,howmanyofthefollowingdoyousmokeeachday?
Mean amount of tobacco used by daily smokers by type
AgeGroup(years)
Men
n
Mean#ofmanu-facturedcig.
95%CI
n
Mean#ofhand-rolledcig.
95%CI n
Mean#ofpipesoftobacco
95%CI
n
Mean#ofothertypeoftobacco
95%CI
25-74 45 4.6 3.4-5.7 16 5.2 2.2-8.3 15 2.0 0.0-4.4 16 4.9 0.7-9.2
25-64 42 4.5 3.3-5.7 14 5.1 1.8-8.3 13 2.2-0.5-4.8
14 5.2 0.7-9.8
Mean amount of tobacco used by daily smokers by type
AgeGroup(years)
Women
n
Mean#ofmanu-facturedcig.
95%CI n
Mean#ofhand-rolledcig.
95%CI n
Mean#ofpipesoftobacco
95%CI n
Mean#ofothertypeoftobacco
95%CI
25-74 22 4.6 2.9-6.3 22 1.9 1.0-2.8 9 0.0 0.0-0.0 12 1.5 0.0-3.4
25-64 22 4.6 2.9-6.3 19 1.6 0.8-2.4 9 0.0 0.0-0.0 12 1.5 -0.4-3.4
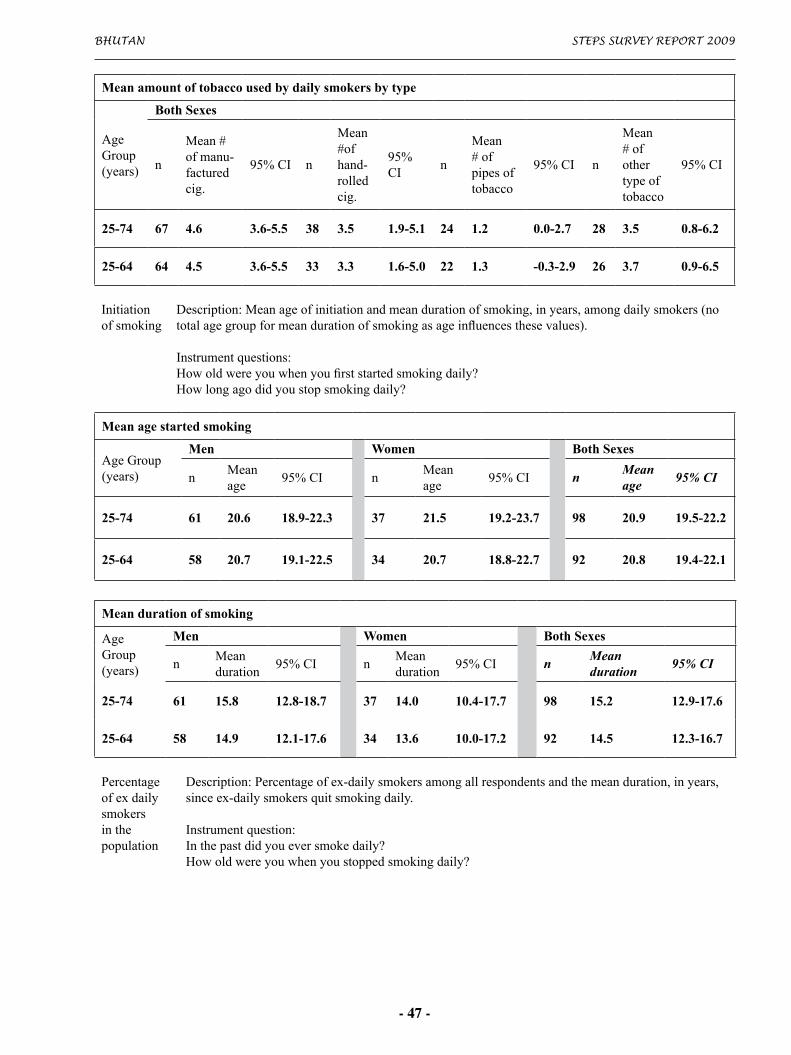
Bhutan StepS Survey report 2009
- 47 -
Mean amount of tobacco used by daily smokers by type
AgeGroup(years)
Both Sexes
n
Mean#ofmanu-facturedcig.
95%CI n
Mean#ofhand-rolledcig.
95%CI
n
Mean#ofpipesoftobacco
95%CI n
Mean#ofothertypeoftobacco
95%CI
25-74 67 4.6 3.6-5.5 38 3.5 1.9-5.1 24 1.2 0.0-2.7 28 3.5 0.8-6.2
25-64 64 4.5 3.6-5.5 33 3.3 1.6-5.0 22 1.3 -0.3-2.9 26 3.7 0.9-6.5
Initiationofsmoking
Description:Meanageofinitiationandmeandurationofsmoking,inyears,amongdailysmokers(nototalagegroupformeandurationofsmokingasageinfluencesthesevalues).
Instrumentquestions:Howoldwereyouwhenyoufirststartedsmokingdaily?Howlongagodidyoustopsmokingdaily?
Mean age started smoking
AgeGroup(years)
Men Women Both Sexes
nMeanage
95%CI nMeanage
95%CI nMean age
95% CI
25-74 61 20.6 18.9-22.3 37 21.5 19.2-23.7 98 20.9 19.5-22.2
25-64 58 20.7 19.1-22.5 34 20.7 18.8-22.7 92 20.8 19.4-22.1
Mean duration of smoking
AgeGroup(years)
Men Women Both Sexes
nMeanduration
95%CI nMeanduration
95%CI nMean duration
95% CI
25-74 61 15.8 12.8-18.7 37 14.0 10.4-17.7 98 15.2 12.9-17.6
25-64 58 14.9 12.1-17.6 34 13.6 10.0-17.2 92 14.5 12.3-16.7
Percentageofexdailysmokersinthepopulation
Description:Percentageofex-dailysmokersamongallrespondentsandthemeanduration,inyears,sinceex-dailysmokersquitsmokingdaily.
Instrumentquestion:Inthepastdidyoueversmokedaily?Howoldwereyouwhenyoustoppedsmokingdaily?

StepS Survey report 2009 Bhutan
- 48 -
Ex-daily smokers among all respondents
AgeGroup(years)
Men Women Both Sexes
n%exdailysmokers
95%CI n%exdailysmokers
95%CI n% ex daily smokers
95% CI
25-34 226 16.4 11.5-21.2 272 4.0 1.7-6.4 498 10.8 7.9-13.7
35-44 256 17.2 12.6-21.8 283 9.2 5.8-12.6 539 13.7 10.7-16.7
45-54 243 23.0 17.7-28.3 294 11.9 8.2-15.6 537 18.0 14.6-21.4
55-64 195 31.8 25.3-38.3 242 14.9 10.4-19.4 437 24.0 19.9-28.2
65-74 150 31.3 23.9-38.8 208 17.8 12.6-23.0 358 25.0 20.3-29.7
25-74 1070 20.6 18.1-23.2 1299 9.1 7.6-10.7 2369 15.4 13.9-17.0
25-64 920 19.8 17.1-22.5 1091 8.4 6.8-10.1 2011 14.7 13.0-16.4
Mean years since cessation
AgeGroup(years)
Men Women Both Sexes
nMeanyears
95%CI nMeanyears
95%CI nMean years
95% CI
25-74 164 22.8 21.1-24.5 91 22.5 20.4-24.6 255 22.7 21.4-24.1
25-64 127 21.1 19.4-22.7 66 21.4 19.2-23.6 193 21.2 19.8-22.5
CurrentUsersofsmokelesstobacco
Description:Percentageofcurrentusersofsmokelesstobaccoamongallrespondents.
Instrumentquestion:Doyoucurrentlyuseanysmokelesstobaccosuchas[snuff,chewingtobacco,betel]?
Current users of smokeless tobacco
AgeGroup(years)
Men Women Both Sexes
n%Currentusers
95%CI n%Currentusers
95%CI n% Current users
95% CI
25-34 248 24.2 18.9-29.5 285 18.6 14.1-23.1 533 21.7 18.1-25.3
35-44 250 22.4 17.2-27.6 281 18.9 14.3-23.4 531 20.8 17.3-24.4
45-54 253 17.4 12.7-22.1 295 16.3 12.1-20.5 548 16.9 13.7-20.1

Bhutan StepS Survey report 2009
- 49 -
55-64 203 17.2 12.0-22.4 246 13.8 9.5-18.1 449 15.7 12.2-19.1
65-74 148 15.5 9.7-21.4 201 13.4 8.7-18.1 349 14.6 10.7-18.4
25-74 1102 21.1 18.5-23.8 1308 17.3 15.0-19.6 2410 19.4 17.6-21.2
25-64 954 21.5 18.7-24.3 1107 17.6 15.2-20.0 2061 19.8 17.9-21.7
DailyUsersofsmokelesstobacco
Description:Percentageofcurrentusersofsmokelesstobaccowhousedaily.
Instrumentquestion:Doyoucurrentlyuseanysmokelesstobaccosuchas[snuff,chewingtobacco,betel]?Doyoucurrentlyusesmokelesstobaccoproductsdaily?
Current users of smokeless tobacco
AgeGroup(years)
Men Women Both Sexes
n%Dailyusers
95%CI n%Dailyusers
95%CI n% Daily users
95% CI
25-34 60 85.0 75.9-94.1 53 71.7 59.5-83.9 113 80.0 72.6-87.3
35-44 56 89.3 81.1-97.5 53 84.9 75.2-94.6 109 87.5 81.3-93.8
45-54 44 84.1 73.2-95.0 48 85.4 75.4-95.5 92 84.7 77.1-92.2
55-64 35 82.9 70.3-95.4 34 91.281.6-100.0
69 86.2 77.7-94.7
65-74 23 73.9 55.8-92.0 27 70.4 53.0-87.7 50 72.4 59.7-85.1
25-74 218 85.3 80.3-90.4 215 79.5 73.4-85.6 433 83.0 79.1-86.9
25-64 195 85.9 80.7-91.1 188 80.0 73.6-86.4 383 83.6 79.5-87.6
Smokelesstobaccouse
Description:Statusofusingsmokelesstobaccoamongallrespondents.
Instrumentquestions:Doyoucurrentlyuseanysmokelesstobaccosuchas[snuff,chewingtobacco,betel]?Doyoucurrentlyusesmokelesstobaccoproductsdaily?
Smokeless tobacco use
AgeGroup(years)
Men
n
Currentuser %Doesnotusesmokelesstobacco
95%CI%Daily 95%CI
%Non-daily
95%CI
25-34 248 20.6 15.5-25.6 3.6 1.3-6.0 75.8 70.5-81.1

StepS Survey report 2009 Bhutan
- 50 -
35-44 250 20.0 15.0-25.0 2.4 0.5-4.3 77.6 72.4-82.845-54 253 14.6 10.3-19.0 2.8 0.7-4.8 82.6 77.9-87.355-64 203 14.3 9.5-19.1 3.0 0.6-5.3 82.8 77.6-88.065-74 148 11.5 6.3-16.6 4.1 0.9-7.2 84.5 78.6-90.325-74 1102 18.0 15.5-20.6 3.1 2.0-4.2 78.9 76.2-81.525-64 954 18.5 15.8-21.2 3.0 1.9-4.2 78.5 75.6-81.3
Smokeless tobacco use
AgeGroup(years)
Women
n
Currentuser %Doesnotusesmokelesstobacco
95%CI%Daily 95%CI
%Non-daily
95%CI
25-34 285 13.3 9.4-17.3 5.3 2.7-7.9 81.4 76.9-85.935-44 281 16.0 11.7-20.3 2.8 0.9-4.8 81.1 76.6-85.7
45-54 295 13.9 9.9-17.8 2.4 0.6-4.1 83.7 79.5-87.9
55-64 246 12.6 8.5-16.8 1.2 0.0-2.6 86.2 81.9-90.565-74 201 9.5 5.4-13.5 4.0 1.3-6.7 86.6 81.9-91.3
25-74 1308 13.8 11.7-15.8 3.6 2.4-4.7 82.7 80.4-85.025-64 1107 14.1 11.9-16.3 3.5 2.3-4.8 82.4 80.0-84.8
Smokeless tobacco use
AgeGroup(years)
Both Sexes
nCurrentuser %Doesnot
usesmokelesstobacco
95%CI%Daily 95%CI
%Non-daily
95%CI
25-34 533 17.4 14.0-20.7 4.4 2.6-6.1 78.3 74.7-81.935-44 531 18.3 14.9-21.6 2.6 1.2-4.0 79.2 75.6-82.7
45-54 548 14.3 11.3-17.3 2.6 1.2-4.0 83.1 79.9-86.3
55-64 449 13.5 10.3-16.8 2.2 0.7-3.6 84.3 80.9-87.865-74 349 10.5 7.2-13.9 4.0 1.9-6.1 85.4 81.6-89.3
25-74 2410 16.1 14.5-17.8 3.3 2.5-4.1 80.6 78.8-82.425-64 2061 16.5 14.8-18.3 3.3 2.4-4.1 80.2 78.3-82.1
Percentageofexdailyusersofsmokelesstobaccointhepopulation
Description:Percentageofex-dailyusersofsmokelesstobaccoamongallrespondents.
Instrumentquestion:Inthepast,didyoueverusesmokelesstobaccosuchas[snuff,chewingtobacco,betel]daily?
Ex-daily smokeless tobacco users
AgeGroup(years)
Men Women Both Sexes
n%Exdailyusers
95%CI n%Exdailyusers
95%CI n% Ex daily users
95% CI
25-34 161 11.2 6.3-16.1 175 13.1 8.1-18.2 336 12.0 8.5-15.535-44 149 21.5 14.9-28.1 167 19.8 13.7-25.8 316 20.7 16.2-25.3
45-54 174 20.1 14.1-26.1 187 18.7 13.1-24.3 361 19.5 15.4-23.7

Bhutan StepS Survey report 2009
- 51 -
55-64 124 16.1 9.6-22.6 160 20.0 13.8-26.2 284 17.9 13.4-22.565-74 104 17.3 10.0-24.6 154 16.2 10.4-22.1 258 16.8 12.1-21.5
25-74 712 16.4 13.5-19.3 843 16.9 14.1-19.6 1555 16.6 14.6-18.625-64 608 16.3 13.3-19.4 689 16.9 14.0-19.9 1297 16.6 14.4-18.7
Frequencyofsmokelesstobaccouseamongusersbytype
Description:Meantimesperdaysmokelesstobaccousedbysmokelesstobaccousersperday,bytype.
Instrumentquestion:Onaverage,howmanytimesadaydoyouuse…?
Mean times per day smokeless tobacco used by daily smokeless tobacco users by type
AgeGroup(years)
Men
nSnuffbymouth
95%CI nSnuffbynose
95%CI nChewingtobacco
95%CI
nBetelquid
95%CI
25-74 46 0.7 0.0-1.5 46 0.3 0.0-0.7 119 7.4 6.4-8.3 109 7.0 5.4-8.725-64 41 0.8 0.0-1.6 40 0.1 0.0-0.2 110 7.5 6.5-8.5 98 7.2 5.4-8.9
Mean times per day smokeless tobacco used by daily smokeless tobacco users by type
AgeGroup(years)
Women
nSnuffbymouth
95%CI nSnuffbynose
95%CI
nChewingtobacco
95%CI
nBetelquid
95%CI
25-74 47 2.1 0.8-3.3 47 1.5 0.4-2.5 89 6.8 5.5-8.1 118 8.0 5.9-10.225-64 46 2.1 0.8-3.4 45 1.4 0.4-2.5 81 6.8 5.5-8.2 107 8.1 5.9-10.3
Mean times per day smokeless tobacco used by daily smokeless tobacco users by type
AgeGroup(years)
Both Sexes
nSnuffbymouth
95%CI nSnuffbynose
95%CI
nChewingtobacco
95%CI nBetel-quid
95%CI
25-74 93 1.3 0.6-2.0 93 0.8 0.2-1.3 208 7.2 6.4-8.0 227 7.5 6.1-8.825-64 87 1.3 0.6-2.1 85 0.7 0.2-1.1 191 7.3 6.5-8.1 205 7.6 6.2-8.9
Currenttobaccousers
Description:Percentageofdailyandcurrent(dailyplusnon-daily)tobaccousers,includessmokingandsmokeless,amongallrespondents.Percentageofcurrenttobaccouserswhousedaily.
Instrumentquestions:Doyoucurrentlysmoketobaccoproductsdaily?Doyoucurrentlyusesmokelesstobaccoproductsdaily?
Daily tobacco users
AgeGroup(years)
Men Women Both Sexes
n%Dailyusers
95%CI n%Dailyusers
95%CI n% Daily users
95% CI
25-34 247 28.7 23.1-34.4 283 16.3 12.0-20.6 530 23.2 19.5-26.9

StepS Survey report 2009 Bhutan
- 52 -
35-44 249 20.9 15.8-25.9 281 17.4 13.0-21.9 530 19.4 15.9-22.8
45-54 253 18.6 13.8-23.4 295 15.3 11.2-19.4 548 17.1 13.9-20.3
55-64 202 17.8 12.5-23.1 246 15.0 10.6-19.5 448 16.6 13.0-20.165-74 148 12.8 7.4-18.2 200 11.0 6.7-15.3 348 12.0 8.5-15.5
25-74 1099 22.5 19.8-25.3 1305 15.9 13.7-18.1 2404 19.6 17.7-21.425-64 951 23.2 20.3-26.2 1105 16.2 13.9-18.6 2056 20.1 18.2-22.1
Current tobacco users
AgeGroup(years)
Men Women Both Sexes
n%Currentusers
95%CI n%Currentusers
95%CI n% Current users
95% CI
25-34 247 33.2 27.3-39.1 283 21.9 17.1-26.7 530 28.2 24.3-32.135-44 249 24.5 19.2-29.8 281 20.3 15.6-25.0 530 22.6 19.0-26.3
45-54 253 22.1 17.0-27.3 295 18.6 14.2-23.1 548 20.6 17.1-24.0
55-64 202 20.8 15.2-26.4 246 16.7 12.0-21.3 448 18.9 15.2-22.665-74 148 16.9 10.9-22.9 200 16.0 10.9-21.1 348 16.5 12.5-20.5
25-74 1099 26.4 23.5-29.3 1305 19.9 17.5-22.3 2404 23.5 21.6-25.425-64 951 27.1 24.0-30.2 1105 20.2 17.6-22.7 2056 24.0 22.0-26.1
Current tobacco users who use daily
AgeGroup(years)
Men Women Both Sexes
n%dailyusers
95%CI n%dailyusers
95%CI n%dailyusers
95% CI
25-34 82 86.6 79.2-94.0 62 74.2 63.2-85.2 144 82.3 76.1-88.535-44 61 85.2 76.3-94.2 57 86.0 76.9-95.0 118 85.5 79.1-92.0
45-54 56 83.9 74.2-93.6 55 81.8 71.6-92.1 111 83.1 76.0-90.2
55-64 42 85.7 75.1-96.4 41 90.2 81.1-99.4 83 87.5 80.2-94.965-74 25 76.0 59.2-92.9 32 68.8 52.6-84.9 57 72.8 61.0-84.6
25-74 266 85.3 80.8-89.9 247 79.9 74.3-85.5 513 83.3 79.7-86.825-64 241 85.8 81.1-90.4 215 80.6 74.7-86.4 456 83.8 80.2-87.5
AlcoholConsumption
Alcoholconsumptionstatus
Description:Alcoholconsumptionstatusofallrespondents.Abstainershavenotconsumedalcoholinthelast12months.*
Instrumentquestions:Haveyouconsumedalcohol(suchasbeer,wine,spirits,fermentedcider,or(addotherlocalexamples)withinthepast12months?Haveyouconsumedalcohol(suchasbeer,wine,spirits,fermentedcider,or(addotherlocalexamples)withinthepast30days?

Bhutan StepS Survey report 2009
- 53 -
Alcohol consumption status
AgeGroup(years)
Men
n%Currentdrinker(last30days)
95%CI
%Drankinlast12months,notcurrent
95%CI %Abstainer 95%CI
25-34 259 37.5 31.6-43.3 5.0 2.4-7.7 57.5 51.5-63.635-44 259 39.8 33.8-45.7 5.8 2.9-8.6 54.4 48.4-60.5
45-54 256 27.3 21.9-32.8 5.5 2.7-8.3 67.2 61.4-72.9
55-64 201 28.9 22.6-35.1 4.0 1.3-6.7 67.2 60.7-73.765-74 150 30.7 23.3-38.0 5.3 1.7-8.9 64.0 56.3-71.7
25-74 1125 34.9 31.9-38.0 5.2 3.8-6.6 59.9 56.8-63.025-64 975 35.2 32.0-38.4 5.2 3.7-6.7 59.6 56.3-62.9
Alcohol consumption status
AgeGroup(years)
Women
n%Currentdrinker(last30days)
95%CI
%Drankinlast12months,notcurrent
95%CI %Abstainer 95%CI
25-34 288 26.4 21.3-31.5 7.6 4.6-10.7 66.0 60.5-71.435-44 284 27.1 21.9-32.3 4.9 2.4-7.4 68.0 62.5-73.4
45-54 301 26.2 21.3-31.2 5.0 2.5-7.4 68.8 63.5-74.0
55-64 246 21.5 16.4-26.7 4.5 1.9-7.1 74.0 68.5-79.565-74 209 20.1 14.7-25.5 6.2 2.9-9.5 73.7 67.7-79.7
25-74 1328 25.5 22.9-28.1 6.0 4.5-7.4 68.5 65.7-71.325-64 1119 25.9 23.2-28.7 6.0 4.4-7.5 68.1 65.1-71.0
Alcohol consumption status
AgeGroup(years)
Both Sexes
n%Currentdrinker(last30days)
95%CI
%Drankinlast12months,notcurrent
95%CI %Abstainer 95%CI
25-34 547 32.6 28.6-36.7 6.2 4.1-8.2 61.2 57.0-65.435-44 543 34.3 30.2-38.4 5.4 3.5-7.4 60.3 56.1-64.5
45-54 557 26.9 23.1-30.6 5.3 3.4-7.1 67.9 63.9-71.8
55-64 447 25.5 21.4-29.7 4.2 2.3-6.1 70.3 65.9-74.665-74 359 25.7 21.0-30.4 5.7 3.3-8.2 68.5 63.5-73.5
25-74 2453 30.8 28.7-32.8 5.6 4.5-6.6 63.7 61.5-65.825-64 2094 31.1 28.9-33.3 5.5 4.5-6.6 63.3 61.1-65.6
Frequencyofalcoholconsumption
Description:Frequencyofalcoholconsumptioninthelastyearamongthoserespondentswhohavedrankinthelast12months.
Instrumentquestion:Inthepast12months,howfrequentlyhaveyouhadatleastonedrink?

StepS Survey report 2009 Bhutan
- 54 -
Frequency of alcohol consumption in the last 12 months
AgeGroup(years)
Men
n%Daily
95%CI
%5-6daysp.week
95%CI
%1-4daysp.week
95%CI
%1-3daysp.month
95%CI
%<onceamonth
95%CI
25-34 110 14.5 7.9-21.2 7.3 2.4-12.1 35.5 26.5-44.4 25.5 17.3-33.6 17.310.2-24.4
35-44 119 23.5 15.9-31.2 7.6 2.8-12.3 37.0 28.3-45.7 21.8 14.4-29.3 10.1 4.7-15.5
45-54 84 32.1 22.1-42.2 6.0 0.9-11.0 33.3 23.2-43.5 20.2 11.6-28.9 8.3 2.4-14.3
55-64 67 32.8 21.5-44.1 14.9 6.4-23.5 23.9 13.6-34.1 19.4 9.9-28.9 9.0 2.1-15.865-74 55 40.0 27.0-53.0 7.3 0.4-14.2 23.6 12.4-34.9 16.4 6.5-26.2 12.7 3.9-21.6
25-74 435 23.0 18.9-27.1 7.9 5.2-10.6 33.8 29.0-38.7 22.5 18.2-26.8 12.8 9.3-16.325-64 380 21.9 17.6-26.2 7.9 5.1-10.8 34.5 29.4-39.6 22.9 18.4-27.5 12.8 9.1-16.5
Frequency of alcohol consumption in the last 12 months
AgeGroup(years)
Women
n%Daily
95%CI
%5-6daysp.week
95%CI
%1-4daysp.week
95%CI
%1-3daysp.month
95%CI
%<onceamonth
95%CI
25-34 99 12.1 5.7-18.6 1.0 0.0-3.0 28.3 19.4-37.2 33.3 24.0-42.7 25.3 16.7-33.835-44 93 17.2 9.5-24.9 3.2 0.0-6.8 29.0 19.8-38.3 32.3 22.7-41.8 18.3 10.4-26.2
45-54 95 25.3 16.5-34.0 5.3 0.8-9.8 32.6 23.2-42.1 30.5 21.2-39.8 6.3 1.4-11.2
55-64 65 26.2 15.4-36.9 7.7 1.2-14.2 30.8 19.5-42.0 20.0 10.2-29.8 15.4 6.6-24.265-74 53 32.1 19.5-44.7 3.8 0.0-8.9 24.5 12.9-36.2 17.0 6.8-27.1 22.6 11.3-34.0
25-74 405 18.3 14.4-22.2 3.2 1.5-4.8 29.3 24.4-34.1 30.3 25.3-35.2 19.0 14.6-23.325-64 352 17.5 13.4-21.5 3.1 1.4-4.8 29.6 24.5-34.7 31.1 25.9-36.3 18.7 14.2-23.3
Frequency of alcohol consumption in the last 12 months
AgeGroup(years)
Both Sexes
n%Daily
95%CI
%5-6daysp.week
95%CI
%1-4daysp.week
95%CI
%1-3daysp.month
95%CI
%<onceamonth
95%CI
25-34 209 13.6 8.9-18.4 4.9 1.8-8.0 32.7 26.2-39.2 28.5 22.3-34.7 20.3 14.8-25.835-44 212 21.3 15.6-27.0 6.0 2.7-9.4 34.2 27.7-40.7 25.5 19.6-31.4 13.0 8.5-17.5
45-54 179 29.1 22.3-36.0 5.7 2.2-9.1 33.0 26.0-40.1 24.7 18.4-31.1 7.5 3.5-11.4
55-64 132 30.2 22.1-38.2 12.0 6.3-17.8 26.6 19.0-34.3 19.6 12.7-26.5 11.5 6.1-16.965-74 108 37.0 27.6-46.4 6.0 1.2-10.7 24.0 15.7-32.2 16.6 9.4-23.8 16.5 9.5-23.5
25-74 840 21.2 18.2-24.1 6.1 4.3-7.9 32.1 28.6-35.6 25.5 22.2-28.8 15.2 12.4-17.925-64 732 20.2 17.1-23.2 6.1 4.2-7.9 32.5 28.9-36.3 26.1 22.6-29.5 15.1 12.2-18.0

Bhutan StepS Survey report 2009
- 55 -
Standarddrinksperdrinkingday
Description:Numberofstandarddrinksconsumedonadrinkingdayamongthoserespondentswhohavedrankinthelast12months.
Instrumentquestion:Whenyoudrinkalcohol,onaverage,howmanydrinksdoyouhaveduringoneday?
Number of standard drinks consumed on a drinking day
AgeGroup(years)
Men
n%1drink
95%CI%2-3drinks
95%CI%4-5drinks
95%CI%6+drinks
95%CI
Mean#ofstandarddrinks
95%CI
25-34 96 26.0 17.2-34.9 43.8 33.8-53.7 19.8 11.8-27.8 10.4 4.3-16.6 2.9 2.4-3.435-44 106 27.4 18.8-35.9 49.1 39.5-58.6 11.3 5.3-17.4 12.3 6.0-18.5 2.7 2.3-3.2
45-54 82 23.2 14.0-32.3 52.4 41.6-63.3 9.8 3.3-16.2 14.6 7.0-22.3 2.9 2.4-3.4
55-64 54 16.7 6.7-26.7 38.9 25.8-52.0 24.1 12.6-35.5 20.4 9.6-31.2 3.4 2.8-4.065-74 45 24.4 11.8-37.1 33.3 19.5-47.2 6.7 0.0-14.0 35.6 21.5-49.6 4.2 3.2-5.1
25-74 383 25.1 20.4-29.9 45.7 40.3-51.1 15.3 11.3-19.3 13.9 10.3-17.5 3.0 2.7-3.225-64 338 25.2 20.2-30.1 46.5 40.8-52.1 15.8 11.6-20.0 12.6 8.9-16.3 2.9 2.6-3.2
Number of standard drinks consumed on a drinking day
AgeGroup(years)
Women
n%1drink
95%CI%2-3drinks
95%CI%4-5drinks
95%CI%6+drinks
95%CI
Mean#ofstandarddrinks
95%CI
25-34 84 54.8 44.1-65.5 41.7 31.1-52.3 1.2 0.0-3.5 2.4 0.0-5.7 1.6 1.4-1.835-44 79 36.7 26.0-47.4 53.2 42.1-64.2 7.6 1.7-13.5 2.5 0.0-6.0 2.0 1.7-2.3
45-54 81 25.9 16.3-35.5 48.1 37.2-59.1 17.3 9.0-25.6 8.6 2.5-14.8 2.7 2.2-3.2
55-64 51 47.1 33.3-60.8 33.3 20.3-46.3 3.9 0.0-9.3 15.7 5.7-25.7 2.4 1.8-3.165-74 46 60.9 46.7-75.0 30.4 17.1-43.8 4.3 0.0-10.3 4.3 0.0-10.3 1.7 1.4-2.1
25-74 341 44.5 38.7-50.3 44.4 38.7-50.2 6.2 3.7-8.7 4.9 2.6-7.1 2.0 1.8-2.225-64 295 43.5 37.4-49.6 45.3 39.2-51.4 6.3 3.7-8.9 4.9 2.6-7.2 2.0 1.8-2.2
Number of standard drinks consumed on a drinking day
AgeGroup(years)
Both Sexes
n%1drink
95%CI%2-3drinks
95%CI%4-5drinks
95%CI%6+drinks
95%CI
Mean#ofstandarddrinks
95%CI
25-34 180 36.9 29.8-44.0 43.0 35.6-50.3 12.8 7.6-18.0 7.4 3.3-11.4 2.4 2.1-2.835-44 185 30.6 23.8-37.3 50.5 43.1-57.8 10.0 5.6-14.5 8.9 4.6-13.3 2.5 2.2-2.8
45-54 163 24.3 17.6-31.0 50.7 42.9-58.5 12.8 7.7-17.9 12.2 7.0-17.4 2.8 2.5-3.2
55-64 105 28.6 20.0-37.1 36.7 27.3-46.1 16.2 8.7-23.7 18.5 10.9-26.2 3.0 2.6-3.565-74 91 38.7 28.6-48.8 32.2 22.3-42.1 5.8 0.7-10.8 23.3 14.0-32.7 3.2 2.6-3.8
25-74 724 32.4 28.6-36.1 45.2 41.2-49.2 11.9 9.2-14.6 10.5 8.1-12.9 2.6 2.4-2.825-64 633 32.0 28.1-35.9 46.0 41.8-50.2 12.2 9.4-15.1 9.7 7.3-12.2 2.6 2.4-2.8

StepS Survey report 2009 Bhutan
- 56 -
Heavydrinking
Description:Frequencyandquantityofdrinksconsumedinthelast7daysbycurrent(last30days)drinker,groupedintothreecategories.
Instrumentquestion:Duringeachofthepast7days,howmanystandarddrinksofanyalcoholicdrinkdidyouhaveeachday?
Frequency and quantity of drinks consumed in the last 7 days
AgeGroup(years)
Men
n%Drankon4+days
95%CI%5+drinksonanyday
95%CI%20+drinksin7days
95%CI
25-34 65 32.3 20.9-43.8 4.6 0.0-9.8 3.1 0.0-7.335-44 73 37.0 25.8-48.1 15.1 6.8-23.3 11.0 3.7-18.2
45-54 44 56.8 42.1-71.6 13.6 3.4-23.8 15.9 5.0-26.8
55-64 40 52.5 36.9-68.1 25.0 11.5-38.5 25.0 11.5-38.565-74 30 53.3 35.4-71.3 20.0 5.6-34.4 26.7 10.7-42.6
25-74 252 40.0 33.5-46.4 11.9 7.9-15.8 10.6 6.9-14.225-64 222 39.2 32.4-46.0 11.4 7.2-15.5 9.6 5.9-13.4
Frequency and quantity of drinks consumed in the last 7 days
AgeGroup(years)
Women
n%Drankon4+days
95%CI%4+drinksonanyday
95%CI%15+drinksin7days
95%CI
25-34 45 17.8 6.5-29.0 4.4 0.0-10.5 4.4 0.0-10.535-44 51 25.5 13.4-37.6 7.8 0.4-15.3 3.9 0.0-9.3
45-54 46 39.1 24.9-53.4 34.8 20.9-48.7 15.2 4.7-25.7
55-64 26 38.5 19.6-57.3 15.4 1.4-29.4 11.5 0.0-23.965-74 26 53.8 34.5-73.2 11.5 0.0-23.9 15.4 1.4-29.4
25-74 194 27.7 21.1-34.3 12.1 7.6-16.7 7.4 3.7-11.125-64 168 26.1 19.2-32.9 12.1 7.4-16.9 6.9 3.1-10.7
Frequency and quantity of drinks consumed in the last 7 days
AgeGroup(years)
Both Sexes
n %Drankon4+days 95%CI
25-34 110 27.6 19.0-36.235-44 124 33.2 24.7-41.7
45-54 90 49.4 38.9-60.0
55-64 66 48.2 35.9-60.565-74 56 53.5 40.1-67.0
25-74 446 35.8 31.0-40.725-64 390 34.7 29.7-39.8

Bhutan StepS Survey report 2009
- 57 -
Hazardousandharmfuldrinking
Description:Percentageofcurrent(last30days)drinkerengaginginhazardousandharmfuldrinkinginthelast7days.Harmfuldrinkingisdefinedas≥60gofpurealcoholonaverageperdayformenand≥40gforwomen.Hazardousdrinkingisdefinedas40-59.9gofpurealcoholonaverageperdayformenand20-39.9gforwomen.Astandarddrinkcontainsapproximately10gofpurealcohol.
Instrumentquestion:Duringeachofthepast7days,howmanystandarddrinksofanyalcoholicdrinkdidyouhaveeachday?
Hazardous and harmful drinking in the last 7 days
AgeGroup(years)
Men
n%harmfuldrinking(>=6drinkperday)
95%CI
%hazardousdrinking(4-5drinksperday)
95%CI%<40gpurealcoholperday
95%CI
25-34 65 1.5 0.0-4.6 1.5 0.0-4.6 96.9 92.7-100.035-44 73 4.1 0.0-8.7 5.5 0.2-10.7 90.4 83.6-97.2
45-54 44 9.1 0.5-17.6 2.3 0.0-6.7 88.6 79.2-98.1
55-64 40 10.0 0.6-19.4 7.5 0.0-15.7 82.5 70.6-94.465-74 30 16.7 3.2-30.1 10.0 0.0-20.8 73.3 57.4-89.3
25-74 252 4.9 2.4-7.5 3.9 1.5-6.3 91.1 87.7-94.525-64 222 4.3 1.7-6.8 3.6 1.1-6.0 92.2 88.7-95.6
Hazardous and harmful drinking in the last 7 days
AgeGroup(years)
Women
n%harmfuldrinking(>=4drinkperday)
95%CI
%hazardousdrinking(2-35drinksperday)
95%CI%<20gpurealcoholperday
95%CI
25-34 45 0.0 0.0-0.0 6.7 0.0-14.0 93.3 86.0-100.035-44 51 2.0 0.0-5.8 9.8 1.6-18.0 88.2 79.3-97.2
45-54 46 10.9 1.8-19.9 13.0 3.2-22.9 76.1 63.7-88.5
55-64 26 7.7 0.0-18.0 15.4 1.4-29.4 76.9 60.6-93.365-74 26 7.7 0.0-18.0 23.1 6.7-39.4 69.2 51.3-87.1
25-74 194 3.6 1.3-5.9 10.4 6.0-14.9 86.0 81.1-90.925-64 168 3.3 1.0-5.7 9.6 5.1-14.2 87.0 82.0-92.1

StepS Survey report 2009 Bhutan
- 58 -
FruitandVegetableConsumption
Meannumberofdaysoffruitandvegetableconsumption
Description:meannumberofdaysfruitandvegetablesconsumed.
Instrumentquestions:Inatypicalweek,onhowmanydaysdoyoueatfruit?Inatypicalweek,onhowmanydaysdoyoueatvegetables?
Mean number of days fruit consumed in a typical week
AgeGroup(years)
Men Women Both Sexes
nMeannumberofdays
95%CI nMeannumberofdays
95%CI nMean number of days
95% CI
25-34 224 3.6 3.3-3.8 244 3.8 3.6-4.1 468 3.7 3.5-3.935-44 227 3.8 3.5-4.1 243 3.9 3.6-4.1 470 3.8 3.6-4.0
45-54 222 3.8 3.5-4.1 260 3.6 3.3-3.8 482 3.7 3.5-3.9
55-64 170 3.8 3.5-4.2 204 3.9 3.6-4.3 374 3.9 3.6-4.165-74 120 3.5 3.1-3.9 175 4.0 3.6-4.3 295 3.7 3.5-4.0
25-74 963 3.7 3.5-3.8 1126 3.8 3.7-4.0 2089 3.7 3.6-3.825-64 843 3.7 3.5-3.9 951 3.8 3.7-4.0 1794 3.7 3.6-3.9
Mean number of days vegetables consumed in a typical week
AgeGroup(years)
Men Women Both Sexes
nMeannumberofdays
95%CI nMeannumberofdays
95%CI nMean number of days
95% CI
25-34 231 6.2 6.1-6.4 263 6.4 6.2-6.6 494 6.3 6.2-6.435-44 230 6.5 6.3-6.6 256 6.4 6.2-6.5 486 6.4 6.3-6.5
45-54 238 6.3 6.2-6.5 278 6.4 6.3-6.6 516 6.4 6.3-6.5
55-64 181 6.6 6.4-6.7 224 6.4 6.3-6.6 405 6.5 6.4-6.665-74 140 6.3 6.1-6.5 191 6.5 6.3-6.7 331 6.4 6.2-6.5
25-74 1020 6.4 6.3-6.4 1212 6.4 6.3-6.5 2232 6.4 6.3-6.425-64 880 6.4 6.3-6.5 1021 6.4 6.3-6.5 1901 6.4 6.3-6.5
Meannumberofservingsoffruitandvegetableconsumption
Description:meannumberoffruit,vegetable,andcombinedfruitandvegetableservingsonaverageperday.
Instrumentquestions:Inatypicalweek,onhowmanydaysdoyoueatfruit?Howmanyservingsoffruitdoyoueatononeofthosedays?Inatypicalweek,onhowmanydaysdoyoueatvegetables?Howmanyservingsofvegetablesdoyoueatononeofthosedays?

Bhutan StepS Survey report 2009
- 59 -
Mean number of servings of fruit on average per day
AgeGroup(years)
Men Women Both Sexes
nMeannumberofservings
95%CI nMeannumberofservings
95%CI n
Mean number of servings
95% CI
25-34 224 1.1 1.0-1.3 244 1.2 1.1-1.3 468 1.2 1.1-1.335-44 227 1.3 1.1-1.5 243 1.4 1.2-1.6 470 1.3 1.2-1.5
45-54 222 1.1 1.0-1.3 260 1.1 0.9-1.3 482 1.1 1.0-1.2
55-64 170 1.2 1.0-1.4 204 1.2 1.0-1.3 374 1.2 1.1-1.365-74 120 1.1 0.8-1.4 175 1.2 1.0-1.5 295 1.2 1.0-1.4
25-74 963 1.2 1.1-1.3 1126 1.2 1.1-1.3 2089 1.2 1.1-1.325-64 843 1.2 1.1-1.3 951 1.2 1.1-1.3 1794 1.2 1.1-1.3
Mean number of servings of vegetables on average per day
AgeGroup(years)
Men Women Both Sexes
nMeannumberofservings
95%CI n
Meannumberofservings
95%CI nMean number of servings
95% CI
25-34 231 3.6 3.3-3.9 263 3.0 2.8-3.2 494 3.3 3.2-3.535-44 230 3.5 3.2-3.7 256 3.2 2.9-3.4 486 3.3 3.2-3.5
45-54 238 3.4 3.1-3.7 278 3.1 2.9-3.3 516 3.2 3.1-3.4
55-64 181 3.0 2.8-3.3 224 3.0 2.7-3.2 405 3.0 2.8-3.265-74 140 3.1 2.7-3.4 191 2.5 2.3-2.7 331 2.8 2.6-3.0
25-74 1020 3.4 3.3-3.6 1212 3.0 2.9-3.1 2232 3.2 3.2-3.325-64 880 3.5 3.3-3.6 1021 3.1 2.9-3.2 1901 3.3 3.2-3.4
Mean number of servings of fruit and/or vegetables on average per day
AgeGroup(years)
Men Women Both Sexes
nMeannumberofservings
95%CI nMeannumberofservings
95%CI n
Mean number of servings
95% CI
25-34 241 4.5 4.2-4.8 272 4.0 3.7-4.2 513 4.3 4.1-4.535-44 243 4.5 4.1-4.8 268 4.3 4.0-4.6 511 4.4 4.2-4.6
45-54 245 4.3 4.0-4.6 285 4.0 3.7-4.3 530 4.2 4.0-4.4
55-64 190 4.0 3.7-4.3 230 3.9 3.7-4.2 420 4.0 3.8-4.265-74 141 4.0 3.6-4.5 193 3.6 3.3-4.0 334 3.8 3.6-4.1
25-74 1060 4.4 4.2-4.5 1248 4.0 3.9-4.2 2308 4.2 4.1-4.325-64 919 4.4 4.2-4.6 1055 4.1 3.9-4.2 1974 4.3 4.1-4.4

StepS Survey report 2009 Bhutan
- 60 -
Fruitandvegetableconsumptionperday
Description:Frequencyoffruitand/orvegetableconsumption.
Instrumentquestions:Inatypicalweek,onhowmanydaysdoyoueatfruit?Howmanyservingsoffruitdoyoueatononeofthosedays?Inatypicalweek,onhowmanydaysdoyoueatvegetables?Howmanyservingsofvegetablesdoyoueatononeofthosedays?
Number of servings of fruit and/or vegetables on average per day
AgeGroup(years)
Men
n%nofruitand/orvegetables
95%CI%1-2servings
95%CI%3-4servings
95%CI%≥5servings
95%CI
25-34 241 2.9 0.8-5.0 27.8 22.1-33.5 32.0 26.1-37.8 37.3 31.2-43.535-44 243 6.2 3.1-9.2 20.6 15.5-25.7 36.6 30.6-42.7 36.6 30.6-42.7
45-54 245 1.6 0.0-3.2 27.3 21.8-32.9 38.4 32.3-44.5 32.7 26.8-38.5
55-64 190 4.2 1.4-7.1 30.5 24.0-37.1 33.7 27.0-40.4 31.6 25.0-38.265-74 141 4.3 0.9-7.6 27.0 19.6-34.3 41.8 33.7-50.0 27.0 19.6-34.3
25-74 1060 3.8 2.5-5.0 26.1 23.2-28.9 35.2 32.1-38.3 35.0 31.9-38.125-64 919 3.8 2.4-5.1 26.0 23.0-29.0 34.7 31.4-38.0 35.6 32.2-38.9
Number of servings of fruit and/or vegetables on average per day
AgeGroup(years)
Women
n%nofruitand/orvegetables
95%CI%1-2servings
95%CI%3-4servings
95%CI%≥5servings
95%CI
25-34 272 4.4 2.0-6.9 27.9 22.6-33.3 33.8 28.2-39.4 33.8 28.2-39.435-44 268 3.0 0.9-5.0 29.5 24.0-34.9 32.5 26.9-38.1 35.1 29.4-40.8
45-54 285 1.1 0.0-2.2 30.2 24.8-35.5 41.8 36.0-47.5 27.0 21.9-32.2
55-64 230 2.6 0.5-4.7 27.8 22.0-33.6 41.7 35.4-48.1 27.8 22.0-33.665-74 193 1.0 0.0-2.5 34.7 28.0-41.4 43.0 36.0-50.0 21.2 15.5-27.0
25-74 1248 3.0 1.9-4.1 29.2 26.5-32.0 36.5 33.6-39.4 31.3 28.5-34.225-64 1055 3.1 2.0-4.3 28.8 25.9-31.7 36.0 32.9-39.1 32.1 29.1-35.1
Number of servings of fruit and/or vegetables on average per day
AgeGroup(years)
Both Sexes
n%nofruitand/orvegetables
95%CI%1-2servings
95%CI%3-4servings
95%CI%≥5servings
95%CI
25-34 513 3.6 2.0-5.2 27.9 23.9-31.8 32.8 28.6-36.9 35.8 31.6-40.035-44 511 4.8 2.9-6.7 24.4 20.7-28.2 34.8 30.6-39.0 36.0 31.7-40.2
45-54 530 1.4 0.3-2.4 28.6 24.7-32.5 39.9 35.6-44.1 30.2 26.2-34.1
55-64 420 3.5 1.7-5.3 29.3 24.9-33.7 37.3 32.6-42.0 29.9 25.4-34.465-74 334 2.8 0.8-4.7 30.5 25.5-35.6 42.4 36.9-47.8 24.3 19.5-29.1
25-74 2308 3.4 2.6-4.3 27.4 25.4-29.5 35.7 33.6-37.9 33.4 31.2-35.525-64 1974 3.5 2.6-4.4 27.2 25.1-29.4 35.3 33.0-37.5 34.0 31.8-36.3

Bhutan StepS Survey report 2009
- 61 -
Fruitandvegetableconsumptionperday
Description:Percentageofthoseeatinglessthanfiveservingsoffruitand/orvegetablesonaverageperday.
Instrumentquestions:Inatypicalweek,onhowmanydaysdoyoueatfruit?Howmanyservingsoffruitdoyoueatononeofthosedays?Inatypicalweek,onhowmanydaysdoyoueatvegetables?Howmanyservingsofvegetablesdoyoueatononeofthosedays?
Less than five servings of fruit and/or vegetables on average per day
AgeGroup(years)
Men Women Both Sexes
n%<fiveservingsperday
95%CI n%<fiveservingsperday
95%CI n% < five servings per day
95% CI
25-34 241 62.7 56.5-68.8 272 66.2 60.6-71.8 513 64.2 60.0-68.435-44 243 63.4 57.3-69.4 268 64.9 59.2-70.6 511 64.0 59.8-68.3
45-54 245 67.3 61.5-73.2 285 73.0 67.8-78.1 530 69.8 65.9-73.8
55-64 190 68.4 61.8-75.0 230 72.2 66.4-78.0 420 70.1 65.6-74.665-74 141 73.1 65.7-80.4 193 78.8 73.0-84.5 334 75.7 70.9-80.5
25-74 1060 65.0 61.9-68.2 1248 68.7 65.8-71.5 2308 66.6 64.5-68.825-64 919 64.4 61.1-67.8 1055 67.9 64.9-70.9 1974 65.9 63.7-68.3
Typeofoilusedmostfrequently
Description:typeofoilorfatmostoftenusedformealpreparationinhouseholds(presentedonlyforbothsexesbecauseresultsareforthehouseholdnotindividuals).
Instrumentquestion:Whattypeofoilorfatismostoftenusedformealpreparationinyourhousehold?
Typeofoilorfatmostoftenusedformealpreparationinhousehold
n(house-holds)
%Vegetableoil
95%CI %AnimalFat 95%CI %ButterorGhee 95%CI
2468 96.8 96.0-97.6 0.5 0.3-0.8 1.5 0.9-2.1
Typeofoilorfatmostoftenusedformealpreparationinhousehold
n(house-holds)
%Margarine 95%CI%NoneinParticular
95%CI %None 95%CI %Other 95%CI
2468 0.4 0.1-0.7 0.4 0.1-0.7 0.0 -- 0.4 0.1-0.7
Amountoffat/oilused
Description:Amountoffat/oilusedinamonth.
Instrumentquestions:Totalamountoffat/oilusedinamonth(allformstogether)
Mean number of litres of fat/oil used in a month per adult
AgeGroup(years)
Both Sexes
n Mean number of litres 95%CI
25-74 2451 1.6 1.5-1.625-64 2096 1.6 1.6-1.7
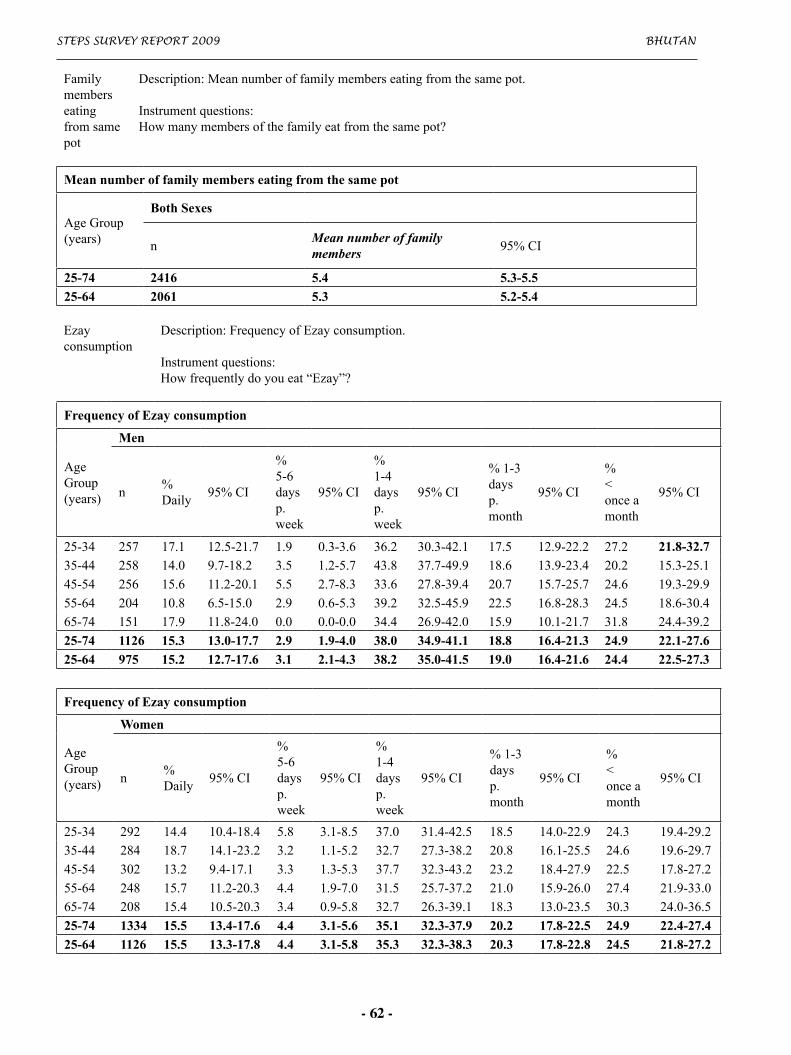
StepS Survey report 2009 Bhutan
- 62 -
Familymemberseatingfromsamepot
Description:Meannumberoffamilymemberseatingfromthesamepot.
Instrumentquestions:Howmanymembersofthefamilyeatfromthesamepot?
Mean number of family members eating from the same pot
AgeGroup(years)
Both Sexes
nMean number of family members
95%CI
25-74 2416 5.4 5.3-5.525-64 2061 5.3 5.2-5.4
Ezayconsumption
Description:FrequencyofEzayconsumption.
Instrumentquestions:Howfrequentlydoyoueat“Ezay”?
Frequency of Ezay consumption
AgeGroup(years)
Men
n%Daily
95%CI
%5-6daysp.week
95%CI
%1-4daysp.week
95%CI
%1-3daysp.month
95%CI
%<onceamonth
95%CI
25-34 257 17.1 12.5-21.7 1.9 0.3-3.6 36.2 30.3-42.1 17.5 12.9-22.2 27.2 21.8-32.735-44 258 14.0 9.7-18.2 3.5 1.2-5.7 43.8 37.7-49.9 18.6 13.9-23.4 20.2 15.3-25.1
45-54 256 15.6 11.2-20.1 5.5 2.7-8.3 33.6 27.8-39.4 20.7 15.7-25.7 24.6 19.3-29.9
55-64 204 10.8 6.5-15.0 2.9 0.6-5.3 39.2 32.5-45.9 22.5 16.8-28.3 24.5 18.6-30.465-74 151 17.9 11.8-24.0 0.0 0.0-0.0 34.4 26.9-42.0 15.9 10.1-21.7 31.8 24.4-39.2
25-74 1126 15.3 13.0-17.7 2.9 1.9-4.0 38.0 34.9-41.1 18.8 16.4-21.3 24.9 22.1-27.625-64 975 15.2 12.7-17.6 3.1 2.1-4.3 38.2 35.0-41.5 19.0 16.4-21.6 24.4 22.5-27.3
Frequency of Ezay consumption
AgeGroup(years)
Women
n%Daily
95%CI
%5-6daysp.week
95%CI
%1-4daysp.week
95%CI
%1-3daysp.month
95%CI
%<onceamonth
95%CI
25-34 292 14.4 10.4-18.4 5.8 3.1-8.5 37.0 31.4-42.5 18.5 14.0-22.9 24.3 19.4-29.235-44 284 18.7 14.1-23.2 3.2 1.1-5.2 32.7 27.3-38.2 20.8 16.1-25.5 24.6 19.6-29.7
45-54 302 13.2 9.4-17.1 3.3 1.3-5.3 37.7 32.3-43.2 23.2 18.4-27.9 22.5 17.8-27.2
55-64 248 15.7 11.2-20.3 4.4 1.9-7.0 31.5 25.7-37.2 21.0 15.9-26.0 27.4 21.9-33.065-74 208 15.4 10.5-20.3 3.4 0.9-5.8 32.7 26.3-39.1 18.3 13.0-23.5 30.3 24.0-36.5
25-74 1334 15.5 13.4-17.6 4.4 3.1-5.6 35.1 32.3-37.9 20.2 17.8-22.5 24.9 22.4-27.425-64 1126 15.5 13.3-17.8 4.4 3.1-5.8 35.3 32.3-38.3 20.3 17.8-22.8 24.5 21.8-27.2
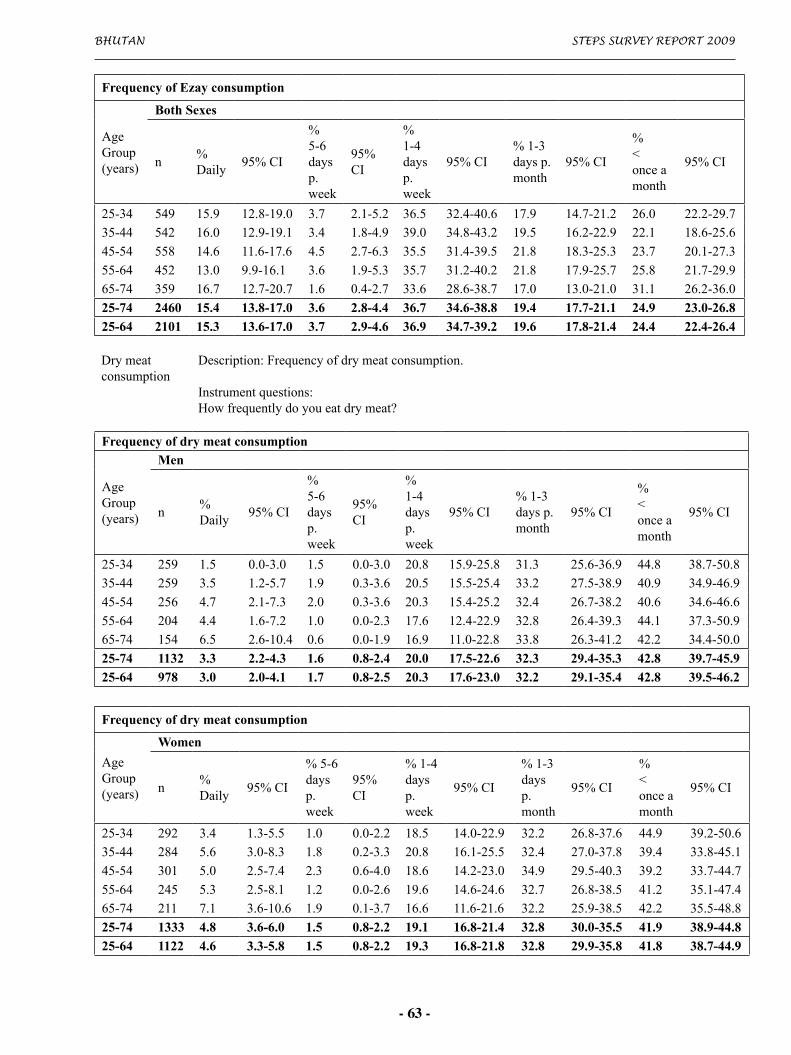
Bhutan StepS Survey report 2009
- 63 -
Frequency of Ezay consumption
AgeGroup(years)
Both Sexes
n%Daily
95%CI
%5-6daysp.week
95%CI
%1-4daysp.week
95%CI%1-3daysp.month
95%CI
%<onceamonth
95%CI
25-34 549 15.9 12.8-19.0 3.7 2.1-5.2 36.5 32.4-40.6 17.9 14.7-21.2 26.0 22.2-29.735-44 542 16.0 12.9-19.1 3.4 1.8-4.9 39.0 34.8-43.2 19.5 16.2-22.9 22.1 18.6-25.6
45-54 558 14.6 11.6-17.6 4.5 2.7-6.3 35.5 31.4-39.5 21.8 18.3-25.3 23.7 20.1-27.3
55-64 452 13.0 9.9-16.1 3.6 1.9-5.3 35.7 31.2-40.2 21.8 17.9-25.7 25.8 21.7-29.965-74 359 16.7 12.7-20.7 1.6 0.4-2.7 33.6 28.6-38.7 17.0 13.0-21.0 31.1 26.2-36.0
25-74 2460 15.4 13.8-17.0 3.6 2.8-4.4 36.7 34.6-38.8 19.4 17.7-21.1 24.9 23.0-26.825-64 2101 15.3 13.6-17.0 3.7 2.9-4.6 36.9 34.7-39.2 19.6 17.8-21.4 24.4 22.4-26.4
Drymeatconsumption
Description:Frequencyofdrymeatconsumption.
Instrumentquestions:Howfrequentlydoyoueatdrymeat?
Frequency of dry meat consumption
AgeGroup(years)
Men
n%Daily
95%CI
%5-6daysp.week
95%CI
%1-4daysp.week
95%CI%1-3daysp.month
95%CI
%<onceamonth
95%CI
25-34 259 1.5 0.0-3.0 1.5 0.0-3.0 20.8 15.9-25.8 31.3 25.6-36.9 44.8 38.7-50.835-44 259 3.5 1.2-5.7 1.9 0.3-3.6 20.5 15.5-25.4 33.2 27.5-38.9 40.9 34.9-46.9
45-54 256 4.7 2.1-7.3 2.0 0.3-3.6 20.3 15.4-25.2 32.4 26.7-38.2 40.6 34.6-46.6
55-64 204 4.4 1.6-7.2 1.0 0.0-2.3 17.6 12.4-22.9 32.8 26.4-39.3 44.1 37.3-50.965-74 154 6.5 2.6-10.4 0.6 0.0-1.9 16.9 11.0-22.8 33.8 26.3-41.2 42.2 34.4-50.0
25-74 1132 3.3 2.2-4.3 1.6 0.8-2.4 20.0 17.5-22.6 32.3 29.4-35.3 42.8 39.7-45.925-64 978 3.0 2.0-4.1 1.7 0.8-2.5 20.3 17.6-23.0 32.2 29.1-35.4 42.8 39.5-46.2
Frequency of dry meat consumption
AgeGroup(years)
Women
n%Daily
95%CI
%5-6daysp.week
95%CI
%1-4daysp.week
95%CI
%1-3daysp.month
95%CI
%<onceamonth
95%CI
25-34 292 3.4 1.3-5.5 1.0 0.0-2.2 18.5 14.0-22.9 32.2 26.8-37.6 44.9 39.2-50.635-44 284 5.6 3.0-8.3 1.8 0.2-3.3 20.8 16.1-25.5 32.4 27.0-37.8 39.4 33.8-45.1
45-54 301 5.0 2.5-7.4 2.3 0.6-4.0 18.6 14.2-23.0 34.9 29.5-40.3 39.2 33.7-44.7
55-64 245 5.3 2.5-8.1 1.2 0.0-2.6 19.6 14.6-24.6 32.7 26.8-38.5 41.2 35.1-47.465-74 211 7.1 3.6-10.6 1.9 0.1-3.7 16.6 11.6-21.6 32.2 25.9-38.5 42.2 35.5-48.8
25-74 1333 4.8 3.6-6.0 1.5 0.8-2.2 19.1 16.8-21.4 32.8 30.0-35.5 41.9 38.9-44.825-64 1122 4.6 3.3-5.8 1.5 0.8-2.2 19.3 16.8-21.8 32.8 29.9-35.8 41.8 38.7-44.9

StepS Survey report 2009 Bhutan
- 64 -
Frequency of dry meat consumption
AgeGroup(years)
Both Sexes
n%Daily
95%CI
%5-6daysp.week
95%CI
%1-4daysp.week
95%CI
%1-3daysp.month
95%CI
%<onceamonth
95%CI
25-34 551 2.4 1.1-3.6 1.3 0.3-2.3 19.8 16.4-23.2 31.7 27.7-35.6 44.8 40.6-49.035-44 543 4.4 2.7-6.1 1.9 0.7-3.0 20.6 17.1-24.1 32.9 28.8-36.9 40.3 36.1-44.5
45-54 557 4.8 3.0-6.6 2.1 0.9-3.3 19.6 16.2-22.9 33.5 29.5-37.5 40.0 35.8-44.1
55-64 449 4.8 2.8-6.8 1.1 0.1-2.1 18.5 14.9-22.2 32.8 28.3-37.2 42.8 38.2-47.565-74 365 6.8 4.1-9.4 1.2 0.1-2.3 16.7 12.8-20.7 33.1 28.1-38.0 42.2 37.0-47.4
25-74 2465 3.9 3.1-4.7 1.6 1.0-2.1 19.6 17.9-21.4 32.5 30.5-34.6 42.4 40.2-44.625-64 2100 3.7 2.9-4.5 1.6 1.0-2.2 19.8 18.0-21.7 32.5 30.3-34.7 42.4 40.1-44.7
Sujaconsumption
Description:Frequencyofsujaconsumption.
Instrumentquestions:Howfrequentlydoyoudrinksuja?
Frequency of suja consumption
AgeGroup(years)
Men
n%Daily
95%CI
%5-6daysp.week
95%CI
%1-4daysp.week
95%CI
%1-3daysp.month
95%CI
%<onceamonth
95%CI
25-34 255 17.3 12.6-21.9 2.0 0.3-3.7 35.7 29.8-41.6 17.6 13.0-22.3 27.5 22.0-32.935-44 255 14.1 9.8-18.4 3.5 1.3-5.8 43.9 37.8-50.0 18.8 14.0-23.6 19.6 14.7-24.5
45-54 247 15.4 10.9-19.9 4.9 2.2-7.5 34.0 28.1-39.9 20.6 15.6-25.7 25.1 19.7-30.5
55-64 202 10.9 6.6-15.2 3.0 0.6-5.3 38.6 31.9-45.3 22.8 17.0-28.6 24.8 18.8-30.765-74 150 18.0 11.8-24.2 0.0 0.0-0.0 34.0 26.4-41.6 16.0 10.1-21.9 32.0 24.5-39.5
25-74 1109 15.4 13.1-17.8 2.9 1.8-3.9 37.8 34.7-40.9 18.9 16.5-21.4 25.0 22.2-27.725-64 959 15.2 12.8-17.7 3.1 1.9-4.2 38.1 34.8-41.4 19.2 16.5-21.8 24.5 21.5-27.4
Frequency of suja consumption
AgeGroup(years)
Women
n%Daily
95%CI
%5-6daysp.week
95%CI
%1-4daysp.week
95%CI
%1-3daysp.month
95%CI
%<onceamonth
95%CI
25-34 288 14.6 10.5-18.7 5.6 2.9-8.2 36.8 31.2-42.4 18.4 13.9-22.9 24.7 19.7-29.635-44 279 18.3 13.7-22.8 2.9 0.9-4.8 33.3 27.8-38.9 20.4 15.7-25.2 25.1 20.0-30.2
45-54 300 13.3 9.5-17.2 3.3 1.3-5.4 38.0 32.5-43.5 23.3 18.5-28.1 22.0 17.3-26.7
55-64 245 15.9 11.3-20.5 4.5 1.9-7.1 31.4 25.6-37.2 20.8 15.7-25.9 27.3 21.8-32.965-74 203 15.8 10.7-20.8 3.4 0.9-6.0 32.5 26.1-39.0 18.7 13.4-24.1 29.6 23.3-35.8
25-74 1315 15.5 13.4-17.7 4.2 3.0-5.4 35.2 32.3-38.0 20.1 17.8-22.5 25.0 22.4-27.525-64 1112 15.5 13.3-17.8 4.3 2.9-5.6 35.4 32.4-38.4 20.2 17.7-22.7 24.6 21.9-27.3

Bhutan StepS Survey report 2009
- 65 -
Frequency of suja consumption
AgeGroup(years)
Both Sexes
n%Daily
95%CI
%5-6daysp.week
95%CI
%1-4daysp.week
95%CI
%1-3daysp.month
95%CI
%<onceamonth
95%CI
25-34 543 16.1 12.9-19.2 3.5 2.0-5.1 36.2 32.1-40.3 18.0 14.7-21.3 26.2 22.4-30.035-44 534 15.9 12.8-19.0 3.2 1.7-4.8 39.3 35.1-43.6 19.5 16.1-22.9 22.0 18.4-25.5
45-54 547 14.5 11.4-17.5 4.2 2.4-5.9 35.8 31.7-39.9 21.9 18.4-25.4 23.7 20.1-27.3
55-64 447 13.2 10.0-16.3 3.7 1.9-5.4 35.4 30.8-39.9 21.9 18.0-25.8 25.9 21.8-30.165-74 353 17.0 12.9-21.0 1.6 0.4-2.8 33.3 28.3-38.4 17.3 13.2-21.3 30.9 25.9-35.8
25-74 2424 15.5 13.9-17.1 3.4 2.7-4.2 36.6 34.5-38.8 19.5 17.7-21.2 25.0 23.1-26.925-64 2071 15.4 13.7-17.1 3.6 2.7-4.4 36.9 34.6-39.2 19.6 17.8-21.5 24.5 22.5-26.6
StepS Survey report 2009 Bhutan
- 66 -
PhysicalActivityIntroduction Analysisphysicalactivitydatacanbeverycomplicatedandtheresultconfusing.
Thefollowingguidelineswillhelpclarifytheresultsofthephysicalactivitydataandwillalsoprovidevaluableinformationontheclassifications.Makesureyouusesomeoftheseguidelineswhenyoureportphysicalactivitydata.
METvaluesareappliedtovigorousandmoderateintensityvariablesinthework,transportandrecreationdomains.Thesehavebeencalculatedusinganaverageofthetypicaltypesofactivityundertaken.DifferenttypesofactivitieshavebeengroupedtogetherandgivenaMETvaluebasedontheintensityoftheactivity.ApplyingMETvaluestotypesofactivitiesallowsustocalculatetotalphysicalactivity.FormoreinformationregardingMETvaluesgotheSTEPSwebsiteatwww.who.int/chp/steps.
Thecalculationsbelowusemultiplequestionsinthephysicalactivitysection.Tosimplifythisabitthequestionshavebeenclusteredintofourgroups(astheyappearintheInstrument).IntheInstrumentquestionssectionofthetable,onlythegrouplabelappears.Thespecificquestionsforeachgrouparepresentedbelow.
Activityatwork:Doesyourworkinvolvevigorous-intensityactivitythatcauseslargeincreasesinbreathingorheartratelike[examples]foratleast10minutescontinuously?Inatypicalweek,onhowmanydaysdoyoudovigorous-intensityactivitiesaspartofyourwork?Howmuchtimedoyouspenddoingvigorous-intensityactivitiesatworkonatypicalday?Doesyourworkinvolvemoderate-intensityactivity,thatcausessmallincreasesinbreathingorheartratesuchasbriskwalkingforatleast10minutescontinuously?Inatypicalweek,onhowmanydaysdoyoudomoderate-intensityactivitiesaspartofyourwork?Howmuchtimedoyouspenddoingmoderate-intensityactivitiesatworkonatypicalday?
Traveltoandfromplaces:Doyouwalkoruseabicycleforatleast10minutescontinuouslytogettoandfromplaces?Inatypicalweek,onhowmanydaysdoyouwalkorbicycleforatleast10minutescontinuouslytogettoandfromplaces?

Bhutan StepS Survey report 2009
- 67 -
Howmuchtimedoyouspendwalkingorbicyclingfortravelonatypicalday?
Recreationalactivities:Doyoudoanyinvolvevigorous-intensitysports,fitnessorrecreationalactivitiesthatcauselargeincreasesinbreathingorheartratelike[examples]foratleast10minutescontinuously?Inatypicalweek,onhowmanydaysdoyoudovigorous-intensitysports,fitnessorrecreationalactivities?Howmuchtimedoyouspenddoingvigorous-intensitysports,fitnessorrecreationalactivitiesonatypicalday?Doyoudoanyinvolvemoderate-intensitysports,fitnessorrecreationalactivitiesthatcauselargeincreasesinbreathingorheartratelike[examples]foratleast10minutescontinuously?Inatypicalweek,onhowmanydaysdoyoudomoderate--intensitysports,fitnessorrecreationalactivities?Howmuchtimedoyouspenddoingmoderate--intensitysports,fitnessorrecreationalactivitiesonatypicalday?
Sedentarybehaviour:Howmuchtimedoyouusuallyspendsittingorrecliningonatypicalday?
Levelsoftotalphysicalactivity
Description:Percentageofrespondentsclassifiedintothreecategoriesoftotalphysicalactivity.
Instrumentquestions:activityatworktraveltoandfromplacesrecreationalactivities
Level of total physical activity
AgeGroup(years)
Men
n %Low 95%CI %Moderate 95%CI %High 95%CI
25-34 238 50.0 43.6-56.4 18.5 13.6-23.4 31.5 25.6-37.435-44 237 44.7 38.4-51.1 22.4 17.1-27.7 32.9 26.9-38.9
45-54 242 47.9 41.6-54.2 24.8 19.4-30.2 27.3 21.7-32.9
55-64 192 54.2 47.1-61.2 22.9 17.0-28.9 22.9 17.0-28.965-74 148 64.9 57.2-72.6 16.2 10.3-22.2 18.9 12.6-25.2
25-74 1057 49.8 46.5-53.1 21.0 18.3-23.6 29.3 26.2-32.325-64 909 48.7 45.2-52.1 21.3 18.5-24.1 30.0 26.8-33.3
Level of total physical activity
AgeGroup(years)
Women
n %Low 95%CI %Moderate 95%CI %High 95%CI
25-34 275 71.6 66.3-77.0 12.7 8.8-16.7 15.6 11.3-19.935-44 263 66.5 60.8-72.2 13.3 9.2-17.4 20.2 15.3-25.0
45-54 294 66.7 61.3-72.1 15.0 10.9-19.0 18.4 13.9-22.8

StepS Survey report 2009 Bhutan
- 68 -
55-64 238 69.3 63.5-75.2 16.4 11.7-21.1 14.3 9.8-18.765-74 203 77.3 71.6-83.1 11.3 7.0-15.7 11.3 7.0-15.7
25-74 1273 69.6 66.8-72.4 13.6 11.6-15.7 16.8 14.5-19.025-64 1070 69.0 66.0-72.0 13.8 11.6-16.0 17.2 14.8-19.6
Level of total physical activity
AgeGroup(years)
Both Sexes
n %Low 95%CI %Moderate 95%CI %High 95%CI
25-34 513 59.6 55.3-64.0 15.9 12.7-19.2 24.5 20.6-28.335-44 500 54.2 49.8-58.7 18.4 14.9-21.9 27.3 23.3-31.4
45-54 536 56.5 52.2-60.7 20.3 16.8-23.8 23.2 19.5-26.9
55-64 430 61.1 56.4-65.8 19.9 16.0-23.8 19.0 15.1-22.865-74 351 70.6 65.7-75.6 14.0 10.2-17.7 15.4 11.4-19.4
25-74 2330 58.6 56.4-60.9 17.7 15.9-19.4 23.7 21.7-25.725-64 1979 57.7 55.3-60.1 18.0 16.1-19.8 24.3 22.2-26.4
Totalphysicalactivity-mean
Description:Meanminutesoftotalphysicalactivityonaverageperday.
Instrumentquestionsactivityatworktraveltoandfromplacesrecreationalactivities
Mean minutes of total physical activity on average per day
AgeGroup(years)
Men Women Both Sexes
nMeanminutes
95%CI nMeanminutes
95%CI nMean minutes
95% CI
25-34 238 94.6 75.4-113.7 275 49.1 36.6-61.6 513 74.3 62.2-86.535-44 237 109.4 88.3-130.6 263 71.6 55.6-87.7 500 92.9 79.0-106.9
45-54 242 90.9 70.6-111.2 294 63.3 48.5-78.1 536 78.3 65.3-91.3
55-64 192 93.6 69.6-117.6 238 57.6 41.6-73.6 430 77.1 62.1-92.165-74 148 69.1 45.4-92.7 203 34.0 23.9-44.1 351 52.8 39.2-66.4
25-74 1057 95.9 85.6-106.2 1273 57.2 50.1-64.2 2330 78.6 72.0-85.225-64 909 97.9 87.0-108.9 1070 59.1 51.5-66.6 1979 80.6 73.6-87.6
Totalphysicalactivity-median
Description:Medianminutesoftotalphysicalactivityonaverageperday.
Instrumentquestionsactivityatworktraveltoandfromplacesrecreationalactivities

Bhutan StepS Survey report 2009
- 69 -
Median minutes of total physical activity on average per day
AgeGroup(years)
Men Women Both Sexes
nMedianminutes
Inter-quartilerange(P25-P75)
nMedianminutes
Inter-quartilerange(P25-P75)
nMedian minutes
Inter-quartile range (P25-P75)
25-34 238 40.0 0.0-110.0 275 0.0 0.0-42.9 513 17.1 0.0-77.135-44 237 45.0 0.0-137.1 263 8.6 0.0-60.0 500 25.7 0.0-120.0
45-54 242 37.1 0.0-120.0 294 8.6 0.0-60.0 536 25.7 0.0-90.0
55-64 192 25.7 0.0-90.0 238 4.3 0.0-55.7 430 15.0 0.0-68.665-74 148 0.0 0.0-60.0 203 0.0 0.0-25.7 351 0.0 0.0-42.9
25-74 1057 34.3 0.0-120.0 1273 4.3 0.0-51.4 2330 17.1 0.0-85.725-64 909 37.9 0.0-120.0 1070 6.4 0.0-51.4 1979 20.0 0.0-90.0
Domain-specificphysicalactivity-mean
Description:Meanminutesspentinwork-,transport-andrecreation-relatedphysicalactivityonaverageperday.
Instrumentquestions:activityatworktraveltoandfromplacesrecreationalactivities
Mean minutes of work-related physical activity on average per day
AgeGroup(years)
Men Women Both Sexes
nMeanminutes
95%CI nMeanminutes
95%CI nMean minutes
95% CI
25-34 238 53.8 36.4-71.3 275 27.3 17.9-36.7 513 42.0 31.4-52.735-44 237 63.0 44.9-81.0 263 49.4 35.1-63.7 500 57.1 45.1-69.0
45-54 242 47.3 32.7-61.8 294 41.0 28.9-53.2 536 44.4 34.7-54.1
55-64 192 66.4 44.3-88.5 238 32.4 18.6-46.1 430 50.8 37.2-64.465-74 148 45.4 23.5-67.4 203 12.4 6.3-18.5 351 30.1 17.9-42.4
25-74 1057 55.9 46.9-64.9 1273 34.8 29.0-40.6 2330 46.5 40.8-52.125-64 909 56.7 46.1-66.3 1070 36.6 30.4-42.8 1979 47.8 41.7-53.7
Mean minutes of transport-related physical activity on average per day
AgeGroup(years)
Men Women Both Sexes
nMeanminutes
95%CI nMeanminutes
95%CI nMean minutes
95% CI
25-34 238 17.4 12.7-22.1 275 10.7 7.0-14.3 513 14.4 11.3-17.535-44 237 26.2 18.3-34.1 263 11.3 8.1-14.5 500 19.7 15.0-24.4
45-54 242 27.9 21.3-34.5 294 13.8 9.2-18.5 536 21.5 17.3-25.7
55-64 192 18.0 12.1-23.8 238 14.1 9.4-18.8 430 16.2 12.4-20.065-74 148 17.7 11.8-23.7 203 17.1 10.5-23.7 351 17.4 13.0-21.9
25-74 1057 21.6 18.6-24.7 1273 12.3 10.3-14.2 2330 17.5 15.5-19.425-64 909 21.9 18.7-25.2 1070 11.9 9.9-13.9 1979 17.5 15.4-19.5

StepS Survey report 2009 Bhutan
- 70 -
Mean minutes of recreation-related physical activity on average per day
AgeGroup(years)
Men Women Both Sexes
nMeanminutes
95%CI nMeanminutes
95%CI nMean minutes
95% CI
25-34 238 23.3 18.0-28.6 275 11.1 6.0-16.2 513 17.9 14.1-21.635-44 237 20.3 14.5-26.0 263 10.9 5.3-16.6 500 16.2 12.1-20.3
45-54 242 15.7 9.6-21.8 294 8.4 3.6-13.3 536 12.4 8.4-16.4
55-64 192 9.2 4.0-14.4 238 11.1 4.9-17.3 430 10.1 6.1-14.165-74 148 5.9 0.0-11.7 203 4.5 1.1-7.9 351 5.2 1.7-8.8
25-74 1057 18.3 15.5-21.1 1273 10.1 7.4-12.7 2330 14.6 12.7-16.625-74 909 19.3 16.3-22.3 1070 10.5 7.7-13.4 1979 15.4 13.3-17.5
Domain-specificphysicalactivity-median
Description:Medianminutesspentonaverageperdayinwork-,transport-andrecreation-relatedphysicalactivity.
Instrumentquestions:activityatworktraveltoandfromplacesrecreationalactivities
Median minutes of work-related physical activity on average per day
AgeGroup(years)
Men Women Both Sexes
nMedianminutes
Inter-quartilerange(P25-P75)
nMedianminutes
Inter-quartilerange(P25-P75)
nMedian minutes
Inter-quartile range (P25-P75)
25-34 238 0.0 0.0-30.0 275 0.0 0.0-0.0 513 0.0 0.0-17.135-44 237 0.0 0.0-45.0 263 0.0 0.0-17.1 500 0.0 0.0-34.3
45-54 242 0.0 0.0-30.0 294 0.0 0.0-12.9 536 0.0 0.0-25.7
55-64 192 0.0 0.0-51.4 238 0.0 0.0-0.0 430 0.0 0.0-20.065-74 148 0.0 0.0-2.1 203 0.0 0.0-0.0 351 0.0 0.0-0.0
25-74 1057 0.0 0.0-30.0 1273 0.0 0.0-6.4 2330 0.0 0.0-21.425-64 909 0.0 0.0-34.3 1070 0.0 0.0-8.5 1979 0.0 0.0-25.7
Median minutes of transport-related physical activity on average per day
AgeGroup(years)
Men Women Both Sexes
nMedianminutes
Inter-quartilerange(P25-P75)
nMedianminutes
Inter-quartilerange(P25-P75)
nMedian minutes
Inter-quartile range (P25-P75)
25-34 238 0.0 0.0-21.4 275 0.0 0.0-7.1 513 0.0 0.0-17.135-44 237 0.0 0.0-30.0 263 0.0 0.0-11.4 500 0.0 0.0-25.745-54 242 0.0 0.0-34.3 294 0.0 0.0-15.0 536 0.0 0.0-25.755-64 192 0.0 0.0-25.7 238 0.0 0.0-8.6 430 0.0 0.0-17.165-74 148 0.0 0.0-17.1 203 0.0 0.0-8.6 351 0.0 0.0-12.925-74 1057 0.0 0.0-25.7 1273 0.0 0.0-8.6 2330 0.0 0.0-19.325-64 909 0.0 0.0-30.0 1070 0.0 0.0-10.0 1979 0.0 0.0-20.0

Bhutan StepS Survey report 2009
- 71 -
Median minutes of recreation-related physical activity on average per day
AgeGroup(years)
Men Women Both Sexes
nMedianminutes
Inter-quartilerange(P25-P75)
nMedianminutes
Inter-quartilerange(P25-P75)
nMedian minutes
Inter-quartile range (P25-P75)
25-34 238 0.0 0.0-34.3 275 0.0 0.0-0.0 513 0.0 0.0-12.9
35-44 237 0.0 0.0-25.7 263 0.0 0.0-0.0 500 0.0 0.0-0.0
45-54 242 0.0 0.0-0.0 294 0.0 0.0-0.0 536 0.0 0.0-0.0
55-64 192 0.0 0.0-0.0 238 0.0 0.0-0.0 430 0.0 0.0-0.0
65-74 148 0.0 0.0-0.0 203 0.0 0.0-0.0 351 0.0 0.0-0.0
25-74 1057 0.0 0.0-17.1 1273 0.0 0.0-0.0 2330 0.0 0.0-0.0
25-64 909 0.0 0.0-19.3 1070 0.0 0.0-0.0 1979 0.0 0.0-0.0
Nophysicalactivitybydomain
Description:Percentageofrespondentsclassifiedasdoingnowork-,transport-orrecreational-relatedphysicalactivity.
Instrumentquestions:activityatworktraveltoandfromplacesrecreationalactivities
No work-related physical activity
AgeGroup(years)
Men Women Both Sexes
n%noactivityatwork
95%CI n%noactivityatwork
95%CI n% no activity at work
95% CI
25-34 238 66.0 59.9-72.0 275 76.4 71.3-81.4 513 70.6 66.5-74.635-44 237 60.3 54.1-66.6 263 68.4 62.8-74.1 500 63.9 59.6-68.2
45-54 242 65.3 59.3-71.3 294 72.1 67.0-77.2 536 68.4 64.4-72.4
55-64 192 63.5 56.7-70.4 238 76.5 71.1-81.9 430 69.5 65.0-73.965-74 148 74.3 67.3-81.4 203 85.2 80.3-90.1 351 79.4 74.9-83.8
25-74 1057 64.7 61.5-67.8 1273 74.3 71.7-76.9 2330 69.0 66.9-71.125-64 909 64.0 60.6-67.3 1070 73.4 70.6-76.2 1979 68.2 65.9-70.4

StepS Survey report 2009 Bhutan
- 72 -
No transport-related physical activity
AgeGroup(years)
Men Women Both Sexes
n
%noactivityfortransport
95%CI n%noactivityfortransport
95%CI n
% no activity for transport
95% CI
25-34 238 59.2 53.0-65.5 275 72.7 67.5-78.0 513 65.2 61.0-69.535-44 237 54.4 48.1-60.8 263 68.4 62.8-74.1 500 60.5 56.2-64.9
45-54 242 52.9 46.6-59.2 294 65.6 60.2-71.1 536 58.7 54.4-63.0
55-64 192 62.5 55.6-69.4 238 71.0 65.2-76.8 430 66.4 61.8-71.065-74 148 65.5 57.9-73.2 203 71.4 65.2-77.6 351 68.3 63.2-73.3
25-74 1057 57.7 54.4-60.9 1273 70.1 67.3-72.8 2330 63.2 61.0-65.425-64 909 57.1 53.7-60.5 1070 70.0 67.0-72.9 1979 62.8 60.5-65.2
No recreation-related physical activity
AgeGroup(years)
Men Women Both Sexes
n%noactivityatrecreation
95%CI n%noactivityatrecreation
95%CI n% no activity at recreation
95% CI
25-34 238 59.2 53.0-65.5 275 87.3 83.3-91.2 513 71.7 67.6-75.835-44 237 66.2 60.2-72.3 263 91.3 87.8-94.7 500 77.1 73.3-81.0
45-54 242 78.1 72.9-83.3 294 90.1 86.7-93.5 536 83.6 80.3-86.9
55-64 192 84.9 79.8-90.0 238 90.8 87.1-94.4 430 87.6 84.3-90.865-74 148 93.2 89.2-97.3 203 94.1 90.8-97.3 351 93.6 91.0-96.3
25-74 1057 69.7 66.6-72.8 1273 89.7 87.8-91.6 2330 78.7 76.7-80.725-64 909 68.0 64.6-71.3 1070 89.4 87.3-91.4 1979 77.5 75.4-79.6
Compositionoftotalphysicalactivity
Description:Percentageofwork,transportandrecreationalactivitycontributingtototalactivity.
Instrumentquestions:activityatworktraveltoandfromplacesrecreationalactivities
Composition of total physical activity
AgeGroup(years)
Men
n%Activityfromwork
95%CI%Activityfortransport
95%CI%Activityduringleisuretime
95%CI
25-34 157 33.6 27.5-39.7 33.2 27.1-39.3 33.2 27.4-39.135-44 169 37.6 31.4-43.7 35.2 29.2-41.1 27.3 21.5-33.0
45-54 165 33.9 27.9-39.9 46.0 39.5-52.5 20.1 14.7-25.5
55-64 119 48.0 40.0-56.0 37.0 29.4-44.5 15.0 9.5-20.665-74 72 39.9 30.0-49.8 50.7 40.7-60.8 9.3 3.1-15.5
25-74 682 36.6 33.4-39.9 37.4 34.1-40.6 26.0 22.9-29.025-64 610 36.6 33.1-39.9 36.7 33.3-40.0 26.9 23.7-30.1
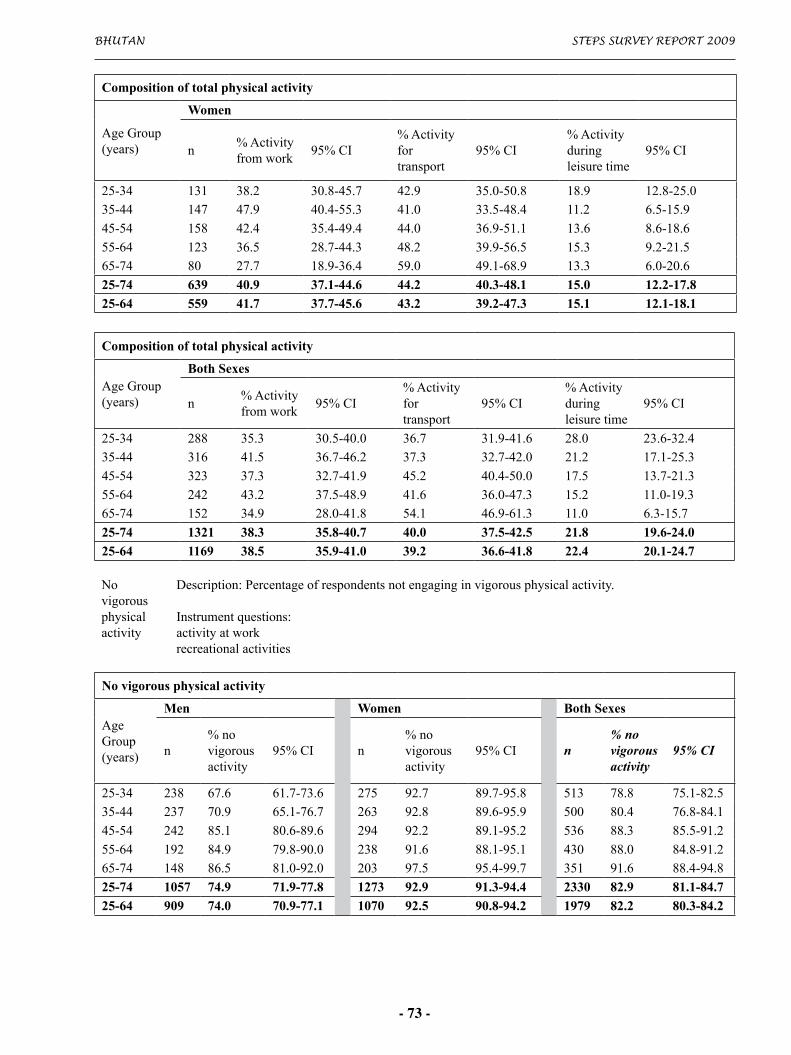
Bhutan StepS Survey report 2009
- 73 -
Composition of total physical activity
AgeGroup(years)
Women
n%Activityfromwork
95%CI%Activityfortransport
95%CI%Activityduringleisuretime
95%CI
25-34 131 38.2 30.8-45.7 42.9 35.0-50.8 18.9 12.8-25.035-44 147 47.9 40.4-55.3 41.0 33.5-48.4 11.2 6.5-15.9
45-54 158 42.4 35.4-49.4 44.0 36.9-51.1 13.6 8.6-18.6
55-64 123 36.5 28.7-44.3 48.2 39.9-56.5 15.3 9.2-21.565-74 80 27.7 18.9-36.4 59.0 49.1-68.9 13.3 6.0-20.6
25-74 639 40.9 37.1-44.6 44.2 40.3-48.1 15.0 12.2-17.825-64 559 41.7 37.7-45.6 43.2 39.2-47.3 15.1 12.1-18.1
Composition of total physical activity
AgeGroup(years)
Both Sexes
n%Activityfromwork
95%CI%Activityfortransport
95%CI%Activityduringleisuretime
95%CI
25-34 288 35.3 30.5-40.0 36.7 31.9-41.6 28.0 23.6-32.435-44 316 41.5 36.7-46.2 37.3 32.7-42.0 21.2 17.1-25.3
45-54 323 37.3 32.7-41.9 45.2 40.4-50.0 17.5 13.7-21.3
55-64 242 43.2 37.5-48.9 41.6 36.0-47.3 15.2 11.0-19.365-74 152 34.9 28.0-41.8 54.1 46.9-61.3 11.0 6.3-15.7
25-74 1321 38.3 35.8-40.7 40.0 37.5-42.5 21.8 19.6-24.025-64 1169 38.5 35.9-41.0 39.2 36.6-41.8 22.4 20.1-24.7
Novigorousphysicalactivity
Description:Percentageofrespondentsnotengaginginvigorousphysicalactivity.
Instrumentquestions:activityatworkrecreationalactivities
No vigorous physical activity
AgeGroup(years)
Men Women Both Sexes
n%novigorousactivity
95%CI n%novigorousactivity
95%CI n% no vigorous activity
95% CI
25-34 238 67.6 61.7-73.6 275 92.7 89.7-95.8 513 78.8 75.1-82.535-44 237 70.9 65.1-76.7 263 92.8 89.6-95.9 500 80.4 76.8-84.1
45-54 242 85.1 80.6-89.6 294 92.2 89.1-95.2 536 88.3 85.5-91.2
55-64 192 84.9 79.8-90.0 238 91.6 88.1-95.1 430 88.0 84.8-91.265-74 148 86.5 81.0-92.0 203 97.5 95.4-99.7 351 91.6 88.4-94.8
25-74 1057 74.9 71.9-77.8 1273 92.9 91.3-94.4 2330 82.9 81.1-84.725-64 909 74.0 70.9-77.1 1070 92.5 90.8-94.2 1979 82.2 80.3-84.2

StepS Survey report 2009 Bhutan
- 74 -
Sedentary Description:Minutesspentinsedentaryactivitiesonatypicalday.
Instrumentquestion:sedentarybehaviour
Minutes spent in sedentary activities on average per day
AgeGroup(years)
Men
n Meanminutes 95%CI MedianminutesInterquartilerange(P25-P75)
25-34 257 168.1 152.8-183.5 120.0 80.0-240.035-44 258 155.3 140.3-170.3 120.0 60.0-180.0
45-54 258 165.2 150.2-180.1 120.0 60.0-240.0
55-64 206 158.7 138.8-178.7 120.0 60.0-180.065-74 154 209.0 184.5-233.6 180.0 120.0-300.0
25-74 1133 165.9 157.9-173.9 120.0 60.0-240.025-64 979 162.8 154.3-171.2 120.0 60.0-210.0
Minutes spent in sedentary activities on average per day
AgeGroup(years)
Women
n Meanminutes 95%CI MedianminutesInterquartilerange(P25-P75)
25-34 293 170.4 155.6-185.3 120.0 60.0-240.035-44 286 182.8 167.1-198.5 120.0 60.0-240.0
45-54 304 178.1 162.6-193.7 120.0 60.0-240.0
55-64 249 204.0 186.5-221.5 180.0 120.0-255.065-74 211 248.7 226.6-270.7 240.0 120.0-360.0
25-74 1343 184.7 176.7-192.6 150.0 75.0-240.025-64 1132 179.6 171.3-187.9 150.0 75.0-240.0
Minutes spent in sedentary activities on average per day
AgeGroup(years)
Both Sexes
n Meanminutes 95%CI MedianminutesInterquartilerange(P25-P75)
25-34 550 169.1 158.3-179.9 120.0 60.0-240.035-44 544 167.3 156.3-178.2 120.0 60.0-240.0
45-54 562 171.0 160.2-181.8 120.0 60.0-240.0
55-64 455 179.2 165.6-192.9 120.0 60.0-240.065-74 365 227.4 210.6-244.2 180.0 120.0-360.0
25-74 2476 174.2 168.5-179.9 120.0 60.0-240.025-64 2111 170.2 164.2-176.2 129.9 60.0-240.0

Bhutan StepS Survey report 2009
- 75 -
BloodPressureandDiabetesHistory
Bloodpressurediagnosisandtreatment
Description:Raisedbloodpressurediagnosisandtreatmentresultsamongallrespondents.
Instrumentquestions:Duringthepast12monthshaveyoubeentoldbyadoctororotherhealthworkerthatyouhaveelevatedbloodpressureorhypertension?Areyoucurrentlyreceivinganyofthefollowingtreatments/adviceforhighbloodpressureprescribedbyadoctororotherhealthworker?Drugs(medication)thatyouhavetakeninthelast2weeks?
Raised blood pressure diagnosed by doctor or health worker in last 12 months
AgeGroup(years)
Men Women Both Sexes
n%diagnosed
95%CI n%diagnosed
95%CI n% diagnosed
95% CI
25-34 257 10.5 6.8-14.3 289 11.8 8.0-15.5 546 11.1 8.4-13.735-44 254 13.4 9.2-17.6 280 17.1 12.7-21.6 534 15.0 12.0-18.1
45-54 247 26.3 20.8-31.8 295 22.7 17.9-27.5 542 24.7 21.0-28.4
55-64 198 22.2 16.4-28.0 248 26.6 21.1-32.1 446 24.2 20.2-28.365-74 149 26.8 19.7-34.0 206 28.6 22.5-34.8 355 27.7 22.9-32.5
25-74 1105 16.4 14.1-18.6 1318 18.1 15.9-20.2 2423 17.1 15.5-18.725-64 956 15.6 13.3-18.0 1112 17.2 15.0-19.5 2068 16.3 14.7-18.0
Currently taking blood pressure drugs prescribed by doctor or health worker
AgeGroup(years)
Men Women Both Sexes
n%takingmeds
95%CI n%takingmeds
95%CI n% taking meds
95% CI
25-34 258 2.7 0.7-4.7 291 2.7 0.9-4.6 549 2.7 1.3-4.135-44 258 7.4 4.2-10.6 288 9.0 5.7-12.3 546 8.1 5.8-10.4
45-54 259 16.6 12.1-21.1 303 13.5 9.7-17.4 562 15.2 12.2-18.3
55-64 204 16.7 11.6-21.8 250 20.0 15.0-25.0 454 18.2 14.6-21.865-74 154 18.2 12.1-24.3 211 23.2 17.5-28.9 365 20.5 16.3-24.7
25-74 1133 9.0 7.4-10.6 1343 9.8 8.3-11.4 2476 9.4 8.2-10.525-64 979 8.3 6.7-10.0 1132 8.8 7.2-10.3 2111 8.5 7.4-9.7
Bloodpressurelifestyleadvice
Description:Percentageofrespondentswhoreceivedlifestyleadvicefromadoctororhealthworkertotreatraisedbloodpressure.
Instrumentquestion:Areyoucurrentlyreceivinganyofthefollowingtreatments/adviceforhighbloodpressureprescribedbyadoctororotherhealthworker?

StepS Survey report 2009 Bhutan
- 76 -
Advised by doctor or health worker to have special prescribed diet
AgeGroup(years)
Men Women Both Sexes
n % 95%CI n % 95%CI n % 95% CI
25-34 258 5.4 2.7-8.2 291 7.9 4.8-11.0 549 6.5 4.4-8.635-44 259 8.9 5.4-12.3 288 12.2 8.4-15.9 547 10.3 7.8-12.9
45-54 258 21.7 16.7-26.7 303 17.8 13.5-22.1 561 20.0 16.6-23.4
55-64 203 20.2 14.7-25.7 250 20.4 15.4-25.4 453 20.3 16.5-24.165-74 154 14.9 9.3-20.6 211 23.7 18.0-29.4 365 19.0 14.9-23.0
25-74 1132 11.5 9.6-13.3 1343 13.4 11.5-15.3 2475 12.3 11.0-13.725-64 978 11.2 9.3-13.2 1132 12.6 10.6-14.5 2110 11.8 10.5-13.2
Advised by doctor or health worker to lose weight
AgeGroup(years)
Men Women Both Sexes
n % 95%CI n % 95%CI n % 95% CI
25-34 258 2.7 0.7-4.7 291 3.1 1.1-5.1 549 2.9 1.5-4.335-44 258 5.0 2.4-7.7 288 6.6 3.7-9.5 546 5.7 3.8-7.7
45-54 258 12.0 8.0-16.0 303 9.9 6.5-13.3 561 11.1 8.4-13.7
55-64 203 14.8 9.9-19.7 250 12.8 8.7-16.9 453 13.9 10.6-17.165-74 154 8.4 4.0-12.8 211 10.4 6.3-14.6 365 9.4 6.3-12.4
25-74 1131 6.7 5.3-8.1 1343 6.9 5.5-8.2 2474 6.8 5.8-7.825-64 977 6.6 5.1-8.1 1132 6.6 5.2-8.0 2109 6.6 5.6-7.6
Advised by doctor or health worker to stop smoking
AgeGroup(years)
Men Women Both Sexes
n % 95%CI n % 95%CI n % 95% CI
25-34 258 1.6 0.0-3.1 290 1.0 0.0-2.2 548 1.3 0.3-2.335-44 258 3.9 1.5-6.2 288 4.2 1.9-6.5 546 4.0 2.3-5.7
45-54 257 6.2 3.3-9.2 303 2.3 0.6-4.0 560 4.5 2.7-6.3
55-64 202 6.9 3.4-10.4 248 7.7 4.4-11.0 450 7.3 4.8-9.765-74 154 1.9 0.0-4.1 208 4.8 1.9-7.7 362 3.3 1.5-5.1
25-74 1129 3.6 2.5-4.7 1337 3.1 2.2-4.1 2466 3.4 2.7-4.125-64 975 3.7 2.6-4.9 1129 3.0 2.0-4.0 2104 3.4 2.6-4.2
Advised by doctor or health worker to start or do more exercise
AgeGroup(years)
Men Women Both Sexes
n % 95%CI n % 95%CI n % 95% CI
25-34 256 3.1 1.0-5.3 291 3.4 1.3-5.5 547 3.3 1.8-4.835-44 259 5.4 2.7-8.2 288 5.9 3.2-8.6 547 5.6 3.7-7.6
45-54 258 12.4 8.4-16.4 303 7.9 4.9-11.0 561 10.4 7.8-13.0
55-64 203 11.8 7.4-16.3 249 7.6 4.3-10.9 452 9.9 7.1-12.865-74 154 6.5 2.6-10.4 211 10.4 6.3-14.6 365 8.3 5.5-11.2
25-74 1130 6.6 5.1-8.0 1342 5.9 4.6-7.2 2472 6.3 5.3-7.225-64 976 6.6 5.1-8.1 1131 5.5 4.2-6.9 2107 6.1 5.1-7.1

Bhutan StepS Survey report 2009
- 77 -
Bloodpressureadvicebyatraditionalhealer
Description:Percentageofrespondentswhohavesoughtadviceorreceivedtreatmentfromtraditionalhealersforraisedbloodpressure.
Instrumentquestions:Duringthepast12monthshaveyouseenatraditionalhealerforraisedbloodpressure?Areyoucurrentlytakinganyherbalortraditionalremedyforyourhighbloodpressure?Duringthepast12monthshaveyouseenanIndigenousPhysician(Drungtso/Menpa)forraisedbloodpressureorhypertension?AreyoucurrentlytakinganyIndigenousremedyforyourraisedbloodpressure?
Seen a traditional healer in the last 12 months
AgeGroup(years)
Men Women Both Sexes
n % 95%CI n % 95%CI n % 95% CI
25-34 258 0.8 0.0-1.8 291 0.0 0.0-0.0 549 0.4 0.0-1.035-44 259 1.5 0.0-3.0 287 1.0 0.0-2.2 546 1.3 0.3-2.3
45-54 258 1.2 0.0-2.5 303 0.7 0.0-1.6 561 0.9 0.1-1.8
55-64 203 0.5 0.0-1.5 249 2.0 0.3-3.8 452 1.2 0.2-2.165-74 154 1.3 0.0-3.1 211 4.7 1.9-7.6 365 2.9 1.2-4.5
25-74 1132 1.1 0.4-1.7 1341 1.0 0.5-1.4 2473 1.0 0.6-1.425-64 978 1.0 0.4-1.7 1130 0.7 0.2-1.1 2108 0.9 0.5-1.3
Currently taking herbal or traditional remedy for high blood pressure
AgeGroup(years)
Men Women Both Sexes
n % 95%CI n % 95%CI n % 95% CI
25-34 258 0.0 0.0-0.0 291 0.0 0.0-0.0 549 0.0 0.0-0.035-44 259 1.5 0.0-3.0 288 0.7 0.0-1.7 547 1.2 0.2-2.1
45-54 258 0.8 0.0-1.8 303 0.0 0.0-0.0 561 0.4 0.0-1.0
55-64 203 0.5 0.0-1.5 250 2.0 0.3-3.7 453 1.2 0.2-2.165-74 154 1.3 0.0-3.1 211 0.9 0.0-2.3 365 1.1 0.0-2.3
25-74 1132 0.7 0.2-1.2 1343 0.5 0.1-0.8 2475 0.6 0.3-0.925-64 978 0.6 0.2-1.1 1132 0.5 0.1-0.8 2110 0.6 0.3-0.9
Seen an indigenous physician in the last 12 months
AgeGroup(years)
Men Women Both Sexes
n % 95%CI n % 95%CI n % 95% CI
25-34 258 0.4 0.0-1.1 291 0.0 0.0-0.0 549 0.2 0.0-0.635-44 259 1.5 0.0-3.0 288 0.7 0.0-1.7 547 1.2 0.2-2.1
45-54 258 0.8 0.0-1.8 303 1.0 0.0-2.1 561 0.9 0.1-1.6
55-64 203 1.5 0.0-3.1 250 2.0 0.3-3.7 453 1.7 0.5-2.965-74 154 1.9 0.0-4.1 211 4.7 1.9-7.6 365 3.2 1.5-5.0
25-74 1132 1.0 0.4-1.6 1343 0.9 0.5-1.4 2475 1.0 0.6-1.325-64 978 0.9 0.3-1.5 1132 0.6 0.2-1.5 2110 0.8 0.4-1.2

StepS Survey report 2009 Bhutan
- 78 -
Currently taking indigenous remedy for high blood pressure
AgeGroup(years)
Men Women Both Sexes
n % 95%CI n % 95%CI n % 95% CI
25-34 258 0.4 0.0-1.1 291 0.0 0.0-0.0 549 0.2 0.0-0.635-44 259 1.2 0.0-2.5 288 0.3 0.0-1.0 547 0.8 0.0-1.6
45-54 258 0.4 0.0-1.1 303 0.3 0.0-1.0 561 0.4 0.0-0.9
55-64 203 1.5 0.0-3.1 250 2.4 0.5-4.3 453 1.9 0.6-3.265-74 154 1.9 0.0-4.1 211 2.8 0.6-5.1 365 2.4 0.8-3.9
25-74 1132 0.8 0.3-1.3 1343 0.6 0.3-1.0 2475 0.7 0.4-1.125-64 978 0.7 0.2-1.3 1132 0.5 0.1-0.8 2110 0.6 0.3-1.0
Diabetesdiagnosisandtreatment
Description:Diabetesdiagnosisandtreatmentresultsamongallrespondents.
Instrumentquestions:Duringthepast12months,haveyoueverbeentoldbyadoctororotherhealthworkerthatyouhavediabetes?Areyoucurrentlytakinganyofthefollowingtreatments/advicefordiabetesprescribedbyadoctororotherhealthworker?
Diabetes diagnosed by doctor or health worker in last 12 months
AgeGroup(years)
Men Women Both Sexes
n%diagnosed
95%CI n%diagnosed
95%CI n% diagnosed
95% CI
25-34 259 0.4 0.0-1.1 292 0.7 0.0-1.6 551 0.5 0.0-1.135-44 257 1.6 0.0-3.1 288 1.4 0.0-2.7 545 1.5 0.4-2.5
45-54 259 5.0 2.4-7.7 303 3.3 1.3-5.3 562 4.3 2.5-6.0
55-64 203 5.9 2.7-9.2 248 4.4 1.9-7.0 451 5.2 3.1-7.465-74 154 9.7 5.1-14.4 211 5.2 2.2-8.2 365 7.6 4.8-10.5
25-74 1132 2.8 1.9-3.6 1342 2.1 1.4-2.8 2474 2.5 1.9-3.025-64 978 2.3 1.4-3.1 1131 1.9 1.1-2.6 2109 2.1 1.5-2.7
Currently taking insulin prescribed for diabetes by doctor or health worker
AgeGroup(years)
Men Women Both Sexes
n%takinginsulin
95%CI n%takinginsulin
95%CI n% taking insulin
95% CI
25-34 258 0.0 0.0-0.0 292 0.3 0.0-1.0 550 0.2 0.0-0.435-44 258 0.0 0.0-0.0 288 0.0 0.0-0.0 546 0.0 0.0-0.0
45-54 258 0.8 0.0-1.8 303 1.0 0.0-2.1 561 0.9 0.1-1.6
55-64 204 1.0 0.0-2.3 249 2.0 0.3-3.8 453 1.4 0.4-2.565-74 154 1.3 0.0-3.1 210 0.5 0.0-1.4 364 0.9 0.0-2.0
25-74 1132 0.3 0.1-0.6 1342 0.6 0.2-1.0 2474 0.4 0.2-0.725-64 978 0.3 0.0-1.5 1132 0.6 0.2-1.0 2110 0.4 0.2-0.6

Bhutan StepS Survey report 2009
- 79 -
Currently taking oral drugs prescribed for diabetes by doctor or health worker
AgeGroup(years)
Men Women Both Sexes
n%takingmeds
95%CI n%takingmeds
95%CI n% taking meds
95% CI
25-34 258 0.8 0.0-1.8 292 0.3 0.0-1.0 550 0.6 0.0-1.335-44 258 0.8 0.0-1.8 288 1.0 0.0-2.2 546 0.9 0.1-1.7
45-54 258 5.0 2.4-7.7 303 1.7 0.2-3.1 561 3.5 1.9-5.1
55-64 204 4.4 1.6-7.2 249 4.0 1.6-6.5 453 4.2 2.3-6.165-74 154 6.5 2.6-10.4 210 3.8 1.2-6.4 364 5.3 2.8-7.7
25-74 1132 2.3 1.5-3.1 1342 1.4 0.9-2.0 2474 1.9 1.4-2.425-64 978 2.0 1.2-2.8 1132 1.3 0.7-1.9 2110 1.7 1.2-2.2
Diabeteslifestyleadvice
Description:Percentageofrespondentswhoreceivedlifestyleadvicefromadoctororhealthworkertodiabetes.
Instrumentquestion:Areyoucurrentlytakinganyofthefollowingtreatments/advicefordiabetesprescribedbyadoctororotherhealthworker?
Advised by doctor or health worker to have special prescribed diet
AgeGroup(years)
Men Women Both Sexes
n % 95%CI n % 95%CI n % 95% CI
25-34 258 0.8 0.0-1.8 293 0.7 0.0-1.6 551 0.7 0.0-1.535-44 258 0.8 0.0-1.8 288 1.0 0.0-2.2 546 0.9 0.1-1.7
45-54 258 4.7 2.1-7.2 303 2.3 0.6-4.0 561 3.6 2.0-5.2
55-64 203 4.9 1.9-7.9 249 4.0 1.6-6.5 452 4.5 2.5-6.565-74 154 7.8 3.6-12.0 210 3.3 0.9-5.8 364 5.7 3.2-8.3
25-74 1131 2.4 1.6-3.2 1343 1.7 1.0-2.3 2474 2.1 1.5-2.625-64 977 2.0 1.2-2.8 1133 1.5 0.8-2.2 2110 1.8 1.3-2.3
Advised by doctor or health worker to lose weight
AgeGroup(years)
Men Women Both Sexes
n % 95%CI n % 95%CI n % 95% CI
25-34 258 0.8 0.0-1.8 293 1.0 0.0-2.2 551 0.9 0.1-1.735-44 258 0.8 0.0-1.8 288 0.7 0.0-1.7 546 0.7 0.0-1.5
45-54 258 3.5 1.2-5.7 303 1.7 0.2-3.1 561 2.7 1.3-4.1
55-64 203 3.9 1.3-6.6 249 2.4 0.5-4.3 452 3.2 1.5-4.965-74 154 4.5 1.3-7.8 210 2.9 0.6-5.1 364 3.8 1.7-5.8
25-74 1131 1.9 1.1-2.6 1343 1.3 0.7-2.0 2474 1.6 1.1-2.125-64 977 1.7 0.9-2.4 1133 1.2 0.6-1.9 2110 1.5 1.0-2.0
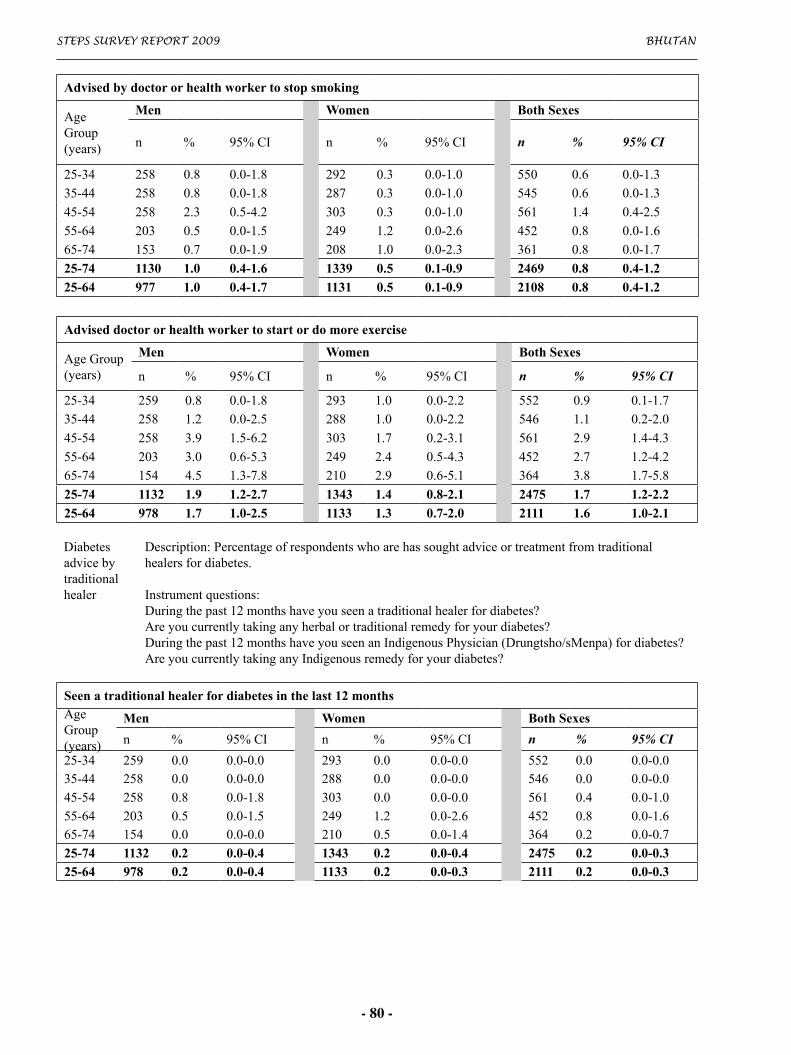
StepS Survey report 2009 Bhutan
- 80 -
Advised by doctor or health worker to stop smoking
AgeGroup(years)
Men Women Both Sexes
n % 95%CI n % 95%CI n % 95% CI
25-34 258 0.8 0.0-1.8 292 0.3 0.0-1.0 550 0.6 0.0-1.335-44 258 0.8 0.0-1.8 287 0.3 0.0-1.0 545 0.6 0.0-1.3
45-54 258 2.3 0.5-4.2 303 0.3 0.0-1.0 561 1.4 0.4-2.5
55-64 203 0.5 0.0-1.5 249 1.2 0.0-2.6 452 0.8 0.0-1.665-74 153 0.7 0.0-1.9 208 1.0 0.0-2.3 361 0.8 0.0-1.7
25-74 1130 1.0 0.4-1.6 1339 0.5 0.1-0.9 2469 0.8 0.4-1.225-64 977 1.0 0.4-1.7 1131 0.5 0.1-0.9 2108 0.8 0.4-1.2
Advised doctor or health worker to start or do more exercise
AgeGroup(years)
Men Women Both Sexes
n % 95%CI n % 95%CI n % 95% CI
25-34 259 0.8 0.0-1.8 293 1.0 0.0-2.2 552 0.9 0.1-1.735-44 258 1.2 0.0-2.5 288 1.0 0.0-2.2 546 1.1 0.2-2.0
45-54 258 3.9 1.5-6.2 303 1.7 0.2-3.1 561 2.9 1.4-4.3
55-64 203 3.0 0.6-5.3 249 2.4 0.5-4.3 452 2.7 1.2-4.265-74 154 4.5 1.3-7.8 210 2.9 0.6-5.1 364 3.8 1.7-5.8
25-74 1132 1.9 1.2-2.7 1343 1.4 0.8-2.1 2475 1.7 1.2-2.225-64 978 1.7 1.0-2.5 1133 1.3 0.7-2.0 2111 1.6 1.0-2.1
Diabetesadvicebytraditionalhealer
Description:Percentageofrespondentswhoarehassoughtadviceortreatmentfromtraditionalhealersfordiabetes.
Instrumentquestions:Duringthepast12monthshaveyouseenatraditionalhealerfordiabetes?Areyoucurrentlytakinganyherbalortraditionalremedyforyourdiabetes?Duringthepast12monthshaveyouseenanIndigenousPhysician(Drungtsho/sMenpa)fordiabetes?AreyoucurrentlytakinganyIndigenousremedyforyourdiabetes?
Seen a traditional healer for diabetes in the last 12 monthsAgeGroup(years)
Men Women Both Sexes
n % 95%CI n % 95%CI n % 95% CI
25-34 259 0.0 0.0-0.0 293 0.0 0.0-0.0 552 0.0 0.0-0.035-44 258 0.0 0.0-0.0 288 0.0 0.0-0.0 546 0.0 0.0-0.045-54 258 0.8 0.0-1.8 303 0.0 0.0-0.0 561 0.4 0.0-1.055-64 203 0.5 0.0-1.5 249 1.2 0.0-2.6 452 0.8 0.0-1.665-74 154 0.0 0.0-0.0 210 0.5 0.0-1.4 364 0.2 0.0-0.725-74 1132 0.2 0.0-0.4 1343 0.2 0.0-0.4 2475 0.2 0.0-0.325-64 978 0.2 0.0-0.4 1133 0.2 0.0-0.3 2111 0.2 0.0-0.3

Bhutan StepS Survey report 2009
- 81 -
Currently taking herbal or traditional treatment for diabetes
AgeGroup(years)
Men Women Both Sexes
n % 95%CI n % 95%CI n % 95% CI
25-34 259 0.0 0.0-0.0 293 0.0 0.0-0.0 552 0.0 0.0-0.035-44 258 0.0 0.0-0.0 288 0.0 0.0-0.0 546 0.0 0.0-0.0
45-54 258 0.8 0.0-1.8 303 0.0 0.0-0.0 561 0.4 0.0-1.0
55-64 203 0.0 0.0-0.0 249 0.8 0.0-1.9 452 0.4 0.0-0.965-74 154 0.6 0.0-1.9 210 0.5 0.0-1.4 364 0.6 0.0-1.4
25-74 1132 0.2 0.0-0.4 1343 0.1 0.0-0.3 2475 0.2 0.0-0.325-64 978 0.1 0.0-0.3 1133 0.1 0.0-0.3 2111 0.1 0.0-0.3
Seen an indigenous physician for diabetes in the last 12 months
AgeGroup(years)
Men Women Both Sexes
n % 95%CI n % 95%CI n % 95% CI
25-34 259 0.0 0.0-0.0 293 0.0 0.0-0.0 552 0.0 0.0-0.035-44 258 0.0 0.0-0.0 288 0.0 0.0-0.0 546 0.0 0.0-0.045-54 258 1.2 0.0-2.5 303 0.0 0.0-0.0 561 0.6 0.0-1.455-64 203 0.0 0.0-0.0 249 1.2 0.0-2.6 452 0.5 0.0-1.265-74 154 1.3 0.0-3.1 210 0.5 0.0-1.4 364 0.9 0.0-2.025-74 1132 0.3 0.0-0.5 1343 0.2 0.0-0.4 2475 0.2 0.1-0.425-64 978 0.2 0.0-0.5 1133 0.2 0.0-0.3 2111 0.2 0.0-0.3
Currently taking indigenous remedy for diabetes
AgeGroup(years)
Men Women Both Sexes
n % 95%CI n % 95%CI n % 95% CI
25-34 259 0.0 0.0-0.0 293 0.0 0.0-0.0 552 0.0 0.0-0.035-44 258 0.0 0.0-0.0 288 0.0 0.0-0.0 546 0.0 0.0-0.0
45-54 258 0.8 0.0-1.8 303 0.0 0.0-0.0 561 0.4 0.0-1.0
55-64 203 0.0 0.0-0.0 249 1.2 0.0-2.6 452 0.5 0.0-1.265-74 154 1.3 0.0-3.1 210 0.5 0.0-1.4 364 0.9 0.0-2.0
25-74 1132 0.2 0.0-0.4 1343 0.2 0.0-0.4 2475 0.2 0.1-0.325-64 978 0.1 0.0-0.4 1133 0.2 0.0-0.3 2111 0.2 0.0-0.3

StepS Survey report 2009 Bhutan
- 82 -
PhysicalMeasurements
Height,weightandBMI
Description:Meanheight,weight,andbodymassindexamongallrespondent(excludingpregnantwomenforweightandBMI).
Instrumentquestions:HeightWeight
Mean height (cm)
AgeGroup(years)
Men Womenn Mean 95%CI n Mean 95%CI
25-34 255 163.8 163.0-164.6 291 154.6 153.8-155.535-44 260 164.2 163.4-165.0 287 154.5 153.7-155.245-54 255 162.9 162.1-163.7 302 153.2 152.5-153.955-64 206 162.3 161.3-163.3 247 152.5 151.7-153.365-74 153 162.5 161.3-163.7 211 150.8 149.9-151.825-74 1129 163.5 163.1-163.9 1338 153.8 153.4-154.225-64 976 163.6 163.1-164.0 1127 154.0 153.6-154.5
Mean weight (kg)
AgeGroup(years)
Men Womenn Mean 95%CI n Mean 95%CI
25-34 256 65.4 64.2-66.5 281 59.8 58.5-61.035-44 259 70.4 68.2-72.5 285 63.3 61.9-64.845-54 255 70.7 69.4-72.0 301 63.2 61.9-64.455-64 205 67.9 66.1-69.7 243 60.6 59.0-62.165-74 153 65.6 63.6-67.6 210 55.8 54.4-57.225-74 1128 67.9 67.1-68.7 1320 61.1 60.4-61.825-64 975 68.1 67.2-68.9 1110 61.5 60.8-62.2
Mean BMI (kg/m2)
AgeGroup(years)
Men Women Both Sexes
n Mean 95%CI n Mean 95%CI n Mean 95% CI
25-34 254 24.3 23.9-24.7 280 25.0 24.5-25.5 534 24.6 24.3-24.935-44 256 25.6 25.2-26.1 282 26.4 26.0-26.9 538 26.0 25.7-26.3
45-54 255 26.6 26.2-27.0 299 26.9 26.4-27.4 554 26.7 26.4-27.1
55-64 203 25.8 25.2-26.4 242 26.0 25.4-26.6 445 25.9 25.5-26.365-74 152 24.9 24.2-25.5 208 24.6 24.1-25.1 360 24.7 24.3-25.1
25-74 1120 25.3 25.1-25.5 1311 25.8 25.6-26.1 2431 25.5 25.3-25.725-64 968 25.3 25.1-25.6 1103 25.9 25.6-26.2 2071 25.6 25.4-25.8
BMIcategories
Description:Percentageofrespondents(excludingpregnantwomen)ineachBMIcategory.
Instrumentquestions:HeightWeight

Bhutan StepS Survey report 2009
- 83 -
BMI classifications
AgeGroup(years)
Men
n%BMI<18.5
95%CI%BMI18.5-24.9
95%CI%BMI25.0-29.9
95%CI%BMI≥30.0
95%CI
25-34 254 1.6 0.0-3.1 58.3 52.2-64.3 36.2 30.3-42.1 3.9 1.5-6.335-44 256 0.8 0.0-1.9 44.5 38.4-50.6 44.1 38.1-50.2 10.5 6.8-14.3
45-54 255 0.4 0.0-1.2 31.4 25.7-37.1 52.2 46.0-58.3 16.1 11.6-20.6
55-64 203 4.4 1.6-7.3 36.9 30.3-43.6 43.4 36.5-50.2 15.3 10.3-20.265-74 152 5.3 1.7-8.8 46.1 38.1-54.0 38.2 30.4-45.9 10.5 5.6-15.4
25-74 1120 1.7 1.0-2.5 46.7 43.5-49.9 42.0 38.9-45.2 9.5 7.8-11.325-64 968 1.5 0.7-2.3 46.7 43.3-50.1 42.3 39.0-45.6 9.5 7.8-11.3
BMI classifications
AgeGroup(years)
Women
n%BMI<18.5
95%CI%BMI18.5-24.9
95%CI%BMI25.0-29.9
95%CI%BMI≥30.0
95%CI
25-34 280 3.6 1.4-5.7 48.9 43.1-54.8 38.2 32.5-43.9 9.3 5.9-12.735-44 282 0.4 0.0-1.0 41.5 35.7-47.2 39.7 34.0-45.4 18.4 13.9-23.0
45-54 299 0.7 0.0-1.6 37.5 32.0-42.9 37.8 32.3-43.3 24.1 19.2-28.9
55-64 242 5.0 2.2-7.7 38.8 32.7-45.0 38.8 32.7-45.0 17.4 12.6-22.165-74 208 2.9 0.6-5.2 54.3 47.6-61.1 33.2 26.8-39.6 9.6 5.6-13.6
25-74 1311 2.3 1.4-3.3 44.2 41.2-47.1 38.2 35.3-41.1 15.3 13.2-17.325-64 1103 2.3 1.3-3.3 43.3 40.2-46.5 38.6 35.6-41.7 15.7 13.5-17.9
BMI classifications
AgeGroup(years)
Both Sexes
n%BMI<18.5
95%CI%BMI18.5-24.9
95%CI%BMI25.0-29.9
95%CI%BMI≥30.0
95%CI
25-34 534 2.4 1.2-3.7 54.2 49.9-58.5 37.1 32.9-41.2 6.3 4.2-8.335-44 538 0.6 0.0-1.3 43.2 39.0-47.5 42.2 38.0-46.5 14.0 11.1-16.9
45-54 554 0.5 0.0-1.1 34.1 30.1-38.1 45.8 41.5-50.0 19.6 16.3-23.0
55-64 445 4.7 2.7-6.7 37.8 33.2-42.4 41.3 36.7-46.0 16.2 12.7-19.765-74 360 4.2 2.0-6.3 49.9 44.6-55.2 35.9 30.7-41.0 10.1 6.9-13.3
25-74 2431 2.0 1.4-2.6 45.6 43.4-47.8 40.4 38.2-42.5 12.1 10.7-13.425-64 2071 1.8 1.2-2.5 45.2 42.9-47.6 40.7 38.4-43.0 12.2 10.8-13.6
Waistcircumference
Description:Meanwaistcircumferenceamongallrespondents(excludingpregnantwomen).
Instrumentquestion:Waistcircumferencemeasurement

StepS Survey report 2009 Bhutan
- 84 -
Waist circumference (cm)
AgeGroup(years)
Men Women
n Mean 95%CI n Mean 95%CI
25-34 256 80.4 79.3-81.4 280 79.0 77.8-80.335-44 258 84.3 83.2-85.4 283 82.3 81.1-83.6
45-54 255 87.4 86.3-88.6 302 85.3 84.0-86.5
55-64 206 86.7 85.2-88.2 244 84.8 83.3-86.365-74 149 85.2 83.4-87.0 206 84.5 83.0-85.9
25-74 1124 83.7 83.1-84.3 1315 82.1 81.4-82.725-64 975 83.6 82.9-84.2 1109 81.9 81.2-82.6
Hipcircumference
Description:Meanhipcircumferenceamongallrespondents(excludingpregnantwomen).
Instrumentquestion:Hipcircumferencemeasurement
Hip circumference (cm)
AgeGroup(years)
Men Women
n Mean 95%CI n Mean 95%CI
25-34 255 91.3 90.3-92.2 280 92.4 91.3-93.435-44 260 94.0 93.0-95.0 285 95.7 94.5-96.9
45-54 255 94.8 93.7-95.8 303 97.5 96.3-98.6
55-64 206 93.6 92.5-94.8 245 95.2 93.5-96.865-74 154 92.5 90.9-94.0 210 93.6 92.1-95.2
25-74 1130 92.9 92.4-93.4 1323 94.6 94.0-95.225-64 976 93.0 92.4-93.5 1113 94.7 94.0-95.3
Waist/hipratio
Description:Meanwaist-to-hipratioamongallrespondents(excludingpregnantwomen).
Instrumentquestion:Waistandhipcircumferencemeasurement
Mean waist / hip ratio
AgeGroup(years)
Men Women
n Mean 95%CI n Mean 95%CI
25-34 254 0.9 0.9-0.9 279 0.9 0.8-0.935-44 258 0.9 0.9-0.9 283 0.9 0.9-0.9
45-54 255 0.9 0.9-0.9 302 0.9 0.9-0.9
55-64 206 0.9 0.9-0.9 244 0.9 0.9-0.965-74 149 0.9 0.9-0.9 206 0.9 0.9-0.9
25-74 1122 0.9 0.9-0.9 1314 0.9 0.9-0.925-64 973 0.9 0.9-0.9 1108 0.9 0.9-0.9

Bhutan StepS Survey report 2009
- 85 -
Bloodpressure Description:Meanbloodpressureamongallrespondents,excludingthosecurrentlyonmedicationforraisedbloodpressure.
Instrumentquestion:Duringthepasttwoweeks,haveyoubeentreatedforraisedbloodpressurewithdrugs(medication)prescribedbyadoctororotherhealthworker?Reading1-3systolicanddiastolicbloodpressure
Mean systolic blood pressure (mmHg)
AgeGroup(years)
Men Women Both Sexes
n Mean 95%CI n Mean 95%CI n Mean 95% CI
25-34 252 122.0 120.3-123.6 289 116.0 114.6-117.5 541 119.3 118.2-120.535-44 249 124.3 122.4-126.1 272 118.6 116.7-120.4 521 121.8 120.5-123.1
45-54 234 133.1 130.5-135.7 277 126.1 123.9-128.4 511 130.0 128.2-131.8
55-64 193 134.4 131.3-137.4 217 129.9 127.2-132.5 410 132.4 130.3-134.565-74 139 140.0 135.6-144.5 181 143.0 138.9-147.0 320 141.4 138.3-144.4
25-74 1067 127.0 125.9-128.1 1236 121.7 120.7-122.7 2303 124.7 123.9-125.425-64 928 126.1 125.6-127.2 1055 120.2 119.2-121.2 1983 123.5 122.8-124.3
Mean diastolic blood pressure (mmHg)
AgeGroup(years)
Men Women Both Sexes
n Mean 95%CI n Mean 95%CI n Mean 95% CI
25-34 252 76.9 75.5-78.3 289 76.7 75.5-77.8 541 76.8 75.9-77.7
35-44 249 79.8 78.5-81.1 272 78.5 77.2-79.8 521 79.2 78.3-80.1
45-54 234 85.5 83.8-87.1 277 81.2 80.0-82.4 511 83.6 82.5-84.7
55-64 193 83.1 81.2-84.9 217 80.8 79.3-82.3 410 82.1 80.9-83.3
65-74 139 82.0 79.9-84.2 181 82.7 80.7-84.6 320 82.3 80.9-83.8
25-74 1067 80.1 79.3-80.9 1236 78.8 78.1-79.4 2303 79.5 79.0-80.0
25-64 928 80.0 79.2-80.8 1055 78.5 77.8-79.2 1983 79.3 78.8-79.9
Raisedbloodpressure
Description:Percentageofrespondentswithraisedbloodpressureandpercentageonmedicationforraisedbloodpressure.
Instrumentquestion:Duringthepasttwoweeks,haveyoubeentreatedforraisedbloodpressurewithdrugs(medication)prescribedbyadoctororotherhealthworker?Reading1-3systolicanddiastolicbloodpressure
SBP ≥140 and/or DBP ≥ 90 mmHg
AgeGroup(years)
Men Women Both Sexes
n % 95%CI n % 95%CI n % 95% CI
25-34 252 14.7 10.3-19.1 289 8.0 4.8-11.1 541 11.7 8.9-14.535-44 249 18.1 13.3-22.9 272 14.0 9.8-18.1 521 16.3 13.0-19.6
45-54 234 40.6 34.3-46.9 277 27.4 22.2-32.7 511 34.7 30.5-38.9
55-64 193 38.9 32.0-45.7 217 32.7 26.5-39.0 410 36.2 31.4-40.9

StepS Survey report 2009 Bhutan
- 86 -
65-74 139 49.6 41.3-58.0 181 53.0 45.8-60.3 320 51.2 45.5-56.825-74 1067 24.8 22.2-27.5 1236 18.6 16.4-20.7 2303 22.1 20.3-23.825-64 928 23.2 20.4-25.9 1055 16.1 13.9-18.3 1983 20.1 18.2-21.9
SBP ≥140 and/or DBP ≥ 90 mmHg or currently on medication for raised blood pressure
AgeGroup(years)
Men Women Both Sexes
n % 95%CI n % 95%CI n % 95% CI
25-34 257 16.3 11.8-20.9 291 8.6 5.4-11.8 548 12.9 10.0-15.935-44 259 21.2 16.3-26.2 287 18.5 14.0-23.0 546 20.0 16.6-23.5
45-54 255 45.5 39.4-51.6 304 33.9 28.6-39.2 559 40.3 36.1-44.4
55-64 206 42.7 36.0-49.5 248 41.1 35.0-47.3 454 42.0 37.4-46.665-74 154 54.5 46.7-62.4 210 59.5 52.9-66.2 364 56.8 51.6-62.1
25-74 1131 28.3 25.6-31.0 1340 23.2 20.9-25.4 2471 26.0 24.2-27.825-64 977 26.4 23.6-29.2 1130 20.3 18.0-22.7 2107 23.7 21.8-25.6
Currently on medication for raised blood pressure
AgeGroup(years)
Men Women Both Sexes
n % 95%CI n % 95%CI n % 95% CI
25-34 257 1.9 0.3-3.6 291 0.7 0.0-1.6 548 1.4 0.4-2.435-44 259 3.9 1.5-6.2 287 5.2 2.7-7.8 546 4.5 2.7-6.2
45-54 255 8.2 4.9-11.6 304 8.9 5.7-12.1 559 8.5 6.2-10.9
55-64 206 6.3 3.0-9.6 248 12.5 8.4-16.6 454 9.1 6.5-11.765-74 154 9.7 5.1-14.4 210 13.8 9.1-18.5 364 11.6 8.3-14.9
25-74 1131 4.6 3.4-5.8 1340 5.7 4.5-6.8 2471 5.1 4.2-5.925-64 977 4.2 3.0-5.4 1130 95.0 93.8-96.2 2107 4.6 3.7-5.4
Raisedbloodpressure
Description:Percentageofrespondentswithraisedbloodpressureandpercentageonmedicationforraisedbloodpressure.
Instrumentquestion:Duringthepasttwoweeks,haveyoubeentreatedforraisedbloodpressurewithdrugs(medication)prescribedbyadoctororotherhealthworker?Reading1-3systolicanddiastolicbloodpressure
SBP ≥160 and/or DBP ≥ 100 mmHg
AgeGroup(years)
Men Women Both Sexes
n % 95%CI n % 95%CI n % 95% CI
25-34 252 4.4 1.8-6.9 289 1.7 0.2-3.2 541 3.2 1.6-4.835-44 249 2.8 0.8-4.9 272 4.0 1.7-6.4 521 3.3 1.8-4.9
45-54 234 14.1 9.6-18.6 277 6.9 3.9-9.8 511 10.9 8.0-13.7
55-64 193 15.0 10.0-20.1 217 9.2 5.4-13.1 410 12.5 9.2-15.865-74 139 23.0 16.0-30.0 181 26.0 19.6-32.4 320 24.3 19.5-29.2
25-74 1067 8.0 6.4-9.5 1236 5.6 4.5-6.8 2303 6.9 5.9-8.025-64 928 6.9 5.3-8.5 1055 4.2 3.0-5.4 1983 5.7 4.7-6.8
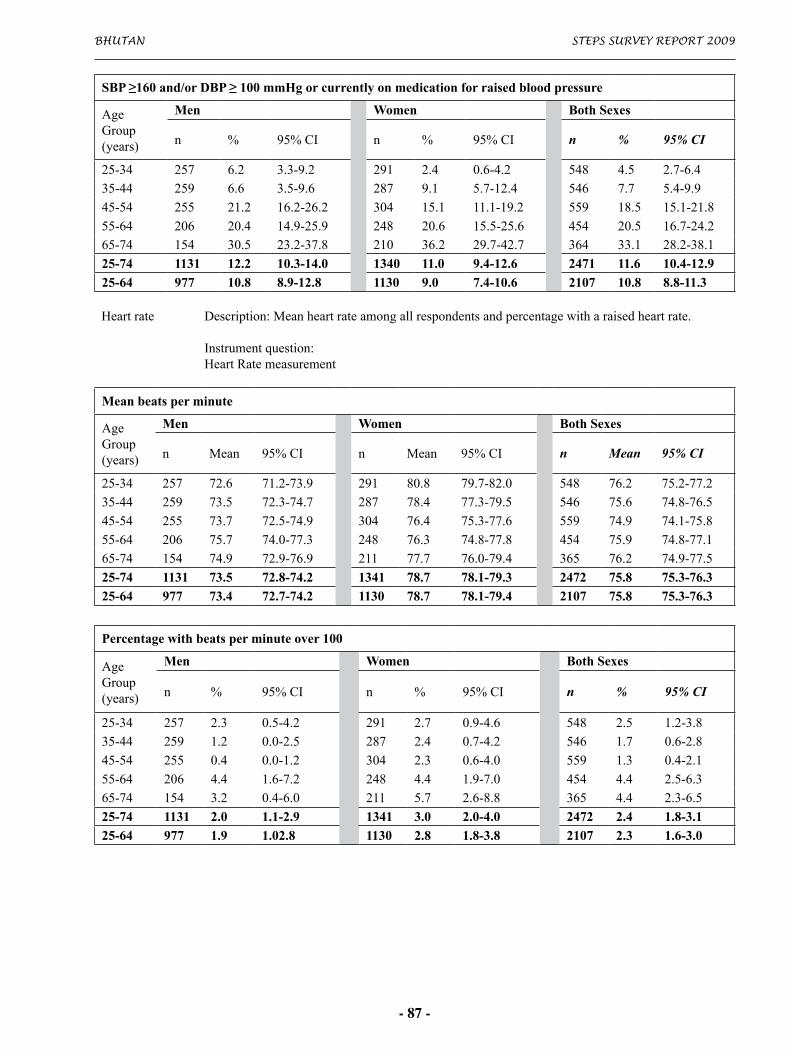
Bhutan StepS Survey report 2009
- 87 -
SBP ≥160 and/or DBP ≥ 100 mmHg or currently on medication for raised blood pressure
AgeGroup(years)
Men Women Both Sexes
n % 95%CI n % 95%CI n % 95% CI
25-34 257 6.2 3.3-9.2 291 2.4 0.6-4.2 548 4.5 2.7-6.435-44 259 6.6 3.5-9.6 287 9.1 5.7-12.4 546 7.7 5.4-9.9
45-54 255 21.2 16.2-26.2 304 15.1 11.1-19.2 559 18.5 15.1-21.8
55-64 206 20.4 14.9-25.9 248 20.6 15.5-25.6 454 20.5 16.7-24.265-74 154 30.5 23.2-37.8 210 36.2 29.7-42.7 364 33.1 28.2-38.1
25-74 1131 12.2 10.3-14.0 1340 11.0 9.4-12.6 2471 11.6 10.4-12.925-64 977 10.8 8.9-12.8 1130 9.0 7.4-10.6 2107 10.8 8.8-11.3
Heartrate Description:Meanheartrateamongallrespondentsandpercentagewitharaisedheartrate.
Instrumentquestion:HeartRatemeasurement
Mean beats per minute
AgeGroup(years)
Men Women Both Sexes
n Mean 95%CI n Mean 95%CI n Mean 95% CI
25-34 257 72.6 71.2-73.9 291 80.8 79.7-82.0 548 76.2 75.2-77.235-44 259 73.5 72.3-74.7 287 78.4 77.3-79.5 546 75.6 74.8-76.5
45-54 255 73.7 72.5-74.9 304 76.4 75.3-77.6 559 74.9 74.1-75.8
55-64 206 75.7 74.0-77.3 248 76.3 74.8-77.8 454 75.9 74.8-77.165-74 154 74.9 72.9-76.9 211 77.7 76.0-79.4 365 76.2 74.9-77.5
25-74 1131 73.5 72.8-74.2 1341 78.7 78.1-79.3 2472 75.8 75.3-76.325-64 977 73.4 72.7-74.2 1130 78.7 78.1-79.4 2107 75.8 75.3-76.3
Percentage with beats per minute over 100
AgeGroup(years)
Men Women Both Sexes
n % 95%CI n % 95%CI n % 95% CI
25-34 257 2.3 0.5-4.2 291 2.7 0.9-4.6 548 2.5 1.2-3.835-44 259 1.2 0.0-2.5 287 2.4 0.7-4.2 546 1.7 0.6-2.8
45-54 255 0.4 0.0-1.2 304 2.3 0.6-4.0 559 1.3 0.4-2.1
55-64 206 4.4 1.6-7.2 248 4.4 1.9-7.0 454 4.4 2.5-6.365-74 154 3.2 0.4-6.0 211 5.7 2.6-8.8 365 4.4 2.3-6.5
25-74 1131 2.0 1.1-2.9 1341 3.0 2.0-4.0 2472 2.4 1.8-3.125-64 977 1.9 1.02.8 1130 2.8 1.8-3.8 2107 2.3 1.6-3.0

StepS Survey report 2009 Bhutan
- 88 -
BiochemicalMeasurements
Meanfastingbloodglucose
Description:meanfastingbloodglucoseresultsexcludingthosecurrentlyonmedicationfordiabetes(non-fastingrecipientsexcludedforfastingbloodglucosemeasurement).Instrumentquestions:Areyoucurrentlyreceivinganyofthefollowingtreatmentsfordiabetesprescribedbyadoctororotherhealthworker?Insulin?Oraldrugs(medication)thatyouhavetakeninthelast2weeks?Duringthelast12hourshaveyouhadanythingtoeatordrink,otherthanwater?Bloodglucosemeasurement
Mean fasting blood glucose (mmol/L)
AgeGroup(years)
Men Women Both Sexes
n Mean 95%CI n Mean 95%CI n Mean 95% CI
25-34 178 5.7 5.5-5.9 188 5.8 5.6-6.0 366 5.7 5.6-5.935-44 189 5.9 5.7-6.2 184 5.9 5.8-5.9 373 5.9 5.7-6.1
45-54 170 6.1 5.9-6.3 205 6.2 5.9-6.5 375 6.1 6.0-6.3
55-64 139 6.1 5.9-6.3 181 6.1 5.9-6.2 320 6.1 5.9-6.265-74 106 6.1 5.9-6.4 139 6.3 5.9-6.7 245 6.2 6.0-6.4
25-74 782 5.9 5.8-6.0 897 6.0 5.9-6.1 1679 5.9 5.8-6.025-64 676 5.9 5.8-6.0 758 5.9 5.8-6.0 1434 5.9 5.8-6.0
Mean fasting blood glucose (mg/dl)
AgeGroup(years)
Men Women Both Sexes
n Mean 95%CI n Mean 95%CI n Mean 95% CI
25-34 178 102.8 99.4-106.2 188 104.2 100.7-107.8 366 103.4 100.9-105.935-44 189 106.8 101.8-111.8 184 105.5 104.0-107.0 373 106.3 103.2-109.3
45-54 170 109.4 106.1-112.7 205 111.7 106.4-116.9 375 110.4 107.5-113.4
55-64 139 109.7 105.7-113.8 181 109.1 106.6-111.5 320 109.4 107.0-111.865-74 106 110.5 106.7-114.4 139 113.3 106.3-120.3 245 111.8 108.0-115.6
25-74 782 106.3 104.3-108.4 897 107.2 105.4-109.0 1679 106.7 105.3-108.125-64 676 106.0 103.8-108.2 758 106.7 104.9-108.5 1434 106.3 104.8-107.8
Mean post-glucose load glucose (mmol/L)
AgeGroup(years)
Men Women Both Sexes
n Mean 95%CI n Mean 95%CI n Mean 95% CI
25-34 249 4.8 4.6-5.0 286 5.4 5.1-5.8 535 5.1 4.9-5.335-44 256 5.3 4.9-5.7 283 5.6 5.4-5.8 539 5.4 5.2-5.7
45-54 242 5.6 5.2-6.0 295 5.9 5.6-6.2 537 5.8 5.5-6.0
55-64 196 5.8 5.4-6.2 238 5.9 5.6-6.3 434 5.8 5.6-6.165-74 144 6.1 5.7-6.5 202 6.4 5.9-6.9 346 6.2 5.9-6.5
25-74 1087 5.3 5.1-5.4 1304 5.7 5.5-5.8 2391 5.5 5.3-5.625-64 943 5.2 5.0-5.4 1102 5.6 5.5-5.8 2045 5.4 5.3-5.5

Bhutan StepS Survey report 2009
- 89 -
Mean post-glucose load glucose (mg/dl)
AgeGroup(years)
Men Women Both Sexes
n Mean 95%CI n Mean 95%CI n Mean 95% CI
25-34 249 86.4 82.1-90.7 286 98.1 92.5-103.7 535 91.6 88.1-95.135-44 256 96.0 88.6-103.4 283 100.8 97.2-104.4 539 98.1 93.6-102.6
45-54 242 101.1 94.3-107.9 295 106.7 101.6-111.8 537 103.7 99.3-108.0
55-64 196 103.8 96.5-111.0 238 106.7 100.0-113.5 434 105.1 100.1-110.165-74 144 109.4 101.9-116.8 202 115.1 106.7-123.4 346 112.0 106.4-117.6
25-74 1087 95.0 91.9-98.0 1304 102.5 99.9-105.2 2391 98.3 96.3-100.425-64 943 94.0 90.8-97.2 1102 101.6 98.8-104.4 2045 97.3 95.2-99.5
Raisedbloodglucose
Description:Categorizationofrespondentsintobloodglucoselevelcategoriesandpercentagecurrentlyonmedicationforraisedbloodglucose(non-fastingrecipientsexcludedforfastingbloodglucosemeasures).
Instrumentquestions:Areyoucurrentlyreceivinganyofthefollowingtreatmentsfordiabetesprescribedbyadoctororotherhealthworker?Insulin?Oraldrugs(medication)thatyouhavetakeninthelast2weeks?Duringthelast12hourshaveyouhadanythingtoeatordrink,otherthanwater?Bloodglucosemeasurement(fastingandpost-glucoseload)
Raised blood glucose or currently on medication for diabetes and/or diagnosed with diabetes*
AgeGroup(years)
Men Women Both Sexes
n % 95%CI n % 95%CI n % 95% CI
25-34 252 2.8 0.7-4.8 289 4.5 2.1-6.9 541 3.5 2.0-5.135-44 259 8.1 4.8-11.4 287 4.5 2.1-6.9 546 6.5 4.4-8.7
45-54 255 13.3 9.2-17.5 304 12.5 8.8-16.2 559 13.0 10.1-15.8
55-64 206 15.0 10.2-19.9 248 13.3 9.1-17.5 454 14.3 11.0-17.665-74 154 20.1 13.8-26.5 210 13.8 9.1-18.5 364 17.2 13.2-21.3
25-74 1126 8.6 7.1-10.2 1338 7.7 6.2-9.1 2464 8.2 7.1-9.325-64 972 7.8 6.2-9.4 1128 7.2 5.7-8.7 2100 7.5 6.4-8.6
Impaired Glucose Tolerance**
AgeGroup(years)
Men Women Both Sexesn % 95%CI n % 95%CI n % 95% CI
25-34 252 2.4 0.5-4.3 289 2.4 0.6-4.2 541 2.4 1.1-3.735-44 259 1.9 0.3-3.6 287 7.0 4.0-9.9 546 4.1 2.5-5.7
45-54 255 3.9 1.5-6.3 304 4.3 2.0-6.6 559 4.1 2.4-5.7
55-64 206 5.3 2.3-8.4 248 6.5 3.4-9.5 454 5.8 3.7-8.065-74 154 9.1 4.5-13.6 210 8.6 4.8-12.4 364 8.9 5.8-11.9
25-74 1126 3.3 2.3-4.4 1338 4.9 3.7-6.0 2464 4.0 3.2-4.825-64 972 2.9 1.8-4.0 1128 4.6 3.3-5.8 2100 3.6 2.8-4.5

StepS Survey report 2009 Bhutan
- 90 -
Impaired Fasting Glycaemia***
AgeGroup(years)
Men Women Both Sexes
n % 95%CI n % 95%CI n % 95% CI
25-34 252 13.9 9.6-18.2 289 19.0 14.5-23.6 541 16.2 13.0-19.335-44 259 19.3 14.5-24.1 287 24.4 19.4-29.4 546 21.5 18.0-25.0
45-54 255 30.6 24.9-36.2 304 28.0 22.9-33.0 559 29.4 25.6-33.3
55-64 206 32.5 26.1-38.9 248 23.0 17.7-28.2 454 28.2 24.0-32.565-74 154 20.1 13.8-26.5 210 19.5 14.2-24.9 364 19.9 15.6-24.1
25-74 1126 20.8 18.3-23.3 1338 22.5 20.1-24.9 2464 21.6 19.8-23.325-64 972 20.9 18.3-23.5 1128 22.7 20.2-25.3 2100 21.7 19.8-23.5
Currently on medication for diabetes
AgeGroup(years)
Men Women Both Sexes
n % 95%CI n % 95%CI n % 95% CI
25-34 252 0.8 0.0-1.9 289 0.7 0.0-1.6 541 0.7 0.0-1.535-44 259 0.8 0.0-1.8 287 1.0 0.0-2.2 546 0.9 0.1-1.7
45-54 255 5.1 2.4-7.8 304 2.3 0.6-4.0 559 3.8 2.2-5.5
55-64 206 4.9 1.9-7.8 248 4.0 1.6-6.5 454 4.5 2.5-6.465-74 154 6.5 2.6-10.4 210 3.8 1.2-6.4 364 5.3 2.8-7.7
25-74 1126 2.4 1.6-3.2 1338 1.7 1.0-2.4 2464 2.1 1.5-2.625-64 972 2.1 1.3-2.9 1128 1.5 0.8-2.2 2100 1.8 1.3-2.4
Totalcholesterol Description:Meantotalcholesterolamongallrespondents.
Instrumentquestion:Totalcholesterolmeasurement
Mean total cholesterol (mmol/L)
AgeGroup(years)
Men Women Both Sexes
n Mean 95%CI n Mean 95%CI n Mean 95% CI
25-34 254 4.8 4.6-4.9 289 4.5 4.4-4.6 543 4.6 4.6-4.735-44 259 4.9 4.8-5.1 286 4.7 4.6-4.8 545 4.8 4.8-4.9
45-54 253 4.9 4.8-5.1 302 5.0 4.9-5.2 555 5.0 4.9-5.1
55-64 206 5.0 4.8-5.1 248 5.1 5.0-5.3 454 5.0 5.0-5.165-74 154 4.7 4.5-4.8 210 5.1 5.0-5.3 364 4.9 4.8-5.0
25-74 1126 4.9 4.8-4.9 1335 4.8 4.7-4.8 2461 4.8 4.8-4.925-64 972 4.9 4.8-4.9 1125 4.8 4.7-4.8 2097 4.8 4.8-4.9

Bhutan StepS Survey report 2009
- 91 -
Mean total cholesterol (mg/dl)
AgeGroup(years)
Men Women Both Sexes
n Mean 95%CI n Mean 95%CI n Mean 95% CI
25-34 254 184.1 179.0-189.3 289 174.2 169.6-178.9 543 179.8 176.2-183.335-44 259 191.3 186.3-196.3 286 182.3 178.6-186.0 545 187.4 184.1-190.7
45-54 253 191.1 186.3-195.8 302 195.0 190.4-199.5 555 192.8 189.5-196.1
55-64 206 191.9 186.7-197.2 248 199.0 194.2-203.9 454 195.1 191.5-198.865-74 154 180.8 175.5-186.0 210 198.0 192.4-203.5 364 188.7 184.8-192.6
25-74 1126 187.9 185.3-190.5 1335 184.7 182.3-187.0 2461 186.5 184.7-188.325-64 972 188.4 185.7-191.2 1125 183.6 181.2-186.1 2097 186.3 184.4-188.2
Raisedtotalcholesterol
Description:Percentageofrespondentswithraisedtotalcholesterol.
Instrumentquestion:Totalcholesterolmeasurement
Total cholesterol ≥ 5.0 mmol/L or ≥ 190 mg/dl
AgeGroup(years)
Men Women Both Sexes
n % 95%CI n % 95%CI n % 95% CI
25-34 254 42.1 36.1-48.2 289 30.8 25.5-36.1 543 37.1 33.0-41.335-44 259 46.3 40.3-52.4 286 38.8 33.2-44.5 545 43.1 38.8-47.3
45-54 253 52.2 46.0-58.3 302 55.6 50.0-61.2 555 53.7 49.5-58.0
55-64 206 48.5 41.7-55.4 248 57.7 51.5-63.8 454 52.7 48.0-57.365-74 154 42.2 34.4-50.0 210 58.6 51.9-65.2 364 49.8 44.5-55.0
25-74 1126 45.7 42.6-48.9 1335 42.5 39.6-45.4 2461 44.3 42.1-46.525-64 972 46.0 42.6-49.3 1125 41.2 38.2-44.3 2097 43.9 41.6-46.2
Total cholesterol ≥ 6.2 mmol/L or ≥ 240 mg/dl
AgeGroup(years)
Men Women Both Sexes
n % 95%CI n % 95%CI n % 95% CI
25-34 254 11.0 7.2-14.9 289 5.2 2.6-7.7 543 8.5 6.0-10.935-44 259 11.6 7.7-15.5 286 3.8 1.6-6.1 545 8.2 5.8-10.6
45-54 253 9.1 5.5-12.6 302 11.3 7.7-14.8 555 10.1 7.5-12.6
55-64 206 13.1 8.5-17.7 248 13.3 9.1-17.5 454 13.2 10.0-16.465-74 154 1.9 0.0-4.1 210 14.8 10.0-19.6 364 7.9 5.3-10.5
25-74 1126 10.5 8.5-12.4 1335 7.6 6.2-9.0 2461 9.2 7.9-10.525-64 972 11.1 9.0-13.2 1125 7.0 5.5-8.5 2097 9.3 7.9-10.6

StepS Survey report 2009 Bhutan
- 92 -
Highdensitylipoprotein(HDL)
Description:MeanHDLamongallrespondentsandpercentageofrespondentswithlowHDL.
Instrumentquestion:HDLcholesterolmeasurement
HDL (mmol/L)
AgeGroup(years)
Men Women Both Sexes
n Mean 95%CI n Mean 95%CI n Mean 95% CI
25-34 235 1.3 1.3-1.4 258 1.3 1.3-1.4 493 1.3 1.3-1.335-44 233 1.3 1.3-1.4 259 1.3 1.3-1.4 492 1.3 1.3-1.4
45-54 237 1.3 1.2-1.3 289 1.3 1.3-1.4 526 1.3 1.3-1.3
55-64 197 1.4 1.3-1.4 235 1.4 1.3-1.4 432 1.4 1.3-1.465-74 147 1.3 1.3-1.4 199 1.4 1.4-1.5 346 1.4 1.3-1.4
25-74 1049 1.3 1.3-1.3 1240 1.3 1.3-1.4 2289 1.3 1.3-1.325-64 902 1.3 1.3-1.3 1041 1.3 1.3-1.3 1943 1.3 1.3-1.3
HDL (mg/dl)
AgeGroup(years)
Men Women Both Sexes
n Mean 95%CI n Mean 95%CI n Mean 95% CI
25-34 235 50.6 48.6-52.7 258 50.9 49.5-52.3 493 50.7 49.4-52.135-44 233 51.1 48.8-53.3 259 50.8 49.3-52.2 492 50.9 49.5-52.4
45-54 237 49.4 47.9-51.0 289 51.7 50.4-53.1 526 50.5 49.4-51.5
55-64 197 52.2 49.6-54.8 235 52.8 51.0-54.6 432 52.5 50.8-54.165-74 147 51.7 49.7-53.8 199 54.7 52.8-56.7 346 53.1 51.7-54.6
25-74 1049 50.8 49.7-51.9 1240 51.5 50.8-52.3 2289 51.1 50.4-51.825-64 902 50.7 49.6-51.9 1041 51.3 50.5-52.0 1943 51.0 50.2-51.7
Percentage of those with HDL <1.03mmol/L or <40 mg/dl
AgeGroup(years)
Men
n % 95%CI
25-34 235 15.3 10.7-19.935-44 233 23.6 18.2-29.1
45-54 237 18.1 13.2-23.1
55-64 197 17.8 12.4-23.165-74 147 17.0 10.9-23.1
25-74 1049 18.4 15.8-20.925-64 902 18.5 15.8-21.2
Percentage of those with HDL <1.29mmol/L or <50 mg/dl
AgeGroup(years)
Womenn % 95%CI
25-34 258 49.2 43.1-55.335-44 259 53.3 47.2-59.4
45-54 289 44.6 38.9-50.4
55-64 235 40.9 34.6-47.1

Bhutan StepS Survey report 2009
- 93 -
65-74 199 31.2 24.7-37.625-74 1240 47.0 44.0-50.125-64 1041 48.3 45.1-51.6
FastingTriglycerides
Description:Meanfastingtriglyceridesamongallrespondentsandpercentageofrespondentswithraisedfastingtriglycerides.
Instrumentquestion:Triglyceridemeasurement
Triglycerides (mmol/L)
AgeGroup(years)
Men Women Both Sexes
n Mean 95%CI n Mean 95%CI n Mean 95% CI
25-34 181 1.8 1.6-2.1 191 1.3 1.1-1.4 372 1.6 1.4-1.835-44 191 1.8 1.7-2.0 184 1.4 1.3-1.5 375 1.7 1.5-1.8
45-54 178 1.8 1.6-2.0 210 1.5 1.4-1.6 388 1.7 1.6-1.8
55-64 146 1.6 1.4-1.8 189 1.5 1.3-1.6 335 1.5 1.4-1.765-74 112 1.2 1.1-1.3 146 1.4 1.2-1.6 258 1.3 1.2-1.4
25-74 808 1.8 1.7-1.9 920 1.4 1.3-1.5 1728 1.6 1.5-1.725-64 696 1.8 1.7-1.9 774 1.4 1.3-1.5 1470 1.6 1.5-1.7
Triglycerides (mg/dl)
AgeGroup(years)
Men Women Both Sexes
n Mean 95%CI n Mean 95%CI n Mean 95% CI
25-34 181 162.0 140.2-183.7 191 111.8 96.2-127.5 372 140.8 126.4-155.235-44 191 163.1 148.9-177.4 184 121.4 111.0-131.8 375 146.4 136.7-156.1
45-54 178 162.2 145.7-178.7 210 132.7 121.0-144.4 388 149.0 138.4-159.6
55-64 146 141.5 123.0-160.0 189 129.6 119.5-139.7 335 135.9 125.0-146.865-74 112 103.7 93.7-113.7 146 128.0 110.2-145.8 258 114.6 104.8-124.5
25-74 808 156.0 146.2-165.7 920 121.6 114.7-128.4 1728 141.2 134.8-147.625-64 696 159.8 149.4-170.2 774 121.0 113.7-128.3 1470 143.3 136.4-150.1
Percentage of those with Triglycerides ≥ 1.7 mmol/L or ≥ 150 mg/dl
AgeGroup(years)
Men Women Both Sexes
n % 95%CI n % 95%CI n % 95% CI
25-34 181 34.3 27.3-41.2 191 14.1 9.2-19.1 372 25.8 21.1-30.435-44 191 44.0 36.9-51.0 184 23.9 17.7-30.1 375 35.9 30.9-40.9
45-54 178 43.8 36.5-51.1 210 27.1 21.1-33.2 388 36.4 31.4-41.3
55-64 146 31.5 24.0-39.1 189 32.8 26.1-39.5 335 32.1 27.0-37.265-74 112 15.2 8.5-21.8 146 19.9 13.4-26.3 258 17.3 12.6-22.0
25-74 808 36.9 33.3-40.5 920 21.8 19.0-24.7 1728 30.4 28.0-32.925-64 696 38.5 34.7-42.4 774 22.0 19.0-25.0 1470 31.5 28.9-34.0

StepS Survey report 2009 Bhutan
- 94 -
Percentage of those with Triglycerides ≥ 2.0 mmol/L or ≥ 180 mg/dl
AgeGroup(years)
Men Women Both Sexes
n % 95%CI n % 95%CI n % 95% CI
25-34 181 25.4 19.1-31.8 191 9.4 5.3-13.6 372 18.7 14.5-22.835-44 191 33.5 26.8-40.2 184 15.8 10.5-21.0 375 26.4 21.8-31.0
45-54 178 31.5 24.6-38.3 210 18.6 13.3-23.8 388 25.7 21.2-30.2
55-64 146 21.9 15.2-28.6 189 16.9 11.6-22.3 335 19.6 15.2-23.965-74 112 10.7 5.0-16.5 146 13.7 8.1-19.3 258 12.1 8.0-16.1
25-74 808 27.2 23.9-30.6 920 14.0 11.6-16.3 1728 21.5 19.3-23.725-64 696 28.5 24.9-32.0 774 14.0 11.5-16.5 1470 22.3 19.9-24.6
RaisedRiskRaisedrisk Description:Percentageofrespondentswith0,1-2,or3-5ofthefollowingriskfactors:
currentdailysmokerlessthan5servingsoffruits&vegetablesperdaylowlevelofactivity(<600MET-minutes)overweightorobese(BMI≥25kg/m2)raisedBP(SBP≥140and/orDBP≥90mmHgorcurrentlyonmedicationforraisedBP).
Instrumentquestion:combinedfromStep1andStep2
Raised Risk
AgeGroup(years)
Men
n%with0riskfactors
95%CI%with1-2riskfactors
95%CI%with3-5riskfactors
95%CI
25-44 435 9.2 6.4-12.1 65.3 60.7-69.8 25.5 21.3-29.745-74 533 2.7 1.3-4.0 54.1 49.8-58.4 43.3 39.0-47.6
25-74 968 6.9 5.0-8.7 61.2 57.9-64.5 31.9 28.8-35.0
Raised Risk
AgeGroup(years)
Women
n%with0riskfactors
95%CI%with1-2riskfactors
95%CI%with3-5riskfactors
95%CI
25-44 484 6.4 4.2-8.7 62.0 57.7-66.4 31.5 27.4-35.745-74 660 2.9 1.6-4.2 47.4 43.5-51.3 49.7 45.8-53.6
25-74 1144 5.1 3.6-6.6 56.5 53.4-59.6 38.4 35.4-41.4
Raised Risk
AgeGroup(years)
Both Sexes
n%with0riskfactors
95%CI%with1-2riskfactors
95%CI%with3-5riskfactors
95%CI
25-44 919 8.0 6.1-9.9 63.9 60.7-67.1 28.1 25.2-31.145-74 1193 2.8 1.8-3.7 51.0 48.1-54.0 46.2 43.3-49.1
25-74 2112 6.1 4.8-7.3 59.1 56.8-61.4 34.8 32.6-37.0

Bhutan StepS Survey report 2009
- 95 -
Raised Risk
AgeGroup(years)
Men
n%with0riskfactors
95%CI%with1-2riskfactors
95%CI%with3-5riskfactors
95%CI
25-44 435 9.2 6.4-12.1 65.3 60.7-69.8 25.5 21.3-29.745-64 398 2.8 1.1-4.4 55.7 50.7-60.6 41.6 36.7-46.5
25-64 833 7.2 5.2-9.2 62.3 58.8-65.8 30.5 27.3-33.8
Raised Risk
AgeGroup(years)
Women
n%with0riskfactors
95%CI%with1-2riskfactors
95%CI%with3-5riskfactors
95%CI
25-44 484 6.4 4.2-8.7 62.0 57.7-66.4 31.5 27.4-35.745-64 480 2.8 1.3-4.3 49.7 45.2-54.2 47.5 43.0-52.0
25-64 964 5.2 3.6-6.8 58.0 54.7-61.3 36.8 33.6-40.0
Raised Risk
AgeGroup(years)
Both Sexes
n%with0riskfactors
95%CI%with1-2riskfactors
95%CI%with3-5riskfactors
95%CI
25-44 919 8.0 6.1-9.9 63.9 60.7-67.1 28.1 25.1-31.145-64 878 2.8 1.7-3.9 53.0 49.6-56.3 44.3 40.9-47.6
25-64 1797 6.3 5.0-7.7 60.4 57.9-62.8 33.3 31.0-35.6

StepS Survey report 2009 Bhutan
- 96 -