Where are the Economists who Publish? - CiteSeer
24
Where are the Economists who Publish? Publication Concentration and Rankings in Europe based on Cumulative Publications * Pierre-Philippe Combes † and Laurent Linnemer ‡ June 2003 Abstract We measure the past production of research articles by current members of European economics institutions. All EconLit journals are used, weighted to reflect differences in quality. Both a long (1971-2000) and a short (1996-2000) time period are considered. We also provide production indices that take into account the authors’ career length. The total output of each research centre is measured as well as its production per member. The focus is on 600 centres from 18 European countries (EU 14, Israel, Norway, Switzerland, and Turkey). European centres are compared to the top 60 U.S. economics departments. Statistics regarding the concentration of article production across researchers, institutions and countries are provided, as well as on publication habits. JEL classification: A14, L11, R32 Keywords: department rankings, research production, research productivity, economics journals. 1 Introduction The ranking job is a tricky one. First, it is a highly time consuming occupation and methodological issues are not all trivial. Second, once the ranking is published, most of your fellow economists find clever arguments to downplay the results. Indeed, except for the happy few who belong to the top ranked institutions, most of the others are bound to be disappointed. People might be right, however, to be disappointed by rankings. An academic economics research centre is a multiproduct factory where even the main input (labor) is not easily measured. The purpose of an economics institution is research but also (if not primarily) teaching (including the supervision of students). Administrative, consulting, and expertise works are also important, as well as more informal output as the generation of ideas and knowledge externalities. Yet most available statistics concentrate on a single output: research articles in academic journals. Therefore production is measured through this single prism. It does not preclude that a measure of production according to other dimensions would give completely different results. Once it has been decided to rank institutions according to their production of academic journal articles, people still often disagree on how to do it, which might explain the vast ranking literature. 1 In this article, we measure the past production of the 22,271.2 current members of 600 European institutions located in 18 countries. Total production as well as production per member are measured. All journals indexed by EconLit are used but they are weighted to reflect differences in quality. Both a 30 year and a 5 year period of time are considered, as well as one that takes into account the authors’ career length. On all these dimensions we differentiate ourselves from other European rankings. First, in the lit- erature, either a publication is allotted to the institution where the author was affiliated at the time of publication (flow measure), or a publication is attributed to the author’s current institutions (stock measure). Both alternatives are complementary. The flow approach is informative from a historical perspective. On the other hand, the stock measure is more informative in terms of human capital: what * This article is based on a more complete report written for the European Economic Association, which is available at http://www.enpc.fr/ceras/combes/pdf/Combes_Linnemer_Europe_07_2003_part_II.pdf. This report includes exten- sive complementary statistics. For example, all rankings are extended to the 150 th center. We are very grateful to the E.E.A. for financial support. We also thank Jeanne Fraysse for her excellent research assistant work. † Ceras (Ura 2036 and Fédération Paris-Jourdan, CNRS). CNRS researcher also affiliated with the CEPR. [email protected], http://www.enpc.fr/ceras/combes/ ‡ University of Lille 2 and Crest (Lei and Grecsta, Ura 2200), [email protected], http://www.crest.fr/pageperso/lei/linnemer/linnemer.htm 1 A detailed survey of this literature can be found in Combes and Linnemer (2002).
Transcript of Where are the Economists who Publish? - CiteSeer

Where are the Economists who Publish?Publication Concentration and Rankings in Europe based on Cumulative
Publications∗
Pierre-Philippe Combes† and Laurent Linnemer‡
June 2003
Abstract
We measure the past production of research articles by current members of European economicsinstitutions. All EconLit journals are used, weighted to reflect differences in quality. Both a long(1971-2000) and a short (1996-2000) time period are considered. We also provide production indicesthat take into account the authors’ career length. The total output of each research centre is measuredas well as its production per member. The focus is on 600 centres from 18 European countries(EU 14, Israel, Norway, Switzerland, and Turkey). European centres are compared to the top 60U.S. economics departments. Statistics regarding the concentration of article production acrossresearchers, institutions and countries are provided, as well as on publication habits.
JEL classification: A14, L11, R32Keywords: department rankings, research production, research productivity, economics journals.
1 IntroductionThe ranking job is a tricky one. First, it is a highly time consuming occupation and methodologicalissues are not all trivial. Second, once the ranking is published, most of your fellow economists findclever arguments to downplay the results. Indeed, except for the happy few who belong to the topranked institutions, most of the others are bound to be disappointed.
People might be right, however, to be disappointed by rankings. An academic economics researchcentre is a multiproduct factory where even the main input (labor) is not easily measured. The purposeof an economics institution is research but also (if not primarily) teaching (including the supervision ofstudents). Administrative, consulting, and expertise works are also important, as well as more informaloutput as the generation of ideas and knowledge externalities. Yet most available statistics concentrateon a single output: research articles in academic journals. Therefore production is measured throughthis single prism. It does not preclude that a measure of production according to other dimensions wouldgive completely different results.
Once it has been decided to rank institutions according to their production of academic journalarticles, people still often disagree on how to do it, which might explain the vast ranking literature.1 Inthis article, we measure the past production of the 22,271.2 current members of 600 European institutionslocated in 18 countries. Total production as well as production per member are measured. All journalsindexed by EconLit are used but they are weighted to reflect differences in quality. Both a 30 year and a5 year period of time are considered, as well as one that takes into account the authors’ career length.
On all these dimensions we differentiate ourselves from other European rankings. First, in the lit-erature, either a publication is allotted to the institution where the author was affiliated at the timeof publication (flow measure), or a publication is attributed to the author’s current institutions (stockmeasure). Both alternatives are complementary. The flow approach is informative from a historicalperspective. On the other hand, the stock measure is more informative in terms of human capital: what
∗This article is based on a more complete report written for the European Economic Association, which is available athttp://www.enpc.fr/ceras/combes/pdf/Combes_Linnemer_Europe_07_2003_part_II.pdf. This report includes exten-sive complementary statistics. For example, all rankings are extended to the 150th center. We are very grateful to theE.E.A. for financial support. We also thank Jeanne Fraysse for her excellent research assistant work.
†Ceras (Ura 2036 and Fédération Paris-Jourdan, CNRS). CNRS researcher also affiliated with the [email protected], http://www.enpc.fr/ceras/combes/
‡University of Lille 2 and Crest (Lei and Grecsta, Ura 2200), [email protected],http://www.crest.fr/pageperso/lei/linnemer/linnemer.htm
1A detailed survey of this literature can be found in Combes and Linnemer (2002).

is the research human capital currently located in a given research center? This approach started withMiller and Tollison (1975) and was followed in Dusansky and Vernon (1998) for the U.S. On Europeandata, we are currently the only ones to adopt it. Besides, the different time periods we consider allowdistinguishing recent human capital from older one. This may provide more accurate information forpeople who want to join the institution (for instance professors or Ph.D. students). The stock approachalso allows for “productivity” measures, since it is then legitimate to divide the production of an insti-tution by the number of its members. Though implemented by some authors, the same operation inthe flow approach is very difficult to interpret since only those members having at least one publicationare considered. Furthermore, two centres with the same total output and the same number of membersat each point in time may end up with different productivity levels only due to differences in memberturnover.
Second, usual rankings are based on a single and relatively short time period. The choice of theperiod of time can be viewed as a choice of a discount factor. As any form of capital, publications areworn away by time. When the time period is 1971-2000 the discount factor equals one. But when theperiod is limited to 1996-2000, the discount factor equals zero for articles published before 1996 and oneafter. Therefore the comparison of both rankings gives an idea of the effects of a variation of the discountfactor. We introduce a new way to take into account time in rankings. This is based on the lengthof the career of each active member of the institution, proxied by the time elapsed since his/her firstpublication. The total output of each member is divided by the length of his/her career, which controls,somehow, for the age structure of the various institutions.
Third, in most of the rankings, only a small sub-set of EconLit journals are used, although EconLitholds about 680 current journals and up to 855 titles if one includes the journals that are no longerreferenced.2 We choose to use all the available information.
The fourth issue is the definition of an output unit. On the one hand we follow the mainstream byconsidering that a unit of output is a weighted page per author. That is, a p page long publicationby n authors corresponds to wp/n units of output where w is the weight of the journal. On the otherhand we also provide rankings which do not take into account either the number of pages or the numberof authors. We weighted all the EconLit journals from 1 to 12, and use these weights in our preferredranking. We compare our results, however, to six other weighting schemes encountered in the literature.
Our main results can be summarized as follows:
• We report descriptive statistics about the number of currently active economists across our set of18 European countries. The most patronized journals within each country are presented, whichunderlines a strong national bias.
• Statistics are given for 14 production indexes, as well as correlations between various rankings.
– On average an economist in our database published 2.7 articles between 1971 and 2000 (notconsidering the journal quality nor the number of authors). About 60% published nothing,however. At the top, to belong to the 1% of the most active publishers one has to claim atleast 33 publications.
– When production is divided by length of career, a researcher with, on average, two publicationsper year is in the top 1% most prolific economists, while the average is of one publication everyfive years.
– The correlation between centre rankings is usually high. In particular, it is higher than betweenthe rankings of the individuals. Important differences remain, however, in particular when thejournal weighting scheme changes and when one goes further down in the rankings.
• European countries are ranked both in terms of total production and production per member.
– Independently of the time period and of the journal weighting scheme, the U.K. is (by far)the country with the largest total output. France is second. The next two ranks are sharedbetween Germany, Italy, and Israel.
– When total output is divided by the number of economists, the most productive country is(generally by far) Israel, while the U.K. stands second. Norway and Belgium are (most of thetime) the next two most productive European countries per member.
• In a long term perspective (1971-2000), the centre rankings show that:2See http://www.econlit.org/ for the complete list of the current journals.
2
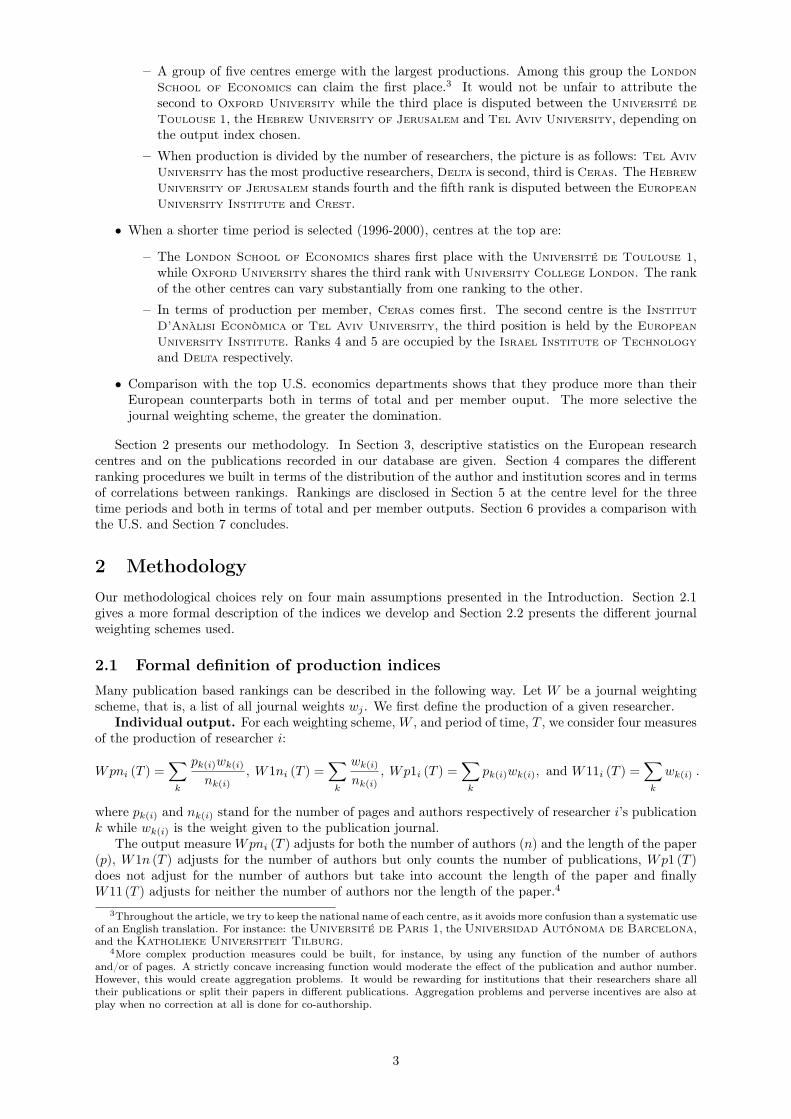
– A group of five centres emerge with the largest productions. Among this group the LondonSchool of Economics can claim the first place.3 It would not be unfair to attribute thesecond to Oxford University while the third place is disputed between the Université deToulouse 1, the Hebrew University of Jerusalem and Tel Aviv University, depending onthe output index chosen.
– When production is divided by the number of researchers, the picture is as follows: Tel AvivUniversity has the most productive researchers, Delta is second, third is Ceras. The HebrewUniversity of Jerusalem stands fourth and the fifth rank is disputed between the EuropeanUniversity Institute and Crest.
• When a shorter time period is selected (1996-2000), centres at the top are:
– The London School of Economics shares first place with the Université de Toulouse 1,while Oxford University shares the third rank with University College London. The rankof the other centres can vary substantially from one ranking to the other.
– In terms of production per member, Ceras comes first. The second centre is the InstitutD’Anàlisi Econòmica or Tel Aviv University, the third position is held by the EuropeanUniversity Institute. Ranks 4 and 5 are occupied by the Israel Institute of Technologyand Delta respectively.
• Comparison with the top U.S. economics departments shows that they produce more than theirEuropean counterparts both in terms of total and per member ouput. The more selective thejournal weighting scheme, the greater the domination.
Section 2 presents our methodology. In Section 3, descriptive statistics on the European researchcentres and on the publications recorded in our database are given. Section 4 compares the differentranking procedures we built in terms of the distribution of the author and institution scores and in termsof correlations between rankings. Rankings are disclosed in Section 5 at the centre level for the threetime periods and both in terms of total and per member outputs. Section 6 provides a comparison withthe U.S. and Section 7 concludes.
2 MethodologyOur methodological choices rely on four main assumptions presented in the Introduction. Section 2.1gives a more formal description of the indices we develop and Section 2.2 presents the different journalweighting schemes used.
2.1 Formal definition of production indicesMany publication based rankings can be described in the following way. Let W be a journal weightingscheme, that is, a list of all journal weights wj . We first define the production of a given researcher.
Individual output. For each weighting scheme, W , and period of time, T , we consider four measuresof the production of researcher i:
Wpni (T ) =∑
k
pk(i)wk(i)
nk(i), W1ni (T ) =
∑
k
wk(i)
nk(i), Wp1i (T ) =
∑
k
pk(i)wk(i), and W11i (T ) =∑
k
wk(i) .
where pk(i) and nk(i) stand for the number of pages and authors respectively of researcher i’s publicationk while wk(i) is the weight given to the publication journal.
The output measure Wpni (T ) adjusts for both the number of authors (n) and the length of the paper(p), W1n (T ) adjusts for the number of authors but only counts the number of publications, Wp1 (T )does not adjust for the number of authors but take into account the length of the paper and finallyW11 (T ) adjusts for neither the number of authors nor the length of the paper.4
3Throughout the article, we try to keep the national name of each centre, as it avoids more confusion than a systematic useof an English translation. For instance: the Université de Paris 1, the Universidad Autónoma de Barcelona,and the Katholieke Universiteit Tilburg.
4More complex production measures could be built, for instance, by using any function of the number of authorsand/or of pages. A strictly concave increasing function would moderate the effect of the publication and author number.However, this would create aggregation problems. It would be rewarding for institutions that their researchers share alltheir publications or split their papers in different publications. Aggregation problems and perverse incentives are also atplay when no correction at all is done for co-authorship.
3

Institution output. Let αi denote the percentage of time spent by member i in the research centreunder consideration. The total output of a research centre is (for the weighting scheme W and the periodof time T ):
Wab (T ) =∑
i
αiWabi (T ) , where a ∈ {p, 1} and b ∈ {n, 1} .
A key issue here is to compute αi. In the absence of any information, we split evenly the researcher’soutput between all his/her affiliations as standard in the literature. However, we were sometimes able toattribute more precise weights.5 Such choices are very important as production is highly concentrated.6Therefore we carefully checked the situation of every top-publisher.
Time periods. For time periods 1971-2000 and 1996-2000, the above formulae can be directly used.For the more subtle “time period” that takes into account the length of the researcher’s career, someadditional details are required. Let Ti denote the number of years since researcher i’s first publication.This index measures his/her average annual production, which is:7
Wabi (career) = Wabi (1971-2000) /Ti.
Note that all the publications of researcher i are taken into account. This measure sheds a differentlight on the comparison of the production of young and more mature researchers. As for other timeperiods, at the level of the institution the production is still measured as the sum of the individualoutputs.
Production per member. Finally, for each production index, we can calculate a productivity indexby dividing the production of a research centre by the number of its (equivalent full time) researchers,∑
αi.
2.2 Journal weighting schemesWe built an original journal weighting scheme denoted CL that weights all EconLit journals from 1 to1/12. After a long and repetitive procedure which started in 1998 (see Combes and Linnemer (2001)),we divided the EconLit journals in six groups. First, five top journals are significantly differentiated fromother ones with a weight equal to 1. A weight of 8/12 only is given to the next 16 journals. Then, aseries of 39 journals are weighted 6/12, 68 journals 4/12, 138 journals 2/12 and all remaining journals1/12 (All weights can be found in appendix C.)
Our choices, which could be discussed endlessly as more than 800 journals are considered, tried tobe consistent with citation/impact indicators when they are available. We do not think, however, thatthese have to be followed blindly. Independently of the journal average quality, the number of citationscan vary from one field to the other and from a young journal to an older one. To counter this kind ofeffects, in any case, we tried to put at least 6/12 to any journal which is a leader in its field. Conversely,we did not put 8/12 or more to a journal too specialized. We do not believe that our scheme is perfectbut the centre rankings proved to be very robust to moderate changes in weights even if such changescould be important at the individual level.
Furthermore, we think that CL is a good complement to the seven other schemes that we also use. Themost elementary one, denoted E, weights equally all EconLit journals. It provides a useful benchmark.At the individual level, E11 measures the total number of publications whatever the number of coauthors.At the institution level, E1n measures the total number of publications of the centre, not counting twicea publication with two authors in the center. Next, we use weighting schemes found in the literature (allthe weights can be found in appendix C). Blue stands for the weights of the 8 journals of the Blue Ribbonof Dusansky and Vernon (1998), SM for the Scott and Mitias (1996) list of 24 journals and coefficientsof normalization,8 Bauwens for the weights used by Bauwens in his initial study on Belgium, KMS forthe 30 journals used by Kalaitzidakis, Mamuneas, and Stengos (2001), KMSall for all the 147 journalsweighted by Kalaitzidakis, Mamuneas, and Stengos (2001), and finally BKLP for the weights proposedby Bauwens, Kirman, Lubrano, and Protopopescu (2002). Table 1 presents the correlations between thedifferent weighting schemes.
Blue and Bauwens present the lowest correlation (0.30), which is not very surprising as Bauwensweights all the journals while Blue weights 8 journals only. The correlation is also rather low, however,
5For example, Peter Wakker signals in his C.V. that he belongs to CREED, University of Amsterdam, (80%) andto the Department of Quantitative Economics, Maastricht University (20%).
6As an example, according to our preferred measure, the total output of Jean Tirole for 1971-2000 is equivalent to theproduction of a research centre ranked 57th. According to the more selective Blue-Ribbon measure, Jean Tirole alone wouldbe ranked 11th among the research centers.
7When production is zero, the score is set to zero, even if the number of years of career is not defined in this case.8We are grateful to Tom Coupé who kindly gave us these coefficients.
4

Table 1: Correlations Between Journal Weights
Weight Blue SM KMS BKLP Bauwens KMSallCL 0.44 0.61 0.64 0.91 0.76 0.69
Blue 1 0.41 0.79 0.37 0.30 0.78SM 1 0.54 0.60 0.54 0.56
KMS 1 0.56 0.47 0.99BKLP 1 0.77 0.61
Bauwens 1 0.51
between Blue and SM, which shows that the 24 weights of Scott and Mitias are significantly differentfrom the 8 of Blue. KMSall and KMS that share 30 journal weights are highly correlated. The correlationis high between CL and BKLP, both of them considering all journals. Finally, correlations of CL withothers schemes increase with the number of journals they consider.
3 Centre and Publication Descriptive StatisticsTo establish the list of the current members of the European institutions, we used the Internet andan email survey. The email survey has not been, however, a success. A majority of the (sub-)centrescontacted did not respond. This means that we mostly had to rely on lists of researchers (Ph.D. and post-doctoral students are excluded) available on the Internet. As a direct consequence, we had to drop somecountries for which the information was not reliable or rich enough, as for instance in Eastern Europe.On the other hand, the information found proved to be of good quality for 18 European countries onwhich this study concentrates: Austria, Belgium, Denmark, Finland, France, Germany, Greece, Ireland,Israel, Italy, the Netherlands, Norway, Portugal, Spain, Sweden, Switzerland, Turkey and the UnitedKingdom.9 Finally, in order to compare Europe and the U.S., we gathered the list of members of the top60 U.S. economics departments.10
Among the 18 countries, the information obtained is not homogeneous. The data quality is not veryhigh for Greece and Turkey due to a low rate of answer and a lack of information on the Web. On theother hand, we have very precise lists for France and Italy as we obtained official lists that we combinedwith direct information from the Web and the email survey. The survey was very successful for Belgiumand Israel: in both countries almost all large research centres answered. Countries like Austria, Denmark,Finland, Ireland, the Netherlands, Norway, Sweden, Switzerland, and the U.K. answered on average in20% of the cases. They have, however, very well documented webpages. These differences may inducesome biases. However, this is the very first attempt to built such a data set that finally includes 22,271.2researchers belonging to 600 centres sub-divided into 1,401 sub-centres and for which all publicationssince 1971 in more than 800 journals are gathered. We are confident that in the future the quality of ourdata set will be improved allowing the production of even better statistics.
Table 2 details the number of research centres, sub-centres, and researchers across Europe. The firstline of Table 2 indicates that we gathered information for 13 centres in Austria, which represent 2.2% ofthe 600 European centers. These 13 centres can be decomposed into 35 sub-centres, all of them including428 members. The average size of an Austrian centre is 32.9 members and the average size of Austriansub-centres is 12.2. These figures are slightly below the European averages which are, respectively, 37.1and 15.9 members.
With 3,538.1 currently active researchers, the U.K. is the largest European country. Four othercountries have more than 2,000 members: Italy, Spain, France, and Germany, by decreasing size. Thesefive countries concentrate 64% of European researchers. Two countries, Sweden, and the Netherlands,have between 1,000 and 2,000 researchers and five countries have between 500 and 1,000: Switzerland,Finland, Denmark, Belgium, and Portugal. Finally, six countries have less than 500 researchers: Norway,Austria, Turkey, Israel, Greece, and Ireland.
For each researcher we tracked (if any) his/her publications since 1971 in EconLit. As shown bythe last two columns of Table 2 we do not find a publication for every economist in our database.The penultimate column gives the number of researchers with at least one publication referenced inEconLit, and the last one the percentage of these publishers in the population of all economists in this
9Notice that affiliations listed in EconLitused in flow rankings are very far from perfect. First, they are frequentlymissing, which prevents any serious rankings before 1990. By contrast, our data have the same accuracy whatever theperiod of time. Second, different declared affiliations may correspond to the same centre, either because the name of theaffiliation has changed across time, or because people refer to sub-centres instead of listing the centre name. Correctioncan usually be made for the most renowned centres but a lot of errors always remain.
10This also allowed us to detect the researchers partly affiliated in the U.S., a piece of information we use to attribute toeach member of a European centre the percentage of time she/he spends there.
5

Table 2: Institutional Structure by Country
Country Centre Centre Sub-C Sub-C Members Members C Size SC Size Publishers Publishers(nb) (%) (nb) (%) (nb) (%) (nb/C) (nb/SC) (nb) (%)
Austria 13 2.2 35 2.3 428.0 1.9 32.9 12.2 137.0 32.0Belgium 16 2.7 68 4.6 605.0 2.7 37.8 8.9 274.5 45.4Denmark 11 1.8 33 2.2 690.3 3.1 62.8 20.9 213.8 31.0Finland 21 3.5 41 2.7 700.0 3.1 33.3 17.1 212.5 30.4France 115 19.2 235 15.7 2627.3 11.8 22.8 11.2 1560.9 59.4
Germany 79 13.2 164 11.0 2064.9 9.3 26.1 12.6 852.3 41.3Greece 9 1.5 15 1.0 237.5 1.1 26.4 15.8 91.5 38.5Ireland 9 1.5 15 1.0 214.0 1.0 23.8 14.3 121.5 56.8Israel 8 1.3 15 1.0 249.6 1.1 31.2 16.6 145.6 58.3Italy 64 10.7 142 9.5 3075.9 13.8 48.1 21.7 1392.8 45.3
Netherlands 15 2.5 61 4.1 1319.0 5.9 87.9 21.6 456.5 34.6Norway 16 2.7 23 1.5 479.2 2.2 30.0 20.8 172.2 35.9Portugal 15 2.5 24 1.6 531.0 2.4 35.4 22.1 107.5 20.2
Spain 47 7.8 116 7.8 3023.0 13.6 64.3 26.1 842.0 27.9Sweden 27 4.5 72 4.8 1456.0 6.5 53.9 20.2 414.0 28.4
Switzerland 23 3.8 64 4.3 698.2 3.1 30.4 10.9 239.4 34.3Turkey 24 4.0 31 2.1 334.0 1.5 13.9 10.8 80.5 24.1
United Kingdom 88 14.7 247 16.5 3538.1 15.9 40.2 14.3 2112.3 59.7Europe 600 100.0 1401 100.0 22271.2 100.0 37.1 15.9 9426.9 42.3
USA / / 59 / 2057.4 / / 34.9 1761.8 85.6
country. A group of countries (France, the U.K., Israel, and Ireland) have about 40% of non publishers. Aslightly higher percentage of non publishers (between 55% and 65%) is found in Belgium, Italy, Germany,Greece, Norway and the Netherlands. A last group with a percentage of non publishers between 68%and 72% contains Switzerland, Austria, Denmark, Finland, Sweden, and Spain. These figures might befrightening, yet, even in the top 60 U.S. economics departments 14.4% of the economists did not publish(in the EconLit sense).
EconLit references 323,023 articles11 published between 1971 and 2000 of which 40,260 (12.5%) havebeen published by the European researchers in our database and 21,954 (6.8%) by the U.S. ones. If thequality of journals is considered according to the CL weighting scheme, the percentage of European CLpnproduction is 19.4% in 2000 and that of the top 60 U.S. departments reaches 12.6%.
The average length of European publications is 17.1 pages with half of the papers having more than16 pages and only 10% more than 29. More than half of the publications (53.0%) have only one author,35.9% have two, 10.0% three and 1.1% more. These figures support the use of the number of pages andof the number of authors in the output measure.
How much of the information available in EconLit is used by each ranking scheme? Blue, basedon 8 journals, uses only 6.2% of all the articles referenced. With 36 journals, the SM scheme uses16.8% of the information. The 30 journals considered in KMS contain 13.8% of all the EconLit articleswhile the KMSall set of journals is larger and represents 38.5%. In contrast, the E, CL, BKLP andBauwens rankings use all the available information as no journal has a weight equal to zero. As a pointof comparison, when measured by CLpn, production in the Blue journals represent only 18.2% of theCLpn total output.
Table 17 in appendix A shows for each European country the six most used journals at the nationallevel. The journal in which researchers publish the most often represents about 10% of the nationalproduction, the first four representing between 12 and 46% of the national production. Moreover, nationalor regional journals constitute the majority of these publications even in the U.K. The only country forwhich this is not true is Israel whose most targeted journals mirror those in the U.S. The 8 most usedjournals by the economists in the top U.S. economics departments are exactly the 8 journals selected inBlue. One could argue, however, that most of these journals are also local.
4 Production and Ranking Descriptive StatisticsIn this section, we evaluate the differences between various ranking methods: first in terms of the dis-tribution of researchers and centres according to their production, next in terms of correlations betweenrankings. Centre rankings are all stock and not flow rankings. For example, we do not provide a com-parison between our rankings and the ranking of Kalaitzidakis, Mamuneas, and Stengos (2001) but theranking that Kalaitzidakis, Mamuneas, and Stengos would have obtained if they had considered the stock
11We use the 1969-2001/11 CDrom.
6

approach. From now on, we use the following notations for output measures: Bauwens for Bauwens1n,BKLP for BKLP1n, Blue for Bluepn, KMS for KMSpn, KMSall for KMSallpn, and SM for SMpn. Westill use the complete name for our own indexes.
4.1 Researcher and Centre DistributionsDistributions of researchers and centres according to the different output measures allow to assess thedegree of concentration of the production as well as its sensitivity to the chosen index. Simultaneouslyany researcher or centre may locate where s/he locates in the hierarchy.
In all tables, PX gives the Xth percentile. For instance, in Table 3 that gives the researcher outputdistribution, the first line indicates that at least 55% of all the 22,271.2 European researchers of ourdatabase have not published an article in any issue of a journal referenced in EconLit. On the otherhand, as P60=1, at least 40% have more than one publication, 25% have more than 2 publications and10% of the researchers more than 8. Finally, only those with more than 33 articles are among the 1% ofthe most productive European economists.
Table 3: Distribution of Researchers according to their Production, 1971-2000
Index Mean St.D. P55 P60 P65 P70 P75 P80 P85 P90 P95 P99E11 2.7 7.1 0 1.0 1.0 1.2 2.0 3.0 5.0 8.0 14.0 33.0E1n 1.9 5.0 0 0.3 0.7 1.0 1.5 2.3 3.5 5.5 9.8 23.5Ep1 46.9 122.5 0 8.0 18.0 27.0 39.7 59.0 88.0 137.0 239.0 563.0Epn 32.4 83.3 0 4.5 10.7 18.0 27.3 41.8 61.8 97.0 165.8 389.2
CL11 0.8 2.9 0 0.1 0.1 0.2 0.3 0.6 1.0 1.8 4.2 13.0CL1n 0.5 1.9 0 0 0.1 0.2 0.3 0.4 0.7 1.3 2.8 8.8CLp1 13.4 50.3 0 1.0 2.1 3.7 6.3 10.3 17.2 31.3 69.0 213.4CLpn 8.8 31.9 0 0.5 1.3 2.5 4.3 7.1 11.5 20.9 45.9 139.2Blue 0.7 6.4 0 0 0 0 0 0 0 0 0.9 17.7SM 3.9 22.4 0 0 0 0 0 0 0 4.4 18.8 89.3
KMS 2.0 14.2 0 0 0 0 0 0 0 1.4 8.2 49.6BLKP 0.7 2.6 0 0.1 0.1 0.2 0.4 0.6 1.0 1.8 3.9 11.8
Bauwens 0.7 2.3 0 0.1 0.2 0.2 0.4 0.6 1.0 1.8 3.7 10.9KMSall 2.2 14.4 0 0 0 0 0 0.1 0.5 2.0 9.1 50.9
The more selective the list of journals, the higher the percentage of economists with no production. Forexample, if production is measured with the Blue weighting scheme, more than 90% of the economistshave no production. More than 85% have no publication in the 24 SM journals or in the 30 KMSjournals. More than 75% have no publication in the 147 KMSall journals. Therefore, these rankings maybe appropriate to discriminate among the top 10% best producers, but do not allow at all to rank thehuge majority of researchers. This is better achieved with rankings taking into account all the journals.For instance, the line “CLpn” indicates that a European economist has produced on average 8.8 CLpnpages, that is, the equivalent of one 8.8 page article s/he would have published alone in one of the top 5CL journals. Only 10% of European economists published more than 20.9 CLpn pages, but on the otherhand, more than 40% have at least 0.5 CLpn pages.
The use of the career period of time provides another perspective (see Combes and Linnemer (2002)):if an economist publishes 0.9 (resp. 2) article(s) every year, she/he belongs to the 10% (resp. 1%) of themost productive economists. On average, a European economist has published 1 article every 5 years.These figures are consistent with the results of Hutchinson and Zivney (1995) for U.S. economists.
Such a high concentration of production (even when all journals share the same weight) could besurprising at first sight. It is, however, consistent with other studies that analyse academic output. Forexample, as regards researchers in economics without any publications, a similar observation is made inBell and Seater (1978). More generally, “Lotka’s Law” (Lotka (1926)) stating the strong concentrationof production in research is well known.
Table 4 reports the distribution of the centres according to their publication output for 1971-2000.More than 80% of the centres produced at least 6.0 papers and more than half of them have more than
37.8 articles. On the other hand, for any production criteria, the top centres are much more productivethan the others. For example, 100.8 Blue pages are required for a centre to be in the top 5%, whereas tobe in the top 1%, 382.0 Blue pages are necessary. In terms of number of publications the jump is slightlymore moderate: 263.4 publications versus 512.1 E1n papers. In terms of CLpn production, the top 1%published more than twice the top 5% that produced about three times more than the top 15%.
7

Table 4: Distribution of Centres according to their Production, 1971-2000
Index Mean St.D. P1 P5 P20 P35 P50 P65 P75 P85 P95 P99E11 97.3 160.3 0 0 6.0 18.3 37.8 69.0 117.2 196.8 395.0 790.9E1n 68.3 110.2 0 0 4.5 13.3 26.8 49.3 82.9 136.0 263.4 512.1Ep1 1696.7 2812.3 0 0.3 90.3 309.0 681.7 1208.5 2010.9 3317.4 6631.1 14134.7Epn 1172.5 1901.5 0 0.2 63.2 229.7 479.2 859.3 1387.1 2279.1 4425.9 9244.2
CL11 28.5 58.6 0 0 0.9 3.3 7.2 15.8 26.9 49.2 135.5 317.4CL1n 19.1 38.5 0 0 0.7 2.3 5.1 11.5 17.9 34.6 90.0 185.3CLp1 472.7 999.8 0 0 15.8 50.5 123.7 259.2 423.6 771.8 2272.1 5373.7CLpn 309.8 636.2 0 0 11.0 34.7 85.5 174.8 283.0 540.8 1497.6 3072.2Blue 21.6 79.0 0 0 0 0 0 2.7 9.0 26.0 100.8 382.0SM 131.9 377.3 0 0 0 0 10.1 42.0 89.6 200.8 623.0 1991.1
KMS 67.0 203.3 0 0 0 0.3 4.1 17.5 36.5 88.9 336.9 1012.0BLKP 26.3 53.5 0 0 0.9 3.1 6.9 14.9 24.5 46.6 121.2 268.5
Bauwens 25.6 49.3 0 0 1.1 3.6 7.9 16.4 25.5 48.8 115.3 244.6KMSall 72.8 213.4 0 0 0.1 1.2 5.6 21.0 43.1 106.0 361.2 1042.3
4.2 Correlations between RankingsIn this section, we present the correlations between the different rankings of authors and institutions.The purpose is to study the sensitivity of both researcher and centre rankings to the weighting schemechoice, but also to the consideration, or not, of the paper length and author number.
First, we compute correlations based on the rankings of the top 200 authors according to at least oneof the CL or E rankings (that is, 378 researchers are taken into account). In order to partly control forthe age heterogeneity, we present here results on the “Career” time period.12
Table 5: Correlations Between (top 200) Researchers’ Rankings, Career
Score E1n Ep1 Epn CL11 CL1n CLp1 CLpn Blue SM KMS BKLP Bauwens KMSallE11 0.85 0.64 0.40 0.58 0.53 0.33 0.27 0.09 0.12 0.07 0.57 0.62 0.08E1n 1 0.49 0.57 0.42 0.55 0.16 0.29 0.04 0.08 0.03 0.50 0.66 0.04Ep1 1 0.80 0.36 0.27 0.47 0.42 0.15 0.21 0.17 0.33 0.33 0.17Epn 1 0.10 0.21 0.20 0.38 0.03 0.11 0.07 0.16 0.29 0.08
CL11 1 0.91 0.86 0.77 0.65 0.67 0.67 0.97 0.85 0.68CL1n 1 0.75 0.83 0.62 0.68 0.67 0.97 0.95 0.69CLp1 1 0.90 0.72 0.80 0.80 0.81 0.66 0.81CLpn 1 0.69 0.82 0.82 0.80 0.74 0.84
Table 5 shows that taking into account the journal quality significantly affects rankings: the correlationbetween Epn and CLpn is only 0.38 and it is close to zero between E schemes and weighting schemes thatdo not consider all journals. It is also striking that even when all journals are weighted equally, takinginto account or not the number of authors and the number of pages significantly modifies the ranking,as shown by the 0.40 correlation between E11 and Epn for instance. This effect is less important for theCL weighting scheme (correlation of 0.77 between CL11 and CLpn).
Table 6 shows that at the institution level, all rankings are highly correlated. Even the correlationsbetween the most basic rankings (E) and the most selective ones (Blue) are as high as 0.47. Hence,aggregation at the centre level reduces the effect of a particular weighting scheme, or the considerationor not of the paper length and author number.
Note, however, that rankings obtained with other standard measures are more highly correlated withthose of ours considering the length of the publications and their number of authors in a similar way.This is for instance the case for CLpn and Blue or CL1n and Bauwens, even if in this case, the squareof the number of authors is used. Otherwise, correlations between rankings mainly reflect correlationsbetween weighting schemes underlined in Section 2. Last, as reported in Combes and Linnemer (2002),correlations are similar on per member rankings.
5 Main rankingsIn this section, we present three rankings of European research centres for three time periods, both interms of total and per member output. For 1996-2000, three additional rankings based on the outputof the 10 most productive researchers of each centre are provided. These 21 rankings give a contrastedview of European research in economics. Three complementary output indexes are selected: CLpn, Blue,and E1n. Blue is very selective and provides information useful to rank the most productive centers. In
12Correlations based on other populations/time periods can be found in Combes and Linnemer (2002).
8

Table 6: Correlations Between (top 75) Centers’ Rankings, Career
Score E1n Ep1 Epn CL11 CL1n CLp1 CLpn Blue SM KMS BKLP Bauwens KMSallE11 0.98 0.96 0.92 0.85 0.84 0.84 0.83 0.48 0.60 0.57 0.86 0.89 0.59E1n 1 0.96 0.96 0.82 0.84 0.81 0.83 0.49 0.60 0.57 0.84 0.88 0.59Ep1 1 0.98 0.79 0.78 0.82 0.82 0.49 0.58 0.56 0.80 0.81 0.58Epn 1 0.73 0.75 0.77 0.79 0.47 0.55 0.54 0.75 0.79 0.55
CL11 1 0.99 0.98 0.97 0.76 0.89 0.86 1.00 0.96 0.88CL1n 1 0.97 0.98 0.78 0.90 0.87 1.00 0.98 0.89CLp1 1 0.99 0.80 0.91 0.89 0.97 0.93 0.90CLpn 1 0.81 0.92 0.90 0.97 0.95 0.91
sharp contrast, E1n ranks only by the number of articles. The third ranking, CLpn, is better balanced:on the one hand, publications in quality journals are given significantly more importance. On the otherhand, all journals are taken into account.
5.1 1971-2000A benefit of a long period ranking is that all publications of all current members are taken into account.Total Output. Table 7 presents rankings based on total output. The first line indicates that the LondonSchool of Economics which gathers a team of (a full time equivalent of) 195.4 members produced overthe last thirty years 7,097.3 CLpn pages, 838.5 Blue pages, and 998.8 publications.
Table 7: European Centres, 1971-2000Name CLpn Name Blue Name E1n
1 london school of economics (uk, 195.4) 7097.3 london school of economics (uk, 195.4) 838.5 london school of economics (uk, 195.4) 998.82 oxford u. (uk, 225.4) 5084.2 hebrew u. jerusalem (is, 60.2) 802.7 oxford u. (uk, 225.4) 825.63 u. toulouse 1 (fr, 95.4) 4207.8 tel aviv u. (is, 31.4) 779.8 u. wales (uk, 302) 643.84 hebrew u. jerusalem (is, 60.2) 3704.3 u. toulouse 1 (fr, 95.4) 642.7 u. roma sapienza (it, 253.3) 620.05 tel aviv u. (is, 31.4) 3424.4 oxford u. (uk, 225.4) 586.9 u. nottingham (uk, 118) 571.46 katholieke u. tilburg (ne, 214.8) 3149.7 crest insee paris (fr, 52.3) 398.6 u. toulouse 1 (fr, 95.4) 522.87 u. warwick (uk, 64.7) 2994.7 u. college london (uk, 67.9) 365.3 u. paris 1 (fr, 194.3) 501.48 u. catholique louvain (be, 134.6) 2910.3 u. pompeu fabra (sp, 111.4) 312.6 u. bologna (it, 162.8) 487.99 u. york (uk, 109) 2556.6 u. catholique louvain (be, 134.6) 291.6 u. warwick (uk, 64.7) 476.010 u. nottingham (uk, 118) 2534.7 u. york (uk, 109) 283.0 katholieke u. tilburg (ne, 214.8) 465.011 u. cambridge (uk, 88) 2470.2 u. warwick (uk, 64.7) 270.1 u. catholique louvain (be, 134.6) 459.412 u. wales (uk, 302) 2326.6 delta ens paris (fr, 11.8) 229.6 u. york (uk, 109) 449.513 u. college london (uk, 67.9) 2297.0 u. cambridge (uk, 88) 216.4 u. paris 10 / cergy (fr, 122.9) 449.514 crest insee paris (fr, 52.3) 2225.1 u. stockholm (swe, 81.8) 202.6 u. reading (uk, 122.5) 445.915 stockholm sch. of eco. (swe, 304) 2128.4 katholieke u. tilburg (ne, 214.8) 186.9 hebrew u. jerusalem (is, 60.2) 439.616 u. paris 1 (fr, 194.3) 2028.0 wilhelms u. bonn (ge, 82.3) 182.1 katholieke u. leuven (be, 88.2) 408.617 u. paris 10 / cergy (fr, 122.9) 2022.8 ceras enpc paris (fr, 11.1) 175.5 stockholm sch. of eco. (swe, 304) 399.118 u. oslo (no, 61.1) 2006.1 u. aix marseille 2 / 3 (fr, 132.5) 170.6 u. cambridge (uk, 88) 397.019 wilhelms u. bonn (ge, 82.3) 1958.5 stockholm sch. of eco. (swe, 304) 170.1 u. bocconi (it, 205.1) 388.020 london business school (uk, 60.3) 1809.3 u. oslo (no, 61.1) 166.0 tel aviv u. (is, 31.4) 376.921 u. stockholm (swe, 81.8) 1752.3 ben gurion u. (is, 19.5) 152.7 u. maastricht (ne, 176.2) 372.022 u. maastricht (ne, 176.2) 1747.5 u. paris 10 / cergy (fr, 122.9) 143.8 bar ilan u. (is, 39) 340.823 u. pompeu fabra (sp, 111.4) 1691.7 insead fontainebleau (fr, 43) 130.5 wilhelms u. bonn (ge, 82.3) 338.824 u. essex (uk, 69) 1681.0 european u. inst. firenze (it, 14.8) 128.3 u. oslo (no, 61.1) 330.525 u. reading (uk, 122.5) 1664.6 u. mannheim (ge, 41.5) 127.2 u. aix marseille 2 / 3 (fr, 132.5) 311.726 u. aix marseille 2 / 3 (fr, 132.5) 1647.4 u. libre bruxelles (be, 99.1) 127.2 u. copenhagen (de, 58.3) 309.027 u. mannheim (ge, 41.5) 1629.7 u. copenhagen (de, 58.3) 121.2 albrechts u. kiel (ge, 126) 302.428 u. roma sapienza (it, 253.3) 1602.5 u. bocconi (it, 205.1) 115.1 u. sussex (uk, 60.5) 290.329 katholieke u. leuven (be, 88.2) 1601.9 bar ilan u. (is, 39) 112.0 u. college london (uk, 67.9) 270.130 insead fontainebleau (fr, 43) 1509.1 u. wien (au, 52) 101.4 u. mannheim (ge, 41.5) 264.431 u. copenhagen (de, 58.3) 1486.2 u. southampton (uk, 24.5) 100.2 u. essex (uk, 69) 262.332 u. bologna (it, 162.8) 1443.0 london business school (uk, 60.3) 95.9 u. manchester (uk, 108) 262.033 u. bocconi (it, 205.1) 1433.4 u. essex (uk, 69) 93.8 u. stockholm (swe, 81.8) 259.434 u. sussex (uk, 60.5) 1416.7 u. nottingham (uk, 118) 93.1 u. east anglia (uk, 66.6) 259.135 bar ilan u. (is, 39) 1410.0 u. zurich (swi, 73.9) 88.0 vrije u. amsterdam (ne, 132.3) 254.736 u. amsterdam (ne, 182.3) 1393.7 birkbeck col. london (uk, 28.4) 81.6 crest insee paris (fr, 52.3) 241.637 vrije u. amsterdam (ne, 132.3) 1289.8 u. geneve (swi, 67.8) 76.9 maximilians u. munchen (ge, 34.9) 239.538 erasmus u. rotterdam (ne, 207.3) 1235.8 goethe u. frankfurt (ge, 49.5) 75.4 athens u. (gr, 50) 238.639 u. east anglia (uk, 66.6) 1204.0 u. lund (swe, 247.1) 74.2 u. zurich (swi, 73.9) 237.640 maximilians u. munchen (ge, 34.9) 1202.4 freie u. berlin (ge, 63.5) 74.0 london business school (uk, 60.3) 233.441 delta ens paris (fr, 11.8) 1185.4 u. autonoma barcelona (sp, 99.5) 72.2 u. sankt gallen (swi, 131.1) 233.142 athens u. (gr, 50) 1166.0 u. amsterdam (ne, 182.3) 68.8 erasmus u. rotterdam (ne, 207.3) 227.443 u. libre bruxelles (be, 99.1) 1162.0 u. east anglia (uk, 66.6) 68.1 u. pompeu fabra (sp, 111.4) 224.444 ben gurion u. (is, 19.5) 1149.5 cemfi madrid (sp, 10) 68.1 u. konstanz (ge, 31) 221.345 albrechts u. kiel (ge, 126) 1142.1 erasmus u. rotterdam (ne, 207.3) 66.2 u. strathclyde (uk, 41.5) 206.846 u. manchester (uk, 108) 1134.2 athens u. (gr, 50) 61.0 u. torino (it, 121) 205.147 u. wien (au, 52) 1115.1 ec polytechnique paris (fr, 20.3) 60.9 humboldt u. berlin (ge, 55) 200.848 humboldt u. berlin (ge, 55) 1079.4 iae csic barcelona (sp, 12.1) 60.1 insead fontainebleau (fr, 43) 198.749 u. southampton (uk, 24.5) 1025.1 u. manchester (uk, 108) 57.6 copenhagen bus. sch. (de, 160.5) 198.750 u. zurich (swi, 73.9) 1019.3 royal holloway london (uk, 16) 56.1 u. valencia (sp, 319.5) 191.151 u. edinburgh (uk, 36.9) 952.8 maximilians u. munchen (ge, 34.9) 51.6 u. libre bruxelles (be, 99.1) 190.852 birkbeck col. london (uk, 28.4) 947.6 humboldt u. berlin (ge, 55) 50.8 u. amsterdam (ne, 182.3) 190.753 leicester u. (uk, 45.5) 929.6 u. college dublin (ir, 28) 50.4 ben gurion u. (is, 19.5) 190.154 ceras enpc paris (fr, 11.1) 921.7 u. bristol (uk, 38.2) 48.8 u. edinburgh (uk, 36.9) 189.555 u. strathclyde (uk, 41.5) 906.8 u. wales (uk, 302) 46.7 aarhus u. (de, 47.2) 189.056 european u. inst. firenze (it, 14.8) 897.1 u. bologna (it, 162.8) 46.1 u. wien (au, 52) 185.557 nhh bergen (no, 38.7) 846.5 u. paris 1 (fr, 194.3) 46.1 bath u. (uk, 99) 185.258 city u. bus. sch. london (uk, 72) 833.0 u. maastricht (ne, 176.2) 46.0 city u. bus. sch. london (uk, 72) 184.259 u. lund (swe, 247.1) 827.5 u. bergen (no, 76.7) 45.4 u. cattolica sacro cuore (it, 120.8) 183.560 u. konstanz (ge, 31) 826.3 u. konstanz (ge, 31) 45.1 u. lund (swe, 247.1) 183.061 u. sankt gallen (swi, 131.1) 825.4 icmb geneve (swi, 8.9) 44.7 u. siena (it, 76.5) 182.162 imperial col. london (uk, 42.5) 801.6 u. lausanne (swi, 17.4) 44.4 u. firenze (it, 115) 180.963 aarhus u. (de, 47.2) 797.5 u. salerno (it, 74.3) 43.3 u. paris 9 (fr, 75.5) 180.564 goethe u. frankfurt (ge, 49.5) 790.6 rijks u. groningen (ne, 96.3) 43.3 queen u. belfast (uk, 95) 177.465 u. bergen (no, 76.7) 761.6 queen mary col. london (uk, 25.3) 42.4 u. napoli federico ii (it, 86.3) 174.766 bath u. (uk, 99) 742.3 u. siena (it, 76.5) 41.5 imperial col. london (uk, 42.5) 174.567 cepremap paris (fr, 15.7) 727.5 u. reading (uk, 122.5) 41.5 leicester u. (uk, 45.5) 171.668 rijks u. groningen (ne, 96.3) 725.7 nhh bergen (no, 38.7) 41.4 u. padova (it, 58.5) 167.869 u. exeter (uk, 35.5) 709.3 cepremap paris (fr, 15.7) 40.2 u. pisa (it, 103) 167.770 u. autonoma barcelona (sp, 99.5) 700.9 leicester u. (uk, 45.5) 40.0 u. roma vergata (it, 58.6) 167.771 u. glasgow (uk, 53.5) 693.9 u. valencia (sp, 319.5) 37.9 u. stirling (uk, 32) 164.172 u. bristol (uk, 38.2) 693.1 u. firenze (it, 115) 37.5 u. nice (fr, 67) 158.573 u. uppsala (swe, 59) 690.5 u. helsinki (fi, 82.2) 36.5 u. grenoble 2 (fr, 112) 157.674 u. carlos iii madrid (sp, 38.8) 681.8 u. alicante (sp, 31) 36.3 goethe u. frankfurt (ge, 49.5) 156.675 copenhagen bus. sch. (de, 160.5) 681.7 u. roma sapienza (it, 253.3) 35.7 u. exeter (uk, 35.5) 155.2
If studied in detail, the three rankings are very different. Some centres enjoy, however, a high rankin all three: the London School of Economics (1st ; 1st ; 1st), Oxford University (2nd ; 5th ; 2nd), andthe Université de Toulouse 1 (3rd ; 4th ; 6th). The Hebrew University of Jerusalem (4th ; 2nd ; 15th)and Tel Aviv University (5th ; 3rd ; 20th) have a very high rank in both the CLpn and Blue rankings buta slightly lower rank in the E1n ranking. Other centres have a very stable ranking as the UniversitéCatholique de Louvain (8th ; 9th ; 11th) or the University of York (9th ; 10th ; 12th). On the other hand,
9
the ranking of the University of Wales (12th ; 55th ; 3rd), for instance, varies significantly from one indexto the other and many other such examples can be found. The way production is computed is thereforecertainly not innocuous on the ranking obtained, contrary to what correlations obtained on average overcentres seemed to show.
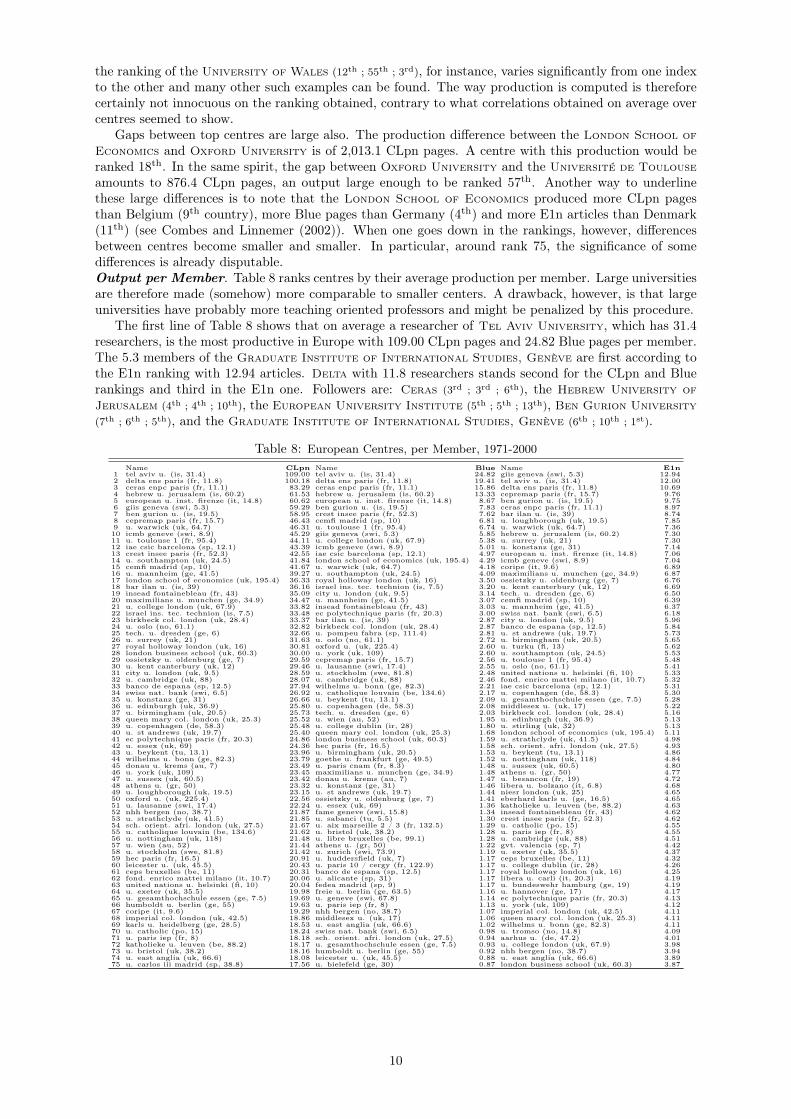
Gaps between top centres are large also. The production difference between the London School ofEconomics and Oxford University is of 2,013.1 CLpn pages. A centre with this production would beranked 18th. In the same spirit, the gap between Oxford University and the Université de Toulouseamounts to 876.4 CLpn pages, an output large enough to be ranked 57th. Another way to underlinethese large differences is to note that the London School of Economics produced more CLpn pagesthan Belgium (9th country), more Blue pages than Germany (4th) and more E1n articles than Denmark(11th) (see Combes and Linnemer (2002)). When one goes down in the rankings, however, differencesbetween centres become smaller and smaller. In particular, around rank 75, the significance of somedifferences is already disputable.Output per Member. Table 8 ranks centres by their average production per member. Large universitiesare therefore made (somehow) more comparable to smaller centers. A drawback, however, is that largeuniversities have probably more teaching oriented professors and might be penalized by this procedure.
The first line of Table 8 shows that on average a researcher of Tel Aviv University, which has 31.4researchers, is the most productive in Europe with 109.00 CLpn pages and 24.82 Blue pages per member.The 5.3 members of the Graduate Institute of International Studies, Genève are first according tothe E1n ranking with 12.94 articles. Delta with 11.8 researchers stands second for the CLpn and Bluerankings and third in the E1n one. Followers are: Ceras (3rd ; 3rd ; 6th), the Hebrew University ofJerusalem (4th ; 4th ; 10th), the European University Institute (5th ; 5th ; 13th), Ben Gurion University(7th ; 6th ; 5th), and the Graduate Institute of International Studies, Genève (6th ; 10th ; 1st).
Table 8: European Centres, per Member, 1971-2000Name CLpn Name Blue Name E1n
1 tel aviv u. (is, 31.4) 109.00 tel aviv u. (is, 31.4) 24.82 giis geneva (swi, 5.3) 12.942 delta ens paris (fr, 11.8) 100.18 delta ens paris (fr, 11.8) 19.41 tel aviv u. (is, 31.4) 12.003 ceras enpc paris (fr, 11.1) 83.29 ceras enpc paris (fr, 11.1) 15.86 delta ens paris (fr, 11.8) 10.694 hebrew u. jerusalem (is, 60.2) 61.53 hebrew u. jerusalem (is, 60.2) 13.33 cepremap paris (fr, 15.7) 9.765 european u. inst. firenze (it, 14.8) 60.62 european u. inst. firenze (it, 14.8) 8.67 ben gurion u. (is, 19.5) 9.756 giis geneva (swi, 5.3) 59.29 ben gurion u. (is, 19.5) 7.83 ceras enpc paris (fr, 11.1) 8.977 ben gurion u. (is, 19.5) 58.95 crest insee paris (fr, 52.3) 7.62 bar ilan u. (is, 39) 8.748 cepremap paris (fr, 15.7) 46.43 cemfi madrid (sp, 10) 6.81 u. loughborough (uk, 19.5) 7.859 u. warwick (uk, 64.7) 46.31 u. toulouse 1 (fr, 95.4) 6.74 u. warwick (uk, 64.7) 7.3610 icmb geneve (swi, 8.9) 45.29 giis geneva (swi, 5.3) 5.85 hebrew u. jerusalem (is, 60.2) 7.3011 u. toulouse 1 (fr, 95.4) 44.11 u. college london (uk, 67.9) 5.38 u. surrey (uk, 21) 7.3012 iae csic barcelona (sp, 12.1) 43.39 icmb geneve (swi, 8.9) 5.01 u. konstanz (ge, 31) 7.1413 crest insee paris (fr, 52.3) 42.55 iae csic barcelona (sp, 12.1) 4.97 european u. inst. firenze (it, 14.8) 7.0614 u. southampton (uk, 24.5) 41.84 london school of economics (uk, 195.4) 4.29 icmb geneve (swi, 8.9) 7.0415 cemfi madrid (sp, 10) 41.67 u. warwick (uk, 64.7) 4.18 coripe (it, 9.6) 6.8916 u. mannheim (ge, 41.5) 39.27 u. southampton (uk, 24.5) 4.09 maximilians u. munchen (ge, 34.9) 6.8717 london school of economics (uk, 195.4) 36.33 royal holloway london (uk, 16) 3.50 ossietzky u. oldenburg (ge, 7) 6.7618 bar ilan u. (is, 39) 36.16 israel ins. tec. technion (is, 7.5) 3.20 u. kent canterbury (uk, 12) 6.6919 insead fontainebleau (fr, 43) 35.09 city u. london (uk, 9.5) 3.14 tech. u. dresden (ge, 6) 6.5020 maximilians u. munchen (ge, 34.9) 34.47 u. mannheim (ge, 41.5) 3.07 cemfi madrid (sp, 10) 6.3921 u. college london (uk, 67.9) 33.82 insead fontainebleau (fr, 43) 3.03 u. mannheim (ge, 41.5) 6.3722 israel ins. tec. technion (is, 7.5) 33.48 ec polytechnique paris (fr, 20.3) 3.00 swiss nat. bank (swi, 6.5) 6.1823 birkbeck col. london (uk, 28.4) 33.37 bar ilan u. (is, 39) 2.87 city u. london (uk, 9.5) 5.9624 u. oslo (no, 61.1) 32.82 birkbeck col. london (uk, 28.4) 2.87 banco de espana (sp, 12.5) 5.8425 tech. u. dresden (ge, 6) 32.66 u. pompeu fabra (sp, 111.4) 2.81 u. st andrews (uk, 19.7) 5.7326 u. surrey (uk, 21) 31.63 u. oslo (no, 61.1) 2.72 u. birmingham (uk, 20.5) 5.6527 royal holloway london (uk, 16) 30.81 oxford u. (uk, 225.4) 2.60 u. turku (fi, 13) 5.6228 london business school (uk, 60.3) 30.00 u. york (uk, 109) 2.60 u. southampton (uk, 24.5) 5.5329 ossietzky u. oldenburg (ge, 7) 29.59 cepremap paris (fr, 15.7) 2.56 u. toulouse 1 (fr, 95.4) 5.4830 u. kent canterbury (uk, 12) 29.46 u. lausanne (swi, 17.4) 2.55 u. oslo (no, 61.1) 5.4131 city u. london (uk, 9.5) 28.59 u. stockholm (swe, 81.8) 2.48 united nations u. helsinki (fi, 10) 5.3332 u. cambridge (uk, 88) 28.07 u. cambridge (uk, 88) 2.46 fond. enrico mattei milano (it, 10.7) 5.3233 banco de espana (sp, 12.5) 27.94 wilhelms u. bonn (ge, 82.3) 2.21 iae csic barcelona (sp, 12.1) 5.3134 swiss nat. bank (swi, 6.5) 26.92 u. catholique louvain (be, 134.6) 2.17 u. copenhagen (de, 58.3) 5.3035 u. konstanz (ge, 31) 26.66 u. beykent (tu, 13.1) 2.09 u. gesamthochschule essen (ge, 7.5) 5.2836 u. edinburgh (uk, 36.9) 25.80 u. copenhagen (de, 58.3) 2.08 middlesex u. (uk, 17) 5.2237 u. birmingham (uk, 20.5) 25.73 tech. u. dresden (ge, 6) 2.03 birkbeck col. london (uk, 28.4) 5.1638 queen mary col. london (uk, 25.3) 25.52 u. wien (au, 52) 1.95 u. edinburgh (uk, 36.9) 5.1339 u. copenhagen (de, 58.3) 25.48 u. college dublin (ir, 28) 1.80 u. stirling (uk, 32) 5.1340 u. st andrews (uk, 19.7) 25.40 queen mary col. london (uk, 25.3) 1.68 london school of economics (uk, 195.4) 5.1141 ec polytechnique paris (fr, 20.3) 24.86 london business school (uk, 60.3) 1.59 u. strathclyde (uk, 41.5) 4.9842 u. essex (uk, 69) 24.36 hec paris (fr, 16.5) 1.58 sch. orient. afri. london (uk, 27.5) 4.9343 u. beykent (tu, 13.1) 23.96 u. birmingham (uk, 20.5) 1.53 u. beykent (tu, 13.1) 4.8644 wilhelms u. bonn (ge, 82.3) 23.79 goethe u. frankfurt (ge, 49.5) 1.52 u. nottingham (uk, 118) 4.8445 donau u. krems (au, 7) 23.49 u. paris cnam (fr, 8.3) 1.48 u. sussex (uk, 60.5) 4.8046 u. york (uk, 109) 23.45 maximilians u. munchen (ge, 34.9) 1.48 athens u. (gr, 50) 4.7747 u. sussex (uk, 60.5) 23.42 donau u. krems (au, 7) 1.47 u. besancon (fr, 19) 4.7248 athens u. (gr, 50) 23.32 u. konstanz (ge, 31) 1.46 libera u. bolzano (it, 6.8) 4.6849 u. loughborough (uk, 19.5) 23.15 u. st andrews (uk, 19.7) 1.44 niesr london (uk, 25) 4.6550 oxford u. (uk, 225.4) 22.56 ossietzky u. oldenburg (ge, 7) 1.41 eberhard karls u. (ge, 16.5) 4.6551 u. lausanne (swi, 17.4) 22.24 u. essex (uk, 69) 1.36 katholieke u. leuven (be, 88.2) 4.6352 nhh bergen (no, 38.7) 21.87 fame geneve (swi, 15.8) 1.34 insead fontainebleau (fr, 43) 4.6253 u. strathclyde (uk, 41.5) 21.85 u. sabanci (tu, 5.5) 1.30 crest insee paris (fr, 52.3) 4.6254 sch. orient. afri. london (uk, 27.5) 21.67 u. aix marseille 2 / 3 (fr, 132.5) 1.29 u. catholic (po, 15) 4.5555 u. catholique louvain (be, 134.6) 21.62 u. bristol (uk, 38.2) 1.28 u. paris iep (fr, 8) 4.5556 u. nottingham (uk, 118) 21.48 u. libre bruxelles (be, 99.1) 1.28 u. cambridge (uk, 88) 4.5157 u. wien (au, 52) 21.44 athens u. (gr, 50) 1.22 gvt. valencia (sp, 7) 4.4258 u. stockholm (swe, 81.8) 21.42 u. zurich (swi, 73.9) 1.19 u. exeter (uk, 35.5) 4.3759 hec paris (fr, 16.5) 20.91 u. huddersfield (uk, 7) 1.17 ceps bruxelles (be, 11) 4.3260 leicester u. (uk, 45.5) 20.43 u. paris 10 / cergy (fr, 122.9) 1.17 u. college dublin (ir, 28) 4.2661 ceps bruxelles (be, 11) 20.31 banco de espana (sp, 12.5) 1.17 royal holloway london (uk, 16) 4.2562 fond. enrico mattei milano (it, 10.7) 20.06 u. alicante (sp, 31) 1.17 libera u. carli (it, 20.3) 4.1963 united nations u. helsinki (fi, 10) 20.04 fedea madrid (sp, 9) 1.17 u. bundeswehr hamburg (ge, 19) 4.1964 u. exeter (uk, 35.5) 19.98 freie u. berlin (ge, 63.5) 1.16 u. hannover (ge, 17) 4.1765 u. gesamthochschule essen (ge, 7.5) 19.69 u. geneve (swi, 67.8) 1.14 ec polytechnique paris (fr, 20.3) 4.1366 humboldt u. berlin (ge, 55) 19.63 u. paris iep (fr, 8) 1.13 u. york (uk, 109) 4.1267 coripe (it, 9.6) 19.29 nhh bergen (no, 38.7) 1.07 imperial col. london (uk, 42.5) 4.1168 imperial col. london (uk, 42.5) 18.86 middlesex u. (uk, 17) 1.06 queen mary col. london (uk, 25.3) 4.1169 karls u. heidelberg (ge, 28.5) 18.53 u. east anglia (uk, 66.6) 1.02 wilhelms u. bonn (ge, 82.3) 4.1170 u. catholic (po, 15) 18.24 swiss nat. bank (swi, 6.5) 0.98 u. tromso (no, 14.8) 4.0971 u. paris iep (fr, 8) 18.18 sch. orient. afri. london (uk, 27.5) 0.94 aarhus u. (de, 47.2) 4.0172 katholieke u. leuven (be, 88.2) 18.17 u. gesamthochschule essen (ge, 7.5) 0.93 u. college london (uk, 67.9) 3.9873 u. bristol (uk, 38.2) 18.16 humboldt u. berlin (ge, 55) 0.92 nhh bergen (no, 38.7) 3.9474 u. east anglia (uk, 66.6) 18.08 leicester u. (uk, 45.5) 0.88 u. east anglia (uk, 66.6) 3.8975 u. carlos iii madrid (sp, 38.8) 17.56 u. bielefeld (ge, 30) 0.87 london business school (uk, 60.3) 3.87
10

5.2 CareerThe “career” time period takes into account researchers’ average annual output since the year of their firstpublication. The idea is to control for differences between centres in the researchers’ ages. By contrastwith the rankings in Table 7, those of Table 9 correct for the age structure in each centre, and hencemay be a better guide to its future potential. In Table 9, the names of the centres are typeset in threedifferent ways to ease this comparison. A centre is in bold if it gains strictly more than 2 ranks comparedto 1971-2000 (Table 7). A centre is in normal font if its rank does not change by more than 2 (upwardor downward). Finally a center’s name is typeset in italic when its rank decreases by strictly more than2. The exact rank variation is given in the last brackets.Total Output. The first line of Table 9 indicates that the 195.4 researchers of the London School ofEconomics produced all together 480.5 CLpn pages per year of their career. This figure is an estimateof the centre’s output to date based on the average output of each active member since his/her firstpublication. The London School of Economics is also first for this career rankings for Blue, with 53.4Blue pages per year of career, and in terms of publication number, with 65.2 E1n articles per year ofcareer.
Differences with Table 7 are quite small at the very top (first 3 centres) but can be larger below.Furthermore, they may depend on the criterion chosen. Examples of variations are for instance: Stock-holm School of Economics (+9 ; +7 ; +8), Universitat Pompeu Fabra (+12 ; +2 ; +20), London BusinessSchool (+6 ; +12 ; +1), Tel Aviv University (-8 ; -1 ; -25), and Hebrew University of Jerusalem (-4 ;= ; -18).
Table 9: European Centres, CareerName CLpn Name Blue Name E1n
1 london school of economics (uk, 195.4)(0) 480.5 london school of economics (uk, 195.4)(0) 53.4 london school of economics (uk, 195.4)(0) 65.22 oxford u. (uk, 225.4)(0) 347.9 hebrew u. jerusalem (is, 60.2)(0) 44.1 oxford u. (uk, 225.4)(0) 56.63 u. toulouse 1 (fr, 95.4)(0) 313.0 oxford u. (uk, 225.4)(+2) 43.6 u. wales (uk, 302)(0) 53.94 katholieke u. tilburg (ne, 214.8)(+2) 292.7 tel aviv u. (is, 31.4)(-1) 38.8 u. nottingham (uk, 118)(+1) 49.35 u. nottingham (uk, 118)(+5) 235.4 u. toulouse 1 (fr, 95.4)(-1) 36.8 u. paris 1 (fr, 194.3)(+2) 47.66 stockholm sch. of eco. (swe, 304)(+9) 231.1 u. pompeu fabra (sp, 111.4)(+2) 28.2 katholieke u. tilburg (ne, 214.8)(+4) 44.77 u. catholique louvain (be, 134.6)(+1) 204.9 u. college london (uk, 67.9)(0) 26.2 u. toulouse 1 (fr, 95.4)(-1) 44.28 hebrew u. jerusalem (is, 60.2)(-4) 201.9 crest insee paris (fr, 52.3)(-2) 21.5 u. roma sapienza (it, 253.3)(-4) 41.99 u. college london (uk, 67.9)(+4) 189.1 u. warwick (uk, 64.7)(+2) 17.6 stockholm sch. of eco. (swe, 304)(+8) 40.910 u. warwick (uk, 64.7)(-3) 187.8 u. stockholm (swe, 81.8)(+4) 14.9 u. bologna (it, 162.8)(-2) 40.911 u. pompeu fabra (sp, 111.4)(+12) 182.9 european u. inst. firenze (it, 14.8)(+13) 14.3 u. valencia (sp, 319.5)(+39) 38.312 u. paris 1 (fr, 194.3)(+4) 182.6 stockholm sch. of eco. (swe, 304)(+7) 14.0 u. reading (uk, 122.5)(+2) 35.913 tel aviv u. (is, 31.4)(-8) 178.5 u. catholique louvain (be, 134.6)(-4) 13.7 u. paris 10 / cergy (fr, 122.9)(-1) 34.714 london business school (uk, 60.3)(+6) 176.6 katholieke u. tilburg (ne, 214.8)(+1) 12.8 u. maastricht (ne, 176.2)(+7) 33.115 u. cambridge (uk, 88)(-4) 175.2 delta ens paris (fr, 11.8)(-3) 12.5 u. catholique louvain (be, 134.6)(-4) 32.216 crest insee paris (fr, 52.3)(-2) 165.2 u. york (uk, 109)(-6) 12.3 u. warwick (uk, 64.7)(-7) 30.317 u. paris 10 / cergy (fr, 122.9)(0) 162.9 ceras enpc paris (fr, 11.1)(0) 11.9 katholieke u. leuven (be, 88.2)(-1) 30.318 u. york (uk, 109)(-9) 160.6 u. libre bruxelles (be, 99.1)(+7) 11.3 wilhelms u. bonn (ge, 82.3)(+5) 29.319 u. maastricht (ne, 176.2)(+3) 156.9 u. cambridge (uk, 88)(-6) 10.9 u. york (uk, 109)(-7) 28.620 u. wales (uk, 302)(-8) 156.0 london business school (uk, 60.3)(+12) 10.3 albrechts u. kiel (ge, 126)(+7) 28.421 u. stockholm (swe, 81.8)(0) 152.8 wilhelms u. bonn (ge, 82.3)(-5) 9.2 u. bocconi (it, 205.1)(-2) 27.922 wilhelms u. bonn (ge, 82.3)(-3) 152.3 u. oslo (no, 61.1)(-2) 9.1 u. cambridge (uk, 88)(-4) 27.823 u. essex (uk, 69)(+1) 145.1 u. wien (au, 52)(+7) 8.8 u. pompeu fabra (sp, 111.4)(+20) 27.424 u. oslo (no, 61.1)(-6) 144.4 u. paris 10 / cergy (fr, 122.9)(-2) 8.7 u. aix marseille 2 / 3 (fr, 132.5)(+1) 24.925 u. bologna (it, 162.8)(+7) 138.8 u. essex (uk, 69)(+8) 8.7 u. oslo (no, 61.1)(-1) 24.726 u. amsterdam (ne, 182.3)(+10) 136.7 insead fontainebleau (fr, 43)(-3) 8.6 u. manchester (uk, 108)(+6) 24.127 u. reading (uk, 122.5)(-2) 135.3 u. aix marseille 2 / 3 (fr, 132.5)(-9) 8.5 u. essex (uk, 69)(+4) 23.228 insead fontainebleau (fr, 43)(+2) 135.1 u. zurich (swi, 73.9)(+7) 8.4 u. stockholm (swe, 81.8)(+5) 22.929 katholieke u. leuven (be, 88.2)(0) 134.9 u. southampton (uk, 24.5)(+2) 8.0 maximilians u. munchen (ge, 34.9)(+8) 22.930 u. mannheim (ge, 41.5)(-3) 133.7 u. bocconi (it, 205.1)(-2) 7.7 u. college london (uk, 67.9)(-1) 22.931 maximilians u. munchen (ge, 34.9)(+9) 128.7 ben gurion u. (is, 19.5)(-10) 7.7 copenhagen bus. sch. (de, 160.5)(+17) 22.732 u. roma sapienza (it, 253.3)(-4) 120.7 u. mannheim (ge, 41.5)(-6) 7.7 erasmus u. rotterdam (ne, 207.3)(+10) 22.333 u. aix marseille 2 / 3 (fr, 132.5)(-7) 118.8 u. bologna (it, 162.8)(+23) 7.6 hebrew u. jerusalem (is, 60.2)(-18) 21.934 u. sussex (uk, 60.5)(0) 115.5 cemfi madrid (sp, 10)(+9) 7.2 u. sussex (uk, 60.5)(-6) 21.035 u. libre bruxelles (be, 99.1)(+8) 114.9 royal holloway london (uk, 16)(+15) 6.7 u. amsterdam (ne, 182.3)(+17) 20.836 u. bocconi (it, 205.1)(-3) 113.7 u. copenhagen (de, 58.3)(-9) 6.6 u. grenoble 2 (fr, 112)(+37) 20.837 erasmus u. rotterdam (ne, 207.3)(+1) 112.6 freie u. berlin (ge, 63.5)(+3) 6.5 u. lund (swe, 247.1)(+23) 20.738 u. copenhagen (de, 58.3)(-7) 107.6 bar ilan u. (is, 39)(-9) 6.2 vrije u. amsterdam (ne, 132.3)(-3) 20.639 vrije u. amsterdam (ne, 132.3)(-2) 107.5 u. nottingham (uk, 118)(-5) 6.1 london business school (uk, 60.3)(+1) 20.440 u. valencia (sp, 319.5)(+42) 106.4 maximilians u. munchen (ge, 34.9)(+11) 6.1 u. copenhagen (de, 58.3)(-14) 20.341 u. alicante (sp, 31)(+60) 100.9 hec paris (fr, 16.5)(+49) 6.0 crest insee paris (fr, 52.3)(-5) 20.242 albrechts u. kiel (ge, 126)(+3) 100.7 u. bristol (uk, 38.2)(+12) 6.0 u. mannheim (ge, 41.5)(-12) 20.143 u. manchester (uk, 108)(+3) 100.3 u. valencia (sp, 319.5)(+28) 5.9 u. east anglia (uk, 66.6)(-9) 20.044 queen mary col. london (uk, 25.3)(+35) 98.0 u. paris 1 (fr, 194.3)(+12) 5.7 bar ilan u. (is, 39)(-22) 19.745 u. carlos iii madrid (sp, 38.8)(+29) 96.5 birkbeck col. london (uk, 28.4)(-9) 5.6 tel aviv u. (is, 31.4)(-25) 18.946 u. wien (au, 52)(+1) 93.4 erasmus u. rotterdam (ne, 207.3)(-1) 5.5 u. barcelona (sp, 383.8)(+106) 18.547 humboldt u. berlin (ge, 55)(+1) 92.4 u. amsterdam (ne, 182.3)(-5) 5.4 u. zurich (swi, 73.9)(-8) 18.348 u. zurich (swi, 73.9)(+2) 90.3 queen mary col. london (uk, 25.3)(+17) 4.8 queen u. belfast (uk, 95)(+16) 18.149 u. east anglia (uk, 66.6)(-10) 90.1 u. roma sapienza (it, 253.3)(+26) 4.8 u. autonoma barcelona (sp, 99.5)(+31) 18.050 european u. inst. firenze (it, 14.8)(+6) 89.5 iae csic barcelona (sp, 12.1)(-2) 4.7 u. lille 1 / valenciennes (fr, 118)(+65) 17.851 u. lund (swe, 247.1)(+8) 89.2 u. alicante (sp, 31)(+23) 4.3 u. torino (it, 121)(-5) 17.452 bar ilan u. (is, 39)(-17) 85.5 humboldt u. berlin (ge, 55)(0) 4.2 u. sankt gallen (swi, 131.1)(-11) 17.453 birkbeck col. london (uk, 28.4)(-1) 81.4 goethe u. frankfurt (ge, 49.5)(-15) 4.2 u. bordeaux 4 (fr, 71)(+46) 17.354 u. autonoma barcelona (sp, 99.5)(+16) 79.5 u. autonoma barcelona (sp, 99.5)(-13) 4.1 u. libre bruxelles (be, 99.1)(-3) 17.255 u. glasgow (uk, 53.5)(+16) 78.5 u. lund (swe, 247.1)(-16) 4.0 humboldt u. berlin (ge, 55)(-8) 17.156 athens u. (gr, 50)(-14) 76.9 israel ins. tec. technion (is, 7.5)(+38) 3.9 u. autonoma madrid (sp, 180.4)(+98) 16.557 city u. bus. sch. london (uk, 72)(+1) 76.6 u. east anglia (uk, 66.6)(-14) 3.5 u. cattolica sacro cuore (it, 120.8)(+2) 16.458 u. bergen (no, 76.7)(+7) 74.9 athens u. (gr, 50)(-12) 3.5 cpb den haag (ne, 163.5)(+75) 16.359 cpb den haag (ne, 163.5)(+61) 74.5 u. carlos iii madrid (sp, 38.8)(+19) 3.5 u. newcastle (uk, 88)(+26) 16.160 copenhagen bus. sch. (de, 160.5)(+15) 74.3 u. college dublin (ir, 28)(-7) 3.4 city u. bus. sch. london (uk, 72)(-2) 16.061 ceras enpc paris (fr, 11.1)(-7) 74.1 koc u. (tu, 47.5)(+35) 3.3 u. alicante (sp, 31)(+89) 15.762 u. southampton (uk, 24.5)(-13) 73.2 u. geneve (swi, 67.8)(-25) 3.2 u. konstanz (ge, 31)(-18) 15.763 ben gurion u. (is, 19.5)(-19) 68.0 u. venezia foscari (it, 87.8)(+17) 2.9 insead fontainebleau (fr, 43)(-15) 15.564 u. edinburgh (uk, 36.9)(-13) 67.7 norw. sch. man. sandvika (no, 20.7)(+47) 2.9 u. carlos iii madrid (sp, 38.8)(+36) 15.565 u. uppsala (swe, 59)(+8) 66.0 u. maastricht (ne, 176.2)(-7) 2.8 u. glasgow (uk, 53.5)(+23) 15.066 leicester u. (uk, 45.5)(-13) 65.9 u. padova (it, 58.5)(+11) 2.8 u. goteborg (swe, 121.2)(+17) 14.967 delta ens paris (fr, 11.8)(-26) 65.6 u. manchester (uk, 108)(-17) 2.8 athens u. (gr, 50)(-29) 14.868 rijks u. groningen (ne, 96.3)(0) 63.7 city u. london (uk, 9.5)(+17) 2.8 u. wien (au, 52)(-12) 14.869 queen u. belfast (uk, 95)(+11) 63.2 u. salerno (it, 74.3)(-6) 2.7 u. napoli federico ii (it, 86.3)(-4) 14.670 nhh bergen (no, 38.7)(-13) 62.4 u. torino (it, 121)(+6) 2.5 u. pisa (it, 103)(-1) 14.471 u. sankt gallen (swi, 131.1)(-10) 61.7 rijks u. groningen (ne, 96.3)(-8) 2.5 u. nice (fr, 67)(+1) 14.372 imperial col. london (uk, 42.5)(-10) 59.6 u. birmingham (uk, 20.5)(+7) 2.5 u. dijon (fr, 77.5)(+44) 14.273 iae csic barcelona (sp, 12.1)(+20) 59.3 ec polytechnique paris (fr, 20.3)(-25) 2.5 rijks u. groningen (ne, 96.3)(+13) 14.074 royal holloway london (uk, 16)(+24) 59.1 u. bergen (no, 76.7)(-15) 2.4 u. rennes 1 (fr, 88.5)(+49) 13.975 goethe u. frankfurt (ge, 49.5)(-11) 57.8 icmb geneve (swi, 8.9)(-14) 2.4 brunel u. (uk, 48.5)(+22) 13.6
Output per Member. Table 10 gives the average production per year of career and per member. Forexample, one of the 11.1 members of Ceras produced on average 6.7 CLpn pages each year since his/herfirst publication. Tel Aviv University is first for the Blue ranking with an average production permember of 1.24 Blue pages per year of career. Finally, Ceras is also first in the E1n ranking with 0.67E1n articles per year of career and per member. Again, comparisons with the results of Table 8 that
11

do not take account of the time since researchers have started their careers underline the role of agedifferences between centres.
Table 10: European Centres, Career, per MemberName CLpn Name Blue Name E1n
1 ceras enpc paris (fr, 11.1)(+2) 6.70 tel aviv u. (is, 31.4)(0) 1.24 ceras enpc paris (fr, 11.1)(+5) 0.672 european u. inst. firenze (it, 14.8)(+3) 6.05 ceras enpc paris (fr, 11.1)(+1) 1.08 european u. inst. firenze (it, 14.8)(+11) 0.663 tel aviv u. (is, 31.4)(-2) 5.68 delta ens paris (fr, 11.8)(-1) 1.06 maximilians u. munchen (ge, 34.9)(+14) 0.664 delta ens paris (fr, 11.8)(-2) 5.54 european u. inst. firenze (it, 14.8)(+1) 0.97 u. kent canterbury (uk, 12)(+14) 0.635 iae csic barcelona (sp, 12.1)(+7) 4.90 hebrew u. jerusalem (is, 60.2)(-1) 0.73 tel aviv u. (is, 31.4)(-3) 0.606 israel ins. tec. technion (is, 7.5)(+16) 4.81 cemfi madrid (sp, 10)(+2) 0.72 delta ens paris (fr, 11.8)(-2) 0.607 cemfi madrid (sp, 10)(+8) 4.59 israel ins. tec. technion (is, 7.5)(+11) 0.52 iae csic barcelona (sp, 12.1)(+28) 0.608 icmb geneve (swi, 8.9)(+2) 4.04 royal holloway london (uk, 16)(+9) 0.42 cemfi madrid (sp, 10)(+12) 0.589 queen mary col. london (uk, 25.3)(+29) 3.88 crest insee paris (fr, 52.3)(-2) 0.41 icmb geneve (swi, 8.9)(+5) 0.5710 royal holloway london (uk, 16)(+17) 3.69 ben gurion u. (is, 19.5)(-4) 0.39 swiss nat. bank (swi, 6.5)(+12) 0.5511 maximilians u. munchen (ge, 34.9)(+10) 3.69 u. college london (uk, 67.9)(+1) 0.39 cepremap paris (fr, 15.7)(-6) 0.5512 ben gurion u. (is, 19.5)(-5) 3.49 u. toulouse 1 (fr, 95.4)(-1) 0.39 u. loughborough (uk, 19.5)(-4) 0.5413 hebrew u. jerusalem (is, 60.2)(-9) 3.35 iae csic barcelona (sp, 12.1)(+3) 0.39 ben gurion u. (is, 19.5)(-8) 0.5314 hec paris (fr, 16.5)(+45) 3.31 hec paris (fr, 16.5)(+28) 0.37 royal holloway london (uk, 16)(+47) 0.5215 u. toulouse 1 (fr, 95.4)(-4) 3.28 u. southampton (uk, 24.5)(+1) 0.33 banco de espana (sp, 12.5)(+10) 0.5216 u. alicante (sp, 31)(+72) 3.25 city u. london (uk, 9.5)(+3) 0.29 bar ilan u. (is, 39)(-9) 0.5117 u. mannheim (ge, 41.5)(-1) 3.22 london school of economics (uk, 195.4)(-3) 0.27 niesr london (uk, 25)(+33) 0.5118 crest insee paris (fr, 52.3)(-5) 3.16 u. warwick (uk, 64.7)(-2) 0.27 city u. london (uk, 9.5)(+7) 0.5119 insead fontainebleau (fr, 43)(0) 3.14 icmb geneve (swi, 8.9)(-7) 0.26 giis geneva (swi, 5.3)(-15) 0.5120 u. southampton (uk, 24.5)(-6) 2.99 u. pompeu fabra (sp, 111.4)(+5) 0.25 u. alicante (sp, 31)(+112) 0.5121 london business school (uk, 60.3)(+7) 2.93 giis geneva (swi, 5.3)(-11) 0.21 queen mary col. london (uk, 25.3)(+46) 0.5022 u. warwick (uk, 64.7)(-13) 2.90 birkbeck col. london (uk, 28.4)(+1) 0.20 u. beykent (tu, 13.1)(+22) 0.5023 birkbeck col. london (uk, 28.4)(0) 2.87 insead fontainebleau (fr, 43)(-1) 0.20 u. konstanz (ge, 31)(-9) 0.5024 u. college london (uk, 67.9)(-3) 2.78 oxford u. (uk, 225.4)(+3) 0.19 israel ins. tec. technion (is, 7.5)(+66) 0.4925 city u. london (uk, 9.5)(+6) 2.60 queen mary col. london (uk, 25.3)(+16) 0.19 sesrtcic ankara (tu, 6)(+217) 0.4926 banco de espana (sp, 12.5)(+8) 2.60 u. mannheim (ge, 41.5)(-4) 0.19 u. lille 2 (fr, 9.8)(+118) 0.4927 cepremap paris (fr, 15.7)(-19) 2.53 u. stockholm (swe, 81.8)(+4) 0.18 u. mannheim (ge, 41.5)(-3) 0.4928 u. beykent (tu, 13.1)(+15) 2.50 tech. u. dresden (ge, 6)(+10) 0.18 u. warwick (uk, 64.7)(-19) 0.4729 u. carlos iii madrid (sp, 38.8)(+46) 2.49 london business school (uk, 60.3)(+12) 0.17 ossietzky u. oldenburg (ge, 7)(-11) 0.4730 u. kent canterbury (uk, 12)(0) 2.47 maximilians u. munchen (ge, 34.9)(+16) 0.17 u. gesamthochschule essen (ge, 7.5)(+7) 0.4731 swiss nat. bank (swi, 6.5)(+4) 2.47 u. wien (au, 52)(+9) 0.17 u. toulouse 1 (fr, 95.4)(-2) 0.4632 giis geneva (swi, 5.3)(-24) 2.47 bar ilan u. (is, 39)(-9) 0.16 tech. u. dresden (ge, 6)(-12) 0.4633 london school of economics (uk, 195.4)(-16) 2.46 u. bristol (uk, 38.2)(+23) 0.16 u. cantabria (sp, 13)(+167) 0.4634 tech. u. dresden (ge, 6)(-9) 2.37 u. oslo (no, 61.1)(-8) 0.15 united nations u. helsinki (fi, 10)(0) 0.4635 u. oslo (no, 61.1)(-11) 2.36 cepremap paris (fr, 15.7)(-5) 0.15 inra rennes (fr, 21)(+75) 0.4536 u. catholic (po, 15)(+34) 2.25 fedea madrid (sp, 9)(+25) 0.15 u. evry (fr, 15)(+186) 0.4537 bar ilan u. (is, 39)(-19) 2.19 norw. sch. man. sandvika (no, 20.7)(+40) 0.14 birkbeck col. london (uk, 28.4)(0) 0.4438 u. essex (uk, 69)(+4) 2.10 u. alicante (sp, 31)(+22) 0.14 inra dijon (fr, 21)(+227) 0.4339 u. lille 2 (fr, 9.8)(+107) 2.08 u. essex (uk, 69)(+12) 0.13 u. crete (gr, 25)(+62) 0.4340 ossietzky u. oldenburg (ge, 7)(-11) 2.06 u. lausanne (swi, 17.4)(-9) 0.13 u. catholic (po, 15)(+14) 0.4241 swedish cent. bank riksbank (swe, 7)(+48) 2.04 u. beykent (tu, 13.1)(-4) 0.13 middlesex u. (uk, 17)(-4) 0.4242 u. lausanne (swi, 17.4)(+9) 2.02 u. college dublin (ir, 28)(-3) 0.12 u. nottingham (uk, 118)(+4) 0.4243 norw. sch. man. sandvika (no, 20.7)(+55) 2.00 u. birmingham (uk, 20.5)(+1) 0.12 u. littoral (fr, 13.8)(+131) 0.4244 u. cambridge (uk, 88)(-12) 1.99 u. cambridge (uk, 88)(-10) 0.12 gvt. valencia (sp, 7)(+17) 0.4245 u. nottingham (uk, 118)(+12) 1.99 ec polytechnique paris (fr, 20.3)(-20) 0.12 fond. enrico mattei milano (it, 10.7)(-13) 0.4046 u. sussex (uk, 60.5)(+1) 1.91 u. york (uk, 109)(-19) 0.11 u. oslo (no, 61.1)(-15) 0.4047 niesr london (uk, 25)(+35) 1.88 u. zurich (swi, 73.9)(+12) 0.11 u. tromso (no, 14.8)(+25) 0.4048 u. stockholm (swe, 81.8)(+10) 1.87 wilhelms u. bonn (ge, 82.3)(-13) 0.11 u. surrey (uk, 21)(-35) 0.4049 wilhelms u. bonn (ge, 82.3)(-5) 1.85 u. libre bruxelles (be, 99.1)(+9) 0.11 u. carlos iii madrid (sp, 38.8)(+59) 0.4050 united nations u. helsinki (fi, 10)(+14) 1.85 u. copenhagen (de, 58.3)(-10) 0.11 coripe (it, 9.6)(-35) 0.3951 u. copenhagen (de, 58.3)(-12) 1.84 freie u. berlin (ge, 63.5)(+13) 0.10 u. besancon (fr, 19)(-3) 0.3952 u. edinburgh (uk, 36.9)(-16) 1.83 u. catholique louvain (be, 134.6)(-17) 0.10 crest insee paris (fr, 52.3)(+2) 0.3953 u. wien (au, 52)(+4) 1.80 u. liverpool (uk, 21)(+56) 0.09 u. thessaly (gr, 9)(+128) 0.3954 u. surrey (uk, 21)(-28) 1.78 inra toulouse (fr, 15.5)(+53) 0.09 u. southampton (uk, 24.5)(-26) 0.3855 u. konstanz (ge, 31)(-20) 1.76 donau u. krems (au, 7)(-6) 0.09 royal swedish acad. of sc. (swe, 5)(+116) 0.3856 ceps bruxelles (be, 11)(+5) 1.74 banco de espana (sp, 12.5)(+6) 0.09 inra toulouse (fr, 15.5)(+92) 0.3857 u. birmingham (uk, 20.5)(-20) 1.70 u. carlos iii madrid (sp, 38.8)(+25) 0.09 u. gesamthochschule siegen (ge, 10.5)(+44) 0.3858 humboldt u. berlin (ge, 55)(+8) 1.68 u. catholic (po, 15)(+96) 0.08 u. birmingham (uk, 20.5)(-32) 0.3759 gvt. the netherlands (ne, 14)(+103) 1.68 u. st andrews (uk, 19.7)(-9) 0.08 inra nancy (fr, 5)(+238) 0.3760 u. pompeu fabra (sp, 111.4)(+32) 1.64 humboldt u. berlin (ge, 55)(+15) 0.08 guericke u. magdeburg (ge, 15.3)(+22) 0.3761 norw. u. tech. trondheim (no, 22.5)(+39) 1.61 goethe u. frankfurt (ge, 49.5)(-14) 0.08 hebrew u. jerusalem (is, 60.2)(-51) 0.3662 nhh bergen (no, 38.7)(-9) 1.61 ossietzky u. oldenburg (ge, 7)(-8) 0.08 norw. u. tech. trondheim (no, 22.5)(+48) 0.3663 u. gesamthochschule essen (ge, 7.5)(+4) 1.61 koc u. (tu, 47.5)(+44) 0.07 u. aberdeen (uk, 34.5)(+22) 0.3664 oxford u. (uk, 225.4)(-14) 1.54 u. paris 10 / cergy (fr, 122.9)(-4) 0.07 insead fontainebleau (fr, 43)(-9) 0.3665 u. evry (fr, 15)(+166) 1.54 u. paris cnam (fr, 8.3)(-18) 0.07 wilhelms u. bonn (ge, 82.3)(+6) 0.3666 athens u. (gr, 50)(-16) 1.54 ludwigs u. freiburg (ge, 8.8)(+31) 0.07 ceps bruxelles (be, 11)(-2) 0.3667 u. st andrews (uk, 19.7)(-27) 1.53 u. gesamthochschule essen (ge, 7.5)(+9) 0.07 esri dublin (ir, 26)(+10) 0.3568 katholieke u. leuven (be, 88.2)(+5) 1.53 u. konstanz (ge, 31)(-15) 0.07 u. exeter (uk, 35.5)(-9) 0.3569 guericke u. magdeburg (ge, 15.3)(+9) 1.52 athens u. (gr, 50)(-6) 0.07 u. sussex (uk, 60.5)(-22) 0.3570 u. catholique louvain (be, 134.6)(-14) 1.52 fame geneve (swi, 15.8)(-18) 0.06 u. copenhagen (de, 58.3)(-33) 0.3571 fond. enrico mattei milano (it, 10.7)(-9) 1.50 u. sabanci (tu, 5.5)(-17) 0.06 abo akademi u. (fi, 12)(+57) 0.3572 u. exeter (uk, 35.5)(-7) 1.50 u. aix marseille 2 / 3 (fr, 132.5)(-16) 0.06 london business school (uk, 60.3)(+3) 0.3473 u. glasgow (uk, 53.5)(+32) 1.47 katholieke u. tilburg (ne, 214.8)(+5) 0.06 u. college london (uk, 67.9)(0) 0.3474 u. loughborough (uk, 19.5)(-24) 1.47 u. bologna (it, 162.8)(+71) 0.05 u. essex (uk, 69)(+6) 0.3475 u. york (uk, 109)(-27) 1.47 u. padova (it, 58.5)(+26) 0.05 hec paris (fr, 16.5)(+45) 0.34
5.3 1996-2000If the consideration of a long period of time allows to stand back and gives a good idea of the total humancapital located in each research centre, it is also relevant to know where more recent human capital islocated, which is the purpose of this section focusing on 1996-2000.Total Output. The first line of Table 11 indicates that the 195.4 current members of the London Schoolof Economics published 2,144.0 CLpn pages, which makes them first in Europe over 1996-2000. TheUniversité de Toulouse 1 is first in terms of Blue pages. Indeed, its 95.4 members have published 219.1Blue pages which is more than the 199.6 Blue pages of the London School of Economics. Finally, theLondon School of Economics is ranked first in the E1n ranking with 298.6 E1n publications.
In Table 11, centre names are typeset as in Table 9 depending on their variation in rank comparedto 1971-2000 (Table 7).
Table 11: European Centres, 1996-2000Name CLpn Name Blue Name E1n
1 london school of economics (uk, 195.4)(0) 2144.0 u. toulouse 1 (fr, 95.4)(+3) 219.1 london school of economics (uk, 195.4)(0) 298.62 u. toulouse 1 (fr, 95.4)(+1) 1705.4 london school of economics (uk, 195.4)(-1) 199.6 oxford u. (uk, 225.4)(0) 262.63 oxford u. (uk, 225.4)(-1) 1590.2 u. college london (uk, 67.9)(+4) 171.1 u. nottingham (uk, 118)(+2) 240.44 katholieke u. tilburg (ne, 214.8)(+2) 1361.4 oxford u. (uk, 225.4)(+1) 150.1 u. wales (uk, 302)(-1) 204.05 u. nottingham (uk, 118)(+5) 1137.3 tel aviv u. (is, 31.4)(-2) 118.2 u. toulouse 1 (fr, 95.4)(+1) 202.96 u. college london (uk, 67.9)(+7) 1076.2 hebrew u. jerusalem (is, 60.2)(-4) 112.6 katholieke u. tilburg (ne, 214.8)(+4) 195.57 stockholm sch. of eco. (swe, 304)(+8) 889.8 crest insee paris (fr, 52.3)(-1) 105.2 u. paris 1 (fr, 194.3)(0) 188.38 u. warwick (uk, 64.7)(-1) 871.9 u. pompeu fabra (sp, 111.4)(0) 99.1 u. reading (uk, 122.5)(+6) 186.89 u. catholique louvain (be, 134.6)(-1) 848.7 u. stockholm (swe, 81.8)(+5) 77.3 u. paris 10 / cergy (fr, 122.9)(+3) 170.510 u. york (uk, 109)(-1) 820.9 stockholm sch. of eco. (swe, 304)(+9) 74.8 u. roma sapienza (it, 253.3)(-6) 169.611 u. cambridge (uk, 88)(0) 818.9 u. zurich (swi, 73.9)(+24) 62.2 u. bologna (it, 162.8)(-3) 168.012 crest insee paris (fr, 52.3)(+2) 791.5 u. bocconi (it, 205.1)(+16) 56.1 stockholm sch. of eco. (swe, 304)(+5) 151.913 hebrew u. jerusalem (is, 60.2)(-9) 780.8 ceras enpc paris (fr, 11.1)(+4) 54.5 u. catholique louvain (be, 134.6)(-2) 146.914 london business school (uk, 60.3)(+6) 743.2 european u. inst. firenze (it, 14.8)(+10) 54.0 u. york (uk, 109)(-2) 143.915 u. pompeu fabra (sp, 111.4)(+8) 732.0 u. york (uk, 109)(-5) 50.9 katholieke u. leuven (be, 88.2)(+1) 143.216 u. paris 1 (fr, 194.3)(0) 717.7 katholieke u. tilburg (ne, 214.8)(-1) 48.5 u. maastricht (ne, 176.2)(+5) 143.017 u. paris 10 / cergy (fr, 122.9)(0) 716.8 u. essex (uk, 69)(+16) 46.0 u. warwick (uk, 64.7)(-8) 138.818 u. essex (uk, 69)(+6) 712.4 u. warwick (uk, 64.7)(-6) 46.0 u. cambridge (uk, 88)(0) 134.519 u. oslo (no, 61.1)(-1) 711.1 wilhelms u. bonn (ge, 82.3)(-3) 45.7 u. aix marseille 2 / 3 (fr, 132.5)(+6) 121.420 katholieke u. leuven (be, 88.2)(+9) 682.9 u. catholique louvain (be, 134.6)(-11) 45.2 u. pompeu fabra (sp, 111.4)(+23) 119.9
continued on next page
12

continued from previous page
Name CLpn Name Blue Name E1n21 u. bocconi (it, 205.1)(+12) 677.2 delta ens paris (fr, 11.8)(-9) 42.2 u. college london (uk, 67.9)(+8) 119.122 wilhelms u. bonn (ge, 82.3)(-3) 660.3 u. college dublin (ir, 28)(+31) 40.5 wilhelms u. bonn (ge, 82.3)(+1) 118.323 u. maastricht (ne, 176.2)(-1) 657.4 london business school (uk, 60.3)(+9) 40.3 u. manchester (uk, 108)(+9) 116.924 u. wales (uk, 302)(-12) 655.5 u. mannheim (ge, 41.5)(+1) 39.1 u. oslo (no, 61.1)(0) 116.825 u. reading (uk, 122.5)(0) 647.8 u. copenhagen (de, 58.3)(+2) 35.5 vrije u. amsterdam (ne, 132.3)(+10) 114.726 u. amsterdam (ne, 182.3)(+10) 644.8 u. libre bruxelles (be, 99.1)(-1) 35.1 u. bocconi (it, 205.1)(-7) 114.127 u. bologna (it, 162.8)(+5) 630.2 u. aix marseille 2 / 3 (fr, 132.5)(-9) 34.4 u. valencia (sp, 319.5)(+23) 106.728 vrije u. amsterdam (ne, 132.3)(+9) 622.6 u. southampton (uk, 24.5)(+3) 33.5 maximilians u. munchen (ge, 34.9)(+9) 106.229 tel aviv u. (is, 31.4)(-24) 621.2 u. bologna (it, 162.8)(+27) 33.2 erasmus u. rotterdam (ne, 207.3)(+13) 100.330 u. stockholm (swe, 81.8)(-9) 602.6 u. nottingham (uk, 118)(+4) 31.3 u. east anglia (uk, 66.6)(+4) 97.831 u. aix marseille 2 / 3 (fr, 132.5)(-5) 597.6 u. cambridge (uk, 88)(-18) 29.5 u. sussex (uk, 60.5)(-3) 94.732 u. copenhagen (de, 58.3)(-1) 592.8 humboldt u. berlin (ge, 55)(+20) 28.9 u. copenhagen (de, 58.3)(-6) 93.733 erasmus u. rotterdam (ne, 207.3)(+5) 579.9 u. venezia foscari (it, 87.8)(+47) 28.2 crest insee paris (fr, 52.3)(+3) 93.234 maximilians u. munchen (ge, 34.9)(+6) 561.8 queen mary col. london (uk, 25.3)(+31) 27.8 u. essex (uk, 69)(-3) 93.135 u. mannheim (ge, 41.5)(-8) 533.5 erasmus u. rotterdam (ne, 207.3)(+10) 25.9 hebrew u. jerusalem (is, 60.2)(-20) 92.936 u. roma sapienza (it, 253.3)(-8) 512.4 u. alicante (sp, 31)(+38) 25.5 albrechts u. kiel (ge, 126)(-9) 91.137 u. manchester (uk, 108)(+9) 488.4 u. amsterdam (ne, 182.3)(+5) 24.9 u. amsterdam (ne, 182.3)(+15) 89.738 insead fontainebleau (fr, 43)(-8) 484.0 insead fontainebleau (fr, 43)(-15) 24.4 u. mannheim (ge, 41.5)(-8) 87.839 u. zurich (swi, 73.9)(+11) 472.1 koc u. (tu, 47.5)(+57) 23.9 u. stockholm (swe, 81.8)(-6) 87.540 u. sussex (uk, 60.5)(-6) 470.9 u. paris 1 (fr, 194.3)(+16) 23.7 u. konstanz (ge, 31)(+4) 87.241 humboldt u. berlin (ge, 55)(+7) 470.1 iae csic barcelona (sp, 12.1)(+7) 23.1 u. zurich (swi, 73.9)(-2) 86.442 u. wien (au, 52)(+5) 433.4 birkbeck col. london (uk, 28.4)(-6) 21.2 london business school (uk, 60.3)(-2) 80.143 birkbeck col. london (uk, 28.4)(+9) 426.5 u. wien (au, 52)(-12) 21.2 humboldt u. berlin (ge, 55)(+4) 80.044 ceras enpc paris (fr, 11.1)(+10) 419.4 israel ins. tec. technion (is, 7.5)(+50) 21.1 copenhagen bus. sch. (de, 160.5)(+4) 79.345 u. east anglia (uk, 66.6)(-6) 407.6 u. cagliari (it, 60.8)(+54) 20.4 city u. bus. sch. london (uk, 72)(+13) 72.846 u. carlos iii madrid (sp, 38.8)(+28) 407.3 u. roma sapienza (it, 253.3)(+30) 20.4 queen u. belfast (uk, 95)(+18) 71.347 european u. inst. firenze (it, 14.8)(+9) 397.6 city u. london (uk, 9.5)(+36) 20.1 bar ilan u. (is, 39)(-25) 70.748 queen mary col. london (uk, 25.3)(+31) 381.2 hec paris (fr, 16.5)(+42) 18.6 u. sankt gallen (swi, 131.1)(-7) 69.849 u. southampton (uk, 24.5)(0) 371.9 freie u. berlin (ge, 63.5)(-9) 17.3 tel aviv u. (is, 31.4)(-29) 67.250 leicester u. (uk, 45.5)(+3) 366.2 u. oslo (no, 61.1)(-30) 17.0 imperial col. london (uk, 42.5)(+16) 66.851 u. libre bruxelles (be, 99.1)(-8) 362.9 royal holloway london (uk, 16)(-1) 16.4 u. autonoma barcelona (sp, 99.5)(+29) 65.552 bar ilan u. (is, 39)(-17) 348.6 u. east anglia (uk, 66.6)(-8) 16.4 niesr london (uk, 25)(+56) 65.053 iae csic barcelona (sp, 12.1)(+40) 338.4 u. paris 10 / cergy (fr, 122.9)(-31) 16.0 leicester u. (uk, 45.5)(+14) 64.954 u. edinburgh (uk, 36.9)(-3) 332.8 u. valencia (sp, 319.5)(+17) 15.9 u. lille 1 / valenciennes (fr, 118)(+61) 64.455 u. alicante (sp, 31)(+46) 329.3 u. autonoma barcelona (sp, 99.5)(-14) 15.3 u. carlos iii madrid (sp, 38.8)(+45) 63.556 imperial col. london (uk, 42.5)(+6) 328.3 u. exeter (uk, 35.5)(+32) 14.1 birkbeck col. london (uk, 28.4)(+28) 63.257 u. sankt gallen (swi, 131.1)(+4) 313.4 maximilians u. munchen (ge, 34.9)(-5) 14.1 u. lund (swe, 247.1)(+3) 62.958 u. konstanz (ge, 31)(+2) 310.2 u. carlos iii madrid (sp, 38.8)(+20) 13.9 u. wien (au, 52)(-2) 62.759 u. valencia (sp, 319.5)(+23) 309.9 u. birmingham (uk, 20.5)(+20) 12.9 u. stirling (uk, 32)(+12) 62.060 u. lund (swe, 247.1)(-1) 301.0 norw. sch. man. sandvika (no, 20.7)(+51) 12.1 u. nice (fr, 67)(+12) 61.961 albrechts u. kiel (ge, 126)(-16) 298.0 bar ilan u. (is, 39)(-32) 12.1 u. pisa (it, 103)(+8) 60.862 u. exeter (uk, 35.5)(+7) 296.8 u. padova (it, 58.5)(+15) 11.7 aarhus u. (de, 47.2)(-7) 60.263 u. autonoma barcelona (sp, 99.5)(+7) 296.0 u. sassari (it, 20.8)(+74) 11.0 u. grenoble 2 (fr, 112)(+10) 60.064 u. uppsala (swe, 59)(+9) 291.3 u. helsinki (fi, 82.2)(+9) 10.9 u. torino (it, 121)(-18) 59.565 copenhagen bus. sch. (de, 160.5)(+10) 285.0 u. geneve (swi, 67.8)(-28) 10.1 insead fontainebleau (fr, 43)(-17) 58.366 nhh bergen (no, 38.7)(-9) 278.2 ben gurion u. (is, 19.5)(-45) 9.8 u. newcastle (uk, 88)(+19) 58.067 u. glasgow (uk, 53.5)(+4) 276.4 banco de espana (sp, 12.5)(+52) 9.8 u. edinburgh (uk, 36.9)(-13) 57.968 city u. bus. sch. london (uk, 72)(-10) 276.2 u. lund (swe, 247.1)(-29) 9.6 u. lyon 2 (fr, 71.5)(+36) 57.569 goethe u. frankfurt (ge, 49.5)(-5) 269.0 u. tromso (no, 14.8)(+58) 9.3 u. crete (gr, 25)(+77) 57.270 ben gurion u. (is, 19.5)(-26) 266.1 u. osnabruck (ge, 35)(+17) 9.2 bath u. (uk, 99)(-13) 56.971 delta ens paris (fr, 11.8)(-30) 254.6 u. innsbruck (au, 80)(+26) 8.9 u. cattolica sacro cuore (it, 120.8)(-12) 56.272 aarhus u. (de, 47.2)(-9) 253.3 u. bristol (uk, 38.2)(-18) 8.8 brunel u. (uk, 48.5)(+26) 56.273 royal holloway london (uk, 16)(+25) 250.4 goethe u. frankfurt (ge, 49.5)(-35) 8.7 u. uppsala (swe, 59)(+22) 55.374 u. bielefeld (ge, 30)(+25) 248.8 u. salerno (it, 74.3)(-11) 8.4 u. exeter (uk, 35.5)(+1) 55.175 u. bergen (no, 76.7)(-10) 246.5 u. liverpool (uk, 21)(+67) 8.4 u. strathclyde (uk, 41.5)(-30) 54.9
The comparison between 1971-2000 and 1996-2000 shows, on the one hand, a relative stability at thetop, and on the other hand, some impressive moves upward or downward. First, to illustrate stability,note that the London School of Economics has the same rank in two rankings and loses one rank in thethird (= ; -1 ; =), the change in the rankings of Oxford University are (-1 ; +1 ; =), and the Université deToulouse 1 (+1 ; +3 ; +1) benefits from upward trends. Changes in ranks of the Katholieke UniversiteitTilburg are (+2 ; -1 ; +4). Second, one can observe a series of larger upward movements: the Universityof Nottingham (+5 ; +4 ; +2), University College London (+7 ; +4 ; +8), the Stockholm School ofEconomics (+8 ; +9 ; +5). Third, the performance of some centres is relatively worse for 1996-2000 thanfor 1971-2000 for some rankings but stable for others, as for instance, for the University of Warwick(-1 ; -6 ; -8). This is an interesting pattern: despite a lower rank in both Blue and E1n rankings, itmaintains the same rank in the CLpn ranking, probably thanks to publications in very good but notBlue journals. The Université Catholique de Louvain (-1 ; -11 ; -2) is almost stable for CLpn and E1nbut experiences a significant drop in the Blue ranking, as for instance the University of York (-1 ; -5 ;-2) or the University of Cambridge (= ; -18 ; =). Fourth, among the top ranked centres for 1971-2000,some centres sustain a drop in all rankings: for instance, the Hebrew University of Jerusalem (-9 ; -4 ;-20) and Tel Aviv University (-24 ; -2 ; -29).Output per Member. Table 12 presents the European research centres ranked by total output permember over 1996-2000. The reading is similar to previous tables. On average, a member of Ceras,which has 11.1 members, produced between 1996 and 2000, 37.90 CLpn pages, 4.93 Blue pages and 3.58E1n articles.
Differences with the 1971-2000 period (Table 8) are indicated by the same font conventions as pre-viously. They appear to be larger in per member rankings than in corresponding total output rankings.For instance, ranking variations of the top most productive centres per member are: Ceras (+2 ; +2 ;+5), the Institut d’Anàlisi Econòmica (+10 ; +3 ; +31), the European University Institute (+2 ; +2 ;+10), the Israel Institute of Technology (+18 ; +13 ; +56), Delta (-3 ; -2 ; -6), Tel Aviv University (-5; -1 ; -24), the Université de Toulouse 1 (+4 ; +2 ; +1), Royal Holloway (+16 ; +1 ; +39), UniversityCollege London (+11 ; +5 ; +21), and the Ludwig Maximilians Universität, München (+11 ; -2 ; +12).Again, differences across production indexes is an indication of the publication strategy, or change ofstrategy, of the centres, oriented more or less towards quality or quantity.
Table 12: European Centres, per Member, 1996-2000Name CLpn Name Blue Name E1n
1 ceras enpc paris (fr, 11.1)(+2) 37.90 ceras enpc paris (fr, 11.1)(+2) 4.93 ceras enpc paris (fr, 11.1)(+5) 3.582 iae csic barcelona (sp, 12.1)(+10) 27.97 tel aviv u. (is, 31.4)(-1) 3.76 iae csic barcelona (sp, 12.1)(+31) 3.203 european u. inst. firenze (it, 14.8)(+2) 26.86 european u. inst. firenze (it, 14.8)(+2) 3.65 european u. inst. firenze (it, 14.8)(+10) 3.144 israel ins. tec. technion (is, 7.5)(+18) 21.70 delta ens paris (fr, 11.8)(-2) 3.56 maximilians u. munchen (ge, 34.9)(+12) 3.045 delta ens paris (fr, 11.8)(-3) 21.52 israel ins. tec. technion (is, 7.5)(+13) 2.82 ossietzky u. oldenburg (ge, 7)(+12) 2.936 tel aviv u. (is, 31.4)(-5) 19.77 u. college london (uk, 67.9)(+5) 2.52 cepremap paris (fr, 15.7)(-2) 2.877 u. toulouse 1 (fr, 95.4)(+4) 17.88 u. toulouse 1 (fr, 95.4)(+2) 2.30 u. konstanz (ge, 31)(+5) 2.818 city u. london (uk, 9.5)(+23) 16.19 city u. london (uk, 9.5)(+11) 2.12 cemfi madrid (sp, 10)(+12) 2.79
continued on next page
13

continued from previous page
Name CLpn Name Blue Name E1n9 maximilians u. munchen (ge, 34.9)(+11) 16.10 crest insee paris (fr, 52.3)(-2) 2.01 delta ens paris (fr, 11.8)(-6) 2.7810 u. college london (uk, 67.9)(+11) 15.85 iae csic barcelona (sp, 12.1)(+3) 1.91 u. loughborough (uk, 19.5)(-2) 2.6911 royal holloway london (uk, 16)(+16) 15.65 hebrew u. jerusalem (is, 60.2)(-7) 1.87 niesr london (uk, 25)(+38) 2.6012 cemfi madrid (sp, 10)(+3) 15.23 u. college dublin (ir, 28)(+27) 1.45 ben gurion u. (is, 19.5)(-7) 2.5513 u. southampton (uk, 24.5)(+1) 15.18 u. southampton (uk, 24.5)(+3) 1.37 u. tromso (no, 14.8)(+57) 2.5314 crest insee paris (fr, 52.3)(-1) 15.13 hec paris (fr, 16.5)(+28) 1.12 u. kent canterbury (uk, 12)(+4) 2.5115 queen mary col. london (uk, 25.3)(+23) 15.09 queen mary col. london (uk, 25.3)(+25) 1.10 city u. london (uk, 9.5)(+9) 2.5116 birkbeck col. london (uk, 28.4)(+7) 15.02 london school of economics (uk, 195.4)(-2) 1.02 u. surrey (uk, 21)(-6) 2.4817 icmb geneve (swi, 8.9)(-7) 14.63 royal holloway london (uk, 16)(+1) 1.02 swiss nat. bank (swi, 6.5)(+5) 2.4718 ben gurion u. (is, 19.5)(-11) 13.65 u. stockholm (swe, 81.8)(+13) 0.95 icmb geneve (swi, 8.9)(-4) 2.4019 u. warwick (uk, 64.7)(-10) 13.48 u. mannheim (ge, 41.5)(+1) 0.94 united nations u. helsinki (fi, 10)(+12) 2.3920 hebrew u. jerusalem (is, 60.2)(-16) 12.97 tech. u. dresden (ge, 6)(+17) 0.92 u. beykent (tu, 13.1)(+23) 2.3621 u. mannheim (ge, 41.5)(-5) 12.86 u. pompeu fabra (sp, 111.4)(+4) 0.89 banco de espana (sp, 12.5)(+3) 2.3422 ossietzky u. oldenburg (ge, 7)(+7) 12.56 u. zurich (swi, 73.9)(+36) 0.84 royal holloway london (uk, 16)(+39) 2.2923 london business school (uk, 60.3)(+5) 12.32 u. alicante (sp, 31)(+36) 0.82 u. crete (gr, 25)(+78) 2.2924 u. beykent (tu, 13.1)(+19) 11.99 banco de espana (sp, 12.5)(+35) 0.79 birkbeck col. london (uk, 28.4)(+13) 2.2325 banco de espana (sp, 12.5)(+8) 11.93 birkbeck col. london (uk, 28.4)(-2) 0.75 u. warwick (uk, 64.7)(-16) 2.1526 united nations u. helsinki (fi, 10)(+37) 11.68 u. warwick (uk, 64.7)(-11) 0.71 tel aviv u. (is, 31.4)(-24) 2.1427 u. oslo (no, 61.1)(-3) 11.63 london business school (uk, 60.3)(+14) 0.67 coripe (it, 9.6)(-11) 2.1428 cepremap paris (fr, 15.7)(-20) 11.33 oxford u. (uk, 225.4)(0) 0.67 u. toulouse 1 (fr, 95.4)(+1) 2.1329 insead fontainebleau (fr, 43)(-10) 11.26 u. essex (uk, 69)(+24) 0.67 u. mannheim (ge, 41.5)(-8) 2.1130 swedish cent. bank riksbank (swe, 7)(+59) 10.99 cemfi madrid (sp, 10)(-22) 0.66 gvt. valencia (sp, 7)(+28) 2.1131 london school of economics (uk, 195.4)(-14) 10.97 ludwigs u. freiburg (ge, 8.8)(+63) 0.64 giis geneva (swi, 5.3)(-30) 2.0732 u. kent canterbury (uk, 12)(-2) 10.69 u. tromso (no, 14.8)(+46) 0.63 queen mary col. london (uk, 25.3)(+35) 2.0633 u. alicante (sp, 31)(+55) 10.62 u. birmingham (uk, 20.5)(+11) 0.63 u. nottingham (uk, 118)(+11) 2.0434 u. carlos iii madrid (sp, 38.8)(+41) 10.49 u. copenhagen (de, 58.3)(+2) 0.61 israel ins. tec. technion (is, 7.5)(+56) 2.0035 u. surrey (uk, 21)(-9) 10.39 norw. sch. man. sandvika (no, 20.7)(+42) 0.58 inra rennes (fr, 21)(+76) 2.0036 u. essex (uk, 69)(+6) 10.32 ossietzky u. oldenburg (ge, 7)(+15) 0.58 u. durham (uk, 23.5)(+65) 1.9537 u. copenhagen (de, 58.3)(+2) 10.16 insead fontainebleau (fr, 43)(-16) 0.57 u. stirling (uk, 32)(+1) 1.9438 hec paris (fr, 16.5)(+21) 10.07 wilhelms u. bonn (ge, 82.3)(-5) 0.56 u. st andrews (uk, 19.7)(-13) 1.9339 u. konstanz (ge, 31)(-4) 10.01 u. sassari (it, 20.8)(+65) 0.53 u. besancon (fr, 19)(+9) 1.9340 swiss nat. bank (swi, 6.5)(-6) 9.81 humboldt u. berlin (ge, 55)(+34) 0.53 u. oslo (no, 61.1)(-10) 1.9141 u. nottingham (uk, 118)(+15) 9.64 icmb geneve (swi, 8.9)(-29) 0.52 iza bonn (ge, 12.3)(+70) 1.9142 norw. sch. man. sandvika (no, 20.7)(+56) 9.43 ben gurion u. (is, 19.5)(-36) 0.50 u. southampton (uk, 24.5)(-14) 1.8743 u. birmingham (uk, 20.5)(-6) 9.39 u. beykent (tu, 13.1)(-7) 0.50 u. lille 2 (fr, 9.8)(+99) 1.8244 u. cambridge (uk, 88)(-12) 9.31 koc u. (tu, 47.5)(+65) 0.50 u. littoral (fr, 13.8)(+128) 1.8245 niesr london (uk, 25)(+37) 9.26 u. york (uk, 109)(-18) 0.47 bar ilan u. (is, 39)(-38) 1.8146 u. catholic (po, 15)(+24) 9.06 u. st andrews (uk, 19.7)(+3) 0.41 norw. u. tech. trondheim (no, 22.5)(+64) 1.8147 u. edinburgh (uk, 36.9)(-11) 9.01 u. wien (au, 52)(-8) 0.41 crest insee paris (fr, 52.3)(+5) 1.7848 bar ilan u. (is, 39)(-30) 8.94 u. exeter (uk, 35.5)(+38) 0.40 guericke u. magdeburg (ge, 15.3)(+32) 1.7749 u. st andrews (uk, 19.7)(-9) 8.76 u. liverpool (uk, 21)(+61) 0.40 u. gesamthochschule essen (ge, 7.5)(-13) 1.7750 humboldt u. berlin (ge, 55)(+16) 8.55 maximilians u. munchen (ge, 34.9)(-3) 0.40 u. birmingham (uk, 20.5)(-24) 1.7651 giis geneva (swi, 5.3)(-45) 8.51 u. gesamthochschule essen (ge, 7.5)(+24) 0.40 u. college london (uk, 67.9)(+21) 1.7552 tech. u. dresden (ge, 6)(-27) 8.39 fedea madrid (sp, 9)(+7) 0.37 u. east london (uk, 11.5)(+51) 1.7353 u. exeter (uk, 35.5)(+11) 8.36 u. carlos iii madrid (sp, 38.8)(+25) 0.36 inra toulouse (fr, 15.5)(+94) 1.7354 u. wien (au, 52)(+3) 8.33 u. libre bruxelles (be, 99.1)(+1) 0.35 fond. enrico mattei milano (it, 10.7)(-22) 1.7255 u. bielefeld (ge, 30)(+26) 8.29 u. cambridge (uk, 88)(-23) 0.34 u. cantabria (sp, 13)(+144) 1.7256 fond. enrico mattei milano (it, 10.7)(+6) 8.08 u. catholique louvain (be, 134.6)(-21) 0.34 u. thessaly (gr, 9)(+122) 1.6757 leicester u. (uk, 45.5)(+3) 8.05 u. cagliari (it, 60.8)(+68) 0.33 tech. u. dresden (ge, 6)(-38) 1.6458 u. loughborough (uk, 19.5)(-9) 8.04 u. venezia foscari (it, 87.8)(+69) 0.32 eberhard karls u. (ge, 16.5)(-8) 1.6459 wilhelms u. bonn (ge, 82.3)(-15) 8.02 bar ilan u. (is, 39)(-36) 0.31 u. carlos iii madrid (sp, 38.8)(+45) 1.6360 coripe (it, 9.6)(+7) 8.00 donau u. krems (au, 7)(-12) 0.31 katholieke u. leuven (be, 88.2)(-9) 1.6261 u. sussex (uk, 60.5)(-14) 7.78 u. oslo (no, 61.1)(-35) 0.28 u. copenhagen (de, 58.3)(-27) 1.6162 katholieke u. leuven (be, 88.2)(+10) 7.75 u. bocconi (it, 205.1)(+38) 0.27 sirif glasgow (uk, 9.5)(+160) 1.6063 imperial col. london (uk, 42.5)(+5) 7.72 u. nottingham (uk, 118)(+18) 0.27 u. alicante (sp, 31)(+66) 1.6064 u. lille 2 (fr, 9.8)(+82) 7.55 freie u. berlin (ge, 63.5)(+2) 0.27 ceps bruxelles (be, 11)(-5) 1.5965 u. york (uk, 109)(-19) 7.53 u. aix marseille 2 / 3 (fr, 132.5)(-11) 0.26 sch. orient. afri. london (uk, 27.5)(-23) 1.5866 u. college dublin (ir, 28)(+18) 7.43 u. osnabruck (ge, 35)(+16) 0.26 sesrtcic ankara (tu, 6)(+176) 1.5867 eberhard karls u. (ge, 16.5)(+28) 7.40 u. tampere (fi, 22.5)(+63) 0.26 imperial col. london (uk, 42.5)(0) 1.5768 norw. u. tech. trondheim (no, 22.5)(+32) 7.37 u. catholic (po, 15)(+86) 0.25 u. edinburgh (uk, 36.9)(-29) 1.5769 u. stockholm (swe, 81.8)(-10) 7.37 u. east anglia (uk, 66.6)(+1) 0.25 u. sussex (uk, 60.5)(-22) 1.5770 u. durham (uk, 23.5)(+53) 7.30 stockholm sch. of eco. (swe, 304)(+32) 0.25 u. aberdeen (uk, 34.5)(+13) 1.5571 u. tromso (no, 14.8)(+43) 7.27 u. lausanne (swi, 17.4)(-41) 0.24 u. exeter (uk, 35.5)(-12) 1.5572 nhh bergen (no, 38.7)(-20) 7.19 u. bristol (uk, 38.2)(-17) 0.23 hebrew u. jerusalem (is, 60.2)(-62) 1.5473 oxford u. (uk, 225.4)(-23) 7.06 katholieke u. tilburg (ne, 214.8)(+3) 0.23 london school of economics (uk, 195.4)(-33) 1.5374 u. lausanne (swi, 17.4)(-23) 7.00 u. namur (be, 35.9)(+16) 0.22 u. cambridge (uk, 88)(-17) 1.5375 ec polytechnique paris (fr, 20.3)(-34) 6.93 bilkent u. (tu, 31.1)(+34) 0.21 u. reading (uk, 122.5)(+14) 1.52
Top 10 rankings. The size of research centres is very heterogeneous in Europe: large centres (withmore than 100 members) co-exist with small ones (10 members or even less). The total output and permember rankings shed complementary lights on the European situation (total output on the one side andlabour productivity on the other). Yet, we experienced that members of small centres feel total outputrankings unfair (production “necessarily” increases with size), while members of large centres feel theyare (unfairly) penalized by the per member rankings (they frequently dispute the number of researchersbelonging to their centre). In some sense, this is a further argument in favor of the use of both rankings.
A different approach, however, is to rank centres according to the production of the same number ofresearchers whatever the centre size. In this section we propose rankings based on the output of the 10most productive members of each center. At first, it is an odd choice: 10 researchers in a large centremight represent only a few percent of the members, while in a small centre it can amount to 100% ofthem. Yet, given the high concentration of publications, it can be a convenient way to sum up in a singlepicture the production of a center. Independently of its size, if these 10 members are very productive, acentre should be attractive. For instance, top economists would agree to give a seminar or lectures in acentre with 10 top colleagues, which in turn could attract good Ph.D. students.
The first line of Table 13 indicates that for each weighting scheme, the 10 highest publishers of theUniversité de Toulouse 1 constitute the first such team of 10 members in Europe. The number in thefirst bracket still gives the total number of researchers in the center. In the second bracket stands thepercentage of the total output of the centre achieved by the top 10 most productive researchers. Forinstance, the CLpn top 10 members published 73% of all the CLpn production of the Université deToulouse 1, the Blue top 10 members, 94% of the Blue output, and the E1n top 10, 60% of E1n output.The last brackets gives the variation in rank compared with the ranking based on the top 10 publishersof the center over 1971-2000 (see Combes and Linnemer (2002)).
Table 13: Top 10 rankings, 1996-2000Name CLpn Name Blue Name E1n
1 u. toulouse 1 (95.4)(73%)(0) 1244.7 u. toulouse 1 (95.4)(94%)(+1) 205.1 u. toulouse 1 (95.4)(60%)(+1) 121.82 london school of economics (195.4)(37%)(0) 799.0 u. college london (67.9)(89%)(+5) 152.0 u. nottingham (118)(44%)(+1) 105.33 u. college london (67.9)(73%)(+7) 782.7 london school of economics (195.4)(70%)(+1) 140.7 london school of economics (195.4)(33%)(-2) 100.04 oxford u. (225.4)(44%)(0) 691.9 oxford u. (225.4)(89%)(+1) 132.9 oxford u. (225.4)(33%)(+1) 86.75 katholieke u. tilburg (214.8)(46%)(+6) 626.7 tel aviv u. (31.4)(90%)(-4) 106.4 u. catholique louvain (134.6)(55%)(+3) 80.76 crest insee paris (52.3)(69%)(0) 548.0 crest insee paris (52.3)(99%)(0) 104.5 u. reading (122.5)(43%)(+6) 79.97 u. york (109)(65%)(0) 529.9 hebrew u. jerusalem (60.2)(92%)(-4) 104.0 u. bologna (162.8)(47%)(+9) 79.48 u. essex (69)(71%)(+13) 504.6 u. pompeu fabra (111.4)(98%)(0) 96.8 vrije u. amsterdam (132.3)(69%)(+27) 79.19 u. warwick (64.7)(57%)(-4) 496.4 u. stockholm (81.8)(100%)(+5) 77.3 u. college london (67.9)(65%)(+28) 77.410 u. pompeu fabra (111.4)(67%)(+7) 493.6 stockholm sch. of eco. (304)(100%)(+9) 74.8 katholieke u. tilburg (214.8)(39%)(+8) 76.1
continued on next page
14

continued from previous page
Name CLpn Name Blue Name E1n11 london business school (60.3)(66%)(+7) 489.8 u. zurich (73.9)(100%)(+23) 62.2 u. york (109)(52%)(-2) 74.812 u. nottingham (118)(42%)(+3) 482.6 u. bocconi (205.1)(100%)(+16) 56.1 u. wales (302)(36%)(-5) 73.813 u. catholique louvain (134.6)(57%)(-5) 480.8 ceras enpc paris (11.1)(100%)(+2) 54.5 katholieke u. leuven (88.2)(51%)(+13) 73.514 hebrew u. jerusalem (60.2)(61%)(-5) 476.4 european u. inst. firenze (14.8)(100%)(+10) 54.0 u. zurich (73.9)(85%)(+1) 73.015 stockholm sch. of eco. (304)(54%)(+7) 476.2 u. york (109)(100%)(-6) 50.9 maximilians u. munchen (34.9)(69%)(+9) 72.816 u. amsterdam (182.3)(74%)(+13) 474.9 u. warwick (64.7)(100%)(-4) 46.0 u. konstanz (31)(76%)(+26) 66.517 u. bocconi (205.1)(69%)(+26) 464.0 u. essex (69)(100%)(+18) 45.9 u. aix marseille 2 / 3 (132.5)(55%)(+22) 66.318 tel aviv u. (31.4)(73%)(-15) 455.9 wilhelms u. bonn (82.3)(100%)(-1) 45.7 stockholm sch. of eco. (304)(43%)(+4) 65.819 erasmus u. rotterdam (207.3)(77%)(+25) 444.1 katholieke u. tilburg (214.8)(94%)(-3) 45.4 wilhelms u. bonn (82.3)(55%)(-9) 65.620 u. oslo (61.1)(62%)(-1) 443.1 u. catholique louvain (134.6)(99%)(-10) 44.9 u. cambridge (88)(49%)(-1) 65.421 u. stockholm (81.8)(73%)(-5) 440.7 delta ens paris (11.8)(100%)(-10) 42.2 u. paris 10 / cergy (122.9)(38%)(-1) 64.922 u. zurich (73.9)(91%)(+8) 430.9 u. college dublin (28)(100%)(+31) 40.5 erasmus u. rotterdam (207.3)(64%)(+33) 64.223 wilhelms u. bonn (82.3)(64%)(-11) 424.1 london business school (60.3)(100%)(+9) 40.3 u. warwick (64.7)(46%)(-17) 63.524 vrije u. amsterdam (132.3)(68%)(+18) 421.6 u. mannheim (41.5)(100%)(+1) 39.1 u. oslo (61.1)(54%)(-3) 63.225 ceras enpc paris (11.1)(100%)(+8) 419.3 u. copenhagen (58.3)(100%)(+2) 35.5 u. pompeu fabra (111.4)(52%)(+28) 62.526 u. aix marseille 2 / 3 (132.5)(69%)(-3) 410.8 u. libre bruxelles (99.1)(100%)(0) 35.1 niesr london (25)(96%)(+54) 62.227 u. cambridge (88)(49%)(-13) 402.1 u. aix marseille 2 / 3 (132.5)(100%)(-9) 34.4 imperial col. london (42.5)(91%)(+16) 60.828 humboldt u. berlin (55)(84%)(+8) 395.2 u. southampton (24.5)(100%)(+3) 33.5 humboldt u. berlin (55)(75%)(+17) 59.829 european u. inst. firenze (14.8)(99%)(+11) 393.8 u. bologna (162.8)(100%)(+28) 33.2 u. roma sapienza (253.3)(35%)(-16) 59.030 maximilians u. munchen (34.9)(69%)(+1) 387.8 u. nottingham (118)(100%)(+3) 31.3 u. mannheim (41.5)(67%)(-13) 58.831 u. copenhagen (58.3)(65%)(-4) 382.7 u. cambridge (88)(100%)(-18) 29.5 crest insee paris (52.3)(62%)(-2) 57.532 insead fontainebleau (43)(79%)(-8) 382.6 humboldt u. berlin (55)(100%)(+20) 28.9 u. amsterdam (182.3)(64%)(+27) 57.533 u. mannheim (41.5)(71%)(-20) 380.3 u. venezia foscari (87.8)(100%)(+47) 28.2 u. bocconi (205.1)(50%)(-3) 57.334 u. wien (52)(88%)(+1) 380.3 queen mary col. london (25.3)(100%)(+31) 27.8 u. paris 1 (194.3)(30%)(-6) 56.935 u. bologna (162.8)(59%)(+21) 374.6 erasmus u. rotterdam (207.3)(100%)(+10) 25.9 u. essex (69)(61%)(-1) 56.736 katholieke u. leuven (88.2)(55%)(+9) 372.4 u. alicante (31)(100%)(+38) 25.5 u. maastricht (176.2)(39%)(-4) 56.437 birkbeck col. london (28.4)(87%)(+11) 368.9 u. amsterdam (182.3)(100%)(+5) 24.9 u. stirling (32)(89%)(+10) 55.438 iae csic barcelona (12.1)(100%)(+37) 338.3 insead fontainebleau (43)(100%)(-15) 24.4 u. sankt gallen (131.1)(79%)(-2) 55.339 u. paris 10 / cergy (122.9)(47%)(-13) 334.0 koc u. (47.5)(100%)(+57) 23.9 u. crete (25)(95%)(+94) 54.240 queen mary col. london (25.3)(86%)(+38) 327.9 u. paris 1 (194.3)(100%)(+16) 23.7 u. copenhagen (58.3)(57%)(-15) 53.441 u. maastricht (176.2)(48%)(-4) 318.1 iae csic barcelona (12.1)(100%)(+7) 23.1 aarhus u. (47.2)(88%)(0) 53.242 imperial col. london (42.5)(96%)(+9) 314.4 u. wien (52)(100%)(-12) 21.2 birkbeck col. london (28.4)(83%)(+27) 52.843 u. southampton (24.5)(84%)(-5) 313.1 birkbeck col. london (28.4)(100%)(-7) 21.2 u. east anglia (66.6)(53%)(+1) 51.844 u. paris 1 (194.3)(42%)(+5) 304.5 israel ins. tec. technion (7.5)(100%)(+51) 21.1 u. stockholm (81.8)(58%)(-17) 50.445 u. reading (122.5)(46%)(-4) 295.5 u. roma sapienza (253.3)(100%)(+30) 20.4 u. macedonia (47)(92%)(+80) 50.346 leicester u. (45.5)(81%)(+7) 295.3 u. cagliari (60.8)(100%)(+53) 20.4 brunel u. (48.5)(88%)(+31) 49.447 u. libre bruxelles (99.1)(80%)(-13) 291.9 city u. london (9.5)(100%)(+36) 20.1 u. exeter (35.5)(89%)(+9) 49.248 u. edinburgh (36.9)(86%)(+4) 287.5 hec paris (16.5)(100%)(+42) 18.6 city u. bus. sch. london (72)(67%)(+23) 49.049 u. sankt gallen (131.1)(90%)(+8) 282.6 freie u. berlin (63.5)(100%)(-9) 17.3 u. loughborough (19.5)(93%)(+3) 48.850 u. east anglia (66.6)(69%)(-4) 281.9 u. oslo (61.1)(100%)(-29) 17.0 london business school (60.3)(60%)(-12) 48.251 u. alicante (31)(83%)(+49) 272.7 royal holloway london (16)(100%)(-1) 16.4 u. sussex (60.5)(51%)(-28) 48.152 u. carlos iii madrid (38.8)(66%)(+36) 270.6 u. east anglia (66.6)(100%)(-8) 16.4 u. strathclyde (41.5)(87%)(-19) 47.953 u. exeter (35.5)(91%)(+11) 270.5 u. paris 10 / cergy (122.9)(100%)(-31) 16.0 leicester u. (45.5)(73%)(+23) 47.754 u. sussex (60.5)(56%)(-15) 264.2 u. valencia (319.5)(100%)(+17) 15.9 hebrew u. jerusalem (60.2)(51%)(-40) 47.355 u. wales (302)(39%)(-30) 258.2 u. autonoma barcelona (99.5)(100%)(-14) 15.3 tel aviv u. (31.4)(70%)(-51) 47.156 delta ens paris (11.8)(100%)(-36) 254.6 u. exeter (35.5)(100%)(+32) 14.1 u. wien (52)(75%)(-8) 47.057 u. konstanz (31)(82%)(+5) 252.9 maximilians u. munchen (34.9)(100%)(-6) 14.1 insead fontainebleau (43)(80%)(-8) 46.858 ben gurion u. (19.5)(95%)(-30) 252.7 u. carlos iii madrid (38.8)(100%)(+20) 13.9 u. surrey (21)(89%)(-4) 46.359 nhh bergen (38.7)(90%)(-5) 249.4 u. birmingham (20.5)(100%)(+20) 12.9 albrechts u. kiel (126)(50%)(-28) 45.760 royal holloway london (16)(99%)(+21) 248.4 bar ilan u. (39)(100%)(-31) 12.1 ben gurion u. (19.5)(92%)(-20) 45.661 goethe u. frankfurt (49.5)(91%)(-1) 244.9 norw. sch. man. sandvika (20.7)(100%)(+50) 12.1 nhh bergen (38.7)(84%)(+1) 45.062 u. uppsala (59)(83%)(+12) 243.1 u. padova (58.5)(100%)(+15) 11.7 u. edinburgh (36.9)(78%)(-12) 44.963 bar ilan u. (39)(69%)(-31) 239.2 u. sassari (20.8)(100%)(+74) 11.0 u. pisa (103)(73%)(+12) 44.564 u. bielefeld (30)(96%)(+25) 239.0 u. helsinki (82.2)(100%)(+9) 10.9 u. manchester (108)(38%)(-3) 44.165 aarhus u. (47.2)(92%)(-10) 233.1 u. geneve (67.8)(100%)(-28) 10.1 european u. inst. firenze (14.8)(95%)(+30) 44.066 u. roma sapienza (253.3)(45%)(+3) 231.0 banco de espana (12.5)(100%)(+52) 9.8 bar ilan u. (39)(62%)(-55) 43.967 niesr london (25)(96%)(+42) 221.5 ben gurion u. (19.5)(100%)(-47) 9.8 queen mary col. london (25.3)(84%)(+56) 43.668 brunel u. (48.5)(92%)(+31) 221.3 u. lund (247.1)(100%)(-29) 9.6 u. aberdeen (34.5)(81%)(+14) 43.369 u. manchester (108)(45%)(-3) 219.7 u. tromso (14.8)(100%)(+58) 9.3 u. uppsala (59)(78%)(+37) 43.370 u. strathclyde (41.5)(92%)(-20) 218.5 u. osnabruck (35)(100%)(+17) 9.2 u. durham (23.5)(94%)(+69) 43.171 u. glasgow (53.5)(75%)(0) 207.3 u. innsbruck (80)(100%)(+26) 8.9 u. lille 1 / valenciennes (118)(66%)(+85) 42.472 u. autonoma barcelona (99.5)(70%)(+10) 206.1 u. bristol (38.2)(100%)(-18) 8.8 queen u. belfast (95)(59%)(+6) 42.273 u. bergen (76.7)(82%)(-10) 201.8 goethe u. frankfurt (49.5)(100%)(-35) 8.7 copenhagen bus. sch. (160.5)(53%)(-9) 42.074 u. surrey (21)(91%)(-6) 198.8 u. salerno (74.3)(100%)(-10) 8.4 cepremap paris (15.7)(93%)(-23) 41.675 u. namur (35.9)(99%)(+30) 198.2 u. wales (302)(100%)(-20) 8.4 u. libre bruxelles (99.1)(73%)(-17) 40.1
In contrast with per member rankings, large centres maintain a high position in top 10 ones. Forexample, the London School of Economics is second in the top 10 CLpn ranking while first in the totaloutput ranking and 31 in the per member ranking. On the other hand, small centres may have a betterrank in top 10 rankings than in total output ones. Ceras moves from rank 44 (total CLpn output) upto 25 (top 10 CLpn) but not up to 1 as in the per member ranking. Similar variations occur for theEuropean University Institute and the Iae Csic for instance.
The percentage of the centre total output realized by the top 10 members gives an idea of theconcentration of production inside each center. The smaller the centre, the higher the share of the top10 members in general but some differences may be observed. For example, the top 10 members of theUniversity of Essex (69 members) produced 71% of the centre CLpn production while the top 10 groupof the University of Warwick (64.7 members) represent (only) 57% of the centre production. In termsof Blue, the concentration of the production in the top 10 is striking: in most of the European centresthe top 10 members produced close to 100% of the Blue output. The lowest concentration is observed atthe London School of Economics where the top 10 counts for 70% of the total Blue production.Country rankings and Geographical Output Distribution. This section temporarily turns fromthe centre point of view to adopt a more geographical perspective.
First, production of research articles is compared at the country level. As shown by Table 14, theU.K. has the highest production in Europe. The 3,538.1 U.K. researchers published between 1996 and2000, 20,593.5 CL-pages, 998.5 Blue pages and 4,066.90 E1n articles. France stands second and Italythird, this country hierarchy being independent of the index chosen.
The font conventions introduced for table 9 are followed here, and the points of comparison are the1971-2000 rankings (see Combes and Linnemer (2002)). At the country level, differences between 1971-2000 rankings and 1996-2000 ones are quite small. Ranks are either the same or change by one place.The only significant change concerns Israel (-3;-1;-4) which regressed according to all three indexes thoughless for Blue.
Country rankings are different once production per member is considered, which is presented inTable 15 for 1996-2000. Israel, first for all three production measures, ranks much higher than in totaloutput, while the U.K., second, does not regress by much. Other small countries as Belgium, Norway,Ireland, or Greece (for E1n only) also have higher ranks, while larger ones, as for instance France, Spain,or Italy are worse ranked.
We finally study the spatial concentration within European countries, at the regional level (where the
15
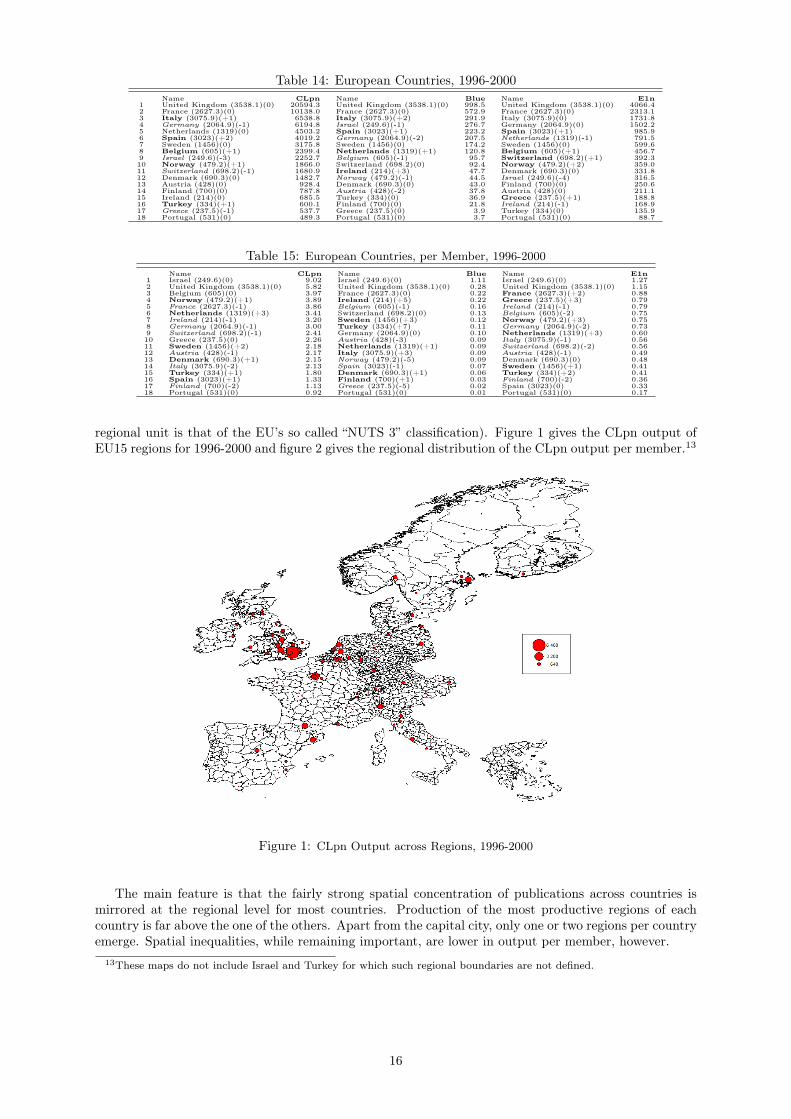
Table 14: European Countries, 1996-2000Name CLpn Name Blue Name E1n
1 United Kingdom (3538.1)(0) 20594.3 United Kingdom (3538.1)(0) 998.5 United Kingdom (3538.1)(0) 4066.42 France (2627.3)(0) 10138.0 France (2627.3)(0) 572.9 France (2627.3)(0) 2313.13 Italy (3075.9)(+1) 6538.8 Italy (3075.9)(+2) 291.9 Italy (3075.9)(0) 1731.84 Germany (2064.9)(-1) 6194.8 Israel (249.6)(-1) 276.7 Germany (2064.9)(0) 1502.25 Netherlands (1319)(0) 4503.2 Spain (3023)(+1) 223.2 Spain (3023)(+1) 985.96 Spain (3023)(+2) 4019.2 Germany (2064.9)(-2) 207.5 Netherlands (1319)(-1) 791.57 Sweden (1456)(0) 3175.8 Sweden (1456)(0) 174.2 Sweden (1456)(0) 599.68 Belgium (605)(+1) 2399.4 Netherlands (1319)(+1) 120.8 Belgium (605)(+1) 456.79 Israel (249.6)(-3) 2252.7 Belgium (605)(-1) 95.7 Switzerland (698.2)(+1) 392.310 Norway (479.2)(+1) 1866.0 Switzerland (698.2)(0) 92.4 Norway (479.2)(+2) 359.011 Switzerland (698.2)(-1) 1680.9 Ireland (214)(+3) 47.7 Denmark (690.3)(0) 331.812 Denmark (690.3)(0) 1482.7 Norway (479.2)(-1) 44.5 Israel (249.6)(-4) 316.513 Austria (428)(0) 928.4 Denmark (690.3)(0) 43.0 Finland (700)(0) 250.614 Finland (700)(0) 787.8 Austria (428)(-2) 37.8 Austria (428)(0) 211.115 Ireland (214)(0) 685.5 Turkey (334)(0) 36.9 Greece (237.5)(+1) 188.816 Turkey (334)(+1) 600.1 Finland (700)(0) 21.8 Ireland (214)(-1) 168.917 Greece (237.5)(-1) 537.7 Greece (237.5)(0) 3.9 Turkey (334)(0) 135.918 Portugal (531)(0) 489.3 Portugal (531)(0) 3.7 Portugal (531)(0) 88.7
Table 15: European Countries, per Member, 1996-2000Name CLpn Name Blue Name E1n
1 Israel (249.6)(0) 9.02 Israel (249.6)(0) 1.11 Israel (249.6)(0) 1.272 United Kingdom (3538.1)(0) 5.82 United Kingdom (3538.1)(0) 0.28 United Kingdom (3538.1)(0) 1.153 Belgium (605)(0) 3.97 France (2627.3)(0) 0.22 France (2627.3)(+2) 0.884 Norway (479.2)(+1) 3.89 Ireland (214)(+5) 0.22 Greece (237.5)(+3) 0.795 France (2627.3)(-1) 3.86 Belgium (605)(-1) 0.16 Ireland (214)(-1) 0.796 Netherlands (1319)(+3) 3.41 Switzerland (698.2)(0) 0.13 Belgium (605)(-2) 0.757 Ireland (214)(-1) 3.20 Sweden (1456)(+3) 0.12 Norway (479.2)(+3) 0.758 Germany (2064.9)(-1) 3.00 Turkey (334)(+7) 0.11 Germany (2064.9)(-2) 0.739 Switzerland (698.2)(-1) 2.41 Germany (2064.9)(0) 0.10 Netherlands (1319)(+3) 0.6010 Greece (237.5)(0) 2.26 Austria (428)(-3) 0.09 Italy (3075.9)(-1) 0.5611 Sweden (1456)(+2) 2.18 Netherlands (1319)(+1) 0.09 Switzerland (698.2)(-2) 0.5612 Austria (428)(-1) 2.17 Italy (3075.9)(+3) 0.09 Austria (428)(-1) 0.4913 Denmark (690.3)(+1) 2.15 Norway (479.2)(-5) 0.09 Denmark (690.3)(0) 0.4814 Italy (3075.9)(-2) 2.13 Spain (3023)(-1) 0.07 Sweden (1456)(+1) 0.4115 Turkey (334)(+1) 1.80 Denmark (690.3)(+1) 0.06 Turkey (334)(+2) 0.4116 Spain (3023)(+1) 1.33 Finland (700)(+1) 0.03 Finland (700)(-2) 0.3617 Finland (700)(-2) 1.13 Greece (237.5)(-5) 0.02 Spain (3023)(0) 0.3318 Portugal (531)(0) 0.92 Portugal (531)(0) 0.01 Portugal (531)(0) 0.17
regional unit is that of the EU’s so called “NUTS 3” classification). Figure 1 gives the CLpn output ofEU15 regions for 1996-2000 and figure 2 gives the regional distribution of the CLpn output per member.13
Figure 1: CLpn Output across Regions, 1996-2000
The main feature is that the fairly strong spatial concentration of publications across countries ismirrored at the regional level for most countries. Production of the most productive regions of eachcountry is far above the one of the others. Apart from the capital city, only one or two regions per countryemerge. Spatial inequalities, while remaining important, are lower in output per member, however.
13These maps do not include Israel and Turkey for which such regional boundaries are not defined.
16
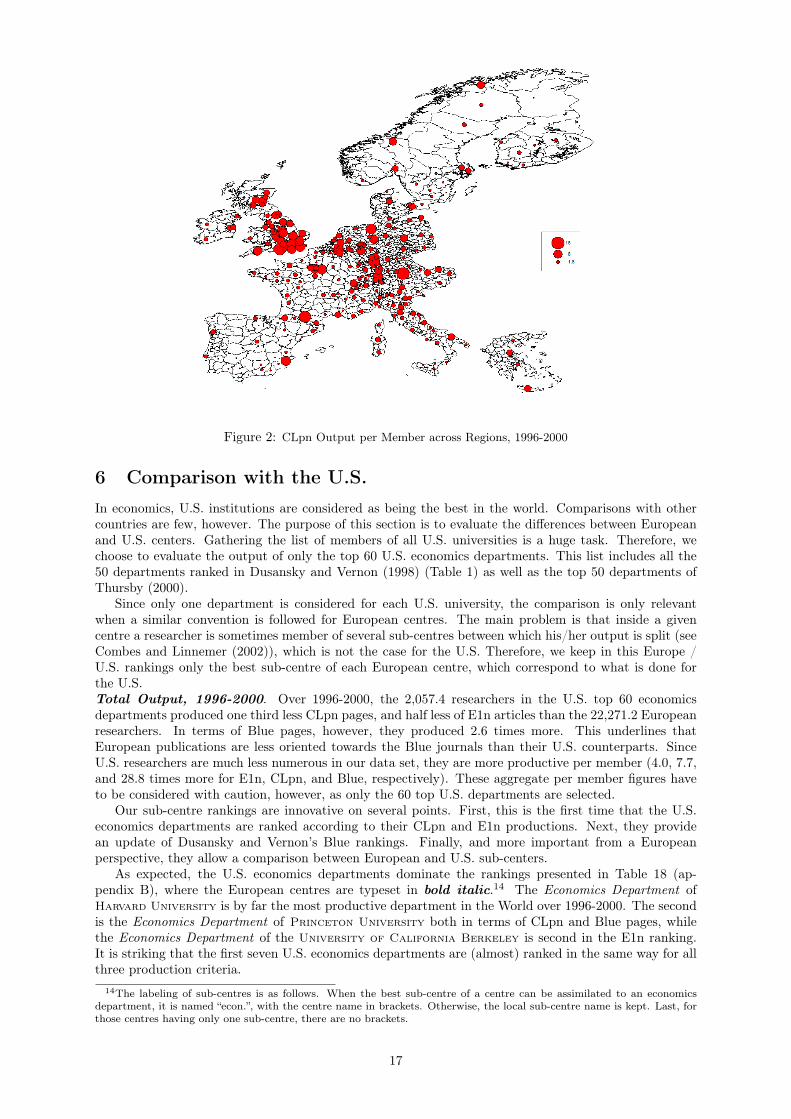
Figure 2: CLpn Output per Member across Regions, 1996-2000
6 Comparison with the U.S.In economics, U.S. institutions are considered as being the best in the world. Comparisons with othercountries are few, however. The purpose of this section is to evaluate the differences between Europeanand U.S. centers. Gathering the list of members of all U.S. universities is a huge task. Therefore, wechoose to evaluate the output of only the top 60 U.S. economics departments. This list includes all the50 departments ranked in Dusansky and Vernon (1998) (Table 1) as well as the top 50 departments ofThursby (2000).
Since only one department is considered for each U.S. university, the comparison is only relevantwhen a similar convention is followed for European centres. The main problem is that inside a givencentre a researcher is sometimes member of several sub-centres between which his/her output is split (seeCombes and Linnemer (2002)), which is not the case for the U.S. Therefore, we keep in this Europe /U.S. rankings only the best sub-centre of each European centre, which correspond to what is done forthe U.S.Total Output, 1996-2000. Over 1996-2000, the 2,057.4 researchers in the U.S. top 60 economicsdepartments produced one third less CLpn pages, and half less of E1n articles than the 22,271.2 Europeanresearchers. In terms of Blue pages, however, they produced 2.6 times more. This underlines thatEuropean publications are less oriented towards the Blue journals than their U.S. counterparts. SinceU.S. researchers are much less numerous in our data set, they are more productive per member (4.0, 7.7,and 28.8 times more for E1n, CLpn, and Blue, respectively). These aggregate per member figures haveto be considered with caution, however, as only the 60 top U.S. departments are selected.
Our sub-centre rankings are innovative on several points. First, this is the first time that the U.S.economics departments are ranked according to their CLpn and E1n productions. Next, they providean update of Dusansky and Vernon’s Blue rankings. Finally, and more important from a Europeanperspective, they allow a comparison between European and U.S. sub-centers.
As expected, the U.S. economics departments dominate the rankings presented in Table 18 (ap-pendix B), where the European centres are typeset in bold italic.14 The Economics Department ofHarvard University is by far the most productive department in the World over 1996-2000. The secondis the Economics Department of Princeton University both in terms of CLpn and Blue pages, whilethe Economics Department of the University of California Berkeley is second in the E1n ranking.It is striking that the first seven U.S. economics departments are (almost) ranked in the same way for allthree production criteria.
14The labeling of sub-centres is as follows. When the best sub-centre of a centre can be assimilated to an economicsdepartment, it is named “econ.”, with the centre name in brackets. Otherwise, the local sub-centre name is kept. Last, forthose centres having only one sub-centre, there are no brackets.
17

According to the CLpn ranking, the first European sub-centre (Gremaq belonging to the Universitéde Toulouse 1) is 9th. In terms of Blue, the Gremaq is also the first European sub-centre, but 15U.S. economics departments produced more. Finally, when production is measured in terms of E1npublications, the European sub-centres perform better. In particular, the Economics Department ofOxford University is ranked 4th. The number of members of the Economics Department of OxfordUniversity is, however, larger than the usual size of a U.S. economics department. Finally, note that therankings of European sub-centres are relatively close to those of their corresponding European centers.Output per member, 1996-2000. Table 19 (appendix B) reports the CLpn, Blue and E1n rankingsper member for 1996-2000. Impressively, the Economics Department of Harvard University is stillat the top for all three rankings. A series of relatively small European departments have high ranksaccording to CLpn and E1n. For instance, the Economics Department of the European UniversityInstitute is respectively (3rd ; 43th ; 2nd), Ceras (which is its own centre) is (6th ; 20th ; 9th), and theEconomics Department of University College London is (12th ; 14th ; 15th).15
7 ConclusionsIn the longer version of this paper (Combes and Linnemer (2002)), we report many other rankings basedon other production indexes and other ways to truncate centres (considering only the top 10 or top 5%best researchers in the centre, or, on the contrary, excluding them). All rankings are extended to the top150 centres and sub-centres. It is difficult to summarize all of this information and we are convinced thata single ranking could not do the job. Each ranking sheds a different light on the relative performanceof the research centers. In particular, European centres present a great variety in the number of theirmembers, which makes it essential to compare rankings by both total output and output per member.Second, considering differences in journal quality is also necessary, but the use of different weightingschemes underlines differences in centre output. Last, the study of production over different periods oftime gives information in terms of the centre dynamics.
If, still, one wants a summary of our results in one single table, it is given in Table 16. The 75 mostproductive European centres over the last five years are ranked according to the mean of their rank interms of total and per member output (which is the figure given in the table), for three indexes, CLpn,Blue, and E1n. As previously, centres in bold progress between 1971-2000 and 1996-2000, those in italicsregress, and those in normal font do not move (of more than 2 ranks), the rank variation being givenbetween the last brackets.
Table 16: European Centres, Total and per Member Mean Ranks, 1996-2000Name CLpn Name Blue Name E1n
1 u. toulouse 1 (fr, 95.4)(+2) 4.5 tel aviv u. (is, 31.4)(0) 3.5 maximilians u. munchen (ge, 34.9)(+8) 16.02 u. college london (uk, 67.9)(+5) 8.0 u. toulouse 1 (fr, 95.4)(+1) 4.0 u. toulouse 1 (fr, 95.4)(+3) 16.53 crest insee paris (fr, 52.3)(+3) 13.0 u. college london (uk, 67.9)(+4) 4.5 u. nottingham (uk, 118)(+4) 18.04 u. warwick (uk, 64.7)(0) 13.5 ceras enpc paris (fr, 11.1)(+4) 7.0 u. warwick (uk, 64.7)(-3) 21.05 london school of economics (uk, 195.4)(0) 16.0 crest insee paris (fr, 52.3)(-1) 8.0 u. konstanz (ge, 31)(+6) 23.56 hebrew u. jerusalem (is, 60.2)(-4) 16.5 hebrew u. jerusalem (is, 60.2)(-4) 8.5 niesr london (uk, 25)(+50) 31.57 tel aviv u. (is, 31.4)(-6) 17.5 european u. inst. firenze (it, 14.8)(+4) 8.5 u. oslo (no, 61.1)(+3) 32.08 london business school (uk, 60.3)(+4) 18.5 london school of economics (uk, 195.4)(-2) 9.0 u. mannheim (ge, 41.5)(0) 33.59 maximilians u. munchen (ge, 34.9)(+10) 21.5 delta ens paris (fr, 11.8)(-4) 12.5 u. college london (uk, 67.9)(+20) 36.010 ceras enpc paris (fr, 11.1)(+8) 22.5 u. stockholm (swe, 81.8)(+8) 13.5 london school of economics (uk, 195.4)(-4) 37.011 u. oslo (no, 61.1)(-3) 23.0 u. pompeu fabra (sp, 111.4)(+2) 14.5 tel aviv u. (is, 31.4)(-9) 37.512 u. nottingham (uk, 118)(+13) 23.0 oxford u. (uk, 225.4)(0) 15.5 katholieke u. leuven (be, 88.2)(+2) 37.513 european u. inst. firenze (it, 14.8)(+7) 25.0 u. zurich (swi, 73.9)(+29) 16.5 birkbeck col. london (uk, 28.4)(+26) 40.014 u. essex (uk, 69)(+10) 27.0 u. college dublin (ir, 28)(+26) 17.0 crest insee paris (fr, 52.3)(+10) 40.015 u. cambridge (uk, 88)(-6) 27.5 u. southampton (uk, 24.5)(+6) 20.5 u. reading (uk, 122.5)(+16) 41.516 iae csic barcelona (sp, 12.1)(+23) 27.5 u. warwick (uk, 64.7)(-7) 21.5 u. cambridge (uk, 88)(0) 45.517 u. mannheim (ge, 41.5)(-6) 28.0 u. mannheim (ge, 41.5)(+2) 21.5 u. crete (gr, 25)(+96) 45.518 birkbeck col. london (uk, 28.4)(+9) 29.5 u. essex (uk, 69)(+19) 22.0 bar ilan u. (is, 39)(-14) 46.019 u. southampton (uk, 24.5)(+2) 31.0 israel ins. tec. technion (is, 7.5)(+33) 24.5 u. copenhagen (de, 58.3)(-6) 46.520 queen mary col. london (uk, 25.3)(+26) 31.5 queen mary col. london (uk, 25.3)(+29) 24.5 u. loughborough (uk, 19.5)(0) 47.021 insead fontainebleau (fr, 43)(-8) 33.5 london business school (uk, 60.3)(+11) 25.0 u. stirling (uk, 32)(+14) 48.022 u. copenhagen (de, 58.3)(+4) 34.5 iae csic barcelona (sp, 12.1)(+4) 25.5 u. paris 10 / cergy (fr, 122.9)(+5) 48.023 u. york (uk, 109)(-6) 37.5 city u. london (uk, 9.5)(+22) 27.5 u. sussex (uk, 60.5)(-8) 49.024 oxford u. (uk, 225.4)(-9) 38.0 wilhelms u. bonn (ge, 82.3)(-2) 28.5 u. surrey (uk, 21)(-2) 50.525 delta ens paris (fr, 11.8)(-15) 38.0 u. copenhagen (de, 58.3)(+2) 29.5 european u. inst. firenze (it, 14.8)(+16) 51.026 u. carlos iii madrid (sp, 38.8)(+37) 40.0 u. alicante (sp, 31)(+36) 29.5 ben gurion u. (is, 19.5)(-14) 52.527 wilhelms u. bonn (ge, 82.3)(-5) 40.5 u. york (uk, 109)(-13) 30.0 wilhelms u. bonn (ge, 82.3)(-2) 53.028 katholieke u. leuven (be, 88.2)(+7) 41.0 hec paris (fr, 16.5)(+33) 31.0 hebrew u. jerusalem (is, 60.2)(-25) 53.529 royal holloway london (uk, 16)(+18) 42.0 birkbeck col. london (uk, 28.4)(-4) 33.5 u. east anglia (uk, 66.6)(+4) 54.030 ben gurion u. (is, 19.5)(-16) 44.0 royal holloway london (uk, 16)(-2) 33.5 u. york (uk, 109)(-13) 55.031 u. alicante (sp, 31)(+52) 44.0 humboldt u. berlin (ge, 55)(+27) 35.5 cepremap paris (fr, 15.7)(-13) 55.532 katholieke u. tilburg (ne, 214.8)(+4) 44.5 u. bocconi (it, 205.1)(+27) 37.0 u. carlos iii madrid (sp, 38.8)(+47) 57.033 humboldt u. berlin (ge, 55)(+11) 45.5 insead fontainebleau (fr, 43)(-17) 37.5 oxford u. (uk, 225.4)(-10) 57.534 u. catholique louvain (be, 134.6)(-11) 47.5 u. catholique louvain (be, 134.6)(-19) 37.5 ceras enpc paris (fr, 11.1)(+14) 58.035 u. pompeu fabra (sp, 111.4)(+10) 47.5 stockholm sch. of eco. (swe, 304)(+20) 39.0 imperial col. london (uk, 42.5)(+7) 58.536 u. wien (au, 52)(+2) 48.0 u. libre bruxelles (be, 99.1)(-2) 40.0 queen mary col. london (uk, 25.3)(+36) 58.537 u. konstanz (ge, 31)(-4) 48.5 koc u. (tu, 47.5)(+62) 40.5 humboldt u. berlin (ge, 55)(+9) 61.538 u. stockholm (swe, 81.8)(-9) 49.0 u. cambridge (uk, 88)(-21) 43.0 iae csic barcelona (sp, 12.1)(+56) 61.539 bar ilan u. (is, 39)(-23) 50.0 u. wien (au, 52)(-10) 44.0 u. essex (uk, 69)(-5) 62.540 u. edinburgh (uk, 36.9)(-9) 50.5 katholieke u. tilburg (ne, 214.8)(-2) 44.0 u. edinburgh (uk, 36.9)(-14) 67.041 u. sussex (uk, 60.5)(-11) 50.5 banco de espana (sp, 12.5)(+42) 45.0 london business school (uk, 60.3)(-5) 68.042 leicester u. (uk, 45.5)(0) 53.5 u. venezia foscari (it, 87.8)(+60) 45.5 u. durham (uk, 23.5)(+83) 68.543 u. paris 10 / cergy (fr, 122.9)(-9) 56.0 u. birmingham (uk, 20.5)(+14) 45.5 leicester u. (uk, 45.5)(+9) 69.044 u. exeter (uk, 35.5)(+9) 57.5 u. nottingham (uk, 118)(+10) 46.0 u. tromso (no, 14.8)(+77) 70.045 u. surrey (uk, 21)(-8) 58.5 u. aix marseille 2 / 3 (fr, 132.5)(-14) 46.0 u. catholique louvain (be, 134.6)(-13) 70.046 imperial col. london (uk, 42.5)(+4) 59.5 norw. sch. man. sandvika (no, 20.7)(+45) 47.5 u. southampton (uk, 24.5)(-9) 71.547 israel ins. tec. technion (is, 7.5)(+37) 61.0 u. tromso (no, 14.8)(+54) 50.5 u. exeter (uk, 35.5)(-4) 72.0
continued on next page
15In Dusansky and Vernon (1998) (for 1990-1994), economics departments are ranked according to the average of thetotal and per member ranks for Blue. According to the Blue rankings of Tables 18 and 19 the average ranking would be (thenumber in parentheses is the rank in Dusansky and Vernon): 1.Harvard (2), 2.Mit (3), 3. Princeton (1), 4.Chicago(17), 5. Berkeley (12), 6. Yale (7), 7. San Diego (9), 8. Ucla (21), 9. Rochester (12), and 10. Stanford (9).The top European sub-centres would be: The Gremaq of the Université de Toulouse 1 17th and the EconomicsDepartment of the University College London 18th.
18

continued from previous page
Name CLpn Name Blue Name E1n48 niesr london (uk, 25)(+43) 61.5 u. cagliari (it, 60.8)(+67) 51.0 inra rennes (fr, 21)(+94) 73.549 u. zurich (swi, 73.9)(+15) 61.5 u. sassari (it, 20.8)(+73) 51.0 delta ens paris (fr, 11.8)(-19) 74.050 u. bielefeld (ge, 30)(+26) 64.5 u. exeter (uk, 35.5)(+29) 52.0 u. pompeu fabra (sp, 111.4)(+58) 74.551 u. reading (uk, 122.5)(-3) 65.0 maximilians u. munchen (ge, 34.9)(-8) 52.0 u. aberdeen (uk, 34.5)(+10) 75.052 cepremap paris (fr, 15.7)(-24) 65.0 u. bologna (it, 162.8)(+45) 53.5 u. bologna (it, 162.8)(-14) 75.553 norw. sch. man. sandvika (no, 20.7)(+56) 67.0 ben gurion u. (is, 19.5)(-43) 54.0 u. manchester (uk, 108)(+10) 76.054 u. east anglia (uk, 66.6)(-11) 67.0 u. oslo (no, 61.1)(-34) 55.5 u. zurich (swi, 73.9)(-4) 77.055 city u. london (uk, 9.5)(+27) 67.0 freie u. berlin (ge, 63.5)(-7) 55.5 royal holloway london (uk, 16)(+55) 77.556 u. birmingham (uk, 20.5)(-7) 68.5 u. carlos iii madrid (sp, 38.8)(+12) 55.5 u. alicante (sp, 31)(+77) 77.557 nhh bergen (no, 38.7)(-16) 69.0 cemfi madrid (sp, 10)(-34) 57.5 insead fontainebleau (fr, 43)(-29) 78.058 cemfi madrid (sp, 10)(-7) 69.5 tech. u. dresden (ge, 6)(+16) 58.0 norw. u. tech. trondheim (no, 22.5)(+78) 79.559 vrije u. amsterdam (ne, 132.3)(+19) 72.0 u. east anglia (uk, 66.6)(-6) 59.5 u. paris 1 (fr, 194.3)(-8) 80.560 u. beykent (tu, 13.1)(+20) 73.5 bar ilan u. (is, 39)(-36) 60.0 u. st andrews (uk, 19.7)(-13) 81.061 hec paris (fr, 16.5)(+26) 75.0 u. liverpool (uk, 21)(+69) 61.0 aarhus u. (de, 47.2)(-21) 81.562 u. aix marseille 2 / 3 (fr, 132.5)(-8) 75.0 u. st andrews (uk, 19.7)(+1) 62.0 u. kent canterbury (uk, 12)(-4) 82.563 u. st andrews (uk, 19.7)(-7) 76.0 ludwigs u. freiburg (ge, 8.8)(+80) 62.5 nhh bergen (no, 38.7)(-8) 84.064 u. college dublin (ir, 28)(+22) 77.0 u. amsterdam (ne, 182.3)(+9) 64.0 u. beykent (tu, 13.1)(+40) 84.565 u. manchester (uk, 108)(+10) 77.5 u. beykent (tu, 13.1)(-9) 64.5 u. besancon (fr, 19)(+1) 84.566 banco de espana (sp, 12.5)(+5) 77.5 erasmus u. rotterdam (ne, 207.3)(+19) 67.0 u. wien (au, 52)(-13) 84.567 u. paris 1 (fr, 194.3)(-6) 79.5 u. osnabruck (ge, 35)(+8) 67.5 cemfi madrid (sp, 10)(+20) 85.068 icmb geneve (swi, 8.9)(-16) 80.0 u. paris 1 (fr, 194.3)(+39) 69.5 u. strathclyde (uk, 41.5)(-47) 85.569 u. bologna (it, 162.8)(+16) 82.5 u. padova (it, 58.5)(+12) 70.0 u. stockholm (swe, 81.8)(-20) 85.570 u. maastricht (ne, 176.2)(-1) 82.5 u. autonoma barcelona (sp, 99.5)(-10) 70.5 katholieke u. tilburg (ne, 214.8)(0) 85.571 goethe u. frankfurt (ge, 49.5)(-9) 85.0 ossietzky u. oldenburg (ge, 7)(+23) 71.0 sch. orient. afri. london (uk, 27.5)(-27) 86.572 u. stirling (uk, 32)(-2) 86.0 icmb geneve (swi, 8.9)(-39) 71.5 banco de espana (sp, 12.5)(+1) 88.573 u. strathclyde (uk, 41.5)(-33) 86.5 u. bristol (uk, 38.2)(-22) 72.0 u. aix marseille 2 / 3 (fr, 132.5)(-8) 90.074 u. glasgow (uk, 53.5)(0) 87.0 u. paris 10 / cergy (fr, 122.9)(-39) 73.5 u. birmingham (uk, 20.5)(-29) 92.575 u. uppsala (swe, 59)(+6) 87.0 u. geneve (swi, 67.8)(-29) 75.5 brunel u. (uk, 48.5)(+28) 93.5
ReferencesLuc Bauwens, Alan Kirman, Michel Lubrano, and Camelia Protopopescu. Ranking european economic
departments: a statistical approach. Working Paper, February 2002.
John G. Bell and John J. Seater. Publishing performance: Departmental and individual. EconomicInquiry, 16(4):599–615, October 1978.
Pierre-Philippe Combes and Laurent Linnemer. La publication d’articles de recherche en économie enFrance. Annales d’Économie et de Statistiques, 62:5–47, Avril/Juin 2001.
Pierre-Philippe Combes and Laurent Linnemer. Measuring and ranking economics throughout europe: acomplete report. http://www.enpc.fr/ceras/combes/pdf/Combes_Linnemer_Europe_07_2003_part_II.pdf.,2002.
Richard Dusansky and Clayton J. Vernon. Rankings of U.S. economics departments. Journal of EconomicPerspectives, 12(1):157–70, Winter 1998.
E. B. Hutchinson and T. L. Zivney. The publication profile of economists. Journal of Economic Education,26(1):59–79, 1995.
Pantelis Kalaitzidakis, Theofanis P. Mamuneas, and Thanasis Stengos. Ranking of academic journalsand institutions in economics. Working Paper, October 2001.
A.J. Lotka. The frequency distribution of scientific productivity. Journal of the Whashington Academyof Sciences, 16(12):317–23, 1926.
James C. III Miller and Robert D. Tollison. Rates of publications per faculty member in forty-five ‘rated’economics departments. Economic Inquiry, 13(1):122–23, March 1975.
Loren C. Scott and Peter M. Mitias. Trends in rankings of economics departments in the U.S.: anuptdate. Economic Inquiry, 34(2):378–400, April 1996.
Jerry G. Thursby. What do we say about ourselves and what does it mean? yet another look at economicsdepartment research. Journal of Economic Literature, 38(2):383–404, June 2000.
A Most patronized journals per countryIn Table 17, the first column gives the name of the country, the second the name of a journal, the thirdthe number of articles published in this journal between 1971 and 2000 by a member of a centre of thiscountry, the fourth column the weight (in percentage) of these articles in all the (EconLit) publicationsof the country, the fifth column gives the cumulative percentage, the sixth column (labeled Eur.) givesthe number of articles published in the journal by the (European) members of our database, columnseven (%Eur.) gives the percentage of the country’s publications in the European’s publication (that is:Nb/Eur.), column eight (Econ.) gives the total number of articles of this journal in EconLit, and the lastcolumn the percentage of the country’s articles in this journal in terms of EconLit articles in this journal(that is: Nb/Econ.). The names of journals are the most recent ones, but the number of publicationsincludes the publications in the same journal under a former name. For example, the table includes the
19

Spanish Economic Review which takes account of the publications in the Revista Espanola de Economia(former name). When both an English and a national name were given we tried to keep the Englishname to facilitate the reading.
Table 17: Most patronized journals per countryCount. Journal Nb % %Cum. Eur. %Eur. Econ. % Econ.au empirica 48.8 7.91 7.9 129.4 37.7 317 15.4au jahrbucher fur nationalokonomie und statistik 29.8 4.82 12.7 506.5 5.9 1298 2.3au journal of institutional and theoretical economics 19.8 3.21 15.9 443.6 4.5 1495 1.3au journal of economics (zeitschrift fur nationalokonomie) 16.8 2.73 18.7 143.4 11.7 363 4.6au public choice 14.0 2.27 20.9 231.8 6.0 2114 0.7au kyklos 12.0 1.94 22.9 263.0 4.6 989 1.2be tijdschrift voor economie en management 190.1 13.50 13.5 218.9 86.9 628 30.3be cahiers economiques de bruxelles 98.2 6.97 20.5 128.3 76.5 471 20.8be european economic review 85.2 6.05 26.5 947.4 9.0 2189 3.9be annals of public and cooperative economics 41.4 2.94 29.5 138.9 29.8 538 7.7be recherches economiques de louvain 34.7 2.46 31.9 188.5 18.4 349 9.9be revue economique 29.6 2.10 34.0 874.4 3.4 1576 1.9de nationalokonomisk tidsskrift 305.5 32.71 32.7 321.9 94.9 894 34.2de scandinavian journal of economics 44.5 4.77 37.5 483.0 9.2 1022 4.4de european economic review 25.7 2.75 40.2 947.4 2.7 2189 1.2de economics letters 20.2 2.16 42.4 667.1 3.0 2865 0.7de journal of econometrics 9.9 1.06 43.4 293.6 3.4 1890 0.5de economic policy: a european forum 9.7 1.04 44.5 178.1 5.4 306 3.2fi liiketaloudellinen aikakauskirja 119.2 13.93 13.9 126.3 94.4 797 15.0fi kansantaloudellinen aikakauskirja 109.1 12.75 26.7 116.4 93.7 480 22.7fi ekonomiska samfundets tidskrift 96.2 11.24 37.9 150.6 63.9 639 15.0fi scandinavian journal of economics 45.0 5.26 43.2 483.0 9.3 1022 4.4fi finnish economic papers 35.3 4.12 47.3 59.2 59.5 135 26.1fi applied economics 22.1 2.58 49.9 486.8 4.5 2699 0.8fr revue economique 796.3 14.07 14.1 874.4 91.1 1576 50.5fr economies et societes 677.8 11.98 26.0 749.4 90.5 1907 35.5fr revue d economie politique 458.3 8.10 34.1 505.3 90.7 980 46.8fr economie appliquee 245.8 4.34 38.5 314.1 78.3 747 32.9fr revue d economie industrielle 226.0 3.99 42.5 256.5 88.1 546 41.4fr annales d economie et de statistique 224.1 3.96 46.4 334.9 66.9 681 32.9ge jahrbucher fur nationalokonomie und statistik 433.3 9.87 9.9 506.5 85.6 1298 33.4ge journal of institutional and theoretical economics 312.8 7.12 17.0 443.6 70.5 1495 20.9ge zeitschrift fur wirtschafts und sozialwissenschaften 194.9 4.44 21.4 236.5 82.4 502 38.8ge kredit und kapital 153.7 3.50 24.9 191.1 80.4 657 23.4ge zeitschrift fur betriebswirtschaft 148.2 3.37 28.3 167.7 88.4 926 16.0ge ifo studien 119.5 2.72 31.0 162.9 73.4 442 27.0gr greek economic review 24.5 5.09 5.1 67.3 36.4 234 10.5gr risec: international review of economics and business 21.2 4.40 9.5 505.2 4.2 2041 1.0gr spoudai 15.6 3.24 12.7 18.9 82.4 81 19.2gr economia internazionale 15.0 3.12 15.9 174.2 8.6 727 2.1gr applied economics 14.1 2.93 18.8 486.8 2.9 2699 0.5gr european review of agricultural economics 13.5 2.81 21.6 159.7 8.5 522 2.6ir economic and social review 158.8 28.32 28.3 219.0 72.5 560 28.4ir journal of the statistical and social inquiry society of ireland 53.2 9.48 37.8 57.6 92.3 218 24.4ir irish banking review 26.7 4.76 42.6 27.8 95.8 128 20.8ir irish journal of agricultural economics and rural sociology 18.0 3.21 45.8 21.3 84.5 128 14.1ir economics letters 9.4 1.68 47.4 667.1 1.4 2865 0.3ir applied economics 9.3 1.66 49.1 486.8 1.9 2699 0.3is american economic review 78.5 5.32 5.3 357.5 22.0 6033 1.3is journal of economic theory 62.3 4.22 9.5 463.2 13.5 2361 2.6is european economic review 45.3 3.07 12.6 947.4 4.8 2189 2.1is journal of political economy 44.4 3.01 15.6 172.6 25.7 2349 1.9is econometrica 41.9 2.84 18.5 412.6 10.2 2525 1.7is games and economic behavior 36.9 2.50 21.0 175.0 21.1 613 6.0it risec: international review of economics and business 390.6 6.99 7.0 505.2 77.3 2041 19.1it giornale degli economisti e annali di economia 336.3 6.01 13.0 358.4 93.8 656 51.3it studi economici 250.7 4.48 17.5 268.8 93.3 395 63.5it rivista di politica economica 244.3 4.37 21.9 253.7 96.3 728 33.6it economia (pontifical catholic university of peru) 208.5 3.73 25.6 218.7 95.3 325 64.1it economia e lavoro 207.5 3.71 29.3 226.6 91.6 592 35.0ne de economist 134.5 7.24 7.2 167.8 80.2 730 18.4ne economics letters 75.7 4.08 11.3 667.1 11.4 2865 2.6ne journal of econometrics 54.9 2.95 14.3 293.6 18.7 1890 2.9ne european economic review 47.0 2.53 16.8 947.4 5.0 2189 2.1ne applied economics 28.3 1.52 18.3 486.8 5.8 2699 1.0ne journal of public economics 26.7 1.43 19.8 429.9 6.2 1710 1.6no scandinavian journal of economics 91.5 10.53 10.5 483.0 18.9 1022 8.9no european economic review 32.2 3.71 14.2 947.4 3.4 2189 1.5no environmental and resource economics 22.3 2.57 16.8 151.9 14.7 462 4.8no marine resource economics 21.3 2.45 19.3 37.4 57.1 329 6.5no economics letters 20.1 2.31 21.6 667.1 3.0 2865 0.7no journal of public economics 18.3 2.11 23.7 429.9 4.3 1710 1.1po economia portuguese catholic university 80.5 33.82 33.8 97.9 82.2 365 22.1po economics letters 11.9 5.00 38.8 667.1 1.8 2865 0.4po international journal of industrial organization 6.5 2.73 41.5 194.5 3.3 637 1.0po brazilian journal of political economy 4.0 1.68 43.2 7.5 53.3 270 1.5po bulletin for international fiscal documentation 4.0 1.68 44.9 43.6 9.2 1680 0.2po economic theory 3.7 1.54 46.4 136.9 2.7 598 0.6sp investigaciones economicas 192.4 10.74 10.7 206.2 93.3 419 45.9sp spanish economic review 105.6 5.89 16.6 126.1 83.7 236 44.7sp revista de economia aplicada 85.4 4.76 21.4 86.1 99.1 183 46.7sp economia industrial 66.6 3.72 25.1 74.8 89.1 449 14.8sp economics letters 63.0 3.51 28.6 667.1 9.4 2865 2.2sp papeles de economia espanola 59.3 3.31 31.9 64.9 91.5 188 31.6swe scandinavian journal of economics 131.2 8.39 8.4 483.0 27.2 1022 12.8swe swedish economic policy review 64.6 4.13 12.5 98.8 65.4 136 47.5swe european economic review 57.1 3.65 16.2 947.4 6.0 2189 2.6swe scandinavian economic history review 54.1 3.46 19.6 98.4 54.9 257 21.0swe ekonomiska samfundets tidskrift 44.2 2.83 22.4 150.6 29.4 639 6.9swe journal of public economics 42.0 2.68 25.1 429.9 9.8 1710 2.5swi schweizerische zeitschrift fur volkswirtschaft und statistik 117.8 8.56 8.6 165.9 71.0 568 20.7swi swiss journal of economics and statistics 92.3 6.71 15.3 152.0 60.7 376 24.6swi aussenwirtschaft 86.5 6.29 21.6 147.5 58.6 562 15.4swi journal of institutional and theoretical economics 43.0 3.13 24.7 443.6 9.7 1495 2.9swi kyklos 39.9 2.90 27.6 263.0 15.2 989 4.0swi european economic review 39.8 2.90 30.5 947.4 4.2 2189 1.8tu middle east technical university studies in development 49.3 19.58 19.6 63.6 77.6 526 9.4tu yapi kredi economic review 11.7 4.63 24.2 12.2 95.9 44 26.5tu journal of economic cooperation among islamic countries 11.5 4.56 28.8 12.5 92.0 106 10.8tu journal of economic theory 9.0 3.57 32.3 463.2 1.9 2361 0.4tu economics letters 7.5 2.98 35.3 667.1 1.1 2865 0.3tu mathematical social sciences 7.5 2.98 38.3 108.2 6.9 608 1.2uk economic journal 548.9 4.79 4.8 769.3 71.4 2257 24.3uk oxford economic papers 265.5 2.32 7.1 442.1 60.1 1252 21.2uk applied economics 265.3 2.31 9.4 486.8 54.5 2699 9.8uk scottish journal of political economy 254.8 2.22 11.6 304.1 83.8 837 30.4
continued on next page
20

continued from previous page
Country Journal Nb % %Cum. Eur. %Eur. Econ. % Econ.uk european economic review 232.4 2.03 13.7 947.4 24.5 2189 10.6uk oxford bulletin of economics and statistics 214.3 1.87 15.5 320.0 67.0 790 27.1us american economic review 1764.9 7.73 7.7 357.5 493.7 6033 29.3us econometrica 863.5 3.78 11.5 412.6 209.3 2525 34.2us journal of political economy 745.6 3.27 14.8 172.6 431.9 2349 31.7us journal of economic theory 716.3 3.14 17.9 463.2 154.6 2361 30.3us quarterly journal of economics 548.5 2.40 20.3 148.7 368.8 1663 33.0us review of economics and statistics 496.2 2.17 22.5 174.3 284.7 2778 17.9
B U.S. and European sub-centre rankings
Table 18: European and U.S. Sub-Centres, 1996-2000Name CLpn Name Blue Name E1n
1 econ. (harvard u.) (us, 53.3) 2957.9 econ. (harvard u.) (us, 53.3) 696.5 econ. (harvard u.) (us, 53.3) 293.52 econ. (princeton u.) (us, 58.8) 2409.2 econ. (princeton u.) (us, 58.8) 635.8 econ. (uc berkeley) (us, 55.5) 241.33 econ. (yale u.) (us, 70.6) 2106.8 econ. (mit) (us, 38) 493.4 econ. (princeton u.) (us, 58.8) 224.54 econ. (uc berkeley) (us, 55.5) 2048.5 econ. (yale u.) (us, 70.6) 464.1 econ. (oxford u.) (uk, 100.4) 211.85 econ. (mit) (us, 38) 2019.8 econ. (chicago u.) (us, 39.4) 453.1 econ. (yale u.) (us, 70.6) 210.66 econ. (cornell u.) (us, 68.3) 1701.8 econ. (uc berkeley) (us, 55.5) 398.5 econ. (cornell u.) (us, 68.3) 192.27 econ. (chicago u.) (us, 39.4) 1565.3 econ. (uc los angeles) (us, 45) 305.7 econ. (mit) (us, 38) 177.88 econ. (uc los angeles) (us, 45) 1526.0 econ. (northwestern u.) (us, 56.5) 261.7 econ. (u. bologna) (it, 113.3) 149.19 gremaq (u. toulouse 1) (fr, 41.2) 1429.5 econ. (uc san diego) (us, 33) 261.3 econ. (katholieke u. tilburg) (ne, 122.8) 147.810 econ. (oxford u.) (uk, 100.4) 1308.0 econ. (stanford u.) (us, 39.1) 248.5 gremaq (u. toulouse 1) (fr, 41.2) 143.511 econ. (uc san diego) (us, 33) 1266.6 econ. (wisconsin u. madison) (us, 43.5) 234.3 econ. (stanford u.) (us, 39.1) 141.412 econ. (london school of econ.)(uk, 52.7) 1165.7 econ. (rochester u.) (us, 28.5) 226.4 econ. (uc los angeles) (us, 45) 139.613 econ. (northwestern u.) (us, 56.5) 1146.9 econ. (new york u.) (us, 34.8) 218.1 econ. (u. nottingham) (uk, 40) 137.814 econ. (maryland u.) (us, 39) 1122.6 econ. (michigan u.) (us, 59.3) 215.3 econ. (chicago u.) (us, 39.4) 133.315 econ. (wisconsin u. madison) (us, 43.5) 1107.8 econ. (maryland u.) (us, 39) 205.4 econ. (iowa state u.) (us, 55.5) 128.816 econ. (stanford u.) (us, 39.1) 1087.4 gremaq (u. toulouse 1) (fr, 41.2) 202.2 econ. (maryland u.) (us, 39) 125.417 econ. (new york u.) (us, 34.8) 1078.5 econ. (cornell u.) (us, 68.3) 196.0 econ. (london school of econ.)(uk, 52.7) 123.518 econ. (katholieke u. tilburg) (ne, 122.8) 1049.4 econ. (brown u.) (us, 33) 195.6 econ. (michigan state u.) (us, 38.9) 121.319 econ. (pennsylvania u.) (us, 33.6) 973.9 econ. (boston u.) (us, 32.8) 191.3 econ. (u. york) (uk, 53.5) 120.720 econ. (u. college london) (uk, 28.3) 948.0 econ. (columbia u.) (us, 43.9) 173.7 econ. (u. warwick) (uk, 38.7) 118.621 econ. (michigan u.) (us, 59.3) 936.4 econ. (pennsylvania u.) (us, 33.6) 173.4 econ. (michigan u.) (us, 59.3) 116.522 econ. (michigan state u.) (us, 38.9) 934.8 econ. (texas u. austin) (us, 40) 166.5 econ. (vrije u. amsterdam) (ne, 119.3) 110.423 econ. (texas u. austin) (us, 40) 913.4 econ. (u. college london) (uk, 28.3) 157.9 econ. (uc san diego) (us, 33) 110.324 econ. (boston u.) (us, 32.8) 863.3 econ. (london school of econ.)(uk, 52.7) 146.6 econ. (u. pompeu fabra) (sp, 100.4) 109.525 econ. (illinois urbana) (us, 38) 838.9 econ. (oxford u.) (uk, 100.4) 137.7 econ. (northwestern u.) (us, 56.5) 108.926 econ. (brown u.) (us, 33) 833.9 econ. (carnegie mellon u.) (us, 37.6) 136.3 econ. (wisconsin u. madison) (us, 43.5) 108.327 econ. (rochester u.) (us, 28.5) 825.4 econ. (ohio state u.C279) (us, 40) 125.4 econ. (maximilians u. munchen)(ge, 26.9) 99.128 econ. (u. warwick) (uk, 38.7) 824.9 econ. (boston col.) (us, 25.5) 119.3 econ. (new york u.) (us, 34.8) 98.429 econ. (u. york) (uk, 53.5) 765.8 e. berglas (tel aviv u.) (is, 26.9) 118.2 econ. (illinois urbana) (us, 38) 98.330 econ. (ohio state u.C279) (us, 40) 763.3 econ. (minnesota u.) (us, 27.5) 105.7 econ. (u. college london) (uk, 28.3) 96.431 econ. (carnegie mellon u.) (us, 37.6) 762.6 econ. (hebrew u. jerusalem) (is, 38.7) 104.0 econ. (columbia u.) (us, 43.9) 96.332 econ. (columbia u.) (us, 43.9) 759.2 econ. (southern california u.)(us, 28) 100.3 core (u. catholique louvain) (be, 42.6) 94.433 econ. (u. nottingham) (uk, 40) 747.1 econ. (u. pompeu fabra) (sp, 100.4) 99.1 econ. (ohio state u.C279) (us, 40) 93.034 econ. (boston col.) (us, 25.5) 739.5 econ. (florida u.) (us, 24) 97.3 econ. (uc santa barbara) (us, 31) 93.035 econ. (u. pompeu fabra) (sp, 100.4) 687.3 econ. (caltech) (us, 18.5) 94.8 econ. (vanderbilt) (us, 37.2) 90.336 econ. (iowa state u.) (us, 55.5) 686.7 econ. (michigan state u.) (us, 38.9) 92.9 econ. (southern california u.)(us, 28) 87.937 econ. (hebrew u. jerusalem) (is, 38.7) 686.2 grecsta (crest insee paris) (fr, 26.2) 92.8 econ. (pennsylvania u.) (us, 33.6) 86.138 econ. (southern california u.)(us, 28) 676.1 econ. (georgetown u.) (us, 43.5) 87.8 econ. (rutgers u.) (us, 34) 86.139 econ. (minnesota u.) (us, 27.5) 671.8 econ. (virginia u.) (us, 29.5) 84.8 econ. (u. cambridge) (uk, 35) 85.640 econ. (vanderbilt) (us, 37.2) 666.3 econ. (rutgers u.) (us, 34) 78.6 econ. (boston col.) (us, 25.5) 84.641 econ. (north carolina u.) (us, 39) 652.0 econ. (uc davis) (us, 25) 77.1 econ. (texas u. austin) (us, 40) 84.342 econ. (georgetown u.) (us, 43.5) 642.5 econ. (johns hopkins u.) (us, 14) 75.1 greqam (u. aix marseille 2/3) (fr, 55) 83.743 econ. (uc davis) (us, 25) 631.5 econ. (illinois urbana) (us, 38) 69.9 econ. (u. mannheim) (ge, 35.5) 83.144 econ. (texas a & m) (us, 29) 627.8 iies (u. stockholm) (swe, 26.8) 67.5 econ. (george mason u.) (us, 26) 82.845 e. berglas (tel aviv u.) (is, 26.9) 621.2 econ. (penn state u.) (us, 27.8) 64.2 econ. (texas a & m) (us, 29) 82.346 econ. (rutgers u.) (us, 34) 614.3 econ. (rice u.) (us, 23) 62.3 econ. (brown u.) (us, 33) 81.347 econ. (caltech) (us, 18.5) 613.0 econ. (uc santa barbara) (us, 31) 62.2 econ. (u. roma sapienza) (it, 137.5) 80.648 grecsta (crest insee paris) (fr, 26.2) 609.2 econ. (pittsburgh u.) (us, 22) 60.8 econ. (u. oslo) (no, 45.8) 79.749 econ. (washington u. seattle) (us, 30) 601.5 econ. (stockholm sch. of eco.)(swe, 37.8) 57.7 econ. (rochester u.) (us, 28.5) 79.450 core (u. catholique louvain) (be, 42.6) 588.6 empirical econ. (u. zurich) (swi, 17.4) 57.7 econ. (hebrew u. jerusalem) (is, 38.7) 79.051 econ. (vrije u. amsterdam) (ne, 119.3) 583.7 econ. (u. bocconi) (it, 40.5) 56.1 econ. (colorado u.) (us, 34) 78.652 econ. (u. bologna) (it, 113.3) 582.8 econ. (indiana u.) (us, 21) 55.9 econ. (boston u.) (us, 32.8) 78.153 econ. (u. cambridge) (uk, 35) 557.5 ceras enpc paris (fr, 11.1) 54.5 econ. stat. (u. konstanz) (ge, 26) 77.854 econ. (indiana u.) (us, 21) 541.2 econ. (u. york) (uk, 53.5) 50.9 econ. (carnegie mellon u.) (us, 37.6) 77.355 econ. (penn state u.) (us, 27.8) 539.8 econ. (north carolina u.) (us, 39) 50.0 inst. of eco. (u. copenhagen) (de, 47) 75.356 econ. (florida u.) (us, 24) 536.5 econ. (vanderbilt) (us, 37.2) 49.9 econ. (minnesota u.) (us, 27.5) 74.957 econ. (uc santa barbara) (us, 31) 529.5 econ. (texas a & m) (us, 29) 48.5 econ. (u. reading) (uk, 26) 73.658 econ. (u. bocconi) (it, 40.5) 528.0 econ. (houston u.) (us, 23) 47.6 econ. (washington u. seattle) (us, 30) 72.259 econ. (maximilians u. munchen)(ge, 26.9) 524.6 econ. (u. warwick) (uk, 38.7) 46.0 econ. (u. bocconi) (it, 40.5) 71.960 econ. (colorado u.) (us, 34) 524.0 econ. (uc irvine) (us, 28.5) 44.5 econ. (penn state u.) (us, 27.8) 71.561 econ. (u. oslo) (no, 45.8) 519.2 econ. (u. arizona) (us, 25) 44.1 thema (u. paris 10 / cergy) (fr, 42.6) 71.062 finance (london business sch.)(uk, 30.2) 509.9 econ. (katholieke u. tilburg) (ne, 122.8) 43.6 econ. (uc davis) (us, 25) 70.963 econ. (u. mannheim) (ge, 35.5) 509.1 econ. (wilhelms u. bonn) (ge, 34.8) 43.2 econ. (wilhelms u. bonn) (ge, 34.8) 70.864 econ. (duke u.) (us, 29.7) 497.2 delta ens paris (fr, 11.8) 42.2 econ. (georgetown u.) (us, 43.5) 70.065 econ. (purdue u.) (us, 25.5) 490.8 econ. (u. college dublin) (ir, 28) 40.5 econ. (washington u. stlouis) (us, 26.2) 69.866 econ. (johns hopkins u.) (us, 14) 489.7 econ. (duke u.) (us, 29.7) 39.7 dev. pbs. (bar ilan u.) (is, 35) 69.267 insead fontainebleau (fr, 43) 484.0 econ. (u. essex) (uk, 28.5) 39.4 e. berglas (tel aviv u.) (is, 26.9) 67.268 econ. (virginia u.) (us, 29.5) 484.0 econ. (u. mannheim) (ge, 35.5) 39.1 grecsta (crest insee paris) (fr, 26.2) 67.169 econ. (wilhelms u. bonn) (ge, 34.8) 476.6 econ. (purdue u.) (us, 25.5) 35.8 niesr london (uk, 25) 65.070 thema (u. paris 10 / cergy) (fr, 42.6) 467.1 core (u. catholique louvain) (be, 42.6) 35.8 empirical econ. (u. zurich) (swi, 17.4) 64.971 econ. (uc irvine) (us, 28.5) 449.3 ecares (u. libre bruxelles) (be, 24.1) 35.1 econ. (florida u.) (us, 24) 64.372 inst. of eco. (u. copenhagen) (de, 47) 443.8 inst. of eco. (u. copenhagen) (de, 47) 34.3 econ. (mass. u. amherst) (us, 37) 63.973 econ. (rice u.) (us, 23) 435.0 econ. (u. southampton) (uk, 24.5) 33.5 econ. st. (u. manchester) (uk, 37.3) 62.974 econ. (u. wien) (au, 34) 433.4 econ. (u. bologna) (it, 113.3) 33.2 econ. (u. wien) (au, 34) 62.775 econ. (u. essex) (uk, 28.5) 432.5 econ. (colorado u.) (us, 34) 30.7 econ. (north carolina u.) (us, 39) 62.6
Table 19: European and U.S. Sub-Centres, per Member, 1996-2000Name CLpn Name Blue Name E1n
1 econ. (harvard u.) (us, 53.3) 55.50 econ. (harvard u.) (us, 53.3) 13.07 econ. (harvard u.) (us, 53.3) 5.512 econ. (mit) (us, 38) 53.15 econ. (mit) (us, 38) 12.99 econ. (eur. u. inst. firenze) (it, 5.8) 5.303 econ. (eur. u. inst. firenze) (it, 5.8) 41.43 econ. (chicago u.) (us, 39.4) 11.50 econ. (mit) (us, 38) 4.684 econ. (princeton u.) (us, 58.8) 40.97 econ. (princeton u.) (us, 58.8) 10.81 econ. (uc berkeley) (us, 55.5) 4.355 econ. (chicago u.) (us, 39.4) 39.73 econ. (rochester u.) (us, 28.5) 7.94 ura928 (cepremap paris) (fr, 5.8) 3.876 econ. (uc san diego) (us, 33) 38.38 econ. (uc san diego) (us, 33) 7.92 econ. (princeton u.) (us, 58.8) 3.827 ceras enpc paris (fr, 11.1) 37.90 econ. (uc berkeley) (us, 55.5) 7.18 empirical econ. (u. zurich) (swi, 17.4) 3.738 econ. (uc berkeley) (us, 55.5) 36.91 econ. (uc los angeles) (us, 45) 6.79 econ. (maximilians u. munchen)(ge, 26.9) 3.699 econ. (johns hopkins u.) (us, 14) 34.98 econ. (yale u.) (us, 70.6) 6.57 econ. (stanford u.) (us, 39.1) 3.6210 gremaq (u. toulouse 1) (fr, 41.2) 34.68 econ. (stanford u.) (us, 39.1) 6.36 ceras enpc paris (fr, 11.1) 3.5811 econ. (uc los angeles) (us, 45) 33.91 econ. (new york u.) (us, 34.8) 6.27 gremaq (u. toulouse 1) (fr, 41.2) 3.4812 econ. (u. college london) (uk, 28.3) 33.46 econ. (brown u.) (us, 33) 5.93 econ. (johns hopkins u.) (us, 14) 3.4713 econ. (caltech) (us, 18.5) 33.13 econ. (boston u.) (us, 32.8) 5.83 econ. (u. nottingham) (uk, 40) 3.4414 econ. (new york u.) (us, 34.8) 30.99 econ. (u. college london) (uk, 28.3) 5.57 econ. (u. stirling) (uk, 15.5) 3.4215 econ. (yale u.) (us, 70.6) 29.84 econ. (wisconsin u. madison) (us, 43.5) 5.39 econ. (u. college london) (uk, 28.3) 3.4016 econ. (boston col.) (us, 25.5) 29.00 econ. (johns hopkins u.) (us, 14) 5.36 econ. (chicago u.) (us, 39.4) 3.3817 econ. (pennsylvania u.) (us, 33.6) 28.98 econ. (maryland u.) (us, 39) 5.27 econ. (uc san diego) (us, 33) 3.3418 econ. (rochester u.) (us, 28.5) 28.96 econ. (pennsylvania u.) (us, 33.6) 5.16 econ. (boston col.) (us, 25.5) 3.3219 econ. (maryland u.) (us, 39) 28.79 econ. (caltech) (us, 18.5) 5.12 373 (humboldt u. berlin) (ge, 15.5) 3.2420 iae csic barcelona (sp, 12.1) 27.97 ceras enpc paris (fr, 11.1) 4.93 econ. (maryland u.) (us, 39) 3.2221 econ. (stanford u.) (us, 39.1) 27.81 gremaq (u. toulouse 1) (fr, 41.2) 4.91 iae csic barcelona (sp, 12.1) 3.2022 econ. (boston u.) (us, 32.8) 26.32 econ. (boston col.) (us, 25.5) 4.68 econ. (swe. sch. eco. bus.) (fi, 6) 3.1923 econ. (indiana u.) (us, 21) 25.77 econ. (northwestern u.) (us, 56.5) 4.63 econ. (george mason u.) (us, 26) 3.1824 econ. (wisconsin u. madison) (us, 43.5) 25.47 e. berglas (tel aviv u.) (is, 26.9) 4.39 econ. (southern california u.)(us, 28) 3.1425 econ. (brown u.) (us, 33) 25.27 econ. (texas u. austin) (us, 40) 4.16 econ. (michigan state u.) (us, 38.9) 3.1226 econ. (uc davis) (us, 25) 25.26 econ. (florida u.) (us, 24) 4.05 econ. (uc los angeles) (us, 45) 3.1027 econ. (cornell u.) (us, 68.3) 24.92 econ. (columbia u.) (us, 43.9) 3.96 econ. (u. warwick) (uk, 38.7) 3.0728 econ. (minnesota u.) (us, 27.5) 24.43 econ. (minnesota u.) (us, 27.5) 3.84 licos (katholieke u. leuven) (be, 11.5) 3.0129 econ. (southern california u.)(us, 28) 24.14 econ. (michigan u.) (us, 59.3) 3.63 econ. (uc santa barbara) (us, 31) 3.0030 econ. (michigan state u.) (us, 38.9) 24.03 econ. (carnegie mellon u.) (us, 37.6) 3.63 econ. stat. (u. konstanz) (ge, 26) 2.9931 grecsta (crest insee paris) (fr, 26.2) 23.25 econ. (southern california u.)(us, 28) 3.58 econ. (yale u.) (us, 70.6) 2.98
continued on next page
21

continued from previous page
Name CLpn Name Blue Name E1n32 e. berglas (tel aviv u.) (is, 26.9) 23.08 delta ens paris (fr, 11.8) 3.56 econ. (ossietzky u. oldenburg)(ge, 7) 2.9333 econ. (texas u. austin) (us, 40) 22.83 grecsta (crest insee paris) (fr, 26.2) 3.54 econ. (birkbeck col. london) (uk, 20.9) 2.9134 econ. (florida u.) (us, 24) 22.36 empirical econ. (u. zurich) (swi, 17.4) 3.32 econ. (uc davis) (us, 25) 2.8435 econ. (london school of econ.)(uk, 52.7) 22.13 econ. (ohio state u.C279) (us, 40) 3.14 econ. (texas a & m) (us, 29) 2.8436 econ. (illinois urbana) (us, 38) 22.08 econ. (uc davis) (us, 25) 3.08 econ. (u. reading) (uk, 26) 2.8337 empirical econ. (u. zurich) (swi, 17.4) 22.00 econ. (virginia u.) (us, 29.5) 2.87 econ. (new york u.) (us, 34.8) 2.8338 (is, 7.5) 21.70 econ. (cornell u.) (us, 68.3) 2.87 econ. (cornell u.) (us, 68.3) 2.8139 econ. (texas a & m) (us, 29) 21.65 (is, 7.5) 2.82 econ. (leicester u.) (uk, 19.5) 2.8040 delta ens paris (fr, 11.8) 21.52 econ. (london school of econ.)(uk, 52.7) 2.78 econ. (rochester u.) (us, 28.5) 2.7941 econ. (u. warwick) (uk, 38.7) 21.33 econ. (pittsburgh u.) (us, 22) 2.76 cemfi madrid (sp, 10) 2.7942 373 (humboldt u. berlin) (ge, 15.5) 21.09 econ. (rice u.) (us, 23) 2.71 delta ens paris (fr, 11.8) 2.7843 econ. (northwestern u.) (us, 56.5) 20.30 econ. (eur. u. inst. firenze) (it, 5.8) 2.70 econ. (caltech) (us, 18.5) 2.7644 econ. (carnegie mellon u.) (us, 37.6) 20.28 econ. (hebrew u. jerusalem) (is, 38.7) 2.69 econ. (minnesota u.) (us, 27.5) 2.7245 econ. (washington u. seattle) (us, 30) 20.05 econ. (indiana u.) (us, 21) 2.66 econ. (u. loughborough) (uk, 19.5) 2.6946 creed (u. amsterdam) (ne, 14.8) 20.02 iies (u. stockholm) (swe, 26.8) 2.52 econ. (florida u.) (us, 24) 2.6847 econ. (birkbeck col. london) (uk, 20.9) 19.94 econ. (michigan state u.) (us, 38.9) 2.39 econ. (aarhus u.) (de, 19.5) 2.6848 math. econ. (u. bielefeld) (ge, 7.5) 19.79 econ. (penn state u.) (us, 27.8) 2.31 econ. (washington u. stlouis) (us, 26.2) 2.6649 econ. (maximilians u. munchen)(ge, 26.9) 19.51 econ. (rutgers u.) (us, 34) 2.31 econ. (indiana u.) (us, 21) 2.6450 econ. (penn state u.) (us, 27.8) 19.45 econ. (city u. london) (uk, 9.5) 2.12 niesr london (uk, 25) 2.6051 econ. (purdue u.) (us, 25.5) 19.25 econ. (houston u.) (us, 23) 2.07 econ. (illinois urbana) (us, 38) 2.5952 econ. (ohio state u.C279) (us, 40) 19.08 econ. (georgetown u.) (us, 43.5) 2.02 econ. (penn state u.) (us, 27.8) 2.5853 econ. (rice u.) (us, 23) 18.91 econ. (uc santa barbara) (us, 31) 2.01 grecsta (crest insee paris) (fr, 26.2) 2.5654 econ. (u. nottingham) (uk, 40) 18.68 iae csic barcelona (sp, 12.1) 1.91 econ. (pennsylvania u.) (us, 33.6) 2.5655 econ. (rutgers u.) (us, 34) 18.07 econ. (illinois urbana) (us, 38) 1.84 econ. (ben gurion u.) (is, 19.5) 2.5556 econ. (vanderbilt) (us, 37.2) 17.91 373 (humboldt u. berlin) (ge, 15.5) 1.80 econ. (u. tromso) (no, 14.8) 2.5357 econ. (hebrew u. jerusalem) (is, 38.7) 17.73 econ. (u. arizona) (us, 25) 1.76 econ. (rutgers u.) (us, 34) 2.5358 econ. (columbia u.) (us, 43.9) 17.29 econ. (texas a & m) (us, 29) 1.67 econ. (city u. london) (uk, 9.5) 2.5159 econ. (uc santa barbara) (us, 31) 17.08 econ. (uc irvine) (us, 28.5) 1.56 econ. (u. kent canterbury) (uk, 12) 2.5160 econ. (leicester u.) (uk, 19.5) 17.02 econ. (stockholm sch. of eco.)(swe, 37.8) 1.53 e. berglas (tel aviv u.) (is, 26.9) 2.5061 finance (london business sch.)(uk, 30.2) 16.90 ecares (u. libre bruxelles) (be, 24.1) 1.46 econ. (wisconsin u. madison) (us, 43.5) 2.4962 econ. (iowa u.) (us, 25.5) 16.79 econ. (u. college dublin) (ir, 28) 1.45 econ. (u. surrey) (uk, 21) 2.4863 econ. (duke u.) (us, 29.7) 16.74 econ. (purdue u.) (us, 25.5) 1.41 swiss nat. bank (swi, 6.5) 2.4764 econ. (north carolina u.) (us, 39) 16.72 econ. (u. bocconi) (it, 40.5) 1.39 econ. (bilkent u.) (tu, 12.5) 2.4765 econ. (pittsburgh u.) (us, 22) 16.52 econ. (u. essex) (uk, 28.5) 1.38 econ. (u. st andrews) (uk, 14.7) 2.4666 econ. (virginia u.) (us, 29.5) 16.41 econ. (u. southampton) (uk, 24.5) 1.37 econ. (brown u.) (us, 33) 2.4667 ura928 (cepremap paris) (fr, 5.8) 16.26 econ. (oxford u.) (uk, 100.4) 1.37 econ. (u. cambridge) (uk, 35) 2.4568 econ. (city u. london) (uk, 9.5) 16.19 econ. (duke u.) (us, 29.7) 1.34 econ. (vanderbilt) (us, 37.2) 2.4369 econ. (u. cambridge) (uk, 35) 15.93 econ. (vanderbilt) (us, 37.2) 1.34 eco. sector (u. east anglia) (uk, 19) 2.4170 econ. (michigan u.) (us, 59.3) 15.79 econ. (north carolina u.) (us, 39) 1.28 econ. (washington u. seattle) (us, 30) 2.4171 econ. (uc irvine) (us, 28.5) 15.76 econ. (wilhelms u. bonn) (ge, 34.8) 1.24 celmr (u. aberdeen) (uk, 19.5) 2.4072 econ. (royal holloway london) (uk, 16) 15.65 econ. (u. warwick) (uk, 38.7) 1.19 icmb geneve (swi, 8.9) 2.4073 licos (katholieke u. leuven) (be, 11.5) 15.61 econ. (washington u. stlouis) (us, 26.2) 1.13 ceco (ec polytechnique paris) (fr, 9.3) 2.4074 econ. (u. edinburgh) (uk, 15.4) 15.46 hec paris (fr, 16.5) 1.12 wider (u.n. u. helsinki) (fi, 10) 2.3975 econ. (colorado u.) (us, 34) 15.41 econ. (queen mary col. london)(uk, 25.3) 1.10 econ. (boston u.) (us, 32.8) 2.38
C Journal weightsIf a journal is in the EconLit database but not in Table 20, its weight is 1/12 ≈ 0.08 according to CL, 0for Blue, SM, KMS, and KMSall, and 1/10 = 0.1 for Bauwens and BKLP.
Table 20: Journal WeightsCL Blue SM KMS BKLP Bauwens KMSall
american economic review 1 1 1 1 1 1 1econometrica 1 0.51 0.94 0.97 1 1 0.97journal of political economy 1 0.36 0.68 0.65 1 1 0.65quarterly journal of economics 1 0.28 0.78 0.58 1 1 0.58review of economic studies 1 0.38 0.93 0.45 1 0.8 0.45econometric theory 0.67 0 0 0.46 0.6 0.6 0.46european economic review 0.67 0 0 0.24 0.6 0.8 0.24games and economic behavior 0.67 0 0 0.35 0.6 0.6 0.35international economic review 0.67 0.09 0.96 0.23 0.8 0.8 0.23journal of business and economic statistics 0.67 0 1.23 0.38 0.6 0.8 0.38journal of econometrics 0.67 0 0.74 0.55 0.8 0.8 0.55journal of economic theory 0.67 0.23 0.72 0.59 1 0.8 0.59journal of finance 0.67 0 1.02 0 0.8 1 0journal of international economics 0.67 0 0.54 0.08 0.8 0.8 0.08journal of labor economics 0.67 0 0.73 0.13 0.8 0.8 0.13journal of monetary economics 0.67 0 0.62 0.36 0.8 0.8 0.36journal of money, credit, and banking 0.67 0 0 0 0.1 0.1 0journal of public economics 0.67 0 0.71 0.20 0.8 0.8 0.20journal of the american statistical association 0.67 0 0 0 0.8 0.2 0rand journal of economics 0.67 0 0.95 0.11 0.8 0.1 0.11review of economics and statistics 0.67 0.24 0.93 0.28 0.8 0.8 0.28american journal of agricultural economics 0.5 0 0 0 0.6 0.8 0.06canadian journal of economics 0.5 0 0 0 0.4 0.6 0.05economic journal 0.5 0 0.98 0.21 0.6 0.8 0.21economic theory 0.5 0 0 0.22 0.6 0.2 0.22economics letters 0.5 0 0 0.19 0.6 0.6 0.19explorations in economic history 0.5 0 0 0 0.4 0.6 0.03industrial and labor relations review 0.5 0 1.05 0 0.6 0.8 0international journal of game theory 0.5 0 0 0 0.6 0.4 0.06international journal of industrial organization 0.5 0 0 0 0.4 0.4 0.04journal of applied econometrics 0.5 0 0 0.17 0.6 0.6 0.17journal of business 0.5 0 0.89 0 0.5 0.8 0journal of comparative economics 0.5 0 0 0 0.6 0.6 0.03journal of development economics 0.5 0 0.65 0 0.6 0.8 0.06journal of economic behavior and organization 0.5 0 0 0 0.6 0.6 0.07journal of economic dynamics and control 0.5 0 0.65 0.15 0.6 0.6 0.15journal of economic history 0.5 0 0.60 0 0.6 0.6 0.04journal of economic literature 0.5 0 0 0.19 0.8 1 0.19journal of economic perspectives 0.5 0 0 0.34 0.6 0.8 0.34journal of economics and management strategy 0.5 0 0 0 0.6 0.2 0.01journal of environmental economics and management 0.5 0 0 0.12 0.6 0.8 0.12journal of financial and quantitative analysis 0.5 0 0 0 0.6 0.6 0.02journal of financial economics 0.5 0 0.69 0.10 0.8 1 0.10journal of health economics 0.5 0 0 0 0.6 0.8 0.02journal of human resources 0.5 0 0.83 0.21 0.6 0.8 0.21journal of industrial economics 0.5 0 0 0 0.6 0.6 0.04journal of law and economics 0.5 0 0.86 0 0.8 0.8 0.04journal of law, economics, and organization 0.5 0 0.64 0 0.6 0.8 0.04journal of macroeconomics 0.5 0 0 0 0.2 0.4 0.02journal of mathematical economics 0.5 0 0 0 0.6 0.6 0.08journal of population economics 0.5 0 0 0 0.4 0.2 0.02journal of risk and uncertainty 0.5 0 0 0 0.6 0.8 0.06journal of urban economics 0.5 0 0.78 0 0.6 0.8 0.04land economics 0.5 0 0 0 0.3 0.6 0.05public choice 0.5 0 0.67 0 0.6 0.6 0.05regional science and urban economics 0.5 0 0 0 0.6 0.6 0.02review of financial studies 0.5 0 0 0 0.4 0.8 0scandinavian journal of economics 0.5 0 0 0.11 0.6 0.6 0.11social choice and welfare 0.5 0 0 0 0.6 0.4 0.07theory and decision 0.5 0 0 0 0.1 0.2 0.05accounting review 0.33 0 0 0 0.6 0.6 0american political science review 0.33 0 0 0 0.8 0.2 0annales d economie et de statistique 0.33 0 0 0 0.4 0.2 0applied economics 0.33 0 0 0 0.4 0.6 0.02british journal of industrial relations 0.33 0 0 0 0.4 0.6 0brookings papers on economic activity 0.33 0 0 0 0.6 0.8 0.01cambridge journal of economics 0.33 0 0 0 0.4 0.6 0.01carnegie rochester conference series on public policy 0.33 0 0 0 0.4 0.2 0demography 0.33 0 0 0 0.6 0.8 0economic geography 0.33 0 0 0 0.4 0.8 0economic history review 0.33 0 0 0 0.4 0.6 0.01economic inquiry 0.33 0 0.88 0 0.4 0.6 0.06economic modelling 0.33 0 0 0 0.4 0.2 0.01economic policy: a european forum 0.33 0 0 0 0.2 0.2 0economic record 0.33 0 0 0 0.4 0.4 0.03economica 0.33 0 0.98 0 0.6 0.6 0.05economics and philosophy 0.33 0 0 0 0.4 0.4 0.01economics and politics 0.33 0 0 0 0.4 0.2 0economics of transition 0.33 0 0 0 0.4 0.2 0energy economics 0.33 0 0 0 0.4 0.4 0environment and planning a 0.33 0 0 0 0.4 0.8 0european journal of political economy 0.33 0 0 0 0.4 0.2 0european review of agricultural economics 0.33 0 0 0 0.4 0.4 0experimental economics 0.33 0 0 0 0.1 0.1 0geneva papers on risk and insurance theory 0.33 0 0 0 0.4 0.2 0.01history of political economy 0.33 0 0 0 0.1 0.2 0industrial relations 0.33 0 0 0 0.4 0.8 0international journal of urban and regional research 0.33 0 0 0 0.4 0.8 0
continued on next page
22

continued from previous page
CL Blue SM KMS BKLP Bauwens KMSallinternational organization 0.33 0 0 0 0.4 0.8 0journal of agricultural economics 0.33 0 0 0 0.4 0.4 0journal of banking and finance 0.33 0 0 0 0.6 0.6 0.03journal of common market studies 0.33 0 0 0 0.4 0.6 0journal of development studies 0.33 0 0 0 0.4 0.6 0journal of economic growth 0.33 0 0 0 0.6 0.2 0journal of economic studies 0.33 0 0 0 0.4 0.2 0journal of empirical finance 0.33 0 0 0 0.4 0.2 0journal of financial intermediation 0.33 0 0 0 0.1 0.2 0journal of institutional and theoretical economics 0.33 0 0 0 0.4 0.4 0.02journal of international business studies 0.33 0 0 0 0.4 0.8 0journal of international money and finance 0.33 0 0.84 0 0.4 0.6 0journal of post keynesian economics 0.33 0 0 0 0.4 0.4 0journal of regional science 0.33 0 1.03 0 0.4 0.6 0journal of regulatory economics 0.33 0 0 0 0.2 0.2 0.01journal of risk and insurance 0.33 0 0 0 0.6 0.4 0journal of the japanese and international economies 0.33 0 0 0 0.4 0.4 0.01journal of the royal statistical society, series a 0.33 0 0 0 0.1 0.1 0kyklos 0.33 0 0 0 0.4 0.4 0.01labour economics 0.33 0 0 0 0.4 0.2 0marketing science 0.33 0 0 0 0.6 0.6 0mathematical methods of operations research 0.33 0 0 0 0.6 0.2 0mathematical social sciences 0.33 0 0 0 0.4 0.4 0michigan law review 0.33 0 0 0 0.8 0.2 0national tax journal 0.33 0 1.30 0 0.6 0.6 0.04open economies review 0.33 0 0 0 0.4 0.2 0oxford bulletin of economics and statistics 0.33 0 0 0.08 0.6 0.8 0.08oxford economic papers 0.33 0 0 0 0.4 0.2 0.04regional studies 0.33 0 0 0 0.4 0.8 0research policy 0.33 0 0 0 0.2 0.2 0review of international economics 0.33 0 0 0 0.4 0.2 0review of radical political economics 0.33 0 0 0 0.4 0.2 0review of world economics 0.33 0 0 0 0.4 0.4 0sloan management review 0.33 0 0 0 0.4 0.8 0southern economic journal 0.33 0 1.03 0 0.4 0.6 0.03urban studies 0.33 0 0 0 0.6 0.8 0world bank economic review 0.33 0 0 0 0.4 0.6 0.06world development 0.33 0 0 0 0.4 0.8 0.03world economy 0.33 0 0 0 0.4 0.4 0.01yale law journal 0.33 0 0 0 0.7 0.2 0agricultural economics 0.17 0 0 0 0.2 0.1 0american journal of economics and sociology 0.17 0 0 0 0.2 0.4 0antitrust bulletin 0.17 0 0 0 0.4 0.2 0applied economics letters 0.17 0 0 0 0.1 0.2 0atlantic economic journal 0.17 0 0 0 0.2 0.2 0australian economic review 0.17 0 0 0 0.2 0.2 0australian journal of agricultural and resource economics 0.17 0 0 0 0.1 0.2 0bulletin of economic research 0.17 0 0 0 0.2 0.2 0bulletin of indonesian economic studies 0.17 0 0 0 0.1 0.2 0business and economic history 0.17 0 0 0 0.2 0.1 0canadian journal of agricultural economics 0.17 0 0 0 0.2 0.4 0china economic review 0.17 0 0 0 0.1 0.2 0computational economics 0.17 0 0 0 0.1 0.2 0contemporary economic policy 0.17 0 0 0 0.1 0.2 0.02de economist 0.17 0 0 0 0.2 0.4 0defence and peace economics 0.17 0 0 0 0.1 0.2 0developing economies 0.17 0 0 0 0.1 0.2 0.01development 0.17 0 0 0 0.2 0.2 0development and change 0.17 0 0 0 0.2 0.6 0eastern european economics 0.17 0 0 0 0.1 0.2 0ecological economics 0.17 0 0 0 0.2 0.6 0.01econometric reviews 0.17 0 0 0 0.4 0.2 0econometrics journal 0.17 0 0 0 0.1 0.1 0economic analysis 0.17 0 0 0 0.2 0.1 0economic and industrial democracy 0.17 0 0 0 0.2 0.4 0economic and social review 0.17 0 0 0 0.1 0.2 0economic development and cultural change 0.17 0 0 0 0.2 0.6 0.01economic development quarterly 0.17 0 0 0 0.1 0.1 0economics of education review 0.17 0 0 0 0.1 0.2 0economics of planning 0.17 0 0 0 0.1 0.2 0energy journal 0.17 0 0 0 0.1 0.2 0.01environment and planning c: government and policy 0.17 0 0 0 0.2 0.1 0european journal of development research 0.17 0 0 0 0.3 0.2 0european journal of law and economics 0.17 0 0 0 0.2 0.2 0european journal of the history of economic thought 0.17 0 0 0 0.2 0.2 0european review of economic history 0.17 0 0 0 0.1 0.1 0federal reserve bank of new york economic policy review 0.17 0 0 0 0.1 0.2 0federal reserve bank of san francisco economic review 0.17 0 0 0 0.3 0.2 0federal reserve bank of st. louis review 0.17 0 0 0 0.4 0.2 0finance and stochastics 0.17 0 0 0 0.1 0.2 0fiscal studies 0.17 0 0 0 0.4 0.2 0food policy 0.17 0 0 0 0.2 0.2 0foreign affairs 0.17 0 0 0 0.3 0.8 0german economic review 0.17 0 0 0 0.1 0.1 0greek economic review 0.17 0 0 0 0.2 0.2 0growth and change 0.17 0 0 0 0.4 0.4 0health economics 0.17 0 0 0 0.3 0.1 0hitotsubashi journal of economics 0.17 0 0 0 0.1 0.2 0indian economic journal 0.17 0 0 0 0.2 0.2 0insurance: mathematics and economics 0.17 0 0 0 0.2 0.4 0international economic journal 0.17 0 0 0 0.1 0.2 0international economy 0.17 0 0 0 0.1 0.1 0international finance 0.17 0 0 0 0.1 0.2 0international game theory review 0.17 0 0 0 0.1 0.1 0international journal of finance and economics 0.17 0 0 0 0.2 0.1 0international journal of forecasting 0.17 0 0 0 0.4 0.6 0international labour review 0.17 0 0 0 0.2 0.4 0international regional science review 0.17 0 0 0 0.2 0.4 0international review of economics and finance 0.17 0 0 0 0.2 0.2 0international review of law and economics 0.17 0 0 0 0.4 0.2 0jahrbucher fur nationalokonomie und statistik 0.17 0 0 0 0.1 0.2 0japan and the world economy 0.17 0 0 0 0.2 0.2 0journal of accounting and economics 0.17 0 0 0 0.2 0.6 0.01journal of accounting research 0.17 0 0 0 0.2 0.6 0journal of african economies 0.17 0 0 0 0.2 0.2 0journal of agricultural and resource economics 0.17 0 0 0 0.3 0.2 0.01journal of applied statistics 0.17 0 0 0 0.2 0.2 0journal of conflict resolution 0.17 0 0 0 0.2 0.8 0journal of consumer research 0.17 0 0 0 0.1 0.8 0journal of developing areas 0.17 0 0 0 0.2 0.4 0journal of economic development 0.17 0 0 0 0.4 0.2 0journal of economic education 0.17 0 0 0 0.2 0.4 0journal of economic integration 0.17 0 0 0 0.1 0.2 0journal of economic issues 0.17 0 0 0 0.2 0.6 0journal of economic methodology 0.17 0 0 0 0.6 0.2 0journal of economic psychology 0.17 0 0 0 0.4 0.4 0journal of economic surveys 0.17 0 0 0 0.4 0.2 0journal of environmental planning and management 0.17 0 0 0 0.2 0.2 0journal of european economic history 0.17 0 0 0 0.2 0.2 0journal of evolutionary economics 0.17 0 0 0 0.1 0.2 0journal of futures markets 0.17 0 0 0 0.2 0.4 0journal of housing economics 0.17 0 0 0 0.2 0.2 0.01journal of income distribution 0.17 0 0 0 0.3 0.2 0journal of international development 0.17 0 0 0 0.5 0.2 0journal of international trade and economic development 0.17 0 0 0 0.3 0.2 0journal of labor research 0.17 0 0 0 0.4 0.4 0journal of legal economics 0.17 0 0 0 0.2 0.2 0journal of legal studies 0.17 0 0.57 0 0.4 0.2 0journal of peace research 0.17 0 0 0 0.1 0.6 0journal of policy modeling 0.17 0 0 0 0.1 0.2 0.01journal of portfolio management 0.17 0 0 0 0.2 0.4 0journal of productivity analysis 0.17 0 0 0 0.1 0.2 0journal of quantitative economics 0.17 0 0 0 0.3 0.2 0journal of real estate finance and economics 0.17 0 0 0 0.1 0.4 0journal of the history of economic thought 0.17 0 0 0 0.2 0.2 0journal of transport economics and policy 0.17 0 0 0 0.2 0.4 0.01journal of world trade 0.17 0 0 0 0.2 0.4 0labor history 0.17 0 0 0 0.1 0.4 0macroeconomic dynamics 0.17 0 0 0 0.6 0.1 0managerial and decision economics 0.17 0 0 0 0.4 0.2 0manchester school 0.17 0 0 0 0.1 0.1 0.01manchester school of economics and social studies 0.17 0 0 0 0.1 0.2 0.01mathematical finance 0.17 0 0 0 0.1 0.2 0monthly labor review 0.17 0 0 0 0.3 0.6 0national institute economic review 0.17 0 0 0 0.2 0.2 0national westminster bank quarterly review 0.17 0 0 0 0.3 0.1 0natural resources journal 0.17 0 0 0 0.1 0.4 0new political economy 0.17 0 0 0 0.2 0.2 0oecd economic studies 0.17 0 0 0 0.2 0.2 0oxford development studies 0.17 0 0 0 0.2 0.2 0oxford review of economic policy 0.17 0 0 0 0.2 0.2 0.02policy sciences 0.17 0 0 0 0.2 0.4 0politica economica 0.17 0 0 0 0.2 0.2 0population and development review 0.17 0 0 0 0.3 0.8 0population research and policy review 0.17 0 0 0 0.1 0.2 0population studies 0.17 0 0 0 0.4 0.8 0post communist economies 0.17 0 0 0 0.1 0.2 0.01post soviet affairs 0.17 0 0 0 0.2 0.4 0post soviet geography and economics 0.17 0 0 0 0.1 0.4 0problems of economic transition 0.17 0 0 0 0.1 0.2 0
continued on next page
23

continued from previous page
CL Blue SM KMS BKLP Bauwens KMSallrecherches economiques de louvain 0.17 0 0 0 0.3 0.1 0resource and energy economics 0.17 0 0 0 0.2 0.2 0.01resources policy 0.17 0 0 0 0.2 0.2 0review of black political economy 0.17 0 0 0 0.1 0.2 0review of economic design 0.17 0 0 0 0.2 0.1 0review of income and wealth 0.17 0 0 0 0.2 0.4 0.02review of industrial organization 0.17 0 0 0 0.2 0.2 0.01review of international studies 0.17 0 0 0 0.2 0.2 0review of social economy 0.17 0 0 0 0.1 0.2 0revue d economie politique 0.17 0 0 0 0.2 0.2 0revue economique 0.17 0 0 0 0.2 0.2 0scandinavian economic history review 0.17 0 0 0 0.2 0.2 0scottish journal of political economy 0.17 0 0 0 0.2 0.4 0.02small business economics 0.17 0 0 0 0.1 0.2 0.01statistical journal 0.17 0 0 0 0.2 0.2 0statistical papers 0.17 0 0 0 0.2 0.2 0structural change and economic dynamics 0.17 0 0 0 0.2 0.2 0world bank research observer 0.17 0 0 0 0.1 0.4 0.01
24