What's Up With the Washington County Economy
61
What’s Up with the Washington County Economy? Lecia Parks Langston, Senior Economist Utah Department of Workforce Services
-
Upload
state-of-utah-salt-lake-city -
Category
Government & Nonprofit
-
view
370 -
download
2
Transcript of What's Up With the Washington County Economy

What’s Up with the Washington
County Economy?
Lecia Parks Langston, Senior EconomistUtah Department of Workforce Services

How boring is it?

Alternative indicators?

Job growth hovering around
the 5-percent mark

Job growth hovering around
the 5-percent mark

-10%
-5%
0%
5%
10%
15%
Washington County
Source: Utah Department of Workforce Services, U.S. Bureau of Labor Statistics.
Three and one-half
years!
Year-Over Change in Nonfarm Jobs

-6%
-5%
-4%
-3%
-2%
-1%
0%
1%
2%
3%
United States
Source: Utah Department of Workforce Services, U.S. Bureau of Labor Statistics.
Peaked in early 2015, but remains
relatively stable.
Year-Over Change in Nonfarm Jobs

-8%
-6%
-4%
-2%
0%
2%
4%
6%
Source: Utah Department of Workforce Services, U.S. Bureau of Labor Statistics.
Utah’s job growth second
only to our neighbor Idaho
in November 2015.
Utah
Year-Over Change in Nonfarm Jobs

-10%
-5%
0%
5%
10%
15%
Washington
Utah
United States
Source: Utah Department of Workforce Services, U.S. Bureau of Labor Statistics.
Hanging out in the
“zone.”
Year-Over Change in Nonfarm Jobs

-10%-4%
-3%0%
0%1%
2%2%2%
3%3%3%3%
3%3%3%4%4%4%4%
5%5%5%
6%7%7%7%7%
8%
DuchesneUintah
PiuteEmery
CarbonMillardTooele
JuabMorgan
United StatesSevier
San JuanKane
GarfieldGrandCacheDavis
Salt LakeIron
State of UtahWeber
SanpeteWashington
SummitWayne
Box ElderUtah
BeaverRich
WasatchDaggett
Percent Change in Nonfarm Jobs by Industry September 2014 to September 2015
Source: Utah Dept. of Workforce Services.
Moderate is better.

Most industries showing strong to moderate
growth.

Most industries showing strong to moderate
growth.

6
324
283
52
180
159
-2
54
172
351
858
159
123
93
Mining
Construction
Manufacturing
Wholesale Trade
Retail Trade
Transportation/Warehousing
Utilities
Information
Financial Activities
Professional/Business Services
Education/Health/Social Services (Private)
Leisure/Hospitality
Other Services
Government
*PreliminarySource: Utah Department of Workforce Services.
Total jobs up 2,800
Slower in retail trade and
leisure/hospitality while healthcare
speeds up
Washington County Change in Nonfarm Jobs; September 2014 to September 2015*

5%
4%
7%
10%
3%
8%
8%
8%
9%
2%
8%
1%
4%
-19%
7%
2%
4%
4%
5%
5%
6%
5%
2%
2%
Total
Mining
Construction
Manufacturing
Trade/Transportation/Utilities
Information
Financial Activities
Professional/Business Services
Education/Health/Social Services (Private)
Leisure/Hospitality
Other Services
Government
Washington County
Utah
*PreliminarySource: Utah Department of Workforce Services.
Still seeing broad-based
expansion
Percent Change in Nonfarm JobsSeptember 2014 to September 2015*

5%
4%
7%
10%
3%
8%
8%
8%
9%
2%
8%
1%
2%
-12%
3%
1%
2%
2%
2%
3%
3%
3%
1%
0%
Total
Mining
Construction
Manufacturing
Trade/Transportation/Utilities
Information
Financial Activities
Professional/Business Services
Education/Health/Social Services (Private)
Leisure/Hospitality
Other Services
Government
Washington County
United States
*PreliminarySource: Utah Department of Workforce Services; U.S. Bureau of Labor Statistics.
Percent Change in Nonfarm JobsSeptember 2014 to September 2015*

Average wage increased 3
percent in 2014.

Third Quarter 2015 up 3.3
percent.

Washington County Annual Change in Average Monthly Wage
0%
1%
2%
3%
4%
5%
6%
7%
8%
19
91
19
92
19
93
19
94
19
95
19
96
19
97
19
98
19
99
20
00
20
01
20
02
20
03
20
04
20
05
20
06
20
07
20
08
20
09
20
10
20
11
20
12
20
13
20
14
Source: Utah Department of Workforce Services.
Full-employment before wages
increase

Washington County Year-Over Change in Average Monthly Wage
-10%
-5%
0%
5%
10%
15%
20%
Raw Smoothed
Source: Utah Department of Workforce Services.
Quarterly data show
gains.

Unemployment about 4 percent.

Jobless rate expected to measure about 4 percent.

Seasonally Adjusted Unemployment Rates
0%
2%
4%
6%
8%
10%
12%
State of Utah United States Washington County
Too low.
Rates bottomed
out in 2015
Source: Utah Department of Workforce Services; U.S. Bureau of Labor Statistics.

Initial Claims for Unemployment Insurance Four-Week Moving Average
0
20
40
60
80
100
120
Week5
Week10
Week15
Week20
Week25
Week30
Week35
Week40
Week45
Week50
2013 2014 2015
Source: Utah Department of Workforce Services.
No sign of major layoffs

U.S. Gross Domestic Product growing under 2 percent.

U.S. Gross Domestic Product growing just over 2 percent.

U.S Quarterly Change in Real GDP
-10%
-8%
-6%
-4%
-2%
0%
2%
4%
6%
8%
10%Quarter-to-Quarter Change Year-Over Change
Source: U.S. Bureau of Economic Analysis.
Same old, same old

Change in Real Gross Domestic Product
Source: U.S. Bureau of Economic Analysis.
-10%
-5%
0%
5%
10%
15%
2002 2003 2004 2005 2006 2007 2008 2009 2010 2011 2012 2013 2014
United States(Metropolitan Portion)
St. George, UT
Better than average

Change in Real GDP 2013-2014
Source: U.S. Bureau of Economic Analysis.
2.3%
3.0%
3.9%
2.2%
3.6%
4.0%
United States (Metropolitan Portion)
Logan, UT-ID
Ogden-Clearfield, UT
Salt Lake City, UT
Provo-Orem, UT
St. George, UTBest of the Utah MSAs

In 2014, population growth
measured 2.9 percent.

In 2015, population
growth measured ?

10%
7%
8%
10%
8%
7%
5%
3%
4%
3%
4%4%
5%
6%
8%
7%
4%
3%
1%
2%
2% 2% 2%
3%
0%
2%
4%
6%
8%
10%
12%1
99
1
19
92
19
93
19
94
19
95
19
96
19
97
19
98
19
99
20
00
20
01
20
02
20
03
20
04
20
05
20
06
20
07
20
08
20
09
20
10
20
11
20
12
20
13
20
14
20
15
Washington County
Utah
Source: U.S. Census Bureau.
Is 3 percent the new normal?
Population Growth Estimates
152,000 in 2014

Permits issued for 1,400-plus homes.

Permits for roughly 1,500 homes.

Washington County Dwelling Unit Permits
980
1,266
2,114
2,697
2,0191,929
1,5141,687
1,519
1,267
1,740
1,995
2,678
3,7943,860
2,256
1,888
682605
870 846
1,257
1,667
1,440 1,500
Source: U of U; Utah Bureau of Economic and Business Research.
No sign of the excesses of the
bubble.

$16.1
$44.3
$32.0
$75.2
$51.7
$84.8
$30.7$37.4
$68.9
$39.6
$109.6
$43.6
$107.5
$118.2
$176.9
$143.4
$119.2
$46.8
$35.7
$69.4
$113.2
$42.4$44.1
$66.5
1992 1994 1996 1998 2000 2002 2004 2006 2008 2010 2012 2014
Washington County
New Nonresidential Building Permit Valuation
Source: Utah Bureau of Business and Economic Research.
Millions of $Improvement in nonresidential
following residential’s lead.

0
1,000
2,000
3,000
4,000
5,000
6,000
7,000
8,000
9,000
2001 2002 2003 2004 2005 2006 2007 2008 2009 2010 2011 2012 2013 2014 2015
*PreliminarySource: Utah Department of Workforce Services.
Employment rising but not over-heated
Washington County Construction Employment

0
50
100
150
200
250
2001 2002 2003 2004 2005 2006 2007 2008 2009 2010 2011 2012 2013 2014 2015
Unhurried
appreciation
in home
prices
Source: Office of Federal Housing Enterprise Oversight, http://www.ofheo.gov/hpi.aspx.
Washington County Housing Price Index

-40%
-30%
-20%
-10%
0%
10%
20%
30%
40%
50%
2003 2004 2005 2006 2007 2008 2009 2010 2011 2012 2013 2014 2015
Washington County
Salt Lake City MSA
Las Vegas MSA
Source: Office of Federal Housing Enterprise Oversight, http://www.ofheo.gov/hpi.aspx.
Rates of
appreciation
plateauing?
Year-over Change in Housing Price Index (HPI)

0
10
20
30
40
50
60
70
80
2006 2007 2008 2009 2010 2011 2012 2013 2014
U.S.
Washington County
Percent of homes which are affordable to families with the median income.
Affordability
holding
steady.
Source: National Association of Homebuilders; Wells Fargo Bank.
Housing Opportunity Index

Washington County Homes Sold
0
200
400
600
800
1,000
1,200
1,400
2001 2004 2007 2010 2013
Source: Utah Association of Realtors.
Home sales
trending
upward.

Sales growing between 5-10 percent.

Sales growing between 5-10 percent.

-14%-13%
-11%
0%
4%
-1%
8%
4%
1%
8%7% 6%
9%
11%
8%
16%
9% 9%10%
4%
9%
7% 7%6%
9%10%
-14%
-12%
-9%
-2%
4%
2%
4%
6%
4%
7%
9%8% 9% 8%
6% 5%
3% 4% 4%2%
4%
6% 6%5%
4% 5%
1st Qtr2009
1st Qtr2010
1st Qtr2011
1st Qtr2012
1st Qtr2013
1st Qtr2014
1st Qtr2015
Washington County
Utah
Source: Utah State Tax Commission.
Five years of expansion.
Year-to-Year Change in Gross Taxable Sales

New Car and Light Truck Sales
0
200
400
600
800
1,000
1,200
1,400
1,600
2008 2009 2010 2011 2012 2013 2014 2015
Washington County
Source: Utah State Tax Commission.
Best quarter
ever.

Year-Over Change in New Car/Truck Sales
-60%
-40%
-20%
0%
20%
40%
60%
80%
100%
2009 2010 2011 2012 2013 2014 2015
Washington County
12 percent gain in third
quarter
Source: Utah State Tax Commission.

Projected same level economic expansion with
stronger wage growth.

No significant sign of a slowdown

39
24
106
36
58
12
92
120
79
May 1954 - Aug 1957
Apr 1958 - Apr 1960
Feb 1961 - Dec 1969
Nov 1970 - Nov 1973
Mar 1975 - Jan 1980
Jul 1980 - Jul 1981
Nov 1982 - Jul 1990
Mar 1991 - Mar 2001
Jun 2009 to Current
Source: National Bureau of Economic Research.
U.S. Expansionary Periods in Months
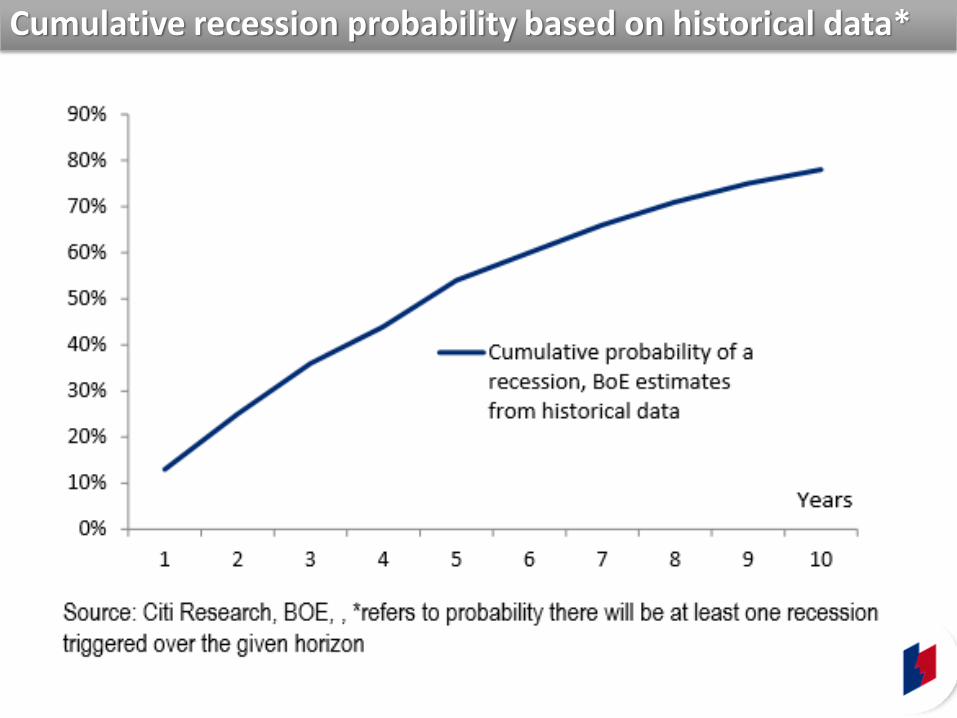
Cumulative recession probability based on historical data*

Risks?

Spread of China’s economic slowdown

Stock Market Bubble

Last two recessions the result of asset bubbles
0
2
4
6
8
10
12
14
16
18
0
5
10
15
20
25
30
35
40
45
50
1860 1880 1900 1920 1940 1960 1980 2000 2020 2040
Lon
g-Te
rm In
tere
st R
ate
s
Pri
ce-E
arn
ings
Rat
io (
CA
PE,
P/E
10
)
Price-EarningsRatio
Long-TermInterest Rates
20001981
1929
1901
1921
25.931966
Suggests market is
over-valued.

Stimulus Went on Too Long

In 2016, keep and eye on the indicators

Year-to-year nonfarm job growth rate.

-6%
-5%
-4%
-3%
-2%
-1%
0%
1%
2%
3%
4%
19
94
19
95
19
96
19
97
19
98
19
99
20
00
20
01
20
02
20
03
20
04
20
05
20
06
20
07
20
08
20
09
20
10
20
11
20
12
20
13
20
14
20
15
Source: U.S. Bureau of Labor Statistics.
U.S. Year-Over Change in Nonfarm Jobs


Don’t sweat the monthly data. Watch the trends.
jobs.utah.gov/wi

Economic Snapshot(Monthly)
Labor Market & Economy Blog
Current
jobs.utah.gov/wi (click on “County Snapshots”)

• Lecia Parks Langston
• Senior Economist, Utah Department of Workforce Services
• 435-688-3115