
What Women Want in Business: A Survey of Executives and Entrepreneurs · What Women Want in...
46
What Women Want in Business: A Survey of Executives and Entrepreneurs
-
Upload
trinhkhanh -
Category
Documents
-
view
217 -
download
2
Transcript of What Women Want in Business: A Survey of Executives and Entrepreneurs · What Women Want in...
What Women Want in Business:
A Survey of Executivesand Entrepreneurs

What Women Want in Business: A Survey of Executives and Entrepreneurs
About Korn/Ferry International
Korn/Ferry International, (NYSE:KFY) with more than 100 offices in 41
countries, is the world’s leading provider of recruitment solutions. The firm
works closely with clients to provide solutions tailored to their recruitment and
assessment needs, through the company’s executive search business, identifying
CEOs, COOs, CFOs, board members and other senior-level executives; through
the firm’s Management Assessment business, which provides evaluation of
senior management teams; through Futurestep, which combines the power of
the Internet with the firm’s proprietary assessment tools and search expertise
to fill the growing demand for middle managers; and through JobDirect,
a U.S.-based online college recruitment company serving client requirements
for college graduates and entry-level professionals.
For more information, visit the Korn/Ferry International Web site at
www.kornferry.com, the Futurestep Web site at www.futurestep.com and
the JobDirect Web site at www.jobdirect.com.
About Columbia Business School’s Eugene M. Lang Center for Entrepreneurship The Eugene M. Lang Center at Columbia Business School serves as a living
laboratory for students’ entrepreneurial ventures. The unique approach to
entrepreneurship education at Columbia Business School combines a
systematic integration of entrepreneurial themes throughout the core
curriculum, a strong elective course program, rigorous hands-on lab courses
and a commitment to making entrepreneurship a viable career option for
students. Course work is led by a world class faculty. The center provides a set
of mentorship programs, which include the “Entrepreneurial Initiative Fund,”
and the “Entrepreneurial Greenhouse Program.” Mentors, largely successful
alumni, provide vigorous, high level advice and guidance throughout the
business development process and the eventual start-up.
About the Duran GroupThe Duran Group, based in New York City, is a consulting firm dedicated to
assisting organizations in the creation of work environments that foster
innovation and high performance through the leveraging of diverse intellectual
capital. A wide array of methods are used to meet this goal including research
on factors that inhibit or facilitate innovation, understanding the changing
career logic in the global environment and identifying the business case for
diversity through econometric modeling. Organizational development, change
management initiatives and skill development in perspective taking are other
tools used by DG consultants to fuel the development and launching of new
ideas within the global or domestic workplace. You can contact the Duran
Group via e-mail at [email protected].

What Women Want in Business: A Survey of Executives and Entrepreneurs
Table of Contents
Executive Summary ................................................................................................5
The Context of the New Economy .......................................................................10
Why This Study? ........................................................................................11
Understanding Why Women Leave Corporations.....................................12
and Why They Wouldn’t Return
The Study Respondents .......................................................................................14
Education ...................................................................................................15
Parental Background..................................................................................15
Home-life....................................................................................................16
Career History ............................................................................................18
Type of Business/Industry..........................................................................18
Functional Areas in Prior Companies .......................................................19
Compensation Package at the Previous Companies..................................20
Number and Type of Previous Companies ................................................20
Small Business Owner Respondents.........................................................21
Beginning the Business..............................................................................22
Sources of Capital ......................................................................................22
Current Work Experiences ........................................................................26
Size and Annual Revenues of Current Businesses ...................................27
Industrial Breakdown of Current Businesses............................................27
Comparison of Industries: Prior and Present ...........................................28
Current Functional Areas: Career Changes ..............................................30
Comparison of Compensation Levels of Owners and Non-owners .........31
Why Did the Women Leave Their Prior Companies?...............................33
Are the Women Satisfied with Their Current Positions?..........................37
Overall Job Satisfaction .............................................................................38
Will the Women Stay in Their Current Positions?....................................40
Age and Commitment................................................................................42
Explanation of Why Women Are Not Likely to Leave ..............................43
Their Present Jobs
Summary ....................................................................................................44
Korn/Ferry International’s World Wide Network.................................................45

What Women Want in Business: A Survey of Executives and Entrepreneurs
In conjunction with Eugene M. Lang Center for Entrepreneurship at
Columbia Business School, Fortune Small Business and the Duran Group
©Copyright 2001 Korn/Ferry International
Acknowledgements
Anna Duran, Ph.D.
President Duran Group and Adjunct Research Scholar Eugene M. Lang Center
for Entrepreneurship at Columbia Business School
Ann Bartel, Ph.D.
A. Barton Hepburn Professor of Economics
at Columbia Business School
Allison Smith
Research Associate Duran Group

5
What Women Want in Business: A Survey of Executives and Entrepreneurs
Executive Summary
There’s something dramatically different about the face of today’s small
business owner… it’s the face of a woman. According to the Small Business
Administration, the number of women-owned businesses increased by nearly
90 percent in the past 10 years. Even more interesting is that the field that’s
drawing these women is technology, whether it involves the development
of high technology products, processes or use of the Internet as a major
business component.
Korn/Ferry International’s What Women Want in Business: A Survey of Executives
and Entrepreneurs sets out to analyze the experiences of women who have left
large corporate environments to start their own businesses or to work for a
small business in the field of technology. What factors explain why so many
women have made these career decisions? What qualities of ownership or small
business appeal to these women? What can large companies do to retain their
best female talent? How can the experiences of these women help others who
are considering making a similar move?
Using a 60-item survey, we set out to gather answers to these and other
questions. Four hundred twenty-five women responded of which 272 are
entrepreneurs and 153 work for small businesses. In addition, we personally
interviewed 32 women who either work in small business environments or
who founded their own companies.
Who Are These Women?The average age of these women is 41 years, with half the sample 40 years and
under. The majority — 85 percent — is of white European descent, while 15
percent come from a variety of minority communities. This is a highly educated
group with almost one-quarter of the owners (23 percent) and one-third of the
non-owners having MBAs. Another third of the total group (32 percent) has
completed at least a four-year degree. More than half (57 percent) are married,
36 percent are single or divorced and seven percent are living in an unmarried
domestic partnership. Half the women in the sample have at least one child.
6
What Women Want in Business: A Survey of Executives and Entrepreneurs
Career HistoryPrior to their current positions, the women spent about five years working for
another company, many of them holding the title of Vice President, Director or
Manager. More than one-third (37 percent) previously worked in the advanced
technology industry, and almost one-third (30 percent) worked in marketing,
advertising or sales in their prior companies. During the course of their careers,
the women worked for about 4.5 other companies with over one-fifth
(21 percent) gaining international experience by working outside the United
States. For more than one-quarter of the group (29 percent), this is not their
first foray into owning a business.
Financing a New BusinessThe majority of the businesses owned by respondents are fairly young
enterprises with more than three-quarters (77 percent) having started their
business within the past five years. More than four-fifths (83 percent) used
their personal capital or funds. Family or friends funded almost half of the
businesses — 48 percent — while venture capital (VC) investors funded only
14 percent of the companies.
The prime indicator of capitalization is the age of the business. Businesses that
began six or more years ago were much more likely to use bank loans than
younger companies, and used less VC funding, perhaps because VC firms have
greatly increased their funding of e-commerce businesses during the past three
years. Those who did not seek VC funding explained that they wanted to remain
in control of their businesses.

7
What Women Want in Business: A Survey of Executives and Entrepreneurs
What Are Their Current Work Experiences?Advanced technology is the industry of choice for most of these women. In fact,
36 percent of the owners and almost two-thirds of the non-owners are in this
industry. The vast majority view technology as the most important tool in their
business with 83 percent stating this fact.
The women report that they currently work about 55 hours a week. For business
owners, this means fewer work hours unlike the non-owners who did not report
a shorter workweek. Many of these women have reduced their travel. Almost
half of owners (47 percent) and an almost equal number of the non-owners
(41 percent) report now traveling fewer days per month.
When it comes to income, these business owners travel two roads. Some start
in low-income brackets and easily catapult to higher brackets. Others leave
well-compensated positions and move to a lower bracket. Non-owners have
much less fluidity.
Why Did These Women Leave Their Prior Companies?Opportunity is the chief reason respondents started their own businesses:
(1) the opportunity to take risks with new ideas and test personal limits,
(2) the opportunity to create wealth and (3) the opportunity to have an impact
on strategic issues.
Many owners are motivated by their desire to have more time for their families
and personal pursuits, with half indicating that this was a significant motivator;
in fact, it is the fourth most important factor chosen. Among non-owners,
however, less than one-quarter (23 percent) point to more family or personal
time as the impetus to leave their prior companies. It is ranked 11 out of 13
options on the survey.
Did women with children leave their prior companies for different reasons than
women who aren’t mothers? Entrepreneurial mothers are much more likely to
say they left so that they could have more time for family and personal interests
as compared to entrepreneurs without children. However, non-owners do not
cite having children as a factor.

8
What Women Want in Business: A Survey of Executives and Entrepreneurs
Are the Women Satisfied With Their Current Positions?Business ownership points to more satisfaction. While the majority of
respondents report career satisfaction, owners express more satisfaction than
non-owners. In fact, three-quarters of owners report being very satisfied
compared to half of the non-owners. Owners who work fewer hours than in
their prior jobs indicate that they are very satisfied.
Women reviewed a list of 20 ways in which their current lifestyles could be
more or less satisfying than their prior work experiences. Owners are much
more likely than non-owners to report greater satisfaction with the “pace of
work” (88 percent vs. 66 percent) and “working with a minimum amount of
disruption” (65 percent vs. 38 percent). More than three-quarters of owners
(75 percent) say their life is satisfying in terms of personal interests while less
than half (39 percent) of the non-owners agree.
Both groups overwhelmingly report greater satisfaction in terms of a position’s
non-tangibles:
■ Recognition for accomplishments
■ Opportunity to learn new skills
■ Opportunity to develop objectives and strategies
■ Authority to make decisions that impact the entire organization
■ Working with novel and new ideas
■ Opportunity to realize a personal dream or vision.

9
What Women Want in Business: A Survey of Executives and Entrepreneurs
How Likely Are These Women to Stay in Their Current Positions?Not surprisingly, owners are more committed to their current businesses than
non-owners. Almost two-thirds of the owners (63 percent) said they were not
likely to leave their current business in the next year or two, compared with
one-third (32 percent) of the non-owners.
What would they do if they sold or left their businesses? One-quarter
(26 percent) would start another one and one in ten (12 percent) of non-owners
would launch their own enterprise. Another 22 percent of the owners and
29 percent of the non-owners would join another group of entrepreneurs.
Only five percent of owners, but as many as 11 percent of the non-owners,
would return to corporate life.
Female owners and non-owners with children are more likely to stay in their
current positions. Owners with children report that should they sell their
current company, they are more likely to open up a new business compared
to owners without children.
ConclusionsIn an economy characterized by increased competition, technology and
innovation, corporate leaders need to understand that it is essential to have a
workplace environment that is conducive to attracting and retaining talent.
Our study reveals that large companies seem to be losing this “war for talent”—
especially when it comes to innovative and entrepreneurial women — as the
top talent looks to the small business setting for their next career move.
Unlike previous decades, today’s businesswomen do not consider the large
corporate environment as the ideal place to pursue their dreams of innovation
and creativity. In fact, many of them are taking the skills they learned in the
corporate setting and applying them to new positions in the small business
world, either as owners or non-owners. In addition, women with children are
viewing entrepreneurship as the ideal way to blend their family needs with
the ability to launch their creative business ideas.
The women we studied have strong desires to pioneer new innovations —
generating ideas, developing ideas and learning from their impact. Corporations
would be well advised to consider the role of women in the new economy,
offering them more control over the strategic process and reducing constraints
on creativity if they hope to retain talent.
10
What Women Want in Business: A Survey of Executives and Entrepreneurs
The Context of the New Economy
Small businesses are clearly an important part of the new economic landscape.
As part of this trend, women are leaving large corporations to join small
businesses or to start their own firms. What are some of the reasons for this
increasing exodus?
In order to answer this question, we need to take a look at the factors behind
corporate America’s new economy. One element is the overwhelming presence
of telecommunications and computer networking, which is removing geographic
boundaries and improving work efficiency. Nowhere is the impact of today’s
new economy being felt more than in the small business. In fact, eight out of
10 small businesses are expected to use the World Wide Web by the year 2002.
As the workplace changes, policy makers within large and small companies are
trying to understand how to attract and retain critical talent.
“Winning the war for talent” has become one of corporate America’s greatest
challenges. Dynamic, talented people are looking for a workplace to serve
as an incubator for their new ideas. A recent report on the expansion of
e-commerce activity says that large companies may not always be the best place
for creative opportunities. “In fact, small firms are the source of more than
half the innovations in products and processes. This is due primarily to more
opportunities for creating new ideas, the reduction in approval time, quickly
moving viable ventures into the revenue stream, and having fewer constraint
or control factors generally associated with large organizations.”
Women who are thinking about
leaving a large company for the
life of a small business or to start
their own enterprise…

11
What Women Want in Business: A Survey of Executives and Entrepreneurs
Why This Study?Career logistics are changing.
Women represent an increasing number of those who are moving toward the
advantages of opportunities for wealth creation, achieving autonomy to make
strategic decisions and moving up faster to the top of the leadership ladder.
In fact, according to the Small Business Administration, the number of women-
owned businesses increased nearly 90 percent in the last decade. Further,
smaller firms — that is businesses with fewer than 10 people — tend to hire
more women than larger firms. Obviously, women entrepreneurs and women
who work in small businesses are an essential ingredient of the economy,
representing a much-desired source of talent.
With these ideas in mind, we set out to analyze the experiences of women who
have left large corporate environments to start their own businesses or to work
for small businesses. What are the factors that can explain why women have
made these career decisions? What qualities about large and small business
environments appeal to these women? Do the reasons for leaving large
businesses vary by cohort or by the presence of children? Are the experiences
of women who own their own businesses versus working in a small business
environment different? What can large companies do to retain female talent?
How can the experiences of these women help other women who are
considering leaving large companies to work in a small business environment
or to start their own businesses?
“…need to be aware that working
in a small business involves a
frenetic pace and it’s more
unpredictable.”

Women who are thinking about
leaving a large company for the
life of a small business or to start
their own enterprise…
12
What Women Want in Business: A Survey of Executives and Entrepreneurs
Understanding Why Women Leave Corporations and Why TheyWouldn’t Return Studies have shown that women are joining small businesses or developing
their own firms in record numbers. What explanations are given for this exit?
In the past, women’s lack of advancement up the career ladder and subsequent
movement into small business have been related to a number of factors.
■ The contractual factor includes differences in compensation; lack of
responsiveness to meeting the needs of employees such as providing work-
life balance programs; and insufficient work performance recognition.
■ A second influence, known as a control factor, involves not having the
authority to make decisions, very little say-so about work pace and work
partner choices and having few or no opportunities to develop business
objectives and strategies.
■ And finally a third element, frequently referred to as a constraint factor,
involves experiences that restrain opportunity such as not having access to
mentors, working in an environment that has a low tolerance for risk and
that does not offer sufficient opportunity for innovation. Other factors that
are experienced as constraining include work interruptions, not having
advancement opportunities and haggling over resources.
While large organizations have not done all that they can to keep the talent
from leaving, there are other reasons that need to be described. Corporations
have made positive contributions that have caused these women to leave.
They have created opportunities in a different way.

13
What Women Want in Business: A Survey of Executives and Entrepreneurs
Despite the factors described above, many women — called intentional
entrepreneurs — have planned to enter the corporate environment for a few
years, learn what they can, save their money and then move with others that
they have met during the course of their work lives to create a new enterprise.
Another group of women — known as careerbanders1— move in and out of
corporate life to entrepreneurial life and back again to a large organization.
The reasons for leaving are mixed and are oriented toward taking advantage
of opportunities. It is important to note that even if a large company addressed
all of the constraining and contractual limitations, some women do not see
themselves as part of the corporate environment for life.
Clearly, small businesses are a growing part of the economic landscape, and
women are an essential ingredient of this shift. The results of this study
provide some clues as to the business environment needs and preferences
of the talented women of our new economy.
1Moore, D.P. (2000). Career Preneurs. Lessons from leading women entrepreneurs on building a careerwithout boundaries. Palo Alto, California: Davies-Black Publishing.
“…need to have a strong sense
of responsibility—in a small
environment, you are
100 percent responsible.”
14
What Women Want in Business: A Survey of Executives and Entrepreneurs
Women who are thinking about
leaving a large company for the
life of a small business or to start
their own enterprise…
5%
37%
15%
2%
42%
0% 10% 20% 30% 40% 50%
18 - 29 years:
30 - 39
40 - 49
50 - 59
60 - 69
9%
40%
16%
35%
0% 10% 20% 30% 40% 50%
18 - 29 years
30 - 39
40 - 49
50 - 59
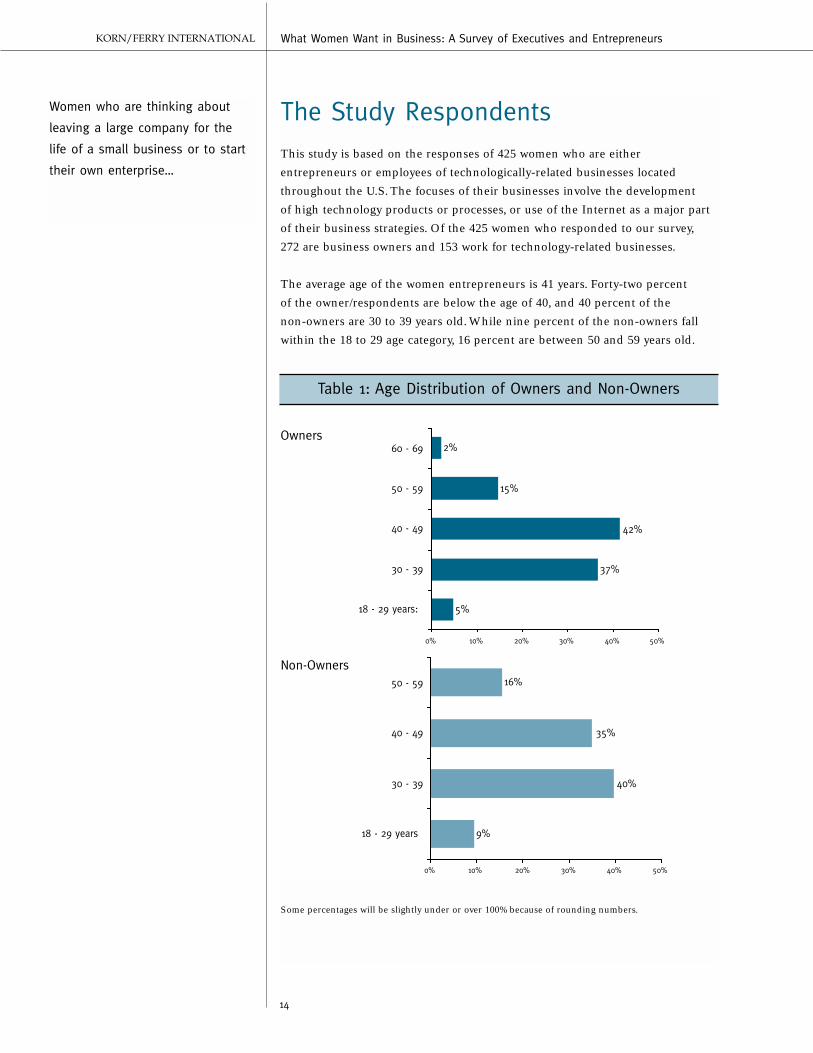
Table 1: Age Distribution of Owners and Non-Owners
Non-Owners
Owners
Some percentages will be slightly under or over 100% because of rounding numbers.
The Study RespondentsThis study is based on the responses of 425 women who are either
entrepreneurs or employees of technologically-related businesses located
throughout the U.S. The focuses of their businesses involve the development
of high technology products or processes, or use of the Internet as a major part
of their business strategies. Of the 425 women who responded to our survey,
272 are business owners and 153 work for technology-related businesses.
The average age of the women entrepreneurs is 41 years. Forty-two percent
of the owner/respondents are below the age of 40, and 40 percent of the
non-owners are 30 to 39 years old. While nine percent of the non-owners fall
within the 18 to 29 age category, 16 percent are between 50 and 59 years old.
15
What Women Want in Business: A Survey of Executives and Entrepreneurs
For all respondents, 57 percent are married, 36 percent are single or divorced
and seven percent live in an unmarried domestic partnership. With regard to
ethnicity, 85 percent are of white European descent, while 15 percent come
from a variety of minority communities. For respondents from outside of the
U.S., 80 percent are of European descent, nine percent have an Asian heritage
and 11 percent are from a variety of other groups.
EducationThis group of women entrepreneurs is highly educated. Twenty-three percent of
the owners and one-third of the non-owners have MBA degrees. Another one-
third (32 percent) of the total group of women have achieved at least a four-year
college degree, and five percent are still in college.
Parental BackgroundThe parents of this group primarily worked in professional/technical areas.
The influence of their fathers’ interests is noticeable in terms of career choice
and the occupation of the spouse that they eventually selected to marry. Yet it
is interesting to note that while almost one-third of the mothers did not work
outside of the home (31 percent), the next largest group, represented by their
mothers, was in the professional technical area (28 percent).
“…need to realize that when
experiencing the challenge of
running a business, one shouldn’t
give up. Just push forward.”

Women who are thinking about
leaving a large company for the
life of a small business or to start
their own enterprise…
16
What Women Want in Business: A Survey of Executives and Entrepreneurs
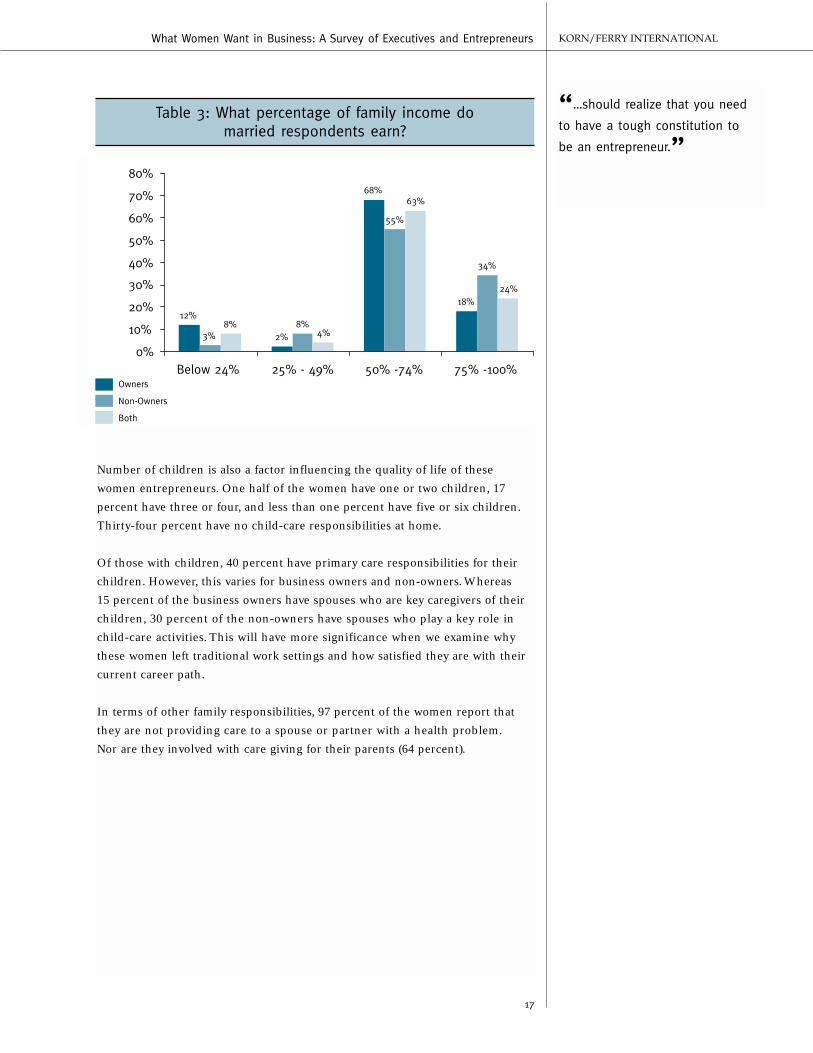
Home–lifeTwenty-four percent of the women in our sample earn 75 percent to 100 percent
of the family income, and another 63 percent earn from 50 percent to 74
percent. In total, 87 percent of the married women earn more than 50 percent
of the total family income. Contrasting this finding with the fact that about a
third of the women in our study came from families in which mothers did not
work outside of the home clearly reinforces that times have changed.
Table 2: Parents and Spouse Occupations
¥
42%
18%
69%
3%
31%
6%2%
6%6%
14%
7%
28%
<1%<1%
7%
15%17%
0%1%3%1%
6%
16%
0%
10%
20%
30%
40%
50%
60%
70%
Professional/Technical
Managerial Clerical Sole Proprietor Blue-collar Governmentservice
CommunityVolunteer
Did not workoutside
Mother Father Spouse
17
What Women Want in Business: A Survey of Executives and Entrepreneurs
Number of children is also a factor influencing the quality of life of these
women entrepreneurs. One half of the women have one or two children, 17
percent have three or four, and less than one percent have five or six children.
Thirty-four percent have no child-care responsibilities at home.
Of those with children, 40 percent have primary care responsibilities for their
children. However, this varies for business owners and non-owners. Whereas
15 percent of the business owners have spouses who are key caregivers of their
children, 30 percent of the non-owners have spouses who play a key role in
child-care activities. This will have more significance when we examine why
these women left traditional work settings and how satisfied they are with their
current career path.
In terms of other family responsibilities, 97 percent of the women report that
they are not providing care to a spouse or partner with a health problem.
Nor are they involved with care giving for their parents (64 percent).
Owners
Non-Owners
Both
2%
68%
18%
3%
34%
24%
12%8%
55%
63%
4%8%
0%
10%
20%
30%
40%
50%
60%
70%
80%
Below 24% 25% - 49% 50% -74% 75% -100%
Table 3: What percentage of family income do married respondents earn?
“…should realize that you need
to have a tough constitution to
be an entrepreneur.”

Women who are thinking about
leaving a large company for the
life of a small business or to start
their own enterprise…
18
What Women Want in Business: A Survey of Executives and Entrepreneurs
Career HistoryPrior to joining their current companies or starting their own businesses, these
women spent an average of 4.5 years working in other companies. Table 4 shows
the breakdown by industry of the women’s prior companies.
Type of Business/IndustryNot surprisingly, 37 percent of these women had previously worked in the
advanced technology industry. The second most frequently represented industry
is professional services (15 percent).
Prior to starting their own businesses or working at their current companies,
these women held a myriad of positions and titles. Most commonly reported
were Vice President, Director and Manager.
37%
15%
1%
6%
5%
4%
4%
1%
4%
3%
2%
1%
3%
1%
2%
1%Pharmaceuticals
Consumer Products
Aerospace Defense
Apparel, Retail, Textiles
Insurance
Education
Healthcare
Banking
Real Estate
Entertainment/Hospitality
Industrials (chemicals, plastics, metals etc.)
Financial Services
Consulting
Energy, Utilities
10%Other
Professional Services
Advanced Technology
Table 4: Previous Company

19
What Women Want in Business: A Survey of Executives and Entrepreneurs
Functional Areas in Prior CompaniesFor both owners and non-owners, the marketing/advertising/sales function is
most predominant with more than 30 percent of the women having worked in
this area. This is followed by executive/senior management and
professional/technical positions.
2%
1%
2%
12%
14%
10%
0%
1%
3%
14%
16%
17%
0%
0%
0% 5% 10% 15% 20%
President
CEO & President
CEO
CFO
Manager
Director
Vice President
Owners
Non-Owners
Table 5: Most Commonly Reported Titles of Prior Position “…need to be someone
with mettle.”
“…need to borrow correctly and
start with the right revenue.”
¥
7%
2%
10%
7%
1%2%
5%
15%
4%
15%
32%
7% 7%
10%10%
30%
7%
18%
9%
0%
5%
10%
15%
20%
25%
30%
35%
40%
Financial/Accounting
Marketing/Advertising/
Sales
Professional/Technical
HumanResources
Executive/ Sr.Management
Special ProjectManager
Production/Manufacturing
ConsumerAffairs
Academic GeneralManagement
InformationTechnology
Small BusinessOwner
Owners Non Owners
Table 6: Functional Area at Previous Company
What was your functional area or the focus of your work?

Women who are thinking about
leaving a large company for the
life of a small business or to start
their own enterprise…
20
What Women Want in Business: A Survey of Executives and Entrepreneurs
Compensation Package at the Previous CompaniesMost of the women owners and non-owners alike earned between $50,000 and
$150,000 at the time they left corporate America. However, the non-owners
were much more likely to have been in the top compensation brackets, with 11
percent of non-owners earning at least $300,000 in their prior jobs compared
to only seven percent of the owners. Base salary accounted for approximately 83
percent of the total compensation for owners in their prior jobs and 79 percent
of the total compensation for non-owners.
Number and Type of Previous CompaniesDuring the course of their careers, these women have worked for approximately
4.5 companies. Twenty-one percent of the women have worked in a country
other than the U.S.
Interestingly, 29 percent of the women in the sample report having owned a
business other than the one in which they work or currently own, although
this varies for business owners and non-owners. Among the sample of current
owners, 35 percent reportedly have previously owned a business, while
19 percent of the non-owners did so. These businesses were most likely in the
advanced technology, consulting and professional services industries.

21
What Women Want in Business: A Survey of Executives and Entrepreneurs
Small Business Owner RespondentsWhile 43 percent of the owners that we studied are sole proprietors of their
businesses, many of these respondents are not working by themselves. Forty-eight
percent have 1 to 4 partners with principal roles in their businesses and another
eight percent have 5 to 6 partners. The partners are more likely to be male.
19%
15%
15%
13%
6%
5%
4%
4%
3%
3%
2%
2%
2%
2%
2%
1%
Pharmaceuticals
Energy, Utilities
Insurance
Education
Healthcare
Industrials (chemicals, plastics, metals etc.)
Financial Services
Consumer Products
Banking
Aerospace Defense
Real Estate
Entertainment/Hospitality
Apparel, Retail, Textiles
Other
Professional Services
Consulting
Advanced Technology
Table 7: Industry of Prior Company of Owners
If a prior company was owned, in what industry was the business?
“…need to be mindful of who
your partners are.”
“…need to surround yourself
with people who have the same
values as you.”
Women who are thinking about
leaving a large company for the
life of a small business or to start
their own enterprise…
22
What Women Want in Business: A Survey of Executives and Entrepreneurs
Beginning the BusinessThe level of maturity of the businesses that are owned by these women is
fairly young — most were developed over the last five years. In general, these
new businesses financed their enterprises the same way as most businesses.
However, the data from the sample of women reveals that there are differences
between businesses that are younger versus those that are more mature, as
described below.
Sources of Capital Those who identified themselves as owners of their businesses were asked to
identify all of the sources of capital that they used to finance their firms. As
might be expected, 83 percent indicated that they used their personal capital
or funds. While many had savings from which to draw support for the
implementation of their vision, 20 percent reported borrowing from friends,
28 percent from family and 32 percent used credit cards. Only 14 percent said
that they used VC funds to begin their businesses.
Further analyses reveal that capitalization of these businesses varied by age of
the business. Businesses that began six or more years ago used personal funds,
although respondents say they had access to bank loans and used credit cards
more frequently than those who began their enterprises less than five years ago.
The women who own older businesses had less VC funding to start, perhaps
attributed to the fact that VC’s efforts to fund e-commerce related businesses
have increased significantly over the last three years.

23
What Women Want in Business: A Survey of Executives and Entrepreneurs
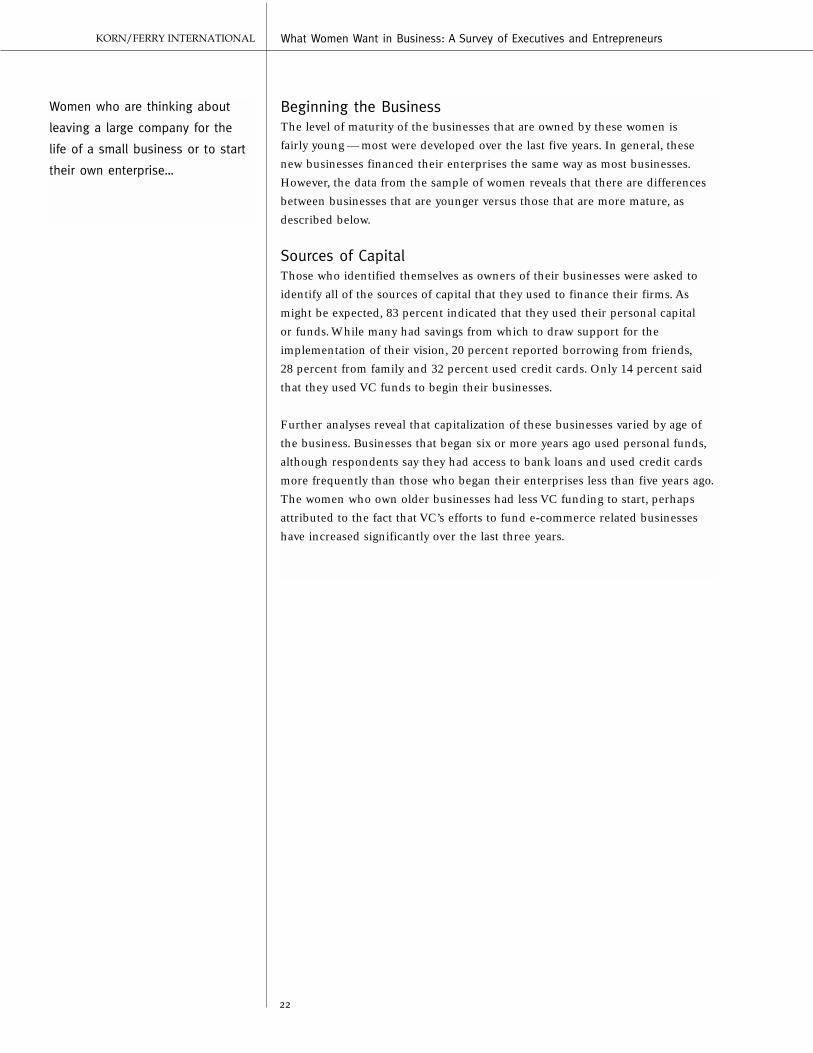
To explore whether or not these owners sought venture capitalist resources,
participants were asked how many contacts had been made with VCs.
Interestingly, 71 percent of the women entrepreneurs did not seek funding
from VCs for a variety of reasons.
Most often cited for not considering a VC relationship was clear — these women
entrepreneurs wanted to remain in control of their businesses.
Other reasons identified include not having reached a certain level of
achievement within their businesses, feeling unsure about the growth of their
venture and not having sufficient information.
Less than 3 years
3-5 years
6+ years
9%
19%
83%
25%
16% 16%
6%
87%
11%
29%24%
78%
39%
11%11%
24%
17%
42%
33%29%
18%
0%10%20%30%40%50%60%70%80%90%
100%
Friends Family Bank Loan(s) Venture Capital PersonalCapital/funds
Credit cards Other
Table 8: What sources of capital have you used to finance your business?
“…need to get a good mentor.
It is the most important
thing you can do.”
Women who are thinking about
leaving a large company for the
life of a small business or to start
their own enterprise…
24
What Women Want in Business: A Survey of Executives and Entrepreneurs
Among those who did seek VC support, 79 percent did not receive any offers,
while 18 percent reportedly had 1 to 3 offers and three percent received
between 4 and 7 overtures. However, nine percent of the women who did, in
fact, receive offers, noted that the proposals were unreasonable.
More of the women with younger businesses (19 percent) reported that they
sought VC support as opposed to those who began businesses three to five years
ago and more than six years ago (11 percent and six percent, respectively).
Keeping costs down is a priority for these business owners as they have
structured the funds for their businesses based on equity. Their financial
strategy is fairly standard — as profits take over the continuation of the
business, the use of personal capital recedes. For the more mature businesses —
especially those six years and older — personal funds are likely to carry their
businesses forward while younger businesses have significantly more investor
support. Noteworthy is that these women have such a strong commitment to
their entrepreneurial visions that they are willing to use their personal
resources to back up their ideas. More than half are clearly using their personal
savings to run their businesses.
45%
25%
13%
11%
8%
7%
0.0% 10.0% 20.0% 30.0% 40.0%
Insufficient information
Unsure about growth
Locks in a commitment
Not achieved major goals
Other
Remain in control
Table 9: VC Relationship Consideration
If you have not seriously considered entering a venture capital relationship, why not?

25
What Women Want in Business: A Survey of Executives and Entrepreneurs
Given the current state of the economy, it is important to determine how
committed these women are to staying in entrepreneurial situations versus
seeking the security of working in a large corporation. Financial demands,
long hours that come from client or customer obligations and management
responsibilities are but a few sources of pressure. What are the key motivators
that will influence their decisions about their career paths? How satisfied are
these women with their lives? Would they return to a traditional environment
if they had an opportunity?
Less than 3 years
3-5 years
6+ years
52%
21%
36%
11%8%
23%
9%12%
23%21%
58%
11%7%
81%
33%
0%
10%
20%
30%
40%
50%
60%
70%
80%
90%
PersonalCapital/funds
Individual Investors Based upon equity Other
Table 10: What have been the ways in which you havestructured the majority of the funds for your business?
“…need to conduct a due
diligence process (before
joining a small business in
a senior-level position)”

In order to attract and retain
talented women, key actions that
a corporation can take include…
26
What Women Want in Business: A Survey of Executives and Entrepreneurs
Current Work ExperiencesWork Hours
These women currently work 54 to 55 hours per week. While 31 percent of
the women business owners report that they are working fewer hours now
compared to their prior position, 13 percent of the non-owners are working
fewer hours. While owning a business may be the vehicle by which some
women are able to reduce their weekly hours, this is not true for all owners.
Thirty-two percent say that they are working more hours per week than in
their prior jobs. Among non-owners, 34 percent report working more hours.
Travel
While half of the women report that they travel between 0 and 2 days per
month on business, another 27 percent to 30 percent of the women travel
between 3 and 5 days per month.
When women were asked to compare their current monthly travel days to the
amount they traveled in their last position prior to starting or joining their
current business, 47 percent of the owners and 41 percent of the non-owners
note that they are traveling fewer days per month now. Another 25 percent
report that they are traveling more.

27
What Women Want in Business: A Survey of Executives and Entrepreneurs
Size and Annual Revenues of Current BusinessesOwned businesses tend to be small; 55 percent have no more than seven
employees and 67 percent have annual revenues under $1 million. By contrast,
74 percent of the non-owners say the businesses in which they work have at
least 26 employees. Twenty-nine percent of the non-owners work in businesses
with annual revenues of at least $20 million.
Industrial Breakdown of Current BusinessesAdvanced technology is most frequently represented among both owners and
non-owners. Thirty-six percent of the owners and almost two-thirds of the non-
owners cite advanced technology as their current business sector. The second
industry most frequently cited among owners is professional services
(27 percent).
Professional services and consulting sectors account for nine percent and seven
percent respectively of the non-owners’ current businesses.
¥
33%
12% 11%8%
3% 4%
29%
7%1%2%4%5%
15%
67%
0%
10%
20%
30%
40%
50%
60%
70%
Under $1 million $1million to $2.5million
Over $2.5 million to$6 million
Over $6 million to$10 million
Over $10 million to$15 million
Over $15 million to$20 million
Over $20 million
Owners Non-Owners
<
Table 11: Annual Revenue of Current Organization
Whether you own your own business or work in a company, what is thecompany’s approximate annual revenue (in U.S. dollars)?
“...being flexible, women are very
good at multi tasking. Therefore,
accommodate their desire for
flexible schedules.”

In order to attract and retain
talented women, key actions that a
corporation can take include…
28
What Women Want in Business: A Survey of Executives and Entrepreneurs
Comparison of Industries: Prior and PresentThe percentage of business owners in advanced technology companies now and
in their previous companies is the same. Compared to their prior companies,
the percentage of owners currently in professional services and consulting
increased and decreased for industrials, financial services and banking.
¥
36%
17%
6%5%
3%2%
5%
2%0%0%
2%
16%
27%
36%
0%
10%
20%
30%
40%
50%
Advanced Technology Professional Services Consulting Financial Services Banking Apparel/Retail/Textiles Industrials
Previous Current
Table 12: Previous and Current Industries – Owners

29
What Women Want in Business: A Survey of Executives and Entrepreneurs
Among non-owners, there is a dramatic increase in representation in the
advanced technology sector compared to their prior companies — 65 percent
versus 39 percent. Conversely, decreases are reported for the apparel/retail/textiles,
industrials, banking and professional services industries among the non-owners.
¥
39%
12%
7%5% 5% 5%
3%
1%0%1%
3%
7%
9%
65%
0%
10%
20%
30%
40%
50%
Advanced Technology Professional Services Consulting Financial Services Banking Apparel/Retail/Textiles Industrials
Previous Current
Table 13: Previous and Current Industries – Non-Owners
“…recognizing and rewarding
female talent.”

In order to attract and retain
talented women, key actions that
a corporation can take include…
30
What Women Want in Business: A Survey of Executives and Entrepreneurs
Current Functional Areas: Career ChangesThirty-three percent and 37 percent of owners and non-owners, respectively,
report their functional area as executive/senior management.
For both owners and non-owners, the number of women in executive/senior
management now doubles compared to functions in their prior companies.
For owners, there are significant decreases in the financial/accounting,
marketing/advertising/sales and professional/technical functions. Among non-
owners, the financial/accounting, marketing/adverting/sales and special project
manager functions all declined in representation.
¥
7%
32%
15%
4%
15%
5%
2%0%
1%
10%
2%2%0%
8%
21%
0%0%
33%
2%
8%
19%
2%
0%
10%
20%
30%
40%
50%
Finan/ Accting Marketing/Adv./Sales
Prof./ Tech HumanResources
Exec/ Sr Mgt SpecialProject
Manager
Prod/ Mfg ConsumerAffairs
Academic InformationTechnology
SmallBusiness
Owner
Previous Current
Table 14: Comparison of Functional Area for Owners
¥
10%
30%
10% 9%
18%
7%
0% 0% 0%
7% 7%
0%1%
0%
7%5%
0%0%1%
37%
7%
10%
24%
6%
0%
10%
20%
30%
40%
50%
Finan/Accouting
Marketing/Adv/Sales
Prof/ Tech HumanResources
Exec/ SrMgmt
SpecialProject
Manager
Prod/ Mfg ConsumerAffairs
Academic GeneralMgmt
InformationTechnology
SmallBusinessOwner
Previous Current
Table 15: Comparison of Functional Area for Non-Owners

31
What Women Want in Business: A Survey of Executives and Entrepreneurs
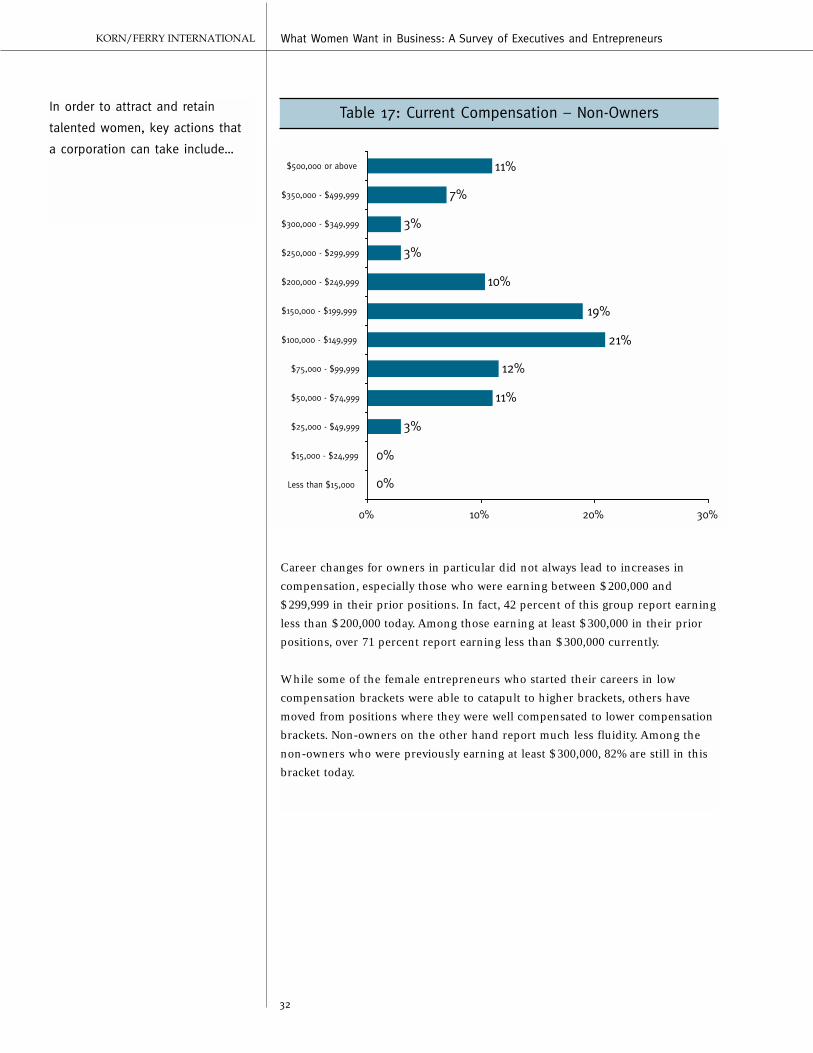
Comparison of Compensation Levels of Owners and Non-ownersEighteen percent of the owners and 21 percent of the non-owners are earning
at least $300,000. Ten percent of the owners and 11 percent of the non-owners
are earning at least $500,000 (see Tables 16 & 17). Among the owners who
report current compensation levels of at least $300,000, only 12 percent had
prior salaries of that magnitude, while among non-owners, 46 percent of those
currently earning at least $300,000 were in that bracket in their prior positions.
9%
4%
10%
12%
10%
8%
4%
4%
10%
10%
18%
3%
0% 10% 20% 30%
Less than $15,000
$15,000 - $24,999
$25,000 - $49,999
$50,000 - $74,999
$75,000 - $99,999
$100,000 - $149,999
$150,000 - $199,999
$200,000 - $249,999
$250,000 - $299,999
$300,000 - $349,999
$350,000 - $499,999
$500,000 or above
Table 16: Current Compensation – Owners “…establishing an environment
where employees can see
results.”
32
What Women Want in Business: A Survey of Executives and Entrepreneurs
Career changes for owners in particular did not always lead to increases in
compensation, especially those who were earning between $200,000 and
$299,999 in their prior positions. In fact, 42 percent of this group report earning
less than $200,000 today. Among those earning at least $300,000 in their prior
positions, over 71 percent report earning less than $300,000 currently.
While some of the female entrepreneurs who started their careers in low
compensation brackets were able to catapult to higher brackets, others have
moved from positions where they were well compensated to lower compensation
brackets. Non-owners on the other hand report much less fluidity. Among the
non-owners who were previously earning at least $300,000, 82% are still in this
bracket today.
In order to attract and retain
talented women, key actions that
a corporation can take include…
3%
11%
12%
21%
19%
10%
3%
3%
7%
11%
0%
0%
0% 10% 20% 30%
Less than $15,000
$15,000 - $24,999
$25,000 - $49,999
$50,000 - $74,999
$75,000 - $99,999
$100,000 - $149,999
$150,000 - $199,999
$200,000 - $249,999
$250,000 - $299,999
$300,000 - $349,999
$350,000 - $499,999
$500,000 or above
Table 17: Current Compensation – Non-Owners

33
What Women Want in Business: A Survey of Executives and Entrepreneurs
Table 18: Reasons for Leaving Prior Company
Owners Non-Owners
Opportunity to take risks with new ideas 77% 79%
More opportunities to have impact on strategic issues 58% 76%
Opportunities for wealth creation 63% 73%
Lack of recognition at prior company 43% 44%
Opportunity to select people to work with 50% 43%
Less organizational politicking 48% 42%
Opportunity to focus on long-term business development 38% 40%
The existence of outmoded policies 23% 34%
Observed that women could not advance 40% 29%
Lack of a good mentor 19% 27%
More time for family/personal interests 51% 23%
Lack of access to technological advances 14% 21%
Improved benefits 6% 10%
“…establishing a support network
where senior women can seriously
mentor junior women.”
Why Did the Women Leave Their Prior Companies?For both owners and non-owners, the top three reasons cited by all women
entrepreneurs for leaving their prior companies were opportunity to take risks
with new ideas and test personal limits, opportunities for wealth creation and
opportunities to have greater impact on strategic issues. But, there are important
differences between women who leave their companies to start their own
ventures and those who join someone else’s business.
Owners Versus Non-Owners: Reasons for Leaving
The women who start their own businesses are much more likely to do so in
order to have more time for family and/or personal interests. Fifty-one percent
of the owners indicate that this was a factor that motivated them to leave their
prior companies. However, only 23 percent of the non-owners indicate that this
was a motivating factor, and it is ranked 11 out of 13 reasons. Owners also were
more likely to leave their prior work environments because they observed that
women could not advance at the company, because of organizational politicking,
and the lack of an opportunity to select people with whom they work.

34
What Women Want in Business: A Survey of Executives and Entrepreneurs
The Impact of Generation and Reasons for Leaving
Half of the women in the sample are under the age of 40 and half are 40 or
older. While younger entrepreneurs were more likely to be motivated to leave
their prior companies for opportunities for wealth creation and their impact
on strategic issues, older entrepreneurs were more likely to make the change
because they saw the lack of opportunity for women to advance.
In order to attract and retain
talented women, key actions that
a corporation can take include…
Table 19: Reasons for Leaving Prior Company – For Women in Two Age Groups
Owners Non-Owners
40 and Under 40 and UnderOlder 40 Older 40
Opportunity to take risks with new ideas 75% 80% 79% 81%
More opportunities to have impact on 50% 68% 75% 76%strategic issues
Opportunities for wealth creation 56% 72% 72% 73%
Lack of recognition at prior company 43% 43% 45% 45%
Opportunity to select people to work with 46% 53% 41% 45%
Less organizational politicking 46% 49% 39% 43%
Opportunity to focus on long-term 36% 40% 42% 40%business development
The existence of outmoded policies 22% 24% 33% 32%
Lack of a good mentor 14% 23% 25% 32%
Observed that women could not advance 42% 34% 32% 28%
More time for family/personal interests 52% 51% 23% 23%
Lack of access to technological advances 14% 13% 26% 17%
Improved benefits 5% 7% 10% 10%

35
What Women Want in Business: A Survey of Executives and Entrepreneurs
Women with Children and Reasons for Leaving: Owners versus Non-Owners
Not surprisingly, the entrepreneurs with children are much more likely to have
left their prior companies to spend more time with family and/or for personal
interests. Entrepreneurs without children are much more likely to opt out for
wealth creation opportunities, to have an impact on strategic issues and to have
less organizational politicking. It is interesting to note that, for non-owners, the
presence of children did not affect their likelihood to leave prior companies for
more family time and/or personal interests. However, non-business owners with
children are much more likely to make a change in order to select co-workers
who, perhaps, will be more supportive of work-family balance.
Table 20: Reasons for Leaving Prior Company for Women With and Without Children
Owners Non-Owners
With Without With WithoutChildren Children Children Children
Opportunity to take risks with new ideas 73% 81% 81% 78%
More opportunities to have impact on 50% 67% 72% 78%strategic issues
Opportunities for wealth creation 59% 68% 79% 68%
Lack of recognition at prior company 40% 46% 48% 41%
Opportunity to select people to work with 43% 58% 56% 32%
Less organizational politicking 43% 54% 43% 42%
Opportunity to focus on long-term 35% 40% 42% 39%business development
The existence of outmoded policies 20% 27% 31% 36%
Lack of a good mentor 19% 19% 30% 25%
Observed that women could not advance 43% 35% 39% 22%
More time for family/personal interests 58% 43% 25% 22%
Lack of access to technological advances 12% 16% 23% 20%
Improved benefits 7% 6% 13% 7%
“…improving the culture
for innovation.”

In order to attract and retain
talented women, key actions that
a corporation can take include…
36
What Women Want in Business: A Survey of Executives and Entrepreneurs
Reasons for Leaving and Age of Business
Reasons given by the entrepreneurs for leaving prior companies further differ
according to the age of business.
For example, having more time for family and/or personal interests is much
more important for women whose businesses are three to five years old than
for women whose businesses started six or more years ago. The women with
younger businesses were also more likely to start their businesses for wealth
creation opportunities. On the other hand, women who started their businesses
six or more years ago were more likely to cite lack of advancement of women in
their prior companies as the motivating factor to leave.
Table 21: Why Owners Left Prior Companies –By Age of Business
Owners
Less Than 3 to 5 6+3 Years Years Years
Opportunity to take risks with new ideas 81% 73% 73%
More opportunities to have impact on 60% 56% 57%strategic issues
Opportunities for wealth creation 65% 68% 52%
Lack of recognition at prior company 44% 44% 39%
Opportunity to select people to work with 45% 62% 48%
Less organizational politicking 48% 53% 42%
Opportunity to focus on long-term 42% 33% 32%business development
The existence of outmoded policies 22% 27% 22%
Lack of a good mentor 22% 14% 17%
Observed that women could not advance 36% 39% 49%
More time for family/personal interests 52% 67% 30%
Lack of access to technological advances 11% 22% 12%
Improved benefits 5% 10% 6%

37
What Women Want in Business: A Survey of Executives and Entrepreneurs
Are the Women Satisfied with Their Current Positions?With regard to current life experience, 77 percent of the owners say they are
currently more satisfied in terms of their time for family compared to only
39 percent of non-owners. Or, in other words, 61 percent of non-owners are
less satisfied when it comes to time for family. Secondly, owners are much
more likely to report greater satisfaction in terms of work pace compared to
non-owners (88 percent versus 66 percent). Furthermore, about 90 percent of
the owners and non-owners report greater satisfaction in terms of recognition
for accomplishments, opportunity to learn new skills, opportunity to develop
objectives and strategies, working with novel and new ideas and opportunity
to realize a personal dream or vision. However, there are areas where a greater
percentage of women report less satisfaction than more satisfaction — these
include economic security and benefit packages.
Table 22: Ways in Which Current Life Experience Is More Satisfying
Owners Non-Owners
Working with novel and new ideas 97% 96%
Opportunity to learn new skills 95% 95%
Opportunity to develop objectives and strategies 97% 93%
Opportunity to realize a personal dream or vision 99% 92%
Authority to make decisions that impact the entire 97% 92%
organization
Continuous learning 96% 88%
Opportunities to develop and negotiate deals 97% 87%
Recognition for accomplishments 92% 87%
Not needing to fit in 95% 85%
Opportunities for creating business alliances 91% 82%
Taking risks without repercussions 79% 82%
Personal interactions in the workplace 75% 80%
Access to technology 72% 77%
Less monitoring and assessment of your contribution 85% 75%
Work pace 88% 66%
Economic security 44% 45%
Availability of resources to meet my business goals 51% 41%
Time for family 77% 39%
Work with a minimal amount of disruptions 65% 38%
Benefit package such as pension plan and healthcare, etc. 24% 21%
“…building communities
within the business.”

In order to attract and retain
talented women, key actions that
a corporation can take include…
38
What Women Want in Business: A Survey of Executives and Entrepreneurs
Overall Job Satisfaction When asked to rate overall job satisfaction in their current business, both
the owners and non-owners are overwhelmingly satisfied with their current
positions, although the level of satisfaction is higher for owners. Seventy-five
percent of the owners report being very satisfied compared to 50 percent of
the non-owners.
Another 20 percent of the owners and 36 percent of the non-owners are
somewhat satisfied. In fact, nine percent of the non-owners currently report
some dissatisfaction. When asked to indicate whether they are more or less
satisfied in their current jobs as compared to the jobs held in their prior companies,
87 percent of the owners and 64 percent of the non-owners report being very
satisfied currently as compared to their prior jobs.
0%1%4%
20%
75%
5%
50%
36%
1%
9%
0%
10%
20%
30%
40%
50%
60%
70%
80%
90%
100%
Very satisfied Somewhat satisfied Neither satisfied nordissatisfied
Somewhat dissatisfied Very dissatisfied
Owners Non-Owners
Table 23: Overall Job Satisfaction in Current Work Experiences
Taking everything into consideration, please rate your overall job satisfaction in your current business.

39
What Women Want in Business: A Survey of Executives and Entrepreneurs
The women business owners who report greater satisfaction are those who have
been in their businesses longer, and those who are working fewer hours than
they did in their previous jobs. These women also confirm that they are satisfied
if they left their prior companies for wealth creation opportunities, in order to
select people with whom to work, or because of opportunities to take risks with
new ideas and test personal limits. For non-owners, those who report greater
satisfaction are those earning at least 75 percent of family income and those
who have left their prior companies because of lack of recognition. For both
owners and non-owners alike, marital status, presence of children and age have
no effect on whether a woman is very satisfied in her current job.
0%2%1%
10%
87%
4%
64%
25%
1%
7%
0%
10%
20%
30%
40%
50%
60%
70%
80%
90%
100%
Very satisfied Somewhat satisfied Neither satisfied nordissatisfied
Somewhat dissatisfied Very dissatisfied
Owners Non-Owners
Table 24: Comparisons of Satisfaction Levels Between Prior and Current Positions
Taking everything into consideration, please indicate whether you are more or less satisfied in your current job as compared to the
job you held in your prior company.
“…inviting the
entrepreneurial spirit.”

In order to attract and retain
talented women, key actions that
a corporation can take include…
40
What Women Want in Business: A Survey of Executives and Entrepreneurs
Will the Women Stay in Their Current Positions?Responses to the question “How likely are you to leave (or sell) your current
business in the next year or two?” indicated that 63 percent of the owners
responded not likely compared to only 32 percent of the non-owners. When
asked what respondents would do next if they did leave or sell their current
business, 26 percent of the owners and 12 percent of the non-owners would
open a new business and another 22 percent of the owners and 29 percent of
the non-owners would join another group of entrepreneurs with a different
business concept. Only five percent of the owners, but 11 percent of the non-
owners, would seek a position within a corporation. Interestingly, 23 percent of
the owners and 27 percent of the non-owners are undecided.
Table 25: Factors Leading to Greater Job Satisfaction for Owners
■ More years in business
■ Working less hours than in prior company
■ Left prior company for opportunities for wealth creation
■ Left prior company to select people to work with
■ Left prior company for opportunities to take risks.
Table 26: Factors Leading to Greater Job Satisfaction for Non-Owners
■ Accounts for at least 75 percent of family income
■ Left prior company because of lack of recognition there.

41
What Women Want in Business: A Survey of Executives and Entrepreneurs
“…facilitating people to go
out of their comfort zones.”Women with Children and Commitment to Current Business
While 67 percent of the owners with children say that they are not likely to leave
or sell their current businesses in the next year or two, 58 percent of the owners
without children would do so. Similarly, non-owners with children are more
likely to stay in their current businesses than non-owners without children
(42 percent versus 24 percent).
Also, while 30 percent of owners with children indicate they are more likely to
open a new business, 22 percent of owners without children would do so.
Table 27: What Women Would Do Next If Left or Sold Current Business – For Those With and Without Children
Women With Children Women Without Children
Owners Non- Both Owners Non- BothOwners Owners
Join another group of 18% 26% 21% 26% 32% 28%entrepreneurs with adifferent business concept
Open a new business 30% 16% 25% 22% 9% 17%
Seek a position within 4% 6% 5% 5% 16% 9%a corporation
Retire 10% 6% 8% 9% 3% 7%
Seek a position in a 2% 4% 3% 3% 5% 4%not-for-profitorganization
Seek additional education 4% 0% 2% 1% 5% 3%
Undecided 22% 34% 26% 24% 21% 23%
Other 10% 9% 9% 9% 9% 9%
In order to attract and retain
talented women, key actions that
a corporation can take iclude…
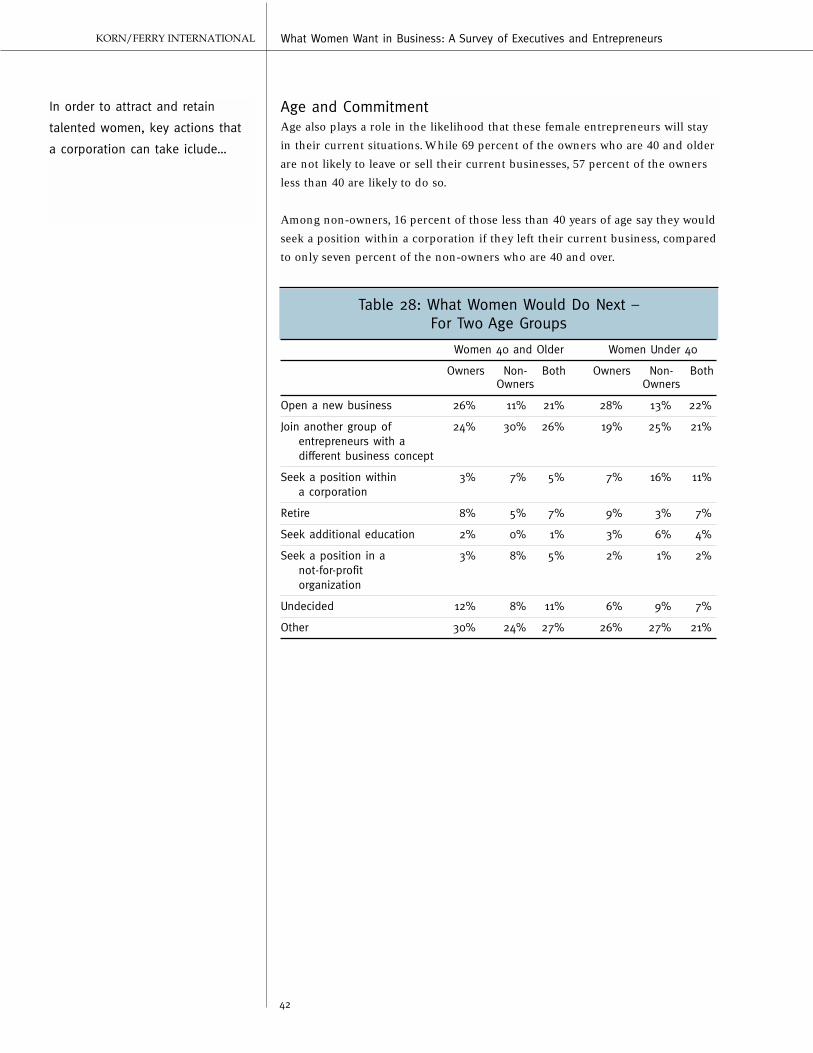
Age and CommitmentAge also plays a role in the likelihood that these female entrepreneurs will stay
in their current situations. While 69 percent of the owners who are 40 and older
are not likely to leave or sell their current businesses, 57 percent of the owners
less than 40 are likely to do so.
Among non-owners, 16 percent of those less than 40 years of age say they would
seek a position within a corporation if they left their current business, compared
to only seven percent of the non-owners who are 40 and over.
42
What Women Want in Business: A Survey of Executives and Entrepreneurs
Table 28: What Women Would Do Next –For Two Age Groups
Women 40 and Older Women Under 40
Owners Non- Both Owners Non- BothOwners Owners
Open a new business 26% 11% 21% 28% 13% 22%
Join another group of 24% 30% 26% 19% 25% 21%entrepreneurs with adifferent business concept
Seek a position within 3% 7% 5% 7% 16% 11%a corporation
Retire 8% 5% 7% 9% 3% 7%
Seek additional education 2% 0% 1% 3% 6% 4%
Seek a position in a 3% 8% 5% 2% 1% 2%not-for-profitorganization
Undecided 12% 8% 11% 6% 9% 7%
Other 30% 24% 27% 26% 27% 21%

43
What Women Want in Business: A Survey of Executives and Entrepreneurs
“…developing and maintaining an
entrepreneurial environment.”Explanation of Why Women Are Not Likely to Leave TheirPresent JobsOwners are more likely to stay in their present jobs if they are older, if their
business has fewer employees, if they never owned another business, if they left
their prior company in order to have more time for family and/or personal
interests, or in order to have less organizational politicking or to take risks with
new ideas and test personal limits.
Among non-owners, the likelihood of staying is higher for those who are
married, those who work in a firm with a small number of employees or those
in a firm with revenues of at least $1 million.
44
What Women Want in Business: A Survey of Executives and Entrepreneurs
Summary
In an economy characterized by increased competition and innovation,
corporate leaders understand that it is important to have a workplace
environment conducive to attracting and retaining talent. The women we
studied have strong desires to pioneer a new business territory and to control
the upstream processes of innovation, that is, to generate an idea, validate it,
develop and launch it, and then exploit and learn from the impact. Further,
women with children see entrepreneurship as an opportunity to blend their
family interests and obligations with their needs to implement their creative
ideas. The women we studied clearly have the desire to follow their business
ideas and although they have learned valuable skills from their experiences in
the corporate world, they do not see the large corporate environment as the
best place for them to pursue these opportunities. Instead, they prefer to apply
what they have learned from their previous corporate experiences and pursue
new career paths. Large corporations may eventually need to create joint
alliances with these businesses. Women entrepreneurs and women who work
in small businesses — especially those in the technology-related areas — are
essential ingredients of the new economy.

45
What Women Want in Business: A Survey of Executives and Entrepreneurs
Korn/Ferry International’s Worldwide Network
The Americas
Atlanta404-577-7542
Bogotá57-1-629-2301
Boston617-345-0200
Buenos Aires54-11-4114-0000
Calgary403-269-3277
Caracas58-212-285-0067
Chicago312-466-1834
Dallas214-954-1834
Denver303-542-1880
Houston713-651-1834
Lima51-1-221-4202
Los Angeles310-552-1834
Mexico City525-201-5400
Miami305-377-4121
Minneapolis612-333-1834
Monterrey52-83-48-43-55
Montreal514-397-9655
New York212-687-1834
Newport Beach949-851-1834
Philadelphia215-496-6666
Princeton609-452-8848
Quito*5932-986-562
Rio de Janeiro55-21-518-1380
San Francisco415-956-1834
Santiago562-233-4155
Sao Paulo5511-5181-9200
Seattle206-447-1834
Silicon Valley650-632-1834
Stamford203-359-3350
Toronto416-365-1841
Tysons Corner703-761-7020
Vancouver604-684-1834
Washington, D.C.202-822-9444
Asia/Pacific
Auckland*64-9-309-4900
Bangkok662-636-1466
Beijing8610-6505-2989
Bombay91-22-282-6689
Brisbane*61-7-3221-6084
Hong Kong852-2521-5457
Jakarta62-21-573-9933
Kuala Lumpur603-2078-1655
Melbourne613-9654-4588
New Delhi91-124-6358866
Seoul82-2-399-7475
Shanghai86-21-6256-7333
Singapore65-224-3111
Sydney612-9006-3400
Tokyo81-3-3560-1400
Wellington64-4-460-4900
* Satellite offices
46
What Women Want in Business: A Survey of Executives and Entrepreneurs
Europe
Amsterdam31-20-799-9000
Athens301-722-8000
Birmingham44-121-782-2492
Brussels32-2-640-3240
Budapest36-1-346-0600
Copenhagen45-3916-3600
Frankfurt/Niederad49-69-669-0170
Frankfurt/Königstein49-6174-2905-0
Geneva41-22-310-2071
Gothenburg46-31-13-4710
Helsinki358-9-61-22-560
Istanbul90-212-231-3949
London44-20-7312-3100
Luxembourg35-2-46-43-42-1
Madrid34-91-701-43-80
Milan39-02-80600-1
Moscow7-503-956-4387
Oslo47-22-82-39-00
Paris33-1-45-61-8686
Rome39-06-80687-090
Stockholm46-8-611-5015
Vienna43-1-531-03-0
Warsaw48-22-622-28-29
Zurich41-56-418-11-11
* Satellite offices


![Themanyfacesofdegeneracy in conicoptimizationhwolkowi/henry/reports/asurvey… · 4 Whatthispaperisabout enedvariants,are[19,57,93,94,144].Theconceptoffacialreduction forgeneralconvexprogramswasintroducedin[23,24],whileanearly](https://static.fdocuments.us/doc/165x107/5fef34aabbed5c7a5917fb8b/themanyfacesofdegeneracy-in-hwolkowihenryreportsasurvey-4-whatthispaperisabout.jpg)