What We Learned From the Stimulus
12
January 5, 2010 What We Learned From the Stimulus And how to use what we learned to speed job creation in the 2010 jobs bill
Transcript of What We Learned From the Stimulus

January 5, 2010
What We Learned From the Stimulus And how to use what we learned to speed job creation in the 2010 jobs bill

This report uses data provided by the US Congress House of Representatives Transportation and Infrastructure Committee. Any errors and all interpretations are the responsibility of the Center for Neighborhood Technology, Smart Growth America, and US PIRG.
Please direct questions about this report to:
Scott Bernstein President Center for Neighborhood Technology p 773 617 9503 [email protected]
William Schroeer State Policy Director Smart Growth America p 612 308 7147
growthamerica.orgwschroeer@smart
Phineas Baxandall Senior Analyst for Tax & Budget Policy U.S. Public Interest Research Group (U.S. PIRG) cell: 857 234 1328 office: 617 747 4351 [email protected]
Cover phoLeft to right, top to bottom:
to credits
(nz)dave, http://www.flickr.com/photos/nzdave/2106802469/
eller, 56
Maxwell Schnhttp://www.flickr.com/photos/18163896@N00/2984500M.V. Jantzen, http://www.flickr.com/photos/mvjantzen/2198863828/ BikePortland.org,
lickr.com/photos/bikeportland/3466048902/in/http://www.fset‐72157617163639684/ Musebrarian, http://www.flickr.com/photos/musebrarian/3231408047/ ~BostonBill~,
flickr.com/photos/8533266@N04/1585224767/ihttp://www.n/pool‐fakedof jeweledlion, http://www.flickr.com/photos/jeweledlion/1502706553/ jenschapter3,
w.flickr.com/photos/chapter3/3221302326/in/phothttp://wwostream/ karpov85, http://www.flickr.com/photos/karpov85/3266981751/

1
Summary: ARRA data show that investing in public transportation creates more jobs The latest data on stimulus spending show that funds spent on public transportation were a more effective job creator than stimulus funds spent on highways. In the 10 months since the merican Recovery and Reinvestment Act (ARRA) was signed, investing in public transportation roAp
duced twice as many jobs per dollar as investing in roads:
Every billion dollars spent on public transportation produced 16,419 job‐months.1
Every billion dollars spent on projects funded under highway infrastructure programs produced 8,781 job‐months.
(Because transportation projects are of different durations, a “job month” is a more accurate way of comparing quantities of employment created than is a “job year”.)
As Congress and the Administration discuss a possible jobs bill, the implication is clear: shifting available funds toward public transportation will increase the resulting employment.
These results are calculated from data provided by the states through October 31, and released by the U.S. House of Representatives Transportation and Infrastructure Committee on December 0.1
2
Type of Project
Recovery Act Funds Associated with Projects
Under Contract
Direct, On‐Project Jobs Created or Sustained (Full‐Time‐Equivalent
Job Months)*
Thus:
Job‐months per $billion
Public transportation $4,405,188,041 72,328 16,419
Highway infrastructure 3(STP funds) $15,809,805,858 138,831 8,781
President Obama has said he is sho
concerned that the goal of quickly boosting employment with ict with making long‐term investments in America’s future. vel‐ready projects may confl
1 ARRA recipients, including State DOTs and transit operating agencies, report job‐hours associated with work under contract; OMB guidance is to divide total hours by 173 to yield job‐months. In this context, “produced” can mean “created” or “retained.” 2 Release at: http://transportation.house.gov/News/PRArticle.aspx?NewsID=1079. Data at http://Transportation.house.gov/Media/file/ARRA/Recovery%20Act%20Funds%20by%20State%20and%20Program%20as%20of%20October%2031%202009.pdf 3 Surface Transportation Program (STP) program funds may be spent on most forms of transportation, and it is not correct to call it a highway program. However, in ARRA, states so far have obligated 94% of their STP funds to highways. So while it remains incorrect to call STP a highway program, the ARRA data on STP are essentially data on highway projects.

2
These results show that investing in public transportation produces the most return for the money in both categories:
it is a more effective direct job creator; and
it builds the transportation systems we need for the future.
Shifting investment to public transportation would speed job creation The United States has put under contract more than $20 billion dollars in transportation investments through ARRA. States are required to report the job creation and job retention resulting from each contract paid for with these funds. As the Congress and the Administration consider a jobs bill, they should learn from data gathered for ARRA.
The data tell us that every billion dollars in public transportation investments made as of October 31 2009 produced roughly an additional 8,000 job‐months compared to highway projects. ARRA transportation funds have so far gone disproportionately to highways.4 If the total road + public transportation funding in the just‐passed House jobs bill were invested equally in public transportation and highways, the same outlay would produce 71,415 additional job‐months, equivalent to year‐round employment for 5,951 additional people.
Allocating the same amount, evenly, would create more jobs
Type of project
Job‐months created per $billion
House jobs bill (HR 2847) Balanced investment in
public transportation & STP
Amounts Direct,
on‐project job‐months
Amounts Direct,
on‐project job‐months
Public transportation (Capital and Fixed Guideway) 16,419 $8.4 billion 137,920 $17.75 billion 291,437 Highway Infrastructure (Surface Transportation Program5) 8,781 $27.1 billion
237,965 $17.75 billion 155,863
Totals $35.5 billion 375,885 $35.5 billion 447,300
4 In ARRA, states so far have obligated 94% of their STP funds to highways. Smart Growth America, The States and the Stimulus: Are They Using it to Create Jobs and 21st Century Transportation?, June, 2009. http://www.smartgrowthamerica.org/documents/120days.pdf.
5 See footnote 2 explaining the STP program as flexible, but spent overwhelmingly on highways.

3
Public transportation creates more jobs by spending less on land and more on people The increased job creation and retention that states are reporting from ARRA spending on public transportation is consistent with the data collected and reported prior to ARRA. Every previous study of the employment impacts of transportation spending has found that investment in public transportation produces more jobs than investment in roads.6
The a roads, public transportation systems tend to: re sons are straightforward: compared to
nd acquisition; 1. spend less money on la
2. be more complex; and
3. buy and maintain vehicles.
Based on past studies, we can expect investments in public transit to produce even more jobs in the House jobs bill than in ARRA because more funds would likely to be allocated to operations instead of solely to capital investment. Initially, ARRA did not allow states or Metropolitan Planning Organizations (MPOs) over 200,000 population to spend any stimulus money on public transportation operations. In June, Congress gave states and MPOs over 200,000 the flexibility to spend up to 10% of federal transit capital funds on transit operations. Largely because so much of the money had been committed by then, we do not know of any meaningful use of that flexibility.
Under the House jobs bill, which continues that flexibility, more public transit funds would presumably be allocated to operations. Because states and MPOs would be able to use the flexibility from the beginning, and because so many systems are in such financial straits,7 it is likely much of the flexibility would likely be used. This would further add to the number of jobs created by public transportation funds, because past studies suggest that transit operations produce, on average, 72% more jobs than even transit capital investment.8 These jobs come from driving buses and operating trains; from routine maintenance, and from running the system (dispatching, etc.).
6 The most recent and comprehensive is J. Heintz, R. Pollin, and H. Garrett‐Peltier. How Infrastructure Investments Support the U.S. Economy: Employment, Productivity and Growth, Political Economy Research Institute. University of Massachusetts at Amherst, 2009. www.peri.umass.edu/236/hash/efc9f7456a/publication/333/. 7 Transportation for America. “Stranded at the Station: The Impact of the Financial Crisis in Public Transportation”, August, 2009. http://www.t4america.org/docs/081809_stranded_at_thestation.PDF 8 Economic Development Research Group, “Job Impacts of Spending on Public Transportation: An Update”, April 29, 2009.

4
Public transportation saves jobs by allowing people to get to work The data that this report analyzes counts only the jobs directly created through investing in and operating public transportation. It is important not to forget the jobs preserved by allowing people to continue get to their workplaces. The impacts of cuts in public transportation service around the country underscore how for many workers, public transportation is the only way to reach their jobs. And for many others, public transportation helps to save money, allowing them to pay their mortgage or spend on other goods and services.9
The United States needs more transit for a 21st century transportation system In addition to creating more jobs, investments in public transportation help make progress on an enormous need. America’s public transit systems have a substantial backlog of unmet needs. The American Society of Civil Engineers gives the condition of the U.S. public transportation network a ‘D’ grade in its 2009 Report Card. The Federal Transit Administration says that the nation’s seven largest systems alone (Chicago’s CTA, Boston’s MBTA, New York’s MTA, New Jersey Transit, San Francisco’s BART, Philadelphia’s SEPTA, and Washington’s WMATA) have a $50 billion backlog of repairs necessary to reach a state of good repair.10
In addition to the FTA estimates of existing repair needs, there are tremendous unmet needs generated by the gap between rapidly rising public demand and lack of existing access to public transit:
• Lack of access. Roughly 50% of U.S. households lack reliable access to public transportation. This number is much higher in rural areas and smaller cities and towns.11
9 APTA, www.apta.com/mediacenter/pressreleases/2009/Pages/091209_December_Savings.aspx 10 US DOT/Federal Transit Administration, “Rail Modernization Study: Report to Congress,” April, 2009. “More than one‐third of agencies’ assets are either in marginal or poor condition, indicating that these assets are near or have already exceeded their expected useful life. …. [T]here is an estimated State of Good Repair backlog of roughly $50 billion (2008 dollars) for the agencies under consideration.” 11 “According to a 2005 Bureau of the Census survey, only 54 percent of American households have access to public transportation of any kind as they plan their daily travel. These statistics are much worse in rural areas and other areas where the transit services that are provided lack the level of service and amenities that can attract choice riders.” William W. Millar, President, American Public Transportation Association, Testimony Before The National Surface Transportation Policy and Revenue Study Commission, July 25, 2007.

5
• Rising use. In 2008, nearly 10.7 billion trips were taken on U.S. public transportation, a four percent increase over 2007 and the highest level since 1956. Public transportation use has increas 2 ed 38 percent since 1995, nearly triple the US population growth rate.1
• Public demand. According to a January 2009 National Association of Realtors national opinion survey, a very strong majority of the public (80%) prefer that stimulus transportation funding be used for repairing roadways and bridges and for public transportation.13
In sum, additional investments in public transportation infrastructure would help make progress on large and pressing long‐term needs, as well as generating a quick boost to employment.
Nationally, ARRA public transportation and road funds are spending out at the same rate The data reported by the House Transportation & Infrastructure Committee also contains useful information concerning states’ productivity in converting ARRA funds into projects. The committee’s spreadsheet shows dollar amounts, state‐by‐state, associated with key benchmarks in the process: funds obligated, projects put out to bid, projects under contract, projects in which ork has begun, and completed projects.w 14 These figures can be aggregated to show the process
at work on the national level as well. What do all these numbers tell us? First, there is very little difference in the overall rates at which ARRA‐funded highway projects and transit projects are moving forward, with transit actually outperforming highways at most points. This is illustrated by Figure 1, below.
12 www.apta.com/media/releases/090309_ridership.cfm
13 www.realtor.org/press_room/news_releases/2009/01/smarter_transportation
14 The spreadsheet also shows funds “outlayed,” but this data is not used here because it refers to federal government reimbursement payments to states, which is not a direct state productivity issue.
6
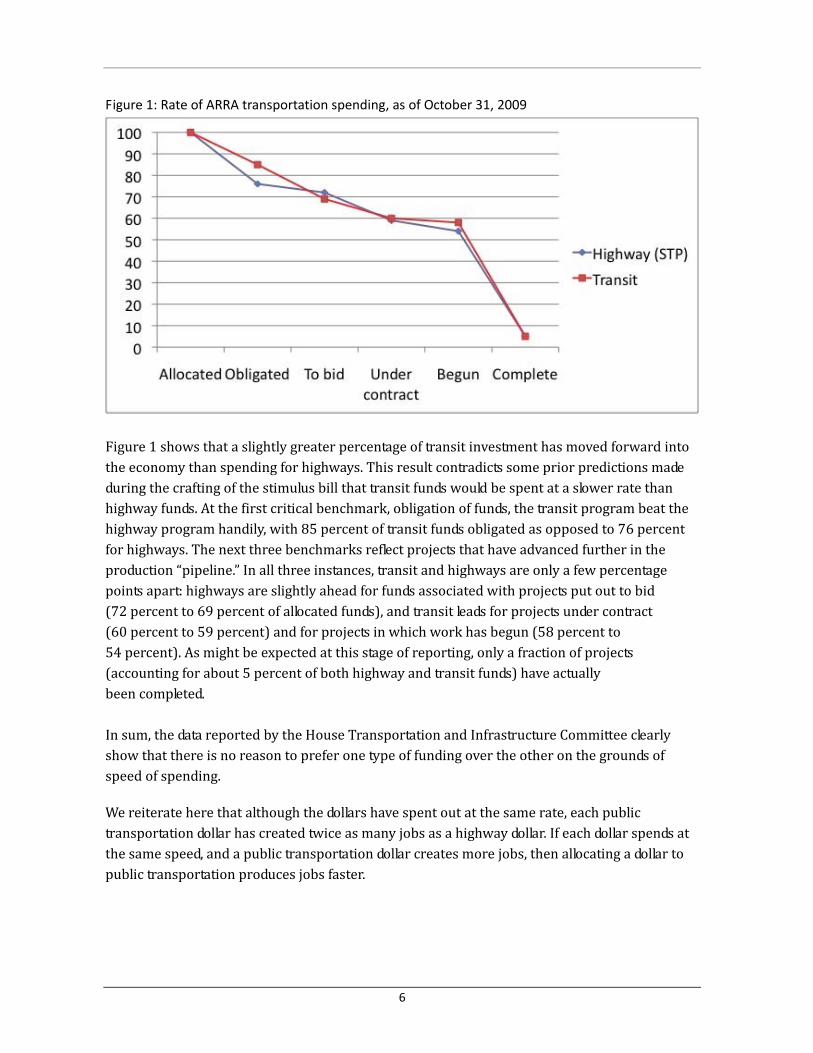
Figure 1: Rate of ARRA transportation spending, as of October 31, 2009
Figure 1 shows that a slightly greater percentage of transit investment has moved forward into the economy than spending for highways. This result contradicts some prior predictions made during the crafting of the stimulus bill that transit funds would be spent at a slower rate than highway funds. At the first critical benchmark, obligation of funds, the transit program beat the highway program handily, with 85 percent of transit funds obligated as opposed to 76 percent for highways. The next three benchmarks reflect projects that have advanced further in the production “pipeline.” In all three instances, transit and highways are only a few percentage points apart: highways are slightly ahead for funds associated with projects put out to bid (72 percent to 69 percent of allocated funds), and transit leads for projects under contract (60 percent to 59 percent) and for projects in which work has begun (58 percent to 54 percent). As might be expected at this stage of reporting, only a fraction of projects accounting for about 5 percent of both highway and transit funds) have actually een completed. (b In sum, the data reported by the House Transportation and Infrastructure Committee clearly show that there is no reason to prefer one type of funding over the other on the grounds of speed of spending.
We reiterate here that although the dollars have spent out at the same rate, each public transportation dollar has created twice as many jobs as a highway dollar. If each dollar spends at the same speed, and a public transportation dollar creates more jobs, then allocating a dollar to public transportation produces jobs faster.
7
State by State Findings
Our summary findings apply nationally. No clear patterns exist among the states in terms of the speed at which transportation stimulus funds are being spent and each state has its own story to tell. The state stories are highly instructive, as shown by the following examples.
Some states have apparently used the availability of stimulus funds to program long‐promised, expensive, high‐profile projects. Some states have carefully crafted their programs to meet policy goals. Other states have probably been so limited in options, due to staffing constraints and other issues, that they have selected any projects they think can be pushed through the pipeline. The emphasis on speed in getting funds obligated, although understandable as a goal, as probably overshadowed planning for maximizing economic impacts in most states and often rumped planning for long‐term investment. ht Sometimes policy directions can be linked to results. For instance, Maine carefully formulated a highway spending plan designed to maximize economic impact through selecting small, system preservation projects spread widely throughout the state and among construction industry segments. As a result, Maine was not only the first state to obligate 100 percent of its highway money but has actually completed 44 percent of its program – more than four times the national average – and has therefore converted these funds into wages, purchases, and infrastructure improvements within the first year of the program.
There are similarly compelling experiences on the public transportation side. In states with older systems, which is where the Transit Fixed Guideway Modernization funds are targeted, the contract rate (Recovery Act funds under contract) tends to be very high: 100 percent for Pennsylvania, 100 percent for Indiana, 99 percent for Illinois, 95 percent for NY, 77 percent for Washington, DC, 76 percent for California, and 76 percent for Ohio. Not only are these agencies getting the money out quickly, but they are spending it on identified serious needs. This distribution matches well with the agencies that received the most focus in the FTA modernization report: Chicago Transit Authority; Massachusetts Bay Transportation Authority; Metropolitan Transportation Authority in Los Angeles; New Jersey Transit; Bay Area Rapid Transit in the San Francisco Bay Area; Southeastern Pennsylvania Transportation Authority; and Washington Metropolitan Area Transit Authority in the District of Columbia. Five of these seven had contract rates from 77 to 100 percent. The FTA Rail Modernization Study identified a backlog of $50 Billion to bring the fixed guideway assets of these 7 study agencies to a State of Good Repair.15 All of these agencies know what to spend the money on, and have the capacity to spend and hire quickly. They and the others cited here had very high obligation rates, typically higher than the obligation rates for highways in those same states. Where there is drop‐off from obligation rate to contract rate, some places were more ready to let bids and sign contracts than others, which calls for more focus on helping those agencies.
15 At http://www.fta.dot.gov/documents/Rail_Mod_Final_Report_4‐27‐09.pdf

8
Case study: Texas
As of October 31, Texas had obligated 100% of its transit fixed guideway apportionments; 96% of its transit capital assistance apportionments; and 64% of its Surface Transportation Program (STP) apportionment, which it obligated almost entirely to highways. More important, 65% of Texas' transit apportionment dollars were under contract, while only 46% of highway infrastructure dollars were under contract.
Transit contracts in Texas supported 38,317 job‐months per billion dollars expended while highway contracts supported just 7,596. As a result, although Texas received six times more STP funds than transit funds, the transit funds created more total jobs: as of October 31, 9,135 job‐months supported by transit contracts versus 7,937 supported by highway contracts.
If the funding sent to Texas for surface transportation had been allocated on a 50‐50 basis, $1.31 billion each to roads and to public transportation, then, liberally assuming a contract rate of 65% for each, $852 million under contract for transit would be supporting (.852 x 38317) or 32,626 job‐months created or retained, and $852 Million under contract for highways would be supporting 6762 job‐months created or retained. This is a total of 39,388 job‐months, versus (9135+7937) or 17,032 under the current split in that state. A balanced distribution would have produced 22,356 more (or 2.3 times as many) job‐months.
Employment in Texas dropped by 271,000 (10,647,500 to 10,375,800) from November 2008 to November 2009.16 To the extent that we can say each job‐month supported by ARRA is keeping a person from unemployment, the current allocation between highways and transit in Texas is reducing or mitigating the drop in employment by 6.8 percent, while a balanced 50‐50 allocation would have reduced that drop by 14.5 percent.
Case study: Illinois
Both the Illinois Department of Transportation and the Chicago‐area Regional Transportation Authority were high performers. As of October 31, 99% of transit fixed guideway, 90% of transit capital assistance and 71% of highway infrastructure apportionments were under contract, respectively. Both IDOT and the RTA’s contract rates are among the highest in the country, for different reasons.
When ARRA was announced, it was shortly after IDOT had furloughed a significant number of staff; the Secretary used authority granted under Illinois statute to re‐hire those staff for 75 days, centralized contracting and bid‐letting, and were able to quickly get highway projects under contract. In the GAO's 3d Quarterly ARRA report to Congress, September 21 2009, IDOT was noted as having been reimbursed more funds ($200 million) than any other State. IDOT did not transfer any STP funds to the transit program, but they chose to program almost exclusively for system preservation or fix‐it‐first projects.
16 http://www.bls.gov/news.release/laus.nr0.htm

9
In the case of the RTA, there has been a major focus on identifying ready to go transit capital projects for several years. This is partly due to a large backlog of projects needed to bring fixed guideway projects to a state of good repair, the need to replace aging rail transit cars and buses, the RTA’s Moving Beyond Congestion capital plan, and the passage by the Illinois General Assembly in 2007 of the RTA Reform Act and in 2009 of two bills that constitute a five year capital plan investment plan for the state.
In addition to a general state of readiness to identify projects and to contract for such major investments, the Chicago Transit Authority was able to creatively pair with WMATA in Washington, DC to jointly purchase buses, which accelerated delivery. ARRA explicitly allows transit agencies to exercise “pre‐award authority” in obligating funds and the CTA used this authority to accelerate their commitment. The net result of this aggressive approach is that (a) the buses ordered have all been delivered and are in service (b) that project (the CTA purchase of replacement buses) has been reimbursed, and (c) FTA has overall been reimbursing CTA as projects are completed. As of December 1, CTA had received $184 Million in reimbursements or 77% of total projects under contract.
As in Texas, the differing rates of spending and of job creation clearly affected the resulting impact of the stimulus on Illinois. On October 31, Illinois had $666 million in highway infrastructure apportionment‐supported projects under contract and $423 million in transit capital‐supported projects under contract. Per billion dollars expended, highway infrastructure projects supported 11,759 job‐months created or retained, while transit capital projects supported 29,868 job‐months created or retained. The total employment supported through October 31 was 7,826 job‐months by highway infrastructure projects and 12,628 job‐months by transit capital projects: 20,454 job‐months created or retained in total. From November 2008 to November 2009, employment in Illinois dropped from 5,880,800 to 5,630,400, or a drop of 250,000. To the extent that a job‐month represents an employed person, the effect of the ARRA‐supported surface transportation projects under contract lowered or mitigated this drop in unemployment by 8.2 percent. If the funds apportioned to Illinois, a total of $1.398 billion, had been apportioned evenly between highways and transit, assuming similar job‐productivity, liberally assuming each was able to achieve a contract rate of 100 percent, 8,220 total job‐months would have been supported by highway infrastructure contracts and 20,878 total job‐months would have been supported by transit capital contracts, respectively, for a total of 29,098 job‐months created or retained; this would have resulted in a decrease in the 2008‐2009 Illinois employment drop of 11.6 percent, and an increase in employment of 8,220.
So here we have two separate large states, each apportioned large amounts of money each for transit and for highway infrastructure, but with very different rates of spend‐out for each program and each state. Illinois is a much higher performer for both spend‐out and for job creation for each program, both for highway infrastructure and for transit capital assistance including fixed guideway modernization, but both would still benefit from a more balanced approach to the relative allocation of transit and highway funds.

10
Each of the states has a rich story to tell. Congress, USDOT, and recipient states and agencies should study the results of ARRA spending in much more detail and find, publicize, and follow the best practices.
Recommendations: Congress, US DOT, and states should act on these results Continuing high levels of unemployment led the U.S. House to pass, and the U.S. Senate to begin considering, jobs legislation. There is, appropriately, substantial debate about the best way to use limited federal resources to spur job creation. Whatever one’s position about the proper level of economic stimulus during this deep recession, we can agree that debate should be informed by the evidence.
Any transportation spending in a jobs bill should be balanced between STP and public transportation The evidence from ARRA shows that investments in public transportation are most effective at producing jobs, where “effective” means both “creates jobs faster” and “creates more jobs”. Allocating federal funds in response to this evidence would speed job creation. If the Congress takes up the House jobs bill, it should balance spending between public transportation and the Surface Transportation program.
US DOT should work with states to improve programming
US DOT should issue further guidance underlining that this is a performance‐oriented jobs and transportation program.
US DOT can and should make programmatic changes to maximize the jobs impact of further investments. For example, funds for small transit operators (those serving areas under 50,000) are, on average, spending out relatively slowly. That is not the fault, necessarily, of the transit operators; those funds are programmed by the State DOTs. There are many more small than large transit operators, and helping states to speed spend‐out to these operators would speed job creation.
States should learn from what worked in ARRA
States should learn from the ARRA experience and use proven strategies to accelerate deployment of projects, learn to partner better with local governments and transit agencies, and select projects that maximize intended impact.
Transit operators and other agencies take advantage of opportunities to bundle projects to maximize contracting power and speed, and do joint purchasing.