WFP Bangladesh - Vulnerability Analysis & Mapping 1 Food Security Assessment in Bangladesh Issues...
19
1 WFP Bangladesh - Vulnerability Analysis & Mapping Food Security Assessment in Bangladesh Issues and Implications for Mapping Food Insecurity and Vulnerability
-
Upload
ethan-garrett -
Category
Documents
-
view
223 -
download
5
Transcript of WFP Bangladesh - Vulnerability Analysis & Mapping 1 Food Security Assessment in Bangladesh Issues...

1 WFP Bangladesh - Vulnerability Analysis & Mapping
Food Security Assessment in Bangladesh
Issues and Implications for Mapping Food Insecurity and Vulnerability
2 WFP Bangladesh - Vulnerability Analysis & Mapping
Programme:Programme:
1. Geographic targeting
2. Data sources for food security analysis and mapping
3. VAM’s strategy for a new set of targeting maps
4. Discussion
3 WFP Bangladesh - Vulnerability Analysis & Mapping
Geographic targetingGeographic targeting
• WFP resources to be concentrated in areas identified through VAM assessments of food insecurity and vulnerability.
• Considerable variation in food consumption between districts. (E.g. range from 2470 k.Cal in Dinajpur to 1819 K.Cal. in Bagerhat)
• Explained by regional difference in poverty
•“Poor areas are not just poor because poor households concentrate in these areas” (WB)
• Geographical indicators can provide indication where to find a concentration of higher levels of poverty. (land productivity, electricity, infrastructure, distance to major markets etc.)
4 WFP Bangladesh - Vulnerability Analysis & Mapping
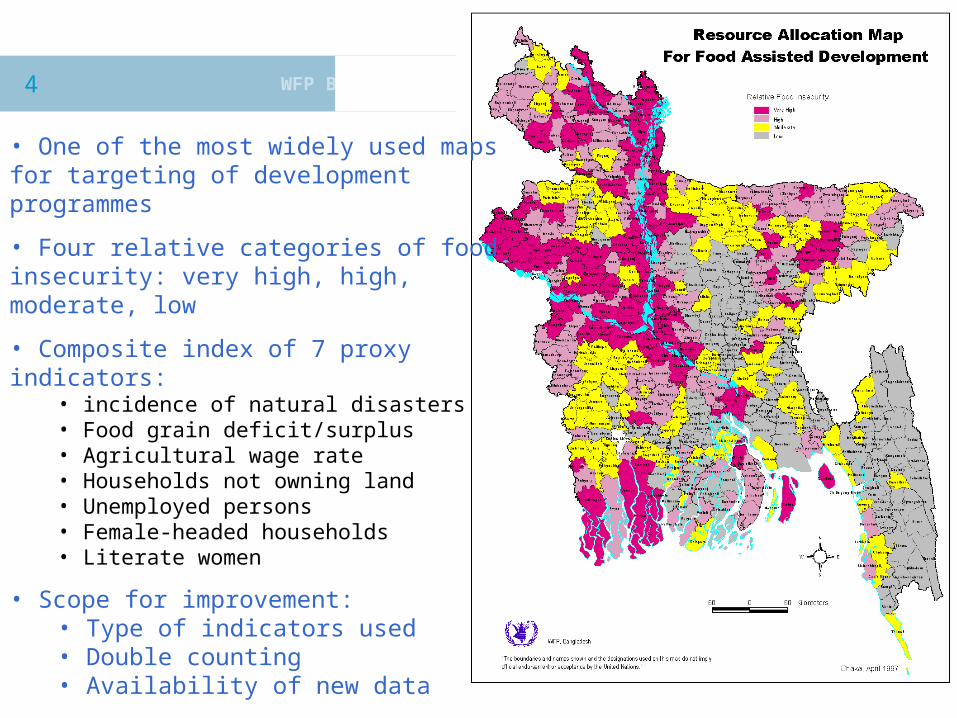
• One of the most widely used maps for targeting of development programmes
• Four relative categories of food insecurity: very high, high, moderate, low
• Composite index of 7 proxy indicators:• incidence of natural disasters• Food grain deficit/surplus• Agricultural wage rate• Households not owning land• Unemployed persons• Female-headed households• Literate women
• Scope for improvement:• Type of indicators used• Double counting• Availability of new data
5 WFP Bangladesh - Vulnerability Analysis & Mapping
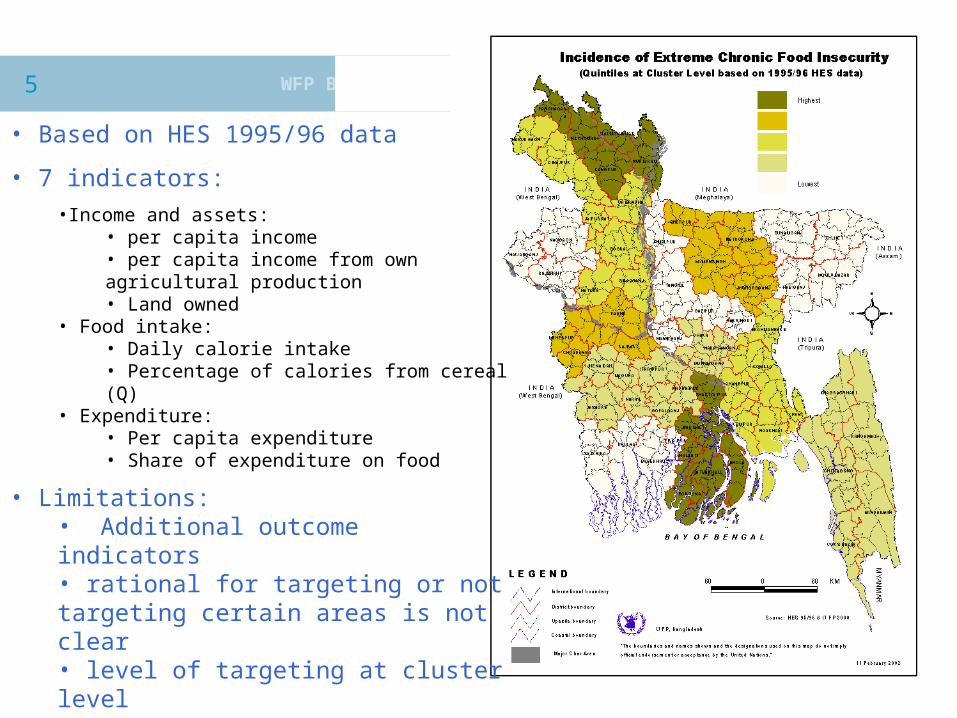
• Based on HES 1995/96 data
• 7 indicators:•Income and assets:
• per capita income• per capita income from own agricultural production• Land owned
• Food intake:• Daily calorie intake• Percentage of calories from cereal (Q)
• Expenditure:• Per capita expenditure• Share of expenditure on food
• Limitations:• Additional outcome indicators• rational for targeting or not targeting certain areas is not clear• level of targeting at cluster level

6 WFP Bangladesh - Vulnerability Analysis & Mapping
Related mapping efforts:Related mapping efforts:
• World Bank’s Poverty targeting exercise (HES 1995-96)
• Bangladesh human development report
• Unicef’s child risk measure
• IRRI’s study into the geographical distribution of poverty and food security
• NW - Kurigram, Lalmonirhat, Nilphamari, Panchagarh• North – Jamalpur, Mymensingh, Sherpur, Tangail.• South of Dhaka – Faridpur, Gopalganj, Madaripur, Rajbari, Shariatpur• Barisal Division
• Jamalpur, Sherpur, Kusthia
• Sunamganj, Bhola
7 WFP Bangladesh - Vulnerability Analysis & Mapping
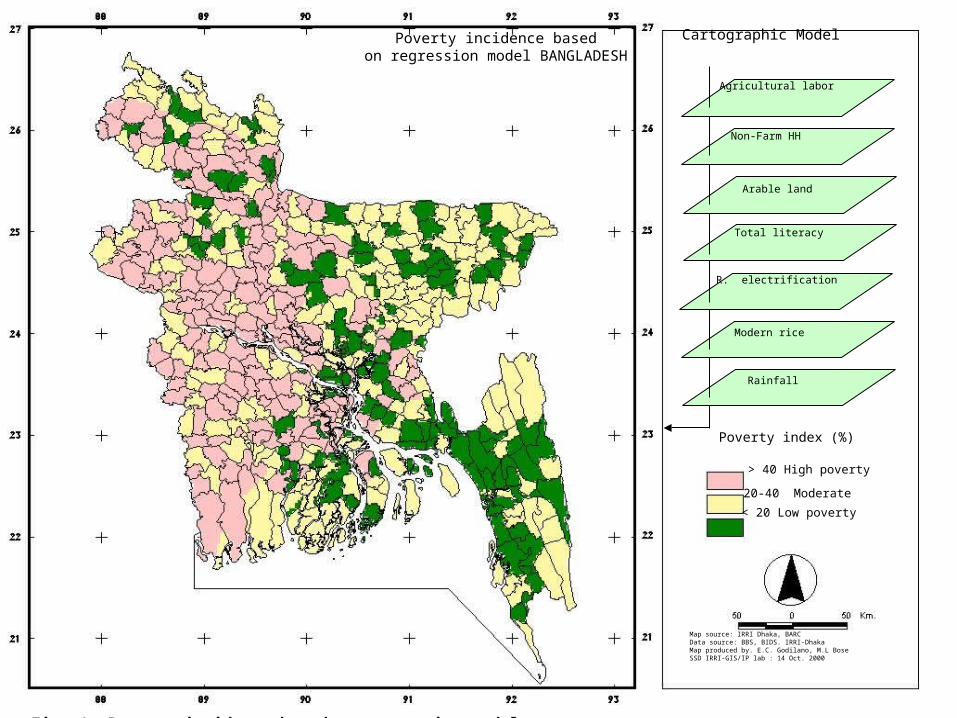
Fig. 1. Poverty incidence based on regression model.
Poverty incidence basedon regression model BANGLADESH
Map source: IRRI Dhaka, BARCData source: BBS, BIDS. IRRI-DhakaMap produced by. E.C. Godilano, M.L BoseSSD IRRI-GIS/IP lab : 14 Oct. 2000
Agricultural labor
Non-Farm HH
Arable land
Total literacy
R. electrification
Modern rice
Rainfall
Cartographic Model
> 40 High poverty
< 20 Low poverty
20-40 Moderate
Poverty index (%)

8 WFP Bangladesh - Vulnerability Analysis & Mapping
Data sources for food security analysis Data sources for food security analysis and mappingand mapping• Household Income and Expenditure Survey, 2000
• Poverty Monitoring Survey, May 1999
• Child Nutrition Survey, 2000
• Demographic and Health survey, 1999-2000
• Multiple Indicator Cluster Survey, 2000
• Nutrition Surveillance Project, HKI/IPHN
• Census of population, 2001
• Census of slum areas and floating populations, 1997
• Census of Agricultural, 1996
9 WFP Bangladesh - Vulnerability Analysis & Mapping
Considerations:Considerations:
• Level of targeting
• Incidence of chronic food insecurity, but …
• Nature of the development programme
• Accessibility and cost-effectiveness
• Presence of partner capabilities
• Political and security considerations
• Geographic targeting vs beneficiary targeting (access to land, gender, source of income)
VAM’s strategy for a new set of VAM’s strategy for a new set of targeting maps.targeting maps.

10
WFP Bangladesh - Vulnerability Analysis & Mapping
(A) Targeting maps for VGD & IFS(A) Targeting maps for VGD & IFS
Approach 1 – Mapping of food security indicatorsApproach 1 – Mapping of food security indicators
• 1st tier - Based on indicators of extreme poverty (food intake, income, expenditure, assets and nutrition)
2nd tier – Based on household (e.g. quality of housing, source of income, landownership, literacy, etc.) and area characteristics (e.g. rural electricity, land-use, infrastructure etc.)
• Ranking of areas based on a combination of methods (scoring, indices, principle component)
Poverty/lack of sufficient purchasing power is main obstacle to achieving food security:• 44 percent falls below the absolute poverty line (2,122 K.Cal/day)• 20 percent (25 million people) consume less then 1,805 k.Cal/day
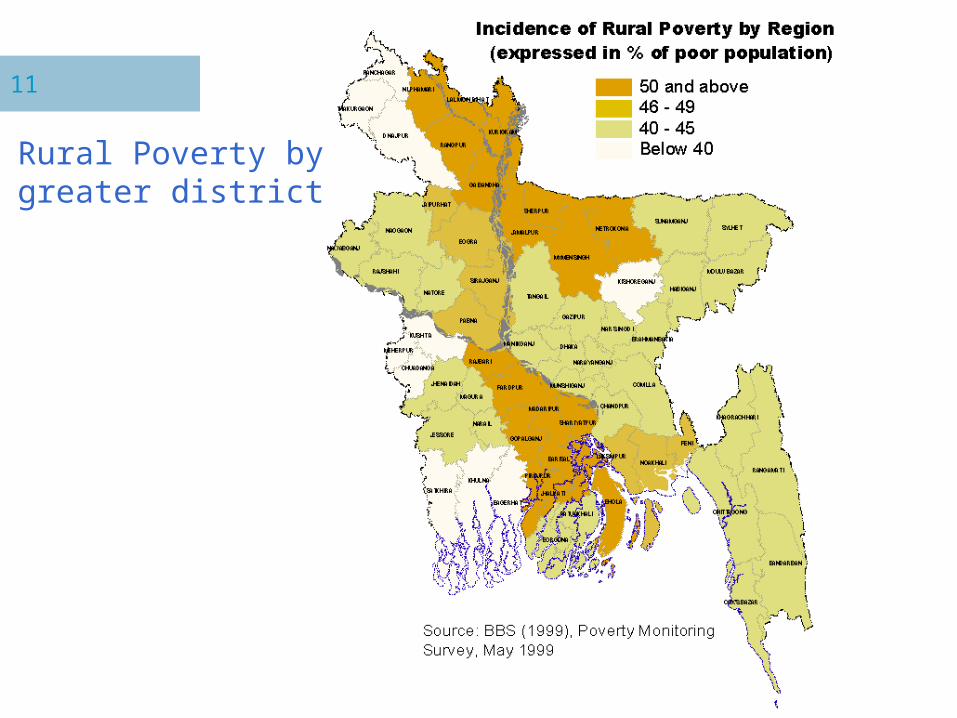
11
WFP Bangladesh - Vulnerability Analysis & Mapping
Rural Poverty by greater district

12
WFP Bangladesh - Vulnerability Analysis & Mapping
13
WFP Bangladesh - Vulnerability Analysis & Mapping
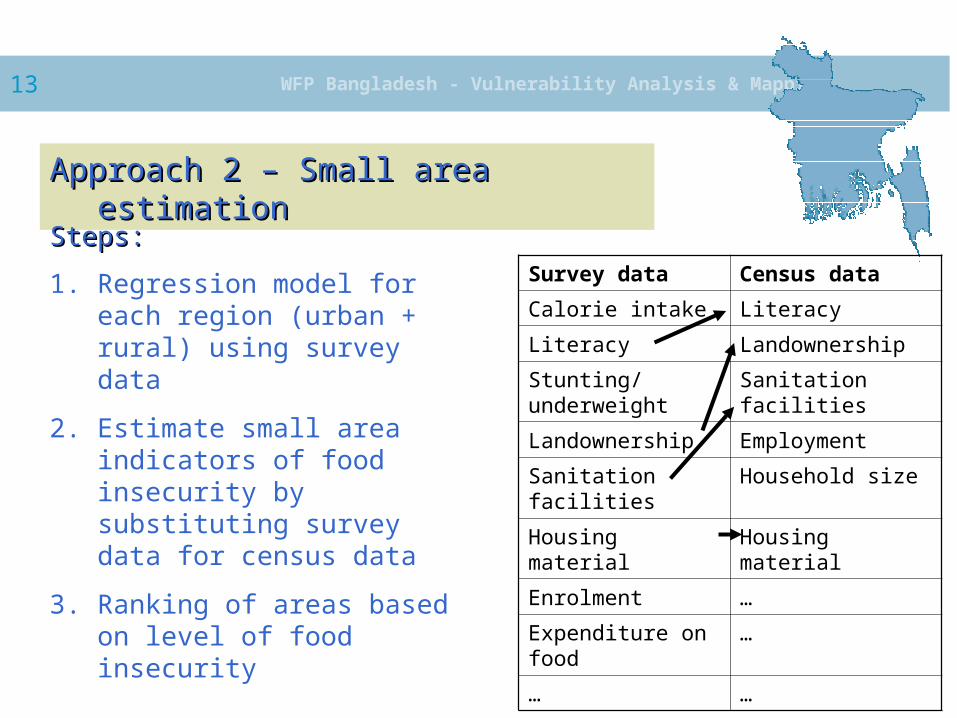
Approach 2 – Small area estimationApproach 2 – Small area estimation
Survey data Census data
Calorie intake Literacy
Literacy Landownership
Stunting/underweight
Sanitation facilities
Landownership Employment
Sanitation facilities
Household size
Housing material Housing material
Enrolment …
Expenditure on food
…
… …
1. Regression model for each region (urban + rural) using survey data
2. Estimate small area indicators of food insecurity by substituting survey data for census data
3. Ranking of areas based on level of food insecurity
Steps:Steps:

14
WFP Bangladesh - Vulnerability Analysis & Mapping
• Compare and validate different approaches and outcomes
• Identify the underlying factors that were most significant in explaining the incidence of food insecurity
• Overlay food insecurity maps with area resource maps (e.g. differences in operational costs and accessibility, partners presence and capacity) for additional insight into where to target WFP’s development programmes.
Analysis of the differences between Analysis of the differences between approach 1 and 2:approach 1 and 2:

15
WFP Bangladesh - Vulnerability Analysis & Mapping
Urban and rural targeting maps based on:
• Food Insecurity and Nutrition (food consumption, anthropometric data)
• Primary education (no. schools, enrolment, attendance, teacher/pupil ratio, drop-out.
• Local partners capabilities
(B) Targeting maps School Feeding Programme(B) Targeting maps School Feeding Programme
16
WFP Bangladesh - Vulnerability Analysis & Mapping
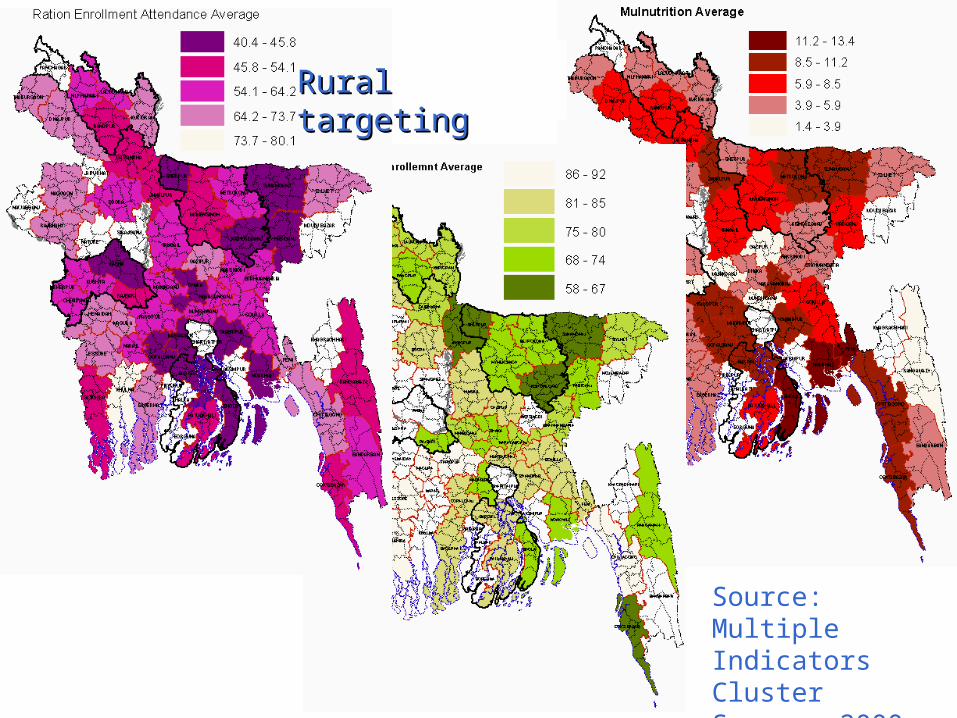
Source: Multiple Indicators Cluster Survey, 2000
Rural targetingRural targeting

17
WFP Bangladesh - Vulnerability Analysis & Mapping
• Map based on proxy indicators obtained from Census of slum areas, 1997 (slum characteristics, literacy, employment, housing, toilet facilities, source of drinking water, land ownership, electricity).
• Mapping of partner presence and capabilities
Urban targetingUrban targeting
•HIES 2000, poverty in urban areas increased with 7.2 percent
•Nutritional status of children living in urban slum areas is worse than in rural areas (stunting (54.1 – 52.9, Underweight (72.6 – 59.3), CNS 1995/96
• Literacy rate in urban slums (14.7) is more than half the national rate found in the 1991 population census (32.4)
•HKI. Wide differences in living conditions between slums within a city. Percentage of underweight mothers ranging from 10 percent in one slum to 45 percent in another in August 2000.

18
WFP Bangladesh - Vulnerability Analysis & Mapping
(C) Vulnerability maps for emergency operations(C) Vulnerability maps for emergency operations
Vulnerability map based on:
• Identification of the most physically affected thanas based on historical disaster data (DMB & CARE&OFDA/CRED)
• Coping potential as indicated by level of poverty
• Existing WFP and partner programmes in these areas
• Scenario maps, estimate likely impact on household access to food.
• OFDA/CRED International disaster database registered 170 events during the period 1975-2000
• Vulnerability = F(fs, exposure to shocks, ability to cope)

19
WFP Bangladesh - Vulnerability Analysis & Mapping
Thank you…!Thank you…!