WFA Report: Economic Contribution of Advertising to the EU
44
The economic contribution of advertising in Europe A report for the World Federation of Advertisers January 2017
-
Upload
advertisers-association-of-nigeria -
Category
Marketing
-
view
62 -
download
0
Transcript of WFA Report: Economic Contribution of Advertising to the EU

The economic contribution of advertising in Europe A report for the World Federation of Advertisers
January 2017


The economic contribution of advertising in Europe A report for the World Federation of Advertisers
Important Notice from Deloitte
This final report (the “Final Report”) has been prepared by Deloitte LLP (“Deloitte”) for the World
Federation of Advertisers (“WFA”) in accordance with the contract with them dated 18th
February 2016
(“the Contract”) and the Change Order Number 1 dated 12th
October 2016, on the basis of the scope
and limitations set out below.
The Final Report has been prepared solely for the purposes of estimating the economic contribution of
advertising, as set out in the Contract. It should not be used for any other purpose or in any other
context, and Deloitte accepts no responsibility for its use in either regard.
The Final Report is provided exclusively for the WFA’s use under the terms of the Contract. No party
other than the WFA is entitled to rely on the Final report for any purpose whatsoever and Deloitte
accepts no responsibility or liability or duty of care to any party other than the WFA in respect of the
Final Report or any of its content.
The information contained in the Final Report has been obtained from WFA and third party sources
that are clearly referenced in the appropriate sections of the Final Report. Deloitte has neither sought
to corroborate this information nor to review its overall reasonableness. Further, any results from the
analysis contained in the Final Report are reliant on the information available at the time of writing the
Final Report and should not be relied upon in subsequent periods.
All copyright and other proprietary rights in the Final Report remain the property of Deloitte LLP and
any rights not expressly granted in these terms or in the Contract are reserved.
Any decision to invest, conduct business, enter or exit the markets considered in the Final Report
should be made solely on independent advice and no information in the Final Report should be relied
upon in any way by any third party. This Final Report and its contents do not constitute financial or
other professional advice, and specific advice should be sought about your specific circumstances. In
particular, the Final Report does not constitute a recommendation or endorsement by Deloitte to invest
or participate in, exit, or otherwise use any of the markets or companies referred to in it. To the fullest
extent possible, both Deloitte and the WFA disclaim any liability arising out of the use (or non-use) of
the Final Report and its contents, including any action or decision taken as a result of such use (or non-
use).
The economic contribution of advertising in Europe A report for the World Federation of Advertisers
Contents
Important Notice from Deloitte 3
Executive Summary 1
1 Introduction 3
2 GDP impacts 5
3 Employment impacts 13
4 Advertising fuels healthy competition and boosts the media
sector across Europe 18
5 Conclusions 27
6 References 28
Annex A: Estimating the GDP impacts 29
Annex B: Estimating the employment impacts 37
1
This report has one over-riding objective: to demonstrate what the contribution of advertising to the
European and national economies is, as well as assessing its tangible benefits to EU citizens.
The World Federation of Advertisers (WFA), with the support of a wide range of industry stakeholders1
commissioned Deloitte to quantify the economic impact of advertising, both across Europe and in a
selection of other developed markets.
This was no easy task, as there are a large number of factors which can influence GDP. However,
Deloitte created an econometric model to isolate the benefits of advertising to the European economy,
and to individual EU markets or countries such as Japan and Canada.
The model was based on 17 years of Advertising Association/WARC2 data (1998 – 2014) from 35
developed markets, and found that advertising spend in the EU has a seven-fold impact on the wider
economy.
The key findings can be summarised under three main headings:
On average, 1 Euro of advertising spend generated 7 Euros for the Economy
This means that the EUR 92 billion spent on advertising in 2014 in the EU is estimated to have
contributed EUR 643 billion to GDP, representing 4.6% of the overall EU GDP.
Advertising contributes to wider economic growth through its ability to support competitiveness. It
provides consumers with information on products and services, and helps to increase their choice of
goods and services. This, in turn, drives innovation by incentivising businesses to create differentiated
products and services, allowing them to out-compete their competitors not just in the EU but around the
world.
Advertising provides almost 6 million jobs in the EU, equivalent to 2.6% of all EU
employment3
Advertising is a major source of employment and provides jobs in three ways:
Firstly, there are people employed directly in the production of advertising. These jobs
account for 16% of the 5.8m total jobs supported by advertising. The study excludes
employment associated with in-house production of advertising, so this is a conservative
number;
1 Advertising Association UK (AA), Association des Agences-Conseils en Communication (AACC), Association of
European Radios (AER), European Association of Communications Agencies (EACA), European Broadcasting
Union (EBU), European association of television and radio sales houses (EGTA), Internet Advertising Bureau EU
(IAB EU), Mainostajat Finland, Organisation Werbungtreibende im Markenverband (OWM), Union des Annonceurs
(UDA), Union des Entreprises de Conseil et Achat Media (UDECAM). 2 AA/Warc Expenditure Report
3 2014 figures.
Executive Summary

2
Secondly, there are jobs created in media and online businesses that are funded by
advertising, including journalists and content producers as well as people working in out-of-
home (OOH) or TV, for example. This accounts for 10% of the 5.8m jobs.
The roles in both these areas provide greater security than jobs in other sectors4 and an
average salary that is higher than the rest of the economy5, reflecting the fact that they can be
described as “quality jobs”, as defined by the OECD;
Finally, there are the jobs created in the wider economy as a consequence of advertising
activity. These range from sales jobs to roles supporting the ad business in industries such as
hospitality. This area also includes roles created by the advertising-stimulated demand for
products and services and accounts for 74% of the 5.8m jobs.
Advertising provides personal and social benefits by funding or part funding media
services, meaning people can enjoy them for free or at a reduced rate.
Advertising ensures that EU citizens benefit from news and entertainment at a reduced cost or even for
free. The €92bn spent on advertising in 2014 directly funded content of all kinds.
Outdoor advertising also provides additional civic benefits in the form of an improved urban
environment while search engines help people to reduce both the time and financial cost of seeking
new information.
Without advertising, funding for all sorts of media would be reduced. This could lead to more expensive
TV-subscriptions, reduced newspapers and magazines’ plurality and independence, and radio stations
would lack the ability to provide news and entertainment throughout the day. In addition, professional
sports and cultural events would need to seek financial support from another source.
On the internet, advertising largely funds free services that people across Europe use at little or no
cost. For example, around 70% of EU citizens regularly use email services, while social media are
accessed by all segments of the population.
Advertising matters for employment, innovation, culture and entertainment, and supports media
plurality which is fundamental to democratic freedoms. The benefits are pervasive and run through the
fabric of society. Europe without advertising would be poorer, less well informed and less competitive.
4 KPMG, 2016 (KPMG Media Tracker 2015, found at https://home.kpmg.com/uk/en/home/insights/2015/01/media-
tracker.html) 5 Eurostat data based on the following sectors: Advertising, Television, Radio, Press, Internet, and Cinema.
3
Advertising plays an important role in market economies by facilitating communication between
businesses and their customers. It provides customers with information to support their purchasing
decisions and strengthens incentives for businesses to enter markets and to develop products.
Advertising also plays an important funding role in enabling media services. This not only provides
value to consumers but also increasingly supports the activities of businesses that use the services as
platforms to showcase their offering.
The broad role that advertising has in the economy means its economic impacts are far-reaching.
Previous Deloitte studies have investigated and sought to quantify these impacts in the UK, Ireland and
Belgium.6 The current study, commissioned by the World Federation of Advertisers (WFA), builds on
this body of work and presents quantitative estimates of the economic contribution that advertising
makes across Europe and a selection of other developed markets. As agreed with the WFA, the focus
of this study is on generating data and it concentrates on the GDP and employment contributions of
advertising.
The intention is that the data presented in this report can be used separately to support a fuller analysis
on the economic impact of advertising, which may follow in a subsequent study.
1.1 Scope
This report presents data on the economic contribution of advertising in the EU and in selected
member markets. As agreed with the WFA, these markets are:
The United Kingdom7;
Belgium8;
Finland;
France;
Germany;
Hungary; and
EU-28
In addition, and as agreed with the WFA, the report also presents data on the GDP contribution in the
following non-EU developed markets:
Australia;
Canada;
Korea; and
6 “Advertising Pays: How advertising fuels the UK economy” (a Deloitte report for the Advertising Association
published in 2013); “Advertising Pays 2: How advertising can unlock UK growth potential”; (a Deloitte report for the
Advertising Association published in 2014); “Advertising Pays 3: The value of advertising to the UK’s culture, media
and sport.” (a Deloitte report for the Advertising Association published in 2015); “Advertising: An engine for
economic growth.” (a Deloitte report for Core Media Communications published in 2013). 7 Note that the estimates of the GDP impact of advertising for the United Kingdom are sourced from “Advertising
Pays: How advertising fuels the UK economy” (a Deloitte report for the Advertising Association published in 2013) 8 Results are only reported for Belgium on the GDP contribution
1 Introduction
4
Japan.
The measures of economic contribution used in this report are outlined below.
Contribution to GDP
Chapter 2 presents estimates of the annual contribution of advertising to GDP for each of the markets
outlined above. These estimates are presented in Euros, but also as a percentage of the total GDP of
the market. In addition, the implied “GDP multiplier” – that is, the ratio of GDP impact to advertising
spend - is reported for each market.
To contextualise the analysis, there is also a high level discussion on what considerations may be
relevant when interpreting these figures ahead of any future study that conducts more detailed analysis
on the drivers of impact in the different markets.
The technical detail on how the GDP estimates are calculated is included in Annex A.
Contribution to employment
Chapter 3 presents estimates of the contribution of advertising to employment in the European
markets. In addition to the total impact, this chapter presents the break-down across different
categories.
As for the section on GDP, a high level discussion is also provided on what considerations may be
relevant for interpreting the figures ahead of any future study.
Technical detail on how the employment estimates are calculated is included in Annex B.
Other elements
Whilst Chapter 2 presents the aggregate contribution of advertising to GDP, it does not quantify the
channels through which advertising spend impacts GDP. While not quantifiable, such channels are
important to understand the reasons behind the impact. Chapter4, therefore, presents additional data
on the economic contribution of advertising in a selection of markets. This is based on existing
evidence on the role that advertising plays in:
Enabling free-to-use or subsidised media services; and
Supporting competition.
5
2.1 Approach
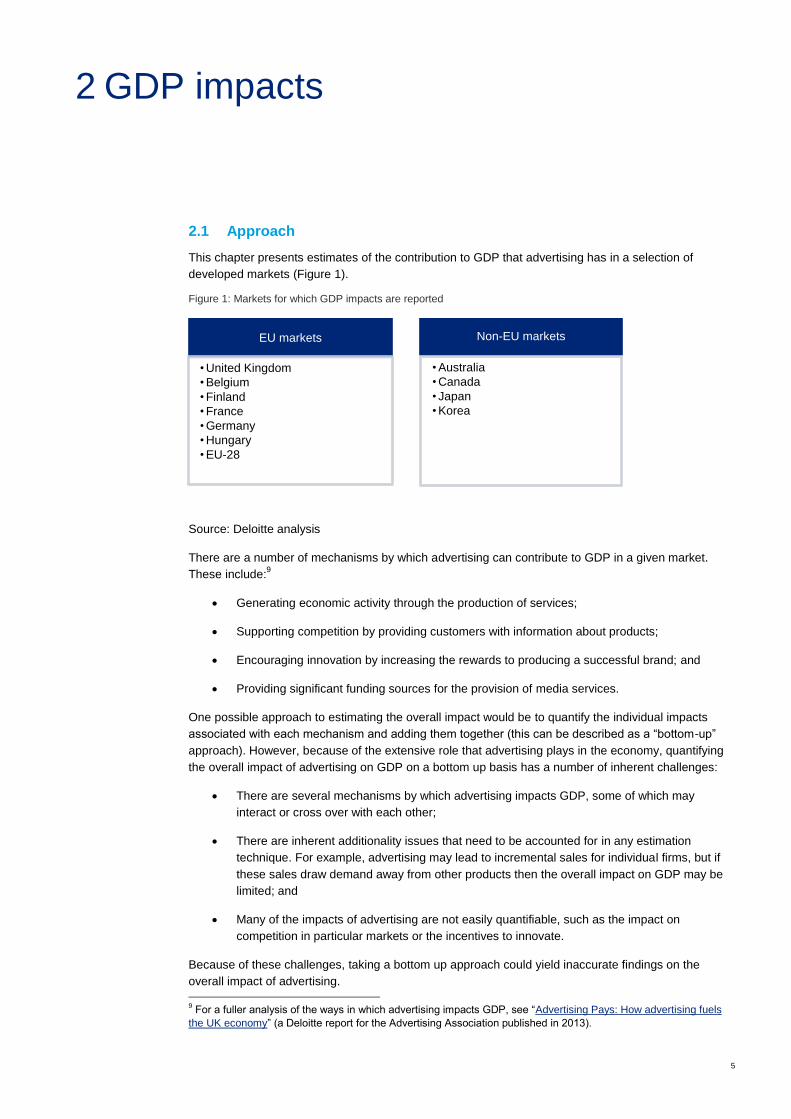
This chapter presents estimates of the contribution to GDP that advertising has in a selection of
developed markets (Figure 1).
Figure 1: Markets for which GDP impacts are reported
Source: Deloitte analysis
There are a number of mechanisms by which advertising can contribute to GDP in a given market.
These include:9
Generating economic activity through the production of services;
Supporting competition by providing customers with information about products;
Encouraging innovation by increasing the rewards to producing a successful brand; and
Providing significant funding sources for the provision of media services.
One possible approach to estimating the overall impact would be to quantify the individual impacts
associated with each mechanism and adding them together (this can be described as a “bottom-up”
approach). However, because of the extensive role that advertising plays in the economy, quantifying
the overall impact of advertising on GDP on a bottom up basis has a number of inherent challenges:
There are several mechanisms by which advertising impacts GDP, some of which may
interact or cross over with each other;
There are inherent additionality issues that need to be accounted for in any estimation
technique. For example, advertising may lead to incremental sales for individual firms, but if
these sales draw demand away from other products then the overall impact on GDP may be
limited; and
Many of the impacts of advertising are not easily quantifiable, such as the impact on
competition in particular markets or the incentives to innovate.
Because of these challenges, taking a bottom up approach could yield inaccurate findings on the
overall impact of advertising.
9 For a fuller analysis of the ways in which advertising impacts GDP, see “Advertising Pays: How advertising fuels
the UK economy” (a Deloitte report for the Advertising Association published in 2013).
EU markets
• United Kingdom
• Belgium
• Finland
• France
• Germany
• Hungary
• EU-28
Non-EU markets
• Australia
• Canada
• Japan
• Korea
2 GDP impacts

6
For these reasons, the analysis in this report takes a top-down approach to modelling the impact of
advertising on GDP. It uses an econometric model to estimate the overall relationship between
advertising spend and GDP in each of the markets, drawing on a rich data set that spans 35 countries
and 17 years of data.
The advantage of this top-down approach is that it captures most mechanisms by which advertising
impacts GDP to produce an estimate of the aggregate net impact of advertising. In principle, this
estimate accounts for interactions, additionality issues and non-measurability issues. However because
the impact is measured at an aggregate level, it is not possible to disentangle the individual impacts
from the total for each market.
Full details of the modelling approach are described in Annex A.
2.2 Results
Figure 2 shows the total EUR value of advertising spend in each of the studied markets in 2014 and
Figure 3 shows the total, net GDP impacts in 2014 that are caused by the advertising spend in each
market.
The total ad spend across the studied markets (EU-28, Japan, Korea, Australia and Canada) in 2014 is
estimated to be EUR 146 billion. This is estimated to have supported EUR 972 billion in GDP, which is
equivalent to 4.7% of total GDP in these markets.
Tool Box: Intuition behind the modelling approach
In order to understand the aggregate net effect of advertising on GDP, this study uses
econometric modelling to draw out its impact after controlling for other determinants of
GDP.
Many factors can impact the level of GDP in a given market, such as government
expenditure, levels of trade or investment, number of hours worked and so on. The
level of advertising expenditure can also be a factor, but determining its specific
impact on GDP while holding the other factors constant is a challenging task which
econometrics helps achieve.
By using annual data across 35 countries and 17 years, the econometric model tests
whether advertising has an impact on GDP over and beyond the impact of variables
that have been shown to contribute to GDP and GDP growth. This impact is tested
over time to ensure that what is observed is not due to other events happening in a
specific year, and across countries to ensure this relationship holds across markets.
A long-run relationship between advertising spend and GDP can therefore be inferred,
which can then be used to estimate the GDP impact, in Euros, of a 1 Euro spend in
advertising in a given year.

7
Figure 2: Annual advertising spend by market in 2014
Source: Deloitte analysis, WARC10
Figure 3: Estimated annual GDP impact of advertising in 2014
Source: Deloitte analysis
2.3 Interpreting the results
2.3.1 The GDP multiplier
The results presented above describe the total GDP impact of advertising in each of the markets. In
presenting the relationship between advertising and GDP, it has proved useful in previous studies to
present the impacts in terms of a GDP multiplier.11
That is, to present the average Euro value of GDP
impact per Euro ad spend. The advantage of this metric is that, by controlling for the scale of the total
ad spend, it provides an arguably more tangible illustration of the impact of advertising spend. Figure 4
presents the results of the GDP multipliers.
10
WARC is an online service offering advertising best practice, evidence and insights from the world’s leading
brands. See https://www.warc.com/ for more information. 11
For example, “Advertising Pays: How advertising fuels the UK economy” (a Deloitte report for the Advertising
Association published in 2013).

8
Figure 4: Average GDP multipliers12
Source: Deloitte analysis
The estimated multipliers are broadly in line with estimates that were produced in previous studies. For
example, a study produced in 2013 for Core Media Communications estimated the Ireland multiplier at
5.7.13
The estimated multipliers for most markets fall in a range of between 6 and 8, but for Australia, the
GDP multiplier lies outside this range. However, while the GDP multipliers provide a useful metric for
the purposes of exposition, caution should be exercised in how they are interpreted, especially when
making cross-country comparisons. The relationship between advertising and GDP is complex and
non-linear, with incremental returns to advertising potentially higher when ad spend is low. As a result,
the average multiplier is a rough approximation of the relationship and cross-market differences will be
significantly driven by differences in levels of advertising spend.
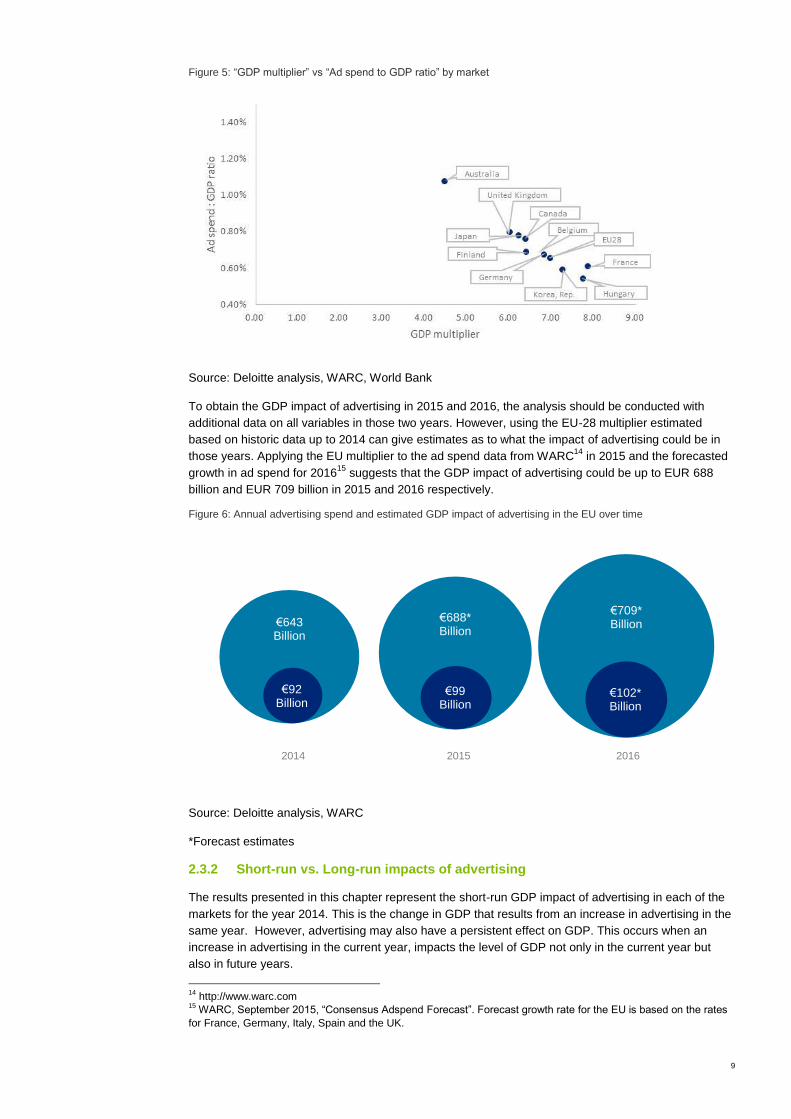
Figure 5 shows the relationship between the estimated average GDP multipliers and the ratio of
advertising spend to GDP in each of the markets. As this chart shows, markets with a high advertising
spend to GDP ratio generally have a low average GDP multiplier and vice versa. This chart also shows
that Australia is an outlier with an advertising spend to GDP ratio of above the sample average. This
helps to explain why its average GDP multiplier is below the sample average.
12
Note that the estimate for the United Kingdom is sourced from “Advertising Pays: How advertising fuels the UK
economy” (a Deloitte report for the Advertising Association published in 2013) and the one for Belgium is sourced
from “Advertising Pays: The impact of advertising on the Belgian Economy” (a Deloitte report for the Conseil de la
Publicité published in December 2015) 13
“Advertising: An engine for economic growth.” A report for Core Media Communications published in 2013.
9
Figure 5: “GDP multiplier” vs “Ad spend to GDP ratio” by market
Source: Deloitte analysis, WARC, World Bank
To obtain the GDP impact of advertising in 2015 and 2016, the analysis should be conducted with
additional data on all variables in those two years. However, using the EU-28 multiplier estimated
based on historic data up to 2014 can give estimates as to what the impact of advertising could be in
those years. Applying the EU multiplier to the ad spend data from WARC14
in 2015 and the forecasted
growth in ad spend for 201615
suggests that the GDP impact of advertising could be up to EUR 688
billion and EUR 709 billion in 2015 and 2016 respectively.
Figure 6: Annual advertising spend and estimated GDP impact of advertising in the EU over time
Source: Deloitte analysis, WARC
*Forecast estimates
2.3.2 Short-run vs. Long-run impacts of advertising
The results presented in this chapter represent the short-run GDP impact of advertising in each of the
markets for the year 2014. This is the change in GDP that results from an increase in advertising in the
same year. However, advertising may also have a persistent effect on GDP. This occurs when an
increase in advertising in the current year, impacts the level of GDP not only in the current year but
also in future years.
14
http://www.warc.com 15
WARC, September 2015, “Consensus Adspend Forecast”. Forecast growth rate for the EU is based on the rates
for France, Germany, Italy, Spain and the UK.
€643 Billion
€92 Billion
€688* Billion
€99 Billion
€709* Billion
€102* Billion
2015 2014 2016
10
There is evidence in the economic literature to support a long-run relationship of this sort (specifically,
between consumption and advertising). Keir (1993) examines this process using quarterly data for the
UK from 1970 to 1991 and concludes that a £1 rise in advertising leads to an £8.97 increase in real
consumption in the long-run.16
As consumption is pro-cyclical and represents over 60% of GDP17
, this
translates to a long-run GDP multiplier of around £15. In more recent work by Marattin (2008), the
effects of advertising on consumption are estimated for Italy using quarterly data from 1980 to 2000.18
The study reports that for every 1% rise in expenditure, real consumption increases by 0.034% in the
short-run and 0.16% in the long-run.
For the sample considered in this study, there is less evidence to support the existence of the long-run
relationship between these advertising and GDP. This does not imply the absence of a long term
impact, but rather when using the current data and model specification, the long term relationship is not
found to be stable enough to be conclusive.
2.3.3 Investigating variations in the link between advertising and GDP impact
The results above suggest advertising has a significant impact on GDP across each of the markets
studied. Despite the challenges in making cross-market comparisons of the market impact figures, it
appears there are some differences in the extent to which advertising impacts on GDP (for example,
Korea has a higher ad spend : GDP ratio than Hungary but also a higher average GDP multiplier). A
natural question is to ask: what are the drivers of any differences in the impact that advertising has on
GDP across the markets?
Answering this question fully is beyond the scope of this study, but potentially important determinants
are considered here.
Channel mix
The modelling in this study considers the GDP impact of total advertising spend in each of the markets.
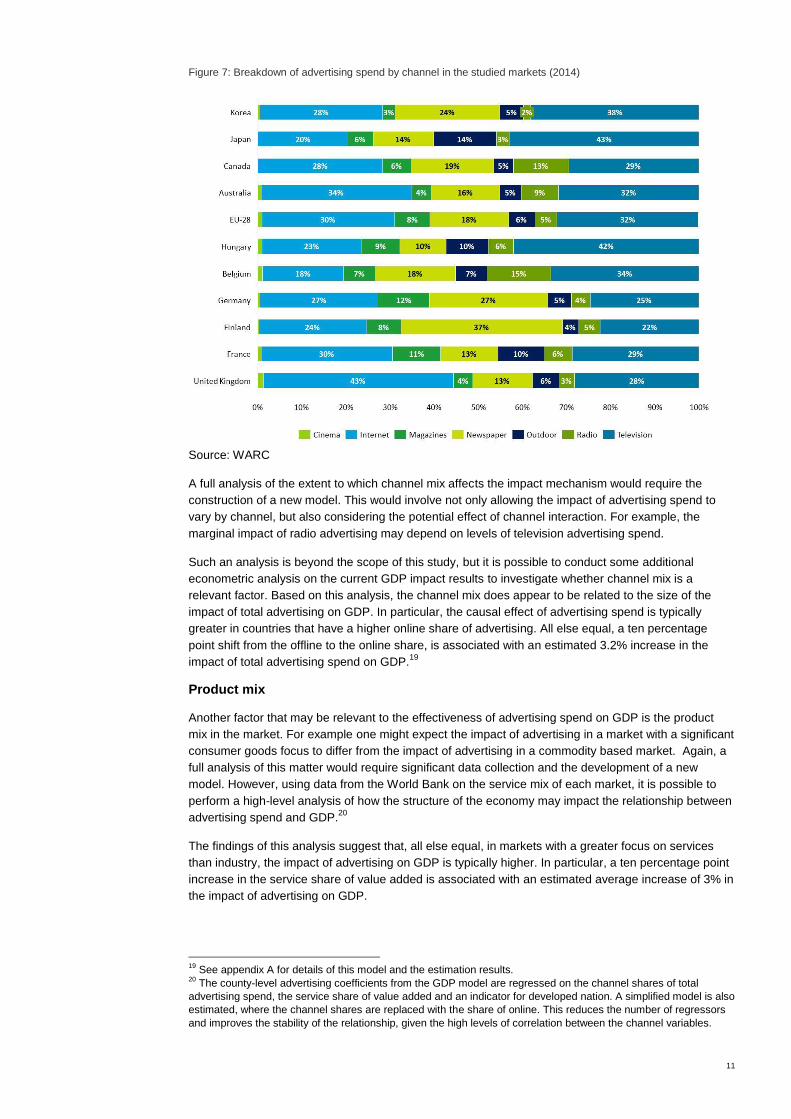
However, it is possible that different channel mixes may give rise to different degrees of impact. Figure
7 describes the advertising channel mixes across the different markets. It shows that the focus of the
ad spend differs significantly. For example:
Internet accounts for 43% of advertising spend in the UK but only 20% in Japan;
Television accounts for 42% of advertising spend in Hungary, but only 25% in Germany; and
Press (Newspapers and Magazines) accounts for 39% of advertising spend in Germany but
only 19% in the UK.
16
Keir, T., (1993), The Aggregate Advertising- Consumption Relationship, Revisited mimeo – University of Warwick 17
Deloitte analysis using World Bank Data for the UK between 1998-2014 18
Marattin, L., (2008), The Impact of Advertising on Aggregate Consumption: The Case of Italy – University of
Bologna
11
Figure 7: Breakdown of advertising spend by channel in the studied markets (2014)
Source: WARC
A full analysis of the extent to which channel mix affects the impact mechanism would require the
construction of a new model. This would involve not only allowing the impact of advertising spend to
vary by channel, but also considering the potential effect of channel interaction. For example, the
marginal impact of radio advertising may depend on levels of television advertising spend.
Such an analysis is beyond the scope of this study, but it is possible to conduct some additional
econometric analysis on the current GDP impact results to investigate whether channel mix is a
relevant factor. Based on this analysis, the channel mix does appear to be related to the size of the
impact of total advertising on GDP. In particular, the causal effect of advertising spend is typically
greater in countries that have a higher online share of advertising. All else equal, a ten percentage
point shift from the offline to the online share, is associated with an estimated 3.2% increase in the
impact of total advertising spend on GDP.19
Product mix
Another factor that may be relevant to the effectiveness of advertising spend on GDP is the product
mix in the market. For example one might expect the impact of advertising in a market with a significant
consumer goods focus to differ from the impact of advertising in a commodity based market. Again, a
full analysis of this matter would require significant data collection and the development of a new
model. However, using data from the World Bank on the service mix of each market, it is possible to
perform a high-level analysis of how the structure of the economy may impact the relationship between
advertising spend and GDP.20
The findings of this analysis suggest that, all else equal, in markets with a greater focus on services
than industry, the impact of advertising on GDP is typically higher. In particular, a ten percentage point
increase in the service share of value added is associated with an estimated average increase of 3% in
the impact of advertising on GDP.
19
See appendix A for details of this model and the estimation results. 20
The county-level advertising coefficients from the GDP model are regressed on the channel shares of total
advertising spend, the service share of value added and an indicator for developed nation. A simplified model is also
estimated, where the channel shares are replaced with the share of online. This reduces the number of regressors
and improves the stability of the relationship, given the high levels of correlation between the channel variables.
12
Age mix
Demographic factors can determine product preferences and the buying behaviour of consumers. Age
in particular is often cited as a driver of new product diffusion, where younger individuals are more
likely to be early adopters. This in part could be due to the differential effects of advertising, which may
be more persuasive amongst younger consumers.
To test this hypothesis, data is obtained from the World Bank on the population shares of 15-39 year
olds and their impact on the importance of advertising is estimated. However, no statistically significant
relationship between age and advertising effectiveness was found. Thus, for the model and data
considered in this analysis, the distribution of age does not appear to be a contributory factor in the
effectiveness of advertising on GDP.
It should of course be noted, that further econometric analysis using additional models and more
disaggregated measures of the population would be required to robustly support this finding.21
This
extension is beyond the scope of the current study.
Conclusion on the drivers of impact
This section has considered what factors could help explain cross-market differences in the observed
relationship between advertising and GDP. The high-level analysis presented here suggests that the
advertising channel mix, the aggregate product mix and market demographics may be significant.22
However, identifying the detail of the relationships requires further research.
21
Interactions of age with the other determinants of advertising effectiveness should also be considered. For
example, the impacts of online spend might be negatively influenced by the age distribution. In this case higher
online shares would have a greater effect on the impact of advertising on GDP for younger populations. 22
It should be noted that the analysis identifies correlation but the direction of causation has not be modelled.

13
3.1 Approach
This chapter presents estimates of the contribution to employment that advertising has in a selection of
developed markets (Figure 8).
Figure 8: Markets for which employment impacts are reported
Source: Deloitte analysis
The employment estimates comprise three elements:
1. Direct impact: These are jobs that are involved in the production of advertising.
2. Enabling impact: These are media jobs that are supported by the role that advertising plays as
a financial enabler of media services.
3. Additional supply chain and income impacts: These are jobs that are supported along the
advertising and media supply chains and throughout the wider economy as a result of (1) and
(2).
The three employment effects are estimated separately for each of the markets. The total employment
contribution of advertising in a given market is then the sum of these three elements.
Full details of the approach taken to calculating these effects are presented in Annex B.
3.2 Results
The results of the employment analysis are presented below. The following is reported for each market:
The total number of jobs supported by advertising;
The distribution of the jobs total across the three effects (direct; enabled; and additional
supply chain / income impacts); and
The distribution of the enabled impacts across the different media sectors.
3.2.1 EU-28
Overall, the analysis suggests that 5,762,573 jobs are supported by advertising in the EU-28. This is
equivalent to 2.6% of employment in the EU.
A majority of these jobs, 74%, come from the supply chain and income effects. That is, these jobs are
supported by advertising due to the additional economic activity it creates through the use of inputs in
certain industries leading to additional outputs, salaries being paid, households spending more and
creating demand, and all the knock-on impacts associated with this initial advertising spend.
EU markets
• United Kingdom
• Finland
• France
• Germany
• Hungary
• EU-28
3 Employment impacts
14
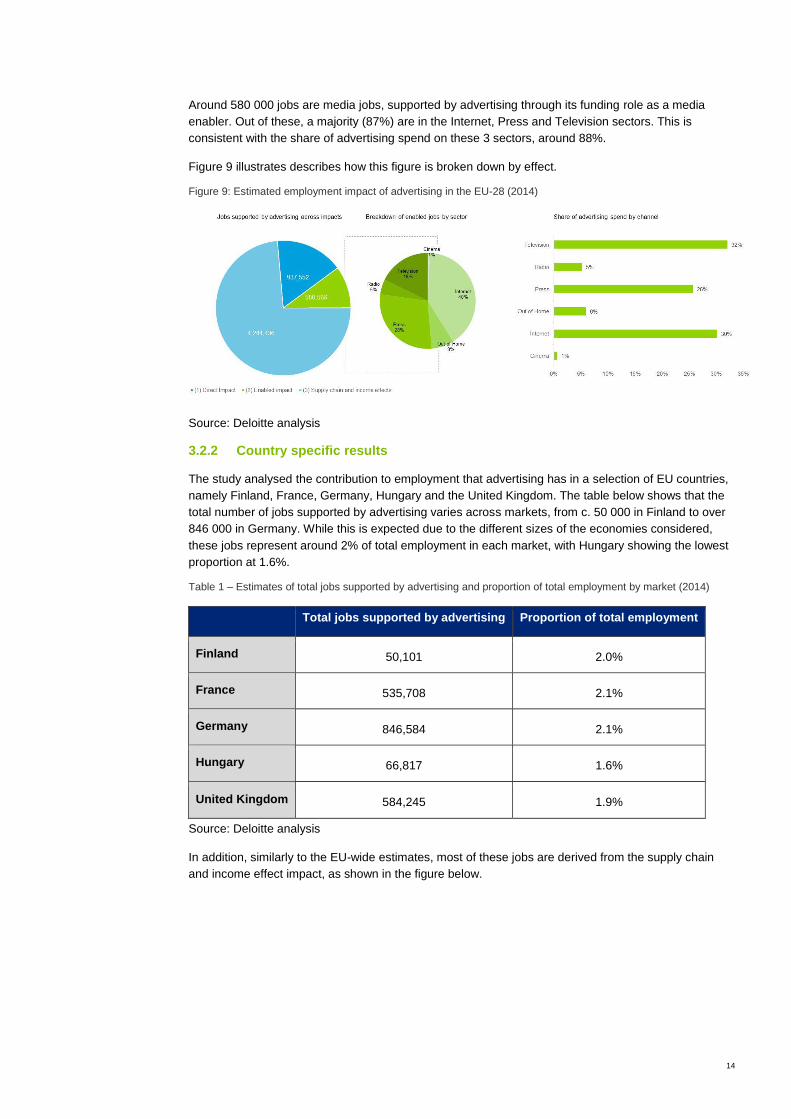
Around 580 000 jobs are media jobs, supported by advertising through its funding role as a media
enabler. Out of these, a majority (87%) are in the Internet, Press and Television sectors. This is
consistent with the share of advertising spend on these 3 sectors, around 88%.
Figure 9 illustrates describes how this figure is broken down by effect.
Figure 9: Estimated employment impact of advertising in the EU-28 (2014)
Source: Deloitte analysis
3.2.2 Country specific results
The study analysed the contribution to employment that advertising has in a selection of EU countries,
namely Finland, France, Germany, Hungary and the United Kingdom. The table below shows that the
total number of jobs supported by advertising varies across markets, from c. 50 000 in Finland to over
846 000 in Germany. While this is expected due to the different sizes of the economies considered,
these jobs represent around 2% of total employment in each market, with Hungary showing the lowest
proportion at 1.6%.
Table 1 – Estimates of total jobs supported by advertising and proportion of total employment by market (2014)
Total jobs supported by advertising Proportion of total employment
Finland 50,101 2.0%
France 535,708 2.1%
Germany 846,584 2.1%
Hungary 66,817 1.6%
United Kingdom 584,245 1.9%
Source: Deloitte analysis
In addition, similarly to the EU-wide estimates, most of these jobs are derived from the supply chain
and income effect impact, as shown in the figure below.
15
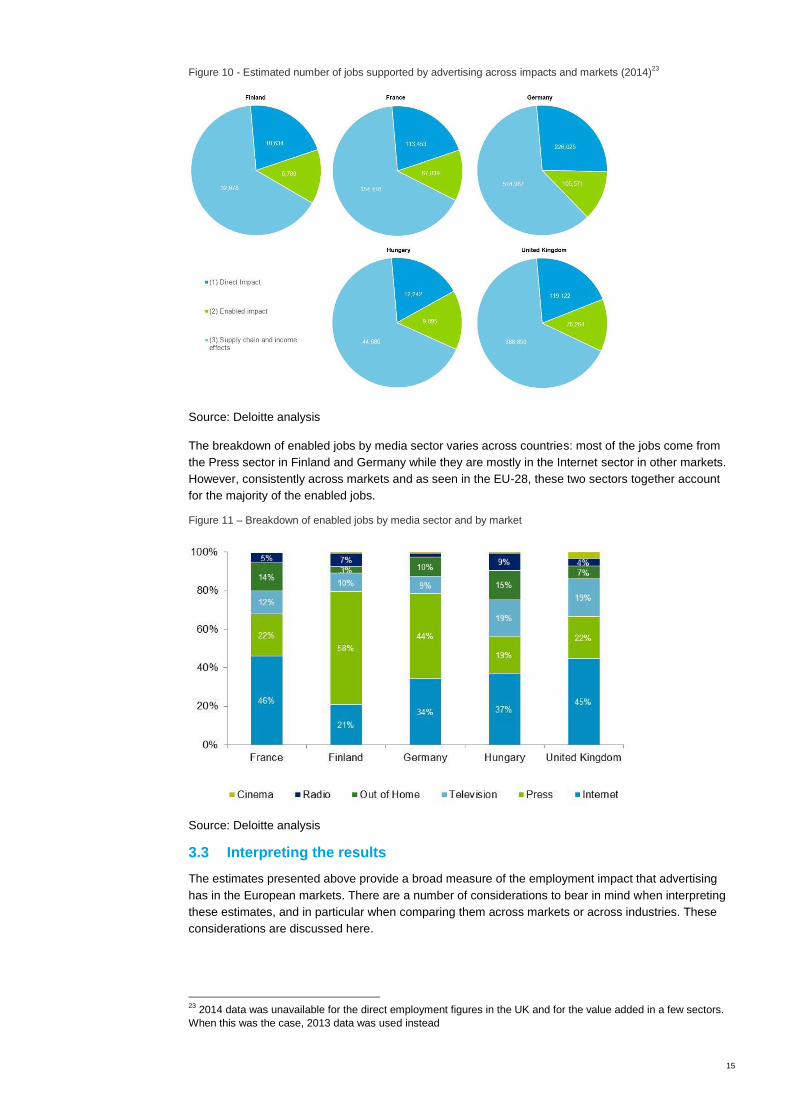
Figure 10 - Estimated number of jobs supported by advertising across impacts and markets (2014)23
Source: Deloitte analysis
The breakdown of enabled jobs by media sector varies across countries: most of the jobs come from
the Press sector in Finland and Germany while they are mostly in the Internet sector in other markets.
However, consistently across markets and as seen in the EU-28, these two sectors together account
for the majority of the enabled jobs.
Figure 11 – Breakdown of enabled jobs by media sector and by market
Source: Deloitte analysis
3.3 Interpreting the results
The estimates presented above provide a broad measure of the employment impact that advertising
has in the European markets. There are a number of considerations to bear in mind when interpreting
these estimates, and in particular when comparing them across markets or across industries. These
considerations are discussed here.
23
2014 data was unavailable for the direct employment figures in the UK and for the value added in a few sectors.
When this was the case, 2013 data was used instead
16
3.3.1 The scope of the direct impact values
First, the direct employment estimates presented here are based on employment in advertising
agencies. In reality the number of jobs associated with advertising production is likely to be greater as
much advertising content is also produced in-house. Furthermore, the extent to which this is the case
may differ across markets. However, limitations on the availability of data across the region means
there are challenges to accurately assessing this on a consistent basis across the sample.
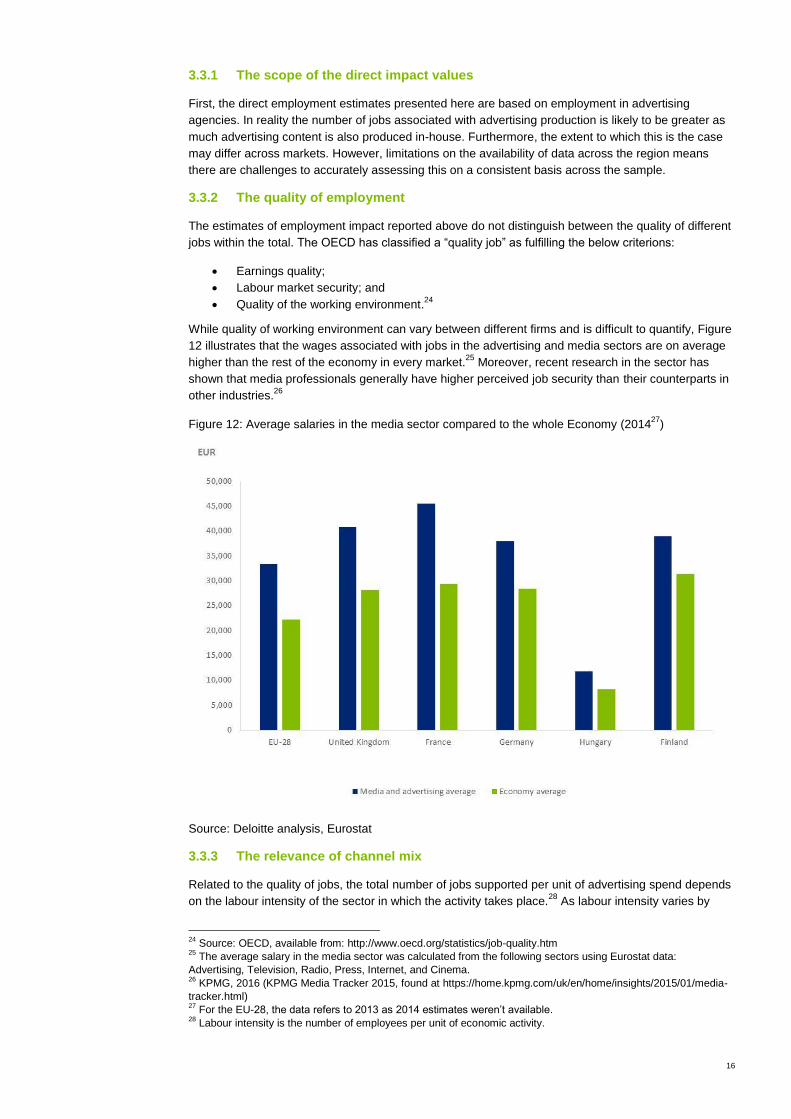
3.3.2 The quality of employment
The estimates of employment impact reported above do not distinguish between the quality of different
jobs within the total. The OECD has classified a “quality job” as fulfilling the below criterions:
Earnings quality;
Labour market security; and
Quality of the working environment.24
While quality of working environment can vary between different firms and is difficult to quantify, Figure
12 illustrates that the wages associated with jobs in the advertising and media sectors are on average
higher than the rest of the economy in every market.25
Moreover, recent research in the sector has
shown that media professionals generally have higher perceived job security than their counterparts in
other industries.26
Figure 12: Average salaries in the media sector compared to the whole Economy (201427
)
Source: Deloitte analysis, Eurostat
3.3.3 The relevance of channel mix
Related to the quality of jobs, the total number of jobs supported per unit of advertising spend depends
on the labour intensity of the sector in which the activity takes place.28
As labour intensity varies by
24
Source: OECD, available from: http://www.oecd.org/statistics/job-quality.htm 25
The average salary in the media sector was calculated from the following sectors using Eurostat data:
Advertising, Television, Radio, Press, Internet, and Cinema. 26
KPMG, 2016 (KPMG Media Tracker 2015, found at https://home.kpmg.com/uk/en/home/insights/2015/01/media-
tracker.html) 27
For the EU-28, the data refers to 2013 as 2014 estimates weren’t available. 28
Labour intensity is the number of employees per unit of economic activity.
17
sector, the channel mix of advertising spend, and not just the total value, is important in determining
the number of media jobs that are enabled by advertising (for the same reason, the channel mix also
impacts the quality of the jobs that are supported).
The labour intensity of media sectors vary across Europe, but in general, television broadcasting has a
relatively low level of labour intensity (in the EU-28 there is an average of one job created for every
€121,000 of value added while in the other sectors the ratio is more than one job for every €70,000 of
value added). This is reflected in the employment estimates, with enabled jobs in a given market being
disproportionally small in Television (for example, in the EU-28, Television advertising accounts for
32% of total ad spend but only 18% of enabled jobs). As a result, in markets where Television
advertising accounts for a large share of the total market, the average jobs return is potentially smaller
than it would be with a channel mix that puts more weight on other sectors.
3.3.4 The distribution of employment
The employment values calculated in this study capture not only jobs in areas directly impacted by
advertising, but also jobs that are supported because of the chain of economic activity that is supported
throughout the economy. The majority of the employment impacts estimated here are in the wider
economy, from 61% in Germany to 74% in the EU overall.
The following can be considered to understand what type of jobs this estimation includes: when
advertisers and media companies produce services they demand inputs from their suppliers. Their
suppliers also demand inputs to production, as do the suppliers’ suppliers and so on. The impact of the
advertising activity therefore extends beyond the immediate sectors and throughout the economy. In
addition, as employment and income grows as a result of the economic activity, households spend
more, create more demand for goods and services throughout the economy. These additional
elements of economic activity play a role in supporting employment.
It is possible to estimate these employment impacts by analysing data on the inter-sectoral flow of
goods and services in each of the markets and tracing where the demand goes.29
Based on this
approach, between two thirds and three quarters of total employment impacts are estimated to be
accounted for by the broader effects. This is consistent with typical ratios in other industries.
Cross-market differences in the magnitude of these wider impacts are caused by differences in the
value chain structures of the economies. In markets where suppliers or consumers purchase mainly
imports instead of domestically produced goods and services, the overall impact is likely to be smaller
because the flows of demand leave the economy more quickly. This may explain why for the EU-28 as
a whole, the wider economic effects are higher (when individual countries are importing they are likely
to be importing from other EU member states).
29
This data is contained in Input-Output tables, provided by Eurostat.

18
This section presents additional evidence on the economic contribution of advertising. Drawing on
existing research it considers the role advertising plays in:
Supporting competition.
Enabling free-to-use or subsidised media services; and
Although not separately quantifiable, these help explain the channels through which advertising
positively impacts the economy. These elements are discussed below.
4.1 Competition
Competition in the marketplace is important for consumers and businesses. It benefits consumers by
reducing prices and increasing the choice of goods and services, while the incentives to outperform
competitors can also encourage businesses to innovate, which leads to improvements in product
quality. Advertising can impact on competition and the barriers to entry through a number of channels:
Impacting on consumer behaviour;
Impacting on search costs; and
Impacting barriers to entry (the impediments that make it difficult for firms to set-up in the
market) and market concentration (the extent to which the market is served by few players).
These are elements explored below.
4.1.1 Consumer behaviour
An important way in which advertising affects competition is through the impact it has on consumer
behaviour. The academic literature distinguishes between two types of advertising that are relevant
here:
“Informative” advertising: When advertising is informative, it provides consumers with
information on the existence of available brands, their attributes and location.
“Persuasive” advertising: When advertising is persuasive, it alters consumers’ tastes and
creates product differentiation and brand loyalty.
The implications for how advertising impacts consumer behaviour depends on the type of advertising.
Under the Informative view, advertising is a vehicle through which businesses can easily convey
information to potential buyers. An important consequence of this view is that consumers are able to
make better choices because they are more informed. As a result advertising is likely to increase price
sensitivity and lower prices. However, under the persuasive view, the development of brand loyalty
makes products more differentiated and leads to reductions in price sensitivity. In this case prices will
tend to rise.
The overall impact of advertising depends on the balance between these effects. The literature is
divided on which effect typically dominates and it appears to depend on the sector. For example, in one
study using information on household purchases of fast-moving-consumer-goods, it was found that TV
4 Advertising fuels healthy competition and boosts the media sector across Europe

19
advertising increased the level of price sensitivity which would lower equilibrium prices30
. Other studies
report the opposite, although empirical patterns have emerged within narrowly defined industries31
.
4.1.2 Search costs
The cost to consumers of obtaining information has been significantly reduced with the development of
online search tools and price-comparison websites. These services allow consumers to quickly access
detailed information about different products without cost, helping them make more informed choices.
Search advertising provides businesses the opportunity to scale nationally and internationally at a low
cost. By providing the funding for these services, advertising is an enabler of this information and
hence supports competition and benefits consumers and businesses.
4.1.3 Barriers to entry & concentration
The impact that advertising has on how easily firms can enter the market depends, in part, on whether
advertising has an informative or persuasive effect on consumers.
Advertising in an informative capacity is a way to stimulate competition. It increases consumers’
awareness of the available brands and their characteristics, raises price sensitivity and lower barriers
to entry – the impediments that make it difficult for firms to set-up in the market. This puts downward
pressure on mark-ups and encourages new companies to enter and trade.
However, advertising can also create additional barriers to entry. This occurs when the effect is
persuasive instead of informative and leads to products that were previously perceived as similar, to
now be perceived as differentiated. This lack of substitutability with the brands offered by incumbents
makes it difficult for new entrants to gain market share.
There have been a number of empirical studies examining the relationship between market
concentration and advertising. The evidence is again mixed, and the effects differ by industry. In one
study, advertising was found to have a negative significant effect on entry in the consumer goods
sector but no effects in producer goods industries32
.
4.2 Online funded platforms
The digital revolution has transformed trading practices and revolutionised commercial models.
Advertising funded platforms such as Google and Facebook, help to:
Reduce barriers to entry into new markets, by providing SMEs33
with an effective low-cost tool to
promote products and acquire customers through search and display advertising
Provide essential sales-channel for online-only companies, without the large sunk-costs that are
required to establish physical outlets in different jurisdictions
Provide consumers with free information that would otherwise have to be paid for without the
funding generated by paid search advertising
In a study carried out by Deloitte34
, it was reported that around 76 billion searches were conducted by
UK consumers on generalist search engines such as Google Search, Bing, and Yahoo in 2014. More
importantly, for companies using Google AdWords – paid advertising copy that appears when users
carry out searches, Deloitte estimates that businesses receive between 3 to 8 euros in advertising
profits for every 1 euro they invest.
The study also highlights how businesses use advertising funded platforms to generate new leads and
compete with existing organisations. These are companies like Chips Away, a car body repair
specialist based in Oxfordshire. They used Google AdWords to target their marketing to a 15 mile
30
Erdem (2008) 31
Bagwell (2007) 32
Orr (1974) 33
Small and medium size enterprises 34
Google’s Economic Impact: United Kingdom | 2014
20
radius of their location and reported a 15-20% increase in business since the start of their campaign.
While traditional market channels continue to form a critical part of the advertising sector, the growth of
digital media has enabled many businesses to access consumers in ways that may not have been
commercially viable in the past.
4.3 Enabling media
In many markets advertising plays an important role in funding media services. This allows consumers
to access services such as commercial TV, radio and Internet services without charge and to access
newspapers and magazines at reduced prices.35
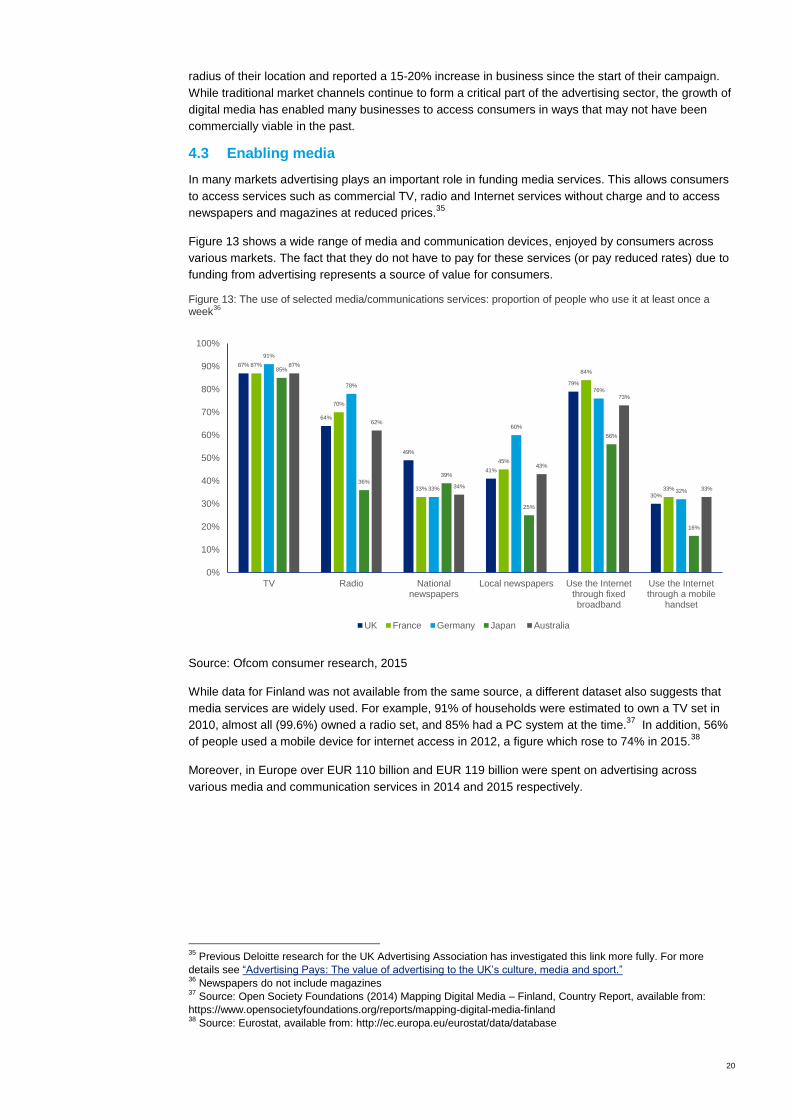
Figure 13 shows a wide range of media and communication devices, enjoyed by consumers across
various markets. The fact that they do not have to pay for these services (or pay reduced rates) due to
funding from advertising represents a source of value for consumers.
Figure 13: The use of selected media/communications services: proportion of people who use it at least once a week
36
Source: Ofcom consumer research, 2015
While data for Finland was not available from the same source, a different dataset also suggests that
media services are widely used. For example, 91% of households were estimated to own a TV set in
2010, almost all (99.6%) owned a radio set, and 85% had a PC system at the time.37
In addition, 56%
of people used a mobile device for internet access in 2012, a figure which rose to 74% in 2015.38
Moreover, in Europe over EUR 110 billion and EUR 119 billion were spent on advertising across
various media and communication services in 2014 and 2015 respectively.
35
Previous Deloitte research for the UK Advertising Association has investigated this link more fully. For more
details see “Advertising Pays: The value of advertising to the UK’s culture, media and sport.” 36
Newspapers do not include magazines 37
Source: Open Society Foundations (2014) Mapping Digital Media – Finland, Country Report, available from:
https://www.opensocietyfoundations.org/reports/mapping-digital-media-finland 38
Source: Eurostat, available from: http://ec.europa.eu/eurostat/data/database
87%
64%
49%
41%
79%
30%
87%
70%
33%
45%
84%
33%
91%
78%
33%
60%
76%
32%
85%
36%
39%
25%
56%
16%
87%
62%
34%
43%
73%
33%
0%
10%
20%
30%
40%
50%
60%
70%
80%
90%
100%
TV Radio Nationalnewspapers
Local newspapers Use the Internetthrough fixedbroadband
Use the Internetthrough a mobile
handset
UK France Germany Japan Australia
21
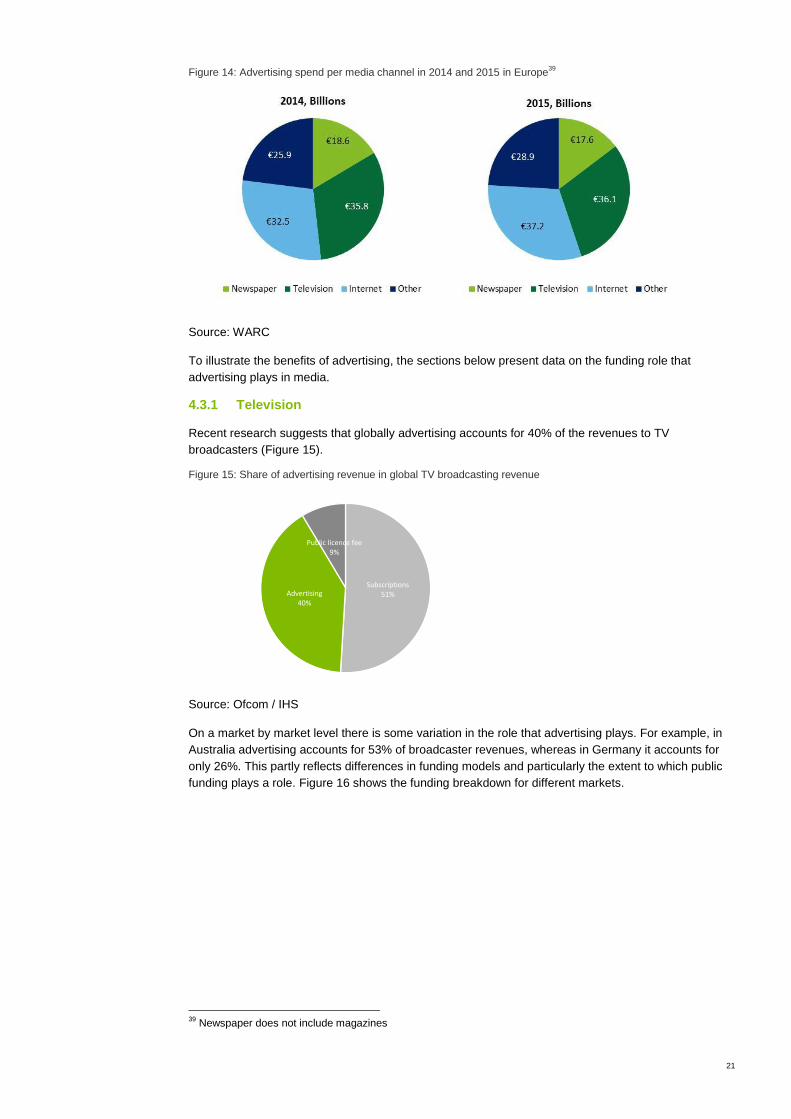
Figure 14: Advertising spend per media channel in 2014 and 2015 in Europe39
Source: WARC
To illustrate the benefits of advertising, the sections below present data on the funding role that
advertising plays in media.
4.3.1 Television
Recent research suggests that globally advertising accounts for 40% of the revenues to TV
broadcasters (Figure 15).
Figure 15: Share of advertising revenue in global TV broadcasting revenue
Source: Ofcom / IHS
On a market by market level there is some variation in the role that advertising plays. For example, in
Australia advertising accounts for 53% of broadcaster revenues, whereas in Germany it accounts for
only 26%. This partly reflects differences in funding models and particularly the extent to which public
funding plays a role. Figure 16 shows the funding breakdown for different markets.
39
Newspaper does not include magazines
Subscriptions51%Advertising
40%
Public licence fee9%
22
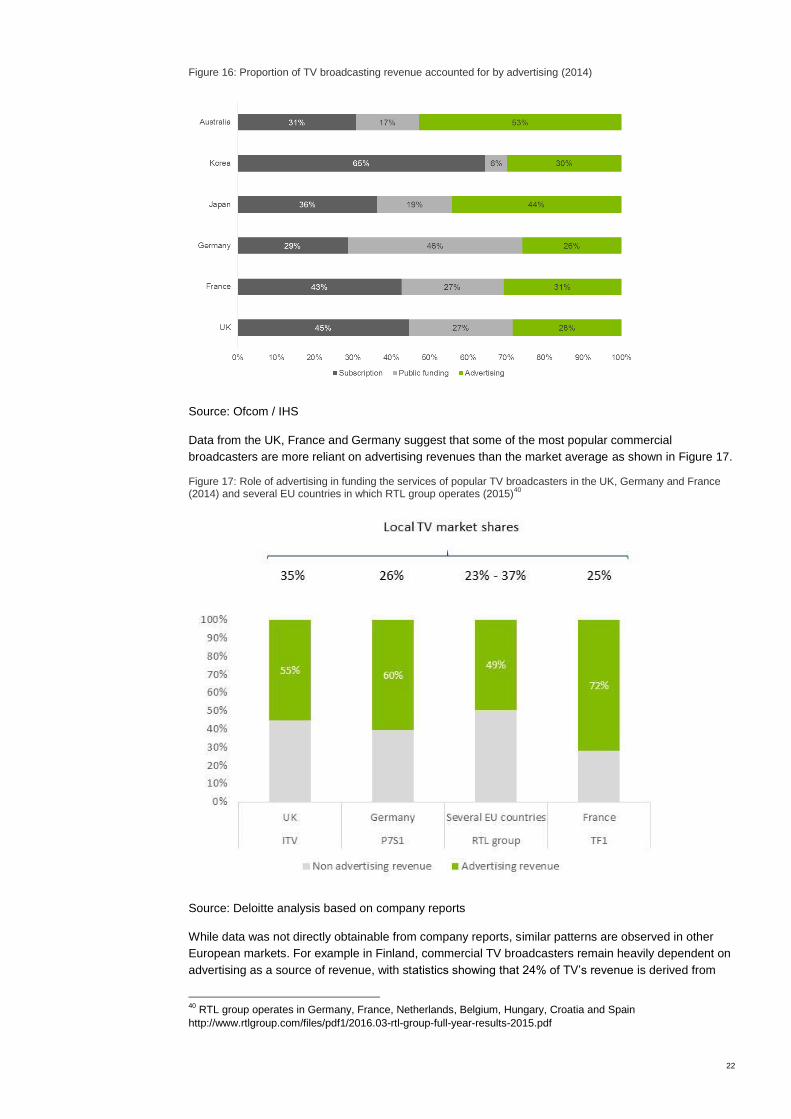
Figure 16: Proportion of TV broadcasting revenue accounted for by advertising (2014)
Source: Ofcom / IHS
Data from the UK, France and Germany suggest that some of the most popular commercial
broadcasters are more reliant on advertising revenues than the market average as shown in Figure 17.
Figure 17: Role of advertising in funding the services of popular TV broadcasters in the UK, Germany and France (2014) and several EU countries in which RTL group operates (2015)
40
Source: Deloitte analysis based on company reports
While data was not directly obtainable from company reports, similar patterns are observed in other
European markets. For example in Finland, commercial TV broadcasters remain heavily dependent on
advertising as a source of revenue, with statistics showing that 24% of TV’s revenue is derived from
40
RTL group operates in Germany, France, Netherlands, Belgium, Hungary, Croatia and Spain
http://www.rtlgroup.com/files/pdf1/2016.03-rtl-group-full-year-results-2015.pdf
23
advertising.41
In addition, European companies owning most popular commercial TV stations in Finland
are also dependent on advertising, with 35% of their income derived from advertising in TV and other
forms of media.42
4.3.2 Radio
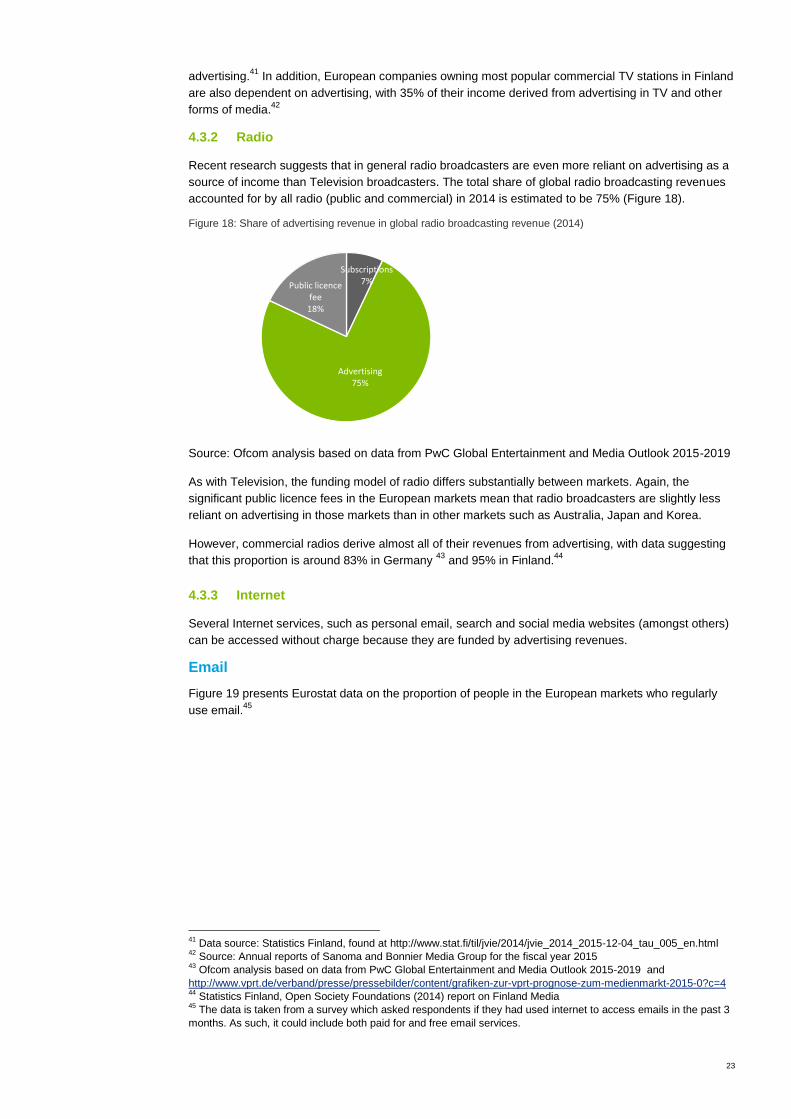
Recent research suggests that in general radio broadcasters are even more reliant on advertising as a
source of income than Television broadcasters. The total share of global radio broadcasting revenues
accounted for by all radio (public and commercial) in 2014 is estimated to be 75% (Figure 18).
Figure 18: Share of advertising revenue in global radio broadcasting revenue (2014)
Source: Ofcom analysis based on data from PwC Global Entertainment and Media Outlook 2015-2019
As with Television, the funding model of radio differs substantially between markets. Again, the
significant public licence fees in the European markets mean that radio broadcasters are slightly less
reliant on advertising in those markets than in other markets such as Australia, Japan and Korea.
However, commercial radios derive almost all of their revenues from advertising, with data suggesting
that this proportion is around 83% in Germany 43
and 95% in Finland.44
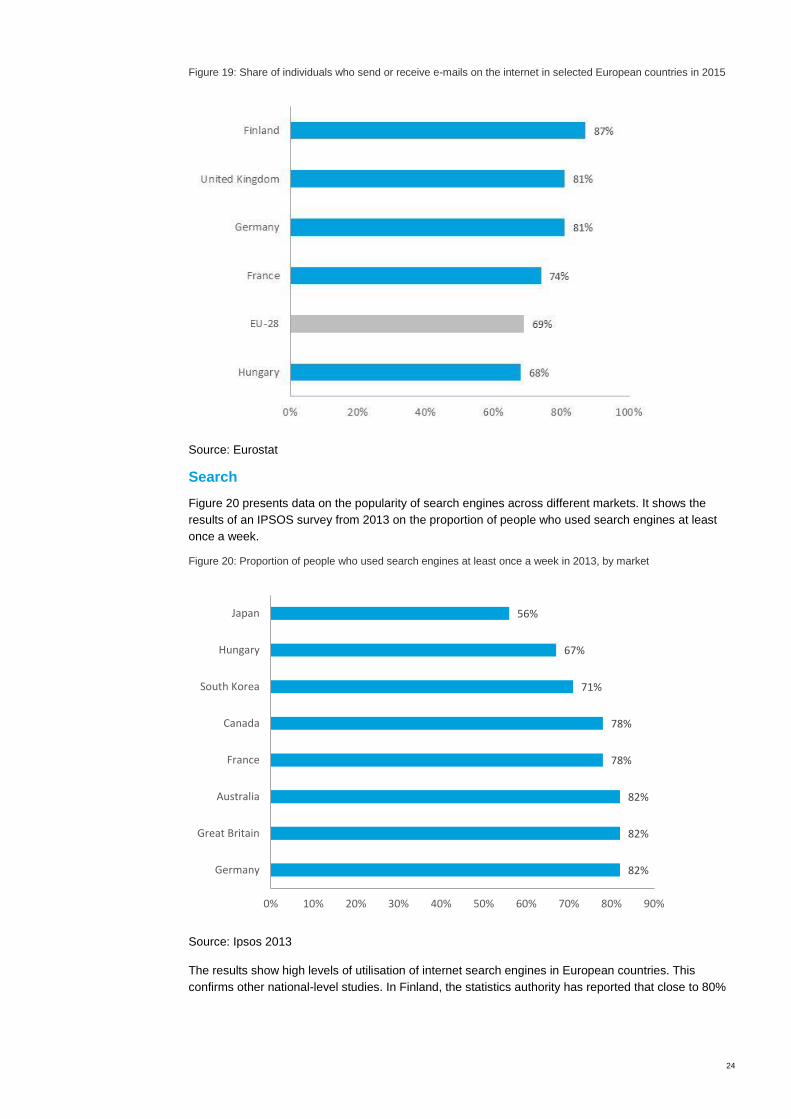
4.3.3 Internet
Several Internet services, such as personal email, search and social media websites (amongst others)
can be accessed without charge because they are funded by advertising revenues.
Figure 19 presents Eurostat data on the proportion of people in the European markets who regularly
use email.45
41
Data source: Statistics Finland, found at http://www.stat.fi/til/jvie/2014/jvie_2014_2015-12-04_tau_005_en.html 42
Source: Annual reports of Sanoma and Bonnier Media Group for the fiscal year 2015 43
Ofcom analysis based on data from PwC Global Entertainment and Media Outlook 2015-2019 and
http://www.vprt.de/verband/presse/pressebilder/content/grafiken-zur-vprt-prognose-zum-medienmarkt-2015-0?c=4 44
Statistics Finland, Open Society Foundations (2014) report on Finland Media 45
The data is taken from a survey which asked respondents if they had used internet to access emails in the past 3
months. As such, it could include both paid for and free email services.
Subscriptions7%
Advertising75%
Public licence fee18%
24
Figure 19: Share of individuals who send or receive e-mails on the internet in selected European countries in 2015
Source: Eurostat
Search
Figure 20 presents data on the popularity of search engines across different markets. It shows the
results of an IPSOS survey from 2013 on the proportion of people who used search engines at least
once a week.
Figure 20: Proportion of people who used search engines at least once a week in 2013, by market
Source: Ipsos 2013
The results show high levels of utilisation of internet search engines in European countries. This
confirms other national-level studies. In Finland, the statistics authority has reported that close to 80%
82%
82%
82%
78%
78%
71%
67%
56%
0% 10% 20% 30% 40% 50% 60% 70% 80% 90%
Germany
Great Britain
Australia
France
Canada
South Korea
Hungary
Japan
25
of its population uses the internet to search for goods and services information, with the figure being as
high as 92% for the 16-24 age group.46
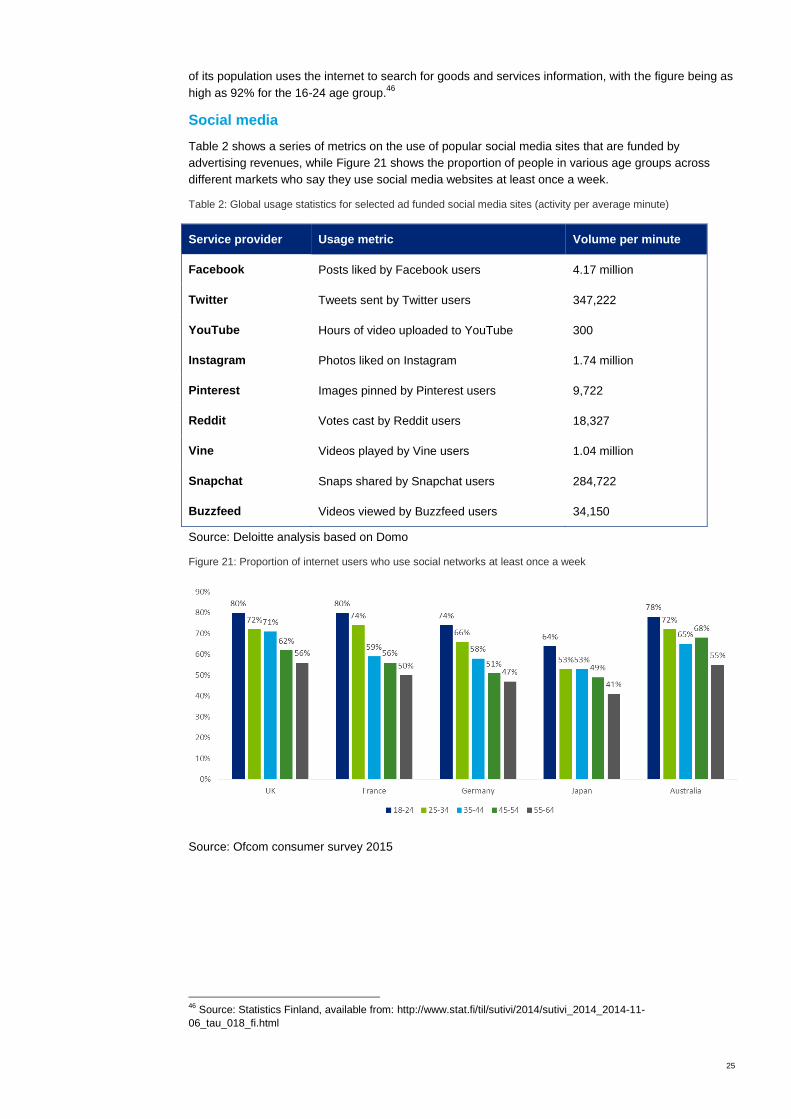
Social media
Table 2 shows a series of metrics on the use of popular social media sites that are funded by
advertising revenues, while Figure 21 shows the proportion of people in various age groups across
different markets who say they use social media websites at least once a week.
Table 2: Global usage statistics for selected ad funded social media sites (activity per average minute)
Service provider Usage metric Volume per minute
Facebook Posts liked by Facebook users 4.17 million
Twitter Tweets sent by Twitter users 347,222
YouTube Hours of video uploaded to YouTube 300
Instagram Photos liked on Instagram 1.74 million
Pinterest Images pinned by Pinterest users 9,722
Reddit Votes cast by Reddit users 18,327
Vine Videos played by Vine users 1.04 million
Snapchat Snaps shared by Snapchat users 284,722
Buzzfeed Videos viewed by Buzzfeed users 34,150
Source: Deloitte analysis based on Domo
Figure 21: Proportion of internet users who use social networks at least once a week
Source: Ofcom consumer survey 2015
46
Source: Statistics Finland, available from: http://www.stat.fi/til/sutivi/2014/sutivi_2014_2014-11-
06_tau_018_fi.html
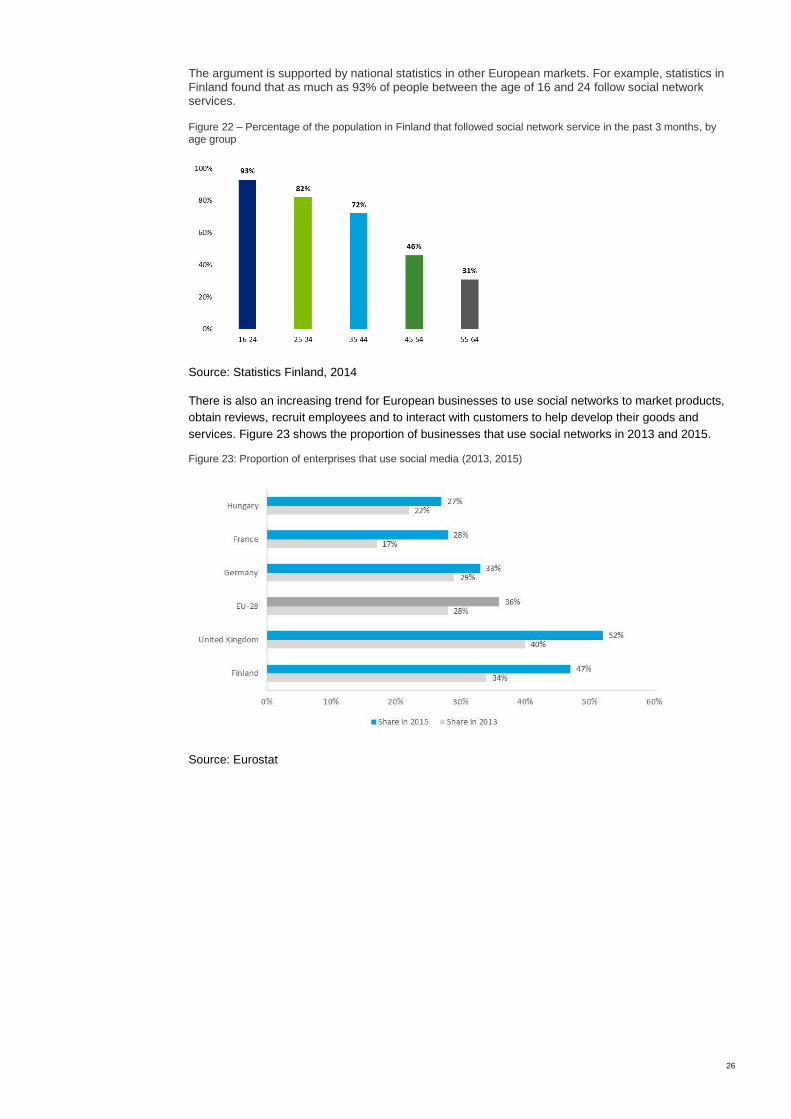
26
The argument is supported by national statistics in other European markets. For example, statistics in Finland found that as much as 93% of people between the age of 16 and 24 follow social network services.
Figure 22 – Percentage of the population in Finland that followed social network service in the past 3 months, by age group
Source: Statistics Finland, 2014
There is also an increasing trend for European businesses to use social networks to market products,
obtain reviews, recruit employees and to interact with customers to help develop their goods and
services. Figure 23 shows the proportion of businesses that use social networks in 2013 and 2015.
Figure 23: Proportion of enterprises that use social media (2013, 2015)
Source: Eurostat

27
This report presents evidence on the economic contribution of advertising in Europe and a selection of
non-EU developed markets. This is estimated to include:
A contribution to GDP worth EUR 643 billion in the EU (from an annual ad spend of EUR 92
billion).
A contribution to employment of approximately 5.8 million jobs across the EU.
Several further economic contributions, for example in the form of enabling media services.
Evidence on the overall impact on competition is mixed.
The report also highlights a number of ways in which the impact may vary across different markets.
These include differences in channel mixes and differences in market features (such as product focus
and demographics). However, fully investigating the extent to which these differences impact the
economic effectiveness of advertising requires a fuller analysis, which is beyond the scope of the
current study.
5 Conclusions
28
Aiginger, K., & Falk, M. (2005). Explaining differences in economic growth among OECD countries.
Arellano, M., & Bover, O. (1995). Another look at the instrumental variable estimation of error-
components models. Journal of econometrics, 68(1), 29-51. Bagwell, K. (2007). The economic analysis of advertising. Handbook of industrial organization, 3, 1701-
1844.
Blundell, R., & Bond, S. (1998). Initial conditions and moment restrictions in dynamic panel data
models. Journal of econometrics, 87(1), 115-143.
Erdem, T., Keane, M. P., & Sun, B. (2008). The impact of advertising on consumer price sensitivity in experience goods markets. Quantitative Marketing and Economics, 6(2), 139-176.
Marattin, Luigi. "The Impact Of Advertising On Aggregate Consumption: The Case Of Italy." Journal of
Applied Economic Sciences 3.3 (5) _Fall2008 (2008): 223-231.
Michael, P. (2001). Strategy and the Internet. Harvard Business Review, 79(3), 63-78.
Orr, D. (1974). The determinants of entry: A study of the Canadian manufacturing industries. The Review of Economics and Statistics, 58-66.
Plümper, T., & Troeger, V. E. (2007). Efficient estimation of time-invariant and rarely changing
variables in finite sample panel analyses with unit fixed effects. Political Analysis, 15(2), 124-139
6 References
29
Summary
The effects of advertising on gross domestic product (GDP) are estimated using an augmented model
of economic growth. Additional variables are included in the process to account for variations in
economic activity that are not explained by advertising. The model is estimated using annual data for
35 countries over the period 1998 – 2014 and the effects of advertising are allowed to differ across
countries. The results show advertising to be a significant driver of GDP, and on average report that a
1% rise in advertising leads to a 0.4% increase in GDP in the same period. At the market level these
econometric outputs are used to estimate the impact of advertising on GDP in a given country.
Econometric model
From the literature on economic growth, an augmented Autoregressive Distributed Lag (ARDL) model
is specified as follows:
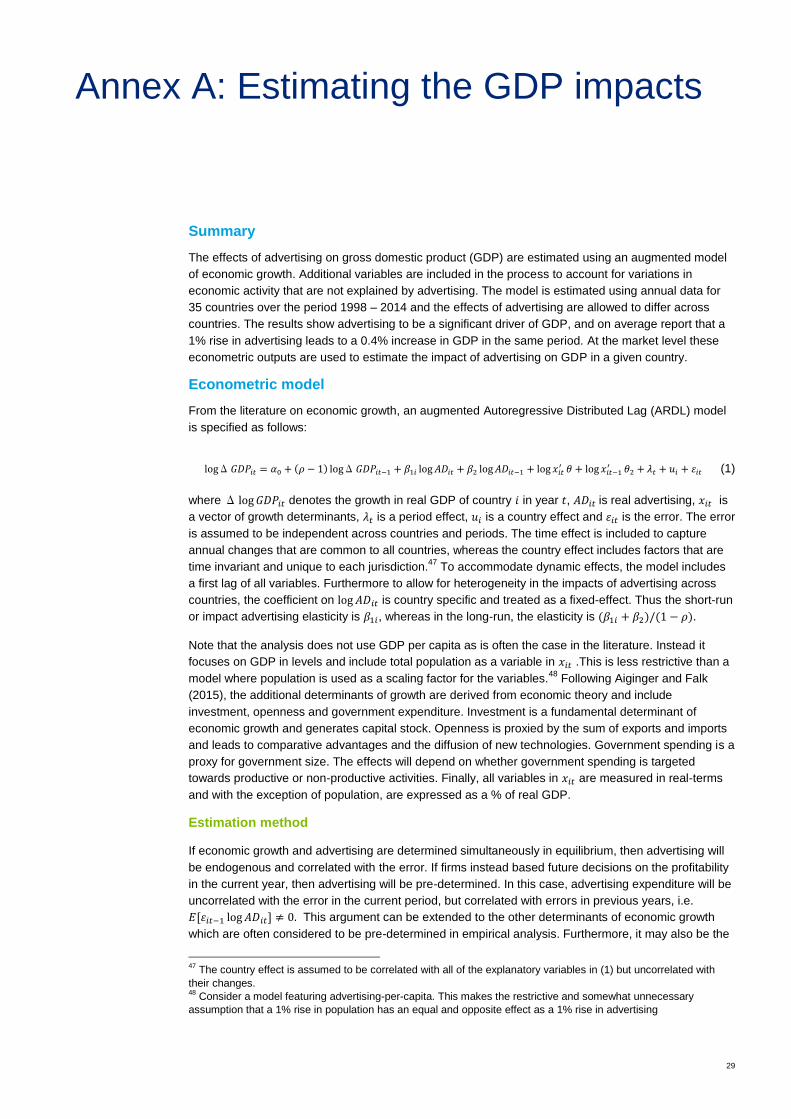
logΔ𝐺𝐷𝑃𝑖𝑡 = 𝛼0 + (𝜌 − 1) logΔ𝐺𝐷𝑃𝑖𝑡−1 + 𝛽1𝑖 log 𝐴𝐷𝑖𝑡 + 𝛽2 log 𝐴𝐷𝑖𝑡−1 + log 𝑥𝑖𝑡
′ 𝜃 + log 𝑥𝑖𝑡−1′ 𝜃2 + 𝜆𝑡 + 𝑢𝑖 + 𝜀𝑖𝑡 (1)
where Δ log 𝐺𝐷𝑃𝑖𝑡 denotes the growth in real GDP of country 𝑖 in year 𝑡, 𝐴𝐷𝑖𝑡 is real advertising, 𝑥𝑖𝑡 is
a vector of growth determinants, 𝜆𝑡 is a period effect, 𝑢𝑖 is a country effect and 𝜀𝑖𝑡 is the error. The error
is assumed to be independent across countries and periods. The time effect is included to capture
annual changes that are common to all countries, whereas the country effect includes factors that are
time invariant and unique to each jurisdiction.47
To accommodate dynamic effects, the model includes
a first lag of all variables. Furthermore to allow for heterogeneity in the impacts of advertising across
countries, the coefficient on log 𝐴𝐷𝑖𝑡 is country specific and treated as a fixed-effect. Thus the short-run
or impact advertising elasticity is 𝛽1𝑖, whereas in the long-run, the elasticity is (𝛽1𝑖 + 𝛽2)/(1 − 𝜌).
Note that the analysis does not use GDP per capita as is often the case in the literature. Instead it
focuses on GDP in levels and include total population as a variable in 𝑥𝑖𝑡 .This is less restrictive than a
model where population is used as a scaling factor for the variables.48
Following Aiginger and Falk
(2015), the additional determinants of growth are derived from economic theory and include
investment, openness and government expenditure. Investment is a fundamental determinant of
economic growth and generates capital stock. Openness is proxied by the sum of exports and imports
and leads to comparative advantages and the diffusion of new technologies. Government spending is a
proxy for government size. The effects will depend on whether government spending is targeted
towards productive or non-productive activities. Finally, all variables in 𝑥𝑖𝑡 are measured in real-terms
and with the exception of population, are expressed as a % of real GDP.
Estimation method
If economic growth and advertising are determined simultaneously in equilibrium, then advertising will
be endogenous and correlated with the error. If firms instead based future decisions on the profitability
in the current year, then advertising will be pre-determined. In this case, advertising expenditure will be
uncorrelated with the error in the current period, but correlated with errors in previous years, i.e.
𝐸[𝜀𝑖𝑡−1 log 𝐴𝐷𝑖𝑡] ≠ 0. This argument can be extended to the other determinants of economic growth
which are often considered to be pre-determined in empirical analysis. Furthermore, it may also be the
47
The country effect is assumed to be correlated with all of the explanatory variables in (1) but uncorrelated with
their changes. 48
Consider a model featuring advertising-per-capita. This makes the restrictive and somewhat unnecessary
assumption that a 1% rise in population has an equal and opposite effect as a 1% rise in advertising
Annex A: Estimating the GDP impacts
30
case that some of the variables in (1) are correlated with the country specific effect. For example,
jurisdictions facing higher levels of regulation may also experience higher levels of government
spending. Whilst the fixed effects estimator can accommodate such correlation, it will be inconsistent if
the variables are endogenous and biased if the variables are pre-determined.49
This situation is
compounded by the inclusion of the lagged dependent variable, which will be correlated with the
county-specific effect by construction.
To overcome these issues, Deloitte apply the system Generalized method of moments (GMM)
technique developed by Arellano and Bover (1995) and Blundell and Bond (1998). This method
considers the model (1) in both levels and first differences, and forms identifying moment conditions
using lags of the included variables as instruments. The estimator is appropriate for situations where
the number of time-periods is small relative to the number of panels, the dependent variable is highly
persistent50
and when the explanatory variables are either endogenous, predetermined and/or
correlated with the country-specific effect.
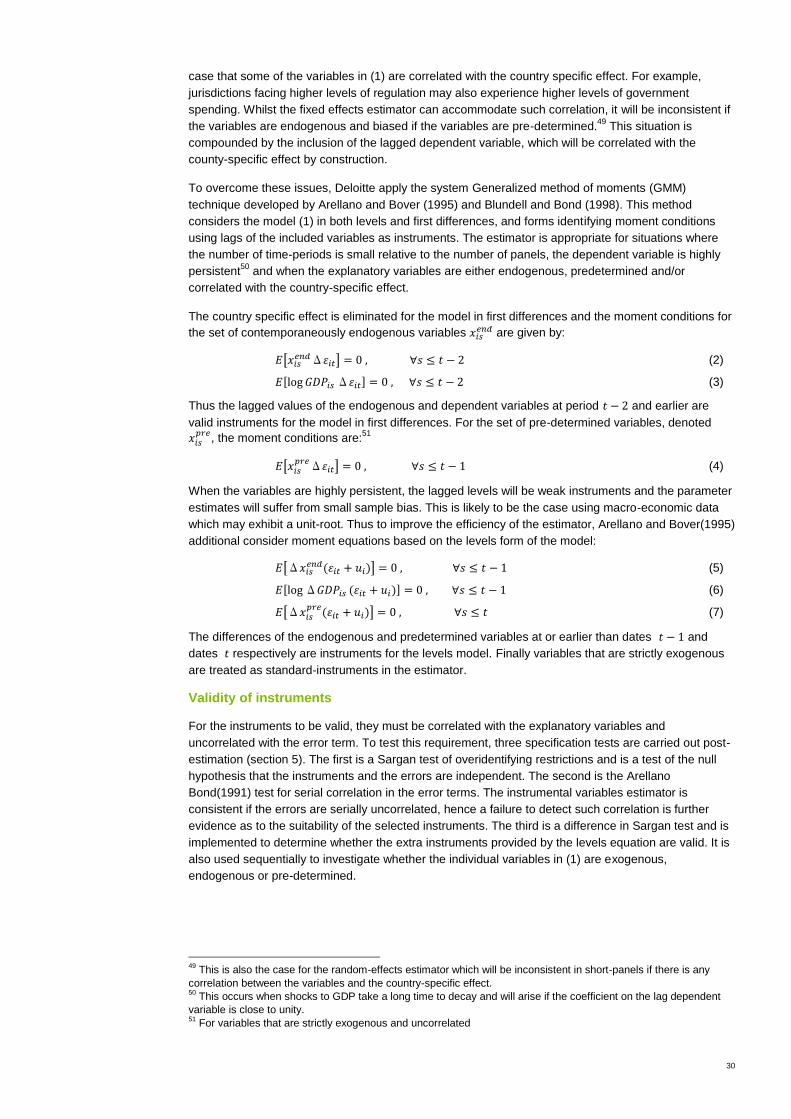
The country specific effect is eliminated for the model in first differences and the moment conditions for
the set of contemporaneously endogenous variables 𝑥𝑖𝑠𝑒𝑛𝑑 are given by:
𝐸[𝑥𝑖𝑠𝑒𝑛𝑑Δ𝜀𝑖𝑡] = 0 , ∀𝑠 ≤ 𝑡 − 2 (2)
𝐸[log 𝐺𝐷𝑃𝑖𝑠Δ𝜀𝑖𝑡] = 0 , ∀𝑠 ≤ 𝑡 − 2 (3)
Thus the lagged values of the endogenous and dependent variables at period 𝑡 − 2 and earlier are
valid instruments for the model in first differences. For the set of pre-determined variables, denoted
𝑥𝑖𝑠𝑝𝑟𝑒
, the moment conditions are:51
𝐸[𝑥𝑖𝑠𝑝𝑟𝑒Δ𝜀𝑖𝑡] = 0 , ∀𝑠 ≤ 𝑡 − 1 (4)
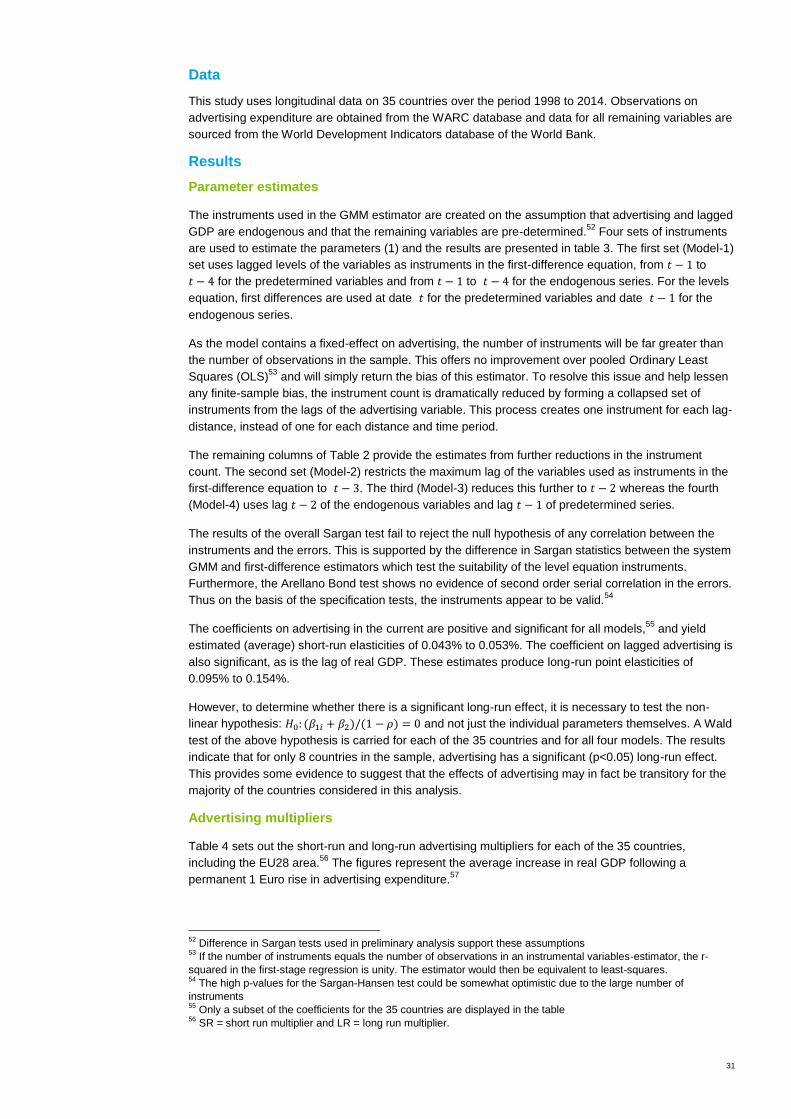
When the variables are highly persistent, the lagged levels will be weak instruments and the parameter
estimates will suffer from small sample bias. This is likely to be the case using macro-economic data
which may exhibit a unit-root. Thus to improve the efficiency of the estimator, Arellano and Bover(1995)
additional consider moment equations based on the levels form of the model:
𝐸[Δ𝑥𝑖𝑠𝑒𝑛𝑑(𝜀𝑖𝑡 + 𝑢𝑖)] = 0 , ∀𝑠 ≤ 𝑡 − 1 (5)
𝐸[logΔ𝐺𝐷𝑃𝑖𝑠 (𝜀𝑖𝑡 + 𝑢𝑖)] = 0 , ∀𝑠 ≤ 𝑡 − 1 (6)
𝐸[Δ𝑥𝑖𝑠𝑝𝑟𝑒
(𝜀𝑖𝑡 + 𝑢𝑖)] = 0 , ∀𝑠 ≤ 𝑡 (7)
The differences of the endogenous and predetermined variables at or earlier than dates 𝑡 − 1 and
dates 𝑡 respectively are instruments for the levels model. Finally variables that are strictly exogenous
are treated as standard-instruments in the estimator.
Validity of instruments
For the instruments to be valid, they must be correlated with the explanatory variables and
uncorrelated with the error term. To test this requirement, three specification tests are carried out post-
estimation (section 5). The first is a Sargan test of overidentifying restrictions and is a test of the null
hypothesis that the instruments and the errors are independent. The second is the Arellano
Bond(1991) test for serial correlation in the error terms. The instrumental variables estimator is
consistent if the errors are serially uncorrelated, hence a failure to detect such correlation is further
evidence as to the suitability of the selected instruments. The third is a difference in Sargan test and is
implemented to determine whether the extra instruments provided by the levels equation are valid. It is
also used sequentially to investigate whether the individual variables in (1) are exogenous,
endogenous or pre-determined.
49
This is also the case for the random-effects estimator which will be inconsistent in short-panels if there is any
correlation between the variables and the country-specific effect. 50
This occurs when shocks to GDP take a long time to decay and will arise if the coefficient on the lag dependent
variable is close to unity. 51
For variables that are strictly exogenous and uncorrelated
31
Data
This study uses longitudinal data on 35 countries over the period 1998 to 2014. Observations on
advertising expenditure are obtained from the WARC database and data for all remaining variables are
sourced from the World Development Indicators database of the World Bank.
Results
Parameter estimates
The instruments used in the GMM estimator are created on the assumption that advertising and lagged
GDP are endogenous and that the remaining variables are pre-determined.52
Four sets of instruments
are used to estimate the parameters (1) and the results are presented in table 3. The first set (Model-1)
set uses lagged levels of the variables as instruments in the first-difference equation, from 𝑡 − 1 to
𝑡 − 4 for the predetermined variables and from 𝑡 − 1 to 𝑡 − 4 for the endogenous series. For the levels
equation, first differences are used at date 𝑡 for the predetermined variables and date 𝑡 − 1 for the
endogenous series.
As the model contains a fixed-effect on advertising, the number of instruments will be far greater than
the number of observations in the sample. This offers no improvement over pooled Ordinary Least
Squares (OLS)53
and will simply return the bias of this estimator. To resolve this issue and help lessen
any finite-sample bias, the instrument count is dramatically reduced by forming a collapsed set of
instruments from the lags of the advertising variable. This process creates one instrument for each lag-
distance, instead of one for each distance and time period.
The remaining columns of Table 2 provide the estimates from further reductions in the instrument
count. The second set (Model-2) restricts the maximum lag of the variables used as instruments in the
first-difference equation to 𝑡 − 3. The third (Model-3) reduces this further to 𝑡 − 2 whereas the fourth
(Model-4) uses lag 𝑡 − 2 of the endogenous variables and lag 𝑡 − 1 of predetermined series.
The results of the overall Sargan test fail to reject the null hypothesis of any correlation between the
instruments and the errors. This is supported by the difference in Sargan statistics between the system
GMM and first-difference estimators which test the suitability of the level equation instruments.
Furthermore, the Arellano Bond test shows no evidence of second order serial correlation in the errors.
Thus on the basis of the specification tests, the instruments appear to be valid.54
The coefficients on advertising in the current are positive and significant for all models,55
and yield
estimated (average) short-run elasticities of 0.043% to 0.053%. The coefficient on lagged advertising is
also significant, as is the lag of real GDP. These estimates produce long-run point elasticities of
0.095% to 0.154%.
However, to determine whether there is a significant long-run effect, it is necessary to test the non-
linear hypothesis: 𝐻0: (𝛽1𝑖 + 𝛽2)/(1 − 𝜌) = 0 and not just the individual parameters themselves. A Wald
test of the above hypothesis is carried for each of the 35 countries and for all four models. The results
indicate that for only 8 countries in the sample, advertising has a significant (p<0.05) long-run effect.
This provides some evidence to suggest that the effects of advertising may in fact be transitory for the
majority of the countries considered in this analysis.
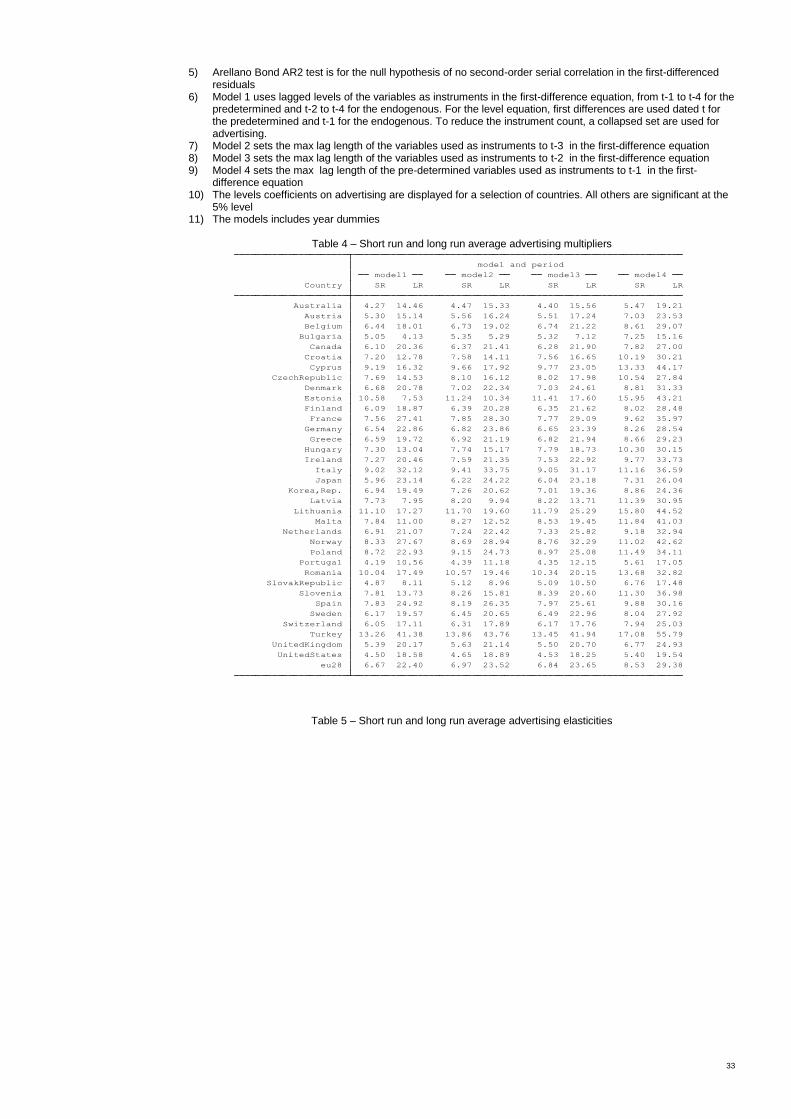
Advertising multipliers
Table 4 sets out the short-run and long-run advertising multipliers for each of the 35 countries,
including the EU28 area.56
The figures represent the average increase in real GDP following a
permanent 1 Euro rise in advertising expenditure.57
52
Difference in Sargan tests used in preliminary analysis support these assumptions 53
If the number of instruments equals the number of observations in an instrumental variables-estimator, the r-
squared in the first-stage regression is unity. The estimator would then be equivalent to least-squares. 54
The high p-values for the Sargan-Hansen test could be somewhat optimistic due to the large number of
instruments 55
Only a subset of the coefficients for the 35 countries are displayed in the table 56
SR = short run multiplier and LR = long run multiplier.
32
Advertising elasticities
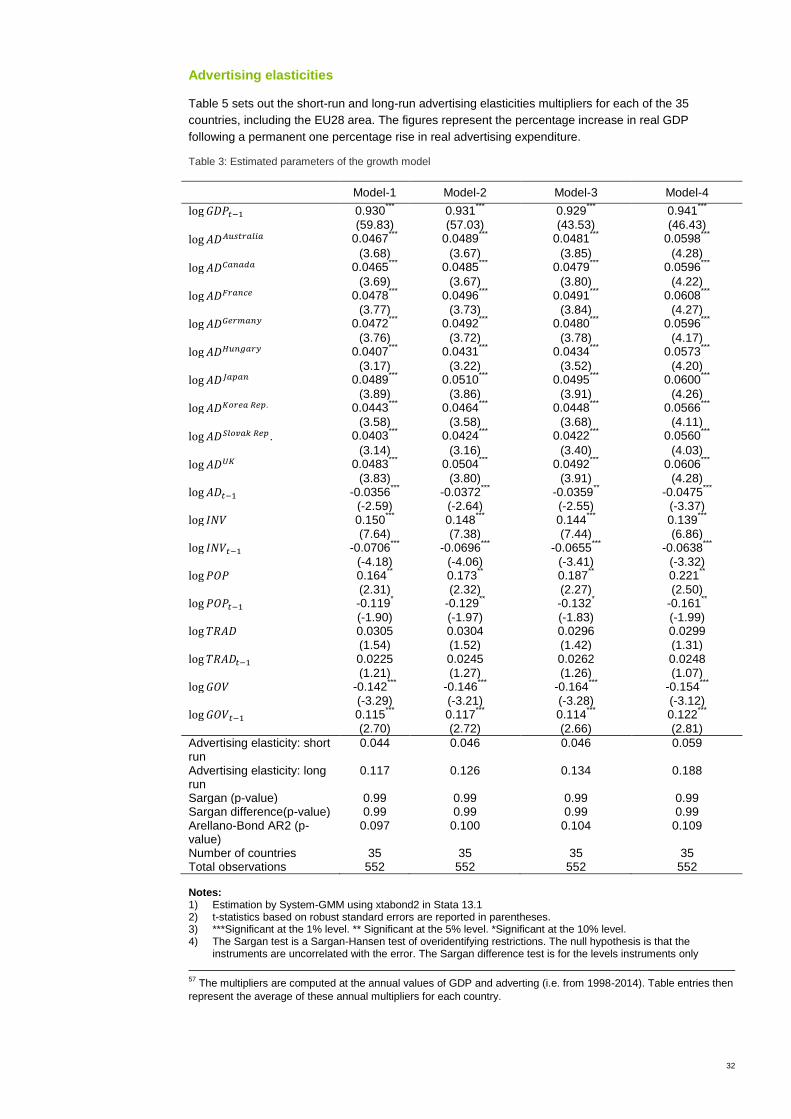
Table 5 sets out the short-run and long-run advertising elasticities multipliers for each of the 35
countries, including the EU28 area. The figures represent the percentage increase in real GDP
following a permanent one percentage rise in real advertising expenditure.
Table 3: Estimated parameters of the growth model
Model-1 Model-2 Model-3 Model-4
log 𝐺𝐷𝑃𝑡−1 0.930***
0.931***
0.929***
0.941***
(59.83) (57.03) (43.53) (46.43)
log 𝐴𝐷𝐴𝑢𝑠𝑡𝑟𝑎𝑙𝑖𝑎 0.0467***
0.0489***
0.0481***
0.0598***
(3.68) (3.67) (3.85) (4.28)
log 𝐴𝐷𝐶𝑎𝑛𝑎𝑑𝑎 0.0465***
0.0485***
0.0479***
0.0596***
(3.69) (3.67) (3.80) (4.22)
log 𝐴𝐷𝐹𝑟𝑎𝑛𝑐𝑒 0.0478***
0.0496***
0.0491***
0.0608***
(3.77) (3.73) (3.84) (4.27)
log 𝐴𝐷𝐺𝑒𝑟𝑚𝑎𝑛𝑦 0.0472***
0.0492***
0.0480***
0.0596***
(3.76) (3.72) (3.78) (4.17)
log 𝐴𝐷𝐻𝑢𝑛𝑔𝑎𝑟𝑦 0.0407***
0.0431***
0.0434***
0.0573***
(3.17) (3.22) (3.52) (4.20)
log 𝐴𝐷𝐽𝑎𝑝𝑎𝑛 0.0489***
0.0510***
0.0495***
0.0600***
(3.89) (3.86) (3.91) (4.26)
log 𝐴𝐷𝐾𝑜𝑟𝑒𝑎 𝑅𝑒𝑝. 0.0443***
0.0464***
0.0448***
0.0566***
(3.58) (3.58) (3.68) (4.11)
log 𝐴𝐷𝑆𝑙𝑜𝑣𝑎𝑘 𝑅𝑒𝑝. 0.0403***
0.0424***
0.0422***
0.0560***
(3.14) (3.16) (3.40) (4.03)
log 𝐴𝐷𝑈𝐾 0.0483***
0.0504***
0.0492***
0.0606***
(3.83) (3.80) (3.91) (4.28) log 𝐴𝐷𝑡−1 -0.0356
*** -0.0372
*** -0.0359
** -0.0475
***
(-2.59) (-2.64) (-2.55) (-3.37) log 𝐼𝑁𝑉 0.150
*** 0.148
*** 0.144
*** 0.139
***
(7.64) (7.38) (7.44) (6.86) log 𝐼𝑁𝑉𝑡−1 -0.0706
*** -0.0696
*** -0.0655
*** -0.0638
***
(-4.18) (-4.06) (-3.41) (-3.32) log 𝑃𝑂𝑃 0.164
** 0.173
** 0.187
** 0.221
**
(2.31) (2.32) (2.27) (2.50) log 𝑃𝑂𝑃𝑡−1 -0.119
* -0.129
** -0.132
* -0.161
**
(-1.90) (-1.97) (-1.83) (-1.99) log 𝑇𝑅𝐴𝐷 0.0305 0.0304 0.0296 0.0299
(1.54) (1.52) (1.42) (1.31) log 𝑇𝑅𝐴𝐷𝑡−1 0.0225 0.0245 0.0262 0.0248
(1.21) (1.27) (1.26) (1.07) log 𝐺𝑂𝑉 -0.142
*** -0.146
*** -0.164
*** -0.154
***
(-3.29) (-3.21) (-3.28) (-3.12) log 𝐺𝑂𝑉𝑡−1 0.115
*** 0.117
*** 0.114
*** 0.122
***
(2.70) (2.72) (2.66) (2.81)
Advertising elasticity: short run
0.044 0.046 0.046 0.059
Advertising elasticity: long run
0.117 0.126 0.134 0.188
Sargan (p-value) 0.99 0.99 0.99 0.99 Sargan difference(p-value) 0.99 0.99 0.99 0.99 Arellano-Bond AR2 (p-value)
0.097 0.100 0.104 0.109
Number of countries 35 35 35 35 Total observations 552 552 552 552 Notes: 1) Estimation by System-GMM using xtabond2 in Stata 13.1 2) t-statistics based on robust standard errors are reported in parentheses. 3) ***Significant at the 1% level. ** Significant at the 5% level. *Significant at the 10% level. 4) The Sargan test is a Sargan-Hansen test of overidentifying restrictions. The null hypothesis is that the
instruments are uncorrelated with the error. The Sargan difference test is for the levels instruments only
57
The multipliers are computed at the annual values of GDP and adverting (i.e. from 1998-2014). Table entries then
represent the average of these annual multipliers for each country.
33
5) Arellano Bond AR2 test is for the null hypothesis of no second-order serial correlation in the first-differenced residuals
6) Model 1 uses lagged levels of the variables as instruments in the first-difference equation, from t-1 to t-4 for the predetermined and t-2 to t-4 for the endogenous. For the level equation, first differences are used dated t for the predetermined and t-1 for the endogenous. To reduce the instrument count, a collapsed set are used for advertising.
7) Model 2 sets the max lag length of the variables used as instruments to t-3 in the first-difference equation 8) Model 3 sets the max lag length of the variables used as instruments to t-2 in the first-difference equation 9) Model 4 sets the max lag length of the pre-determined variables used as instruments to t-1 in the first-
difference equation 10) The levels coefficients on advertising are displayed for a selection of countries. All others are significant at the
5% level 11) The models includes year dummies
Table 4 – Short run and long run average advertising multipliers
Table 5 – Short run and long run average advertising elasticities
eu28 6.67 22.40 6.97 23.52 6.84 23.65 8.53 29.38
UnitedStates 4.50 18.58 4.65 18.89 4.53 18.25 5.40 19.54
UnitedKingdom 5.39 20.17 5.63 21.14 5.50 20.70 6.77 24.93
Turkey 13.26 41.38 13.86 43.76 13.45 41.94 17.08 55.79
Switzerland 6.05 17.11 6.31 17.89 6.17 17.76 7.94 25.03
Sweden 6.17 19.57 6.45 20.65 6.49 22.96 8.04 27.92
Spain 7.83 24.92 8.19 26.35 7.97 25.61 9.88 30.16
Slovenia 7.81 13.73 8.26 15.81 8.39 20.60 11.30 36.98
SlovakRepublic 4.87 8.11 5.12 8.96 5.09 10.50 6.76 17.48
Romania 10.04 17.49 10.57 19.46 10.34 20.15 13.68 32.82
Portugal 4.19 10.56 4.39 11.18 4.35 12.15 5.61 17.05
Poland 8.72 22.93 9.15 24.73 8.97 25.08 11.49 34.11
Norway 8.33 27.67 8.69 28.94 8.76 32.29 11.02 42.62
Netherlands 6.91 21.07 7.24 22.42 7.33 25.82 9.18 32.94
Malta 7.84 11.00 8.27 12.52 8.53 19.45 11.84 41.03
Lithuania 11.10 17.27 11.70 19.60 11.79 25.29 15.80 44.52
Latvia 7.73 7.95 8.20 9.94 8.22 13.71 11.39 30.95
Korea,Rep. 6.94 19.49 7.26 20.62 7.01 19.36 8.86 24.36
Japan 5.96 23.14 6.22 24.22 6.04 23.18 7.31 26.04
Italy 9.02 32.12 9.41 33.75 9.05 31.17 11.16 36.59
Ireland 7.27 20.46 7.59 21.35 7.53 22.92 9.77 33.73
Hungary 7.30 13.04 7.74 15.17 7.79 18.73 10.30 30.15
Greece 6.59 19.72 6.92 21.19 6.82 21.94 8.66 29.23
Germany 6.54 22.86 6.82 23.86 6.65 23.39 8.26 28.54
France 7.56 27.41 7.85 28.30 7.77 29.09 9.62 35.97
Finland 6.09 18.87 6.39 20.28 6.35 21.62 8.02 28.48
Estonia 10.58 7.53 11.24 10.34 11.41 17.60 15.95 43.21
Denmark 6.68 20.78 7.02 22.34 7.03 24.61 8.81 31.33
CzechRepublic 7.69 14.53 8.10 16.12 8.02 17.98 10.54 27.84
Cyprus 9.19 16.32 9.66 17.92 9.77 23.05 13.33 44.17
Croatia 7.20 12.78 7.58 14.11 7.56 16.65 10.19 30.21
Canada 6.10 20.36 6.37 21.41 6.28 21.90 7.82 27.00
Bulgaria 5.05 4.13 5.35 5.29 5.32 7.12 7.25 15.16
Belgium 6.44 18.01 6.73 19.02 6.74 21.22 8.61 29.07
Austria 5.30 15.14 5.56 16.24 5.51 17.24 7.03 23.53
Australia 4.27 14.46 4.47 15.33 4.40 15.56 5.47 19.21
Country SR LR SR LR SR LR SR LR
model1 model2 model3 model4
model and period
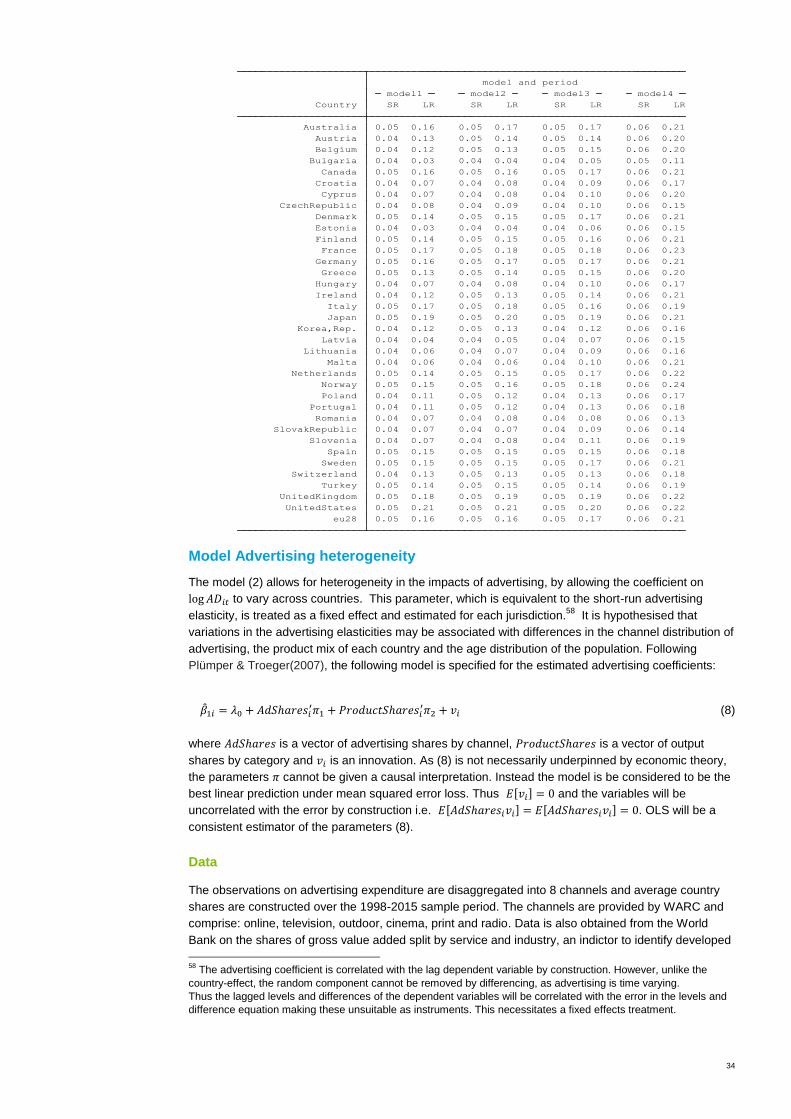
34
Model Advertising heterogeneity
The model (2) allows for heterogeneity in the impacts of advertising, by allowing the coefficient on
log 𝐴𝐷𝑖𝑡 to vary across countries. This parameter, which is equivalent to the short-run advertising
elasticity, is treated as a fixed effect and estimated for each jurisdiction.58
It is hypothesised that
variations in the advertising elasticities may be associated with differences in the channel distribution of
advertising, the product mix of each country and the age distribution of the population. Following
Plümper & Troeger(2007), the following model is specified for the estimated advertising coefficients:
�̂�1𝑖 = 𝜆0 + 𝐴𝑑𝑆ℎ𝑎𝑟𝑒𝑠𝑖′𝜋1 + 𝑃𝑟𝑜𝑑𝑢𝑐𝑡𝑆ℎ𝑎𝑟𝑒𝑠𝑖
′𝜋2 + 𝑣𝑖 (8)
where 𝐴𝑑𝑆ℎ𝑎𝑟𝑒𝑠 is a vector of advertising shares by channel, 𝑃𝑟𝑜𝑑𝑢𝑐𝑡𝑆ℎ𝑎𝑟𝑒𝑠 is a vector of output
shares by category and 𝑣𝑖 is an innovation. As (8) is not necessarily underpinned by economic theory,
the parameters 𝜋 cannot be given a causal interpretation. Instead the model is be considered to be the
best linear prediction under mean squared error loss. Thus 𝐸[𝑣𝑖] = 0 and the variables will be
uncorrelated with the error by construction i.e. 𝐸[𝐴𝑑𝑆ℎ𝑎𝑟𝑒𝑠𝑖𝑣𝑖] = 𝐸[𝐴𝑑𝑆ℎ𝑎𝑟𝑒𝑠𝑖𝑣𝑖] = 0. OLS will be a
consistent estimator of the parameters (8).
Data
The observations on advertising expenditure are disaggregated into 8 channels and average country
shares are constructed over the 1998-2015 sample period. The channels are provided by WARC and
comprise: online, television, outdoor, cinema, print and radio. Data is also obtained from the World
Bank on the shares of gross value added split by service and industry, an indictor to identify developed
58
The advertising coefficient is correlated with the lag dependent variable by construction. However, unlike the
country-effect, the random component cannot be removed by differencing, as advertising is time varying.
Thus the lagged levels and differences of the dependent variables will be correlated with the error in the levels and
difference equation making these unsuitable as instruments. This necessitates a fixed effects treatment.
eu28 0.05 0.16 0.05 0.16 0.05 0.17 0.06 0.21
UnitedStates 0.05 0.21 0.05 0.21 0.05 0.20 0.06 0.22
UnitedKingdom 0.05 0.18 0.05 0.19 0.05 0.19 0.06 0.22
Turkey 0.05 0.14 0.05 0.15 0.05 0.14 0.06 0.19
Switzerland 0.04 0.13 0.05 0.13 0.05 0.13 0.06 0.18
Sweden 0.05 0.15 0.05 0.15 0.05 0.17 0.06 0.21
Spain 0.05 0.15 0.05 0.15 0.05 0.15 0.06 0.18
Slovenia 0.04 0.07 0.04 0.08 0.04 0.11 0.06 0.19
SlovakRepublic 0.04 0.07 0.04 0.07 0.04 0.09 0.06 0.14
Romania 0.04 0.07 0.04 0.08 0.04 0.08 0.06 0.13
Portugal 0.04 0.11 0.05 0.12 0.04 0.13 0.06 0.18
Poland 0.04 0.11 0.05 0.12 0.04 0.13 0.06 0.17
Norway 0.05 0.15 0.05 0.16 0.05 0.18 0.06 0.24
Netherlands 0.05 0.14 0.05 0.15 0.05 0.17 0.06 0.22
Malta 0.04 0.06 0.04 0.06 0.04 0.10 0.06 0.21
Lithuania 0.04 0.06 0.04 0.07 0.04 0.09 0.06 0.16
Latvia 0.04 0.04 0.04 0.05 0.04 0.07 0.06 0.15
Korea,Rep. 0.04 0.12 0.05 0.13 0.04 0.12 0.06 0.16
Japan 0.05 0.19 0.05 0.20 0.05 0.19 0.06 0.21
Italy 0.05 0.17 0.05 0.18 0.05 0.16 0.06 0.19
Ireland 0.04 0.12 0.05 0.13 0.05 0.14 0.06 0.21
Hungary 0.04 0.07 0.04 0.08 0.04 0.10 0.06 0.17
Greece 0.05 0.13 0.05 0.14 0.05 0.15 0.06 0.20
Germany 0.05 0.16 0.05 0.17 0.05 0.17 0.06 0.21
France 0.05 0.17 0.05 0.18 0.05 0.18 0.06 0.23
Finland 0.05 0.14 0.05 0.15 0.05 0.16 0.06 0.21
Estonia 0.04 0.03 0.04 0.04 0.04 0.06 0.06 0.15
Denmark 0.05 0.14 0.05 0.15 0.05 0.17 0.06 0.21
CzechRepublic 0.04 0.08 0.04 0.09 0.04 0.10 0.06 0.15
Cyprus 0.04 0.07 0.04 0.08 0.04 0.10 0.06 0.20
Croatia 0.04 0.07 0.04 0.08 0.04 0.09 0.06 0.17
Canada 0.05 0.16 0.05 0.16 0.05 0.17 0.06 0.21
Bulgaria 0.04 0.03 0.04 0.04 0.04 0.05 0.05 0.11
Belgium 0.04 0.12 0.05 0.13 0.05 0.15 0.06 0.20
Austria 0.04 0.13 0.05 0.14 0.05 0.14 0.06 0.20
Australia 0.05 0.16 0.05 0.17 0.05 0.17 0.06 0.21
Country SR LR SR LR SR LR SR LR
model1 model2 model3 model4
model and period
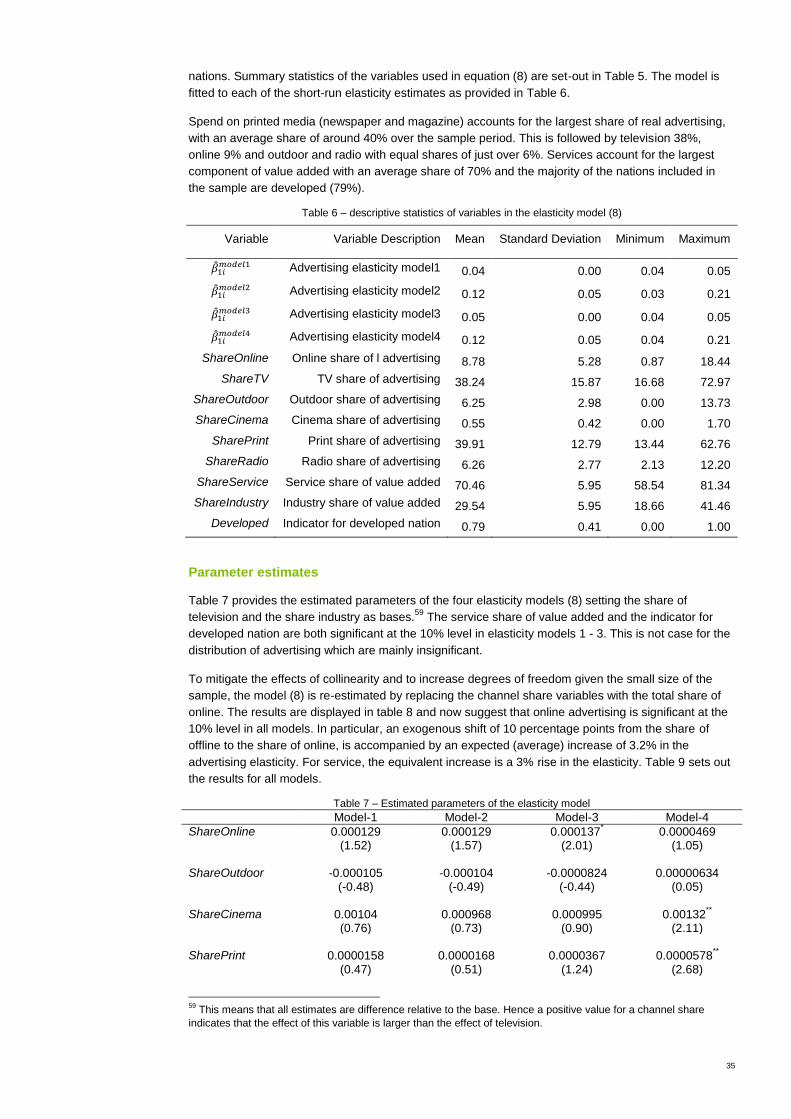
35
nations. Summary statistics of the variables used in equation (8) are set-out in Table 5. The model is
fitted to each of the short-run elasticity estimates as provided in Table 6.
Spend on printed media (newspaper and magazine) accounts for the largest share of real advertising,
with an average share of around 40% over the sample period. This is followed by television 38%,
online 9% and outdoor and radio with equal shares of just over 6%. Services account for the largest
component of value added with an average share of 70% and the majority of the nations included in
the sample are developed (79%).
Table 6 – descriptive statistics of variables in the elasticity model (8)
Variable Variable Description Mean Standard Deviation Minimum Maximum
�̂�1𝑖𝑚𝑜𝑑𝑒𝑙1 Advertising elasticity model1 0.04 0.00 0.04 0.05
�̂�1𝑖𝑚𝑜𝑑𝑒𝑙2 Advertising elasticity model2 0.12 0.05 0.03 0.21
�̂�1𝑖𝑚𝑜𝑑𝑒𝑙3 Advertising elasticity model3 0.05 0.00 0.04 0.05
�̂�1𝑖𝑚𝑜𝑑𝑒𝑙4 Advertising elasticity model4 0.12 0.05 0.04 0.21
ShareOnline Online share of l advertising 8.78 5.28 0.87 18.44
ShareTV TV share of advertising 38.24 15.87 16.68 72.97
ShareOutdoor Outdoor share of advertising 6.25 2.98 0.00 13.73
ShareCinema Cinema share of advertising 0.55 0.42 0.00 1.70
SharePrint Print share of advertising 39.91 12.79 13.44 62.76
ShareRadio Radio share of advertising 6.26 2.77 2.13 12.20
ShareService Service share of value added 70.46 5.95 58.54 81.34
ShareIndustry Industry share of value added 29.54 5.95 18.66 41.46
Developed Indicator for developed nation 0.79 0.41 0.00 1.00
Parameter estimates
Table 7 provides the estimated parameters of the four elasticity models (8) setting the share of
television and the share industry as bases.59
The service share of value added and the indicator for
developed nation are both significant at the 10% level in elasticity models 1 - 3. This is not case for the
distribution of advertising which are mainly insignificant.
To mitigate the effects of collinearity and to increase degrees of freedom given the small size of the
sample, the model (8) is re-estimated by replacing the channel share variables with the total share of
online. The results are displayed in table 8 and now suggest that online advertising is significant at the
10% level in all models. In particular, an exogenous shift of 10 percentage points from the share of
offline to the share of online, is accompanied by an expected (average) increase of 3.2% in the
advertising elasticity. For service, the equivalent increase is a 3% rise in the elasticity. Table 9 sets out
the results for all models.
Table 7 – Estimated parameters of the elasticity model
Model-1 Model-2 Model-3 Model-4
ShareOnline 0.000129 0.000129 0.000137* 0.0000469
(1.52) (1.57) (2.01) (1.05) ShareOutdoor -0.000105 -0.000104 -0.0000824 0.00000634 (-0.48) (-0.49) (-0.44) (0.05) ShareCinema 0.00104 0.000968 0.000995 0.00132
**
(0.76) (0.73) (0.90) (2.11) SharePrint 0.0000158 0.0000168 0.0000367 0.0000578
**
(0.47) (0.51) (1.24) (2.68)
59
This means that all estimates are difference relative to the base. Hence a positive value for a channel share
indicates that the effect of this variable is larger than the effect of television.

36
ShareRadio -0.000170 -0.000169 -0.000118 -0.0000394 (-0.76) (-0.80) (-0.65) (-0.38) ShareService 0.000192
*** 0.000188
*** 0.000165
*** 0.0000818
*
(2.96) (3.05) (2.85) (1.85) Developed 0.00394
*** 0.00386
*** 0.00294
*** 0.000785
(3.79) (3.88) (3.41) (1.27) Constant 0.0265
*** 0.0290
*** 0.0296
*** 0.0489
***
(5.52) (6.34) (6.90) (14.87)
N 34 34 34 34 R2 0.588 0.600 0.629 0.569 t statistics in parentheses * p < 0.10,
** p < 0.05,
*** p < 0.01
Table 8 – Estimated parameters of the elasticity model (online share as only channel)
(model1) (model2) (model3) (model4) Lag4 Lag3 Lag2 Lag1
ShareOnline 0.000172** 0.000172
** 0.000189
*** 0.0000986
*
(2.50) (2.59) (3.26) (1.98) ShareService 0.000192
*** 0.000187
*** 0.000165
** 0.0000869
(3.08) (3.17) (2.67) (1.43) Developed 0.00400
*** 0.00392
*** 0.00312
*** 0.00120
(4.02) (4.09) (3.49) (1.48) Constant 0.0256
*** 0.0281
*** 0.0297
*** 0.0506
***
(5.76) (6.66) (6.55) (10.87)
N 34 34 34 34 R2 0.547 0.558 0.576 0.339 t statistics in parentheses * p < 0.10,
** p < 0.05,
*** p < 0.01
Table 9 - % Change in elasticity for an exogenous 10-point increase in the shares
ShareOnline ShareService
Model-1 3.92 4.37
Model-2 3.75 4.06
Model-3 4.15 3.63
Model-4 1.68 1.48
Average 3.19 3.01
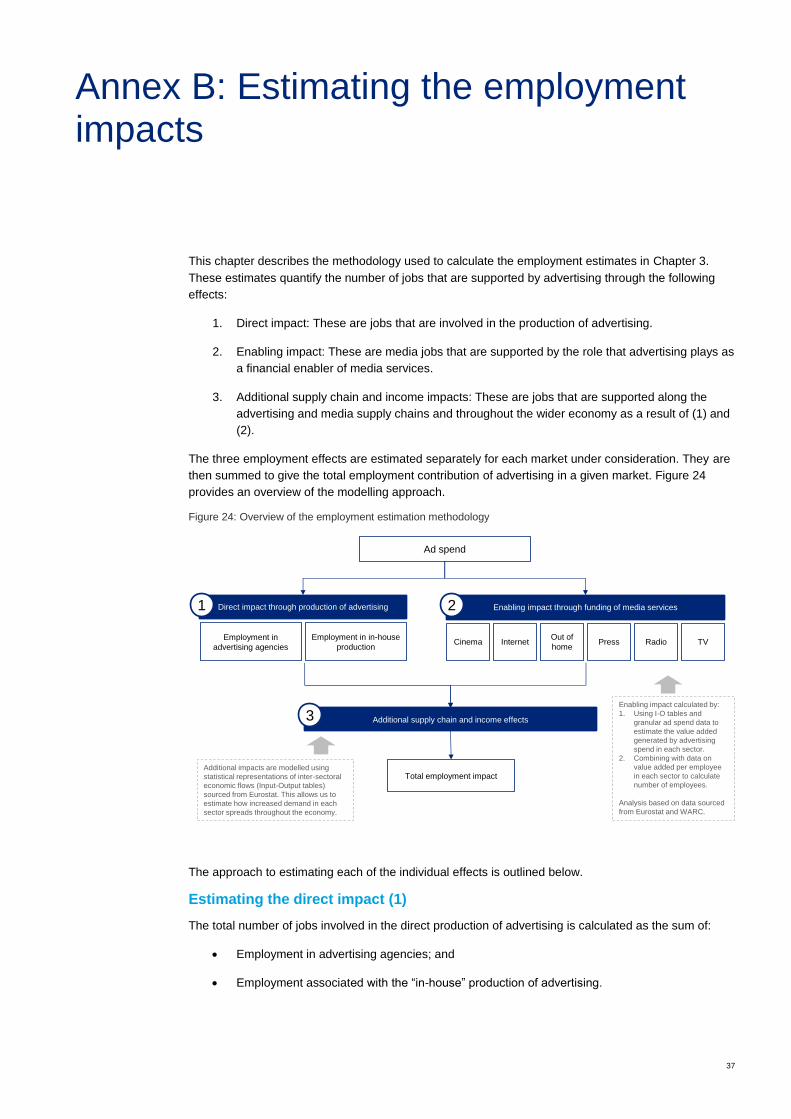
37
This chapter describes the methodology used to calculate the employment estimates in Chapter 3.
These estimates quantify the number of jobs that are supported by advertising through the following
effects:
1. Direct impact: These are jobs that are involved in the production of advertising.
2. Enabling impact: These are media jobs that are supported by the role that advertising plays as
a financial enabler of media services.
3. Additional supply chain and income impacts: These are jobs that are supported along the
advertising and media supply chains and throughout the wider economy as a result of (1) and
(2).
The three employment effects are estimated separately for each market under consideration. They are
then summed to give the total employment contribution of advertising in a given market. Figure 24
provides an overview of the modelling approach.
Figure 24: Overview of the employment estimation methodology
The approach to estimating each of the individual effects is outlined below.
Estimating the direct impact (1)
The total number of jobs involved in the direct production of advertising is calculated as the sum of:
Employment in advertising agencies; and
Employment associated with the “in-house” production of advertising.
Ad spend
Additional supply chain and income effects
Total employment impact
Direct impact through production of advertising
Employment in
advertising agencies
Employment in in-house
production
Enabling impact through funding of media services
Cinema InternetOut of
homePress Radio TV
Enabling impact calculated by:
1. Using I-O tables and
granular ad spend data to
estimate the value added
generated by advertising
spend in each sector.
2. Combining with data on
value added per employee
in each sector to calculate
number of employees.
Analysis based on data sourced
from Eurostat and WARC.
Additional impacts are modelled using
statistical representations of inter-sectoral
economic flows (Input-Output tables)
sourced from Eurostat. This allows us to
estimate how increased demand in each
sector spreads throughout the economy.
1 2
3
Annex B: Estimating the employment impacts

38
Eurostat produces data on the number of jobs in advertising agencies across each of the selected
markets. However Eurostat does not report data for employment of in-house production. In addition the
availability of relevant data at the market level is mixed.
Assumptions can be used to derive consistent estimates of the number of jobs associated with in-
house advertising. However, making such assumptions at a market level is challenging given data
availability. In addition, as the estimates of direct impact feeds into the estimates of the supply chain
and income effects, the overall results are sensitive to these assumptions. Therefore, the results
presented here do not include the in-house advertising element of direct employment and, in this
respect, they represent conservative estimates of the value of direct employment impacts.
Estimating the enabling impact (2)
Advertising supports jobs in the media sectors by providing an important source of income for firms in
those sectors. The number of jobs supported in this way is quantified through the following steps:
1. The average value added to turnover ratio in each media sector and each market is calculated
using data from market specific Input-Output tables sourced from Eurostat.
2. These estimates are combined with ad spend data for the relevant channel in the relevant market
to calculate the value added supported by advertising in each media segment.
3. These figures are then combined with data from Eurostat on the average value added per
employee to derive the number of jobs supported by advertising.
These steps are summarised below.
Figure 25: Summary of approach to calculating enabling impact on employment
Source: Deloitte analysis
The method outlined above is used to estimate all enabled impacts except for the Radio and Television
segments in Slovakia. In these segments Eurostat reports negative value added per employee ratios,
so applying the method above would not be appropriate. For these segments the methodology is
based on a revenue approach in which average revenue per employee is combined with the channel
expenditure.
Estimating the supply chain and income effects (3)
The employment impacts that are estimated in effects (1) and (2) occur as a result of economic activity
that exists directly because of advertising (either the production of advertising content or activity which
occurs because of the funding role that advertising plays in the media). However the overall impact on
employment is likely to be greater than this because of two additional effects:
Indirect impact: As advertising and media businesses increase their activity, they will need to
increase their purchases of inputs. This will translate to more demand for the goods and
services produced by each player in the advertising and media value chains and hence
increase their employment requirement. Furthermore, to meet the higher demand, each player
in the supply chain will have to increase their purchases of intermediate goods and services,
which in turn will result in higher revenues for their suppliers. This chain of demand
expansions continues throughout the economy and at each stage firms have additional
Value added per person
employed in media sector
(Eurostat data)
Advertising revenue in
media sector
(WARC)
Value added : Output ratio
in media sector
(Eurostat Input-Output
tables)
Total number of jobs in
media sector supported by
advertising
1 2
3
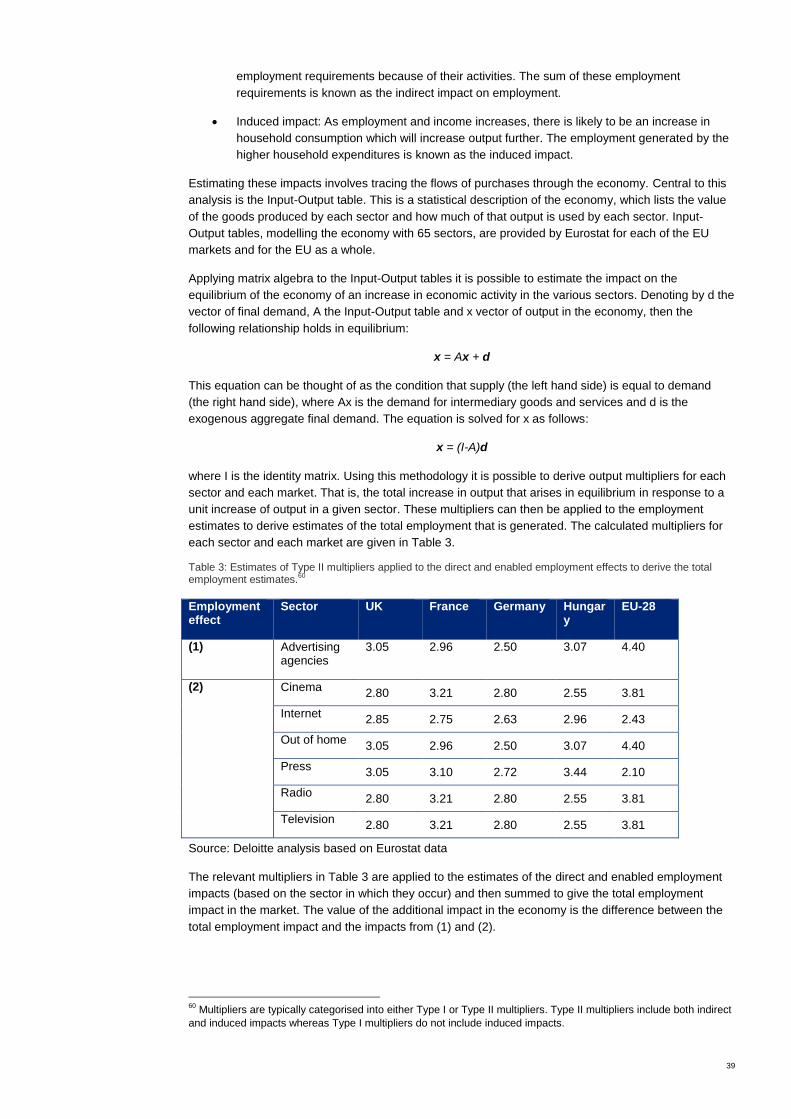
39
employment requirements because of their activities. The sum of these employment
requirements is known as the indirect impact on employment.
Induced impact: As employment and income increases, there is likely to be an increase in
household consumption which will increase output further. The employment generated by the
higher household expenditures is known as the induced impact.
Estimating these impacts involves tracing the flows of purchases through the economy. Central to this
analysis is the Input-Output table. This is a statistical description of the economy, which lists the value
of the goods produced by each sector and how much of that output is used by each sector. Input-
Output tables, modelling the economy with 65 sectors, are provided by Eurostat for each of the EU
markets and for the EU as a whole.
Applying matrix algebra to the Input-Output tables it is possible to estimate the impact on the
equilibrium of the economy of an increase in economic activity in the various sectors. Denoting by d the
vector of final demand, A the Input-Output table and x vector of output in the economy, then the
following relationship holds in equilibrium:
x = Ax + d
This equation can be thought of as the condition that supply (the left hand side) is equal to demand
(the right hand side), where Ax is the demand for intermediary goods and services and d is the
exogenous aggregate final demand. The equation is solved for x as follows:
x = (I-A)d
where I is the identity matrix. Using this methodology it is possible to derive output multipliers for each
sector and each market. That is, the total increase in output that arises in equilibrium in response to a
unit increase of output in a given sector. These multipliers can then be applied to the employment
estimates to derive estimates of the total employment that is generated. The calculated multipliers for
each sector and each market are given in Table 3.
Table 3: Estimates of Type II multipliers applied to the direct and enabled employment effects to derive the total employment estimates.
60
Employment effect
Sector UK France Germany Hungary
EU-28
(1) Advertising agencies
3.05
2.96
2.50
3.07
4.40
(2) Cinema 2.80 3.21 2.80 2.55 3.81
Internet 2.85 2.75 2.63 2.96 2.43
Out of home 3.05 2.96 2.50 3.07 4.40
Press 3.05 3.10 2.72 3.44 2.10
Radio 2.80 3.21 2.80 2.55 3.81
Television 2.80 3.21 2.80 2.55 3.81
Source: Deloitte analysis based on Eurostat data
The relevant multipliers in Table 3 are applied to the estimates of the direct and enabled employment
impacts (based on the sector in which they occur) and then summed to give the total employment
impact in the market. The value of the additional impact in the economy is the difference between the
total employment impact and the impacts from (1) and (2).
60
Multipliers are typically categorised into either Type I or Type II multipliers. Type II multipliers include both indirect
and induced impacts whereas Type I multipliers do not include induced impacts.

40
Other than as stated below, this document is confidential and prepared solely for your information and that of other
beneficiaries of our advice listed in our engagement letter. Therefore you should not, refer to or use our name or this
document for any other purpose, disclose them or refer to them in any prospectus or other document, or make them
available or communicate them to any other party. If this document contains details of an arrangement that could
result in a tax or National Insurance saving, no such conditions of confidentiality apply to the details of that
arrangement (for example, for the purpose of discussion with tax authorities). In any event, no other party is entitled
to rely on our document for any purpose whatsoever and thus we accept no liability to any other party who is shown
or gains access to this document.
© 2016 Deloitte LLP. All rights reserved.
Deloitte LLP is a limited liability partnership registered in England and Wales with registered number OC303675 and
its registered office at 2 New Street Square, London EC4A 3BZ, United Kingdom.
Deloitte LLP is the United Kingdom member firm of Deloitte Touche Tohmatsu Limited (“DTTL”), a UK private
company limited by guarantee, whose member firms are legally separate and independent entities. Please see
www.deloitte.co.uk/about for a detailed description of the legal structure of DTTL and its member firms.