Wetlands mapping in North America using MODIS 500m imagery July 28, 2011 ○ Gegen Tana a, Ryutaro...
29
Wetlands mapping in North America using MODIS 500m imagery July 28, 2011 ○Gegen Tana a , Ryutaro Tateishi b a Graduate Schools of Science, Chiba University b Center for Environmental Remote Sensing (CEReS), Chiba University
-
Upload
perla-daft -
Category
Documents
-
view
222 -
download
3
Transcript of Wetlands mapping in North America using MODIS 500m imagery July 28, 2011 ○ Gegen Tana a, Ryutaro...

Wetlands mapping in North America using MODIS 500m imagery
July 28, 2011
○Gegen Tanaa, Ryutaro Tateishib
a Graduate Schools of Science, Chiba Universityb Center for Environmental Remote Sensing (CEReS), Chiba University

What is a wetland?

Background
- Definition of wetlands (Broadly used)
Ramsar Convention: The Convention on Wetlands, signed in Ramsar, Iran, in 1971, is an intergovernmental treaty which provides the framework for national action and international cooperation for the conservation and wise use of wetlands and their resources.
(source – the Convention on Wetlands website)
The Ramsar convention (Ramsar 2004) defined wetlands as areas of marsh, fen, peatland or water, whether natural or artificial, permanent or temporary, with water that is static or flowing, fresh, brackish or salt, including areas of marine water the depth of which at low tide does not exceed six meters.

- Global wetlands locations in the Ramar Convention
160 countries participate in and 1953 wetlands are contained.Total surface area of designated sites (hectares): 190,455,433
(source – the Convention on Wetlands website)
The Ramsar definition of "wetlands" is a broad one, including not just marshes, fen and peatland, but also lakes, coral reefs, temporary pools, even underground caves, and all sorts of other systems everywhere from the mountains to the sea, including man-made habitats.
Background

Background
- The values of wetlands
• The provision of water
• A supplement of groundwater
• Regulation of water quantity & flood control
• Wildlife habitat
• Retention of nutrients and carbon
Wetlands are one of the most important ecosystems in the world.It is important to inventory and monitor wetlands.
• A source of methane gas

Background
- Global wetland databases
Problems existed in the wetlands maps on large scale:
Global wetland databases:
Global land cover maps which include wetlands:
Global wetland distribution (http://data.giss.nasa.gov/landuse/wetland.html)
Global distribution of wetlands map (http://soils.usda.gov/use/worldsoils/mapindex/wetlands.html )
Global lakes and wetlands database (http://gcmd.nasa.gov/)
GLC2000
GLCNMO
GLOBCOVER
Underestimate wetlands areas due to the spectral heterogeneity of wetlands.
Difficult to separate wetlands from other vegetation types such as forest, herbaceous and shrub.

To extract wetlands in North America using MODIS 2008 data
Objective
Advantages of MODIS data:
• With high frequency repeat coverage • Significant potential for mapping large wetland extent and dynamics• Lower cost

Study area
North America is defined in this study as Canada, United States , Mexico, the countries of Central America and the Caribbean Islands.

MCD43A4: Terra+Aqua Nadir BRDF-Adjusted Reflectance 16-Day L3 Global 500m SIN Grid V005 (All 23 periods of 2008)
Spectral bands (1-7):
Data used- Nadir BRDF-Adjusted Reflectance

Data used
- Digital elevation model and reference data
Digital elevation model:
Reference data:
Landsat ETM+, 30m (Around 2008)
Existing land cover maps (GLCNMO, GLC2000, GLOBCOVER)
Google Earth images
Ramsar Convention sites
SRTM DEM, 90m (version 4.1)

Code Class name R,G,B (color code)
1 Broadleaf evergreen forest 0,50,0
2 Broadleaf deciduous forest 60,150,0
3 Needleleaf evergreen forest 0,110,0
4 Needleleaf deciduous forest 85,110,25
5 Mixed forest 0,200,0
6 Tree open 140,190,140
7 Shrub 190,190,0
8 Herbaceous 255,255,50
9 Herbaceous with sparse tree / shrub 180,230,100
10 Sparse vegetation 255,255,205
11 Cropland 255,175,80
12 Paddy field 145,50,230
13 Cropland / other vegetation mosaic 220,160,255
14 Mangrove 155,130,230
15 Wetland 180,250,240
16 Bare Area,consolidated(gravel,rock) 150,150,150
17 Bare Area,unconsolidated (sand) 200,200,200
18 Urban 255,0,0
19 Snow / ice 250,250,250
20 Water bodies 175,210,240
- Land cover legend
20 land cover classes are defined by Land Cover Classification System (LCCS)
Definition

- Definition of wetlands in LCCS
Wetland formula in LCCS2: Closed to Open Woody Vegetation Water Quality: Fresh Water // Closed to Open Woody Vegetation Water Quality: Brackish Water // Closed to Open Herbaceous Vegetation.
Water Quality: Fresh Water or Brackish Water.
Depending on the level of Total Dissolved Solids (TDS) expressed in parts per million (ppm), three classes are distinguished: fresh, brackish and saline water (Cowardin et al., 1979).
1) Fresh Water: Less than 1 000 ppm TDS.
2) Brackish Water: Between 1 000 and 10 000 ppm TDS.
3) Saline Water: More than 10 000 ppm TDS
The main layer consists of closed to open woody vegetation.
The crown cover is between 100 and 15%.
The height is in the range of 7 - 2m.
The main layer consists of closed to open herbaceous vegetation.
The crown cover is between 100 and 15%.
The height is in the range of 3 - 0.03m.
Three main components: Hydrology, Soil and Vegetation
LCCS definition: Land cover definition by Land Cover Classification System version 2 (LCCS2) developed by FAO( http://www.glcn-lccs.org/).
Definition

Vegetated area
Validation
Wetland map
Non-vegetated area
Methodology- The flow of the study
23 period of
MCD43A4(2008)
NDWI
Preprocessing
Reference data
Training data
GLCNMO STRM 90m NDSI
MODIS Tasseled Cap Indices
Maximum likelihood classification
Decision tree model
III
IV
V
I
II
II
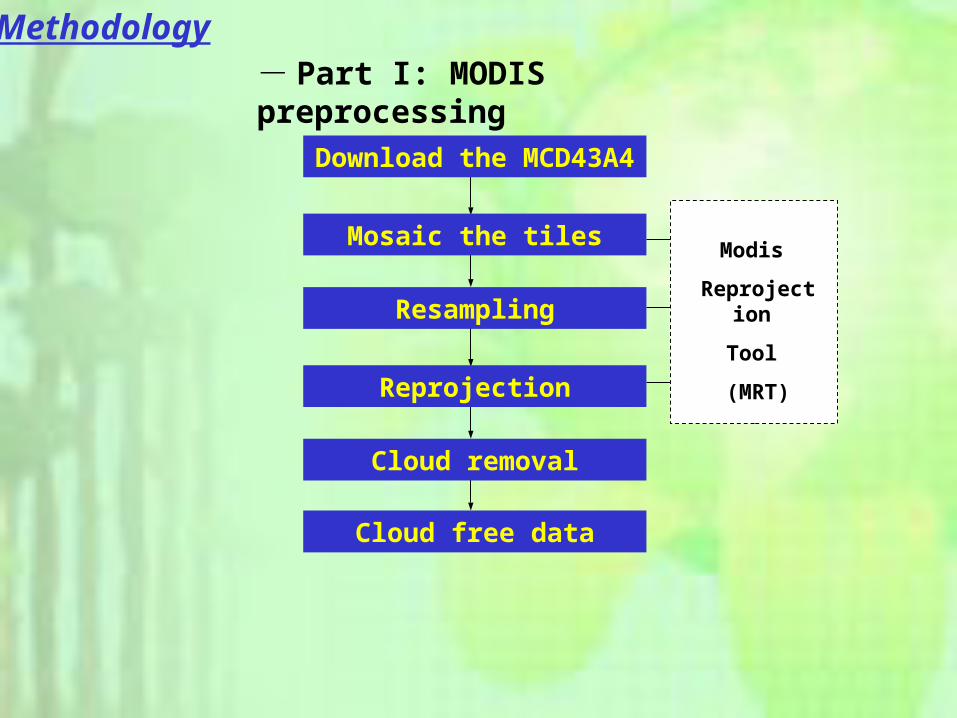
Methodology- Part I: MODIS preprocessing
Download the MCD43A4
Mosaic the tiles
Resampling
Modis
Reprojection
Tool
(MRT)
Cloud removal
Reprojection
Cloud free data
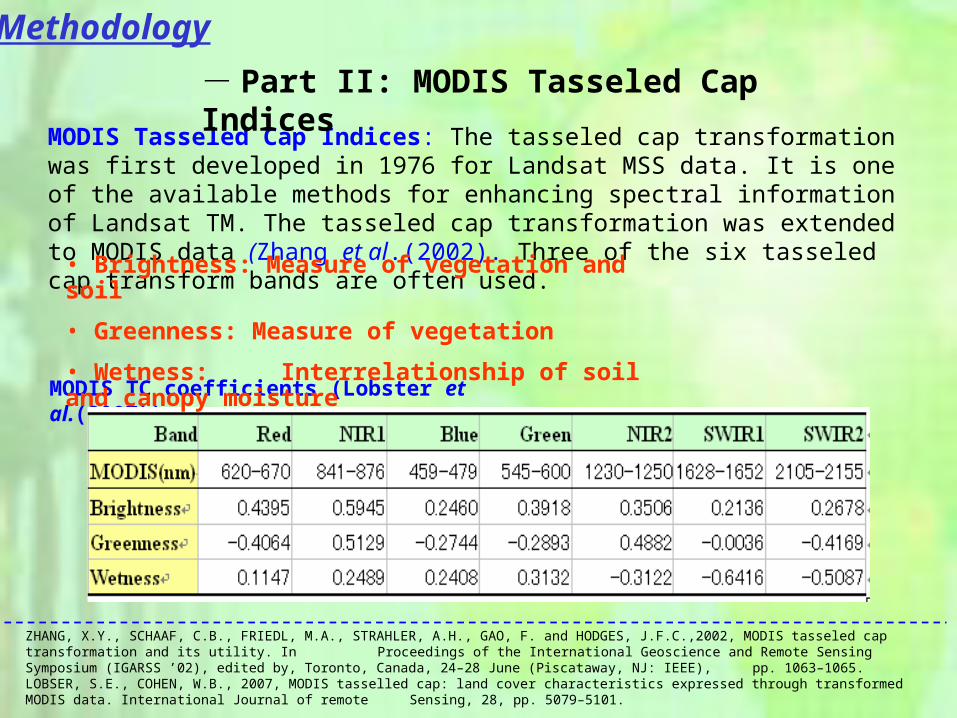
MODIS TC coefficients (Lobster et al.(2007)):
MODIS Tasseled Cap Indices: The tasseled cap transformation was first developed in 1976 for Landsat MSS data. It is one of the available methods for enhancing spectral information of Landsat TM. The tasseled cap transformation was extended to MODIS data (Zhang et al.(2002). Three of the six tasseled cap transform bands are often used.
ZHANG, X.Y., SCHAAF, C.B., FRIEDL, M.A., STRAHLER, A.H., GAO, F. and HODGES, J.F.C.,2002, MODIS tasseled cap transformation and its utility. In Proceedings of the International Geoscience and Remote Sensing Symposium (IGARSS ’02), edited by, Toronto, Canada, 24–28 June (Piscataway, NJ: IEEE), pp. 1063–1065.LOBSER, S.E., COHEN, W.B., 2007, MODIS tasselled cap: land cover characteristics expressed through transformed MODIS data. International Journal of remote Sensing, 28, pp. 5079–5101.
• Brightness: Measure of vegetation and soil
• Greenness: Measure of vegetation
• Wetness: Interrelationship of soil and canopy moisture
- Part II: MODIS Tasseled Cap Indices
Methodology

Normalized Difference Water Index (NDWI):
Normalized Difference Snow Index (NDSI):
(Gao, 1996)21
21
NIRNIR
NIRNIRNDWI
1
1
NIRGreen
NIRGreenNDSI
- Part II: NDWI & NDSI
Bo-Cai G.NDWI--A normalized difference water index for remote sensing of vegetation liquid water from space, Remote sensing of environment, 1996, pp257-266
Dorothy K. Halla, George A. Riggsb and Vincent V. Salomonsonc. NDSI:Development of methods for mapping global snow cover using moderate resolution imaging spectroradiometer data Remote Sensing of Environment, 1995
(D.K Halla, 1996)
Methodology

- Part III: Dominant wetland types in North America
(source – the Convention on Wetlands website)
O — Permanent freshwater lakes (over 8 ha) H — Intertidal marshes; includes salt marshes, salt meadows, saltings, raised salt marshes; includes tidal brackish and freshwater marshes.Tp - Permanent freshwater marshes/pools; ponds(below 8 ha), marshes and swamps on inorganic soils;with emergent vegetation water-logged for at least most of the growing season.F — Estuarine waters; permanent water of estuaries and estuarine systems of deltas.J — Coastal brackish/saline lagoons; brackish to saline lagoons with at least one relatively narrow connection to the sea.A — Permanent shallow marine waters in most cases less than six metres deep at low tide; includes sea bays and straits.E — Sand, shingle or pebble shores; includes sand bars, spits and sandy islets; includes dune systems and humid dune slacks.I — Intertidal forested wetlands; includes mangrove swamps, nipah swamps and tidal freshwater swamp forests.G — Intertidal mud, sand or salt flats.Xf - Freshwater, tree-dominated wetlands; includes freshwater swamp forests, seasonally flooded forests, wooded swamps on inorganic soils.
Methodology
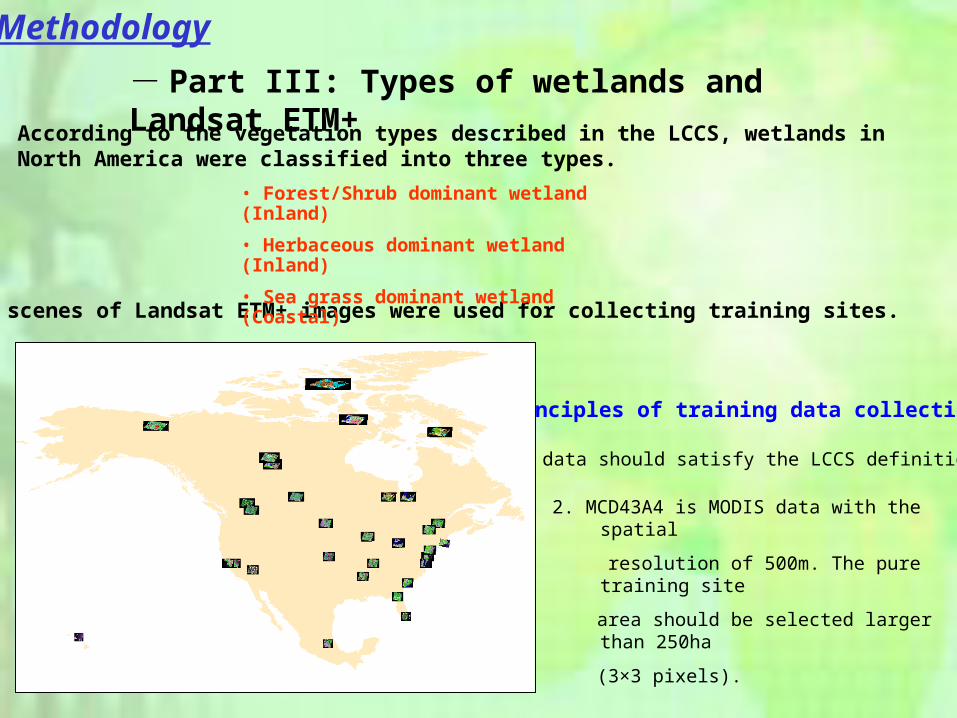
- Part III: Types of wetlands and Landsat ETM+
1. Training data should satisfy the LCCS definition.
Principles of training data collection:
Totally 31 scenes of Landsat ETM+ images were used for collecting training sites.
Methodology
• Forest/Shrub dominant wetland (Inland)
• Herbaceous dominant wetland (Inland)
• Sea grass dominant wetland (Coastal)
According to the vegetation types described in the LCCS, wetlands in North America were classified into three types.
2. MCD43A4 is MODIS data with the spatial
resolution of 500m. The pure training site
area should be selected larger than 250ha
(3×3 pixels).

Methodology- Part III: Training data collection
Common part of existing maps
Google Earth
Ramsar Convention
Landsat ETM+
Google Earth
Non-vegetated*1 and vegetated *2 land cover types
Wetland
Collection of training data
*1: Water, Snow, Urban, Bare (Rock&Sand)
*2: Broadleaf evergreen forest, Broadleaf deciduous forest, Needleleaf evergreen forest, Needleleaf deciduous forest, Mixed forest, Tree open, Shrub, Herbaceous, Herbaceous with sparse tree/shrub, Sparse vegetation, Cropland, Paddy field, Cropland/other vegetation mosaic, Mangrove,

Methodology
- Part IV: Decision tree model
STRM 90m <1000m
NDWI_8<0.2013
Water
Snow
Wetland&Other vagetation
NDSI_P10<0.1391
Mask of Urban&Bare area(GLCNMO)
Resampling
NoYes
Yes No

Methodology
- Part V: Maximum likelihood method
Input satellite data: MODIS Tasseled Cap Indices (Brightness, Greenness, Wetness)
Period of data: Totally 12 periods, 36 scenes. (1,4, 8,11-18, 20,22)
Training data: Wetland (3 types) and other vegetated land cover types (According to the monthly changed Tasseled Cap _Greenness pattern, each land cover type was subclassified. ) Integration: After classification, vegetated land cover types were integrated as “Others”, three types of wetlands were integrated as “wetland”.

Result
Wetlands
Others
Water

Comparison (1)
- Everglades National Park (United States)
Google Earth image
Result of this study
GLOBCOVER
GLC2000

Comparison (2)
Result of this study
GLOBCOVER
GLC2000
- Reserva de la Biosfera Ría Celestún (Mexico)
Google Earth image
Conclusions and future works
• In this study, wetlands defined in the LCCS were classified into three types and wetlands in North America with large spatial extent were successfully extracted.
• MODIS tasseled Cap Indices (brightness, greenness and wetness), SRTM 90m, NDWI and NDSI were confirmed useful for extracting wetlands.
• However, because of the spectral heterogeneity of wetlands, some small extent of wetlands and narrow wetlands were failed to be extracted in this study.
• Other reference data like Landsat ETM+ should be considered for mapping small and narrow wetlands.
• Quantitative validation should be also performed by using ground truth data. (National Wetland Inventory: http://www.fws.gov/wetlands/)
• Subclasses of land cover types especially for wetlands were very effective for classification in this study.
• Develop a wetland map of 2008 for global scale.

Thank you for your attention!


- Characteristics of remote sensing data for mapping wetlands
Advantages:• With high frequency repeat coverage • Significant potential for mapping large wetland extent and dynamics• Lower cost
• Benefit on mapping wetlands in local and regional scales • With high accuracy in mapping small extent of wetlands
Advantages:
Disadvantages:
Disadvantages:
• Unavoidably underestimate wetland area due to the small and fragmented nature of many wetlands• Lower map accuracy
• Difficult to get global or continent range of wetlands map• Time consuming for mapping large wetlands • Higher cost (SAR data)
High spatial resolution remote sensing data:
Moderate spatial resolution remote sensing data:
Background

Background- Global wetland databases
Name:Global wetland distribution
Resolution:
Year:1987
Name:Distribution of wetlands
Resolution:
Year:
Wetlands Wetlands Wetlands
Name: GLC2000
Resolution: 1km
Year:2000
Name: GLCNMO
Resolution: 1km
Year:2003
Name: GLOBCOVER
Resolution: 300m
Year:2005
Name:Global lakes and wetlands database
Resolution:1km
Year:2004