Westpac Capital Notes 5 - Amazon Web...
39
200 years proudly supporting Australia Westpac Capital Notes 5 Investor Presentation All amounts are in Australian dollars unless otherwise indicated Westpac Banking Corporation ABN 33 007 457 141 WARNING – Westpac Capital Notes 5 are not deposit liabilities of Westpac, are riskier than bank deposits and may not be suitable for some investors. Their overall complexity may make them difficult to understand and the risks associated with the Notes could result in the loss of all of your investment. If you do not fully understand how they work or the risks associated with them, you should obtain professional advice. NOT FOR DISTRIBUTION IN THE UNITED STATES
-
Upload
truongdieu -
Category
Documents
-
view
213 -
download
0
Transcript of Westpac Capital Notes 5 - Amazon Web...
200 years proudly supporting Australia
Westpac Capital Notes 5
Investor Presentation
All amounts are in Australian dollars unless otherwise indicated
Westpac Banking Corporation ABN 33 007 457 141
WARNING – Westpac Capital Notes 5 are not deposit liabilities of Westpac, are riskier than bank deposits and may not be suitable for some investors. Their overall complexity may make them difficult to understand and the risks associated with the Notes could result in the loss of all of your investment. If you do not fully understand how they work or the risks associated with them, you should obtain professional advice.
NOT FOR DISTRIBUTION IN THE UNITED STATES
Disclaimer THIS PRESENTATION IS NOT FOR DISTRIBUTION IN THE UNITED STATES.
YOU SHOULD CONSIDER AND READ THE PROSPECTUS IN FULL BEFORE DECIDING WHETHER TO INVEST IN WESTPAC CAPITAL NOTES 5.
This presentation has been prepared and authorised by Westpac Banking Corporation (ABN 33 007 457 141, AFSL 233714) (“Westpac”) in connection with a proposed offer (“Offer”) of Westpac Capital Notes 5 (“Notes”).
The Offer is being made under a Prospectus which was lodged with the Australian Securities and Investments Commission (“ASIC”) on 5 February 2018 and a replacement Prospectus, which will include the Margin and Broker Firm Application Form, expected to be lodged with ASIC on or about 13 February 2018.
Westpac Institutional Bank, ANZ Securities Limited, Commonwealth Bank of Australia, J.P. Morgan Australia Limited, Morgans Financial Limited, National Australia Bank Limited and UBS AG, Australia Branch are the Joint Lead Managers to the Offer (“Joint Lead Managers”).
The information in this presentation is an indicative overview and does not contain all information necessary to make an investment decision in relation to Westpac Capital Notes 5. It is intended to constitute a summary of certain information relating to Westpac and the Offer and does not purport to be a complete description of Westpac or the Offer. This presentation also includes information derived from publicly available sources that has not been independently verified.
The information in this presentation is subject to change without notice and Westpac is not obliged to update or correct it. Certain statements contained in this presentation contain language such as ‘will’, ‘may’, ‘expect’, ‘indicative’, ‘intent’, ‘seek’, ‘would’, ‘should’, ‘could’, ‘continue’, ‘plan’, ‘probability’, ‘risk’, ‘forecast’, ‘likely’, ‘estimate’, ‘anticipate’ or ‘believe’ and may constitute statements about “future matters” for the purposes of section 728(2) of the Corporations Act 2001 (Cth). The forward-looking statements include statements regarding our intent, belief or current expectations with respect to our business and operations, market conditions, results of operations and financial condition, including, without limitation, future loan loss provisions, indicative drivers and performance metric outcomes. These forward-looking statements reflect our current views with respect to future events and are subject to change, certain risks, uncertainties and assumptions which are, in many instances, beyond our control and have been made based upon management’s expectations and beliefs concerning future developments and their potential effect upon us. There can be no assurance that future developments will be in accordance with our expectations or that the effect of future developments on us will be those anticipated.
Should one or more of the risks or uncertainties materialise, or should underlying assumptions prove incorrect, actual results may vary materially from the expectations described in this presentation. All statements as to future matters are not guaranteed to be accurate and any statements as to past performance do not represent future performance..
Nothing in this presentation constitutes investment, legal, tax, financial product or other advice. The information in this presentation is not intended to create any legal or fiduciary relationship and does not take into account your investment objectives, financial situation or particular needs, so you should consider its appropriateness having regard to these factors before acting upon it. This presentation is not intended as an offer, invitation, solicitation or recommendation with respect to the purchase or sale of any security. In making an investment decision, investors must rely on their own examination of Westpac and the Offer including the merits and risks involved. Investors should consult with their own legal, tax, business and/or financial advisers in connection with any acquisition of securities.
2

Disclaimer (continued) No representation or warranty, express or implied, is made as to the accuracy, adequacy, currency, completeness or reliability of any statements, estimates or opinions or other information contained in this presentation. To the maximum extent permitted by law, Westpac, the Joint Lead Managers and their related bodies corporate, affiliates and each of their respective directors, officers, employees and agents disclaim all liability and responsibility (including without limitation any liability arising from fault or negligence on the part of Westpac, the Joint Lead Managers and their related bodies corporate, affiliates and each of their respective directors, officers, employees and agents) for any direct or indirect loss or damage which may be suffered by any recipient through use of or reliance on anything contained in or omitted from this presentation. If any law prohibits the exclusion of such liability, Westpac’s liability, to the maximum extent permitted by law, is limited to the re-supply of the information in this presentation to the extent which is fair and reasonable.
Westpac Capital Notes 5 are not deposit liabilities or protected accounts of Westpac for the purposes of the Banking Act 1959 (Cth) or the Financial Claims Scheme and are not subject to the depositor protection provisions of Australian banking legislation (including the Australian Government guarantee of certain bank deposits). Westpac Capital Notes 5 are not guaranteed or insured by any government agency, by any member of the Westpac Group or any other person.
A copy of the Prospectus is available at www.westpac.com.au/westpaccapnotes5. Applications for Westpac Capital Notes 5 may only be made during the Offer Period by completing and returning an Application Form attached to or accompanying the Prospectus or online at www.westpac.com.au/westpaccapnotes5.
This presentation is not a prospectus or an offer of securities for subscription or sale in any jurisdiction. The distribution of this presentation or the Prospectus in jurisdictions outside of Australia may be restricted by law. Any person who comes into possession of this presentation or the Prospectus in jurisdictions outside Australia should seek advice on and observe any such restrictions. Nothing in this presentation is to be construed as authorising the distribution, or the offer or sale of Westpac Capital Notes 5 in any jurisdiction other than Australia, and Westpac and the Joint Lead Managers do not accept any liability in this regard. Failure to comply with these restrictions may constitute a violation of applicable securities laws. In particular, Westpac Capital Notes 5 have not been, and will not be, registered under the United States Securities Act of 1933, as amended (“US Securities Act”) or the securities laws of any state or other jurisdiction of the United States and may not be offered, sold, delivered or transferred within the United States or to, or for the account or benefit of, any “U.S. persons” (as defined in Regulation S under the US Securities Act).
All amounts are in Australian dollars unless otherwise indicated.
3
Westpac Capital Notes 5 Summary of terms and conditions
Westpac Capital Notes 5
4
1 Redemption is subject to APRA’s prior written approval. There can be no certainty that APRA will provide its prior written approval. 2 The number of Ordinary Shares that can be issued on Conversion is limited to a Maximum Conversion Number. If Conversion of Notes following a Capital Trigger Event or a Non-Viability Trigger Event does not occur for any reason within 5 Business Days, all rights in relation to those Notes will be terminated (the investment will lose all of its value and Holders will not receive any compensation or unpaid Distributions) and Notes will have no ranking in a Winding Up.
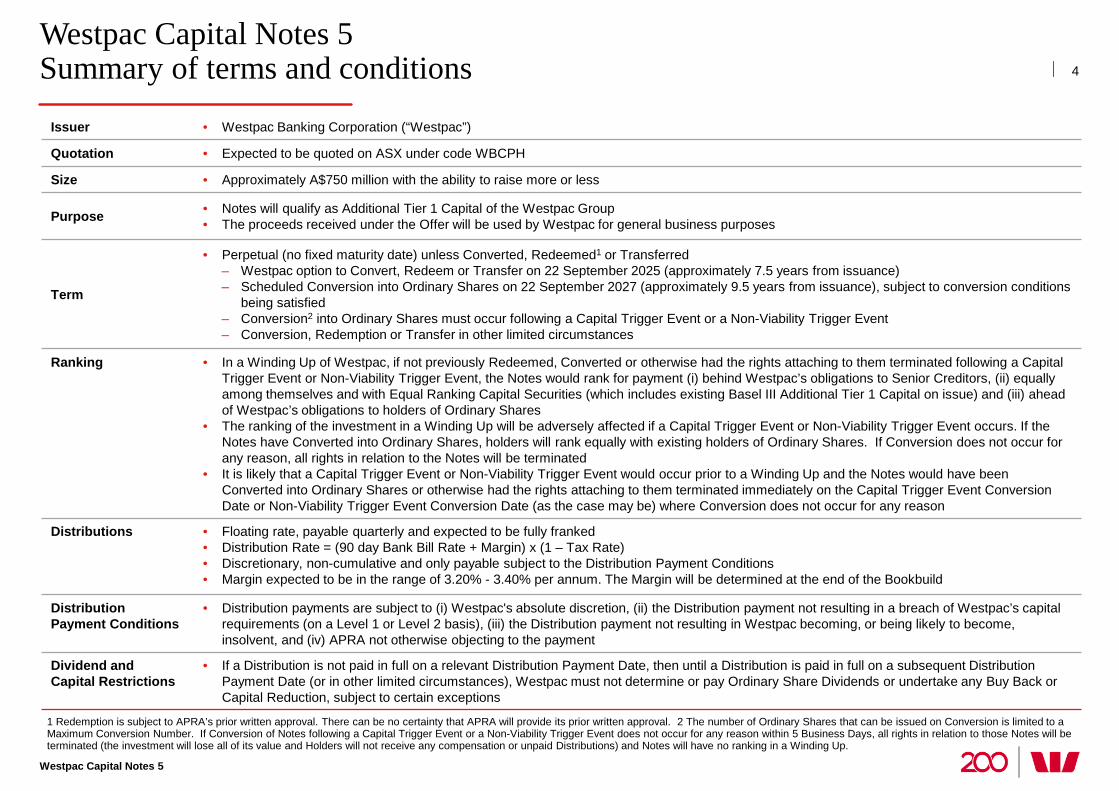
Issuer • Westpac Banking Corporation (“Westpac”)
Quotation • Expected to be quoted on ASX under code WBCPH
Size • Approximately A$750 million with the ability to raise more or less
Purpose • Notes will qualify as Additional Tier 1 Capital of the Westpac Group • The proceeds received under the Offer will be used by Westpac for general business purposes
Term
• Perpetual (no fixed maturity date) unless Converted, Redeemed1 or Transferred – Westpac option to Convert, Redeem or Transfer on 22 September 2025 (approximately 7.5 years from issuance) – Scheduled Conversion into Ordinary Shares on 22 September 2027 (approximately 9.5 years from issuance), subject to conversion conditions
being satisfied – Conversion2 into Ordinary Shares must occur following a Capital Trigger Event or a Non-Viability Trigger Event – Conversion, Redemption or Transfer in other limited circumstances
Ranking • In a Winding Up of Westpac, if not previously Redeemed, Converted or otherwise had the rights attaching to them terminated following a Capital Trigger Event or Non-Viability Trigger Event, the Notes would rank for payment (i) behind Westpac’s obligations to Senior Creditors, (ii) equally among themselves and with Equal Ranking Capital Securities (which includes existing Basel III Additional Tier 1 Capital on issue) and (iii) ahead of Westpac’s obligations to holders of Ordinary Shares
• The ranking of the investment in a Winding Up will be adversely affected if a Capital Trigger Event or Non-Viability Trigger Event occurs. If the Notes have Converted into Ordinary Shares, holders will rank equally with existing holders of Ordinary Shares. If Conversion does not occur for any reason, all rights in relation to the Notes will be terminated
• It is likely that a Capital Trigger Event or Non-Viability Trigger Event would occur prior to a Winding Up and the Notes would have been Converted into Ordinary Shares or otherwise had the rights attaching to them terminated immediately on the Capital Trigger Event Conversion Date or Non-Viability Trigger Event Conversion Date (as the case may be) where Conversion does not occur for any reason
Distributions • Floating rate, payable quarterly and expected to be fully franked • Distribution Rate = (90 day Bank Bill Rate + Margin) x (1 – Tax Rate) • Discretionary, non-cumulative and only payable subject to the Distribution Payment Conditions • Margin expected to be in the range of 3.20% - 3.40% per annum. The Margin will be determined at the end of the Bookbuild
Distribution Payment Conditions
• Distribution payments are subject to (i) Westpac's absolute discretion, (ii) the Distribution payment not resulting in a breach of Westpac’s capital requirements (on a Level 1 or Level 2 basis), (iii) the Distribution payment not resulting in Westpac becoming, or being likely to become, insolvent, and (iv) APRA not otherwise objecting to the payment
Dividend and Capital Restrictions
• If a Distribution is not paid in full on a relevant Distribution Payment Date, then until a Distribution is paid in full on a subsequent Distribution Payment Date (or in other limited circumstances), Westpac must not determine or pay Ordinary Share Dividends or undertake any Buy Back or Capital Reduction, subject to certain exceptions
Westpac Capital Notes 5 Summary of terms and conditions (continued)
Westpac Capital Notes 5
5
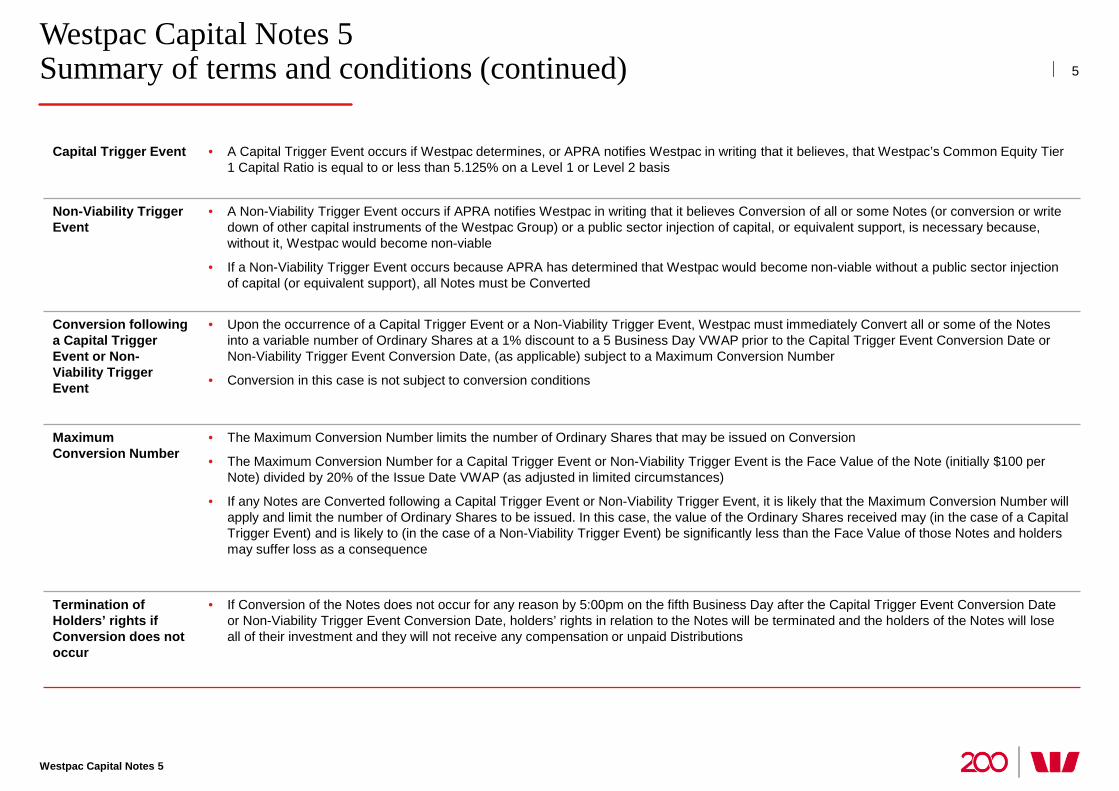
Capital Trigger Event • A Capital Trigger Event occurs if Westpac determines, or APRA notifies Westpac in writing that it believes, that Westpac’s Common Equity Tier 1 Capital Ratio is equal to or less than 5.125% on a Level 1 or Level 2 basis
Non-Viability Trigger Event
• A Non-Viability Trigger Event occurs if APRA notifies Westpac in writing that it believes Conversion of all or some Notes (or conversion or write down of other capital instruments of the Westpac Group) or a public sector injection of capital, or equivalent support, is necessary because, without it, Westpac would become non-viable
• If a Non-Viability Trigger Event occurs because APRA has determined that Westpac would become non-viable without a public sector injection of capital (or equivalent support), all Notes must be Converted
Conversion following a Capital Trigger Event or Non-Viability Trigger Event
• Upon the occurrence of a Capital Trigger Event or a Non-Viability Trigger Event, Westpac must immediately Convert all or some of the Notes into a variable number of Ordinary Shares at a 1% discount to a 5 Business Day VWAP prior to the Capital Trigger Event Conversion Date or Non-Viability Trigger Event Conversion Date, (as applicable) subject to a Maximum Conversion Number
• Conversion in this case is not subject to conversion conditions
Maximum Conversion Number
• The Maximum Conversion Number limits the number of Ordinary Shares that may be issued on Conversion
• The Maximum Conversion Number for a Capital Trigger Event or Non-Viability Trigger Event is the Face Value of the Note (initially $100 per Note) divided by 20% of the Issue Date VWAP (as adjusted in limited circumstances)
• If any Notes are Converted following a Capital Trigger Event or Non-Viability Trigger Event, it is likely that the Maximum Conversion Number will apply and limit the number of Ordinary Shares to be issued. In this case, the value of the Ordinary Shares received may (in the case of a Capital Trigger Event) and is likely to (in the case of a Non-Viability Trigger Event) be significantly less than the Face Value of those Notes and holders may suffer loss as a consequence
Termination of Holders’ rights if Conversion does not occur
• If Conversion of the Notes does not occur for any reason by 5:00pm on the fifth Business Day after the Capital Trigger Event Conversion Date or Non-Viability Trigger Event Conversion Date, holders’ rights in relation to the Notes will be terminated and the holders of the Notes will lose all of their investment and they will not receive any compensation or unpaid Distributions
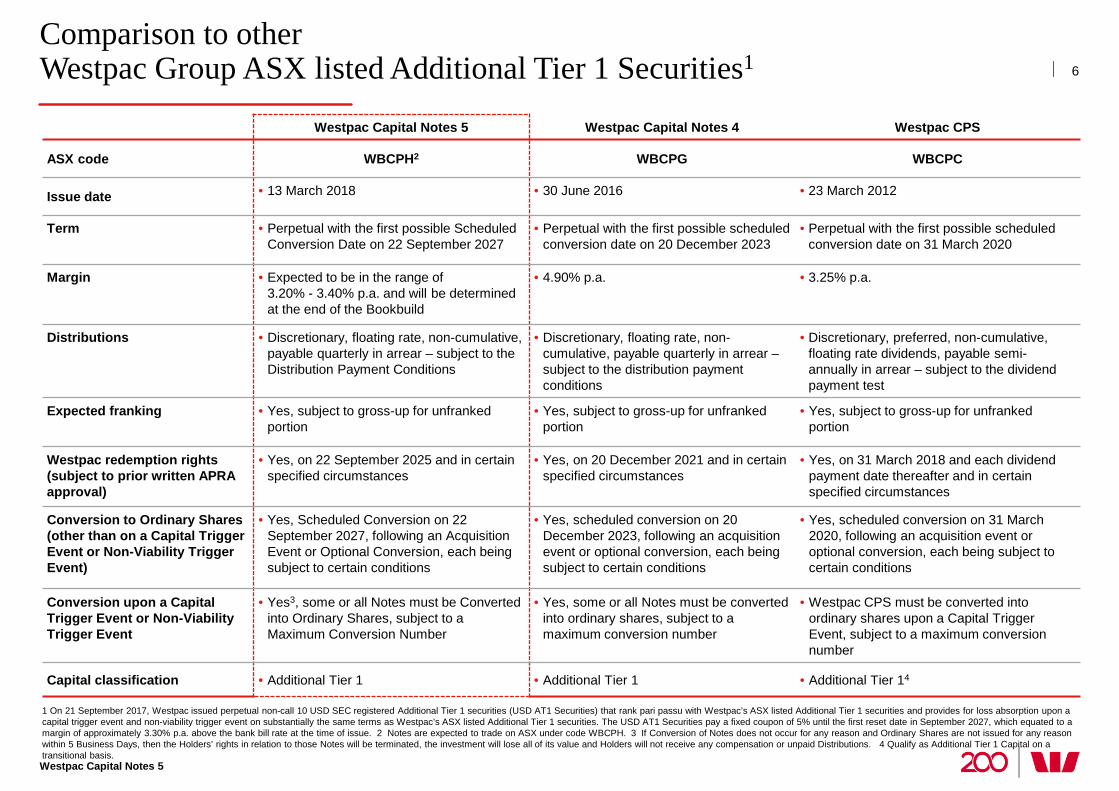
Comparison to other Westpac Group ASX listed Additional Tier 1 Securities1
Westpac Capital Notes 5
6
Westpac Capital Notes 5 Westpac Capital Notes 4 Westpac CPS
ASX code WBCPH2 WBCPG WBCPC
Issue date • 13 March 2018 • 30 June 2016 • 23 March 2012
Term • Perpetual with the first possible Scheduled Conversion Date on 22 September 2027
• Perpetual with the first possible scheduled conversion date on 20 December 2023
• Perpetual with the first possible scheduled conversion date on 31 March 2020
Margin • Expected to be in the range of 3.20% - 3.40% p.a. and will be determined at the end of the Bookbuild
• 4.90% p.a. • 3.25% p.a.
Distributions • Discretionary, floating rate, non-cumulative, payable quarterly in arrear – subject to the Distribution Payment Conditions
• Discretionary, floating rate, non-cumulative, payable quarterly in arrear – subject to the distribution payment conditions
• Discretionary, preferred, non-cumulative, floating rate dividends, payable semi-annually in arrear – subject to the dividend payment test
Expected franking • Yes, subject to gross-up for unfranked portion
• Yes, subject to gross-up for unfranked portion
• Yes, subject to gross-up for unfranked portion
Westpac redemption rights (subject to prior written APRA approval)
• Yes, on 22 September 2025 and in certain specified circumstances
• Yes, on 20 December 2021 and in certain specified circumstances
• Yes, on 31 March 2018 and each dividend payment date thereafter and in certain specified circumstances
Conversion to Ordinary Shares (other than on a Capital Trigger Event or Non-Viability Trigger Event)
• Yes, Scheduled Conversion on 22 September 2027, following an Acquisition Event or Optional Conversion, each being subject to certain conditions
• Yes, scheduled conversion on 20 December 2023, following an acquisition event or optional conversion, each being subject to certain conditions
• Yes, scheduled conversion on 31 March 2020, following an acquisition event or optional conversion, each being subject to certain conditions
Conversion upon a Capital Trigger Event or Non-Viability Trigger Event
• Yes3, some or all Notes must be Converted into Ordinary Shares, subject to a Maximum Conversion Number
• Yes, some or all Notes must be converted into ordinary shares, subject to a maximum conversion number
• Westpac CPS must be converted into ordinary shares upon a Capital Trigger Event, subject to a maximum conversion number
Capital classification • Additional Tier 1 • Additional Tier 1 • Additional Tier 14
1 On 21 September 2017, Westpac issued perpetual non-call 10 USD SEC registered Additional Tier 1 securities (USD AT1 Securities) that rank pari passu with Westpac’s ASX listed Additional Tier 1 securities and provides for loss absorption upon a capital trigger event and non-viability trigger event on substantially the same terms as Westpac’s ASX listed Additional Tier 1 securities. The USD AT1 Securities pay a fixed coupon of 5% until the first reset date in September 2027, which equated to a margin of approximately 3.30% p.a. above the bank bill rate at the time of issue. 2 Notes are expected to trade on ASX under code WBCPH. 3 If Conversion of Notes does not occur for any reason and Ordinary Shares are not issued for any reason within 5 Business Days, then the Holders’ rights in relation to those Notes will be terminated, the investment will lose all of its value and Holders will not receive any compensation or unpaid Distributions. 4 Qualify as Additional Tier 1 Capital on a transitional basis.
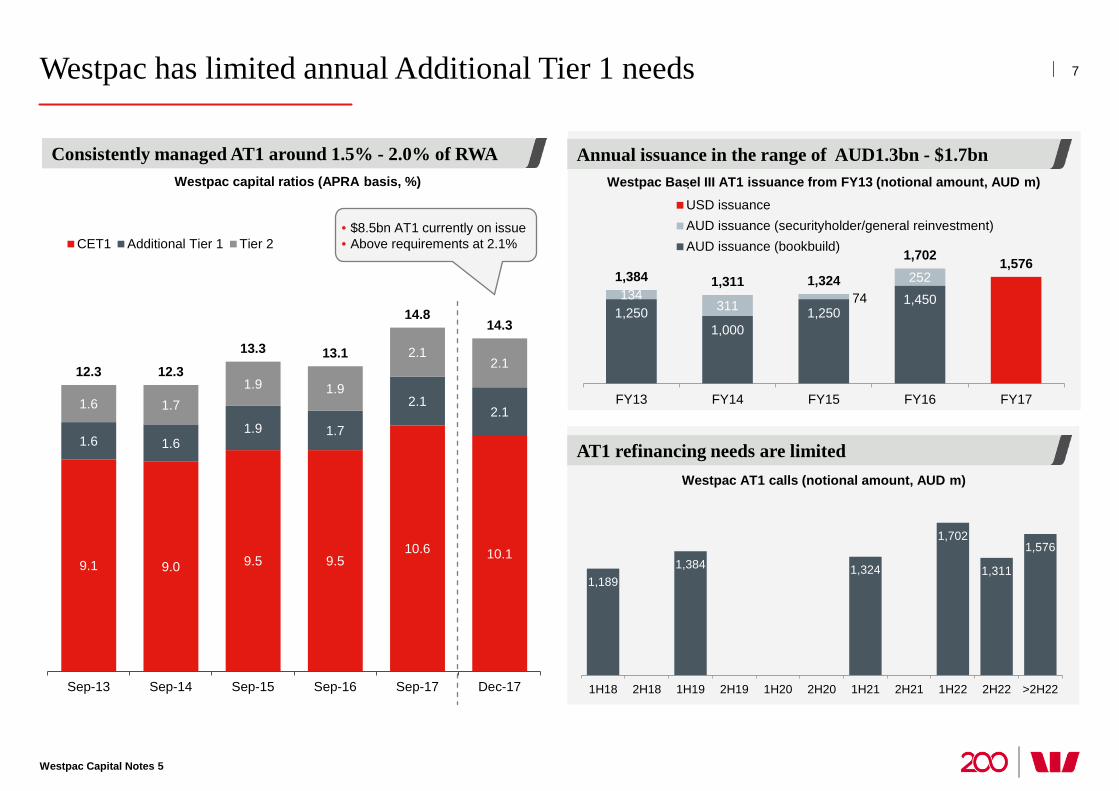
Westpac has limited annual Additional Tier 1 needs 7
Westpac Capital Notes 5
9.1 9.0 9.5 9.5 10.6 10.1
1.6 1.6 1.9 1.7
2.1 2.1 1.6 1.7
1.9 1.9
2.1 2.1 12.3 12.3
13.3 13.1
14.8 14.3
Sep-13 Sep-14 Sep-15 Sep-16 Sep-17 Dec-17
CET1 Additional Tier 1 Tier 2
Westpac capital ratios (APRA basis, %)
1,189 1,384 1,324
1,702
1,311
1,576
1H18 2H18 1H19 2H19 1H20 2H20 1H21 2H21 1H22 2H22 >2H22
1,250 1,000
1,250 1,450 134
311 74 252 1,384 1,311 1,324
1,702 1,576
FY13 FY14 FY15 FY16 FY17
.USD issuanceAUD issuance (securityholder/general reinvestment)AUD issuance (bookbuild)
Westpac Basel III AT1 issuance from FY13 (notional amount, AUD m)
Westpac AT1 calls (notional amount, AUD m)
Annual issuance in the range of AUD1.3bn - $1.7bn
AT1 refinancing needs are limited
• $8.5bn AT1 currently on issue • Above requirements at 2.1%
Consistently managed AT1 around 1.5% - 2.0% of RWA

1 Dow Jones Sustainability Index 2017. 2 As at 30 September 2017. 3 Source: APRA Banking Statistics September 2017. 4 Source: RBA Financial Aggregates, September 2017. 5 Source: Plan for Life, June 2017, All Master Funds Admin. 6 Source: RBNZ, September 2017. 7 Net stable funding ratio (NSFR) is estimated. NSFR commenced in Australia on 1 January 2018 and will be reported from March 2018.
0.67
0.40 0.30 0.32
0.22
FY13 FY14 FY15 FY16 FY17
8
Westpac Capital Notes 5
Westpac offers a strong franchise, consistent strategy and solid financial performance
110 100
31-Dec-17 Regulatoryminimum
116
100
31-Dec-17 Regulatoryminimum
Net stable funding ratio7 (%)
Liquidity coverage ratio (%)
Consistent strategy for creating value Market share in core segments
Balance sheet ratios Sound asset quality
Cash earnings ($bn)
Total impaired loans to total loans (%)
3.5
5.0 4.7
5.9 6.3 6.6
7.1 7.6 7.8 7.8 8.1
FY07 FY09 FY11 FY13 FY15 FY17
Customers2 13.8m
Australian household deposit market share3 23%
Australian mortgage market share4 23%
Australian business market share4 19%
Australian wealth platforms market share5 19%
NZ deposit market share6 19%
NZ consumer lending market share6 19%
• Continued discipline: Focus on strength and return over growth
− Cash earnings up 3% over FY17
− Operating divisions all performing well
− Review of products and services underway (‘Get it right/Put it right’)
• Increasing franchise value
− Growing customer numbers - added 1 million new customers since 2015
− Well positioned across key markets
− Unique portfolio of brands, reaching a broader customer set
• Strong balance sheet
− Material increase in capital
− Asset quality improved further in FY17
− Balance sheet ratios comfortably above regulatory minimums
• Driving efficiency via digital
• Building a highly engaged workforce and innovative culture
• World’s most sustainable bank 4 years in a row1
9
Westpac Capital Notes 5
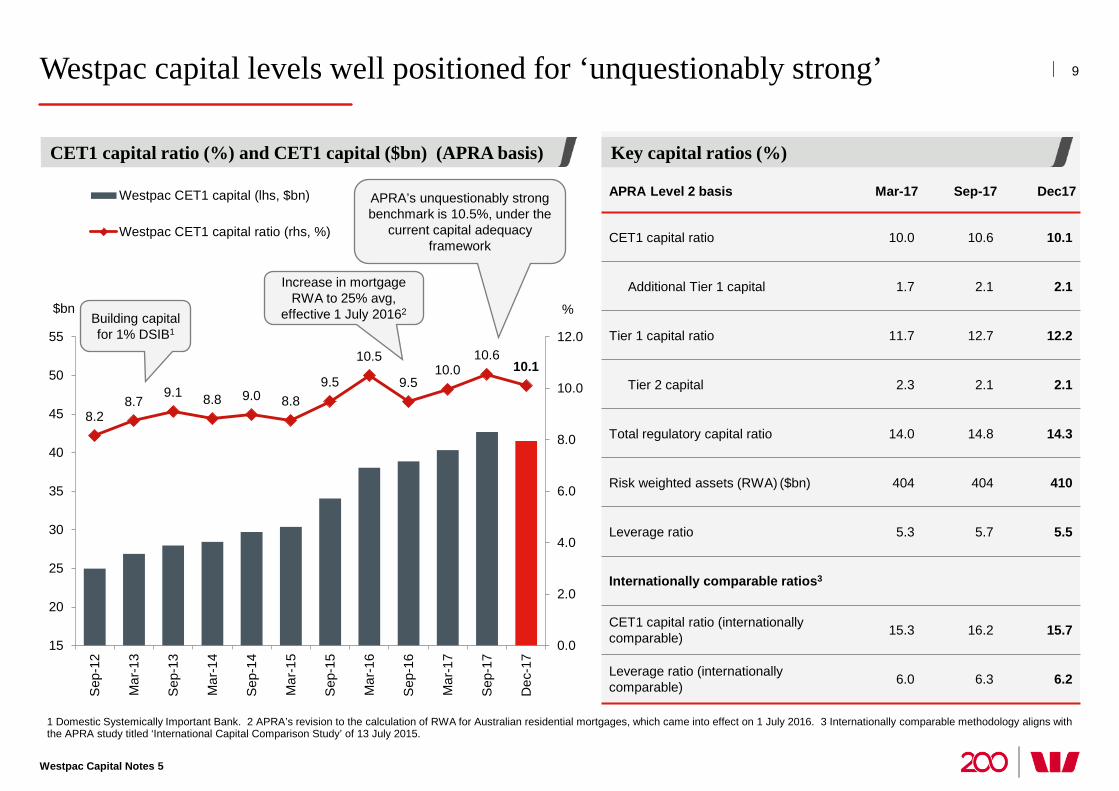
Westpac capital levels well positioned for ‘unquestionably strong’
1 Domestic Systemically Important Bank. 2 APRA’s revision to the calculation of RWA for Australian residential mortgages, which came into effect on 1 July 2016. 3 Internationally comparable methodology aligns with the APRA study titled ‘International Capital Comparison Study’ of 13 July 2015.
APRA Level 2 basis Mar-17 Sep-17 Dec17
CET1 capital ratio 10.0 10.6 10.1
Additional Tier 1 capital 1.7 2.1 2.1
Tier 1 capital ratio 11.7 12.7 12.2
Tier 2 capital 2.3 2.1 2.1
Total regulatory capital ratio 14.0 14.8 14.3
Risk weighted assets (RWA) ($bn) 404 404 410
Leverage ratio 5.3 5.7 5.5
Internationally comparable ratios3
CET1 capital ratio (internationally comparable) 15.3 16.2 15.7
Leverage ratio (internationally comparable) 6.0 6.3 6.2
Key capital ratios (%)
8.2 8.7
9.1 8.8 9.0 8.8 9.5
10.5
9.5 10.0
10.6 10.1
0.0
2.0
4.0
6.0
8.0
10.0
12.0
15
20
25
30
35
40
45
50
55
Sep
-12
Mar
-13
Sep
-13
Mar
-14
Sep
-14
Mar
-15
Sep
-15
Mar
-16
Sep
-16
Mar
-17
Sep
-17
Dec
-17
Westpac CET1 capital (lhs, $bn)
Westpac CET1 capital ratio (rhs, %)
APRA’s unquestionably strong benchmark is 10.5%, under the
current capital adequacy framework
Building capital for 1% DSIB1
CET1 capital ratio (%) and CET1 capital ($bn) (APRA basis)
%
Increase in mortgage RWA to 25% avg,
effective 1 July 20162 $bn
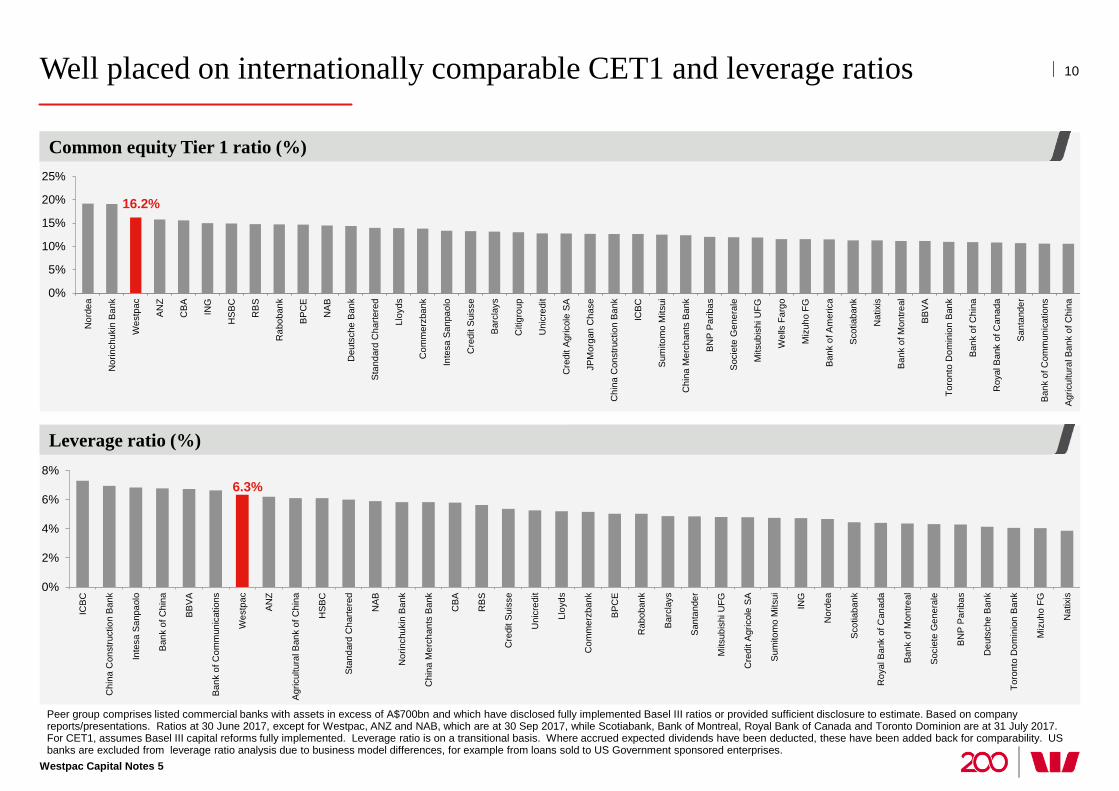
Well placed on internationally comparable CET1 and leverage ratios
Peer group comprises listed commercial banks with assets in excess of A$700bn and which have disclosed fully implemented Basel III ratios or provided sufficient disclosure to estimate. Based on company reports/presentations. Ratios at 30 June 2017, except for Westpac, ANZ and NAB, which are at 30 Sep 2017, while Scotiabank, Bank of Montreal, Royal Bank of Canada and Toronto Dominion are at 31 July 2017. For CET1, assumes Basel III capital reforms fully implemented. Leverage ratio is on a transitional basis. Where accrued expected dividends have been deducted, these have been added back for comparability. US banks are excluded from leverage ratio analysis due to business model differences, for example from loans sold to US Government sponsored enterprises.
10
Westpac Capital Notes 5
Common equity Tier 1 ratio (%)
16.2%
0%
5%
10%
15%
20%
25%
Nor
dea
Nor
inch
ukin
Ban
k
Wes
tpac
AN
Z
CB
A
ING
HS
BC
RB
S
Rab
oban
k
BP
CE
NA
B
Deu
tsch
e B
ank
Sta
ndar
d C
harte
red
Lloy
ds
Com
mer
zban
k
Inte
sa S
anpa
olo
Cre
dit S
uiss
e
Bar
clay
s
Citi
grou
p
Uni
cred
it
Cre
dit A
gric
ole
SA
JPM
orga
n C
hase
Chi
na C
onst
ruct
ion
Ban
k
ICB
C
Sum
itom
o M
itsui
Chi
na M
erch
ants
Ban
k
BN
P P
arib
as
Soc
iete
Gen
eral
e
Mits
ubis
hi U
FG
Wel
ls F
argo
Miz
uho
FG
Ban
k of
Am
eric
a
Sco
tiaba
nk
Nat
ixis
Ban
k of
Mon
treal
BB
VA
Toro
nto
Dom
inio
n B
ank
Ban
k of
Chi
na
Roy
al B
ank
of C
anad
a
San
tand
er
Ban
k of
Com
mun
icat
ions
Agr
icul
tura
l Ban
k of
Chi
na
Leverage ratio (%)
6.3%
0%
2%
4%
6%
8%
ICB
C
Chi
na C
onst
ruct
ion
Ban
k
Inte
sa S
anpa
olo
Ban
k of
Chi
na
BB
VA
Ban
k of
Com
mun
icat
ions
Wes
tpac
AN
Z
Agr
icul
tura
l Ban
k of
Chi
na
HS
BC
Sta
ndar
d C
harte
red
NA
B
Nor
inch
ukin
Ban
k
Chi
na M
erch
ants
Ban
k
CB
A
RB
S
Cre
dit S
uiss
e
Uni
cred
it
Lloy
ds
Com
mer
zban
k
BP
CE
Rab
oban
k
Bar
clay
s
San
tand
er
Mits
ubis
hi U
FG
Cre
dit A
gric
ole
SA
Sum
itom
o M
itsui
ING
Nor
dea
Sco
tiaba
nk
Roy
al B
ank
of C
anad
a
Ban
k of
Mon
treal
Soc
iete
Gen
eral
e
BN
P P
arib
as
Deu
tsch
e B
ank
Toro
nto
Dom
inio
n B
ank
Miz
uho
FG
Nat
ixis
Minimum CET1 4.5%
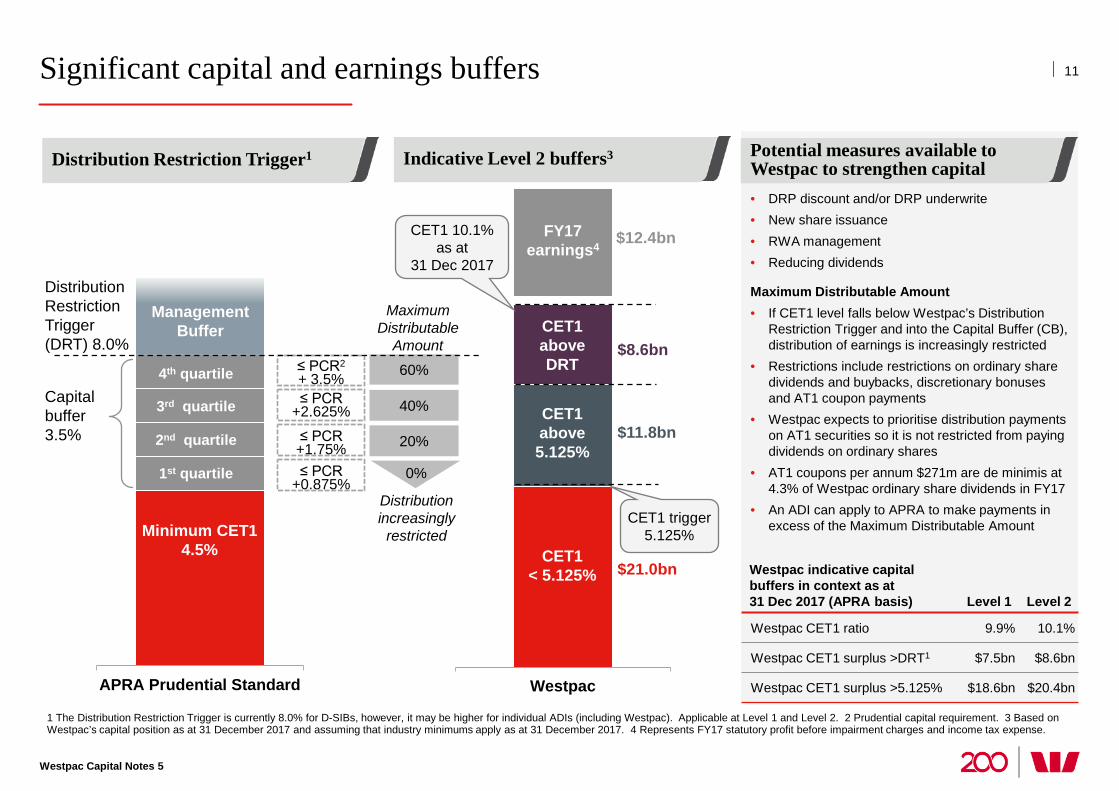
Significant capital and earnings buffers
1 The Distribution Restriction Trigger is currently 8.0% for D-SIBs, however, it may be higher for individual ADIs (including Westpac). Applicable at Level 1 and Level 2. 2 Prudential capital requirement. 3 Based on Westpac’s capital position as at 31 December 2017 and assuming that industry minimums apply as at 31 December 2017. 4 Represents FY17 statutory profit before impairment charges and income tax expense.
Potential measures available to Westpac to strengthen capital • DRP discount and/or DRP underwrite • New share issuance • RWA management • Reducing dividends
Maximum Distributable Amount • If CET1 level falls below Westpac’s Distribution
Restriction Trigger and into the Capital Buffer (CB), distribution of earnings is increasingly restricted
• Restrictions include restrictions on ordinary share dividends and buybacks, discretionary bonuses and AT1 coupon payments
• Westpac expects to prioritise distribution payments on AT1 securities so it is not restricted from paying dividends on ordinary shares
• AT1 coupons per annum $271m are de minimis at 4.3% of Westpac ordinary share dividends in FY17
• An ADI can apply to APRA to make payments in excess of the Maximum Distributable Amount
Westpac indicative capital buffers in context as at 31 Dec 2017 (APRA basis) Level 1 Level 2
Westpac CET1 ratio 9.9% 10.1%
Westpac CET1 surplus >DRT1 $7.5bn $8.6bn
Westpac CET1 surplus >5.125% $18.6bn $20.4bn
11
Westpac Capital Notes 5
Distribution Restriction Trigger1 Indicative Level 2 buffers3
APRA Prudential Standard
Minimum CET1 4.5%
≤ PCR2 + 3.5% ≤ PCR
+2.625%
≤ PCR +1.75% ≤ PCR
+0.875%
20%
40%
60%
0%
4th quartile
3rd quartile
2nd quartile
1st quartile
Management Buffer
Capital buffer 3.5%
Distribution Restriction Trigger (DRT) 8.0%
Westpac
CET1 above DRT
FY17 earnings4
CET1 < 5.125%
CET1 above 5.125%
$12.4bn
$8.6bn
$11.8bn
$21.0bn
Maximum Distributable
Amount
Distribution increasingly
restricted
CET1 10.1% as at
31 Dec 2017
CET1 trigger 5.125%
12
Westpac Capital Notes 5
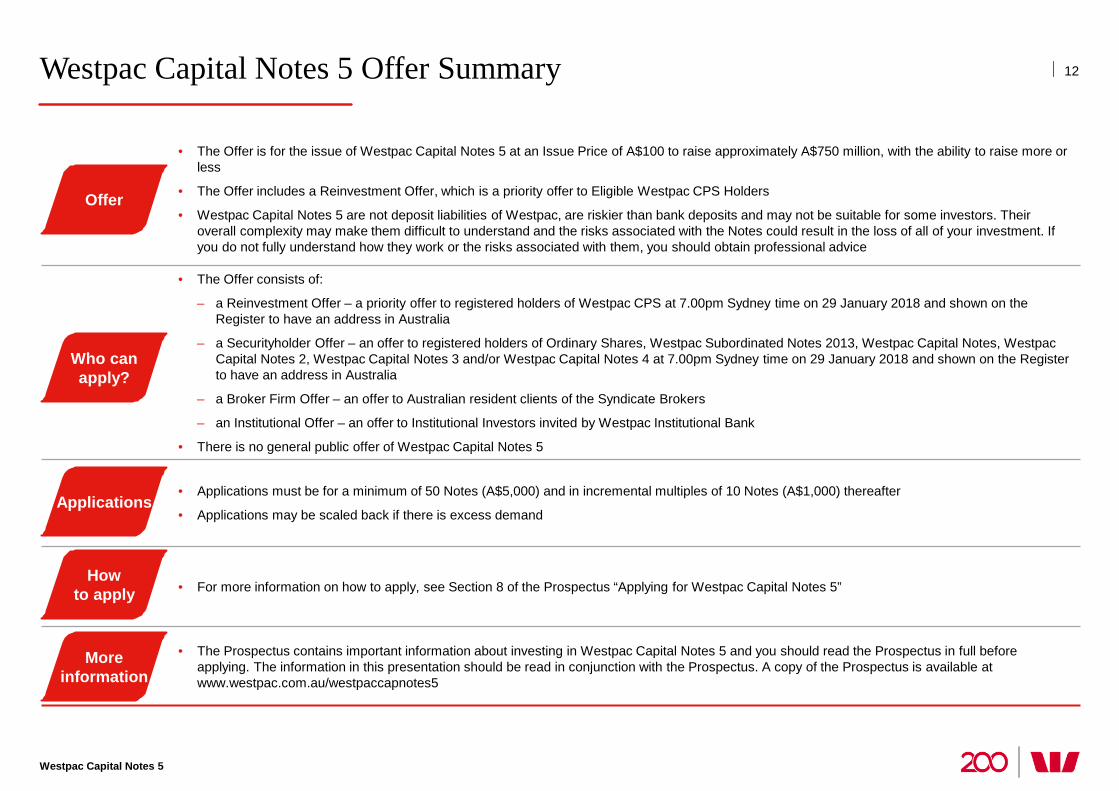
Westpac Capital Notes 5 Offer Summary
• The Offer is for the issue of Westpac Capital Notes 5 at an Issue Price of A$100 to raise approximately A$750 million, with the ability to raise more or less
• The Offer includes a Reinvestment Offer, which is a priority offer to Eligible Westpac CPS Holders
• Westpac Capital Notes 5 are not deposit liabilities of Westpac, are riskier than bank deposits and may not be suitable for some investors. Their overall complexity may make them difficult to understand and the risks associated with the Notes could result in the loss of all of your investment. If you do not fully understand how they work or the risks associated with them, you should obtain professional advice
• The Offer consists of:
– a Reinvestment Offer – a priority offer to registered holders of Westpac CPS at 7.00pm Sydney time on 29 January 2018 and shown on the Register to have an address in Australia
– a Securityholder Offer – an offer to registered holders of Ordinary Shares, Westpac Subordinated Notes 2013, Westpac Capital Notes, Westpac Capital Notes 2, Westpac Capital Notes 3 and/or Westpac Capital Notes 4 at 7.00pm Sydney time on 29 January 2018 and shown on the Register to have an address in Australia
– a Broker Firm Offer – an offer to Australian resident clients of the Syndicate Brokers
– an Institutional Offer – an offer to Institutional Investors invited by Westpac Institutional Bank
• There is no general public offer of Westpac Capital Notes 5
• Applications must be for a minimum of 50 Notes (A$5,000) and in incremental multiples of 10 Notes (A$1,000) thereafter
• Applications may be scaled back if there is excess demand
• For more information on how to apply, see Section 8 of the Prospectus “Applying for Westpac Capital Notes 5”
• The Prospectus contains important information about investing in Westpac Capital Notes 5 and you should read the Prospectus in full before applying. The information in this presentation should be read in conjunction with the Prospectus. A copy of the Prospectus is available at www.westpac.com.au/westpaccapnotes5
Offer
Who can apply?
Applications
How to apply
More information

Priority Reinvestment Offer for Eligible Westpac CPS Holders 13
Westpac Capital Notes 5
• A priority offer to Eligible Westpac CPS Holders to apply to reinvest some or all of their Westpac CPS in Notes through the Reinvestment Offer
• An Eligible Westpac CPS Holder is: – a registered holder of Westpac CPS at 7.00pm (Sydney time) on 29 January 2018; and – shown on the Register as having an address in Australia
• Apply to automatically reinvest some or all of their Westpac CPS in Notes • Do nothing, in which case on 3 April 2018 any Westpac CPS held will be automatically transferred to the Westpac CPS Nominated
Party for $100 per Westpac CPS, in accordance with the Westpac CPS Terms
• Eligible Westpac CPS Holders who own 50 Westpac CPS or fewer must apply to reinvest all of their Westpac CPS and those who own more than 50 Westpac CPS must apply to reinvest a minimum of 50 Westpac CPS ($5,000)
• Eligible Westpac CPS Holders may apply for additonal Notes if they reinvest all of their Westpac CPS • Priority will be given to Applications received under the Reinvestment Offer, but not to Applications for additional Notes
• A pro-rata dividend of $1.6229 on all Westpac CPS for the period from 1 October 2017 to 13 March 2018 (inclusive), payable on 13 March 2018. This is the last dividend payable on any reinvested Westpac CPS; and
• A final dividend of $0.1782 on Non-participating Westpac CPS for the period from 14 March 2018 to 31 March 2018 (inclusive), payable on 3 April 2018
• All Westpac CPS dividend payments are subject to the satisfaction of the dividend payment test in the Westpac CPS terms
• The Reinvestment Offer is not a simple rollover into a similar investment. The Notes and Westpac CPS have different features and risks, which must be evaluated separately. Eligible Westpac CPS Holders should read the Prospectus in full before deciding whether to apply for Notes
• A comparison of Notes and Westpac CPS is contained on slide 6 of this presentation and in section 3.4 of the Prospectus • If you have any questions about the differences between Notes and Westpac CPS or the Reinvestment Offer, you should seek
advice from your professional adviser before deciding to participate in the Reinvestment Offer and invest in Notes
Reinvestment Offer
Who can participate in the Reinvestment Offer?
Options for Eligible Westpac CPS Holders
Differences between Westpac CPS and Notes
Pro-Rata and Final Dividend
Applications
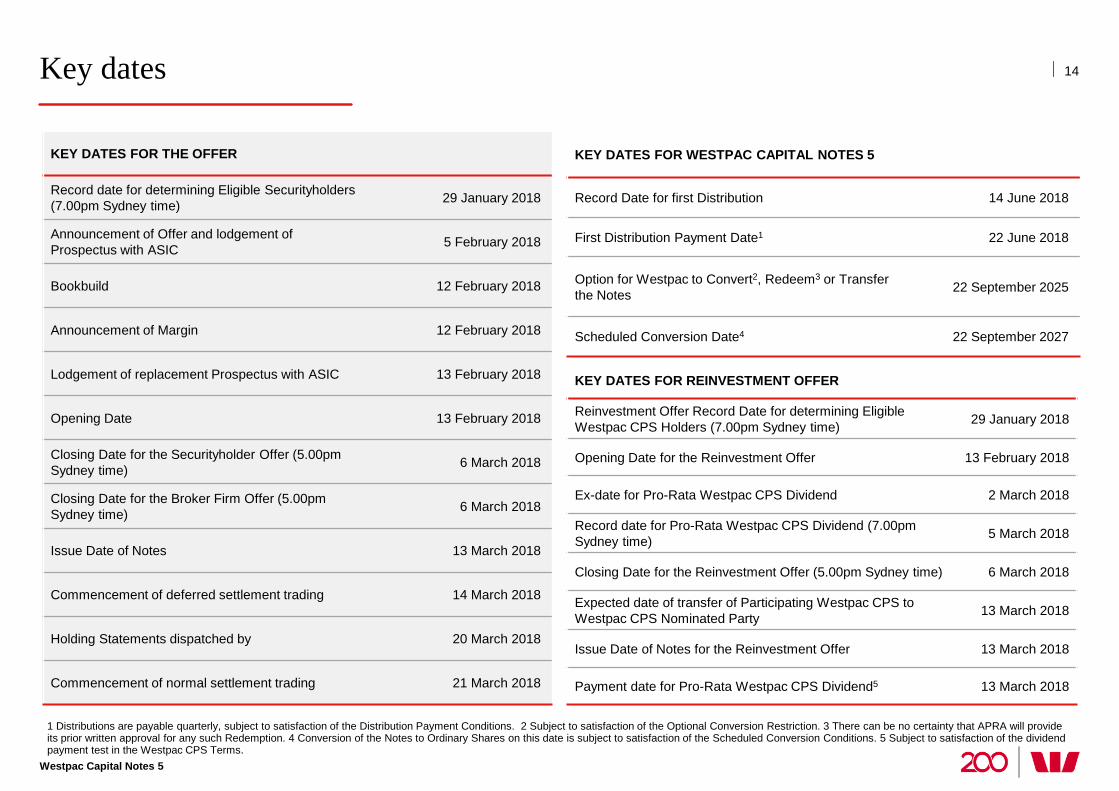
1 Distributions are payable quarterly, subject to satisfaction of the Distribution Payment Conditions. 2 Subject to satisfaction of the Optional Conversion Restriction. 3 There can be no certainty that APRA will provide its prior written approval for any such Redemption. 4 Conversion of the Notes to Ordinary Shares on this date is subject to satisfaction of the Scheduled Conversion Conditions. 5 Subject to satisfaction of the dividend payment test in the Westpac CPS Terms.
14
Westpac Capital Notes 5
Key dates
KEY DATES FOR THE OFFER
Record date for determining Eligible Securityholders (7.00pm Sydney time) 29 January 2018
Announcement of Offer and lodgement of Prospectus with ASIC 5 February 2018
Bookbuild 12 February 2018
Announcement of Margin 12 February 2018
Lodgement of replacement Prospectus with ASIC 13 February 2018
Opening Date 13 February 2018
Closing Date for the Securityholder Offer (5.00pm Sydney time) 6 March 2018
Closing Date for the Broker Firm Offer (5.00pm Sydney time) 6 March 2018
Issue Date of Notes 13 March 2018
Commencement of deferred settlement trading 14 March 2018
Holding Statements dispatched by 20 March 2018
Commencement of normal settlement trading 21 March 2018
KEY DATES FOR REINVESTMENT OFFER
Reinvestment Offer Record Date for determining Eligible Westpac CPS Holders (7.00pm Sydney time) 29 January 2018
Opening Date for the Reinvestment Offer 13 February 2018
Ex-date for Pro-Rata Westpac CPS Dividend 2 March 2018
Record date for Pro-Rata Westpac CPS Dividend (7.00pm Sydney time) 5 March 2018
Closing Date for the Reinvestment Offer (5.00pm Sydney time) 6 March 2018
Expected date of transfer of Participating Westpac CPS to Westpac CPS Nominated Party 13 March 2018
Issue Date of Notes for the Reinvestment Offer 13 March 2018
Payment date for Pro-Rata Westpac CPS Dividend5 13 March 2018
KEY DATES FOR WESTPAC CAPITAL NOTES 5
Record Date for first Distribution 14 June 2018
First Distribution Payment Date1 22 June 2018
Option for Westpac to Convert2, Redeem3 or Transfer the Notes 22 September 2025
Scheduled Conversion Date4 22 September 2027
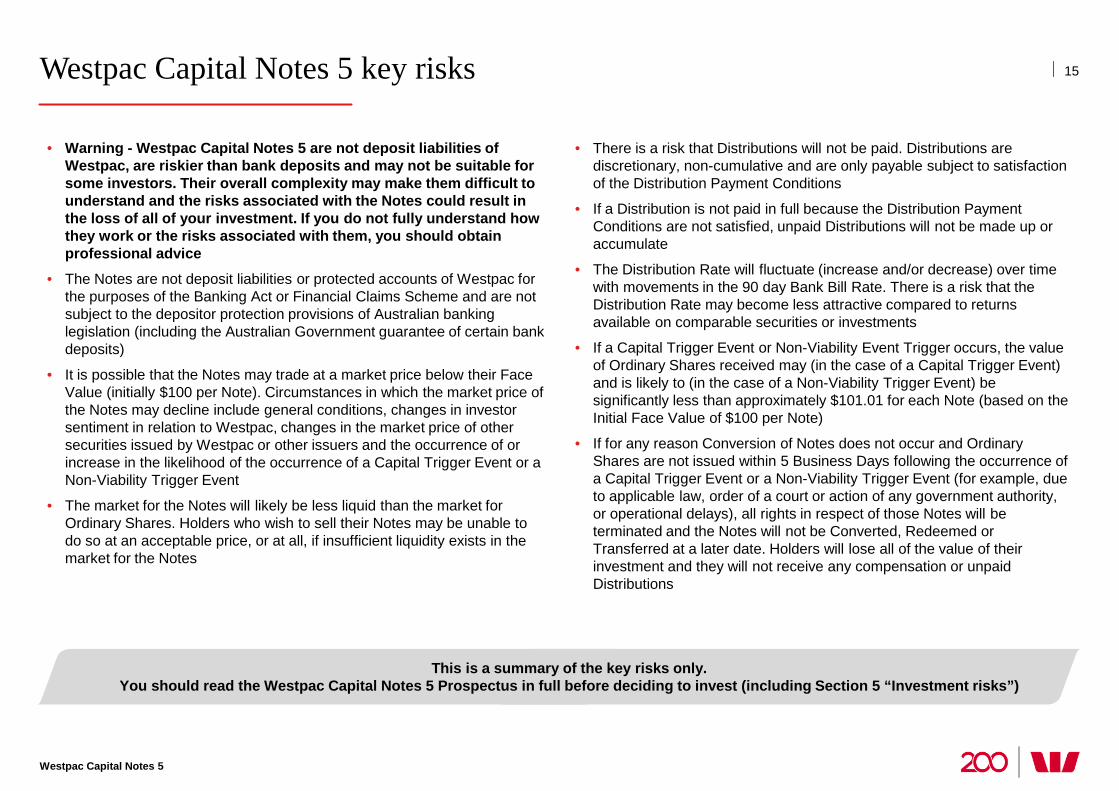
Westpac Capital Notes 5 key risks
• Warning - Westpac Capital Notes 5 are not deposit liabilities of Westpac, are riskier than bank deposits and may not be suitable for some investors. Their overall complexity may make them difficult to understand and the risks associated with the Notes could result in the loss of all of your investment. If you do not fully understand how they work or the risks associated with them, you should obtain professional advice
• The Notes are not deposit liabilities or protected accounts of Westpac for the purposes of the Banking Act or Financial Claims Scheme and are not subject to the depositor protection provisions of Australian banking legislation (including the Australian Government guarantee of certain bank deposits)
• It is possible that the Notes may trade at a market price below their Face Value (initially $100 per Note). Circumstances in which the market price of the Notes may decline include general conditions, changes in investor sentiment in relation to Westpac, changes in the market price of other securities issued by Westpac or other issuers and the occurrence of or increase in the likelihood of the occurrence of a Capital Trigger Event or a Non-Viability Trigger Event
• The market for the Notes will likely be less liquid than the market for Ordinary Shares. Holders who wish to sell their Notes may be unable to do so at an acceptable price, or at all, if insufficient liquidity exists in the market for the Notes
• There is a risk that Distributions will not be paid. Distributions are discretionary, non-cumulative and are only payable subject to satisfaction of the Distribution Payment Conditions
• If a Distribution is not paid in full because the Distribution Payment Conditions are not satisfied, unpaid Distributions will not be made up or accumulate
• The Distribution Rate will fluctuate (increase and/or decrease) over time with movements in the 90 day Bank Bill Rate. There is a risk that the Distribution Rate may become less attractive compared to returns available on comparable securities or investments
• If a Capital Trigger Event or Non-Viability Event Trigger occurs, the value of Ordinary Shares received may (in the case of a Capital Trigger Event) and is likely to (in the case of a Non-Viability Trigger Event) be significantly less than approximately $101.01 for each Note (based on the Initial Face Value of $100 per Note)
• If for any reason Conversion of Notes does not occur and Ordinary Shares are not issued within 5 Business Days following the occurrence of a Capital Trigger Event or a Non-Viability Trigger Event (for example, due to applicable law, order of a court or action of any government authority, or operational delays), all rights in respect of those Notes will be terminated and the Notes will not be Converted, Redeemed or Transferred at a later date. Holders will lose all of the value of their investment and they will not receive any compensation or unpaid Distributions
15
Westpac Capital Notes 5
This is a summary of the key risks only. You should read the Westpac Capital Notes 5 Prospectus in full before deciding to invest (including Section 5 “Investment risks”)
Westpac Capital Notes 5 key risks (continued)
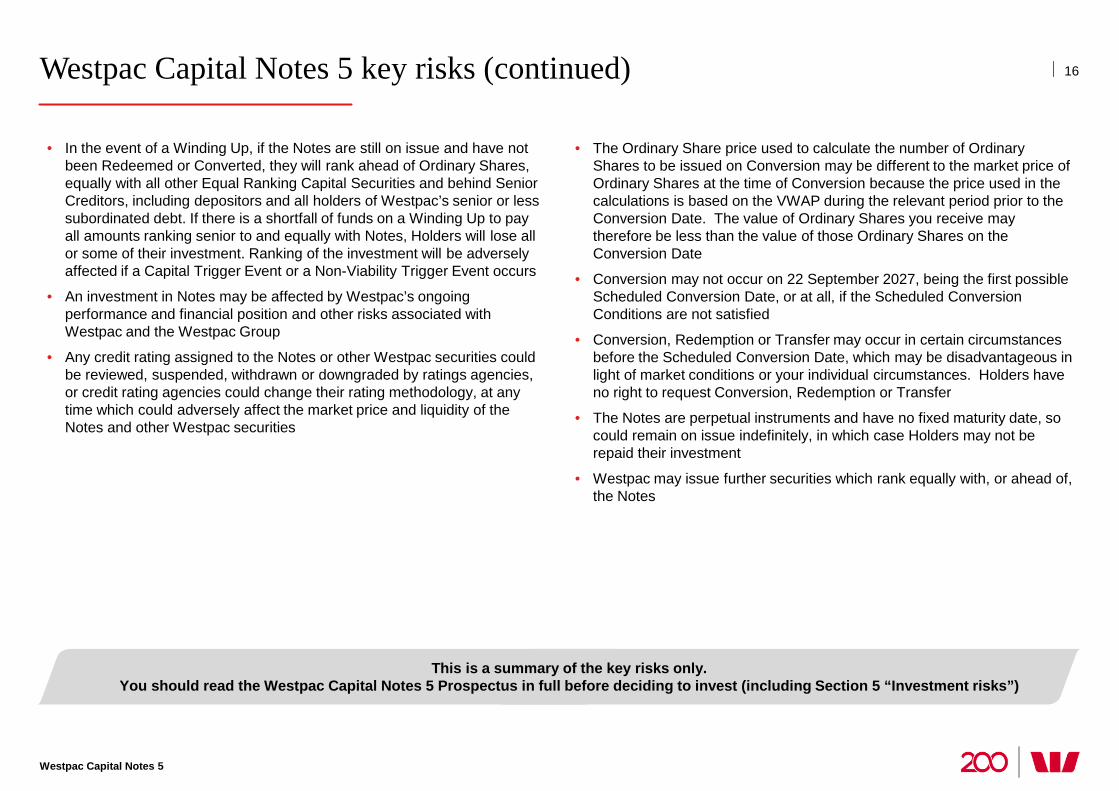
• In the event of a Winding Up, if the Notes are still on issue and have not been Redeemed or Converted, they will rank ahead of Ordinary Shares, equally with all other Equal Ranking Capital Securities and behind Senior Creditors, including depositors and all holders of Westpac’s senior or less subordinated debt. If there is a shortfall of funds on a Winding Up to pay all amounts ranking senior to and equally with Notes, Holders will lose all or some of their investment. Ranking of the investment will be adversely affected if a Capital Trigger Event or a Non-Viability Trigger Event occurs
• An investment in Notes may be affected by Westpac’s ongoing performance and financial position and other risks associated with Westpac and the Westpac Group
• Any credit rating assigned to the Notes or other Westpac securities could be reviewed, suspended, withdrawn or downgraded by ratings agencies, or credit rating agencies could change their rating methodology, at any time which could adversely affect the market price and liquidity of the Notes and other Westpac securities
• The Ordinary Share price used to calculate the number of Ordinary Shares to be issued on Conversion may be different to the market price of Ordinary Shares at the time of Conversion because the price used in the calculations is based on the VWAP during the relevant period prior to the Conversion Date. The value of Ordinary Shares you receive may therefore be less than the value of those Ordinary Shares on the Conversion Date
• Conversion may not occur on 22 September 2027, being the first possible Scheduled Conversion Date, or at all, if the Scheduled Conversion Conditions are not satisfied
• Conversion, Redemption or Transfer may occur in certain circumstances before the Scheduled Conversion Date, which may be disadvantageous in light of market conditions or your individual circumstances. Holders have no right to request Conversion, Redemption or Transfer
• The Notes are perpetual instruments and have no fixed maturity date, so could remain on issue indefinitely, in which case Holders may not be repaid their investment
• Westpac may issue further securities which rank equally with, or ahead of, the Notes
16
Westpac Capital Notes 5
This is a summary of the key risks only. You should read the Westpac Capital Notes 5 Prospectus in full before deciding to invest (including Section 5 “Investment risks”)

200 years proudly supporting Australia
Information on Westpac Banking Corporation
All amounts are in Australian dollars unless otherwise indicated
Full Year 2017 financial performance
Westpac Capital Notes 5
18
19
31
73
30 22 24
16 12 12 17 13
0
20
40
60
80
100
FY07 FY08 FY09 FY10 FY11 FY12 FY13 FY14 FY15 FY16 FY17
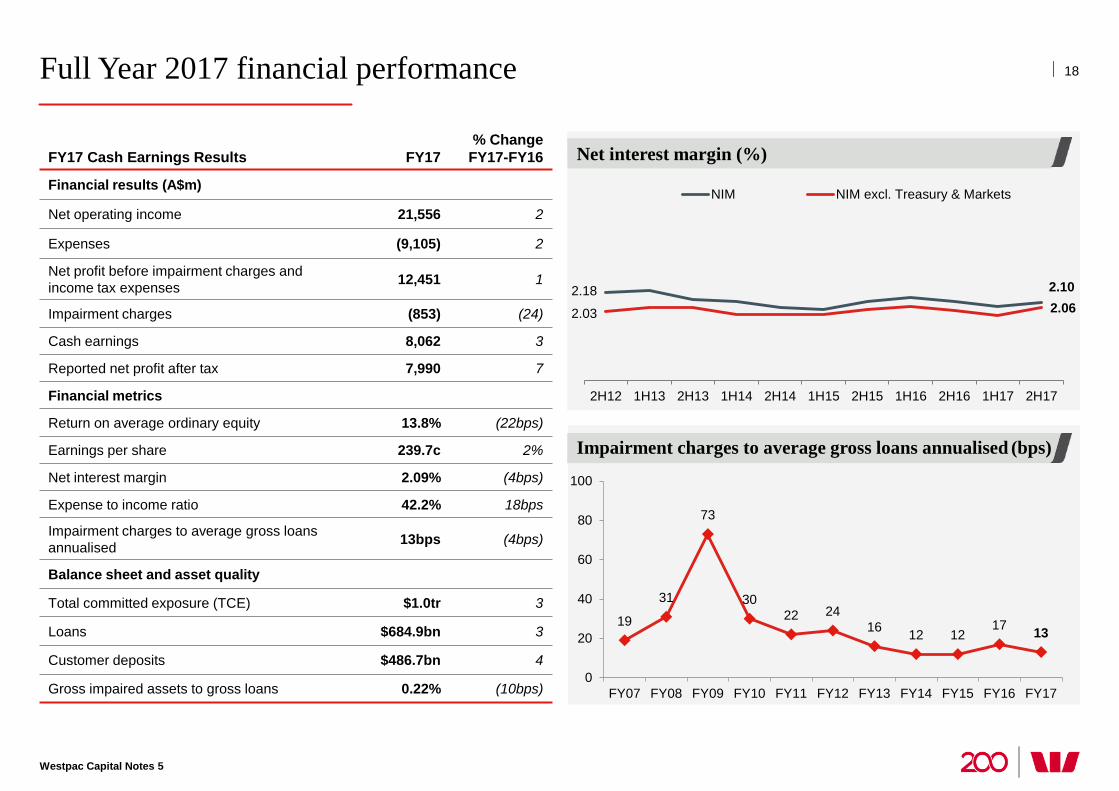
FY17 Cash Earnings Results FY17 % Change
FY17-FY16
Financial results (A$m)
Net operating income 21,556 2
Expenses (9,105) 2
Net profit before impairment charges and income tax expenses 12,451 1
Impairment charges (853) (24)
Cash earnings 8,062 3
Reported net profit after tax 7,990 7
Financial metrics
Return on average ordinary equity 13.8% (22bps)
Earnings per share 239.7c 2%
Net interest margin 2.09% (4bps)
Expense to income ratio 42.2% 18bps
Impairment charges to average gross loans annualised 13bps (4bps)
Balance sheet and asset quality
Total committed exposure (TCE) $1.0tr 3
Loans $684.9bn 3
Customer deposits $486.7bn 4
Gross impaired assets to gross loans 0.22% (10bps)
Impairment charges to average gross loans annualised (bps)
Net interest margin (%)
2.18 2.10
2.03 2.06
2H12 1H13 2H13 1H14 2H14 1H15 2H15 1H16 2H16 1H17 2H17
NIM NIM excl. Treasury & Markets
Well progressed on FY18 term funding
1 Based on residual maturity and FX spot currency translation. Includes all debt issuance with contractual maturity greater than 370 days excluding US Commercial Paper and Yankee Certificates of Deposit. 2 Westpac public benchmark transactions only. 3 Contractual maturity date for hybrids and callable subordinated instruments is the first scheduled conversion date or call date for the purposes of this disclosure. 4 Tenor excludes RMBS and ABS. 5 Perpetual sub-debt has been included in >FY22 maturity bucket. Maturities exclude securitisation amortisation.
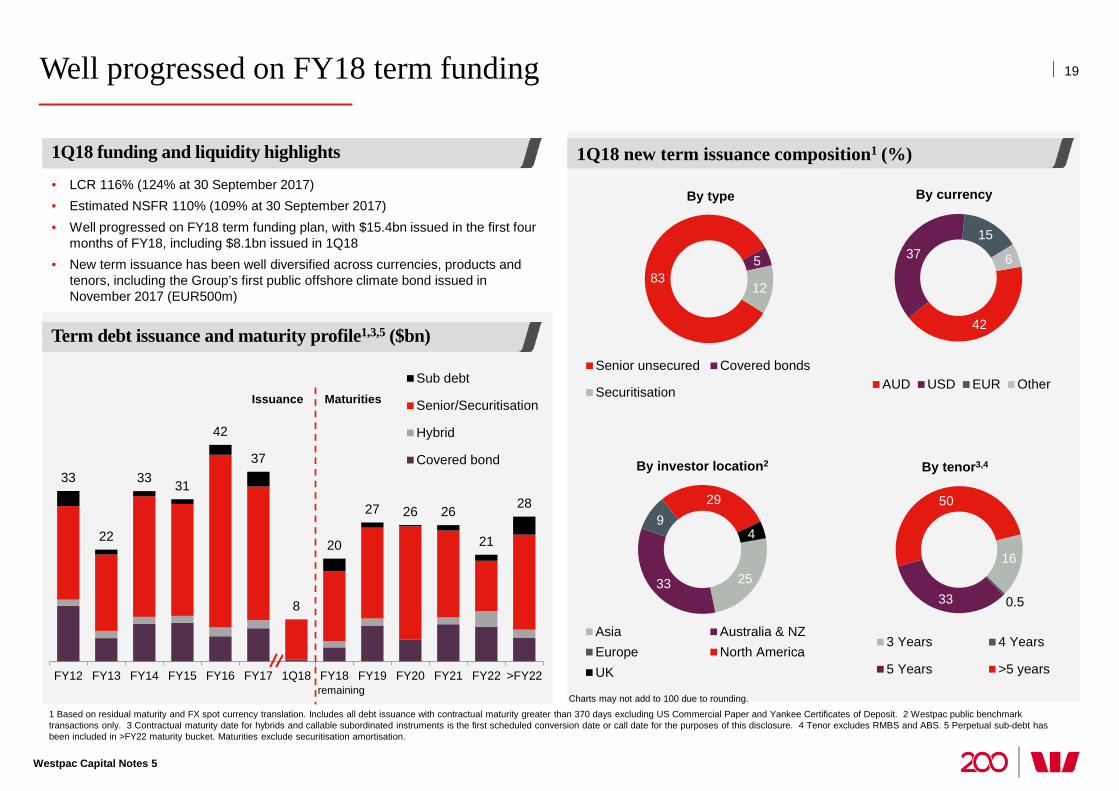
83 5
12
By type
Senior unsecured Covered bonds
Securitisation
25 33
9 29
4
By investor location2
Asia Australia & NZEurope North AmericaUK
42
37 15
6
By currency
AUD USD EUR Other
16
0.5 33
50
By tenor3,4
3 Years 4 Years
5 Years >5 years
33
22
33 31
42
37
8
20
27 26 26
21
28
FY12 FY13 FY14 FY15 FY16 FY17 1Q18 FY18 FY19 FY20 FY21 FY22 >FY22
Sub debt
Senior/Securitisation
Hybrid
Covered bond
Issuance Maturities
Charts may not add to 100 due to rounding. remaining
1Q18 new term issuance composition1 (%)
Term debt issuance and maturity profile1,3,5 ($bn)
1Q18 funding and liquidity highlights
• LCR 116% (124% at 30 September 2017) • Estimated NSFR 110% (109% at 30 September 2017) • Well progressed on FY18 term funding plan, with $15.4bn issued in the first four
months of FY18, including $8.1bn issued in 1Q18 • New term issuance has been well diversified across currencies, products and
tenors, including the Group’s first public offshore climate bond issued in November 2017 (EUR500m)
19
Westpac Capital Notes 5
Impaired assets and stressed assets lower
Westpac Capital Notes 5
20
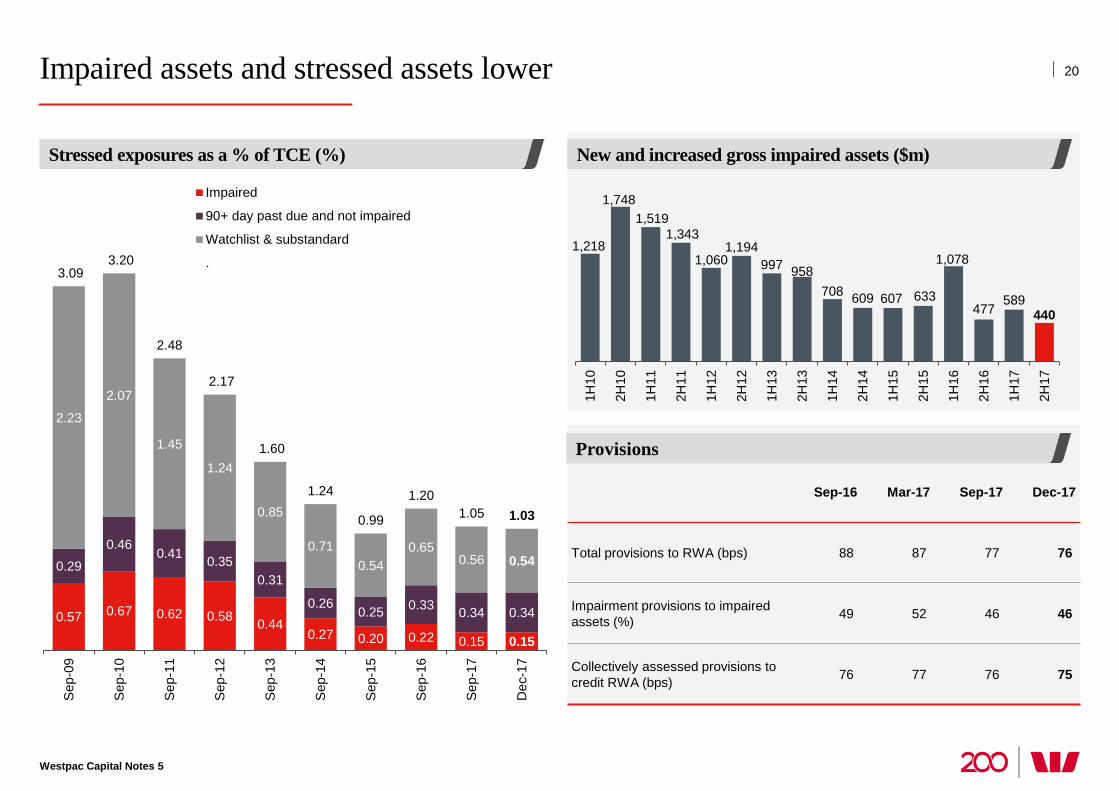
0.57 0.67 0.62 0.58 0.44 0.27 0.20 0.22 0.15 0.15
0.29 0.46
0.41 0.35 0.31
0.26 0.25 0.33 0.34 0.34
2.23
2.07
1.45
1.24
0.85
0.71 0.54
0.65 0.56 0.54
3.09 3.20
2.48
2.17
1.60
1.24
0.99
1.20 1.05 1.03
Sep
-09
Sep
-10
Sep
-11
Sep
-12
Sep
-13
Sep
-14
Sep
-15
Sep
-16
Sep
-17
Dec
-17
Impaired
90+ day past due and not impaired
Watchlist & substandard
.1,218
1,748 1,519
1,343
1,060 1,194
997 958 708 609 607 633
1,078
477 589
440
1H10
2H10
1H11
2H11
1H12
2H12
1H13
2H13
1H14
2H14
1H15
2H15
1H16
2H16
1H17
2H17
Sep-16 Mar-17 Sep-17 Dec-17
Total provisions to RWA (bps) 88 87 77 76
Impairment provisions to impaired assets (%) 49 52 46 46
Collectively assessed provisions to credit RWA (bps) 76 77 76 75
Stressed exposures as a % of TCE (%) New and increased gross impaired assets ($m)
Provisions
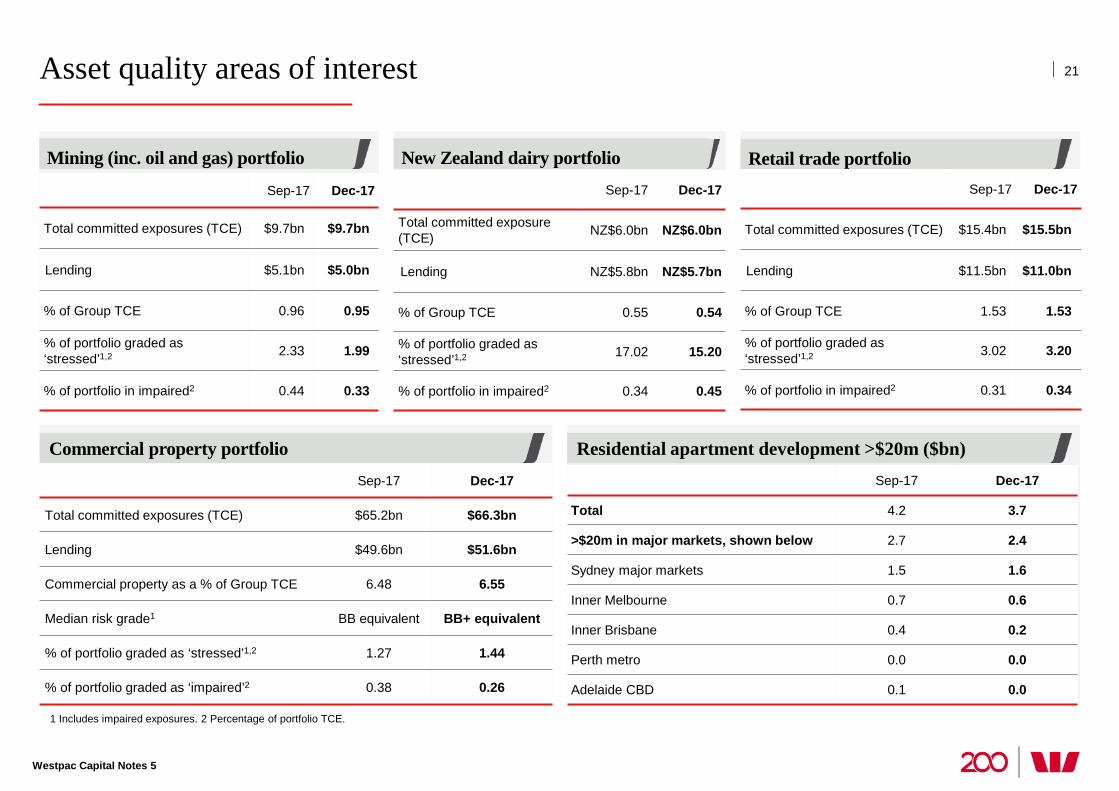
Asset quality areas of interest
1 Includes impaired exposures. 2 Percentage of portfolio TCE.
Sep-17 Dec-17
Total committed exposure (TCE) NZ$6.0bn NZ$6.0bn
Lending NZ$5.8bn NZ$5.7bn
% of Group TCE 0.55 0.54
% of portfolio graded as ‘stressed’1,2 17.02 15.20
% of portfolio in impaired2 0.34 0.45
Sep-17 Dec-17
Total committed exposures (TCE) $9.7bn $9.7bn
Lending $5.1bn $5.0bn
% of Group TCE 0.96 0.95
% of portfolio graded as ‘stressed’1,2 2.33 1.99
% of portfolio in impaired2 0.44 0.33
Residential apartment development >$20m ($bn) Commercial property portfolio Sep-17 Dec-17
Total committed exposures (TCE) $65.2bn $66.3bn
Lending $49.6bn $51.6bn
Commercial property as a % of Group TCE 6.48 6.55
Median risk grade1 BB equivalent BB+ equivalent
% of portfolio graded as ‘stressed’1,2 1.27 1.44
% of portfolio graded as ‘impaired’2 0.38 0.26
Sep-17 Dec-17
Total 4.2 3.7
>$20m in major markets, shown below 2.7 2.4
Sydney major markets 1.5 1.6
Inner Melbourne 0.7 0.6
Inner Brisbane 0.4 0.2
Perth metro 0.0 0.0
Adelaide CBD 0.1 0.0
Mining (inc. oil and gas) portfolio New Zealand dairy portfolio Retail trade portfolio Sep-17 Dec-17
Total committed exposures (TCE) $15.4bn $15.5bn
Lending $11.5bn $11.0bn
% of Group TCE 1.53 1.53
% of portfolio graded as ‘stressed’1,2 3.02 3.20
% of portfolio in impaired2 0.31 0.34
21
Westpac Capital Notes 5
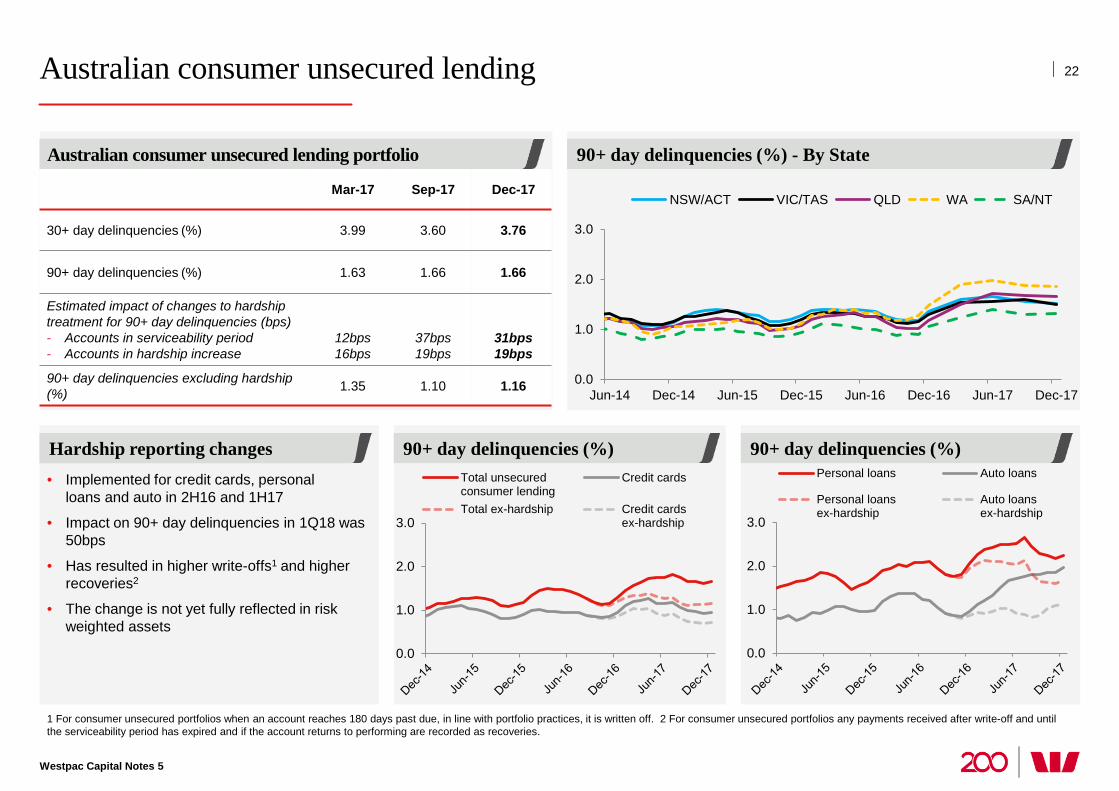
90+ day delinquencies (%) 90+ day delinquencies (%)
Australian consumer unsecured lending
1 For consumer unsecured portfolios when an account reaches 180 days past due, in line with portfolio practices, it is written off. 2 For consumer unsecured portfolios any payments received after write-off and until the serviceability period has expired and if the account returns to performing are recorded as recoveries.
Hardship reporting changes
Mar-17 Sep-17 Dec-17
30+ day delinquencies (%) 3.99 3.60 3.76
90+ day delinquencies (%) 1.63 1.66 1.66
Estimated impact of changes to hardship treatment for 90+ day delinquencies (bps) - Accounts in serviceability period - Accounts in hardship increase
12bps 16bps
37bps 19bps
31bps 19bps
90+ day delinquencies excluding hardship (%) 1.35 1.10 1.16
90+ day delinquencies (%) - By State Australian consumer unsecured lending portfolio
• Implemented for credit cards, personal loans and auto in 2H16 and 1H17
• Impact on 90+ day delinquencies in 1Q18 was 50bps
• Has resulted in higher write-offs1 and higher recoveries2
• The change is not yet fully reflected in risk weighted assets
0.0
1.0
2.0
3.0
Total unsecuredconsumer lending
Credit cards
Total ex-hardship Credit cardsex-hardship
0.0
1.0
2.0
3.0
Personal loans Auto loans
Personal loansex-hardship
Auto loansex-hardship
0.0
1.0
2.0
3.0
Jun-14 Dec-14 Jun-15 Dec-15 Jun-16 Dec-16 Jun-17 Dec-17
NSW/ACT VIC/TAS QLD WA SA/NT
Westpac Capital Notes 5
22
0.0
1.0
2.0
3.0
Jun-14 Dec-14 Jun-15 Dec-15 Jun-16 Dec-16 Jun-17 Dec-17
NSW/ACT VIC/TAS QLD
WA SA/NT ALL
0.0
1.0
2.0
3.0
Jun-14 Dec-14 Jun-15 Dec-15 Jun-16 Dec-16 Jun-17 Dec-17
90+ day past due total 90+ day past due investor
30+ day past due total Loss rates
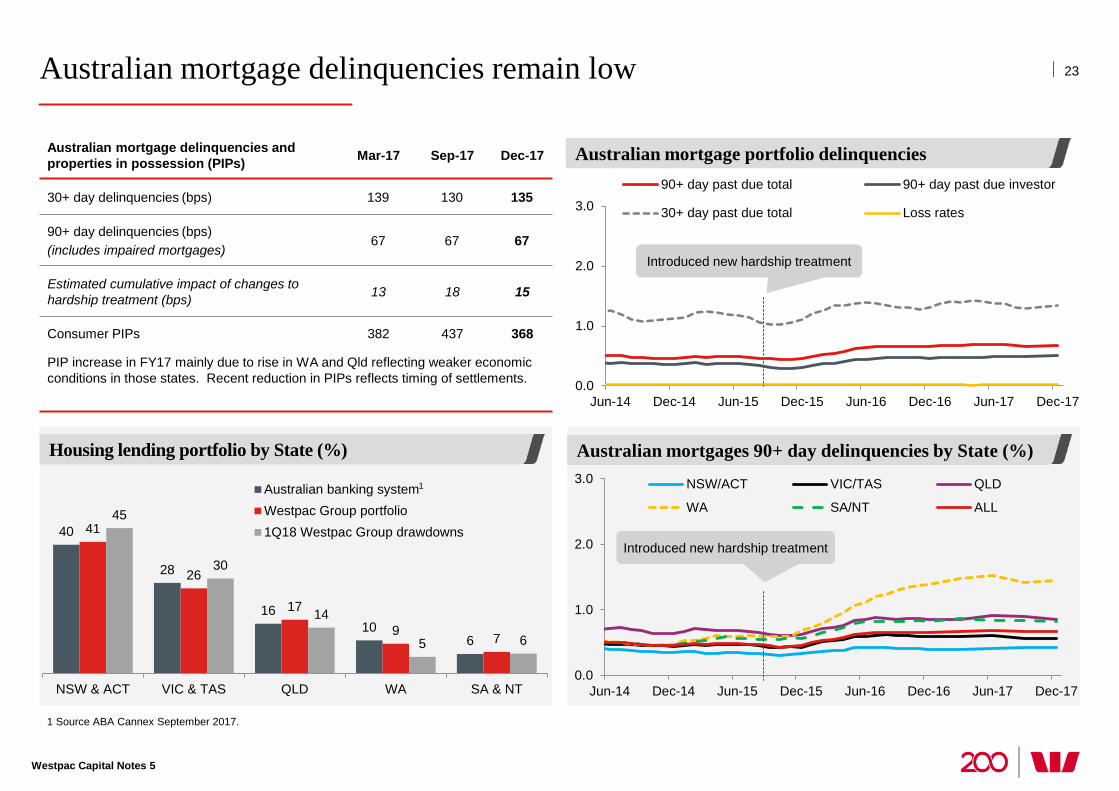
Australian mortgage delinquencies remain low
Australian mortgage delinquencies and properties in possession (PIPs) Mar-17 Sep-17 Dec-17
30+ day delinquencies (bps) 139 130 135
90+ day delinquencies (bps) (includes impaired mortgages)
67 67 67
Estimated cumulative impact of changes to hardship treatment (bps) 13 18 15
Consumer PIPs 382 437 368
PIP increase in FY17 mainly due to rise in WA and Qld reflecting weaker economic conditions in those states. Recent reduction in PIPs reflects timing of settlements.
1 Source ABA Cannex September 2017.
Australian mortgage portfolio delinquencies
Introduced new hardship treatment
Housing lending portfolio by State (%)
1
Housing lending portfolio by State (%) Australian mortgages 90+ day delinquencies by State (%)
Introduced new hardship treatment 40
28
16 10
6
41
26
17
9 7
45
30
14
5 6
NSW & ACT VIC & TAS QLD WA SA & NT
Australian banking systemWestpac Group portfolio1Q18 Westpac Group drawdowns
Westpac Capital Notes 5
23
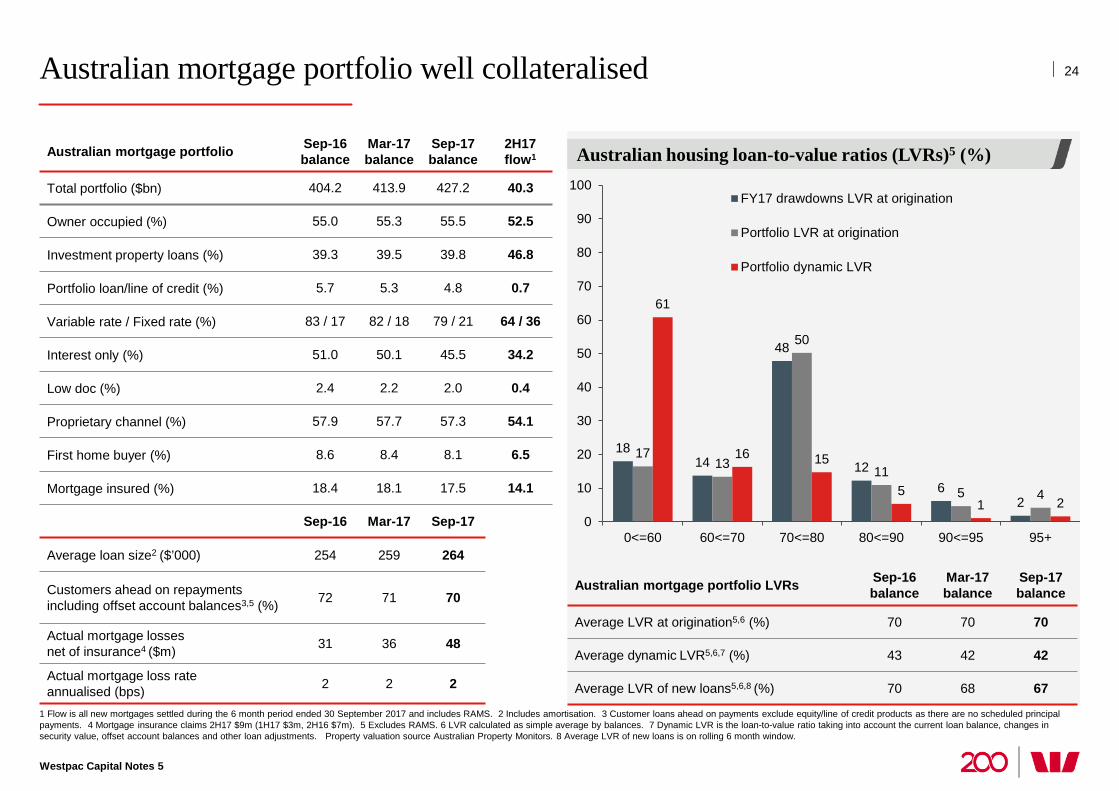
Australian mortgage portfolio well collateralised
Westpac Capital Notes 5
Australian mortgage portfolio Sep-16 balance
Mar-17 balance
Sep-17 balance
2H17 flow1
Total portfolio ($bn) 404.2 413.9 427.2 40.3
Owner occupied (%) 55.0 55.3 55.5 52.5
Investment property loans (%) 39.3 39.5 39.8 46.8
Portfolio loan/line of credit (%) 5.7 5.3 4.8 0.7
Variable rate / Fixed rate (%) 83 / 17 82 / 18 79 / 21 64 / 36
Interest only (%) 51.0 50.1 45.5 34.2
Low doc (%) 2.4 2.2 2.0 0.4
Proprietary channel (%) 57.9 57.7 57.3 54.1
First home buyer (%) 8.6 8.4 8.1 6.5
Mortgage insured (%) 18.4 18.1 17.5 14.1
Sep-16 Mar-17 Sep-17
Average loan size2 ($’000) 254 259 264
Customers ahead on repayments including offset account balances3,5 (%) 72 71 70
Actual mortgage losses net of insurance4 ($m) 31 36 48
Actual mortgage loss rate
annualised (bps) 2 2 2
18 14
48
12 6
2
17 13
50
11 5 4
61
16 15
5 1 2
0
10
20
30
40
50
60
70
80
90
100
0<=60 60<=70 70<=80 80<=90 90<=95 95+
FY17 drawdowns LVR at origination
Portfolio LVR at origination
Portfolio dynamic LVR
24
1 Flow is all new mortgages settled during the 6 month period ended 30 September 2017 and includes RAMS. 2 Includes amortisation. 3 Customer loans ahead on payments exclude equity/line of credit products as there are no scheduled principal payments. 4 Mortgage insurance claims 2H17 $9m (1H17 $3m, 2H16 $7m). 5 Excludes RAMS. 6 LVR calculated as simple average by balances. 7 Dynamic LVR is the loan-to-value ratio taking into account the current loan balance, changes in security value, offset account balances and other loan adjustments. Property valuation source Australian Property Monitors. 8 Average LVR of new loans is on rolling 6 month window.
Australian housing loan-to-value ratios (LVRs)5 (%)
Australian mortgage portfolio LVRs Sep-16 balance
Mar-17 balance
Sep-17 balance
Average LVR at origination5,6 (%) 70 70 70
Average dynamic LVR5,6,7 (%) 43 42 42
Average LVR of new loans5,6,8 (%) 70 68 67
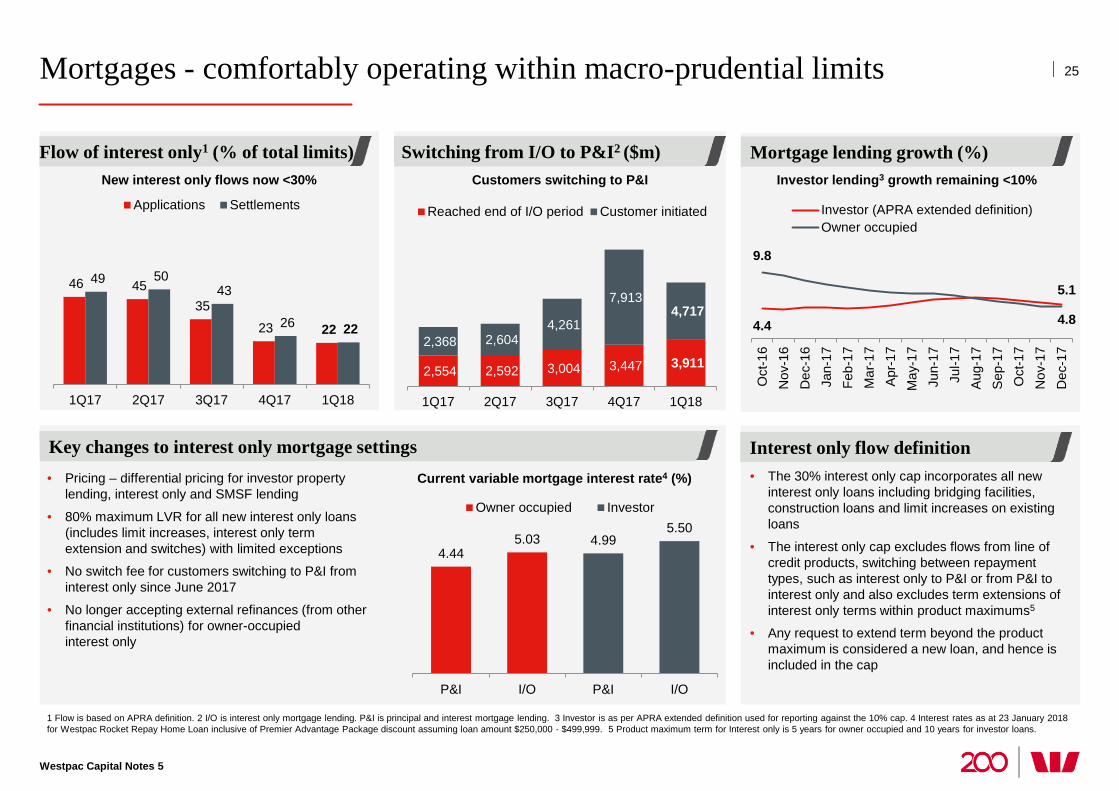
Mortgages - comfortably operating within macro-prudential limits
1 Flow is based on APRA definition. 2 I/O is interest only mortgage lending. P&I is principal and interest mortgage lending. 3 Investor is as per APRA extended definition used for reporting against the 10% cap. 4 Interest rates as at 23 January 2018 for Westpac Rocket Repay Home Loan inclusive of Premier Advantage Package discount assuming loan amount $250,000 - $499,999. 5 Product maximum term for Interest only is 5 years for owner occupied and 10 years for investor loans.
Mortgage lending growth (%)
Interest only flow definition
Switching from I/O to P&I2 ($m)
• The 30% interest only cap incorporates all new interest only loans including bridging facilities, construction loans and limit increases on existing loans
• The interest only cap excludes flows from line of credit products, switching between repayment types, such as interest only to P&I or from P&I to interest only and also excludes term extensions of interest only terms within product maximums5
• Any request to extend term beyond the product maximum is considered a new loan, and hence is included in the cap
Flow of interest only1 (% of total limits)
• Pricing – differential pricing for investor property lending, interest only and SMSF lending
• 80% maximum LVR for all new interest only loans (includes limit increases, interest only term extension and switches) with limited exceptions
• No switch fee for customers switching to P&I from interest only since June 2017
• No longer accepting external refinances (from other financial institutions) for owner-occupied interest only
Key changes to interest only mortgage settings
4.44 5.03 4.99
5.50
P&I I/O P&I I/O
Owner occupied Investor
Current variable mortgage interest rate4 (%)
New interest only flows now <30% Customers switching to P&I Investor lending3 growth remaining <10%
46 45 35
23 22
49 50 43
26 22
1Q17 2Q17 3Q17 4Q17 1Q18
Applications Settlements
2,554 2,592 3,004 3,447 3,911 2,368 2,604
4,261
7,913 4,717
1Q17 2Q17 3Q17 4Q17 1Q18
Reached end of I/O period Customer initiated
4.4
5.1
9.8
4.8
Oct
-16
Nov
-16
Dec
-16
Jan-
17Fe
b-17
Mar
-17
Apr
-17
May
-17
Jun-
17Ju
l-17
Aug
-17
Sep
-17
Oct
-17
Nov
-17
Dec
-17
Investor (APRA extended definition)Owner occupied
Westpac Capital Notes 5
25
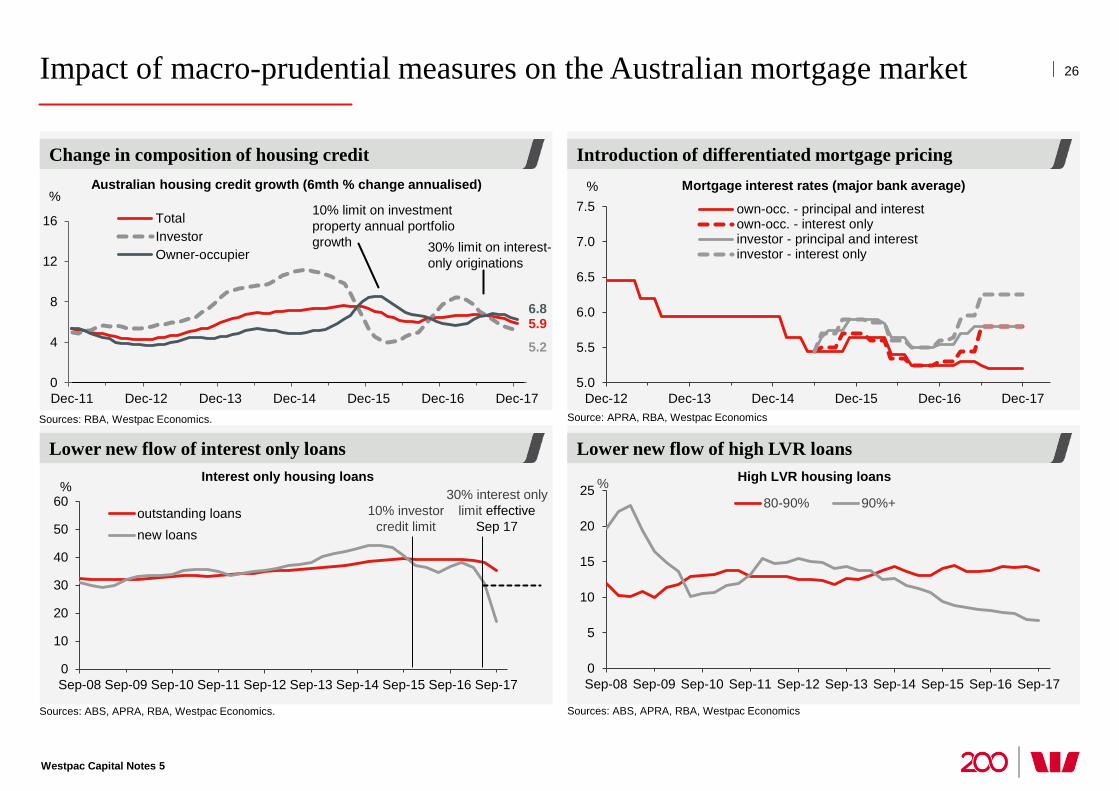
Impact of macro-prudential measures on the Australian mortgage market
Westpac Capital Notes 5
Introduction of differentiated mortgage pricing
Lower new flow of high LVR loans
Change in composition of housing credit
Lower new flow of interest only loans
26
Sources: RBA, Westpac Economics.
5.9
5.2
6.8
0
4
8
12
16
Dec-11 Dec-12 Dec-13 Dec-14 Dec-15 Dec-16 Dec-17
TotalInvestorOwner-occupier
Sources: ABS, APRA, RBA, Westpac Economics. Sources: ABS, APRA, RBA, Westpac Economics
Source: APRA, RBA, Westpac Economics
Australian housing credit growth (6mth % change annualised)
High LVR housing loans
5.0
5.5
6.0
6.5
7.0
7.5
Dec-12 Dec-13 Dec-14 Dec-15 Dec-16 Dec-17
%
own-occ. - principal and interestown-occ. - interest onlyinvestor - principal and interestinvestor - interest only
Mortgage interest rates (major bank average)
10% limit on investment property annual portfolio growth 30% limit on interest-
only originations
0
10
20
30
40
50
60
Sep-08 Sep-09 Sep-10 Sep-11 Sep-12 Sep-13 Sep-14 Sep-15 Sep-16 Sep-17
%
outstanding loansnew loans
30% interest only limit effective
Sep 17 10% investor
credit limit
%
0
5
10
15
20
25
Sep-08 Sep-09 Sep-10 Sep-11 Sep-12 Sep-13 Sep-14 Sep-15 Sep-16 Sep-17
% 80-90% 90%+
Interest only housing loans
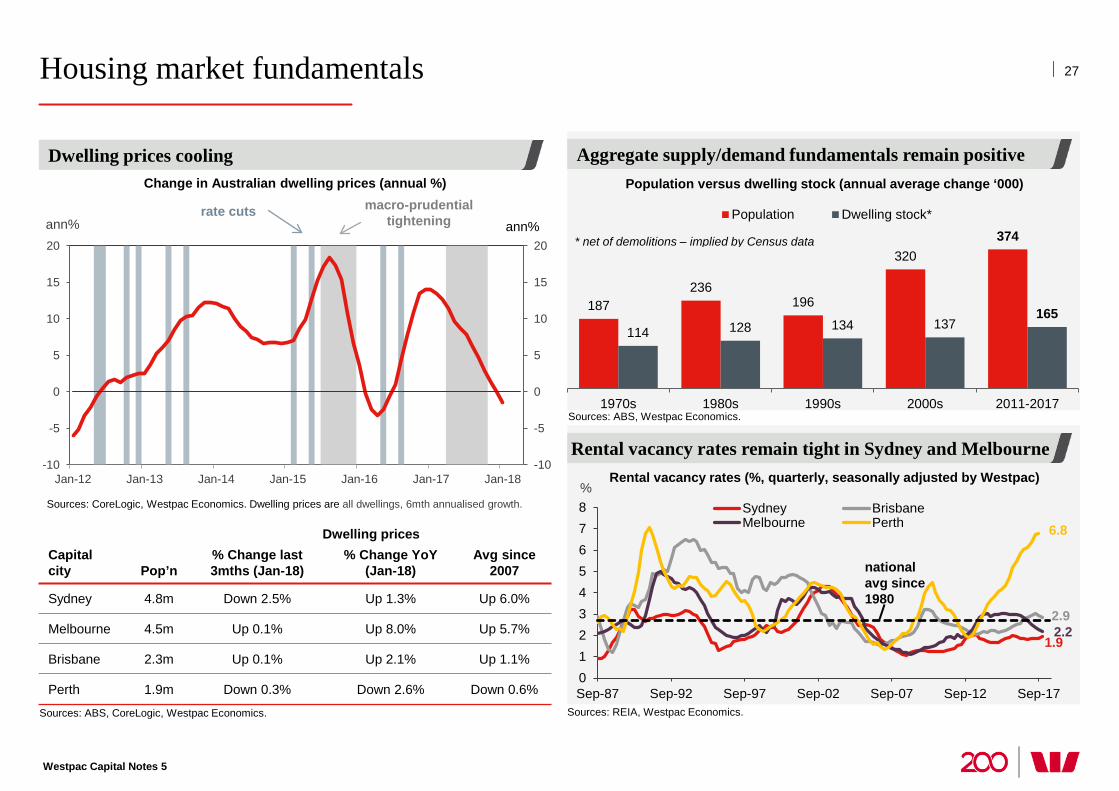
Housing market fundamentals
Westpac Capital Notes 5
Rental vacancy rates remain tight in Sydney and Melbourne
187 236
196
320 374
114 128 134 137 165
1970s 1980s 1990s 2000s 2011-2017
Population Dwelling stock*
* net of demolitions – implied by Census data
Aggregate supply/demand fundamentals remain positive
27
Sources: ABS, Westpac Economics.
Dwelling prices cooling Population versus dwelling stock (annual average change ‘000)
Sources: REIA, Westpac Economics.
Rental vacancy rates (%, quarterly, seasonally adjusted by Westpac)
1.9
2.9 2.2
6.8
012345678
Sep-87 Sep-92 Sep-97 Sep-02 Sep-07 Sep-12 Sep-17
% Sydney BrisbaneMelbourne Perth
national avg since 1980
Dwelling prices Capital city Pop’n
% Change last 3mths (Jan-18)
% Change YoY (Jan-18)
Avg since 2007
Sydney 4.8m Down 2.5% Up 1.3% Up 6.0%
Melbourne 4.5m Up 0.1% Up 8.0% Up 5.7%
Brisbane 2.3m Up 0.1% Up 2.1% Up 1.1%
Perth 1.9m Down 0.3% Down 2.6% Down 0.6%
-10
-5
0
5
10
15
20
-10
-5
0
5
10
15
20
Jan-12 Jan-13 Jan-14 Jan-15 Jan-16 Jan-17 Jan-18
ann% ann%
Sources: ABS, CoreLogic, Westpac Economics.
Sources: CoreLogic, Westpac Economics. Dwelling prices are all dwellings, 6mth annualised growth.
macro-prudential tightening
rate cuts
Change in Australian dwelling prices (annual %)
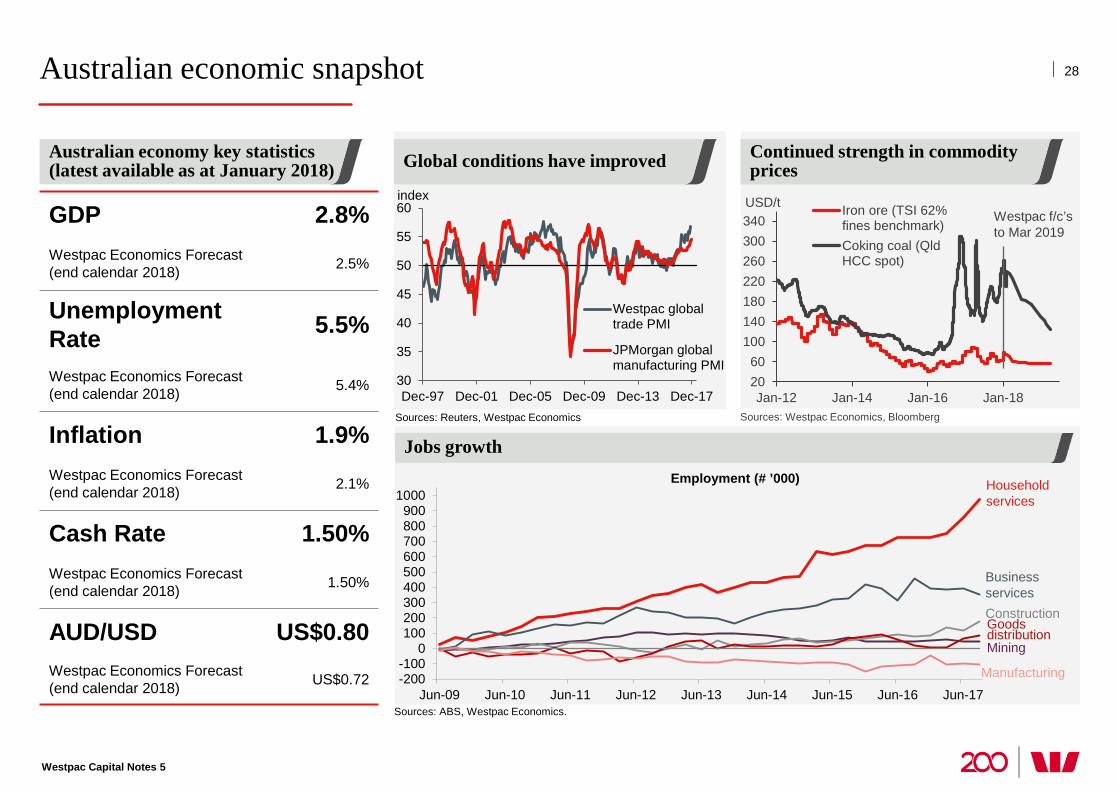
Australian economic snapshot
Australian economy key statistics (latest available as at January 2018)
-200-100
0100200300400500600700800900
1000
Jun-09 Jun-10 Jun-11 Jun-12 Jun-13 Jun-14 Jun-15 Jun-16 Jun-17Sources: ABS, Westpac Economics.
Jobs growth Employment (# ’000) Household
services
Business services
Mining
Construction Goods distribution
Manufacturing
Sources: Reuters, Westpac Economics
30
35
40
45
50
55
60
Dec-97 Dec-01 Dec-05 Dec-09 Dec-13 Dec-17
Westpac globaltrade PMI
JPMorgan globalmanufacturing PMI
index
28
Westpac Capital Notes 5
Continued strength in commodity prices Global conditions have improved
Sources: Westpac Economics, Bloomberg
GDP 2.8% Westpac Economics Forecast (end calendar 2018) 2.5%
Unemployment Rate 5.5%
Westpac Economics Forecast (end calendar 2018) 5.4%
Inflation 1.9% Westpac Economics Forecast (end calendar 2018) 2.1%
Cash Rate 1.50% Westpac Economics Forecast (end calendar 2018) 1.50%
AUD/USD US$0.80 Westpac Economics Forecast (end calendar 2018) US$0.72
2060
100140180220260300340
Jan-12 Jan-14 Jan-16 Jan-18
USD/t Iron ore (TSI 62%fines benchmark)Coking coal (QldHCC spot)
Westpac f/c’s to Mar 2019
200 years proudly supporting Australia
Additional information and appendices
All amounts are in Australian dollars unless otherwise indicated
1 There can be no certainty that APRA will provide its prior written approval for any such Redemption.
30
Westpac Capital Notes 5
Appendix 1: Westpac Capital Notes 5 Additional Information
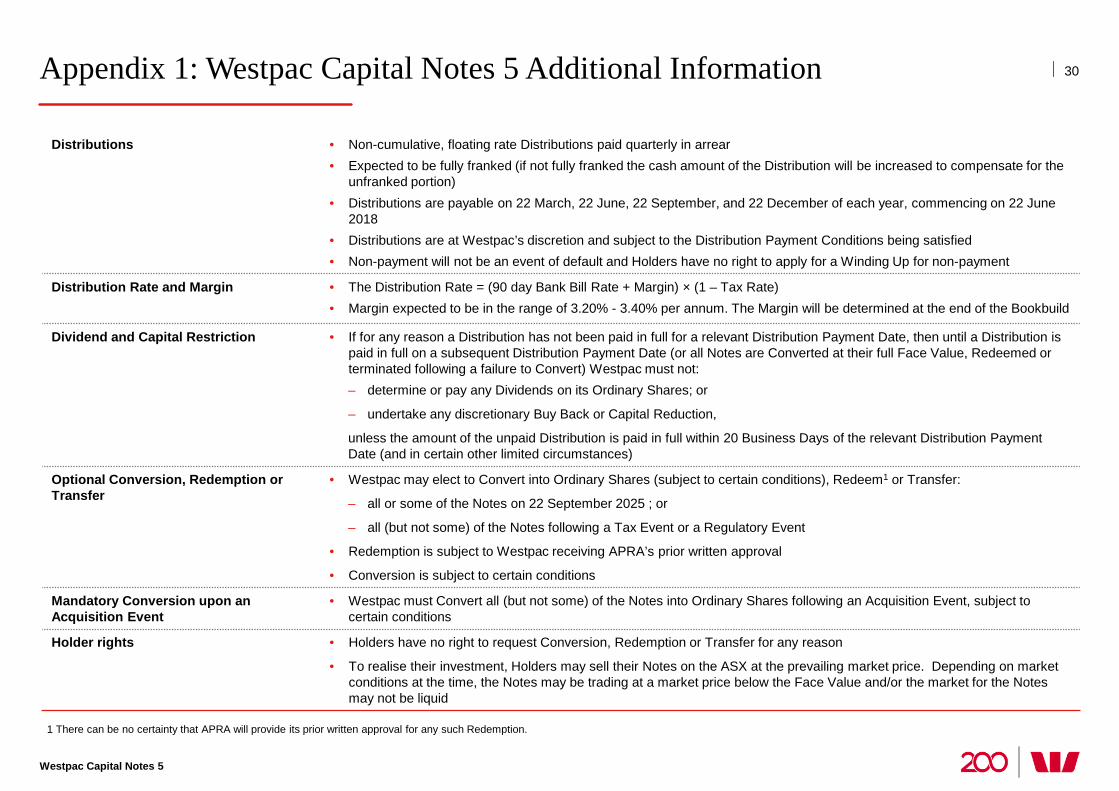
Distributions • Non-cumulative, floating rate Distributions paid quarterly in arrear • Expected to be fully franked (if not fully franked the cash amount of the Distribution will be increased to compensate for the
unfranked portion) • Distributions are payable on 22 March, 22 June, 22 September, and 22 December of each year, commencing on 22 June
2018 • Distributions are at Westpac’s discretion and subject to the Distribution Payment Conditions being satisfied • Non-payment will not be an event of default and Holders have no right to apply for a Winding Up for non-payment
Distribution Rate and Margin • The Distribution Rate = (90 day Bank Bill Rate + Margin) × (1 – Tax Rate) • Margin expected to be in the range of 3.20% - 3.40% per annum. The Margin will be determined at the end of the Bookbuild
Dividend and Capital Restriction • If for any reason a Distribution has not been paid in full for a relevant Distribution Payment Date, then until a Distribution is paid in full on a subsequent Distribution Payment Date (or all Notes are Converted at their full Face Value, Redeemed or terminated following a failure to Convert) Westpac must not: – determine or pay any Dividends on its Ordinary Shares; or
– undertake any discretionary Buy Back or Capital Reduction,
unless the amount of the unpaid Distribution is paid in full within 20 Business Days of the relevant Distribution Payment Date (and in certain other limited circumstances)
Optional Conversion, Redemption or Transfer
• Westpac may elect to Convert into Ordinary Shares (subject to certain conditions), Redeem1 or Transfer:
– all or some of the Notes on 22 September 2025 ; or
– all (but not some) of the Notes following a Tax Event or a Regulatory Event
• Redemption is subject to Westpac receiving APRA’s prior written approval
• Conversion is subject to certain conditions
Mandatory Conversion upon an Acquisition Event
• Westpac must Convert all (but not some) of the Notes into Ordinary Shares following an Acquisition Event, subject to certain conditions
Holder rights • Holders have no right to request Conversion, Redemption or Transfer for any reason
• To realise their investment, Holders may sell their Notes on the ASX at the prevailing market price. Depending on market conditions at the time, the Notes may be trading at a market price below the Face Value and/or the market for the Notes may not be liquid
1 Based on the Initial Face Value of $100 per Note and the average of the daily volume weighted average sales prices of Ordinary Shares during the relevant VWAP Period before the Scheduled Conversion Date, with a benefit of a 1% discount. The value of the Ordinary Shares received on Conversion may be worth more or less than $101.01 depending on the market price of Ordinary Shares before Conversion and the Face Value of the Notes at the Conversion Date. Holders would also receive a Distribution. Distributions are subject to the Distribution Payment Conditions being satisfied, including being at Westpac’s absolute discretion.
31
Westpac Capital Notes 5
Appendix 1: Westpac Capital Notes 5 Additional Information Scheduled Conversion
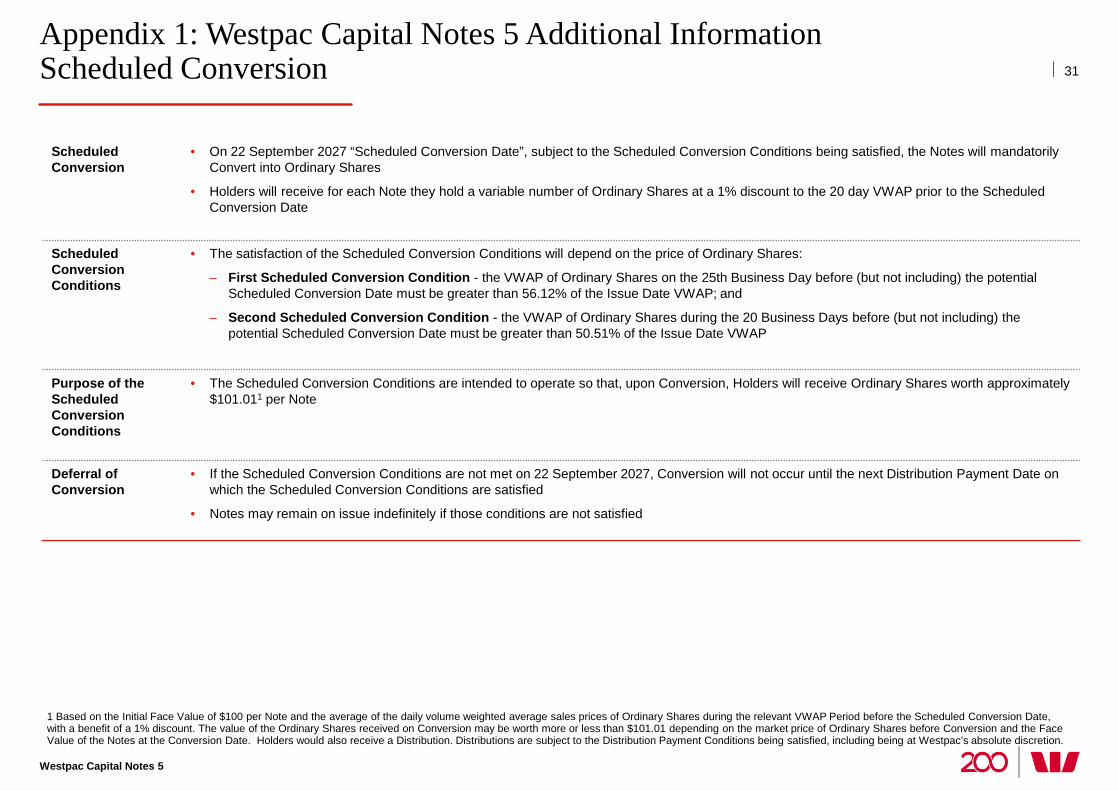
Scheduled Conversion
• On 22 September 2027 “Scheduled Conversion Date”, subject to the Scheduled Conversion Conditions being satisfied, the Notes will mandatorily Convert into Ordinary Shares
• Holders will receive for each Note they hold a variable number of Ordinary Shares at a 1% discount to the 20 day VWAP prior to the Scheduled Conversion Date
Scheduled Conversion Conditions
• The satisfaction of the Scheduled Conversion Conditions will depend on the price of Ordinary Shares:
– First Scheduled Conversion Condition - the VWAP of Ordinary Shares on the 25th Business Day before (but not including) the potential Scheduled Conversion Date must be greater than 56.12% of the Issue Date VWAP; and
– Second Scheduled Conversion Condition - the VWAP of Ordinary Shares during the 20 Business Days before (but not including) the potential Scheduled Conversion Date must be greater than 50.51% of the Issue Date VWAP
Purpose of the Scheduled Conversion Conditions
• The Scheduled Conversion Conditions are intended to operate so that, upon Conversion, Holders will receive Ordinary Shares worth approximately $101.011 per Note
Deferral of Conversion
• If the Scheduled Conversion Conditions are not met on 22 September 2027, Conversion will not occur until the next Distribution Payment Date on which the Scheduled Conversion Conditions are satisfied
• Notes may remain on issue indefinitely if those conditions are not satisfied
32
Westpac Capital Notes 5
Appendix 1: Westpac Capital Notes 5 Additional Information Summary of certain events that may occur
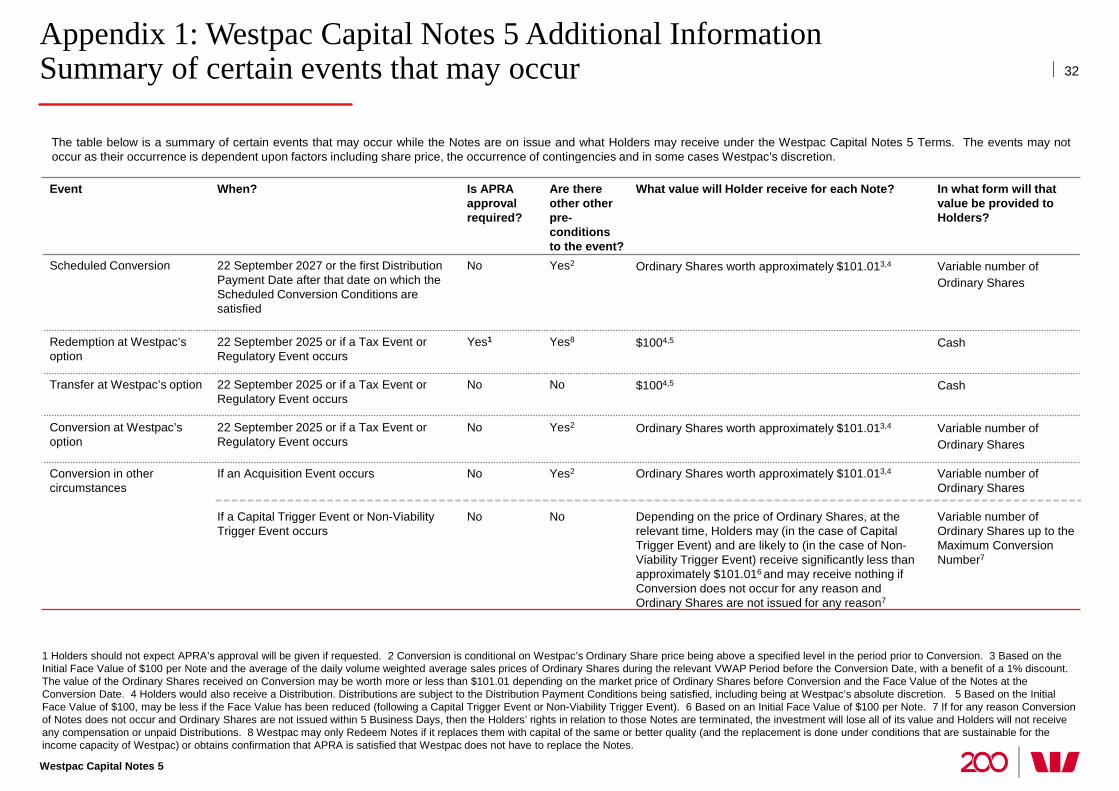
Event When? Is APRA approval required?
Are there other other pre-conditions to the event?
What value will Holder receive for each Note? In what form will that value be provided to Holders?
Scheduled Conversion 22 September 2027 or the first Distribution Payment Date after that date on which the Scheduled Conversion Conditions are satisfied
No Yes2 Ordinary Shares worth approximately $101.013,4 Variable number of Ordinary Shares
Redemption at Westpac’s option
22 September 2025 or if a Tax Event or Regulatory Event occurs
Yes1 Yes8 $1004,5 Cash
Transfer at Westpac’s option 22 September 2025 or if a Tax Event or Regulatory Event occurs
No No $1004,5 Cash
Conversion at Westpac’s option
22 September 2025 or if a Tax Event or Regulatory Event occurs
No Yes2 Ordinary Shares worth approximately $101.013,4 Variable number of Ordinary Shares
Conversion in other circumstances
If an Acquisition Event occurs If a Capital Trigger Event or Non-Viability Trigger Event occurs
No No
Yes2
No
Ordinary Shares worth approximately $101.013,4
Depending on the price of Ordinary Shares, at the relevant time, Holders may (in the case of Capital Trigger Event) and are likely to (in the case of Non-Viability Trigger Event) receive significantly less than approximately $101.016 and may receive nothing if Conversion does not occur for any reason and Ordinary Shares are not issued for any reason7
Variable number of Ordinary Shares Variable number of Ordinary Shares up to the Maximum Conversion Number7
1 Holders should not expect APRA’s approval will be given if requested. 2 Conversion is conditional on Westpac’s Ordinary Share price being above a specified level in the period prior to Conversion. 3 Based on the Initial Face Value of $100 per Note and the average of the daily volume weighted average sales prices of Ordinary Shares during the relevant VWAP Period before the Conversion Date, with a benefit of a 1% discount. The value of the Ordinary Shares received on Conversion may be worth more or less than $101.01 depending on the market price of Ordinary Shares before Conversion and the Face Value of the Notes at the Conversion Date. 4 Holders would also receive a Distribution. Distributions are subject to the Distribution Payment Conditions being satisfied, including being at Westpac’s absolute discretion. 5 Based on the Initial Face Value of $100, may be less if the Face Value has been reduced (following a Capital Trigger Event or Non-Viability Trigger Event). 6 Based on an Initial Face Value of $100 per Note. 7 If for any reason Conversion of Notes does not occur and Ordinary Shares are not issued within 5 Business Days, then the Holders’ rights in relation to those Notes are terminated, the investment will lose all of its value and Holders will not receive any compensation or unpaid Distributions. 8 Westpac may only Redeem Notes if it replaces them with capital of the same or better quality (and the replacement is done under conditions that are sustainable for the income capacity of Westpac) or obtains confirmation that APRA is satisfied that Westpac does not have to replace the Notes.
The table below is a summary of certain events that may occur while the Notes are on issue and what Holders may receive under the Westpac Capital Notes 5 Terms. The events may not occur as their occurrence is dependent upon factors including share price, the occurrence of contingencies and in some cases Westpac’s discretion.
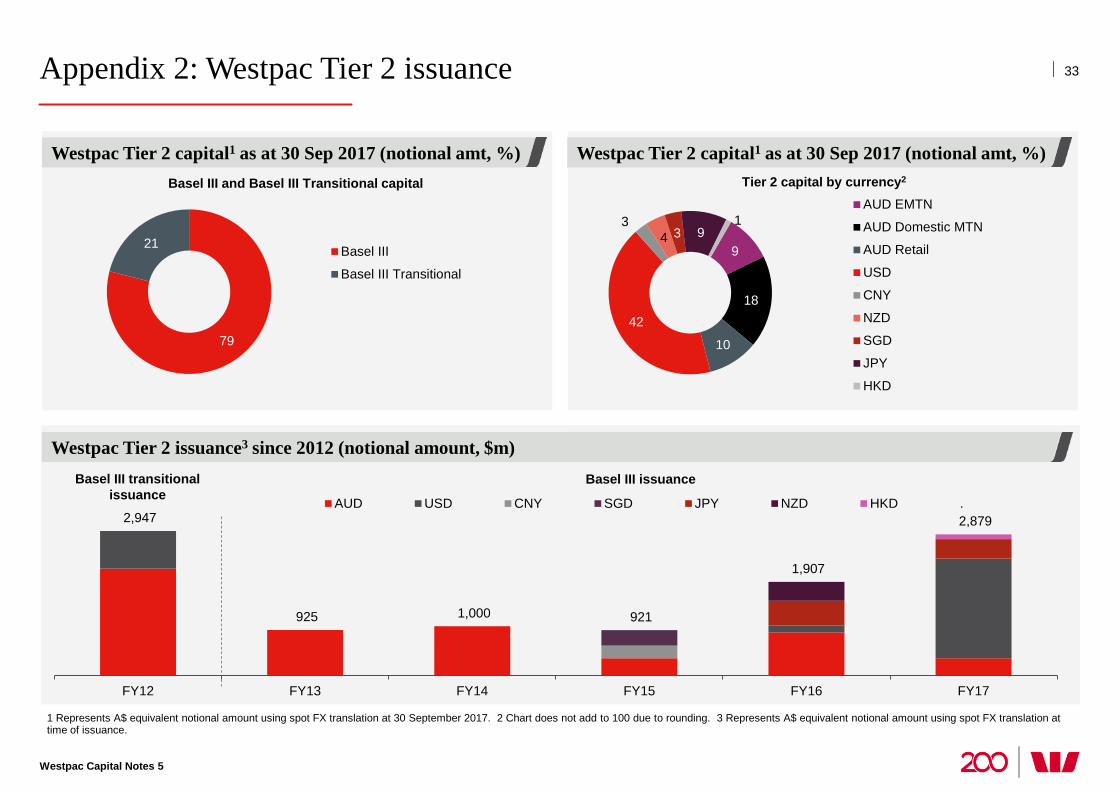
Appendix 2: Westpac Tier 2 issuance
Westpac Capital Notes 5
33
2,947
925 1,000 921
1,907
2,879
FY12 FY13 FY14 FY15 FY16 FY17
AUD USD CNY SGD JPY NZD HKD .
79
21 Basel III
Basel III Transitional
9
18
10
42
3 4 3 9
1 AUD EMTN
AUD Domestic MTN
AUD Retail
USD
CNY
NZD
SGD
JPY
HKD
Basel III and Basel III Transitional capital Tier 2 capital by currency2
Basel III issuance Basel III transitional issuance
Westpac Tier 2 capital1 as at 30 Sep 2017 (notional amt, %)
1 Represents A$ equivalent notional amount using spot FX translation at 30 September 2017. 2 Chart does not add to 100 due to rounding. 3 Represents A$ equivalent notional amount using spot FX translation at time of issuance.
Westpac Tier 2 capital1 as at 30 Sep 2017 (notional amt, %)
Westpac Tier 2 issuance3 since 2012 (notional amount, $m)
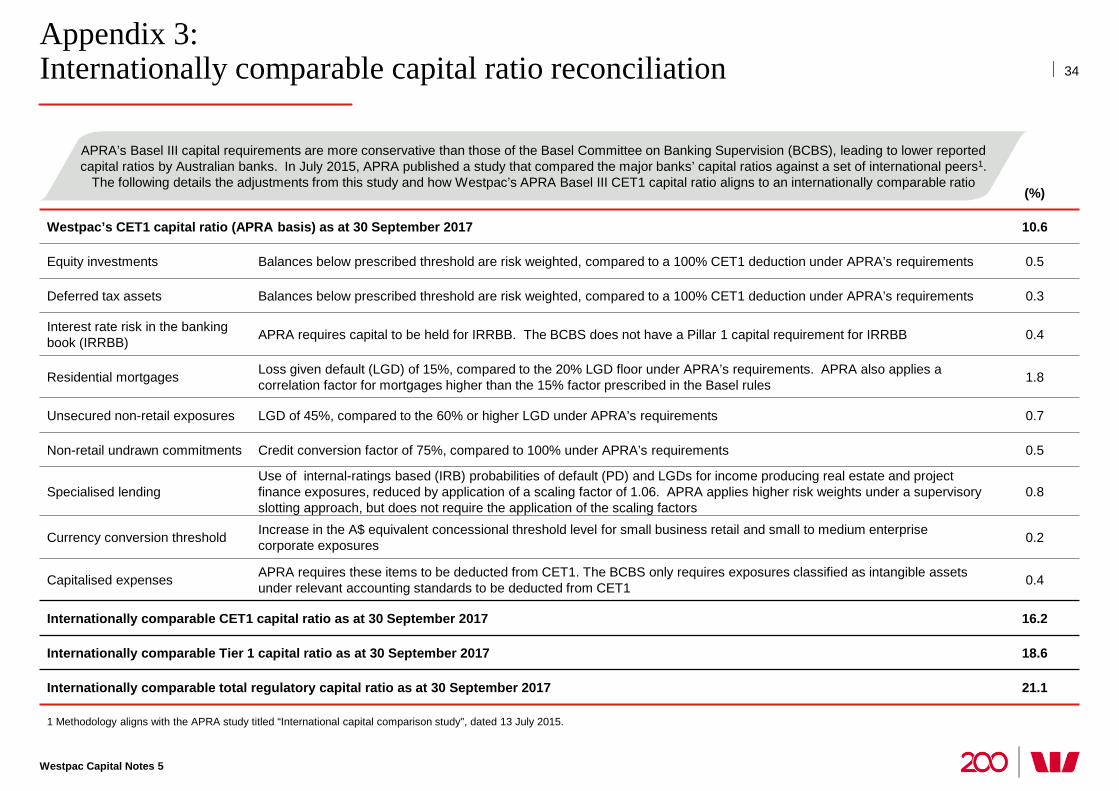
Appendix 3: Internationally comparable capital ratio reconciliation
Westpac Capital Notes 5
34
1 Methodology aligns with the APRA study titled “International capital comparison study", dated 13 July 2015.
(%)
Westpac’s CET1 capital ratio (APRA basis) as at 30 September 2017 10.6
Equity investments Balances below prescribed threshold are risk weighted, compared to a 100% CET1 deduction under APRA’s requirements 0.5
Deferred tax assets Balances below prescribed threshold are risk weighted, compared to a 100% CET1 deduction under APRA’s requirements 0.3
Interest rate risk in the banking book (IRRBB) APRA requires capital to be held for IRRBB. The BCBS does not have a Pillar 1 capital requirement for IRRBB 0.4
Residential mortgages Loss given default (LGD) of 15%, compared to the 20% LGD floor under APRA’s requirements. APRA also applies a correlation factor for mortgages higher than the 15% factor prescribed in the Basel rules 1.8
Unsecured non-retail exposures LGD of 45%, compared to the 60% or higher LGD under APRA’s requirements 0.7
Non-retail undrawn commitments Credit conversion factor of 75%, compared to 100% under APRA’s requirements 0.5
Specialised lending Use of internal-ratings based (IRB) probabilities of default (PD) and LGDs for income producing real estate and project finance exposures, reduced by application of a scaling factor of 1.06. APRA applies higher risk weights under a supervisory slotting approach, but does not require the application of the scaling factors
0.8
Currency conversion threshold Increase in the A$ equivalent concessional threshold level for small business retail and small to medium enterprise corporate exposures 0.2
Capitalised expenses APRA requires these items to be deducted from CET1. The BCBS only requires exposures classified as intangible assets under relevant accounting standards to be deducted from CET1 0.4
Internationally comparable CET1 capital ratio as at 30 September 2017 16.2
Internationally comparable Tier 1 capital ratio as at 30 September 2017 18.6
Internationally comparable total regulatory capital ratio as at 30 September 2017 21.1
APRA’s Basel III capital requirements are more conservative than those of the Basel Committee on Banking Supervision (BCBS), leading to lower reported capital ratios by Australian banks. In July 2015, APRA published a study that compared the major banks’ capital ratios against a set of international peers1.
The following details the adjustments from this study and how Westpac’s APRA Basel III CET1 capital ratio aligns to an internationally comparable ratio
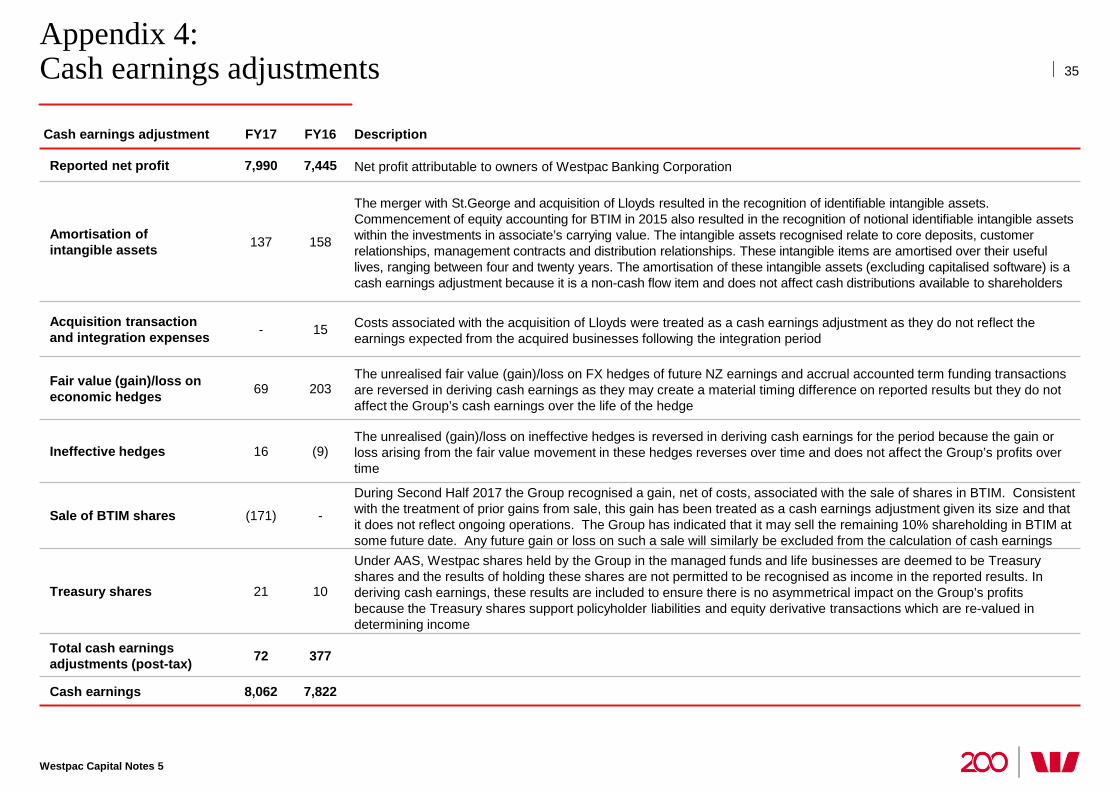
Appendix 4: Cash earnings adjustments
Westpac Capital Notes 5
35
Cash earnings adjustment FY17 FY16 Description
Reported net profit 7,990 7,445 Net profit attributable to owners of Westpac Banking Corporation
Amortisation of intangible assets 137 158
The merger with St.George and acquisition of Lloyds resulted in the recognition of identifiable intangible assets. Commencement of equity accounting for BTIM in 2015 also resulted in the recognition of notional identifiable intangible assets within the investments in associate’s carrying value. The intangible assets recognised relate to core deposits, customer relationships, management contracts and distribution relationships. These intangible items are amortised over their useful lives, ranging between four and twenty years. The amortisation of these intangible assets (excluding capitalised software) is a cash earnings adjustment because it is a non-cash flow item and does not affect cash distributions available to shareholders
Acquisition transaction and integration expenses - 15 Costs associated with the acquisition of Lloyds were treated as a cash earnings adjustment as they do not reflect the
earnings expected from the acquired businesses following the integration period
Fair value (gain)/loss on economic hedges 69 203
The unrealised fair value (gain)/loss on FX hedges of future NZ earnings and accrual accounted term funding transactions are reversed in deriving cash earnings as they may create a material timing difference on reported results but they do not affect the Group’s cash earnings over the life of the hedge
Ineffective hedges 16 (9) The unrealised (gain)/loss on ineffective hedges is reversed in deriving cash earnings for the period because the gain or loss arising from the fair value movement in these hedges reverses over time and does not affect the Group’s profits over time
Sale of BTIM shares (171) -
During Second Half 2017 the Group recognised a gain, net of costs, associated with the sale of shares in BTIM. Consistent with the treatment of prior gains from sale, this gain has been treated as a cash earnings adjustment given its size and that it does not reflect ongoing operations. The Group has indicated that it may sell the remaining 10% shareholding in BTIM at some future date. Any future gain or loss on such a sale will similarly be excluded from the calculation of cash earnings
Treasury shares 21 10
Under AAS, Westpac shares held by the Group in the managed funds and life businesses are deemed to be Treasury shares and the results of holding these shares are not permitted to be recognised as income in the reported results. In deriving cash earnings, these results are included to ensure there is no asymmetrical impact on the Group’s profits because the Treasury shares support policyholder liabilities and equity derivative transactions which are re-valued in determining income
Total cash earnings adjustments (post-tax) 72 377
Cash earnings 8,062 7,822
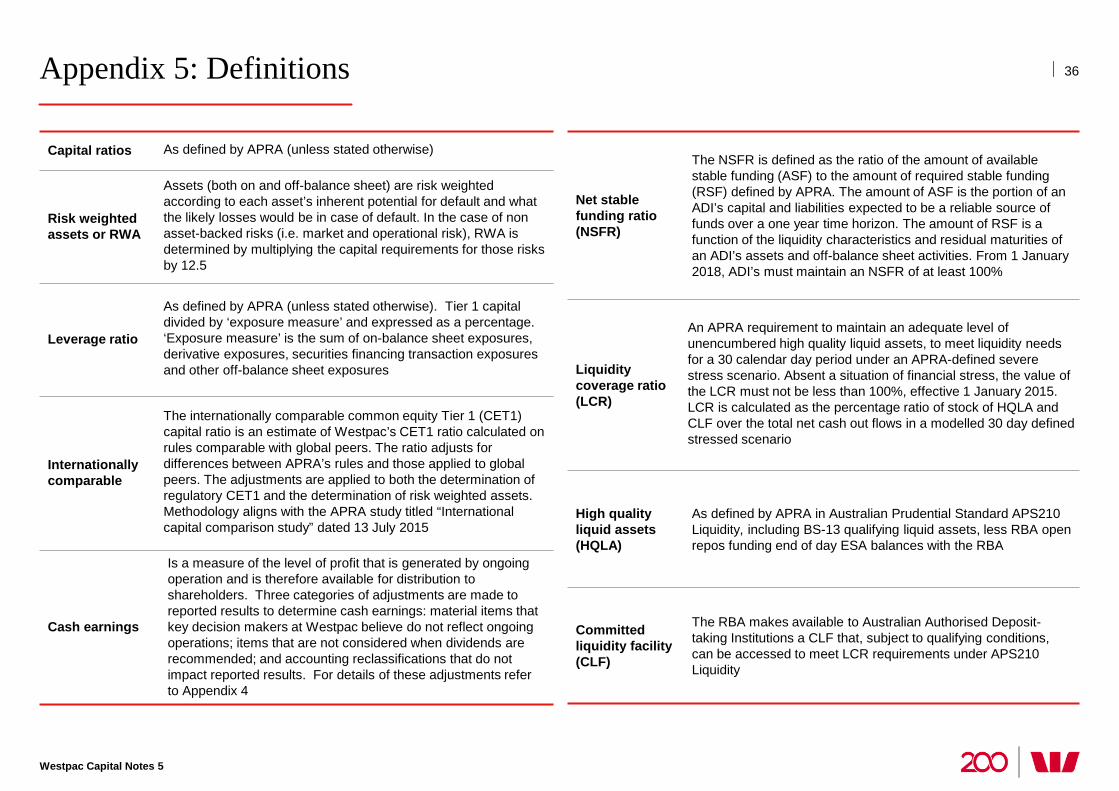
Appendix 5: Definitions
Westpac Capital Notes 5
36
Capital ratios As defined by APRA (unless stated otherwise)
Risk weighted assets or RWA
Assets (both on and off-balance sheet) are risk weighted according to each asset’s inherent potential for default and what the likely losses would be in case of default. In the case of non asset-backed risks (i.e. market and operational risk), RWA is determined by multiplying the capital requirements for those risks by 12.5
Leverage ratio
As defined by APRA (unless stated otherwise). Tier 1 capital divided by ‘exposure measure’ and expressed as a percentage. ‘Exposure measure’ is the sum of on-balance sheet exposures, derivative exposures, securities financing transaction exposures and other off-balance sheet exposures
Internationally comparable
The internationally comparable common equity Tier 1 (CET1) capital ratio is an estimate of Westpac’s CET1 ratio calculated on rules comparable with global peers. The ratio adjusts for differences between APRA’s rules and those applied to global peers. The adjustments are applied to both the determination of regulatory CET1 and the determination of risk weighted assets. Methodology aligns with the APRA study titled “International capital comparison study” dated 13 July 2015
Cash earnings
Is a measure of the level of profit that is generated by ongoing operation and is therefore available for distribution to shareholders. Three categories of adjustments are made to reported results to determine cash earnings: material items that key decision makers at Westpac believe do not reflect ongoing operations; items that are not considered when dividends are recommended; and accounting reclassifications that do not impact reported results. For details of these adjustments refer to Appendix 4
Net stable funding ratio (NSFR)
The NSFR is defined as the ratio of the amount of available stable funding (ASF) to the amount of required stable funding (RSF) defined by APRA. The amount of ASF is the portion of an ADI’s capital and liabilities expected to be a reliable source of funds over a one year time horizon. The amount of RSF is a function of the liquidity characteristics and residual maturities of an ADI’s assets and off-balance sheet activities. From 1 January 2018, ADI’s must maintain an NSFR of at least 100%
Liquidity coverage ratio (LCR)
An APRA requirement to maintain an adequate level of unencumbered high quality liquid assets, to meet liquidity needs for a 30 calendar day period under an APRA-defined severe stress scenario. Absent a situation of financial stress, the value of the LCR must not be less than 100%, effective 1 January 2015. LCR is calculated as the percentage ratio of stock of HQLA and CLF over the total net cash out flows in a modelled 30 day defined stressed scenario
High quality liquid assets (HQLA)
As defined by APRA in Australian Prudential Standard APS210 Liquidity, including BS-13 qualifying liquid assets, less RBA open repos funding end of day ESA balances with the RBA
Committed liquidity facility (CLF)
The RBA makes available to Australian Authorised Deposit-taking Institutions a CLF that, subject to qualifying conditions, can be accessed to meet LCR requirements under APS210 Liquidity
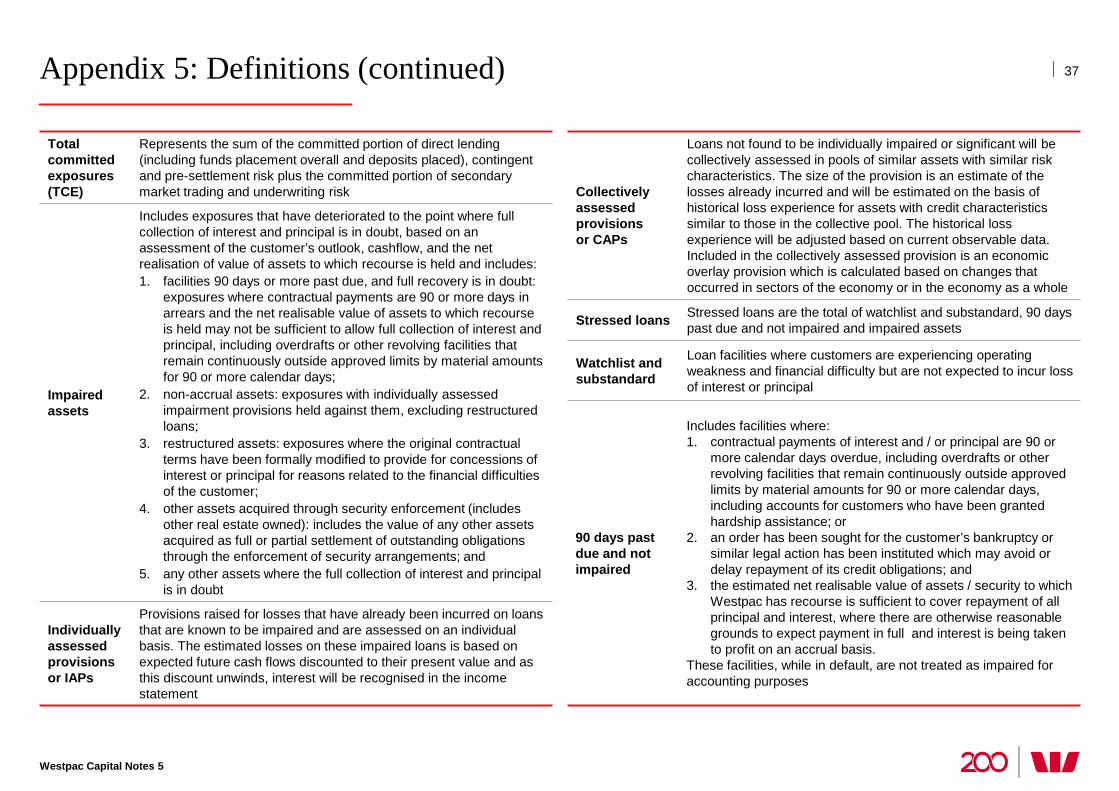
Appendix 5: Definitions (continued)
Westpac Capital Notes 5
37
Total committed exposures (TCE)
Represents the sum of the committed portion of direct lending (including funds placement overall and deposits placed), contingent and pre-settlement risk plus the committed portion of secondary market trading and underwriting risk
Impaired assets
Includes exposures that have deteriorated to the point where full collection of interest and principal is in doubt, based on an assessment of the customer’s outlook, cashflow, and the net realisation of value of assets to which recourse is held and includes: 1. facilities 90 days or more past due, and full recovery is in doubt:
exposures where contractual payments are 90 or more days in arrears and the net realisable value of assets to which recourse is held may not be sufficient to allow full collection of interest and principal, including overdrafts or other revolving facilities that remain continuously outside approved limits by material amounts for 90 or more calendar days;
2. non-accrual assets: exposures with individually assessed impairment provisions held against them, excluding restructured loans;
3. restructured assets: exposures where the original contractual terms have been formally modified to provide for concessions of interest or principal for reasons related to the financial difficulties of the customer;
4. other assets acquired through security enforcement (includes other real estate owned): includes the value of any other assets acquired as full or partial settlement of outstanding obligations through the enforcement of security arrangements; and
5. any other assets where the full collection of interest and principal is in doubt
Individually assessed provisions or IAPs
Provisions raised for losses that have already been incurred on loans that are known to be impaired and are assessed on an individual basis. The estimated losses on these impaired loans is based on expected future cash flows discounted to their present value and as this discount unwinds, interest will be recognised in the income statement
Collectively assessed provisions or CAPs
Loans not found to be individually impaired or significant will be collectively assessed in pools of similar assets with similar risk characteristics. The size of the provision is an estimate of the losses already incurred and will be estimated on the basis of historical loss experience for assets with credit characteristics similar to those in the collective pool. The historical loss experience will be adjusted based on current observable data. Included in the collectively assessed provision is an economic overlay provision which is calculated based on changes that occurred in sectors of the economy or in the economy as a whole
Stressed loans Stressed loans are the total of watchlist and substandard, 90 days past due and not impaired and impaired assets
Watchlist and substandard
Loan facilities where customers are experiencing operating weakness and financial difficulty but are not expected to incur loss of interest or principal
90 days past due and not impaired
Includes facilities where: 1. contractual payments of interest and / or principal are 90 or
more calendar days overdue, including overdrafts or other revolving facilities that remain continuously outside approved limits by material amounts for 90 or more calendar days, including accounts for customers who have been granted hardship assistance; or
2. an order has been sought for the customer’s bankruptcy or similar legal action has been instituted which may avoid or delay repayment of its credit obligations; and
3. the estimated net realisable value of assets / security to which Westpac has recourse is sufficient to cover repayment of all principal and interest, where there are otherwise reasonable grounds to expect payment in full and interest is being taken to profit on an accrual basis.
These facilities, while in default, are not treated as impaired for accounting purposes
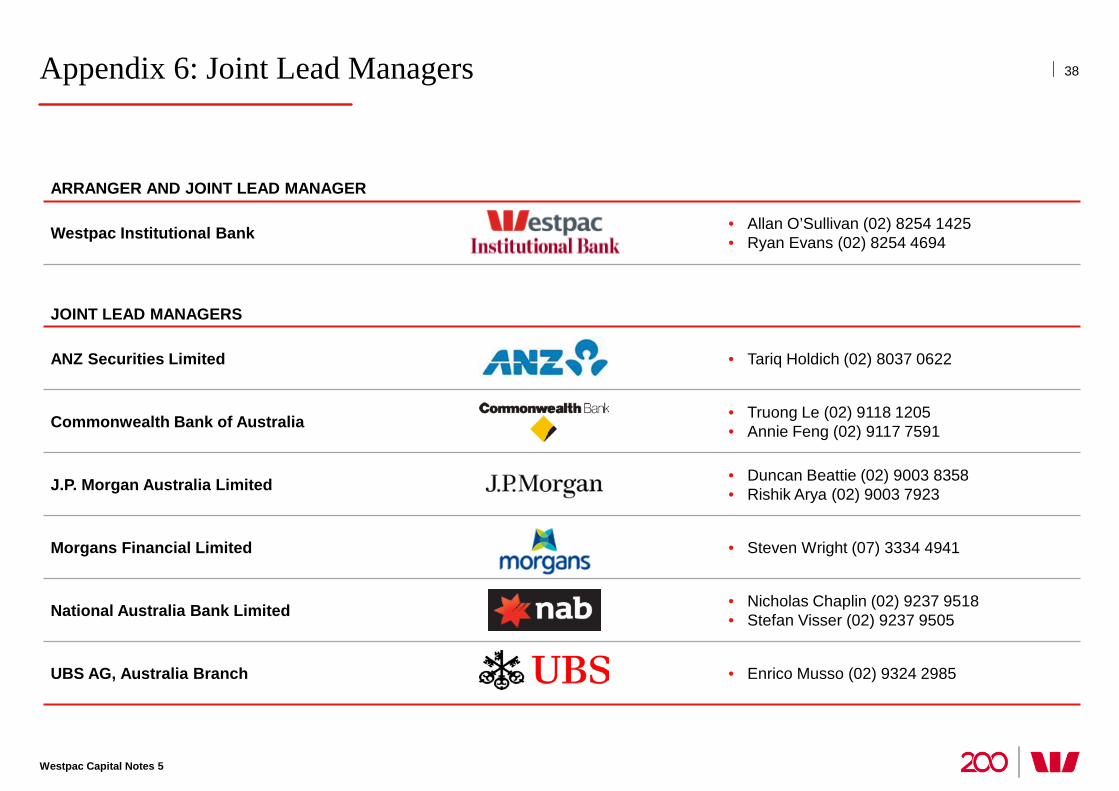
38
Westpac Capital Notes 5
Appendix 6: Joint Lead Managers
ARRANGER AND JOINT LEAD MANAGER
Westpac Institutional Bank • Allan O’Sullivan (02) 8254 1425 • Ryan Evans (02) 8254 4694
JOINT LEAD MANAGERS
ANZ Securities Limited • Tariq Holdich (02) 8037 0622
Commonwealth Bank of Australia • Truong Le (02) 9118 1205 • Annie Feng (02) 9117 7591
J.P. Morgan Australia Limited • Duncan Beattie (02) 9003 8358 • Rishik Arya (02) 9003 7923
Morgans Financial Limited • Steven Wright (07) 3334 4941
National Australia Bank Limited • Nicholas Chaplin (02) 9237 9518 • Stefan Visser (02) 9237 9505
UBS AG, Australia Branch • Enrico Musso (02) 9324 2985
More information | www.westpac.com.au/investorcentre
Curt Zuber Treasurer, Westpac Banking Corporation
+61 2 8253 4230 [email protected]
John Georgiades Executive Director, Structured Funding & Capital
+61 2 8253 1053 [email protected]
Joanne Dawson Deputy Treasurer, Westpac Banking Corporation
+61 2 8204 2777 [email protected]
Jacqueline Boddy Director, Debt Investor Relations
+61 2 8253 3133 [email protected]
X - +
39
Guy Volpicella Head of Structured Funding & Capital
+61 2 8254 9261 [email protected]
Westpac Capital Notes 5
X - +
39
Key Treasury contacts