GLA: 2ND HALF 1ST HALF 2ND HALF 2ND HALF 1ST HALF 2014 second

Half Year Report 2018

2 Contact Half Year Report 2018 | Our Performance
Chief Executive’s Review
The first half of the financial year has seen solid progress on our strategy to optimise the business to deliver strong cash flows, with our cost efficiency programme reducing cash spend by $37 million, down 19% on 1H17. This has given the Board the confidence to increase the 1H18 interim dividend by 18% to 13 cents per share.
The first half of the 2018 financial year (1H18) has seen encouraging progress in delivering improved operational performance despite poor hydrology and a highly competitive electricity market.
Delivering on our strategy, to optimise the Customer and Generation businesses to increase cash distributions to shareholders, has seen a range of continuous improvement initiatives executed which have improved the customer experience, increased customer advocacy and delivered strong operational performance in Generation.
This focus on cash flow has resulted in a sustainable reduction in operating costs of $11 million, a 9% reduction on the prior comparative period and a reduction in cash capital expenditure of $26 million, a 40% reduction.
Despite this progress on the controllable aspects of the business, Contact’s short term earnings have been impacted by the weather. Low rainfall into our South Island hydro catchments meant we were more reliant on higher cost generation from our thermal power stations and other generation companies.
As a result, Contact reported a statutory profit for the six months ended 31 December 2017 of $58 million; $38 million lower than the prior corresponding period. EBITDAF fell by $28 million, or 11%, to $236 million, while underlying profit after tax decreased by $23 million, or 28%, to $59 million.
Contact’s portfolio of long life generation assets and the progress of our cost efficiency programme has given the Board confidence in the strength of Contact’s sustainable cash flow generation. The interim dividend increased 18% to 13 cents per share, compared to 11 cents per share for 1H17, and is fully imputed and payable in April 2018.
Tena koe (Greetings),
4 Contact Half Year Report 2018 | Chief Executive’s Review Chief Executive’s Review | Contact Half Year Report 2018 5
People
Contact continues to empower frontline workers to play a meaningful role in identifying risks and come up with ways to manage them. The strength of our process safety systems and progress in fostering a generative safety culture has led to consulting opportunities, which not only provide a small revenue stream but also confirm we are on the right track.
Disappointingly, Contact recorded four low severity injuries in the first six months with a Total Recordable Injury Frequency Rate per million hours worked (TRIFR) of 2.9. Although these injuries were relatively minor, we continue to work on identifying critical risks and key controls through rigorous planning. A good example of this was the recently completed major outage at the Taranaki Combined Cycle plant where 125,000 hours were worked with no recordable injuries.
In line with advancing our safety culture, Contact introduced a new Health Safety and Environmental Management System, a simpler and more engaging framework focused on learning and improving.
Alongside these improvements to safety systems, the wellbeing of our people has been emphasised in the period with focus on mental health, workload and stress. Contact is implementing more creative and flexible ways of working through a new employee programme named ContactFlex to further foster a more inclusive and diverse workplace.
Looking forward
Contact’s focus for the next six months remains on delivering operating free cash flow growth by focusing on the aspects of the business we can control and maintaining a disciplined and transparent approach to operating and capital expenditure.
The extent of the current dry period, its impact on hydro inflows, and the government’s Electricity Pricing Review all present potential operational challenges for the remainder of the year. However, there are also a number of exciting opportunities for Contact to pursue.
Chief amongst these is the opportunity to help New Zealand businesses transition to low-emissions operating platforms as the government’s policy focus shifts towards decarbonising the economy and establishing 100% renewable energy targets.
Our generation assets, deep relationship with customers, ongoing cost efficiency programme, and lean operations gives us confidence in our ability to execute on our strategy, manage the challenges, and develop the opportunities ahead of us.
Generation business
Wholesale market conditions in the first half of the financial year were book-ended by record low inflows into our Clutha catchment. Contact’s Clutha hydro generation in the six months was 438 GWh, 21% below the prior comparative period with the impact most acutely felt during high wholesale electricity pricing periods in July, August and December.
While Contact’s flexible thermal fuel supply and assets have ensured a reliable supply to customers through these dry periods, the additional fuel and carbon costs incurred adversely affected our financial performance. Wholesale electricity prices responded to the national hydrological conditions with the average price received for our generation nearly twice that of the prior period, but this was insufficient to fully offset the additional costs to operate our thermal plant and purchase risk management contracts from the wholesale market.
Our continuous improvement programme is delivering results with strong plant availability across the portfolio, lower operating costs and record generation from our geothermal power stations which was 11% higher than the prior comparative period.
These conditions resulted in the Generation business recording EBITDAF for the six months of $173 million, $25 million lower than 1H17.
As part of our strategy we are always looking to optimise our portfolio of assets. In December 2017, Contact entered into an agreement to sell the Ahuroa Gas Storage Facility to Gas Services New Zealand for $200 million. The sale is subject to a number of conditions being satisfied and is expected to be completed by June 2018. Contact will retain its rights to use the facility and will support the facility’s expansion for other users, allowing us to focus on our core generation business.
Customer business
The New Zealand energy market remains highly competitive and is currently delivering good outcomes for increasingly satisfied customers, who now have a choice of providers offering competitive pricing and new and innovative products.
Contact is competing well in this environment by providing customers with choice, certainty and control while systems-enabled operational improvements continue to improve the customer experience.
More customers are choosing to stay with Contact and we again recorded a level of switching below that of the overall market, with customer churn reducing to 19.1% over the last 12 months, 1.8 percentage points below the market average.
The ongoing migration of systems into the cloud continues to deliver benefits by lowering operating costs, improving performance, bolstering security and enhancing the flexibility of our information technology platform.
As a result of our ongoing work in the Customer business, the cost to serve our customers is down 11% on the prior comparative period. We are also seeing customers advocate for Contact in greater numbers with a Net Promoter Score of +15 for the period, up from +12 in the same period last year and +14 for the 2017 financial year.
Despite this strong operational performance, the Customer business EBITDAF fell by $3 million to $63 million in the six months to 31 December 2017 compared to the same period a year ago. This was mainly due to rising LPG product costs, which are linked to international oil prices and foreign exchange rates.
Dennis Barnes Chief Executive Officer
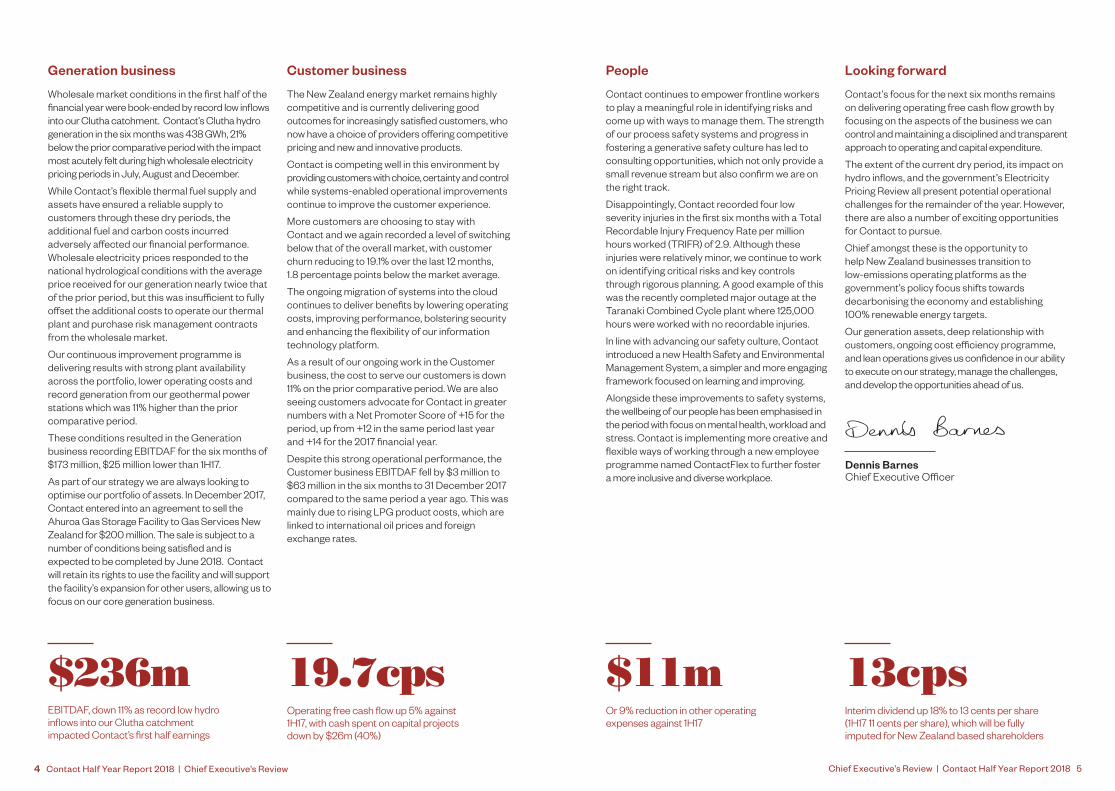
EBITDAF, down 11% as record low hydro inflows into our Clutha catchment impacted Contact’s first half earnings
$236mOperating free cash flow up 5% against 1H17, with cash spent on capital projects down by $26m (40%)
19.7cpsOr 9% reduction in other operating expenses against 1H17
$11mInterim dividend up 18% to 13 cents per share (1H17 11 cents per share), which will be fully imputed for New Zealand based shareholders
13cps

6 Contact Half Year Report 2018 | Our Performance Our Performance | Contact Half Year Report 2018 7
Our performance for the period
THE LAST FIVE YEARS IN REVIEW Unit 1H14 1H15 1H16 1H17 1H18
Revenue and other income $m 1,148 1,240 1,120 1,037 1,194
Expenses $m 884 983 866 773 958
EBITDAF $m 264 257 254 264 236
Profit (loss) $m 112 51 (116) 96 58
Underlying profit $m 97 76 73 82 59
Underlying profit per share cps 13.2 10.4 10.0 11.5 8.2
Operating free cash flow $m 55 163 200 134 141
Operating free cash flow per share cps 7.6 22.2 27.3 18.7 19.7
Dividends declared cps 11.0 11.0 11.0 11.0 13.0
Total assets $m 6,271 6,139 5,726 5,587 5,390
Total liabilities $m 2,732 2,617 2,848 2,766 2,663
Total equity $m 3,539 3,522 2,878 2,821 2,727
Gearing ratio % 28 28 37 36 35
Contact reported a statutory profit for the six months ended 31 December 2017 of $58m; $38m lower than the prior corresponding period. EBITDAF was $236m, $28m (11%) lower, while underlying profit after tax reduced by $23m, 28% to $59m. Operating free cash flow for the period increased by $7m, up 5% to $141m as Contact reduced other operating costs by $11m and reduced capital expenditure by $26m. Strong free cash flow enabled Contact to reduce borrowings by $14m, increase cash on hand by $10m and increase the interim dividend to shareholders by 18% to 13 cents per share.
0
50
100
150
200
250
300
($m
)
1H181H171H161H151H14
EBITDAF Sales volumes and customer numbers
Customer segment EBITDAF was down by $3m (5%) with warmer temperatures reducing electricity sales volumes, higher network costs and increasing LPG product costs not being fully passed through to customers. This was offset by modest electricity price increases and strong progress in reducing the operating costs to serve our customers.
Electricity and gas netback was down $5m (1%) to $347m on lower electricity sales volumes which was partially offset by a higher netback per MWh.
Electricity purchase costs from the Generation business reduced by $5m (2%) as a higher electricity transfer price, which reflected higher ASX futures settlement prices, was offset by lower electricity sales volumes to customers.
LPG EBITDAF was down by $3m on higher product costs which are linked to international oil prices.
Generation segment EBITDAF was $25m (13%) lower than 1H17 as cost of energy, which reflects the total costs of supplying the energy sold, increased by $20m to $124m. Lower hydro generation in the period required more thermal generation and market contracts to meet electricity sales at a higher cost. Lower electricity sales to the Customer business reduced EBITDAF by $5m in the period.
A strong focus on the controllable aspects of the business saw an $11m (9%) reduction in other operating expenses. A result of lower labour costs, reduced bad debt write-offs, reduction in ICT costs and savings from operational improvement initiatives.
Total retail electricity sales volumes for 1H18 were down 136 gigawatt hours (GWh) to 3,611 GWh. Mass market sales volumes were 2% lower than 1H17 as customer usage per connection reduced by 2% following a long-term trend of improving energy efficiency and warmer weather during the second quarter. Electricity customer numbers were on average only 800 lower in 1H18 despite price discounting by larger competitors and increasing competition from new entrant retailers who are attempting to build mass market customer bases. C&I sales volumes were down by 101 GWh as Contact was disciplined in signing up new C&I customers during the dry winter period when pricing did not provide adequate risk adjusted returns.
Lower sales volumes offset the higher electricity transfer price, which reflects rising ASX prices as demand increased and the excess hydro storage seen in prior years was not repeated. These combined to reduce Customer purchase costs by $5m (2%).
Overall customer numbers for the year across electricity, natural gas and LPG increased from 567,000 in June 2017 to 568,500.
Netback marginsTotal electricity and gas netback was down by $5m (1%) as Contact sold less electricity. Modest price increases and a $7m reduction in operating costs to serve our customers was offset by rising costs from electricity distribution networks.
Mass market electricity netback per unit was up $1/MWh. Mass market tariffs rose by $1/MWh, however this was lower than the increase in network costs, which rose by $4/MWh on 1H17. Operating costs to serve were down by 9% which contributed to the slight increase in mass market netback.
C&I electricity netback was up by $4/MWh as the prices of new customer contracts tracked ASX pricing higher on a tighter electricity supply and demand balance. Retail gas netback was up by $1/MWh on lower gas transmission costs and a reduction in operating costs to serve our customers.
LPG margins reduced by $3m as a 1% increase in sales volume was more than offset by higher LPG product costs (up 17%).
0
50
100
150
200
250
300
Declared dividends
Operating free
cash flow
EBITDAFUnderlying profit
Profit
($m
)
1H17 1H18

8 Contact Half Year Report 2018 | Our Performance Our Performance | Contact Half Year Report 2018 9
Wholesale price and volumes Fuel mix and generation costs
In 1H18, the volume of electricity purchased from the market decreased by 109 GWh in line with the reduction in total electricity sales. The contribution from wholesale financial markets was down by $30m on 1H17; as Contact supplied Meridian with 80MW for the period to support Tiwai and called on risk management contracts to support customer sales during periods of low hydro inflows.
The average price received for generation was $92/MWh, up $45/MWh compared to the same period last year. The average price paid for purchases was $99/MWh, $46/MWh higher than 1H17.
Weaker national hydro storage between May and December and a tighter supply and demand balance saw short dated ASX electricity futures prices increase.
Total renewable generation in 1H18 was 3,361 GWh, 264 GWh (7%) lower than the prior corresponding period as lower hydro inflows into our Clutha catchments resulted in a 21% decline in hydro generation (438 GWh). The lower hydro generation was partially offset by record geothermal production of 1,726 GWh as Contact obtained a favourable variation to the Wairakei mass take consent and did not repeat the 1H17 planned outage at Te Mihi.
Higher national electricity demand (1% higher than 1H17) and dry South Island hydro conditions saw additional thermal generation required to replace hydro generation. Contact thermal generation was up 281 GWh to 966 GWh, an increase of 165 GWh at our CCGT station and 116 GWh increase from the peaking plants. Contact has fully utilised the flexibility of the thermal plants to manage portfolio positions. Total gas used in generation was 9.5 PJ at an average cost of $5.80/GJ. This included 2.3 PJ of gas extracted from Ahuroa, enabling Contact to maintain a flexible gas contracting position.
0
50
100
150
200
($m
)
1H181H171H161H151H140
20
40
60
80
100
($m
)
1H181H171H161H151H14
UNDERLYING PROFIT OPERATING FREE CASH FLOW
Underlying profit of $59m was down $23m (28%) from 1H17 reflecting the reduction in EBITDAF. Depreciation was $8m higher than the prior period at $109m due to higher depreciation on our thermal plants as utilisation increased and accounting standards changes which require the capitalisation of operating leases.
Net interest costs reduced by $5m on lower average borrowings and a 0.3% reduction in average interest rates.
The only significant item excluded from underlying profit in 1H18 was the reduction in the fair value of financial instruments of $1m, net of tax.
Operating free cash flow for the period was $141m, up $7m on 1H17 as Contact reduced stay in business capital expenditure. Operating free cash flow was negatively impacted by lower operating earnings with EBITDAF down by $28m, partially offset by a $6m reduction in significant items over the prior period. Tax paid was down by $5m on 1H17 on lower operating earnings. Contact purchased additional NZ carbon units at a higher price for surrender in future periods, which contributed to a unfavourable working capital movement of $8m when compared to the prior period.
Stay in business capital expenditure was down by $29m. Contact implemented detailed asset management plans, and major capital projects in 1H17 were not repeated.
(Gw
h)
0
1000
2000
3000
4000
5000
SwaptionHydro
1H181H171H161H151H14
Swaption
Thermal
Hydro
Geothermal
CY21CY20CY19CY18CY170
20
40
60
80
100
($/M
Wh)
Dec 2017
Jun 2017Dec 2016
Ota
huhu
futu
re p
rices

Financial Statements | Contact Half Year Report 2018 1110 Contact Half Year Report 2018 | Our Performance
DISTRIBUTIONS FUNDING About these Financial StatementsFOR THE SIX MONTHS ENDED 31 DECEMBER 2017
These condensed interim Financial Statements are for Contact, a group made up of Contact Energy Limited and the entities over which it has control or joint control.
Contact Energy Limited is registered in New Zealand under the Companies Act 1993. It is listed on the New Zealand stock exchange (NZX) and the Australian Securities Exchange (ASX) and has bonds listed on the NZX debt market. Contact is an FMC reporting entity under the Financial Markets Conduct Act 2013.
Contact’s condensed interim Financial Statements for the six months ended 31 December 2017 provide a summary of Contact’s performance for the period and outline significant changes to information reported in the Financial Statements for the year ended 30 June 2017 (2017 Annual Report). The Financial Statements should be read with the 2017 Annual Report.
The Financial Statements have been prepared:
• In millions of New Zealand dollars
• In accordance with New Zealand generally accepted accounting practice (GAAP) and comply with NZ IAS 34 and with IAS 34 Interim Financial Reporting
• Using the same accounting policies and significant estimation and critical judgments disclosed in the 2017 Annual Report, except for those changed with Contact electing to early adopt NZ IFRS 15 Revenue from Contracts with Customers and NZ IFRS 16 Leases. The effect of these changes in accounting policies are shown in note A1.
Certain comparative amounts have been restated due to the early adoption of NZ IFRS 15 Revenue from Contracts with Customers and NZ IFRS 16 Leases and/or reclassified to conform with the current period’s classification.
The Financial Statements were authorised on behalf of the Contact Energy Limited Board of Directors on 9 February 2018:
Sir Ralph Norris Chairman
Sue Sheldon Director
The Board has resolved to increase the interim dividend by 18% to 13 cents per share (1H17 11 cents per share), which will be fully imputed for New Zealand based shareholders and represents a pay-out of 66% of operating free cash flow.
Contact’s distribution policy targets between 80-90% of operating free cash flow as an ordinary dividend, on average over time, once our Standard and Poor’s (S&P) net debt / EBITDAF ratio is below 2.8. This key metric currently sits above the 2.8 threshold. Contact is transitioning to the new distribution policy by providing investors with a clear and transparent dividend target. For FY18 the Board is targeting an ordinary dividend of 32 cents per share, an increase of 23% on FY17.
The face value of borrowings at 31 December 2017 was $1,531m. Contact continues to benefit from a funding portfolio that is flexible, efficient and diverse with a manageable maturity profile. Average weighted cost of borrowings continued to improve, falling 0.3% in 1H18 vs 1H17 as competitively priced short term bank facilities and a retail bond issue replaced higher cost historic debt.
The face value of net borrowings reduced by $14m since 30 June 2017 as surplus cash was applied to the reduction of debt. Cash on hand also increased by $10m since 30 June 2017.
($m
)
0
100
200
300
400
500
2221201918 23-27 28-32 Yr
NEXI
USPP
Domestic
Bank
($m
)
0
30
60
90
120
150
1H181H17
Net debt repayments
Gas sale & repurchase
Dividends
Growth capex
Use
s of
free
cas
h flo
w
Increase in cash balance

12 Contact Half Year Report 2018 | Financial Statements Financial Statements | Contact Half Year Report 2018 13
Statement of Comprehensive IncomeFOR THE SIX MONTHS ENDED 31 DECEMBER 2017
$m Note
Unaudited 6 months ended
31 Dec 2017
Restated Unaudited
6 months ended 31 Dec 2016
RestatedAudited
year ended 30 Jun 2017
Revenue and other income A3 1,194 1,037 2,079
Operating expenses A3 (958) (773) (1,578)
Significant items A3 (2) 19 11
Depreciation and amortisation C1 (109) (101) (208)
Net interest expense (43) (48) (93)
Profit before tax 82 134 211Tax expense (24) (38) (60)
Profit 58 96 151
Items that may be reclassified to profit/(loss):
Change in cash flow hedge reserve D1 (6) 8 (21)
Deferred tax relating to cash flow hedges D1 2 (2) 6
Other comprehensive income/(loss) (4) 6 (15)
Comprehensive income 54 102 136
Profit per share (cents) – Basic 8.1 13.4 21.0
Profit per share (cents) – Diluted 8.1 13.2 21.0
Statement of Cash FlowsFOR THE SIX MONTHS ENDED 31 DECEMBER 2017
$m Note
Unaudited 6 months ended
31 Dec 2017
Restated Unaudited
6 months ended 31 Dec 2016
Restated Audited
year ended 30 Jun 2017
Receipts from customers 1,212 1,054 2,072
Payments to suppliers and employees (976) (786) (1,527)
Tax paid (20) (25) (37)
Operating cash flows 216 243 508 Purchase of assets (39) (65) (118)
Proceeds from sale of assets – 2 9
Interest received – – 1
Investing cash flows (39) (63) (108)
Dividends paid B2 (107) (107) (186)
Proceeds from issue of shares 1 – –
Proceeds from borrowings – 20 115
Repayment of borrowings (14) (43) (226)
Interest paid (40) (45) (88)
Gas sale and repurchase arrangement (7) (6) (14)
Financing cash flows (167) (181) (399)
Net cash flow 10 (1) 1
Add: cash at the beginning of the period 6 5 5
Cash at the end of the period 16 4 6

14 Contact Half Year Report 2018 | Financial Statements Financial Statements | Contact Half Year Report 2018 15
Statement of Financial PositionAT 31 DECEMBER 2017
Statement of Changes in EquityFOR THE SIX MONTHS ENDED 31 DECEMBER 2017
$m NoteUnaudited
31 Dec 2017
Restated Unaudited
31 Dec 2016
Restated Audited
30 Jun 2017
Cash and cash equivalents 16 4 6
Trade and other receivables 182 186 197
Inventories 38 55 46
Intangible assets C1 23 18 11
Derivative financial instruments D1 9 29 8
Assets held for sale C1 184 – –Total current assets 452 292 268
Inventories 21 37 24
Property, plant and equipment C1 4,402 4,670 4,611
Intangible assets C1 275 331 321
Goodwill 182 182 182
Derivative financial instruments D1 47 57 38
Other non–current assets 11 18 11
Total non–current assets 4,938 5,295 5,187
Total assets 5,390 5,587 5,455
Trade and other payables 182 203 202
Tax payable 10 4 4
Borrowings B3 442 440 391
Derivative financial instruments D1 51 22 50
Provisions 12 15 14
Total current liabilities 697 684 661
Borrowings B3 1,108 1,228 1,158
Derivative financial instruments D1 54 52 52
Provisions 51 45 50
Deferred tax 746 750 749
Other non–current liabilities 7 7 7
Total non–current liabilities 1,966 2,082 2,016
Total liabilities 2,663 2,766 2,677
Net assets 2,727 2,821 2,778
Share capital B1 1,519 1,515 1,515
Retained earnings 1,214 1,286 1,263
Cash flow hedge reserve (11) 14 (8)
Share–based compensation reserve 5 6 8
Shareholders' equity 2,727 2,821 2,778
$m NoteShare
CapitalRetained Earnings
Other Reserves
Total Shareholders’
Equity
Balance at 1 July 2016 1,515 1,294 14 2,823
Adjustment on adoption of new IFRS A1 – 2 – 2
Restated opening balance as at 1 July 2016 1,515 1,296 14 2,825
Profit A3 – 96 – 96
Change in cash flow hedge reserve (net of tax) – – 6 6
Lapsed share scheme awards – 1 (1) – Share–based compensation expense – – 1 1
Dividends paid B2 – (107) – (107)
Restated unaudited balance at 31 December 2016 1,515 1,286 20 2,821
Profit A3 – 55 – 55
Change in cash flow hedge reserve (net of tax) – – (21) (21)
Lapsed share scheme awards – 1 (1) –
Share–based compensation expense – – 2 2
Dividends paid B2 – (79) – (79)
Restated audited balance at 30 June 2017 1,515 1,263 – 2,778
Profit A3 – 58 – 58
Change in cash flow hedge reserve (net of tax) – – (4) (4)
Exercised share scheme awards – – (3) (3)
Share–based compensation expense – – 1 1
Change in share capital 4 – – 4
Dividends paid B2 – (107) – (107)
Unaudited balance at 31 December 2017 1,519 1,214 (6) 2,727

16 Contact Half Year Report 2018 | Notes to the Financial Statements Notes to the Financial Statement | Contact Half Year Report 2018 17
A. Our PerformanceA1. ADOPTION OF NEW ACCOUNTING POLICIESContact has elected to early adopt NZ IFRS 15 Revenue from Contracts with Customers (‘revenue standard’) and NZ IFRS 16 Leases (‘leases standard’) for the year ending 30 June 2018. Both standards have been adopted using the full retrospective approach with an adjustment to retained earnings on 1 July 2016.
With the adoption of the revenue standard the incremental costs incurred to acquire new customers are capitalised as a contract asset instead of being expensed as incurred. The contract asset is amortised to operating expenses over the expected life of the customer relationship. Direct customer incentives are also capitalised as a contract asset and amortised to revenue, which is consistent with the previous accounting treatment. The amortisation period has been revised from the contract term to the expected life of the customer relationship. At 31 December 2017 contract assets held within ‘Trade and other receivables’ totalled $13 million (31 December 2016: $11 million, 30 June 2017: $12 million).
The adoption of the leases standard results in those leases previously classified as operating leases being recorded on balance sheet. All other arrangements will be considered under the leases standard when the contract is amended or renewed. On 1 July 2016 Contact recognised lease assets and lease obligations that represent the present value of future lease payments for the minimum lease term and all lease renewal options that Contact is reasonably certain to exercise. Lease payments are recorded as a repayment of the lease obligation and interest expense instead of as an operating expense. Lease assets are depreciated over the lease term.
The effect of this change in accounting policy is shown below:
$m
Unaudited 6 months
ended 31 Dec 2016 Adjustments
Restated Unaudited
6 months ended
31 Dec 2016
Audited year
ended 30 Jun 2017 Adjustments
Restated Audited
year ended
30 Jun 2017
Statement of Comprehensive Income
Revenue and other income 1,039 (2) 1,037 2,080 (1) 2,079
Operating expenses (778) 5 (773) (1,586) 8 (1,578)
Depreciation and amortisation (99) (2) (101) (204) (4) (208)
Net interest expense (47) (1) (48) (92) (1) (93)
Tax expense (38) – (38) (59) (1) (60)
Profit 96 – 96 150 1 151Statement of Financial Position
Trade and other receivables 181 6 187 190 7 197 Property, plant and equipment 4,649 20 4,670 4,592 19 4,611
Lease obligations (Borrowings) 23 23 46 19 22 41
Deferred tax liability 749 1 750 748 1 749
Retained earnings 1,284 2 1,286 1,260 3 1,263
The adjustments relating to the periods before those presented are an increase in lease obligations of $26 million, lease assets of $23 million, contract assets of $6 million, deferred tax liability of $1 million and retained earnings of $2 million.
A2. SEGMENTS Contact reports activities under two operating segments; being the Generation segment and the Customer segment. There has been no significant changes to Contact’s operating segments in the current year.
The Generation segment includes revenue from the sale of electricity to the wholesale electricity market and to the Customer segment, less the cost to generate and/or purchase the electricity sold.
The Customer segment includes revenue from delivering energy to customers less the cost of energy, and costs to service and distribute energy to the customer.
The Customer segment purchases electricity from the Generation segment at a price fixed in a manner similar to transactions with third parties.
A3. EARNINGSThe table on the next page provides a breakdown of Contact’s revenue and expenses, earnings before interest, tax, depreciation and amortisation, and changes in fair value of financial instruments and significant items (EBITDAF) by segment, and a reconciliation from EBITDAF and underlying profit to profit reported under NZ GAAP.
EBITDAF and underlying profit are used to monitor performance and are non–GAAP profit measures.
Significant items are excluded from EBITDAF and underlying profit when they meet criteria approved by the Board of Directors. The significant item in this reporting period is ‘Change in fair value of financial instruments’, which is the movements in the valuation of interest rate and electricity price derivatives that are not accounted for as hedges, hedge accounting ineffectiveness and the effect of credit risk on the valuation of hedged debt and derivatives. Refer D1 for a breakdown.

18 Contact Half Year Report 2018 | Notes to the Financial Statements Notes to the Financial Statement | Contact Half Year Report 2018 19
Unaudited 6 months ended 31 Dec 2017 Restated unaudited 6 months ended 31 Dec 2016 Restated audited year ended 30 Jun 2017
$m Generation Customer Eliminations Total Generation Customer Eliminations Total Generation Customer Eliminations Total
Mass market electricity – 458 – 458 – 465 – 465 – 892 (1) 891
Commercial & Industrial electricity 5 223 – 228 4 231 – 235 8 465 – 473
Wholesale electricity 388 – – 388 222 – – 222 492 – – 492
Inter–segment electricity sales 296 – (296) – 301 – (301) – 596 – (596) –
Gas – 39 – 39 – 36 – 36 – 66 – 66
LPG – 63 – 63 – 62 – 62 – 119 – 119
Steam 14 – – 14 14 – – 14 25 – – 25
Total revenue 703 783 (296) 1,190 541 794 (301) 1,034 1,121 1,542 (597) 2,066
Other income 1 3 – 4 – 3 – 3 6 7 – 13
Total revenue and other income 704 786 (296) 1,194 541 797 (301) 1,037 1,127 1,549 (597) 2,079
Electricity purchases (381) – – (381) (206) – – (206) (460) – – (460)
Inter–segment electricity purchases – (296) 296 – – (301) 301 – – (596) 596 –
Gas purchases (57) (9) – (66) (44) (8) – (52) (100) (15) – (115)
LPG purchases – (36) – (36) – (33) – (33) – (67) – (67)
Electricity networks, transmission, levies & meter costs (24) (304) – (328) (24) (305) – (329) (48) (590) – (638)
Gas networks, transmission, levies & meter costs (5) (20) – (25) (4) (19) – (23) (8) (36) – (44)
Other operating expenses (57) (57) – (114) (61) (64) – (125) (119) (125) 1 (243)
Carbon emissions (7) (1) – (8) (4) (1) – (5) (9) (2) – (11)
Total operating expenses (531) (723) 296 (958) (343) (731) 301 (773) (744) (1,431) 597 (1,578)
EBITDAF 173 63 – 236 198 66 – 264 383 118 – 501
Depreciation and amortisation (109) (101) (208)
Net interest expense (43) (48) (93)
Tax on underlying profit (25) (33) (58)
Underlying profit 59 82 142
Significant items
Change in fair value of financial instruments (2) 30 23
Transition costs – (7) (7)
Remediation for Holidays Act non–compliance – (5) (5)
Otahuhu thermal power station closure and sale – 1 –
Tax on significant items 1 (5) (2)
Profit 58 96 151
Underlying profit per share (cents) 8.2 11.5 19.9

20 Contact Half Year Report 2018 | Notes to the Financial Statements Notes to the Financial Statement | Contact Half Year Report 2018 21
A4. FREE CASH FLOW
$m
Unaudited 6 months ended
31 Dec 2017
RestatedUnaudited
6 months ended 31 Dec 2016
RestatedAudited
year ended 30 Jun 2017
EBITDAF 236 264 501
Tax paid (20) (25) (37)
Change in working capital net of non–cash, investing and financing activities
(4) 4 41
Non–cash items included in EBITDAF 4 6 11
Significant items, net of non–cash adjustments – (6) (8)
Operating cash flows 216 243 508 Net interest paid (40) (45) (87)
Stay in business capital expenditure (35) (64) (116)Operating free cash flow 141 134 305
Proceeds from sale of assets – 2 9
Free cash flow 141 136 314
Operating free cash flow per share (cents) 19.7 18.7 42.6
A5. RELATED PARTY TRANSACTIONS During the period Contact’s transactions with related parties were:
• Sales of LPG to Rockgas Timaru Limited of $1 million (31 December 2016: $1 million, 30 June 2017: $2 million).
• Directors’ fees of $1 million (31 December 2016: $1 million, 30 June 2017: $1 million).
• Leadership Team’s salary and other short–term benefits of $4 million (31 December 2016: $3 million, 30 June 2017: $7 million), which includes $1 million of share–based compensation expense (31 December 2016: $nil, 30 June 2017: $1 million).
B. Our FundingB1. SHARE CAPITAL
Number $m
Balance at 1 July 2016 715,525,756 1,515
Balance at 31 December 2016 715,525,756 1,515
Balance at 30 June 2017 715,525,756 1,515
Share capital issued 750,281 4
Balance at 31 December 2017 716,276,037 1,519 Ordinary shares 715,878,887 1,520
Restricted shares – Contact Share 397,150 (1)
During the period Contact granted a new tranche of share awards under the Equity Scheme, comprising 1,148,119 options, 274,347 PSRs and 309,212 DSRs. The share options have an exercise price of $5.54 per share while the PSRs and DSRs have no exercise price.
B2. DIVIDENDS PAID
$m Cents per share
Unaudited 6 months ended
31 Dec 2017
Unaudited 6 months ended
31 Dec 2016
Audited year ended
30 Jun 2017
2016 final dividend 15 – 107 107
2017 interim dividend 11 – – 79
2017 final dividend 15 107 – –
107 107 186
On 9 February 2018 the Board declared an interim dividend of 13 cents per share to be paid on 6 April 2018.

22 Contact Half Year Report 2018 | Notes to the Financial Statements Notes to the Financial Statement | Contact Half Year Report 2018 23
B3. BORROWINGS
$mUnaudited
31 Dec 2017
Restated Unaudited
31 Dec 2016
RestatedAudited
30 Jun 2017
Bank overdraft 3 4 3
*Commercial paper 180 185 180
*Bank facilities 106 187 113
Lease obligations 38 46 41
*Wholesale bonds 100 200 100 *Retail bonds 472 372 472
*Export credit agency facility 72 79 76
*USPP notes 560 560 560 Face value of borrowings 1,531 1,633 1,545
Deferred financing costs (7) (8) (7)
Fair value adjustment on hedged borrowing 26 43 11
Carrying value of borrowings 1,550 1,668 1,549
Current 442 440 391
Non–current 1,108 1,228 1,158
Borrowings denoted with an asterisk (*) are Green Debt Instruments under Contact’s Green Borrowing Programme (excluding USPP notes and wholesale bonds maturing in 2018). At 31 December 2017 Contact remains compliant with the requirements of the programme. Further information is available on the Sustainability section on Contact’s website.
At 31 December 2017, $5 million of lease obligations are payable within one year of the end of the reporting period.
Contact uses bank facilities to manage its liquidity risk and maintains a buffer of undrawn bank facilities over its forecast funding requirements to enable it to meet any unforeseen cash flows.
Contact’s bank facilities have a range of maturities:
$mUnaudited
31 Dec 2017Unaudited
31 Dec 2016Audited
30 Jun 2017
Less than 1 year 170 240 150
Between 1 and 2 years 110 215 265
Between 2 and 3 years 80 30 30
More than 3 years 165 115 155
525 600 600
In addition to bank facilities Contact, has entered into a $100 million bridge facility available to draw from 28 March 2018 with a maturity of one year. This forms part of the refinancing plans for USPP notes maturing in 2018.
C. Our AssetsC1. PROPERTY, PLANT AND EQUIPMENT AND INTANGIBLE ASSETS
Property, plant and equipment $m
Unaudited 31 Dec 2017
RestatedUnaudited
31 Dec 2016
Restated Audited
30 Jun 2017
Opening balance 4,611 4,721 4,721
Additions 36 35 66
Transfers to assets held for sale (155) – –
Depreciation (90) (87) (175)
Disposals – – (1)
Closing balance 4,402 4,670 4,611
At 31 December 2017, included within property, plant and equipment is $17 million of lease assets. These assets incurred a depreciation charge of $2 million for the six months ended 31 December 2017.
Intangible assets $m
Unaudited 31 Dec 2017
Unaudited 31 Dec 2016
Audited 30 Jun 2017
Opening balance 332 333 333
Additions 15 31 40
Transfers to assets held for sale (29) – –
Amortisation (19) (15) (33)
Disposals (1) – (8)
Closing balance 298 349 332
Current 23 18 11
Non–current 275 331 321
At 31 December 2017, Contact was committed to $11 million of capital expenditure, with all payments due within one year of the reporting period end (31 December 2016: $20 million, 30 June 2017: $11 million).
Assets classified as held for sale comprise the Ahuroa Gas Storage Facility which is subject to a conditional sale agreement with Gas Services New Zealand. These assets are expected to be sold within one year of the end of the reporting period.

24 Contact Half Year Report 2018 | Notes to the Financial Statements Notes to the Financial Statement | Contact Half Year Report 2018 25
D. Our Financial RisksD1. FAIR VALUE OF DERIVATIVE FINANCIAL INSTRUMENTS
The fair value of derivatives used to hedge risk, categorised by accounting treatment is provided below.
Unaudited 31 Dec 2017
Unaudited 31 Dec 2016
Audited 30 Jun 2017
$m Asset Liability Asset Liability Asset Liability
Fair value hedges
CCIRS 44 (26) 50 (18) 33 (30)
Interest rate swaps 7 – 8 – 8 –
Cash flow hedges
CCIRS – margin – (4) 3 (1) 2 (6)
Foreign exchange derivatives – – 1 (4) – –
Electricity and LPG price derivatives – (12) 20 – – (6)
Not designated in hedge relationship
Interest rate swaps 1 (55) 1 (49) – (53)
Electricity price derivatives 4 (8) 3 (2) 3 (7)
56 (105) 86 (74) 46 (102)
Current 9 (51) 29 (22) 8 (50)
Non–current 47 (54) 57 (52) 38 (52)
The change in the fair value of derivatives and the fair value adjustment to borrowings is provided below.
Unaudited 6 months ended
31 Dec 2017
Unaudited 6 months ended
31 Dec 2016
Audited year ended 30 Jun 2017
$mProfit/
(loss)CFHR Profit/
(loss)CFHR Profit/
(loss)CFHR
CCIRS 15 – (23) – (52) –
Interest rate swaps (1) – (6) – (6) –
Fair value adjustment to borrowings (15) – 30 – 62 –
Fair value hedges (1) – 1 – 4 –
CCIRS – margin – – – 4 – (2)
Foreign exchange derivatives – – – 1 – 4
Electricity and LPG price derivatives – (6) – 3 – (23)
Tax on change in fair value – 2 – (2) – 6
Cash flow hedges – (4) – 6 – (15)
Interest rate swaps (1) – 28 – 23 –
Electricity price derivatives – – 1 – (4) –
Derivatives not designated in hedge relationships (1) – 29 – 19 –
Total fair value movement (2) (4) 30 6 23 (15)
Conclusion
Based on our review, nothing has come to our attention that causes us to believe that the interim financial statements on pages 11 to 24 do not:
I. present fairly in all material respects the company’s financial position as at 31 December 2017 and its financial performance and cash flows for the 6 month period ended on that date; and
II. comply with NZ IAS 34 Interim Financial Reporting.
We have completed a review of the accompanying interim financial statements which comprise:
• the statement of financial position as at 31 December 2017;
• the statements of comprehensive income, changes in equity and cash flows for the six month period then ended; and
• notes, including a summary of significant accounting policies and other explanatory information.
Basis for conclusion
A review of interim financial statements in accordance with NZ SRE 2410 Review of Financial Statements Performed by the Independent Auditor of the Entity (“NZ SRE 2410”) is a limited assurance engagement. The auditor performs procedures, consisting of making enquiries, primarily of persons responsible for financial and accounting matters, and applying analytical and other review procedures.
As the auditor of Contact Energy Limited, NZ SRE 2410 requires that we comply with the ethical requirements relevant to the audit of the annual financial statements.
Our firm has also provided other services to the company in relation to AGM scrutineering. Subject to certain restrictions, partners and employees of our firm may also deal with the company on normal terms within the ordinary course of trading activities of the business of the company. These matters have not impaired our independence as reviewer of the company. The firm has no other relationship with, or interest in, the company.
Use of this Independent Review Report
This report is made solely to the shareholders as a body. Our review work has been undertaken so that we might state to the shareholders those matters we are required
to state to them in the Independent Review Report and for no other purpose. To the fullest extent permitted by law, we do not accept or assume responsibility to anyone other than the shareholders as a body for our review work, this report, or any of the opinions we have formed.
Responsibilities of the Directors for the interim financial statements
The Directors, on behalf of the company, are responsible for:
• the preparation and fair presentation of the interim financial statements in accordance with NZ IAS 34 Interim Financial Reporting;
• implementing necessary internal control to enable the preparation of interim financial statements that are fairly presented and free from material misstatement, whether due to fraud or error; and
• assessing the ability to continue as a going concern. This includes disclosing, as applicable, matters related to going concern and using the going concern basis of accounting unless they either intend to liquidate or to cease operations, or have no realistic alternative but to do so.
Auditor’s Responsibilities for the review of the interim financial statements
Our responsibility is to express a conclusion on the interim financial statements based on our review. We conducted our review in accordance with NZ SRE 2410. NZ SRE 2410 requires us to conclude whether anything has come to our attention that causes us to believe that the interim financial statements are not prepared, in all material respects, in accordance with NZ IAS 34 Interim Financial Reporting.
The procedures performed in a review are substantially less than those performed in an audit conducted in accordance with International Standards on Auditing (New Zealand). Accordingly we do not express an audit opinion on these interim financial statements.
This description forms part of our Independent Review Report.
9 February 2018 Wellington
Independent Auditors Review ReportTO THE SHAREHOLDERS OF CONTACT ENERGY LIMITED REPORT ON THE INTERIM FINANCIAL STATEMENTS
26 Contact Half Year Report 2018 | Glossary Corporate Directory | Contact Half Year Report 2018 27
Corporate Directory
BOARD OF DIRECTORSSir Ralph Norris (Chairman)
Victoria Crone
Whaimutu Dewes
Rob McDonald
Sue Sheldon
Elena Trout
LEADERSHIP TEAMDennis Barnes Chief Executive Officer
Graham Cockroft Chief Financial Officer
Venasio–Lorenzo Crawley Chief Customer Officer
James Kilty Chief Generation and Development Officer
Tania Palmer General Manager, People and Safety
Catherine Thompson General Manager, External Relations and General Counsel
REGISTERED OFFICEContact Energy Limited Harbour City Tower 29 Brandon Street Wellington 6011 New Zealand
Phone: +64 4 499 4001 Fax: +64 4 499 4003
Find us on Facebook, Twitter, LinkedIn and YouTube by searching for Contact Energy
COMPANY NUMBERSNZ Incorporation 660760 ABN 68 080 480 477
AUDITORKPMG PO Box 996 Wellington 6140
REGISTRYChange of address, payment instructions and investment portfolios can be viewed and updated online:
investorcentre.linkmarketservices.co.nz investorcentre.linkmarketservices.com.au
New Zealand RegistryLink Market Services Limited, PO Box 91976, Auckland 1142 Level 11, Deloitte Centre, 80 Queen Street, Auckland 1010 [email protected] Phone: +64 9 375 5998 Fax: +64 9 375 5990
Australian RegistryLink Market Services Limited, Locked Bag A14, Sydney South, NSW 1235 680 George Street, Sydney, NSW 2000 [email protected] Phone: +61 2 8280 7111 Fax: +61 2 9287 0303
INVESTOR ENQUIRIESMatthew Forbes Investor Relations Manager [email protected] Phone: +64 4 462 1323
Glossary
ASX Australian Securities Exchange
C&I Commercial and industrial
CCGT Combined cycle gas turbine
CCIRS Cross currency interest rate swaps
CEO Chief Executive Officer
CFHR Cash flow hedge reserve
cps cents per share
Cost of energy The net result of trading electricity on the national market and the associated generation and transmission costs
DSR/PSR Deferred share rights / performance share rights
EBITDAF A non-GAAP measure equal to earnings before net interest expense, tax, depreciation and amortisation, changes in fair value of financial instruments and other significant items (refer note A3)
Free cash flow A non-GAAP measure of the cash generating performance of the business. It represents cash available to fund distributions to shareholders and growth capital expenditure. It is equal to operating cash flows less net interest paid and stay-in-business capital expenditure plus proceeds from asset sales
GWh Gigawatt hour
ICT Information, Communication and Technology
LPG Liquid petroleum gas
MWh Megawatt hour
Netback The revenue and expenses of delivering energy and servicing customers.
NEXI Export credit facility
NZ GAAP New Zealand generally accepted accounting practice
NZX New Zealand Stock Exchange
Operating free cash flow A non-GAAP measure equal to Free cash flow less proceeds from asset sales
PJ / GJ Petajoule / Gigajoule (measure of gas)
Significant items Items excluded from EBITDAF and underlying profit. These items are determined in accordance with the principles of consistency, relevance and clarity (refer to note A3)
Swaption Risk management contract with market participant
Underlying profit A non-GAAP measure equal to reported profit/(loss) adjusted for significant items that do not reflect Contact’s ongoing performance (refer note A3)
USPP United States private placement