West Virginia Higher Education Policy Commission and ... · WEST VIRGINIA RE PORT CARD West...
72
WEST VIRGINIA REPORT CARD West Virginia Higher Education Policy Commission and Community and Technical College System of West Virginia 2014
Transcript of West Virginia Higher Education Policy Commission and ... · WEST VIRGINIA RE PORT CARD West...
W E S T V I R G I N I A REPORT CARD
Wes t V i r g in i a H igher Educa t ion Po l i c y Commiss ion andCommun i t y and Techn i ca l Co l l ege Sys tem o f Wes t V i r g in i a
2014

A MESSAGE FROM GOVERNOR EARL RAY TOMBLIN
West Virg
inia Higher Education Po
licy C
ommiss
ion and
Commun
ity and
Tec
hnical College
System of We
st Virg
inia
Simply put – with education and training beyond high school, our entire state is stronger.
As you will find in this year’s Report Card, West Virginia is making marked progress toward achieving a number of bold goals for higher education. We are opening the doors for more West Virginians to pursue postsecondary education, we are supporting them as they work toward their credentials, and we are seeing the far-reaching impact higher education has on our economy and our communities.
West Virginia’s public two- and four-year colleges and universities hold vast potential for West Virginians of all ages and backgrounds. Through these campuses and the diverse programs they offer, the opportunities available to our students are endless – and the possibilities for West Virginia are beyond measure.
WE
ST
VIR
GIN
IAREPORT C
ARD
20
14
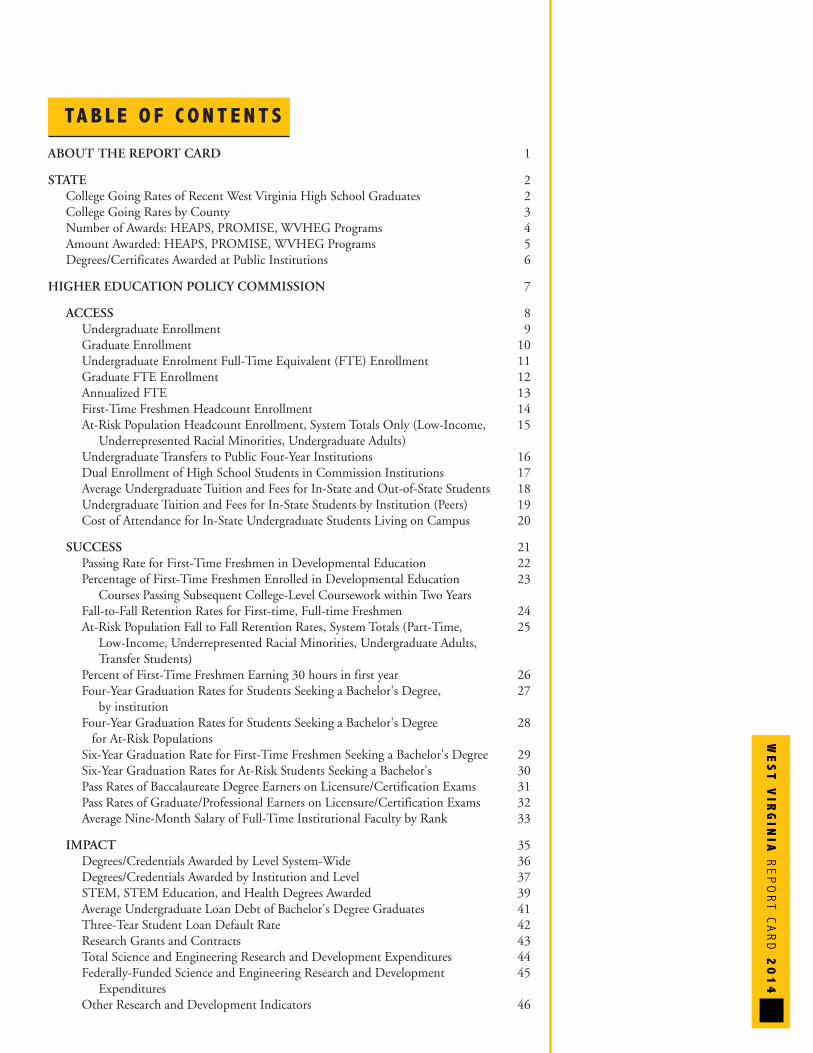
TA B L E O F C ON T EN T S
ABOUT THE REPORT CARD 1
STATE 2College Going Rates of Recent West Virginia High School Graduates 2College Going Rates by County 3Number of Awards: HEAPS, PROMISE, WVHEG Programs 4Amount Awarded: HEAPS, PROMISE, WVHEG Programs 5Degrees/Certificates Awarded at Public Institutions 6
HIGHER EDUCATION POLICY COMMISSION 7
ACCESS 8Undergraduate Enrollment 9Graduate Enrollment 10Undergraduate Enrolment Full-Time Equivalent (FTE) Enrollment 11Graduate FTE Enrollment 12Annualized FTE 13First-Time Freshmen Headcount Enrollment 14At-Risk Population Headcount Enrollment, System Totals Only (Low-Income, 15Underrepresented Racial Minorities, Undergraduate Adults)
Undergraduate Transfers to Public Four-Year Institutions 16Dual Enrollment of High School Students in Commission Institutions 17Average Undergraduate Tuition and Fees for In-State and Out-of-State Students 18Undergraduate Tuition and Fees for In-State Students by Institution (Peers) 19Cost of Attendance for In-State Undergraduate Students Living on Campus 20
SUCCESS 21Passing Rate for First-Time Freshmen in Developmental Education 22Percentage of First-Time Freshmen Enrolled in Developmental Education 23Courses Passing Subsequent College-Level Coursework within Two Years
Fall-to-Fall Retention Rates for First-time, Full-time Freshmen 24 At-Risk Population Fall to Fall Retention Rates, System Totals (Part-Time, 25 Low-Income, Underrepresented Racial Minorities, Undergraduate Adults, Transfer Students)
Percent of First-Time Freshmen Earning 30 hours in first year 26Four-Year Graduation Rates for Students Seeking a Bachelor's Degree, 27by institution
Four-Year Graduation Rates for Students Seeking a Bachelor's Degree 28for At-Risk Populations
Six-Year Graduation Rate for First-Time Freshmen Seeking a Bachelor's Degree 29Six-Year Graduation Rates for At-Risk Students Seeking a Bachelor's 30 Pass Rates of Baccalaureate Degree Earners on Licensure/Certification Exams 31Pass Rates of Graduate/Professional Earners on Licensure/Certification Exams 32Average Nine-Month Salary of Full-Time Institutional Faculty by Rank 33
IMPACT 35Degrees/Credentials Awarded by Level System-Wide 36Degrees/Credentials Awarded by Institution and Level 37STEM, STEM Education, and Health Degrees Awarded 39Average Undergraduate Loan Debt of Bachelor's Degree Graduates 41Three-Tear Student Loan Default Rate 42Research Grants and Contracts 43Total Science and Engineering Research and Development Expenditures 44Federally-Funded Science and Engineering Research and Development 45 Expenditures
Other Research and Development Indicators 46
TAB L E O F C ON T EN T S C O N T I N U E D
West Virg
inia Higher Education Po
licy C
ommiss
ion and
Commun
ity and
Tec
hnical College
System of We
st Virg
inia
COMMUNITY AND TECHNICAL COLLEGE SYSTEM 47
STUDENT SUCCESS 47All Certificates and Degrees Awarded 48Student Success Rate 49Six-Year Graduation Rate of Associate/Certificate-Seeking Students 50One-Year Retention Rates 51 Percentage of Students Enrolling in Developmental Courses 52Pass Rate for First-Time Freshmen In Developmental Courses 53Percentage of First-Time Freshmen Enrolling in Developmental Courses Passing 55 Next Subsequent College-Level Coursework Within 2 Years
Community College Students Entering a Bachelor's Degree Program 56 the Following Fall
Pass Rates of Undergraduate Certificate and Associate's Degree Completers 57On Licensure/Certification Exams
WORKFORCE DEVELOPMENT 58Skill Set Certificate Completers (Less than One-Year) 58Career-Technical Certificate of Applied Science Completers 59Career-Technical Associate Program Completers 60Training Contact (Clock) Hours Delivered 61
ACCESS 62Credit Headcount Enrollment 62Annual Headcount Enrollment 63Credit Headcount Enrollment, Adult Population (Age 25-44) 64
ADDITIONAL COMMISSION AND COUNCIL UPDATES 65
WE
ST
VIR
GIN
IAREPORT C
ARD
20
14
1
A B O U T T H E 2 0 14 R E PORT C A RD
West Virginia Code §18B-1D-8 statutorily mandates the West Virginia Higher Education Report Card. This annual accountability report provides year-end higher education statistics for both of the state’s higher education systems,the West Virginia Higher Education Policy Commission (Commission) and West Virginia Council for Community and Technical College Education (Council). Many of the enrollment, retention, graduation, and financial aid statistics found throughout this publication are reflective of the individual master plans approved by the Commission (Leading the Way Access. Success. Impact. 2013-2018) and Council (Meeting the Challenge 2010-2015).
The systems’ master plans establish aspirational institutional and statewide goals for the state’s public higher education systems at a time when public postsecondary education is a critical component to the economic and civil success of the state. As the Council’s master plan comes to the end of its cycle in 2015, the public two-year system is in the process of developing a comprehensive master plan that renews its commitment to providing high-quality, accessible, and responsive education and training to the citizenry of West Virginia.
When reviewing the statistics throughout this report, it is important to carefully read the“About This Measure” section on each page, which is intended to precisely define what is being measured by any given statistic. This is particularly important when it comes to the cohort, or group of students, of which the statistic is reflective. For example, there are fundamental differences between “full-time” and “part-time” students that can have a drastic effect on reported data.
While, this edition of the West Virginia Higher Education Report Card primarily focuses on the 2013-2014 academic year, several divisions within the Commission and Council are continuously updating different reports and data sources. These additional resources touch on diverse higher education topics specific to West Virginia and can be found in the following locations:
Reports and Publications:
The Reports and Publications page of the Commission’s website provides a majority of the Commission’s annual and ad hoc reports. These include the Financial Aid Comprehensive Report, Higher Education Report Card, the state College-Going Rate Report, High School Academic Readiness Report, and State Reauthorization data, among many others. Historical and current year reporting are available for most reports.
Data Portal:
The Data Portal provides the most current data available for every institution within both the two- and four- year systems. The data is reflective of fall end-of-term reporting and is updated annually. Additional information regarding enrollment, retention, and graduation can be found using this system.
Tuition Summaries:
Updated by the Commission’s Division of Finance, the tuition summaries page provides current and historical tuition and fees for all public institutions across the state.
S TAT E
West Virg
inia Higher Education Po
licy C
ommiss
ion and
Commun
ity and
Tec
hnical College
System of We
st Virg
inia
2
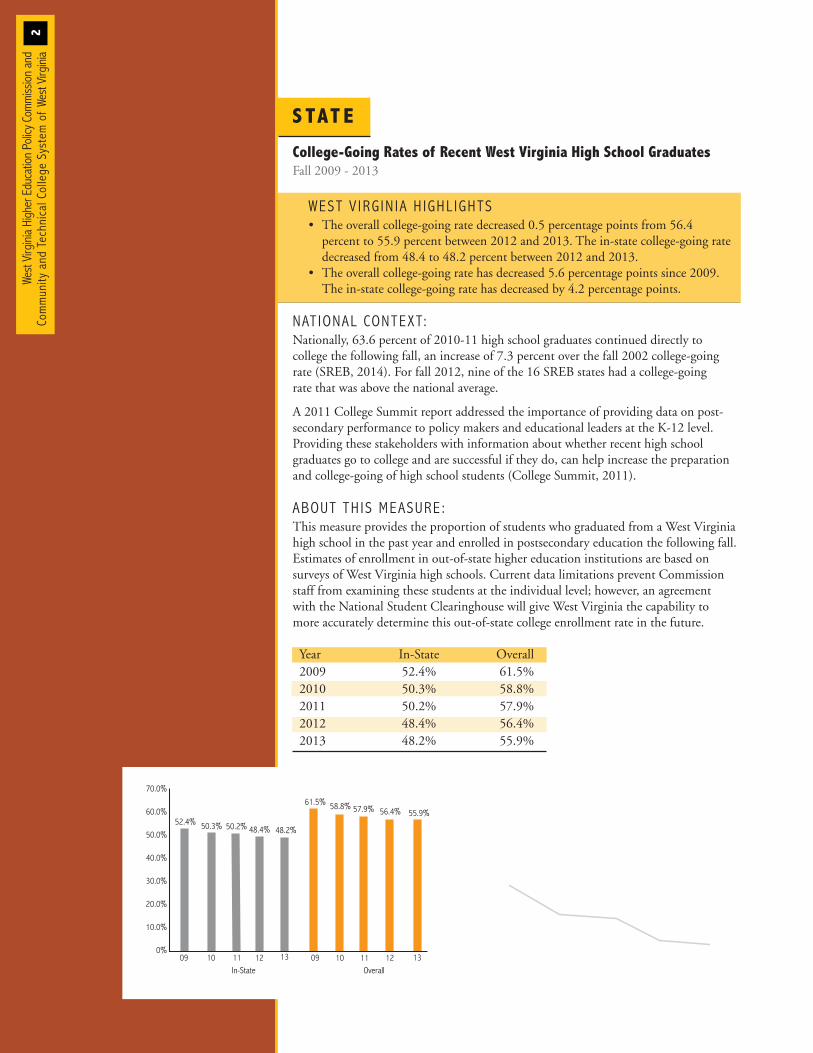
College-Going Rates of Recent West Virginia High School GraduatesFall 2009 - 2013
WEST V IRG IN IA H IGHL IGHTS• The overall college-going rate decreased 0.5 percentage points from 56.4 percent to 55.9 percent between 2012 and 2013. The in-state college-going rate decreased from 48.4 to 48.2 percent between 2012 and 2013.
• The overall college-going rate has decreased 5.6 percentage points since 2009. The in-state college-going rate has decreased by 4.2 percentage points.
NAT IONAL CONTEXT:Nationally, 63.6 percent of 2010-11 high school graduates continued directly to college the following fall, an increase of 7.3 percent over the fall 2002 college-goingrate (SREB, 2014). For fall 2012, nine of the 16 SREB states had a college-going rate that was above the national average.
A 2011 College Summit report addressed the importance of providing data on post-secondary performance to policy makers and educational leaders at the K-12 level. Providing these stakeholders with information about whether recent high school graduates go to college and are successful if they do, can help increase the preparationand college-going of high school students (College Summit, 2011).
ABOUT TH IS MEASURE :This measure provides the proportion of students who graduated from a West Virginiahigh school in the past year and enrolled in postsecondary education the following fall.Estimates of enrollment in out-of-state higher education institutions are based on surveys of West Virginia high schools. Current data limitations prevent Commissionstaff from examining these students at the individual level; however, an agreement with the National Student Clearinghouse will give West Virginia the capability to more accurately determine this out-of-state college enrollment rate in the future.
Year In-State Overall2009 52.4% 61.5%2010 50.3% 58.8%2011 50.2% 57.9%2012 48.4% 56.4%2013 48.2% 55.9%
Overall
70.0%
60.0%
50.0%
40.0%
30.0%
20.0%
10.0%
0%11 12 1309
48.4%52.4% 50.3% 50.2%
In-State11 12 1309Overall
55.9%57.9% 56.4%
4
10 10
48.2%
61.5% 58.8%
4
Overall
11 12 1309 10
4
48.2%
6O.0%
58.0%
56.0%
54.0%
52.0%
50.0%
48.0%
56.4%57.9%
1
48.4%
52.4%
50.3%
61.5%
58.8%
50.2%
55.9%
In-State Overall
7
WE
ST
VIR
GIN
IAR
EP
OR
T C
AR
D2
01
43
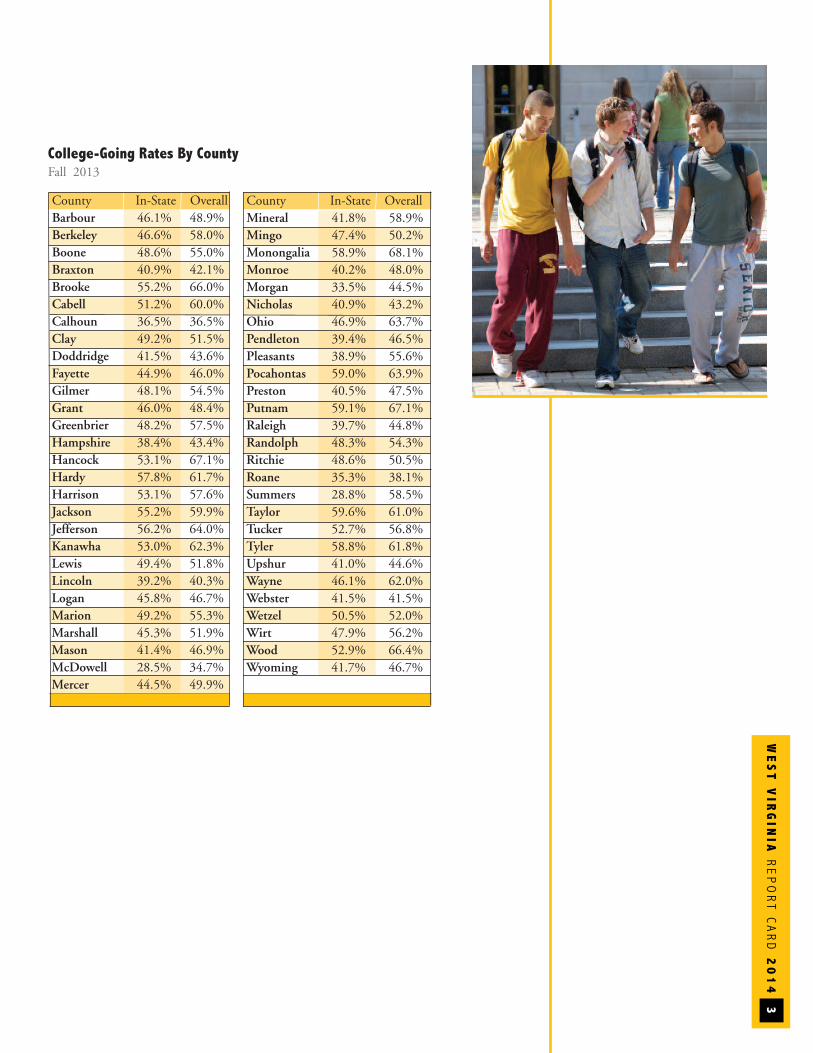
County In-State OverallMineral 41.8% 58.9%Mingo 47.4% 50.2%Monongalia 58.9% 68.1%Monroe 40.2% 48.0%Morgan 33.5% 44.5%Nicholas 40.9% 43.2%Ohio 46.9% 63.7%Pendleton 39.4% 46.5%Pleasants 38.9% 55.6%Pocahontas 59.0% 63.9%Preston 40.5% 47.5%Putnam 59.1% 67.1%Raleigh 39.7% 44.8%Randolph 48.3% 54.3%Ritchie 48.6% 50.5%Roane 35.3% 38.1%Summers 28.8% 58.5%Taylor 59.6% 61.0%Tucker 52.7% 56.8%Tyler 58.8% 61.8%Upshur 41.0% 44.6%Wayne 46.1% 62.0%Webster 41.5% 41.5%Wetzel 50.5% 52.0%Wirt 47.9% 56.2%Wood 52.9% 66.4%Wyoming 41.7% 46.7%
County In-State OverallBarbour 46.1% 48.9%Berkeley 46.6% 58.0%Boone 48.6% 55.0%Braxton 40.9% 42.1%Brooke 55.2% 66.0%Cabell 51.2% 60.0%Calhoun 36.5% 36.5%Clay 49.2% 51.5%Doddridge 41.5% 43.6%Fayette 44.9% 46.0%Gilmer 48.1% 54.5%Grant 46.0% 48.4%Greenbrier 48.2% 57.5%Hampshire 38.4% 43.4%Hancock 53.1% 67.1%Hardy 57.8% 61.7%Harrison 53.1% 57.6%Jackson 55.2% 59.9%Jefferson 56.2% 64.0%Kanawha 53.0% 62.3%Lewis 49.4% 51.8%Lincoln 39.2% 40.3%Logan 45.8% 46.7%Marion 49.2% 55.3%Marshall 45.3% 51.9%Mason 41.4% 46.9%McDowell 28.5% 34.7%Mercer 44.5% 49.9%
College-Going Rates By CountyFall 2013
S TAT E
4
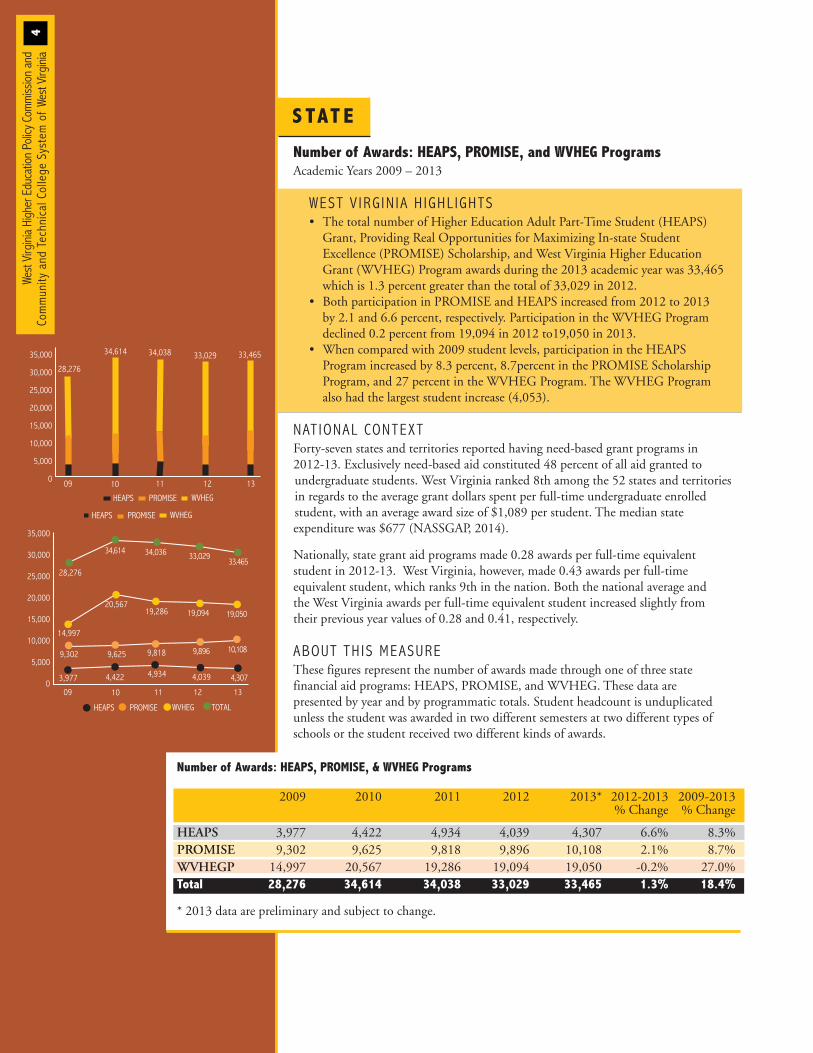
Number of Awards: HEAPS, PROMISE, and WVHEG ProgramsAcademic Years 2009 – 2013
WEST V IRG IN IA H IGHL IGHTS• The total number of Higher Education Adult Part-Time Student (HEAPS) Grant, Providing Real Opportunities for Maximizing In-state Student Excellence (PROMISE) Scholarship, and West Virginia Higher Education Grant (WVHEG) Program awards during the 2013 academic year was 33,465 which is 1.3 percent greater than the total of 33,029 in 2012.
• Both participation in PROMISE and HEAPS increased from 2012 to 2013 by 2.1 and 6.6 percent, respectively. Participation in the WVHEG Program declined 0.2 percent from 19,094 in 2012 to19,050 in 2013.
• When compared with 2009 student levels, participation in the HEAPS Program increased by 8.3 percent, 8.7percent in the PROMISE Scholarship Program, and 27 percent in the WVHEG Program. The WVHEG Program also had the largest student increase (4,053).
NAT IONAL CONTEXTForty-seven states and territories reported having need-based grant programs in 2012-13. Exclusively need-based aid constituted 48 percent of all aid granted to undergraduate students. West Virginia ranked 8th among the 52 states and territoriesin regards to the average grant dollars spent per full-time undergraduate enrolled student, with an average award size of $1,089 per student. The median state expenditure was $677 (NASSGAP, 2014).
Nationally, state grant aid programs made 0.28 awards per full-time equivalent student in 2012-13. West Virginia, however, made 0.43 awards per full-time equivalent student, which ranks 9th in the nation. Both the national average and the West Virginia awards per full-time equivalent student increased slightly from their previous year values of 0.28 and 0.41, respectively.
ABOUT TH IS MEASUREThese figures represent the number of awards made through one of three state financial aid programs: HEAPS, PROMISE, and WVHEG. These data are presented by year and by programmatic totals. Student headcount is unduplicated unless the student was awarded in two different semesters at two different types ofschools or the student received two different kinds of awards.
35,000
30,000
25,000
20,000
15,000
10,000
5,000
011 12 1309 10
33.46534,614 34,036 33,029
28,276
4,3074,422 4,934 4,0393,977
9,8969,625 9,818 10,1089,302
19,09420,567
19,286 19,050
14,997
HEAPS PROMISE WVHEG TOTAL
35,000
30,000
25,000
20,000
15,000
10,000
5,000
0 11 12 1309 10
33,46534,614 34,038 33,029
28,276
HEAPS PROMISE WVHEG
HEAPS PROMISE WVHEG
Number of Awards: HEAPS, PROMISE, & WVHEG Programs
2009 2010 2011 2012 2013* 2012-2013 2009-2013 % Change % Change
HEAPS 3,977 4,422 4,934 4,039 4,307 6.6% 8.3%PROMISE 9,302 9,625 9,818 9,896 10,108 2.1% 8.7%WVHEGP 14,997 20,567 19,286 19,094 19,050 -0.2% 27.0%Total 28,276 34,614 34,038 33,029 33,465 1.3% 18.4%
* 2013 data are preliminary and subject to change.
West Virg
inia Higher Education Po
licy C
ommiss
ion and
Commun
ity and
Tec
hnical College
System of We
st Virg
inia
WE
ST
VIR
GIN
IAREPORT C
ARD
20
14
5
$95,000
$90,000
$85,000
$80,000
$75,000
$70,000
$65,000
$83,421
$88,626
$92,178 $92,431$90,086
11 12 1309 10 11 12 1309 10
$100,000
$80,000
$60,000
$40,000
$20,000
0
$83,421$90,086 $88,626
$92,178
$
$92,431
H
11 12 1309 10 11 12 1309 10
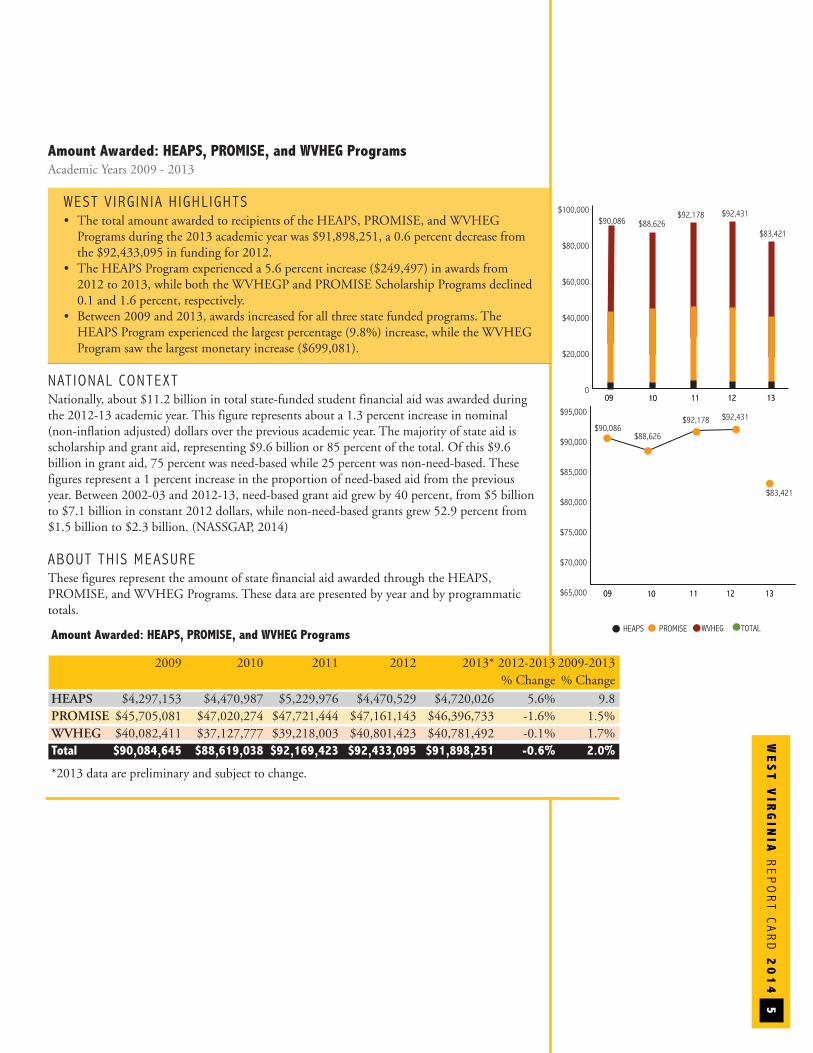
HEAPS PROMISE WVHEG TOTALAmount Awarded: HEAPS, PROMISE, and WVHEG Programs
2009 2010 2011 2012 2013* 2012-2013 2009-2013 % Change % Change
HEAPS $4,297,153 $4,470,987 $5,229,976 $4,470,529 $4,720,026 5.6% 9.8PROMISE $45,705,081 $47,020,274 $47,721,444 $47,161,143 $46,396,733 -1.6% 1.5%WVHEG $40,082,411 $37,127,777 $39,218,003 $40,801,423 $40,781,492 -0.1% 1.7%Total $90,084,645 $88,619,038 $92,169,423 $92,433,095 $91,898,251 -0.6% 2.0%
*2013 data are preliminary and subject to change.
Amount Awarded: HEAPS, PROMISE, and WVHEG ProgramsAcademic Years 2009 - 2013
WEST V IRG IN IA H IGHL IGHTS• The total amount awarded to recipients of the HEAPS, PROMISE, and WVHEG Programs during the 2013 academic year was $91,898,251, a 0.6 percent decrease from the $92,433,095 in funding for 2012.
• The HEAPS Program experienced a 5.6 percent increase ($249,497) in awards from 2012 to 2013, while both the WVHEGP and PROMISE Scholarship Programs declined 0.1 and 1.6 percent, respectively.
• Between 2009 and 2013, awards increased for all three state funded programs. The HEAPS Program experienced the largest percentage (9.8%) increase, while the WVHEG Program saw the largest monetary increase ($699,081).
NAT IONAL CONTEXTNationally, about $11.2 billion in total state-funded student financial aid was awarded duringthe 2012-13 academic year. This figure represents about a 1.3 percent increase in nominal(non-inflation adjusted) dollars over the previous academic year. The majority of state aid isscholarship and grant aid, representing $9.6 billion or 85 percent of the total. Of this $9.6 billion in grant aid, 75 percent was need-based while 25 percent was non-need-based. Thesefigures represent a 1 percent increase in the proportion of need-based aid from the previousyear. Between 2002-03 and 2012-13, need-based grant aid grew by 40 percent, from $5 billionto $7.1 billion in constant 2012 dollars, while non-need-based grants grew 52.9 percent from$1.5 billion to $2.3 billion. (NASSGAP, 2014)
ABOUT TH IS MEASUREThese figures represent the amount of state financial aid awarded through the HEAPS, PROMISE, and WVHEG Programs. These data are presented by year and by programmatictotals.
S TAT E
West Virg
inia Higher Education Po
licy C
ommiss
ion and
Commun
ity and
Tec
hnical College
System of We
st Virg
inia
6
09 10 11
14,733
15,04018,000
16,000
14,000
12,000
10,000
8,000
6,000
4,000
2,000
004 05 06 07
15,18515,733
16,51218,012
08
14,917
16,938
12
14,206
13
13,963
14,733
15,040
16,512
16,938
18,012
13,963
14,206
10 11 12 1304 05 06 07 08
18,000
17,000
16,500
16,000
15,500
15,000
14,500
14,000
13,500
13,000
14,917
09
15,185
15,733
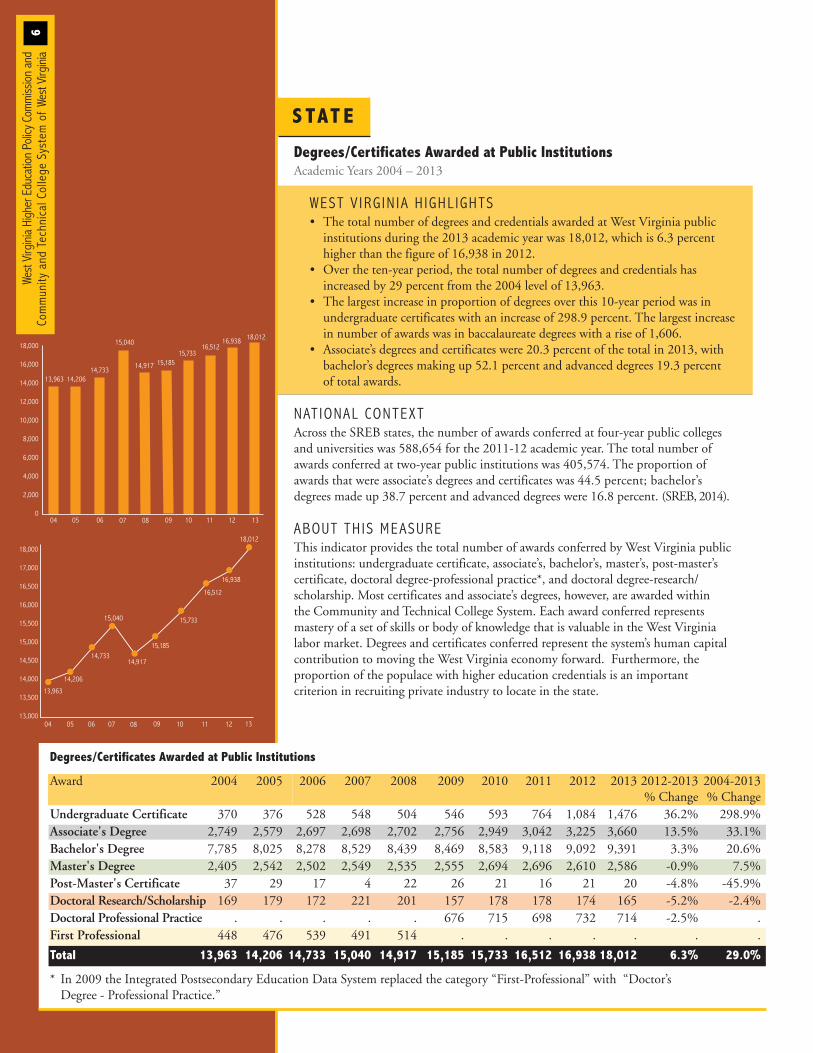
Degrees/Certificates Awarded at Public Institutions
Award 2004 2005 2006 2007 2008 2009 2010 2011 2012 2013 2012-2013 2004-2013 % Change % Change
Undergraduate Certificate 370 376 528 548 504 546 593 764 1,084 1,476 36.2% 298.9%Associate's Degree 2,749 2,579 2,697 2,698 2,702 2,756 2,949 3,042 3,225 3,660 13.5% 33.1%Bachelor's Degree 7,785 8,025 8,278 8,529 8,439 8,469 8,583 9,118 9,092 9,391 3.3% 20.6%Master's Degree 2,405 2,542 2,502 2,549 2,535 2,555 2,694 2,696 2,610 2,586 -0.9% 7.5%Post-Master's Certificate 37 29 17 4 22 26 21 16 21 20 -4.8% -45.9%Doctoral Research/Scholarship 169 179 172 221 201 157 178 178 174 165 -5.2% -2.4%Doctoral Professional Practice . . . . . 676 715 698 732 714 -2.5% .First Professional 448 476 539 491 514 . . . . . . .
Total 13,963 14,206 14,733 15,040 14,917 15,185 15,733 16,512 16,938 18,012 6.3% 29.0%
* In 2009 the Integrated Postsecondary Education Data System replaced the category “First-Professional” with “Doctor’s Degree - Professional Practice.”
Degrees/Certificates Awarded at Public InstitutionsAcademic Years 2004 – 2013
WEST V IRG IN IA H IGHL IGHTS• The total number of degrees and credentials awarded at West Virginia public institutions during the 2013 academic year was 18,012, which is 6.3 percent higher than the figure of 16,938 in 2012.
• Over the ten-year period, the total number of degrees and credentials has increased by 29 percent from the 2004 level of 13,963.
• The largest increase in proportion of degrees over this 10-year period was in undergraduate certificates with an increase of 298.9 percent. The largest increase in number of awards was in baccalaureate degrees with a rise of 1,606.
• Associate’s degrees and certificates were 20.3 percent of the total in 2013, with bachelor’s degrees making up 52.1 percent and advanced degrees 19.3 percent of total awards.
NAT IONAL CONTEXTAcross the SREB states, the number of awards conferred at four-year public collegesand universities was 588,654 for the 2011-12 academic year. The total number ofawards conferred at two-year public institutions was 405,574. The proportion ofawards that were associate’s degrees and certificates was 44.5 percent; bachelor’s degrees made up 38.7 percent and advanced degrees were 16.8 percent. (SREB, 2014).
ABOUT TH IS MEASUREThis indicator provides the total number of awards conferred by West Virginia publicinstitutions: undergraduate certificate, associate’s, bachelor’s, master’s, post-master’s certificate, doctoral degree-professional practice*, and doctoral degree-research/scholarship. Most certificates and associate’s degrees, however, are awarded within the Community and Technical College System. Each award conferred represents mastery of a set of skills or body of knowledge that is valuable in the West Virginialabor market. Degrees and certificates conferred represent the system’s human capital contribution to moving the West Virginia economy forward. Furthermore, the proportion of the populace with higher education credentials is an important criterion in recruiting private industry to locate in the state.
WE
ST
VIR
GIN
IAREPORT C
ARD
20
14
7
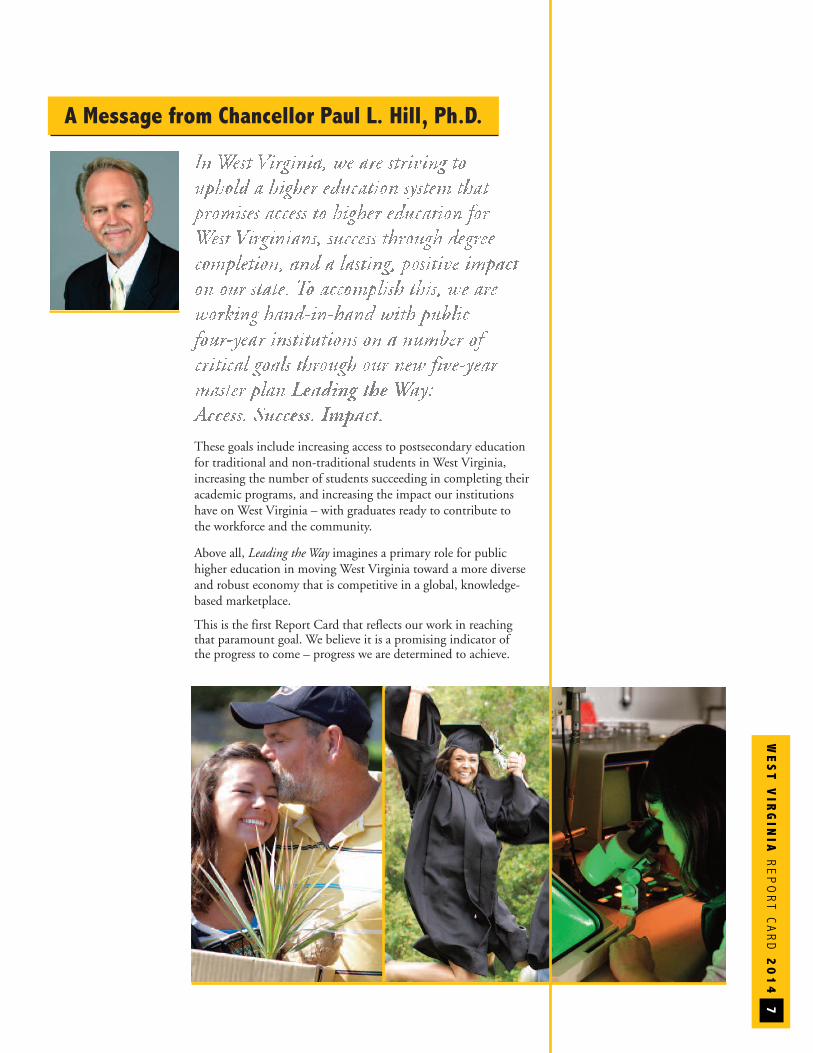
A Message from Chancellor Paul L. Hill, Ph.D.
These goals include increasing access to postsecondary educationfor traditional and non-traditional students in West Virginia, increasing the number of students succeeding in completing theiracademic programs, and increasing the impact our institutionshave on West Virginia – with graduates ready to contribute to the workforce and the community.
Above all, Leading the Way imagines a primary role for publichigher education in moving West Virginia toward a more diverseand robust economy that is competitive in a global, knowledge-based marketplace.
This is the first Report Card that reflects our work in reaching that paramount goal. We believe it is a promising indicator of the progress to come – progress we are determined to achieve.
AC C E S S
West Virg
inia Higher Education Po
licy C
ommiss
ion and
Commun
ity and
Tec
hnical College
System of We
st Virg
inia
8
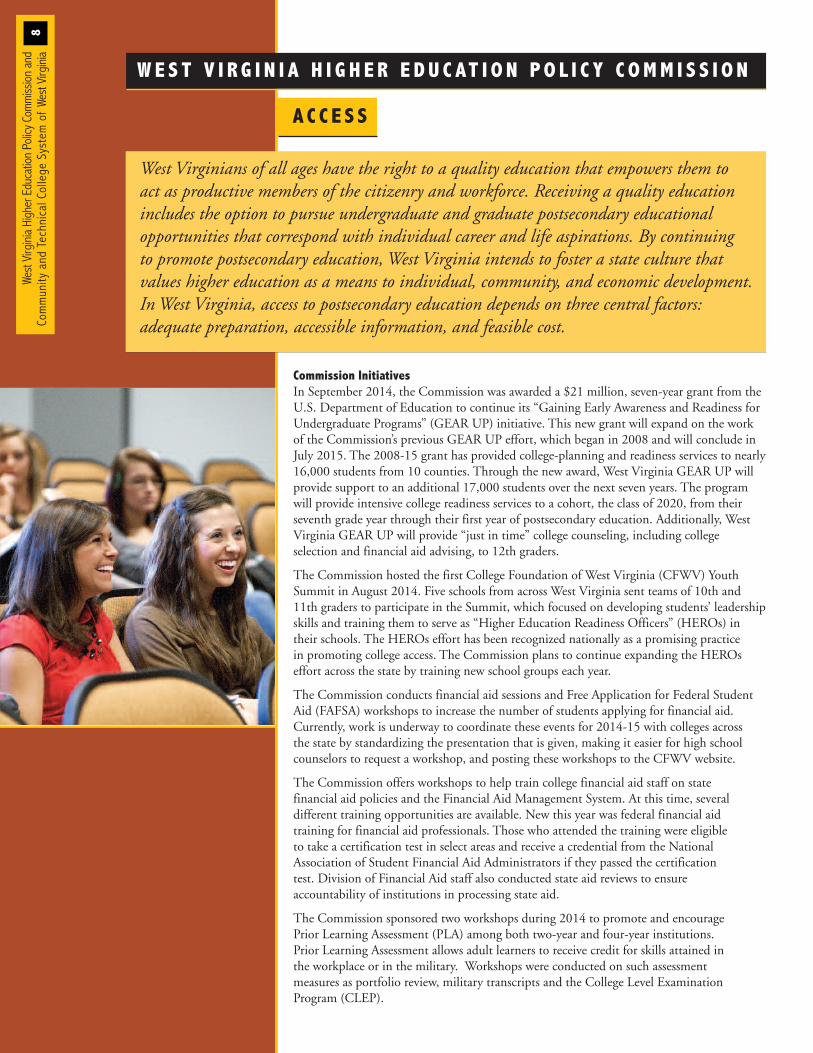
Commission InitiativesIn September 2014, the Commission was awarded a $21 million, seven-year grant from theU.S. Department of Education to continue its “Gaining Early Awareness and Readiness forUndergraduate Programs” (GEAR UP) initiative. This new grant will expand on the workof the Commission’s previous GEAR UP effort, which began in 2008 and will conclude inJuly 2015. The 2008-15 grant has provided college-planning and readiness services to nearly16,000 students from 10 counties. Through the new award, West Virginia GEAR UP willprovide support to an additional 17,000 students over the next seven years. The programwill provide intensive college readiness services to a cohort, the class of 2020, from their seventh grade year through their first year of postsecondary education. Additionally, WestVirginia GEAR UP will provide “just in time” college counseling, including college selection and financial aid advising, to 12th graders.
The Commission hosted the first College Foundation of West Virginia (CFWV) YouthSummit in August 2014. Five schools from across West Virginia sent teams of 10th and11th graders to participate in the Summit, which focused on developing students’ leadershipskills and training them to serve as “Higher Education Readiness Officers” (HEROs) intheir schools. The HEROs effort has been recognized nationally as a promising practice in promoting college access. The Commission plans to continue expanding the HEROs effort across the state by training new school groups each year.
The Commission conducts financial aid sessions and Free Application for Federal StudentAid (FAFSA) workshops to increase the number of students applying for financial aid. Currently, work is underway to coordinate these events for 2014-15 with colleges across the state by standardizing the presentation that is given, making it easier for high schoolcounselors to request a workshop, and posting these workshops to the CFWV website.
The Commission offers workshops to help train college financial aid staff on state financial aid policies and the Financial Aid Management System. At this time, several different training opportunities are available. New this year was federal financial aid training for financial aid professionals. Those who attended the training were eligible to take a certification test in select areas and receive a credential from the National Association of Student Financial Aid Administrators if they passed the certification test. Division of Financial Aid staff also conducted state aid reviews to ensure accountability of institutions in processing state aid.
The Commission sponsored two workshops during 2014 to promote and encourage Prior Learning Assessment (PLA) among both two-year and four-year institutions. Prior Learning Assessment allows adult learners to receive credit for skills attained in the workplace or in the military. Workshops were conducted on such assessment measures as portfolio review, military transcripts and the College Level ExaminationProgram (CLEP).
West Virginians of all ages have the right to a quality education that empowers them to act as productive members of the citizenry and workforce. Receiving a quality education includes the option to pursue undergraduate and graduate postsecondary educational opportunities that correspond with individual career and life aspirations. By continuing to promote postsecondary education, West Virginia intends to foster a state culture that values higher education as a means to individual, community, and economic development.In West Virginia, access to postsecondary education depends on three central factors: adequate preparation, accessible information, and feasible cost.
W E S T V I R G I N I A H I G H E R E D U C AT I O N P O L I C Y C O M M I S S I O N
WE
ST
VIR
GIN
IAREPORT C
ARD
20
14
9
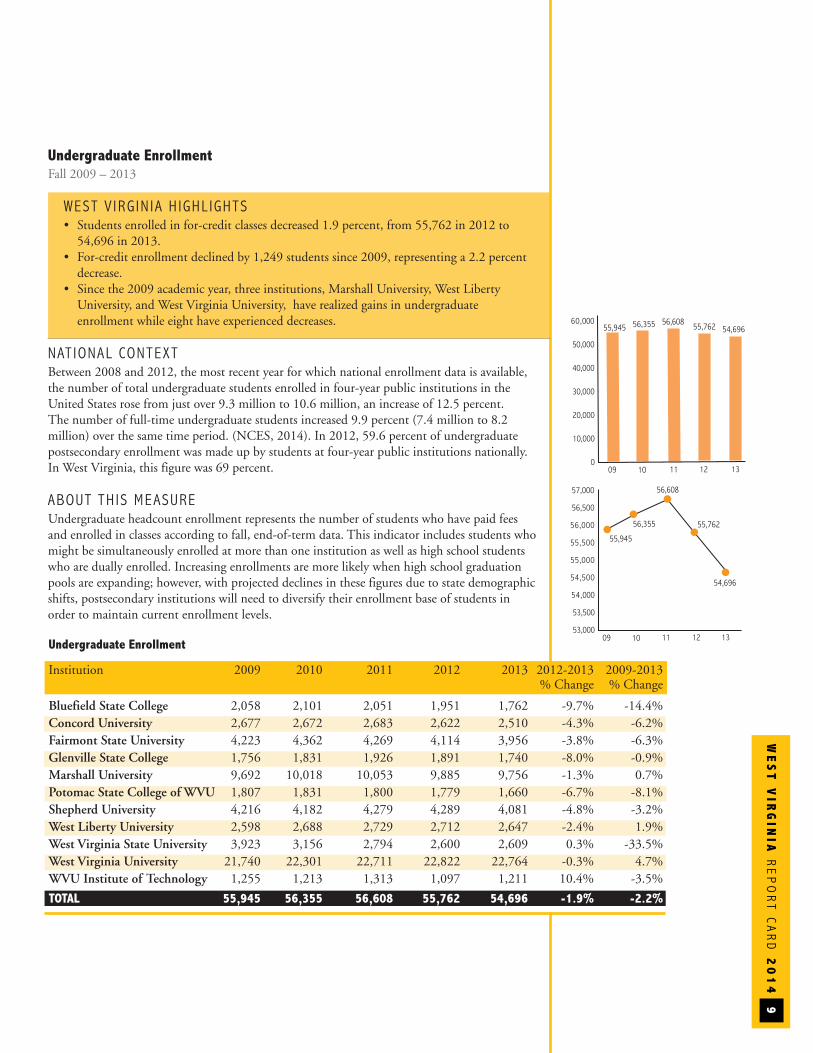
Undergraduate EnrollmentFall 2009 – 2013
WEST V IRG IN IA H IGHL IGHTS• Students enrolled in for-credit classes decreased 1.9 percent, from 55,762 in 2012 to 54,696 in 2013.
• For-credit enrollment declined by 1,249 students since 2009, representing a 2.2 percent decrease.
• Since the 2009 academic year, three institutions, Marshall University, West Liberty University, and West Virginia University, have realized gains in undergraduate enrollment while eight have experienced decreases.
NAT IONAL CONTEXTBetween 2008 and 2012, the most recent year for which national enrollment data is available,the number of total undergraduate students enrolled in four-year public institutions in theUnited States rose from just over 9.3 million to 10.6 million, an increase of 12.5 percent. The number of full-time undergraduate students increased 9.9 percent (7.4 million to 8.2 million) over the same time period. (NCES, 2014). In 2012, 59.6 percent of undergraduatepostsecondary enrollment was made up by students at four-year public institutions nationally.In West Virginia, this figure was 69 percent.
ABOUT TH IS MEASUREUndergraduate headcount enrollment represents the number of students who have paid feesand enrolled in classes according to fall, end-of-term data. This indicator includes students whomight be simultaneously enrolled at more than one institution as well as high school studentswho are dually enrolled. Increasing enrollments are more likely when high school graduationpools are expanding; however, with projected declines in these figures due to state demographicshifts, postsecondary institutions will need to diversify their enrollment base of students inorder to maintain current enrollment levels.
55,945 56,355 56,60860,000
50,000
40,000
30,000
20,000
10,000
011 12 1309 10
55,762
54,696
57,000
56,500
56,000
55,500
55,000
54,500
54,000
53,500
53,000
56,355
56,608
55,762
54,696
55,945
11 12 1309 10
Undergraduate Enrollment
Institution 2009 2010 2011 2012 2013 2012-2013 2009-2013% Change % Change
Bluefield State College 2,058 2,101 2,051 1,951 1,762 -9.7% -14.4%Concord University 2,677 2,672 2,683 2,622 2,510 -4.3% -6.2%Fairmont State University 4,223 4,362 4,269 4,114 3,956 -3.8% -6.3%Glenville State College 1,756 1,831 1,926 1,891 1,740 -8.0% -0.9%Marshall University 9,692 10,018 10,053 9,885 9,756 -1.3% 0.7%Potomac State College of WVU 1,807 1,831 1,800 1,779 1,660 -6.7% -8.1%Shepherd University 4,216 4,182 4,279 4,289 4,081 -4.8% -3.2%West Liberty University 2,598 2,688 2,729 2,712 2,647 -2.4% 1.9%West Virginia State University 3,923 3,156 2,794 2,600 2,609 0.3% -33.5%West Virginia University 21,740 22,301 22,711 22,822 22,764 -0.3% 4.7%WVU Institute of Technology 1,255 1,213 1,313 1,097 1,211 10.4% -3.5%
TOTAL 55,945 56,355 56,608 55,762 54,696 -1.9% -2.2%
AC C E S S
West Virg
inia Higher Education Po
licy C
ommiss
ion and
Commun
ity and
Tec
hnical College
System of We
st Virg
inia
10
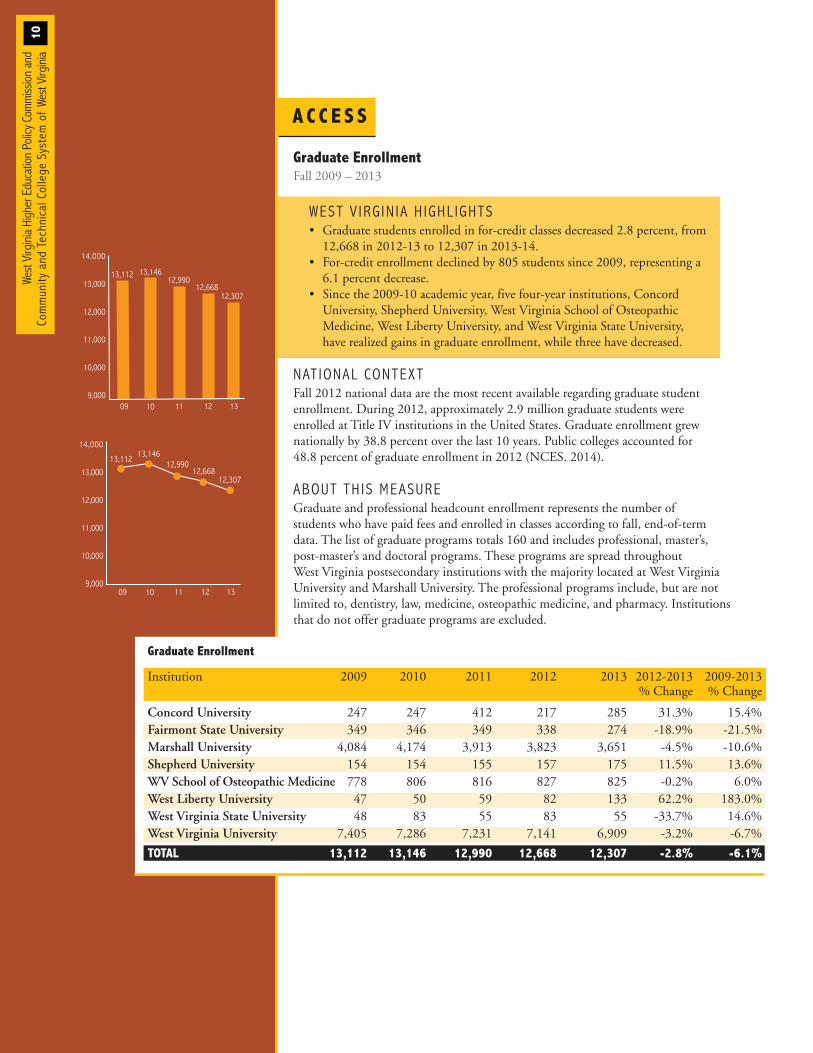
Graduate EnrollmentFall 2009 – 2013
WEST V IRG IN IA H IGHL IGHTS• Graduate students enrolled in for-credit classes decreased 2.8 percent, from 12,668 in 2012-13 to 12,307 in 2013-14.
• For-credit enrollment declined by 805 students since 2009, representing a 6.1 percent decrease.
• Since the 2009-10 academic year, five four-year institutions, Concord University, Shepherd University, West Virginia School of Osteopathic Medicine, West Liberty University, and West Virginia State University, have realized gains in graduate enrollment, while three have decreased.
NAT IONAL CONTEXTFall 2012 national data are the most recent available regarding graduate student enrollment. During 2012, approximately 2.9 million graduate students were enrolled at Title IV institutions in the United States. Graduate enrollment grew nationally by 38.8 percent over the last 10 years. Public colleges accounted for 48.8 percent of graduate enrollment in 2012 (NCES. 2014).
ABOUT TH IS MEASUREGraduate and professional headcount enrollment represents the number of students who have paid fees and enrolled in classes according to fall, end-of-term data. The list of graduate programs totals 160 and includes professional, master’s, post-master’s and doctoral programs. These programs are spread throughout West Virginia postsecondary institutions with the majority located at West Virginia University and Marshall University. The professional programs include, but are notlimited to, dentistry, law, medicine, osteopathic medicine, and pharmacy. Institutionsthat do not offer graduate programs are excluded.
Graduate Enrollment
Institution 2009 2010 2011 2012 2013 2012-2013 2009-2013% Change % Change
Concord University 247 247 412 217 285 31.3% 15.4%Fairmont State University 349 346 349 338 274 -18.9% -21.5%Marshall University 4,084 4,174 3,913 3,823 3,651 -4.5% -10.6%Shepherd University 154 154 155 157 175 11.5% 13.6%WV School of Osteopathic Medicine 778 806 816 827 825 -0.2% 6.0%West Liberty University 47 50 59 82 133 62.2% 183.0%West Virginia State University 48 83 55 83 55 -33.7% 14.6%West Virginia University 7,405 7,286 7,231 7,141 6,909 -3.2% -6.7%
TOTAL 13,112 13,146 12,990 12,668 12,307 -2.8% -6.1%
12,307
13,112 13,14612,990
12,668
14,000
13,000
12,000
11,000
10,000
9,00011 12 1309 10
11 12 1309 10
12,307
13,112 13,14612,990
12,668
14,000
13,000
12,000
11,000
10,000
9,000
WE
ST
VIR
GIN
IAREPORT C
ARD
20
14
11
50,74551,378 52,478 52,499 51,901
60,000
50,000
40,000
30,000
20,000
10,000
011 12 1309 10
53,000
52,000
51,000
50,000
49,000
48,000
50,745
51,378
52,499
11 12 1309 10
52,478
51,901
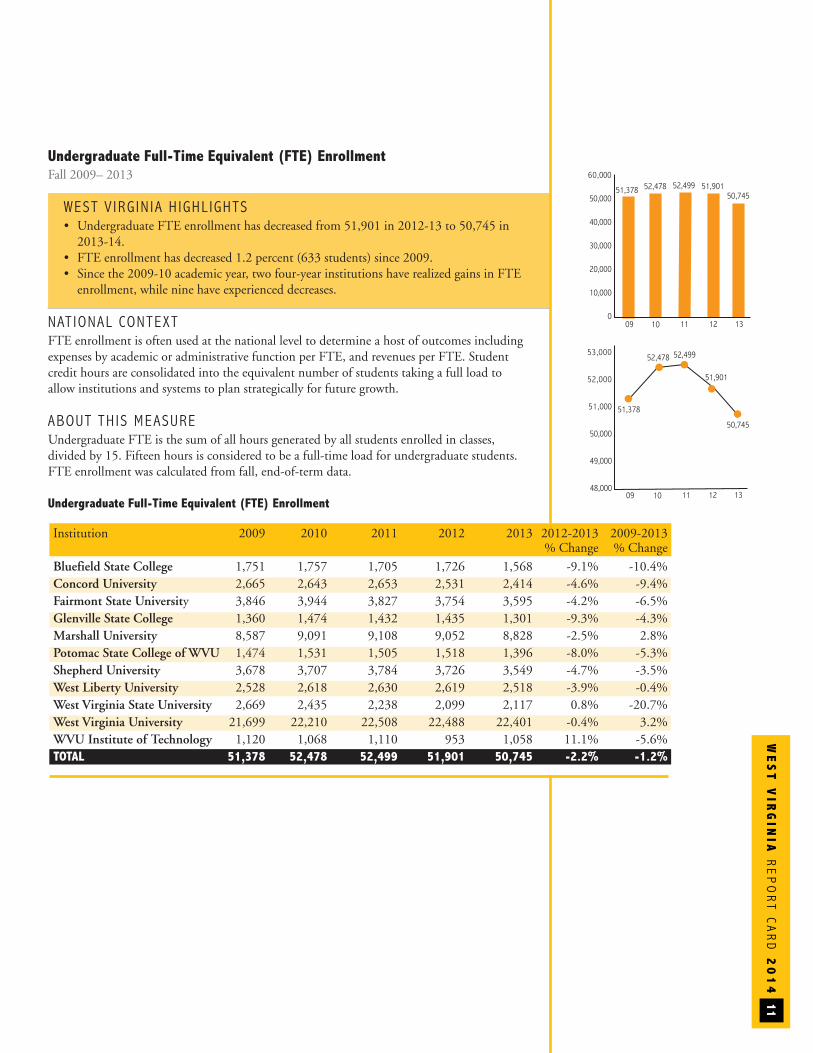
Undergraduate Full-Time Equivalent (FTE) EnrollmentFall 2009– 2013
WEST V IRG IN IA H IGHL IGHTS• Undergraduate FTE enrollment has decreased from 51,901 in 2012-13 to 50,745 in 2013-14.
• FTE enrollment has decreased 1.2 percent (633 students) since 2009.• Since the 2009-10 academic year, two four-year institutions have realized gains in FTE enrollment, while nine have experienced decreases.
NAT IONAL CONTEXTFTE enrollment is often used at the national level to determine a host of outcomes includingexpenses by academic or administrative function per FTE, and revenues per FTE. Studentcredit hours are consolidated into the equivalent number of students taking a full load to allow institutions and systems to plan strategically for future growth.
ABOUT TH IS MEASUREUndergraduate FTE is the sum of all hours generated by all students enrolled in classes, divided by 15. Fifteen hours is considered to be a full-time load for undergraduate students.FTE enrollment was calculated from fall, end-of-term data.
Undergraduate Full-Time Equivalent (FTE) Enrollment
Institution 2009 2010 2011 2012 2013 2012-2013 2009-2013% Change % Change
Bluefield State College 1,751 1,757 1,705 1,726 1,568 -9.1% -10.4%Concord University 2,665 2,643 2,653 2,531 2,414 -4.6% -9.4%Fairmont State University 3,846 3,944 3,827 3,754 3,595 -4.2% -6.5%Glenville State College 1,360 1,474 1,432 1,435 1,301 -9.3% -4.3%Marshall University 8,587 9,091 9,108 9,052 8,828 -2.5% 2.8%Potomac State College of WVU 1,474 1,531 1,505 1,518 1,396 -8.0% -5.3%Shepherd University 3,678 3,707 3,784 3,726 3,549 -4.7% -3.5%West Liberty University 2,528 2,618 2,630 2,619 2,518 -3.9% -0.4%West Virginia State University 2,669 2,435 2,238 2,099 2,117 0.8% -20.7%West Virginia University 21,699 22,210 22,508 22,488 22,401 -0.4% 3.2%WVU Institute of Technology 1,120 1,068 1,110 953 1,058 11.1% -5.6%TOTAL 51,378 52,478 52,499 51,901 50,745 -2.2% -1.2%
AC C E S S
West Virg
inia Higher Education Po
licy C
ommiss
ion and
Commun
ity and
Tec
hnical College
System of We
st Virg
inia
12
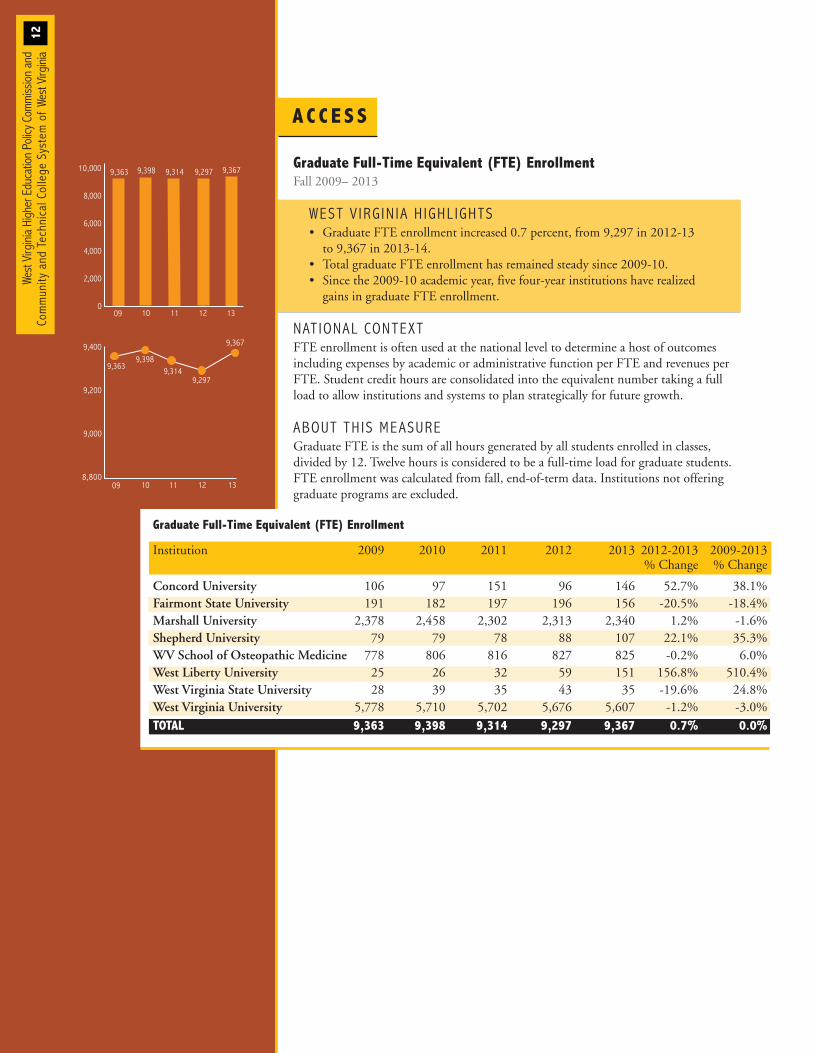
Graduate Full-Time Equivalent (FTE) EnrollmentFall 2009– 2013
WEST V IRG IN IA H IGHL IGHTS• Graduate FTE enrollment increased 0.7 percent, from 9,297 in 2012-13 to 9,367 in 2013-14.
• Total graduate FTE enrollment has remained steady since 2009-10.• Since the 2009-10 academic year, five four-year institutions have realized gains in graduate FTE enrollment.
NAT IONAL CONTEXTFTE enrollment is often used at the national level to determine a host of outcomes including expenses by academic or administrative function per FTE and revenues perFTE. Student credit hours are consolidated into the equivalent number taking a fullload to allow institutions and systems to plan strategically for future growth.
ABOUT TH IS MEASUREGraduate FTE is the sum of all hours generated by all students enrolled in classes, divided by 12. Twelve hours is considered to be a full-time load for graduate students.FTE enrollment was calculated from fall, end-of-term data. Institutions not offeringgraduate programs are excluded.
Graduate Full-Time Equivalent (FTE) Enrollment
Institution 2009 2010 2011 2012 2013 2012-2013 2009-2013% Change % Change
Concord University 106 97 151 96 146 52.7% 38.1%Fairmont State University 191 182 197 196 156 -20.5% -18.4%Marshall University 2,378 2,458 2,302 2,313 2,340 1.2% -1.6%Shepherd University 79 79 78 88 107 22.1% 35.3%WV School of Osteopathic Medicine 778 806 816 827 825 -0.2% 6.0%West Liberty University 25 26 32 59 151 156.8% 510.4%West Virginia State University 28 39 35 43 35 -19.6% 24.8%West Virginia University 5,778 5,710 5,702 5,676 5,607 -1.2% -3.0%TOTAL 9,363 9,398 9,314 9,297 9,367 0.7% 0.0%
9,3679,363 9,398 9,29710,000
8,000
6,000
4,000
2,000
011 1209 10
9,314
13
9,400
9,200
9,000
8,800
9,3989,3149,363
10 11 12 1309
9,297
9,367
WE
ST
VIR
GIN
IAREPORT C
ARD
20
14
13
62,52963,418 64,697 64,427 63,72665,000
55,000
45,000
35,000
25,000
15,000
5,000
011 12 1309 10
11 12 1309 10
62,529
63,418
64,697 64,427 63,72665,000
64,000
63,000
62,000
61,000
60,000
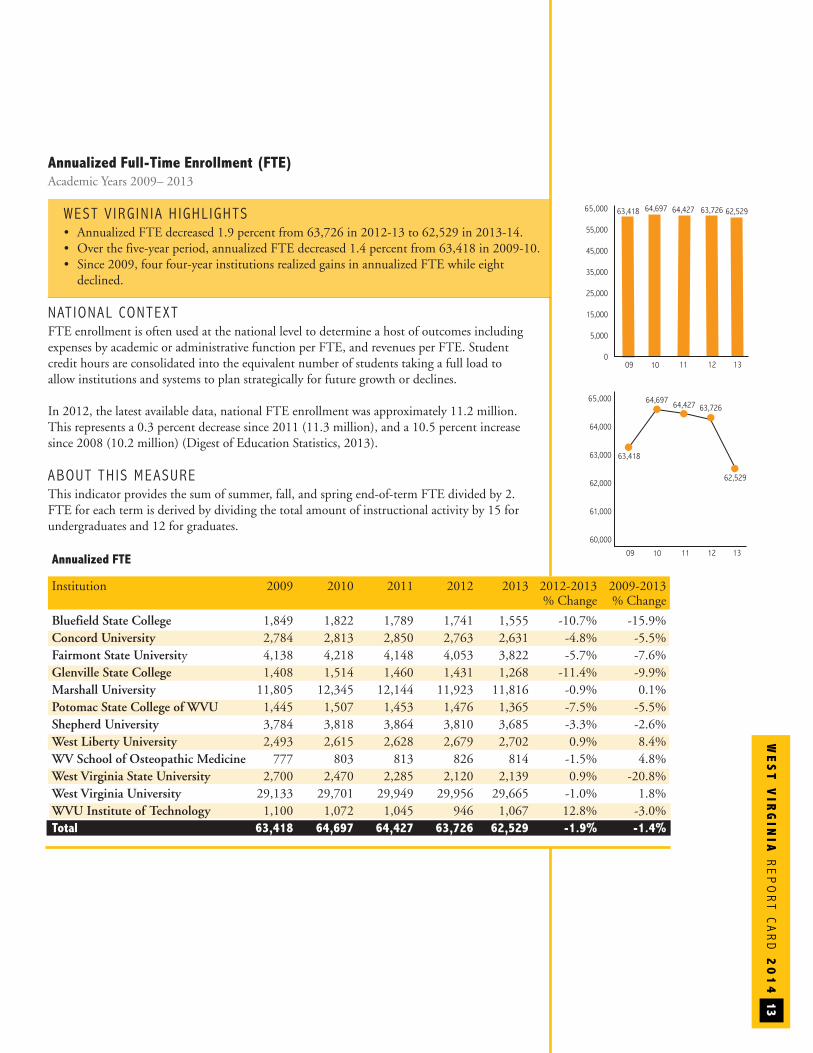
Annualized Full-Time Enrollment (FTE)Academic Years 2009– 2013
WEST V IRG IN IA H IGHL IGHTS • Annualized FTE decreased 1.9 percent from 63,726 in 2012-13 to 62,529 in 2013-14.• Over the five-year period, annualized FTE decreased 1.4 percent from 63,418 in 2009-10.• Since 2009, four four-year institutions realized gains in annualized FTE while eight declined.
NAT IONAL CONTEXTFTE enrollment is often used at the national level to determine a host of outcomes including expenses by academic or administrative function per FTE, and revenues per FTE. Student credit hours are consolidated into the equivalent number of students taking a full load to allow institutions and systems to plan strategically for future growth or declines.
In 2012, the latest available data, national FTE enrollment was approximately 11.2 million.This represents a 0.3 percent decrease since 2011 (11.3 million), and a 10.5 percent increasesince 2008 (10.2 million) (Digest of Education Statistics, 2013).
ABOUT TH IS MEASUREThis indicator provides the sum of summer, fall, and spring end-of-term FTE divided by 2. FTE for each term is derived by dividing the total amount of instructional activity by 15 for undergraduates and 12 for graduates.
Annualized FTE
Institution 2009 2010 2011 2012 2013 2012-2013 2009-2013% Change % Change
Bluefield State College 1,849 1,822 1,789 1,741 1,555 -10.7% -15.9%Concord University 2,784 2,813 2,850 2,763 2,631 -4.8% -5.5%Fairmont State University 4,138 4,218 4,148 4,053 3,822 -5.7% -7.6%Glenville State College 1,408 1,514 1,460 1,431 1,268 -11.4% -9.9%Marshall University 11,805 12,345 12,144 11,923 11,816 -0.9% 0.1%Potomac State College of WVU 1,445 1,507 1,453 1,476 1,365 -7.5% -5.5%Shepherd University 3,784 3,818 3,864 3,810 3,685 -3.3% -2.6%West Liberty University 2,493 2,615 2,628 2,679 2,702 0.9% 8.4%WV School of Osteopathic Medicine 777 803 813 826 814 -1.5% 4.8%West Virginia State University 2,700 2,470 2,285 2,120 2,139 0.9% -20.8%West Virginia University 29,133 29,701 29,949 29,956 29,665 -1.0% 1.8%WVU Institute of Technology 1,100 1,072 1,045 946 1,067 12.8% -3.0%Total 63,418 64,697 64,427 63,726 62,529 -1.9% -1.4%
AC C E S S
West Virg
inia Higher Education Po
licy C
ommiss
ion and
Commun
ity and
Tec
hnical College
System of We
st Virg
inia
14
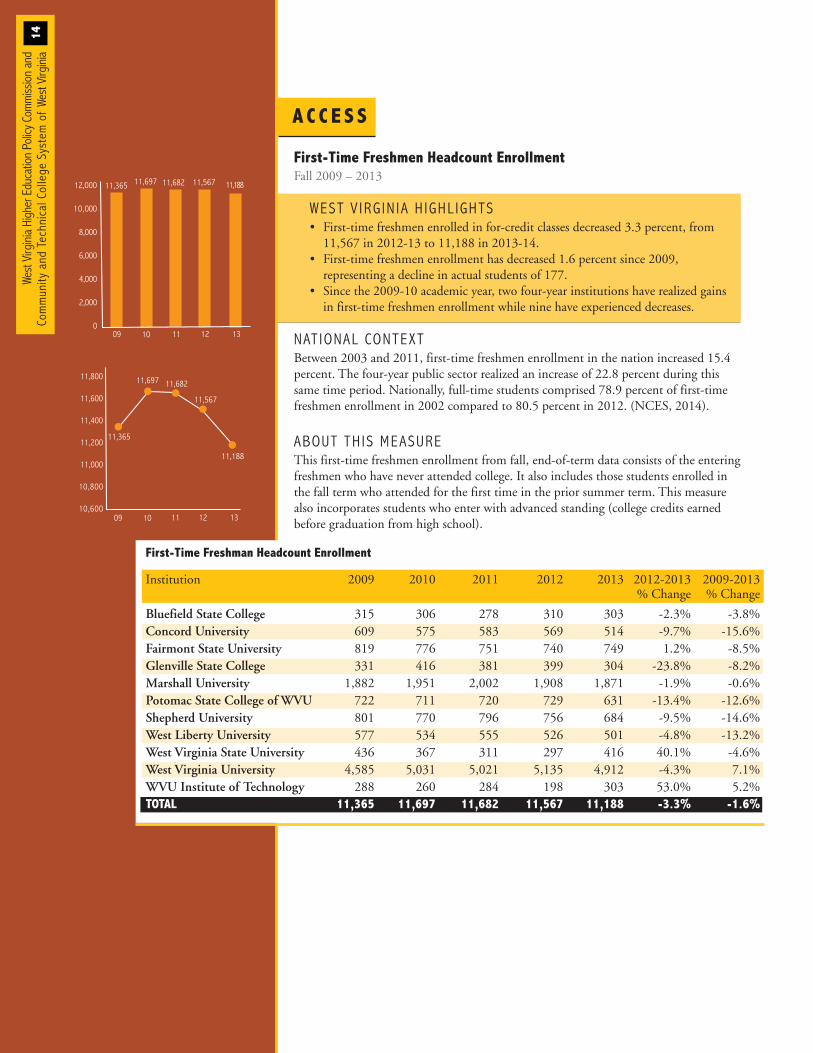
First-Time Freshmen Headcount EnrollmentFall 2009 – 2013
WEST V IRG IN IA H IGHL IGHTS• First-time freshmen enrolled in for-credit classes decreased 3.3 percent, from 11,567 in 2012-13 to 11,188 in 2013-14.
• First-time freshmen enrollment has decreased 1.6 percent since 2009, representing a decline in actual students of 177.
• Since the 2009-10 academic year, two four-year institutions have realized gains in first-time freshmen enrollment while nine have experienced decreases.
NAT IONAL CONTEXTBetween 2003 and 2011, first-time freshmen enrollment in the nation increased 15.4percent. The four-year public sector realized an increase of 22.8 percent during thissame time period. Nationally, full-time students comprised 78.9 percent of first-timefreshmen enrollment in 2002 compared to 80.5 percent in 2012. (NCES, 2014).
ABOUT TH IS MEASUREThis first-time freshmen enrollment from fall, end-of-term data consists of the enteringfreshmen who have never attended college. It also includes those students enrolled inthe fall term who attended for the first time in the prior summer term. This measurealso incorporates students who enter with advanced standing (college credits earned before graduation from high school).
First-Time Freshman Headcount Enrollment
Institution 2009 2010 2011 2012 2013 2012-2013 2009-2013% Change % Change
Bluefield State College 315 306 278 310 303 -2.3% -3.8%Concord University 609 575 583 569 514 -9.7% -15.6%Fairmont State University 819 776 751 740 749 1.2% -8.5%Glenville State College 331 416 381 399 304 -23.8% -8.2%Marshall University 1,882 1,951 2,002 1,908 1,871 -1.9% -0.6%Potomac State College of WVU 722 711 720 729 631 -13.4% -12.6%Shepherd University 801 770 796 756 684 -9.5% -14.6%West Liberty University 577 534 555 526 501 -4.8% -13.2%West Virginia State University 436 367 311 297 416 40.1% -4.6%West Virginia University 4,585 5,031 5,021 5,135 4,912 -4.3% 7.1%WVU Institute of Technology 288 260 284 198 303 53.0% 5.2%TOTAL 11,365 11,697 11,682 11,567 11,188 -3.3% -1.6%
11,18811,697 11,68212,000
10,000
8,000
6,000
4,000
2,000
0
11,365
11 12 1309 10
11,567
11,800
11,600
11,400
11,200
11,000
10,800
10,600
11,365
11,697
11,567
11,188
11 12 1309 10
11,682
15
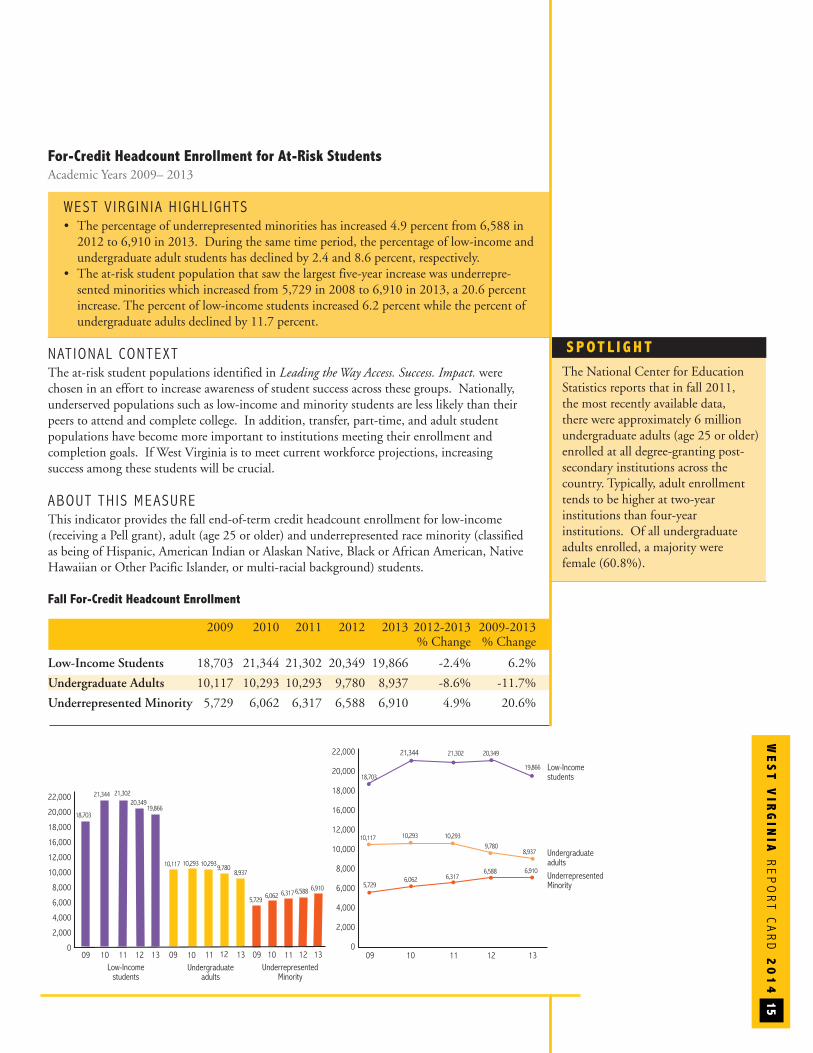
For-Credit Headcount Enrollment for At-Risk StudentsAcademic Years 2009– 2013
WEST V IRG IN IA H IGHL IGHTS • The percentage of underrepresented minorities has increased 4.9 percent from 6,588 in 2012 to 6,910 in 2013. During the same time period, the percentage of low-income and undergraduate adult students has declined by 2.4 and 8.6 percent, respectively.
• The at-risk student population that saw the largest five-year increase was underrepre-sented minorities which increased from 5,729 in 2008 to 6,910 in 2013, a 20.6 percent increase. The percent of low-income students increased 6.2 percent while the percent of undergraduate adults declined by 11.7 percent.
NAT IONAL CONTEXTThe at-risk student populations identified in Leading the Way Access. Success. Impact. were chosen in an effort to increase awareness of student success across these groups. Nationally, underserved populations such as low-income and minority students are less likely than theirpeers to attend and complete college. In addition, transfer, part-time, and adult student populations have become more important to institutions meeting their enrollment and completion goals. If West Virginia is to meet current workforce projections, increasing success among these students will be crucial.
ABOUT TH IS MEASUREThis indicator provides the fall end-of-term credit headcount enrollment for low-income (receiving a Pell grant), adult (age 25 or older) and underrepresented race minority (classified as being of Hispanic, American Indian or Alaskan Native, Black or African American, NativeHawaiian or Other Pacific Islander, or multi-racial background) students.
Fall For-Credit Headcount Enrollment
2009 2010 2011 2012 2013 2012-2013 2009-2013% Change % Change
Low-Income Students 18,703 21,344 21,302 20,349 19,866 -2.4% 6.2%
Undergraduate Adults 10,117 10,293 10,293 9,780 8,937 -8.6% -11.7%
Underrepresented Minority 5,729 6,062 6,317 6,588 6,910 4.9% 20.6%
Low-Incomestudents
Undergraduate
adultsUnderrepresented
Minority
22,000
20,000
18,000
16,000
12,000
10,000
8,000
6,000
4,000
2,000
01009 10 0911
21,302
09 10
19,866
21,344
11 1113 1312 131212
18,703
20,349
10,2938,937
10,29310,117 9,780
6,3176,910
6,0625,7296,588
S POT L I G H T
The National Center for EducationStatistics reports that in fall 2011, the most recently available data, there were approximately 6 millionundergraduate adults (age 25 or older)enrolled at all degree-granting post-secondary institutions across thecountry. Typically, adult enrollmenttends to be higher at two-year institutions than four-year institutions. Of all undergraduateadults enrolled, a majority were female (60.8%).
WE
ST
VIR
GIN
IAREPORT C
ARD
20
14
1109 10 12
Low-Incomestudents
UndergraduateadultsUnderrepresentedMinority
22,000
20,000
18,000
16,000
12,000
10,000
8,000
6,000
4,000
2,000
013
21,302
19,866
21,344
18,703
20,349
10,293
8,937
10,29310,1179,780
6,3176,910
6,0625,729
6,588
AC C E S S
West Virg
inia Higher Education Po
licy C
ommiss
ion and
Commun
ity and
Tec
hnical College
System of We
st Virg
inia
16
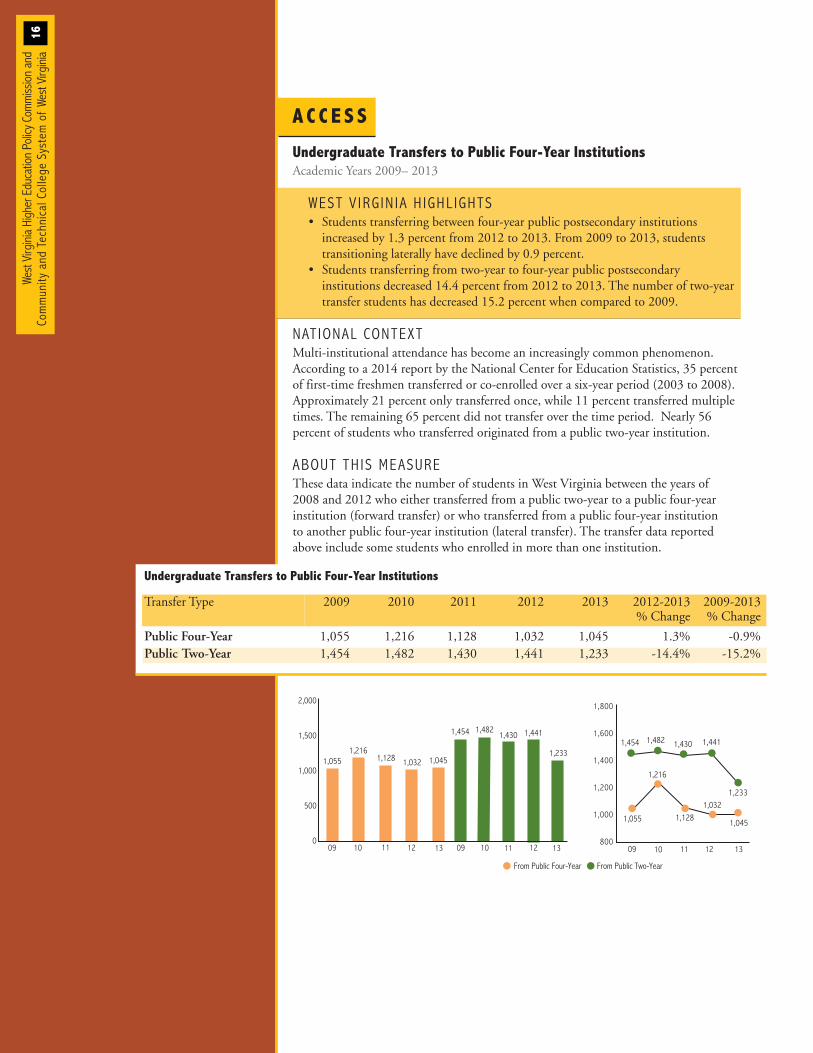
Undergraduate Transfers to Public Four-Year Institutions
Transfer Type 2009 2010 2011 2012 2013 2012-2013 2009-2013% Change % Change
Public Four-Year 1,055 1,216 1,128 1,032 1,045 1.3% -0.9%Public Two-Year 1,454 1,482 1,430 1,441 1,233 -14.4% -15.2%
Undergraduate Transfers to Public Four-Year InstitutionsAcademic Years 2009– 2013
WEST V IRG IN IA H IGHL IGHTS• Students transferring between four-year public postsecondary institutions increased by 1.3 percent from 2012 to 2013. From 2009 to 2013, students transitioning laterally have declined by 0.9 percent.
• Students transferring from two-year to four-year public postsecondary institutions decreased 14.4 percent from 2012 to 2013. The number of two-year transfer students has decreased 15.2 percent when compared to 2009.
NAT IONAL CONTEXTMulti-institutional attendance has become an increasingly common phenomenon. According to a 2014 report by the National Center for Education Statistics, 35 percentof first-time freshmen transferred or co-enrolled over a six-year period (2003 to 2008).Approximately 21 percent only transferred once, while 11 percent transferred multipletimes. The remaining 65 percent did not transfer over the time period. Nearly 56 percent of students who transferred originated from a public two-year institution.
ABOUT TH IS MEASUREThese data indicate the number of students in West Virginia between the years of 2008 and 2012 who either transferred from a public two-year to a public four-yearinstitution (forward transfer) or who transferred from a public four-year institution to another public four-year institution (lateral transfer). The transfer data reportedabove include some students who enrolled in more than one institution.
From Public Two-Year
09 10 11 12 13
1,0451,216
1,128
1,441
2,000
1,500
1,000
500
009 10 11 12 13
1,233
1,4821,430
1,032
1,055
1,454
1
From Public Two-Year
1,800
1,600
1,400
1,200
1,000
800
1
1,233
1,055
1,454
1,045
1
11 12 1309 10
1,216
1,482
1,128
1,430 1,441
1,032
From Public Four-Year From Public Two-Year
0
WE
ST
VIR
GIN
IAREPORT C
ARD
20
14
17
2,3582,198 2,155 2,117
2,500
2,000
1,500
1,000
500
009 10 11 12 13
2,241
2
2,400
2,300
2,200
2,100
2,000
2
2,358
2,155
2,241
2,198
09 10 11 12 13
2,117
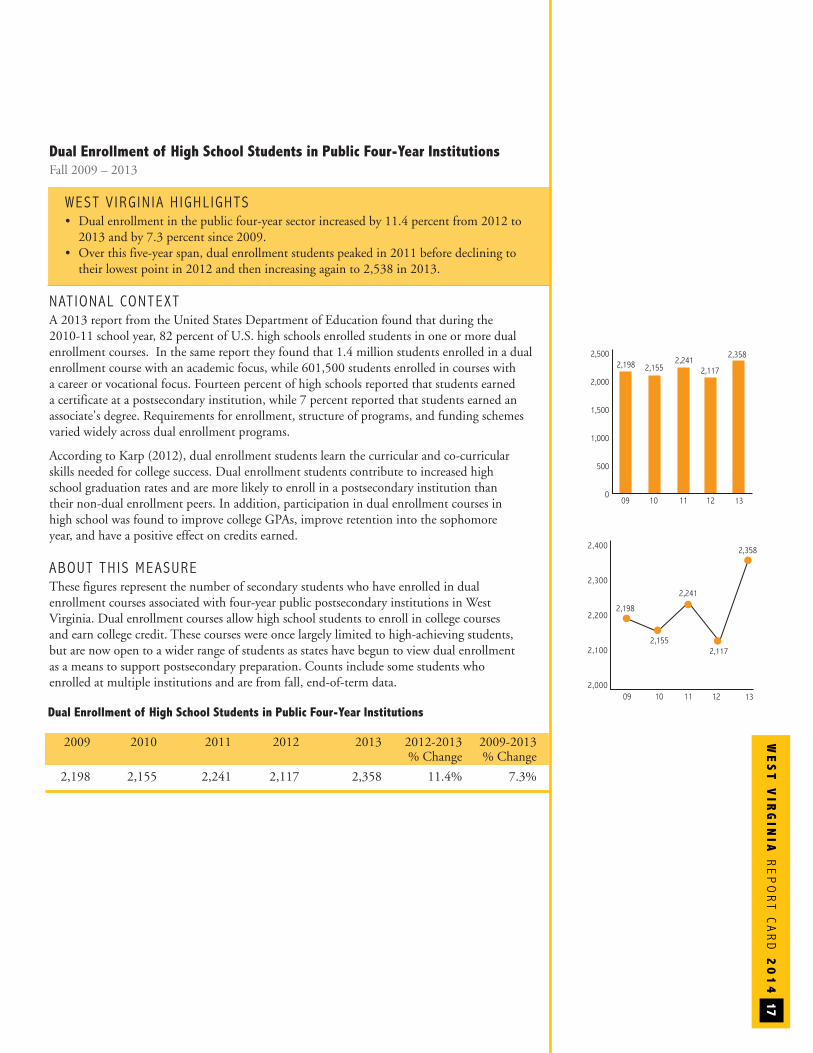
Dual Enrollment of High School Students in Public Four-Year Institutions
2009 2010 2011 2012 2013 2012-2013 2009-2013% Change % Change
2,198 2,155 2,241 2,117 2,358 11.4% 7.3%
Dual Enrollment of High School Students in Public Four-Year Institutions Fall 2009 – 2013
WEST V IRG IN IA H IGHL IGHTS• Dual enrollment in the public four-year sector increased by 11.4 percent from 2012 to 2013 and by 7.3 percent since 2009.
• Over this five-year span, dual enrollment students peaked in 2011 before declining to their lowest point in 2012 and then increasing again to 2,538 in 2013.
NAT IONAL CONTEXTA 2013 report from the United States Department of Education found that during the 2010-11 school year, 82 percent of U.S. high schools enrolled students in one or more dual enrollment courses. In the same report they found that 1.4 million students enrolled in a dualenrollment course with an academic focus, while 601,500 students enrolled in courses with a career or vocational focus. Fourteen percent of high schools reported that students earned a certificate at a postsecondary institution, while 7 percent reported that students earned an associate's degree. Requirements for enrollment, structure of programs, and funding schemesvaried widely across dual enrollment programs.
According to Karp (2012), dual enrollment students learn the curricular and co-curricular skills needed for college success. Dual enrollment students contribute to increased high school graduation rates and are more likely to enroll in a postsecondary institution than their non-dual enrollment peers. In addition, participation in dual enrollment courses in high school was found to improve college GPAs, improve retention into the sophomore year, and have a positive effect on credits earned.
ABOUT TH IS MEASUREThese figures represent the number of secondary students who have enrolled in dual enrollment courses associated with four-year public postsecondary institutions in West Virginia. Dual enrollment courses allow high school students to enroll in college courses and earn college credit. These courses were once largely limited to high-achieving students, but are now open to a wider range of students as states have begun to view dual enrollment as a means to support postsecondary preparation. Counts include some students who enrolled at multiple institutions and are from fall, end-of-term data.
AC C E S S
West Virg
inia Higher Education Po
licy C
ommiss
ion and
Commun
ity and
Tec
hnical College
System of We
st Virg
inia
18
$6,000
$5,500
$5,000
$4,500
$4,000
$3,500
$3,000
$4,796
$
$5,147
$5,528
$5,827
$3,706
$3,965
$4,214$4,487
$4,832
$
04 11 12 1309 1006 07 0805
$3,428
$12,077
$14,000
$13,000
$12,000
$11,000
$10,000
$9,000
$8,000
$11,613
$12,600$12,831
$13,801
$9,323
$9,982
$10,538
$11,174
05 11 12 1309 1006 07 08
$8,629
04
In-state Out-of-state
$
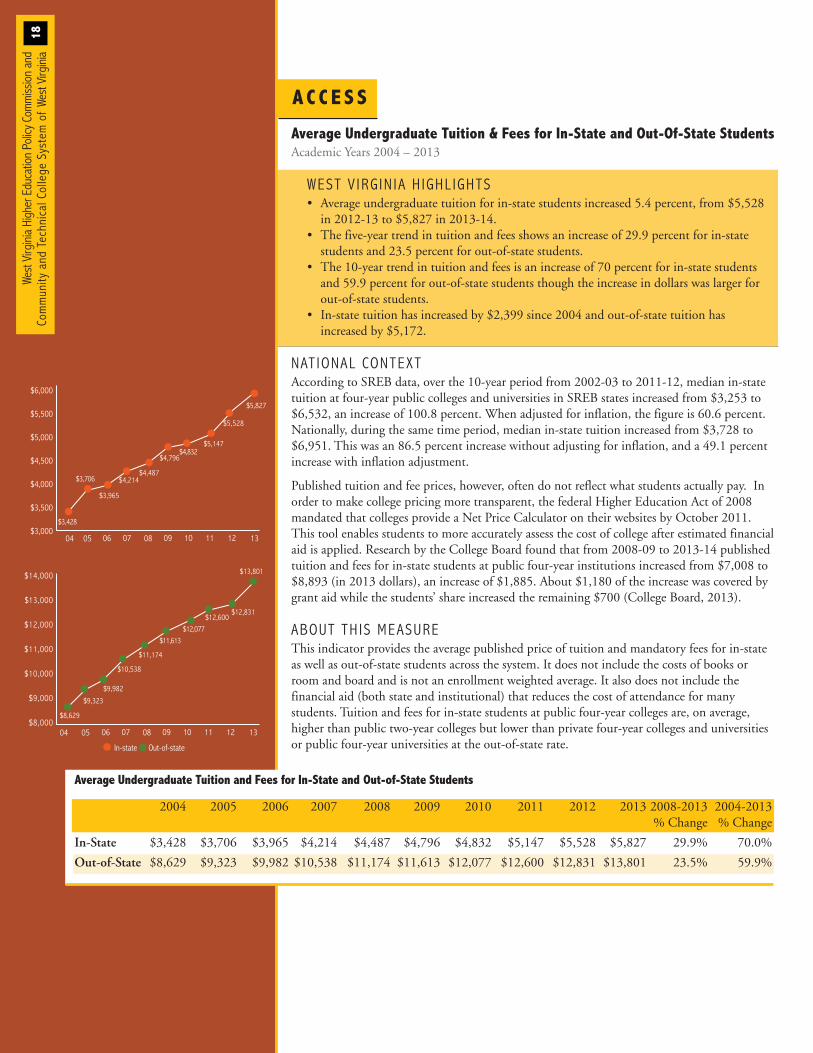
Average Undergraduate Tuition & Fees for In-State and Out-Of-State StudentsAcademic Years 2004 – 2013
WEST V IRG IN IA H IGHL IGHTS• Average undergraduate tuition for in-state students increased 5.4 percent, from $5,528 in 2012-13 to $5,827 in 2013-14.
• The five-year trend in tuition and fees shows an increase of 29.9 percent for in-state students and 23.5 percent for out-of-state students.
• The 10-year trend in tuition and fees is an increase of 70 percent for in-state students and 59.9 percent for out-of-state students though the increase in dollars was larger for out-of-state students.
• In-state tuition has increased by $2,399 since 2004 and out-of-state tuition has increased by $5,172.
NAT IONAL CONTEXTAccording to SREB data, over the 10-year period from 2002-03 to 2011-12, median in-statetuition at four-year public colleges and universities in SREB states increased from $3,253 to$6,532, an increase of 100.8 percent. When adjusted for inflation, the figure is 60.6 percent.Nationally, during the same time period, median in-state tuition increased from $3,728 to$6,951. This was an 86.5 percent increase without adjusting for inflation, and a 49.1 percentincrease with inflation adjustment.
Published tuition and fee prices, however, often do not reflect what students actually pay. Inorder to make college pricing more transparent, the federal Higher Education Act of 2008mandated that colleges provide a Net Price Calculator on their websites by October 2011.This tool enables students to more accurately assess the cost of college after estimated financialaid is applied. Research by the College Board found that from 2008-09 to 2013-14 publishedtuition and fees for in-state students at public four-year institutions increased from $7,008 to$8,893 (in 2013 dollars), an increase of $1,885. About $1,180 of the increase was covered bygrant aid while the students’ share increased the remaining $700 (College Board, 2013).
ABOUT TH IS MEASUREThis indicator provides the average published price of tuition and mandatory fees for in-stateas well as out-of-state students across the system. It does not include the costs of books orroom and board and is not an enrollment weighted average. It also does not include the financial aid (both state and institutional) that reduces the cost of attendance for many students. Tuition and fees for in-state students at public four-year colleges are, on average,higher than public two-year colleges but lower than private four-year colleges and universitiesor public four-year universities at the out-of-state rate.
Average Undergraduate Tuition and Fees for In-State and Out-of-State Students
2004 2005 2006 2007 2008 2009 2010 2011 2012 2013 2008-2013 2004-2013% Change % Change
In-State $3,428 $3,706 $3,965 $4,214 $4,487 $4,796 $4,832 $5,147 $5,528 $5,827 29.9% 70.0%
Out-of-State $8,629 $9,323 $9,982 $10,538 $11,174 $11,613 $12,077 $12,600 $12,831 $13,801 23.5% 59.9%
WE
ST
VIR
GIN
IAREPORT C
ARD
20
14
19
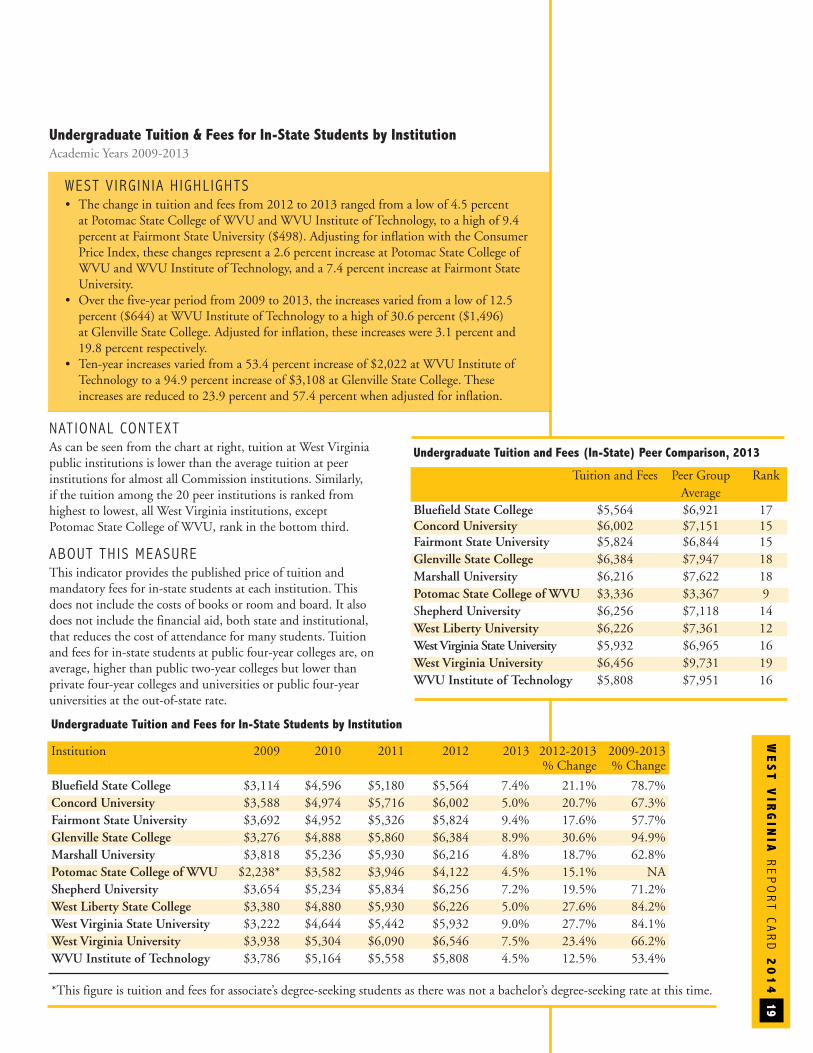
Undergraduate Tuition and Fees for In-State Students by Institution
Institution 2009 2010 2011 2012 2013 2012-2013 2009-2013% Change % Change
Bluefield State College $3,114 $4,596 $5,180 $5,564 7.4% 21.1% 78.7%Concord University $3,588 $4,974 $5,716 $6,002 5.0% 20.7% 67.3%Fairmont State University $3,692 $4,952 $5,326 $5,824 9.4% 17.6% 57.7%Glenville State College $3,276 $4,888 $5,860 $6,384 8.9% 30.6% 94.9%Marshall University $3,818 $5,236 $5,930 $6,216 4.8% 18.7% 62.8%Potomac State College of WVU $2,238* $3,582 $3,946 $4,122 4.5% 15.1% NAShepherd University $3,654 $5,234 $5,834 $6,256 7.2% 19.5% 71.2%West Liberty State College $3,380 $4,880 $5,930 $6,226 5.0% 27.6% 84.2%West Virginia State University $3,222 $4,644 $5,442 $5,932 9.0% 27.7% 84.1%West Virginia University $3,938 $5,304 $6,090 $6,546 7.5% 23.4% 66.2%WVU Institute of Technology $3,786 $5,164 $5,558 $5,808 4.5% 12.5% 53.4%
*This figure is tuition and fees for associate’s degree-seeking students as there was not a bachelor’s degree-seeking rate at this time.
Undergraduate Tuition & Fees for In-State Students by Institution Academic Years 2009-2013
WEST V IRG IN IA H IGHL IGHTS• The change in tuition and fees from 2012 to 2013 ranged from a low of 4.5 percent at Potomac State College of WVU and WVU Institute of Technology, to a high of 9.4 percent at Fairmont State University ($498). Adjusting for inflation with the Consumer Price Index, these changes represent a 2.6 percent increase at Potomac State College of WVU and WVU Institute of Technology, and a 7.4 percent increase at Fairmont State University.
• Over the five-year period from 2009 to 2013, the increases varied from a low of 12.5 percent ($644) at WVU Institute of Technology to a high of 30.6 percent ($1,496) at Glenville State College. Adjusted for inflation, these increases were 3.1 percent and 19.8 percent respectively.
• Ten-year increases varied from a 53.4 percent increase of $2,022 at WVU Institute of Technology to a 94.9 percent increase of $3,108 at Glenville State College. These increases are reduced to 23.9 percent and 57.4 percent when adjusted for inflation.
NAT IONAL CONTEXTAs can be seen from the chart at right, tuition at West Virginia public institutions is lower than the average tuition at peer institutions for almost all Commission institutions. Similarly, if the tuition among the 20 peer institutions is ranked from highest to lowest, all West Virginia institutions, except Potomac State College of WVU, rank in the bottom third.
ABOUT TH IS MEASUREThis indicator provides the published price of tuition andmandatory fees for in-state students at each institution. This does not include the costs of books or room and board. It also does not include the financial aid, both state and institutional, that reduces the cost of attendance for many students. Tuition and fees for in-state students at public four-year colleges are, on average, higher than public two-year colleges but lower than private four-year colleges and universities or public four-year universities at the out-of-state rate.
Undergraduate Tuition and Fees (In-State) Peer Comparison, 2013
Tuition and Fees Peer Group RankAverage
Bluefield State College $5,564 $6,921 17Concord University $6,002 $7,151 15Fairmont State University $5,824 $6,844 15Glenville State College $6,384 $7,947 18Marshall University $6,216 $7,622 18Potomac State College of WVU $3,336 $3,367 9Shepherd University $6,256 $7,118 14West Liberty University $6,226 $7,361 12West Virginia State University $5,932 $6,965 16West Virginia University $6,456 $9,731 19WVU Institute of Technology $5,808 $7,951 16
AC C E S S
West Virg
inia Higher Education Po
licy C
ommiss
ion and
Commun
ity and
Tec
hnical College
System of We
st Virg
inia
20
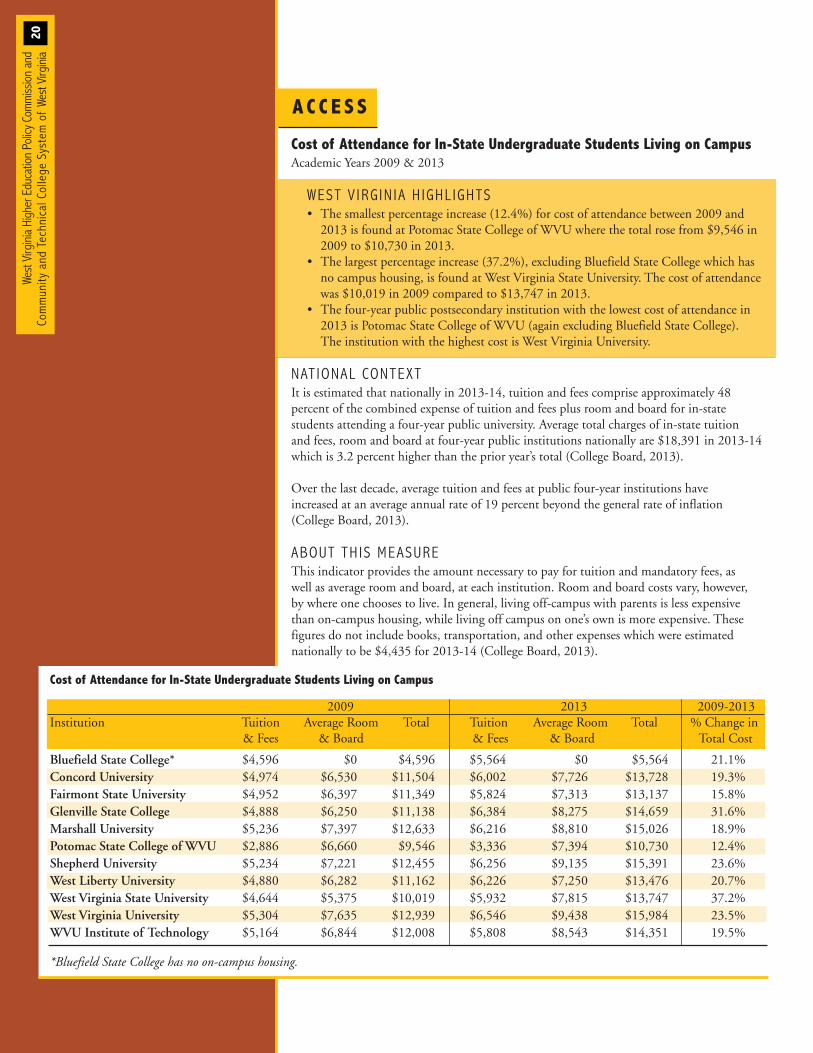
Cost of Attendance for In-State Undergraduate Students Living on CampusAcademic Years 2009 & 2013
WEST V IRG IN IA H IGHL IGHTS• The smallest percentage increase (12.4%) for cost of attendance between 2009 and 2013 is found at Potomac State College of WVU where the total rose from $9,546 in 2009 to $10,730 in 2013.
• The largest percentage increase (37.2%), excluding Bluefield State College which has no campus housing, is found at West Virginia State University. The cost of attendance was $10,019 in 2009 compared to $13,747 in 2013.
• The four-year public postsecondary institution with the lowest cost of attendance in 2013 is Potomac State College of WVU (again excluding Bluefield State College). The institution with the highest cost is West Virginia University.
NAT IONAL CONTEXTIt is estimated that nationally in 2013-14, tuition and fees comprise approximately 48 percent of the combined expense of tuition and fees plus room and board for in-state students attending a four-year public university. Average total charges of in-state tuition and fees, room and board at four-year public institutions nationally are $18,391 in 2013-14which is 3.2 percent higher than the prior year’s total (College Board, 2013).
Over the last decade, average tuition and fees at public four-year institutions have increased at an average annual rate of 19 percent beyond the general rate of inflation (College Board, 2013).
ABOUT TH IS MEASUREThis indicator provides the amount necessary to pay for tuition and mandatory fees, as well as average room and board, at each institution. Room and board costs vary, however, by where one chooses to live. In general, living off-campus with parents is less expensivethan on-campus housing, while living off campus on one’s own is more expensive. These figures do not include books, transportation, and other expenses which were estimated nationally to be $4,435 for 2013-14 (College Board, 2013).
Cost of Attendance for In-State Undergraduate Students Living on Campus
2009 2013 2009-2013Institution Tuition Average Room Total Tuition Average Room Total % Change in
& Fees & Board & Fees & Board Total Cost
Bluefield State College* $4,596 $0 $4,596 $5,564 $0 $5,564 21.1%Concord University $4,974 $6,530 $11,504 $6,002 $7,726 $13,728 19.3%Fairmont State University $4,952 $6,397 $11,349 $5,824 $7,313 $13,137 15.8%Glenville State College $4,888 $6,250 $11,138 $6,384 $8,275 $14,659 31.6%Marshall University $5,236 $7,397 $12,633 $6,216 $8,810 $15,026 18.9%Potomac State College of WVU $2,886 $6,660 $9,546 $3,336 $7,394 $10,730 12.4%Shepherd University $5,234 $7,221 $12,455 $6,256 $9,135 $15,391 23.6%West Liberty University $4,880 $6,282 $11,162 $6,226 $7,250 $13,476 20.7%West Virginia State University $4,644 $5,375 $10,019 $5,932 $7,815 $13,747 37.2%West Virginia University $5,304 $7,635 $12,939 $6,546 $9,438 $15,984 23.5%WVU Institute of Technology $5,164 $6,844 $12,008 $5,808 $8,543 $14,351 19.5%
*Bluefield State College has no on-campus housing.

WE
ST
VIR
GIN
IAREPORT C
ARD
20
14
21
S U C C E S S
In order to increase the number of West Virginia students who persist in their academic programs and earn their degrees, it is important to promote progress in retention and completion. Moreover, given historical gaps in achievement for certain underrepresented groups and the Commission’s commitment to improving equity in outcomes in addition to opportunity, it is necessary to target populations relatedto income and race/ethnicity. To correspond with efforts to re-enroll and graduate adults who have some college credits but no degree, thereis a focus on the retention of returning adults. Adults face additionalbarriers to completion including balancing home and work responsibilities and constraints related to geographical access to campuses. Finally, evidence that West Virginia transfer students persist and graduate at lower rates than other students demands a focus on the outcomes of this population as well. To both sustain andmove West Virginia's postsecondary success agenda forward, the state'sfour-year public colleges and universities are working to enhance effortsin this area.
Commission InitiativesIn January 2014, the Commission partnered with Bluefield State College, Concord University,Marshall University, and Southern West Virginia Community and Technical College to launcha three-year pilot project to provide college counseling and support via text message to studentsgraduating from 14 high-need high schools. Nearly 1,000 students signed up to receive themessages, which provide students with periodic updates to assist them in completing criticaltasks required for enrolling and succeeding in college.
In September 2014, the Commission and its institutions launched a statewide “15 to Finish”campaign, which encourages students to take at least 15 credit hours each semester, an essentialstep that puts students on track to graduate on time, save money, do well academically, andstart their careers as soon as possible.
Work continues to execute the intent of the joint resolution passed by both the Commissionand Council regarding student credit transfer and articulation. A statewide steering committeehas been formed with representation from both two-year and four-year institutions. Furtherinitiatives include the creation of a student appeal process for denial of transfer of credit andprogress on implementation of a reverse transfer policy. The steering committee also is working on the creation of statewide articulation degrees between two-year and four-year institutions.
A grant of $28,765 allowed the West Virginia Network (WVNET) and the Commission toprovide training to faculty on how to improve their online courses to meet Quality Matters’standards. Through the grant, training was provided in either a half-day face-to-face or two-week online format for 20 faculty currently teaching online from each of the colleges and universities affiliated with Quality Matters.
West Virg
inia Higher Education Po
licy C
ommiss
ion and
Commun
ity and
Tec
hnical College
System of We
st Virg
inia
22
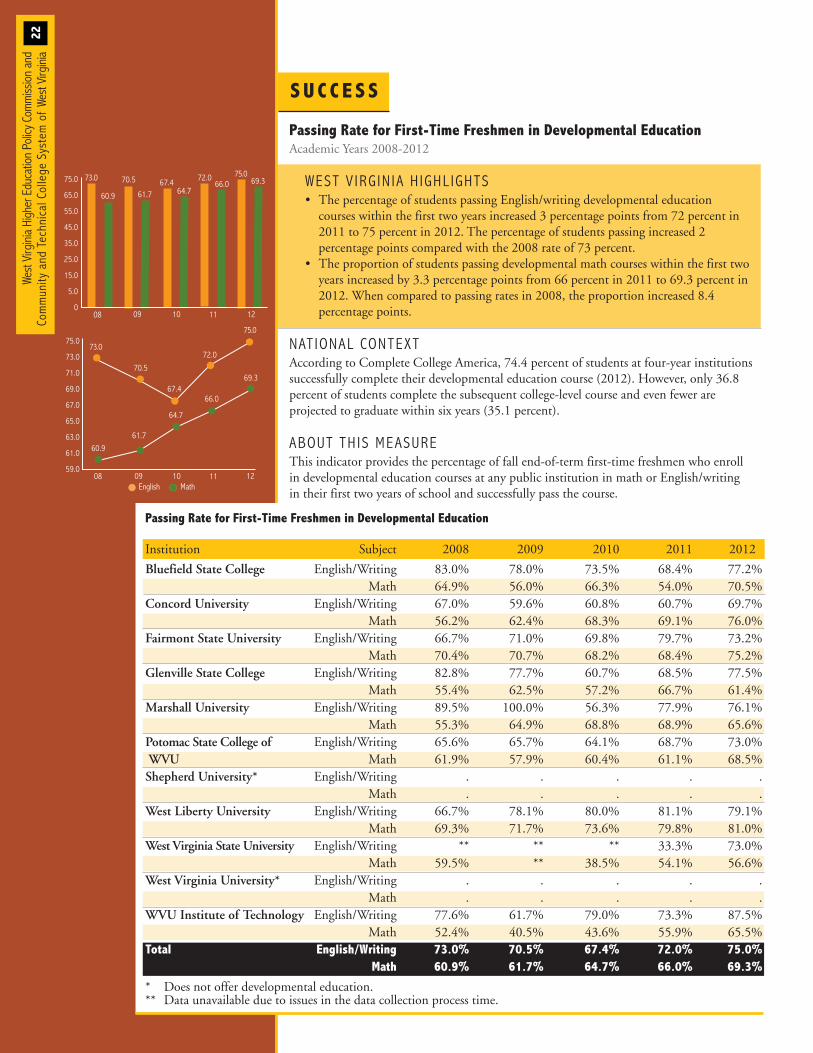
Passing Rate for First-Time Freshmen in Developmental EducationAcademic Years 2008-2012
WEST V IRG IN IA H IGHL IGHTS • The percentage of students passing English/writing developmental education courses within the first two years increased 3 percentage points from 72 percent in 2011 to 75 percent in 2012. The percentage of students passing increased 2 percentage points compared with the 2008 rate of 73 percent.
• The proportion of students passing developmental math courses within the first two years increased by 3.3 percentage points from 66 percent in 2011 to 69.3 percent in 2012. When compared to passing rates in 2008, the proportion increased 8.4 percentage points.
NAT IONAL CONTEXTAccording to Complete College America, 74.4 percent of students at four-year institutionssuccessfully complete their developmental education course (2012). However, only 36.8percent of students complete the subsequent college-level course and even fewer are projected to graduate within six years (35.1 percent).
ABOUT TH IS MEASUREThis indicator provides the percentage of fall end-of-term first-time freshmen who enroll in developmental education courses at any public institution in math or English/writing in their first two years of school and successfully pass the course.
Passing Rate for First-Time Freshmen in Developmental Education
Institution Subject 2008 2009 2010 2011 2012
Bluefield State College English/Writing 83.0% 78.0% 73.5% 68.4% 77.2%Math 64.9% 56.0% 66.3% 54.0% 70.5%
Concord University English/Writing 67.0% 59.6% 60.8% 60.7% 69.7%Math 56.2% 62.4% 68.3% 69.1% 76.0%
Fairmont State University English/Writing 66.7% 71.0% 69.8% 79.7% 73.2%Math 70.4% 70.7% 68.2% 68.4% 75.2%
Glenville State College English/Writing 82.8% 77.7% 60.7% 68.5% 77.5%Math 55.4% 62.5% 57.2% 66.7% 61.4%
Marshall University English/Writing 89.5% 100.0% 56.3% 77.9% 76.1%Math 55.3% 64.9% 68.8% 68.9% 65.6%
Potomac State College of English/Writing 65.6% 65.7% 64.1% 68.7% 73.0%WVU Math 61.9% 57.9% 60.4% 61.1% 68.5%Shepherd University* English/Writing . . . . .
Math . . . . .West Liberty University English/Writing 66.7% 78.1% 80.0% 81.1% 79.1%
Math 69.3% 71.7% 73.6% 79.8% 81.0%West Virginia State University English/Writing ** ** ** 33.3% 73.0%
Math 59.5% ** 38.5% 54.1% 56.6%West Virginia University* English/Writing . . . . .
Math . . . . .WVU Institute of Technology English/Writing 77.6% 61.7% 79.0% 73.3% 87.5%
Math 52.4% 40.5% 43.6% 55.9% 65.5%Total English/Writing 73.0% 70.5% 67.4% 72.0% 75.0%
Math 60.9% 61.7% 64.7% 66.0% 69.3%
* Does not offer developmental education.** Data unavailable due to issues in the data collection process time.
S U C C E S S
Math
7
75.0
65.0
55.0
45.0
35.0
25.0
15.0
5.0
01208 09 11
Math
75.073.0 70.5
61.760.966.0
72.0 69.3
10
67.464.7
Math
7
Math
7
75.0
73.0
70.5
61.760.9
66.0
72.0
69.367.4
64.7
75.0
73.0
71.0
69.0
67.0
65.0
63.0
61.0
59.01208 09 1110
Math
7
English Math
7
WE
ST
VIR
GIN
IAREPORT C
ARD
20
14
23
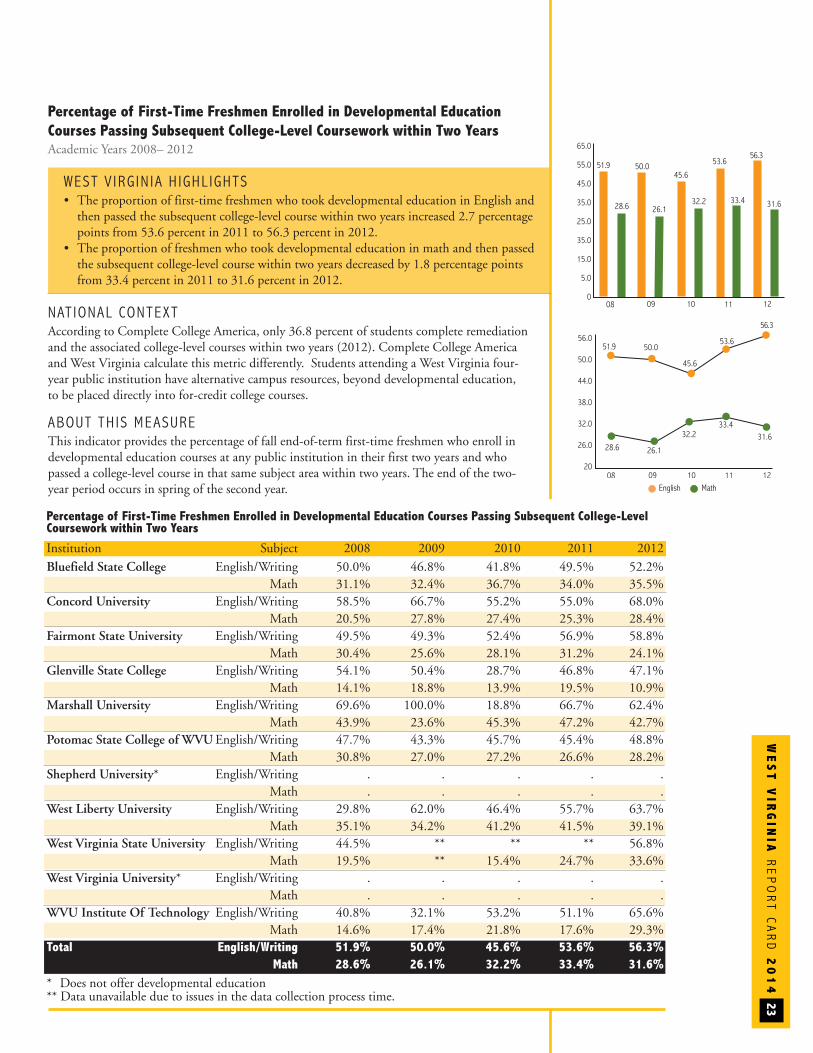
Percentage of First-Time Freshmen Enrolled in Developmental Education Courses Passing Subsequent College-LevelCoursework within Two Years
Institution Subject 2008 2009 2010 2011 2012Bluefield State College English/Writing 50.0% 46.8% 41.8% 49.5% 52.2%
Math 31.1% 32.4% 36.7% 34.0% 35.5%Concord University English/Writing 58.5% 66.7% 55.2% 55.0% 68.0%
Math 20.5% 27.8% 27.4% 25.3% 28.4%Fairmont State University English/Writing 49.5% 49.3% 52.4% 56.9% 58.8%
Math 30.4% 25.6% 28.1% 31.2% 24.1%Glenville State College English/Writing 54.1% 50.4% 28.7% 46.8% 47.1%
Math 14.1% 18.8% 13.9% 19.5% 10.9%Marshall University English/Writing 69.6% 100.0% 18.8% 66.7% 62.4%
Math 43.9% 23.6% 45.3% 47.2% 42.7%Potomac State College of WVUEnglish/Writing 47.7% 43.3% 45.7% 45.4% 48.8%
Math 30.8% 27.0% 27.2% 26.6% 28.2%Shepherd University* English/Writing . . . . .
Math . . . . .West Liberty University English/Writing 29.8% 62.0% 46.4% 55.7% 63.7%
Math 35.1% 34.2% 41.2% 41.5% 39.1%West Virginia State University English/Writing 44.5% ** ** ** 56.8%
Math 19.5% ** 15.4% 24.7% 33.6%West Virginia University* English/Writing . . . . .
Math . . . . .WVU Institute Of Technology English/Writing 40.8% 32.1% 53.2% 51.1% 65.6%
Math 14.6% 17.4% 21.8% 17.6% 29.3%Total English/Writing 51.9% 50.0% 45.6% 53.6% 56.3%
Math 28.6% 26.1% 32.2% 33.4% 31.6%* Does not offer developmental education ** Data unavailable due to issues in the data collection process time.
Percentage of First-Time Freshmen Enrolled in Developmental EducationCourses Passing Subsequent College-Level Coursework within Two YearsAcademic Years 2008– 2012
WEST V IRG IN IA H IGHL IGHTS • The proportion of first-time freshmen who took developmental education in English andthen passed the subsequent college-level course within two years increased 2.7 percentage points from 53.6 percent in 2011 to 56.3 percent in 2012.
• The proportion of freshmen who took developmental education in math and then passedthe subsequent college-level course within two years decreased by 1.8 percentage points from 33.4 percent in 2011 to 31.6 percent in 2012.
NAT IONAL CONTEXTAccording to Complete College America, only 36.8 percent of students complete remediationand the associated college-level courses within two years (2012). Complete College Americaand West Virginia calculate this metric differently. Students attending a West Virginia four-year public institution have alternative campus resources, beyond developmental education, to be placed directly into for-credit college courses.
ABOUT TH IS MEASUREThis indicator provides the percentage of fall end-of-term first-time freshmen who enroll in developmental education courses at any public institution in their first two years and whopassed a college-level course in that same subject area within two years. The end of the two-year period occurs in spring of the second year.
65.0
55.0
45.0
35.0
25.0
35.0
15.0
5.0
01208 09 11
E Math
56.351.9 50.0
26.128.633.4
53.6
31.6
10
45.6
32.2
$
Math
5
1208 09 1110
56.0
50.0
44.0
38.0
32.0
26.0
20
56.3
51.9 50.0
26.128.6
33.4
53.6
31.6
1
45.6
32.2
English Math
5

S U C C E S S
West Virg
inia Higher Education Po
licy C
ommiss
ion and
Commun
ity and
Tec
hnical College
System of We
st Virg
inia
24
Fall-to-Fall Retention Rates for First-Time, Full-Time FreshmenAcademic Years 2009– 2013
WEST V IRG IN IA H IGHL IGHTS• First-time full-time retention rates have declined 1.4 percentage points at four-year public institutions from 76.1 percent in 2009 to 74.7 percent in 2013.
• The largest gain over the five-year period was at WVU Institute of Technology, with an increase of 7.1 percentage points.
• From 2009 to 2013 five of the eleven four-year public institutions experienced decreases in their retention rates with the largest of 4.2 percentage points at West Virginia State University.
NAT IONAL CONTEXTThe national proportion of fall 2012 first-time freshmen at four-year public institutionswho were retained at any institution the following fall was 85.5 percent (National StudentClearinghouse, 2014).
In the SREB region, the one-year persistence rate for the 2010 cohort of full-time, first-timebachelor’s degree-seeking freshmen at public four-year institutions was 85 percent. West Virginia is currently ranked last among the 16 SREB states in overall first-year persistencewith a rate of 76 percent for 2010 (SREB, 2013).
ABOUT TH IS MEASUREThis indicator provides the proportion of all first-time full-time, freshmen who are enrolledthe following year at any West Virginia public college or university. Data capabilities at this point do not allow tracking of students who transfer to private or out-of-state public institutions. Students are more likely to drop out during their first year of college than atany other time. The ability to provide support that will assist with retention during this first year will increase the likelihood of higher graduation rates.
One-Year Retention Rates
Institution 2009 2010 2011 2012 2013Bluefield State College 65.0% 65.2% 59.9% 61.9% 65.9%Concord University 70.6% 73.3% 71.1% 71.7% 71.4%Fairmont State University 71.2% 73.6% 72.8% 72.6% 70.9%Glenville State College 60.6% 66.3% 65.5% 61.3% 62.8%Marshall University 77.2% 77.2% 76.1% 77.7% 75.3%Potomac State College of WVU 61.7% 60.9% 58.9% 56.4% 56.8%Shepherd University 70.4% 75.6% 72.6% 67.6% 74.3%West Liberty University 74.3% 81.3% 75.6% 77.6% 75.7%West Virginia State University 66.7% 61.6% 67.2% 60.7% 62.5%West Virginia University 82.8% 82.3% 80.5% 78.7% 80.0%WVU Institute of Technology 61.8% 57.8% 68.3% 54.9% 68.9%Total 76.1% 76.3% 75.1% 73.7% 74.7%
80.0%
70.0%
60.0%
50.0%
40.0%
30.0%
20.0%
10.0%
0
76.1%
11 12 1309 10
74.7%76.3% 75.1% 73.7%
77.0%
76.0%
75.0%
74.0%
73.0%
74.7%
76.1%
76.3%
75.1%
73.7%
11 12 1309 10
WE
ST
VIR
GIN
IAREPORT C
ARD
20
14
25
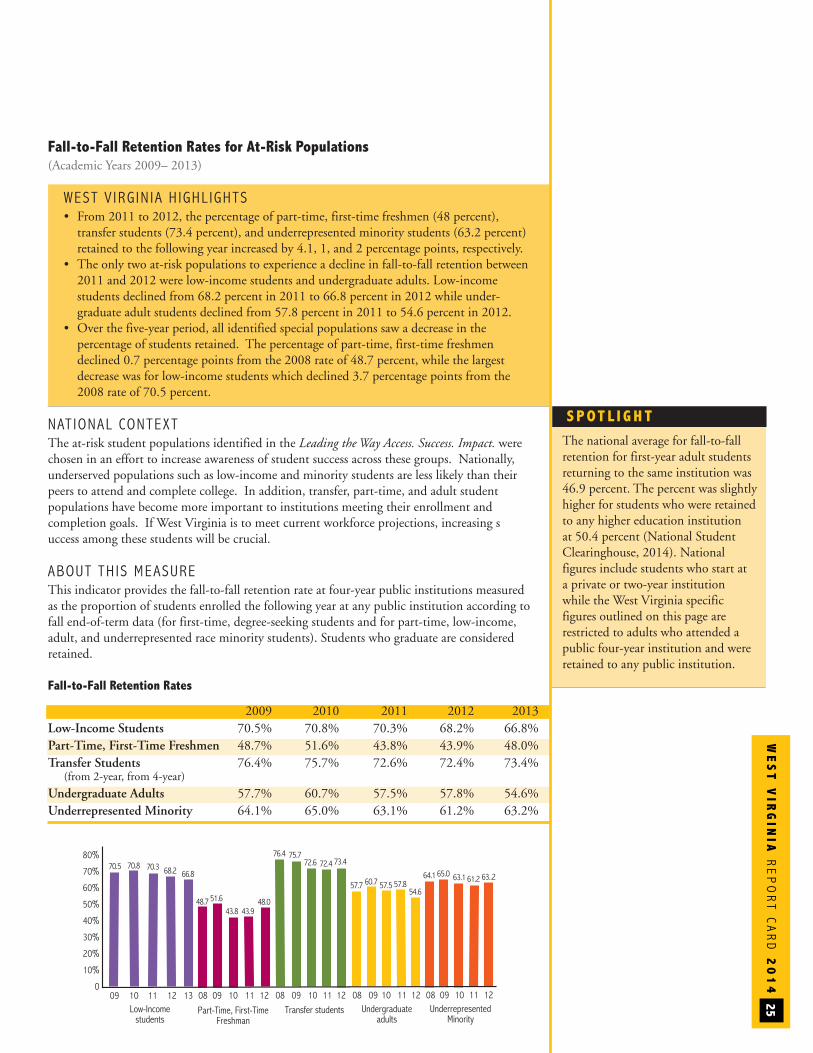
Fall-to-Fall Retention Rates for At-Risk Populations(Academic Years 2009– 2013)
WEST V IRG IN IA H IGHL IGHTS • From 2011 to 2012, the percentage of part-time, first-time freshmen (48 percent), transfer students (73.4 percent), and underrepresented minority students (63.2 percent) retained to the following year increased by 4.1, 1, and 2 percentage points, respectively.
• The only two at-risk populations to experience a decline in fall-to-fall retention between 2011 and 2012 were low-income students and undergraduate adults. Low-income students declined from 68.2 percent in 2011 to 66.8 percent in 2012 while under-graduate adult students declined from 57.8 percent in 2011 to 54.6 percent in 2012.
• Over the five-year period, all identified special populations saw a decrease in the percentage of students retained. The percentage of part-time, first-time freshmen declined 0.7 percentage points from the 2008 rate of 48.7 percent, while the largest decrease was for low-income students which declined 3.7 percentage points from the 2008 rate of 70.5 percent.
NAT IONAL CONTEXTThe at-risk student populations identified in the Leading the Way Access. Success. Impact. werechosen in an effort to increase awareness of student success across these groups. Nationally, underserved populations such as low-income and minority students are less likely than theirpeers to attend and complete college. In addition, transfer, part-time, and adult student populations have become more important to institutions meeting their enrollment and completion goals. If West Virginia is to meet current workforce projections, increasing success among these students will be crucial.
ABOUT TH IS MEASUREThis indicator provides the fall-to-fall retention rate at four-year public institutions measured as the proportion of students enrolled the following year at any public institution according tofall end-of-term data (for first-time, degree-seeking students and for part-time, low-income,adult, and underrepresented race minority students). Students who graduate are considered retained.
Fall-to-Fall Retention Rates
2009 2010 2011 2012 2013Low-Income Students 70.5% 70.8% 70.3% 68.2% 66.8%Part-Time, First-Time Freshmen 48.7% 51.6% 43.8% 43.9% 48.0%Transfer Students 76.4% 75.7% 72.6% 72.4% 73.4%(from 2-year, from 4-year)
Undergraduate Adults 57.7% 60.7% 57.5% 57.8% 54.6%Underrepresented Minority 64.1% 65.0% 63.1% 61.2% 63.2%
Low-Incomestudents
Part-Time, First-TimeFreshman
Transfer students Undergraduateadults
UnderrepresentedMinority
80%
70%
60%
50%
40%
30%
20%
10%
011 1209 1008 09 1008 121111
70.3
09 10
66.870.8
1312
70.5 68.2
43.943.851.6 48.0
72.476.4
72.675.7
73.4
57.554.6
60.757.7 57.863.1 63..265.064.1 61.2
09 1008 1211 09 1008 1211
48.7
S POT L I G H T
The national average for fall-to-fall retention for first-year adult studentsreturning to the same institution was46.9 percent. The percent was slightlyhigher for students who were retainedto any higher education institution at 50.4 percent (National StudentClearinghouse, 2014). National figures include students who start at a private or two-year institution while the West Virginia specific figures outlined on this page are restricted to adults who attended apublic four-year institution and wereretained to any public institution.
S U C C E S S
West Virg
inia Higher Education Po
licy C
ommiss
ion and
Commun
ity and
Tec
hnical College
System of We
st Virg
inia
26
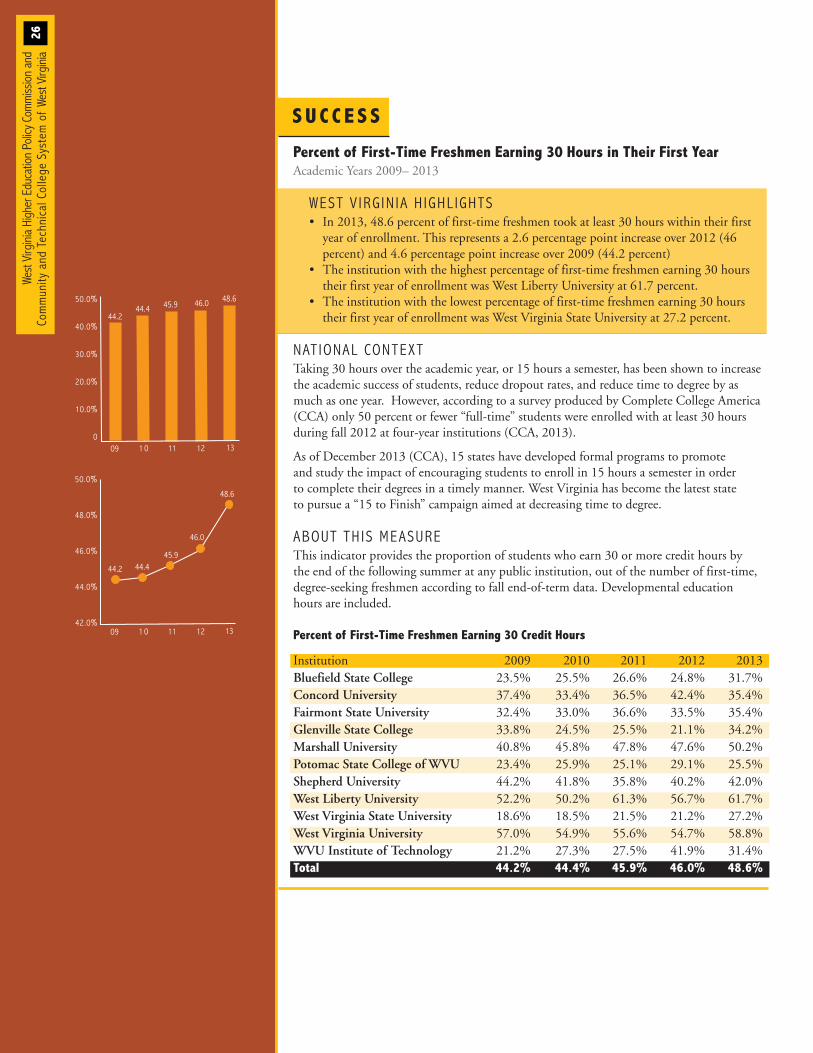
Percent of First-Time Freshmen Earning 30 Hours in Their First YearAcademic Years 2009– 2013
WEST V IRG IN IA H IGHL IGHTS • In 2013, 48.6 percent of first-time freshmen took at least 30 hours within their first year of enrollment. This represents a 2.6 percentage point increase over 2012 (46 percent) and 4.6 percentage point increase over 2009 (44.2 percent)
• The institution with the highest percentage of first-time freshmen earning 30 hours their first year of enrollment was West Liberty University at 61.7 percent.
• The institution with the lowest percentage of first-time freshmen earning 30 hours their first year of enrollment was West Virginia State University at 27.2 percent.
NAT IONAL CONTEXTTaking 30 hours over the academic year, or 15 hours a semester, has been shown to increasethe academic success of students, reduce dropout rates, and reduce time to degree by asmuch as one year. However, according to a survey produced by Complete College America(CCA) only 50 percent or fewer “full-time” students were enrolled with at least 30 hours during fall 2012 at four-year institutions (CCA, 2013).
As of December 2013 (CCA), 15 states have developed formal programs to promote and study the impact of encouraging students to enroll in 15 hours a semester in order to complete their degrees in a timely manner. West Virginia has become the latest state to pursue a “15 to Finish” campaign aimed at decreasing time to degree.
ABOUT TH IS MEASUREThis indicator provides the proportion of students who earn 30 or more credit hours by the end of the following summer at any public institution, out of the number of first-time,degree-seeking freshmen according to fall end-of-term data. Developmental education hours are included.
Percent of First-Time Freshmen Earning 30 Credit Hours
Institution 2009 2010 2011 2012 2013Bluefield State College 23.5% 25.5% 26.6% 24.8% 31.7%Concord University 37.4% 33.4% 36.5% 42.4% 35.4%Fairmont State University 32.4% 33.0% 36.6% 33.5% 35.4%Glenville State College 33.8% 24.5% 25.5% 21.1% 34.2%Marshall University 40.8% 45.8% 47.8% 47.6% 50.2%Potomac State College of WVU 23.4% 25.9% 25.1% 29.1% 25.5%Shepherd University 44.2% 41.8% 35.8% 40.2% 42.0%West Liberty University 52.2% 50.2% 61.3% 56.7% 61.7%West Virginia State University 18.6% 18.5% 21.5% 21.2% 27.2%West Virginia University 57.0% 54.9% 55.6% 54.7% 58.8%WVU Institute of Technology 21.2% 27.3% 27.5% 41.9% 31.4%Total 44.2% 44.4% 45.9% 46.0% 48.6%
48.6
44.244.4
46.050.0%
40.0%
30.0%
20.0%
10.0%
011 12 1309 1 0
45.9
48.6
44.2 44.4
46.0
50.0%
48.0%
46.0%
44.0%
42.0%11 1209 1 0
45.9
13
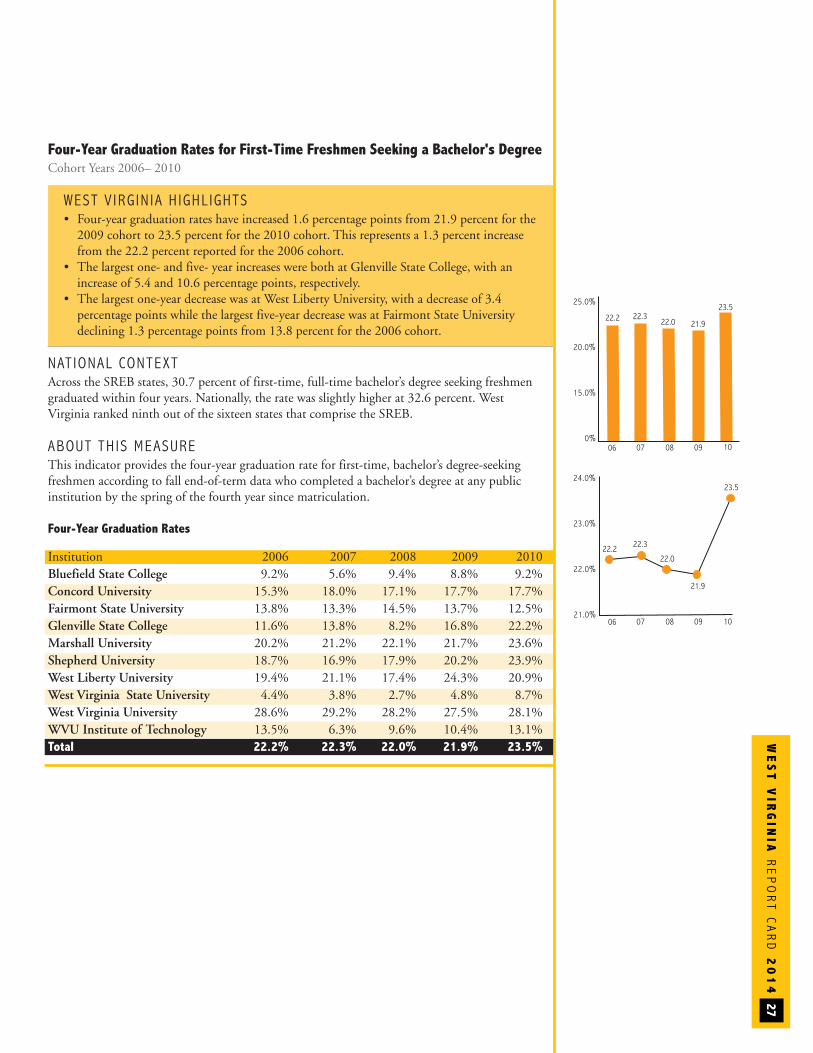
WE
ST
VIR
GIN
IAREPORT C
ARD
20
14
27
Four-Year Graduation Rates for First-Time Freshmen Seeking a Bachelor's DegreeCohort Years 2006– 2010
WEST V IRG IN IA H IGHL IGHTS • Four-year graduation rates have increased 1.6 percentage points from 21.9 percent for the 2009 cohort to 23.5 percent for the 2010 cohort. This represents a 1.3 percent increase from the 22.2 percent reported for the 2006 cohort.
• The largest one- and five- year increases were both at Glenville State College, with an increase of 5.4 and 10.6 percentage points, respectively.
• The largest one-year decrease was at West Liberty University, with a decrease of 3.4 percentage points while the largest five-year decrease was at Fairmont State University declining 1.3 percentage points from 13.8 percent for the 2006 cohort.
NAT IONAL CONTEXTAcross the SREB states, 30.7 percent of first-time, full-time bachelor’s degree seeking freshmen graduated within four years. Nationally, the rate was slightly higher at 32.6 percent. West Virginia ranked ninth out of the sixteen states that comprise the SREB.
ABOUT TH IS MEASUREThis indicator provides the four-year graduation rate for first-time, bachelor’s degree-seekingfreshmen according to fall end-of-term data who completed a bachelor’s degree at any public institution by the spring of the fourth year since matriculation.
Four-Year Graduation Rates
Institution 2006 2007 2008 2009 2010Bluefield State College 9.2% 5.6% 9.4% 8.8% 9.2%Concord University 15.3% 18.0% 17.1% 17.7% 17.7%Fairmont State University 13.8% 13.3% 14.5% 13.7% 12.5%Glenville State College 11.6% 13.8% 8.2% 16.8% 22.2%Marshall University 20.2% 21.2% 22.1% 21.7% 23.6%Shepherd University 18.7% 16.9% 17.9% 20.2% 23.9%West Liberty University 19.4% 21.1% 17.4% 24.3% 20.9%West Virginia State University 4.4% 3.8% 2.7% 4.8% 8.7%West Virginia University 28.6% 29.2% 28.2% 27.5% 28.1%WVU Institute of Technology 13.5% 6.3% 9.6% 10.4% 13.1%Total 22.2% 22.3% 22.0% 21.9% 23.5%
23.522.2 22.3
21.9
25.0%
20.0%
15.0%
0%08 09 1006 07
22.0
23.5
22.2 22.3
21.9
24.0%
23.0%
22.0%
21.0%08 09 1006 07
22.0
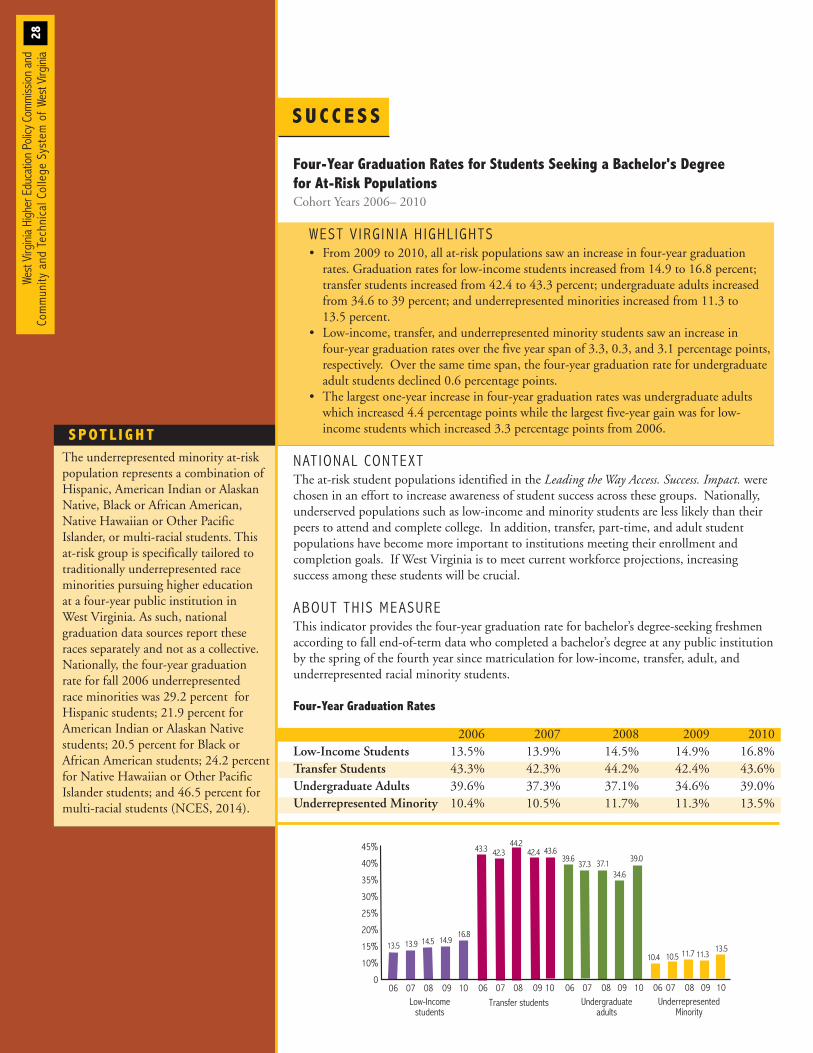
S U C C E S S
West Virg
inia Higher Education Po
licy C
ommiss
ion and
Commun
ity and
Tec
hnical College
System of We
st Virg
inia
28
Four-Year Graduation Rates for Students Seeking a Bachelor's Degree for At-Risk PopulationsCohort Years 2006– 2010
WEST V IRG IN IA H IGHL IGHTS • From 2009 to 2010, all at-risk populations saw an increase in four-year graduation rates. Graduation rates for low-income students increased from 14.9 to 16.8 percent; transfer students increased from 42.4 to 43.3 percent; undergraduate adults increased from 34.6 to 39 percent; and underrepresented minorities increased from 11.3 to 13.5 percent.
• Low-income, transfer, and underrepresented minority students saw an increase in four-year graduation rates over the five year span of 3.3, 0.3, and 3.1 percentage points, respectively. Over the same time span, the four-year graduation rate for undergraduate adult students declined 0.6 percentage points.
• The largest one-year increase in four-year graduation rates was undergraduate adults which increased 4.4 percentage points while the largest five-year gain was for low-income students which increased 3.3 percentage points from 2006.
NAT IONAL CONTEXTThe at-risk student populations identified in the Leading the Way Access. Success. Impact. werechosen in an effort to increase awareness of student success across these groups. Nationally, underserved populations such as low-income and minority students are less likely than theirpeers to attend and complete college. In addition, transfer, part-time, and adult student populations have become more important to institutions meeting their enrollment and completion goals. If West Virginia is to meet current workforce projections, increasing success among these students will be crucial.
ABOUT TH IS MEASUREThis indicator provides the four-year graduation rate for bachelor’s degree-seeking freshmen according to fall end-of-term data who completed a bachelor’s degree at any public institutionby the spring of the fourth year since matriculation for low-income, transfer, adult, and underrepresented racial minority students.
Four-Year Graduation Rates
2006 2007 2008 2009 2010Low-Income Students 13.5% 13.9% 14.5% 14.9% 16.8%Transfer Students 43.3% 42.3% 44.2% 42.4% 43.6%Undergraduate Adults 39.6% 37.3% 37.1% 34.6% 39.0%Underrepresented Minority 10.4% 10.5% 11.7% 11.3% 13.5%
S POT L I G H T The underrepresented minority at-riskpopulation represents a combination ofHispanic, American Indian or AlaskanNative, Black or African American, Native Hawaiian or Other Pacific Islander, or multi-racial students. Thisat-risk group is specifically tailored totraditionally underrepresented race minorities pursuing higher education at a four-year public institution in West Virginia. As such, national graduation data sources report theseraces separately and not as a collective.Nationally, the four-year graduation rate for fall 2006 underrepresented race minorities was 29.2 percent forHispanic students; 21.9 percent forAmerican Indian or Alaskan Native students; 20.5 percent for Black orAfrican American students; 24.2 percentfor Native Hawaiian or Other Pacific Islander students; and 46.5 percent formulti-racial students (NCES, 2014).
Low-Incomestudents
Transfer students Undergraduateadults
UnderrepresentedMinority
45%
40%
35%
30%
25%
20%
15%
10%
008
14.5
06 07
16.813.9
1009
13.514.9
42.444.2
42.3 43.6
34.6
39.6 37.137.339.0
11.7 13.510.510.4 11.3
43.3
0806 07 1009 0806 07 1009 0806 07 1009
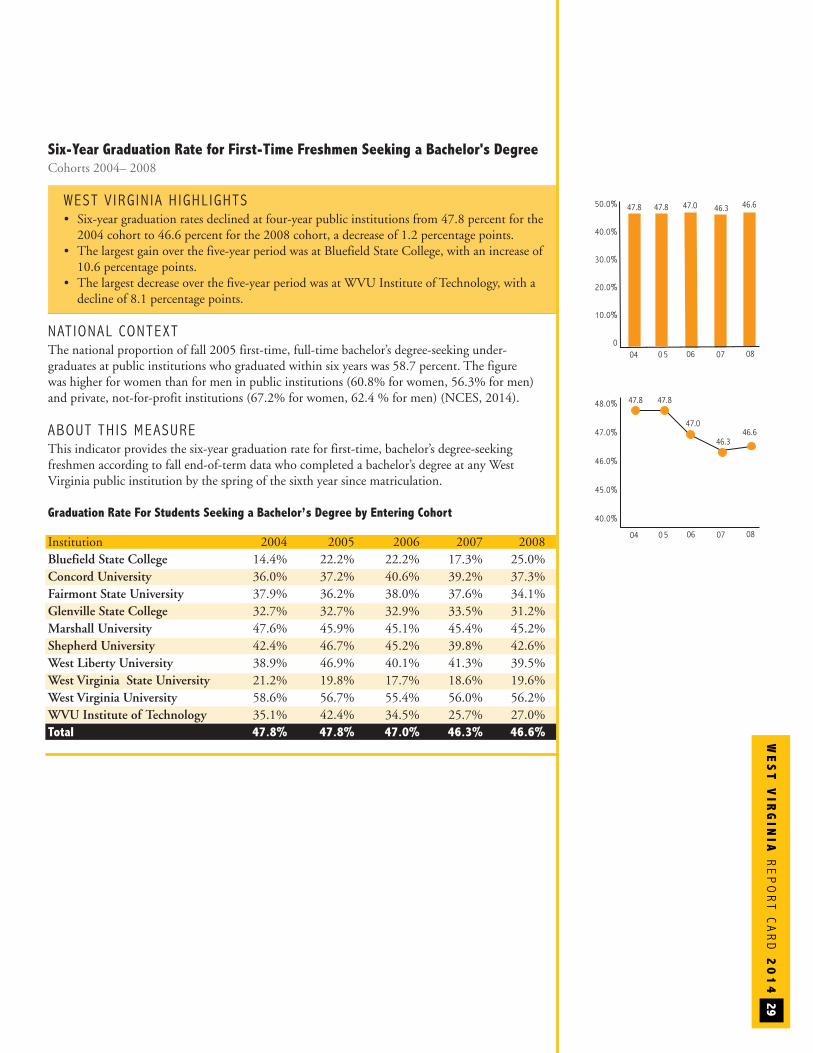
WE
ST
VIR
GIN
IAREPORT C
ARD
20
14
29
Six-Year Graduation Rate for First-Time Freshmen Seeking a Bachelor's DegreeCohorts 2004– 2008
WEST V IRG IN IA H IGHL IGHTS• Six-year graduation rates declined at four-year public institutions from 47.8 percent for the 2004 cohort to 46.6 percent for the 2008 cohort, a decrease of 1.2 percentage points.
• The largest gain over the five-year period was at Bluefield State College, with an increase of 10.6 percentage points.
• The largest decrease over the five-year period was at WVU Institute of Technology, with a decline of 8.1 percentage points.
NAT IONAL CONTEXTThe national proportion of fall 2005 first-time, full-time bachelor’s degree-seeking under-graduates at public institutions who graduated within six years was 58.7 percent. The figure was higher for women than for men in public institutions (60.8% for women, 56.3% for men)and private, not-for-profit institutions (67.2% for women, 62.4 % for men) (NCES, 2014).
ABOUT TH IS MEASUREThis indicator provides the six-year graduation rate for first-time, bachelor’s degree-seeking freshmen according to fall end-of-term data who completed a bachelor’s degree at any West Virginia public institution by the spring of the sixth year since matriculation.
Graduation Rate For Students Seeking a Bachelor’s Degree by Entering Cohort
Institution 2004 2005 2006 2007 2008Bluefield State College 14.4% 22.2% 22.2% 17.3% 25.0%Concord University 36.0% 37.2% 40.6% 39.2% 37.3%Fairmont State University 37.9% 36.2% 38.0% 37.6% 34.1%Glenville State College 32.7% 32.7% 32.9% 33.5% 31.2%Marshall University 47.6% 45.9% 45.1% 45.4% 45.2%Shepherd University 42.4% 46.7% 45.2% 39.8% 42.6%West Liberty University 38.9% 46.9% 40.1% 41.3% 39.5%West Virginia State University 21.2% 19.8% 17.7% 18.6% 19.6%West Virginia University 58.6% 56.7% 55.4% 56.0% 56.2%WVU Institute of Technology 35.1% 42.4% 34.5% 25.7% 27.0%Total 47.8% 47.8% 47.0% 46.3% 46.6%
46.647.8 46.350.0%
40.0%
30.0%
20.0%
10.0%
006 07 0804 0 5
47.0
48.0%
47.0%
46.0%
45.0%
40.0%
06 07 0804 0 5
46.6
47.8
46.3
47.0
47.8
47.8
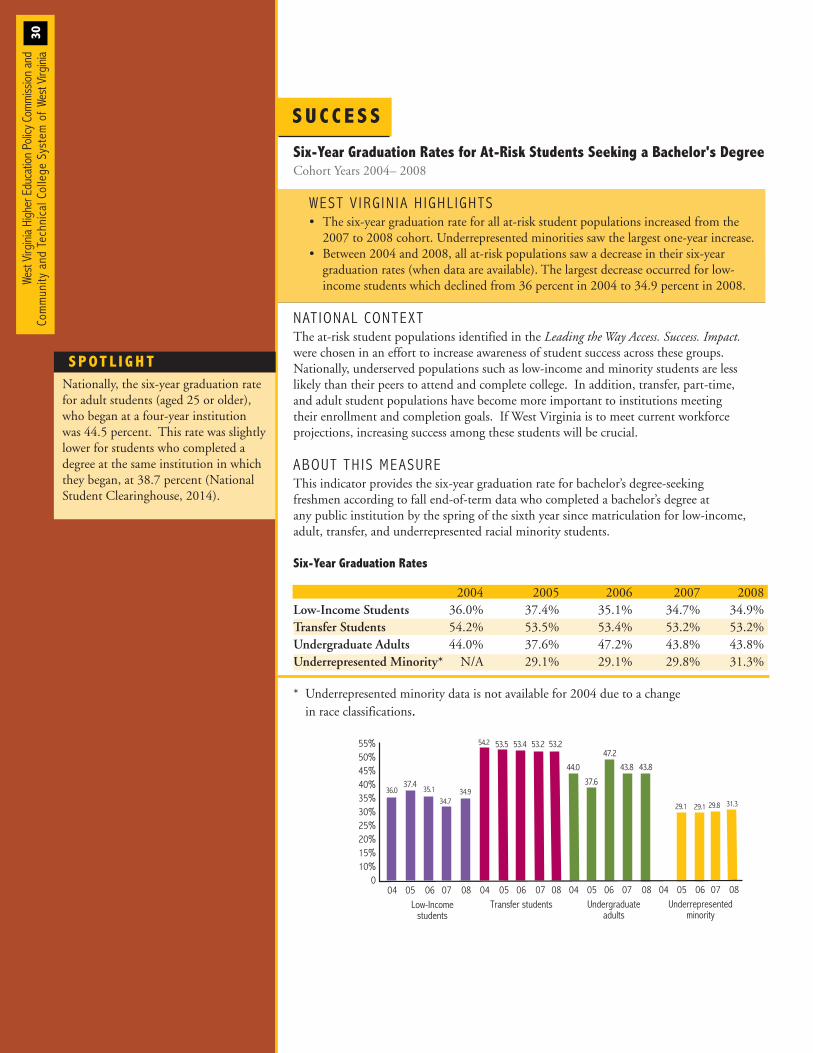
S U C C E S S
West Virg
inia Higher Education Po
licy C
ommiss
ion and
Commun
ity and
Tec
hnical College
System of We
st Virg
inia
30
Six-Year Graduation Rates for At-Risk Students Seeking a Bachelor's Degree Cohort Years 2004– 2008
WEST V IRG IN IA H IGHL IGHTS • The six-year graduation rate for all at-risk student populations increased from the 2007 to 2008 cohort. Underrepresented minorities saw the largest one-year increase.
• Between 2004 and 2008, all at-risk populations saw a decrease in their six-year graduation rates (when data are available). The largest decrease occurred for low-income students which declined from 36 percent in 2004 to 34.9 percent in 2008.
NAT IONAL CONTEXTThe at-risk student populations identified in the Leading the Way Access. Success. Impact.were chosen in an effort to increase awareness of student success across these groups. Nationally, underserved populations such as low-income and minority students are less likely than their peers to attend and complete college. In addition, transfer, part-time, and adult student populations have become more important to institutions meeting their enrollment and completion goals. If West Virginia is to meet current workforce projections, increasing success among these students will be crucial.
ABOUT TH IS MEASUREThis indicator provides the six-year graduation rate for bachelor’s degree-seeking freshmen according to fall end-of-term data who completed a bachelor’s degree at any public institution by the spring of the sixth year since matriculation for low-income,adult, transfer, and underrepresented racial minority students.
Six-Year Graduation Rates
2004 2005 2006 2007 2008Low-Income Students 36.0% 37.4% 35.1% 34.7% 34.9%Transfer Students 54.2% 53.5% 53.4% 53.2% 53.2%Undergraduate Adults 44.0% 37.6% 47.2% 43.8% 43.8%Underrepresented Minority* N/A 29.1% 29.1% 29.8% 31.3%
* Underrepresented minority data is not available for 2004 due to a change in race classifications.
S POT L I G H T Nationally, the six-year graduation ratefor adult students (aged 25 or older),who began at a four-year institution was 44.5 percent. This rate was slightlylower for students who completed a degree at the same institution in whichthey began, at 38.7 percent (NationalStudent Clearinghouse, 2014).
Low-Incomestudents
Transfer students Undergraduateadults
Underrepresentedminority
55%50%45%40%35%30%25%20%15%10%
006
35.1
04 05
34.937.4
0807
36.034.7
53.253.453.5 53.2
43.844.0
47.2
37.6
43.8
29.1 31.329.1 29.8
54.2
0604 05 0807 0604 05 0807 0604 05 0807
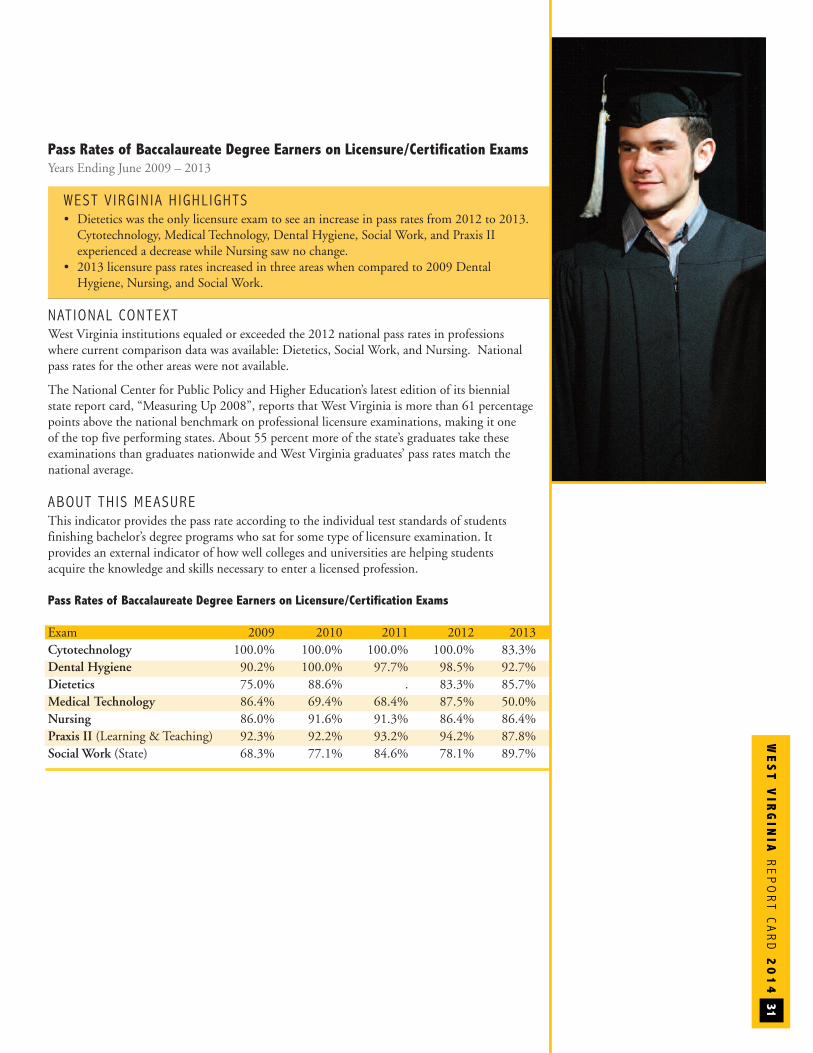
WE
ST
VIR
GIN
IAREPORT C
ARD
20
14
31
Pass Rates of Baccalaureate Degree Earners on Licensure/Certification ExamsYears Ending June 2009 – 2013
WEST V IRG IN IA H IGHL IGHTS• Dietetics was the only licensure exam to see an increase in pass rates from 2012 to 2013. Cytotechnology, Medical Technology, Dental Hygiene, Social Work, and Praxis II experienced a decrease while Nursing saw no change.
• 2013 licensure pass rates increased in three areas when compared to 2009 Dental Hygiene, Nursing, and Social Work.
NAT IONAL CONTEXTWest Virginia institutions equaled or exceeded the 2012 national pass rates in professionswhere current comparison data was available: Dietetics, Social Work, and Nursing. Nationalpass rates for the other areas were not available.
The National Center for Public Policy and Higher Education’s latest edition of its biennial state report card, “Measuring Up 2008”, reports that West Virginia is more than 61 percentagepoints above the national benchmark on professional licensure examinations, making it one of the top five performing states. About 55 percent more of the state’s graduates take these examinations than graduates nationwide and West Virginia graduates’ pass rates match thenational average.
ABOUT TH IS MEASUREThis indicator provides the pass rate according to the individual test standards of students finishing bachelor’s degree programs who sat for some type of licensure examination. It provides an external indicator of how well colleges and universities are helping students acquire the knowledge and skills necessary to enter a licensed profession.
Pass Rates of Baccalaureate Degree Earners on Licensure/Certification Exams
Exam 2009 2010 2011 2012 2013Cytotechnology 100.0% 100.0% 100.0% 100.0% 83.3%Dental Hygiene 90.2% 100.0% 97.7% 98.5% 92.7%Dietetics 75.0% 88.6% . 83.3% 85.7%Medical Technology 86.4% 69.4% 68.4% 87.5% 50.0%Nursing 86.0% 91.6% 91.3% 86.4% 86.4%Praxis II (Learning & Teaching) 92.3% 92.2% 93.2% 94.2% 87.8%Social Work (State) 68.3% 77.1% 84.6% 78.1% 89.7%
S U C C E S S
West Virg
inia Higher Education Po
licy C
ommiss
ion and
Commun
ity and
Tec
hnical College
System of We
st Virg
inia
32
Pass Rates of Graduate/Professional Degree Earners on Licensure/Certification ExamsYears Ending June 2009 – 2013
WEST V IRG IN IA H IGHL IGHTS• 2013 licensure pass rates increased in five of twelve areas when compared to 2012 and eight of twelve since 2008.
• The areas of Dentistry, National Exam in Speech Pathology & Audiology, Pharmacy (Pharm D), and Physical Therapy, all have pass rates above 90 percent for each of the five years examined.
• Comlex and USMLE Step 3 had a pass rate above 90 percent from 2009 through 2011. New reporting methods combine the exams under a general medicine category, where pass rates have remained above 90 percent in 2012 and 2013.
NAT IONAL CONTEXTWest Virginia institutions exceeded the national pass rate in all exams with an available national 2013 pass rate: National Exam in Speech Pathology & Audiology, OccupationalTherapy, and Physical Therapy. The newly combined Comlex Level 3 and USMLE Step 3or reporting methods make it difficult to discern individual pass rates for these exams.
ABOUT TH IS MEASUREThis indicator provides the pass rate according to the individual test standards of studentsfinishing master’s professional degree programs who sat for some type of licensure examination. It provides an external indicator of how well colleges and universities are helping students acquire the knowledge and skills necessary to enter a licensed profession.
Pass Rates of Graduate/Professional Degree Earners on Licensure/Certification Exams*
Exam 2009 2010 2011 2012 2013Comlex Level 3 100.0% 96.4% 92.7% . .Dentistry 97.9% 94.6% 98.5% 97.0% 98.0%Dietetics 60.0% 87.5% 100.0% 77.8% 88.9%Family Nurse Practitioner 94.4% 97.4% 97.0% 76.3% 89.7%Law 71.3% 77.7% 80.6% 77.9% 76.0%Medicine (USMLE Step 3 . . . 98.5% 97.8%or COMLEX Level 3)
National Certified Counselor Exam 83.3% 68.4% 85.2% 100.0% 92.3%National Exam in Speech Pathology 98.2% 98.0% 100.0% 96.3% 100.0%& Audiology
Occupational Therapy 89.5% 90.0% 100.0% 100.0% 100.0%Pharmacy (Pharm D) 95.0% 97.4% 95.9% 97.2% 98.7%Physical Therapy 100.0% 100.0% 100.0% 96.8% 100.0%Teacher Education-Praxis II 86.8% 89.0% 90.8% 90.8% 91.4%USMLE Step 3 97.4% 100.0% 97.9% . .WV Competency Exam for 94.3% 81.8% 97.1% 100.0% 0.0%Counselor Licensing
*Data collection methods were changed in 2012. The new reporting methods combineComlex Level 3 and USMLE Step 3 into the Medicine category.
WE
ST
VIR
GIN
IAREPORT C
ARD
20
14
33
Average Nine-Month Salary of Full-Time Instructional Faculty by RankFall 2009 – 2013
WEST V IRG IN IA H IGHL IGHTS• Overall, faculty salaries increased 1 percent between 2012 and 2013. Salary gains since 2009 were 7.1 percent.
• The largest one-year percentage increase by faculty rank was for associate professors at 1.3 percent ($898), while the largest five-year percentage increase was for graduate assistants and others who realized a 17.4 percent ($6,781) increase from 2009 to 2013.
• Over the five-year period, the smallest increase was for instructors who realized, on average, a 2.6 percent increase in salary. From 2012 to 2013, on average, instructors’ salaries decreased by 0.2 percent.
NAT IONAL CONTEXTNationally, the average salary of full-time faculty in 2012-13 was $108,310 for full professors,$77,089 for associate professors, $64,632 for assistant professors and $57,495 for instructorswhich combined for an overall average salary of $77,301 (NCES, 2014).
ABOUT TH IS MEASUREThis indicator provides the average salary for West Virginia’s baccalaureate and graduate full-time instructional faculty from fall 2009 to fall 2013. The data do not include medicalschool faculty. It is important that faculty salaries be competitive with other institutions inorder to attract and retain quality faculty. While this indicator provides only salaries of full-time faculty, there have been larger increases nationally in the number of part-time faculty than full-time faculty over the last decade (NCES, 2008).
Average Nine-Month Salary of Full-Time Instructional Faculty by Rank, Fall 2013
Institution Professor Associate Assistant Instructor Lecturer Graduate All RanksProfessor Professor Assistant & Other
Bluefield State College $68,796 $62,397 $53,854 $39,358 $39,684 $45,000 $58,575 Concord University $68,811 $57,651 $52,567 $41,092 $31,500 . $56,526 Fairmont State University $76,200 $64,638 $51,404 $37,564 . $48,976 $62,182 Glenville State College $73,961 $65,494 $51,313 $44,430 . . $54,736 Marshall University $76,269 $63,612 $55,928 $34,931 . $31,000 $62,698 Potomac State College of WVU $69,681 $52,468 $47,935 $42,306 . . $51,786 Shepherd University $74,775 $64,095 $55,840 . $44,356 . $61,385 West Liberty University $65,916 $70,896 $56,511 $47,779 $40,195 . $60,231 West Virginia State University $63,900 $56,885 $49,817 $41,347 . $44,000 $54,958 West Virginia University $109,997 $81,988 $66,246 $42,251 $56,415 . $81,273 WVU Institute of Technology $81,482 $60,267 $54,812 $42,176 $53,284 . $61,196 System $88,122 $71,520 $59,161 $40,445 $51,526 $45,786 $68,775
*Graduate student packages may include tuition waivers and living stipends. Funding may also be determined by grant funds.
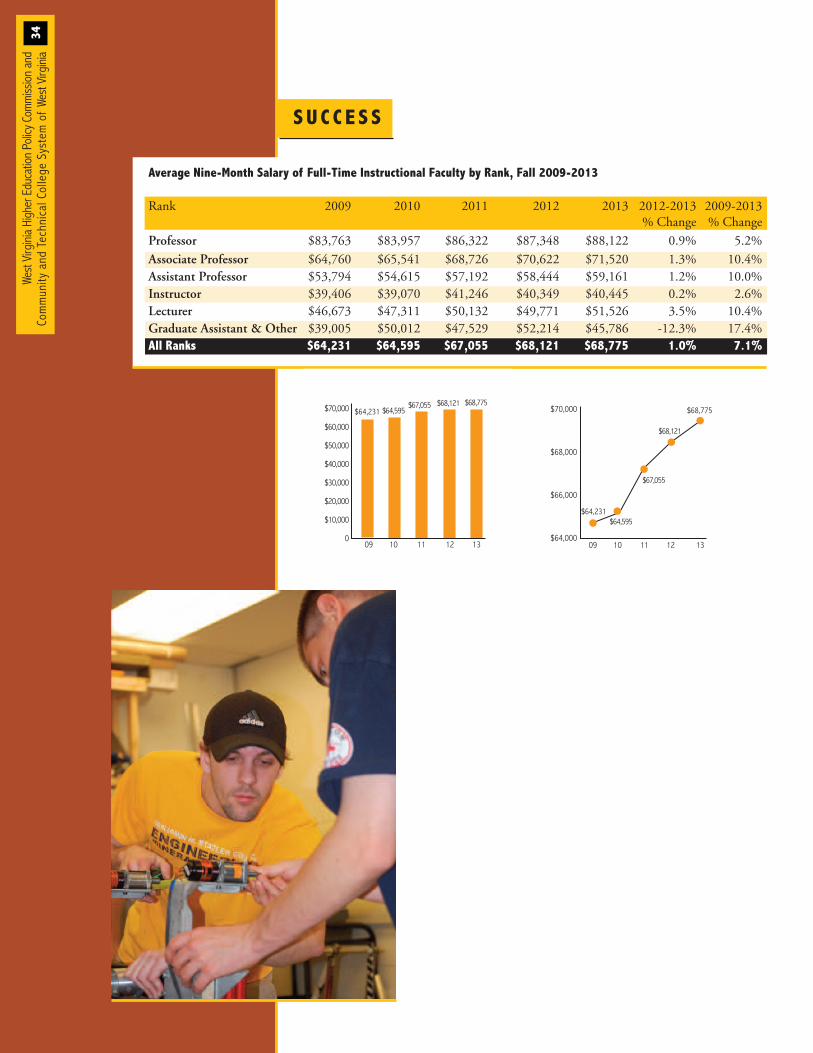
S U C C E S S
West Virg
inia Higher Education Po
licy C
ommiss
ion and
Commun
ity and
Tec
hnical College
System of We
st Virg
inia
34
Average Nine-Month Salary of Full-Time Instructional Faculty by Rank, Fall 2009-2013
Rank 2009 2010 2011 2012 2013 2012-2013 2009-2013% Change % Change
Professor $83,763 $83,957 $86,322 $87,348 $88,122 0.9% 5.2%Associate Professor $64,760 $65,541 $68,726 $70,622 $71,520 1.3% 10.4%Assistant Professor $53,794 $54,615 $57,192 $58,444 $59,161 1.2% 10.0%Instructor $39,406 $39,070 $41,246 $40,349 $40,445 0.2% 2.6%Lecturer $46,673 $47,311 $50,132 $49,771 $51,526 3.5% 10.4%Graduate Assistant & Other $39,005 $50,012 $47,529 $52,214 $45,786 -12.3% 17.4%All Ranks $64,231 $64,595 $67,055 $68,121 $68,775 1.0% 7.1%
$70,000
$68,000
$66,000
$64,000
$64,595
$68,121
$64,231
$67,055
10 11 1309 12
$68,775
10 11 1309
$64,595$68,121 $68,775
$64,231$67,055$70,000
$60,000
$50,000
$40,000
$30,000
$20,000
$10,000
012
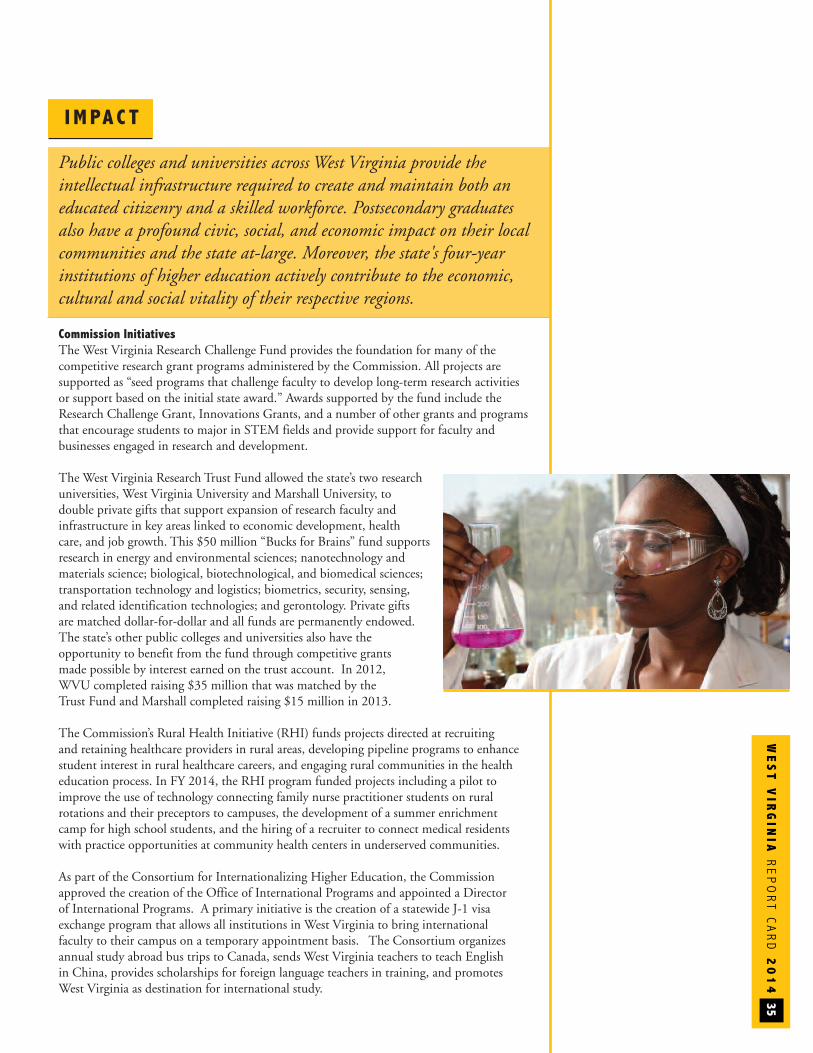
WE
ST
VIR
GIN
IAREPORT C
ARD
20
14
35
Public colleges and universities across West Virginia provide the intellectual infrastructure required to create and maintain both an educated citizenry and a skilled workforce. Postsecondary graduates also have a profound civic, social, and economic impact on their localcommunities and the state at-large. Moreover, the state's four-year institutions of higher education actively contribute to the economic, cultural and social vitality of their respective regions.
Commission InitiativesThe West Virginia Research Challenge Fund provides the foundation for many of the competitive research grant programs administered by the Commission. All projects are supported as “seed programs that challenge faculty to develop long-term research activities or support based on the initial state award.” Awards supported by the fund include the Research Challenge Grant, Innovations Grants, and a number of other grants and programsthat encourage students to major in STEM fields and provide support for faculty and businesses engaged in research and development.
The West Virginia Research Trust Fund allowed the state’s two research universities, West Virginia University and Marshall University, to double private gifts that support expansion of research faculty and infrastructure in key areas linked to economic development, health care, and job growth. This $50 million “Bucks for Brains” fund supports research in energy and environmental sciences; nanotechnology and materials science; biological, biotechnological, and biomedical sciences; transportation technology and logistics; biometrics, security, sensing, and related identification technologies; and gerontology. Private gifts are matched dollar-for-dollar and all funds are permanently endowed. The state’s other public colleges and universities also have the opportunity to benefit from the fund through competitive grants made possible by interest earned on the trust account. In 2012, WVU completed raising $35 million that was matched by the Trust Fund and Marshall completed raising $15 million in 2013.
The Commission’s Rural Health Initiative (RHI) funds projects directed at recruiting and retaining healthcare providers in rural areas, developing pipeline programs to enhance student interest in rural healthcare careers, and engaging rural communities in the health education process. In FY 2014, the RHI program funded projects including a pilot to improve the use of technology connecting family nurse practitioner students on rural rotations and their preceptors to campuses, the development of a summer enrichment camp for high school students, and the hiring of a recruiter to connect medical residents with practice opportunities at community health centers in underserved communities.
As part of the Consortium for Internationalizing Higher Education, the Commission approved the creation of the Office of International Programs and appointed a Director of International Programs. A primary initiative is the creation of a statewide J-1 visa exchange program that allows all institutions in West Virginia to bring international faculty to their campus on a temporary appointment basis. The Consortium organizes annual study abroad bus trips to Canada, sends West Virginia teachers to teach English in China, provides scholarships for foreign language teachers in training, and promotes West Virginia as destination for international study.
I M PA C T
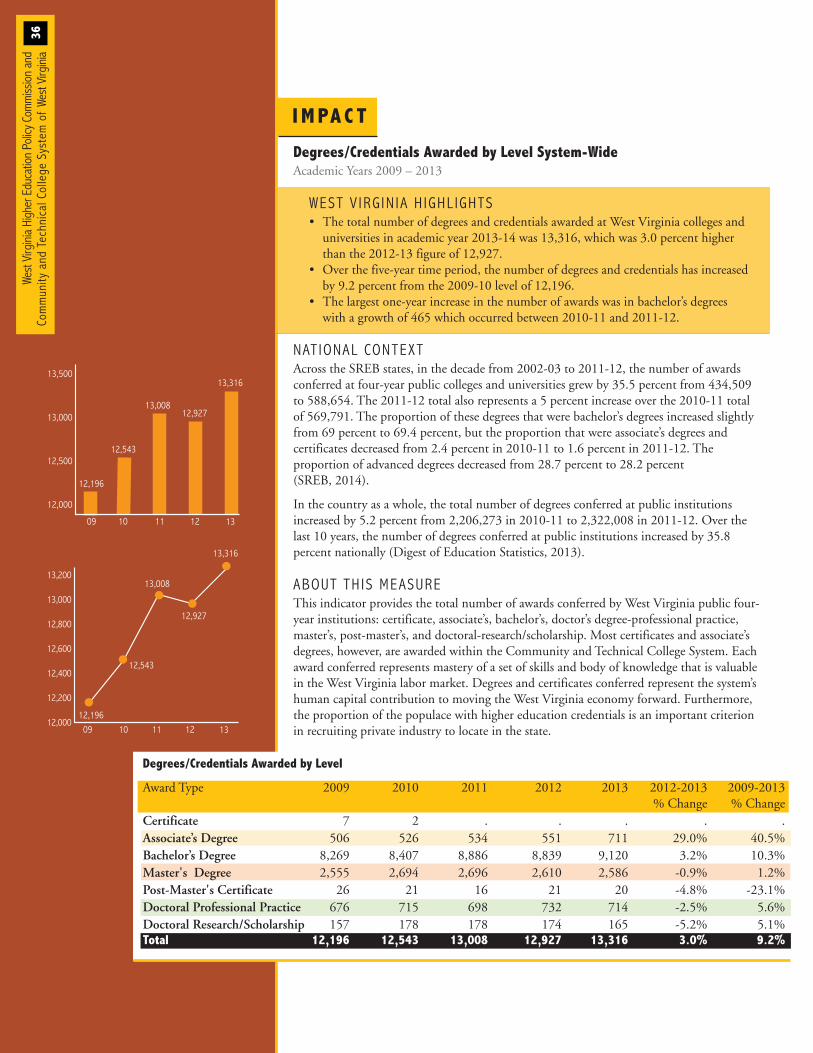
I M PA C T
West Virg
inia Higher Education Po
licy C
ommiss
ion and
Commun
ity and
Tec
hnical College
System of We
st Virg
inia
36
Degrees/Credentials Awarded by Level System-WideAcademic Years 2009 – 2013
WEST V IRG IN IA H IGHL IGHTS• The total number of degrees and credentials awarded at West Virginia colleges and universities in academic year 2013-14 was 13,316, which was 3.0 percent higher than the 2012-13 figure of 12,927.
• Over the five-year time period, the number of degrees and credentials has increased by 9.2 percent from the 2009-10 level of 12,196.
• The largest one-year increase in the number of awards was in bachelor’s degrees with a growth of 465 which occurred between 2010-11 and 2011-12.
NAT IONAL CONTEXTAcross the SREB states, in the decade from 2002-03 to 2011-12, the number of awards conferred at four-year public colleges and universities grew by 35.5 percent from 434,509 to 588,654. The 2011-12 total also represents a 5 percent increase over the 2010-11 total of 569,791. The proportion of these degrees that were bachelor’s degrees increased slightlyfrom 69 percent to 69.4 percent, but the proportion that were associate’s degrees and certificates decreased from 2.4 percent in 2010-11 to 1.6 percent in 2011-12. The proportion of advanced degrees decreased from 28.7 percent to 28.2 percent (SREB, 2014).
In the country as a whole, the total number of degrees conferred at public institutions increased by 5.2 percent from 2,206,273 in 2010-11 to 2,322,008 in 2011-12. Over the last 10 years, the number of degrees conferred at public institutions increased by 35.8 percent nationally (Digest of Education Statistics, 2013).
ABOUT TH IS MEASUREThis indicator provides the total number of awards conferred by West Virginia public four-year institutions: certificate, associate’s, bachelor’s, doctor’s degree-professional practice, master’s, post-master’s, and doctoral-research/scholarship. Most certificates and associate’s degrees, however, are awarded within the Community and Technical College System. Eachaward conferred represents mastery of a set of skills and body of knowledge that is valuable in the West Virginia labor market. Degrees and certificates conferred represent the system’shuman capital contribution to moving the West Virginia economy forward. Furthermore,the proportion of the populace with higher education credentials is an important criterion in recruiting private industry to locate in the state.
Degrees/Credentials Awarded by Level
Award Type 2009 2010 2011 2012 2013 2012-2013 2009-2013% Change % Change
Certificate 7 2 . . . . .Associate’s Degree 506 526 534 551 711 29.0% 40.5%Bachelor’s Degree 8,269 8,407 8,886 8,839 9,120 3.2% 10.3%Master's Degree 2,555 2,694 2,696 2,610 2,586 -0.9% 1.2%Post-Master's Certificate 26 21 16 21 20 -4.8% -23.1%Doctoral Professional Practice 676 715 698 732 714 -2.5% 5.6%Doctoral Research/Scholarship 157 178 178 174 165 -5.2% 5.1%Total 12,196 12,543 13,008 12,927 13,316 3.0% 9.2%
13,500
13,000
12,500
12,000
09 10 11 12 13
13,316
13,00812,927
12,196
0
12,543
13,200
13,000
12,800
12,600
12,400
12,200
12,000
13,316
12,196
12,543
09 10 11 12 13
13,008
12,927
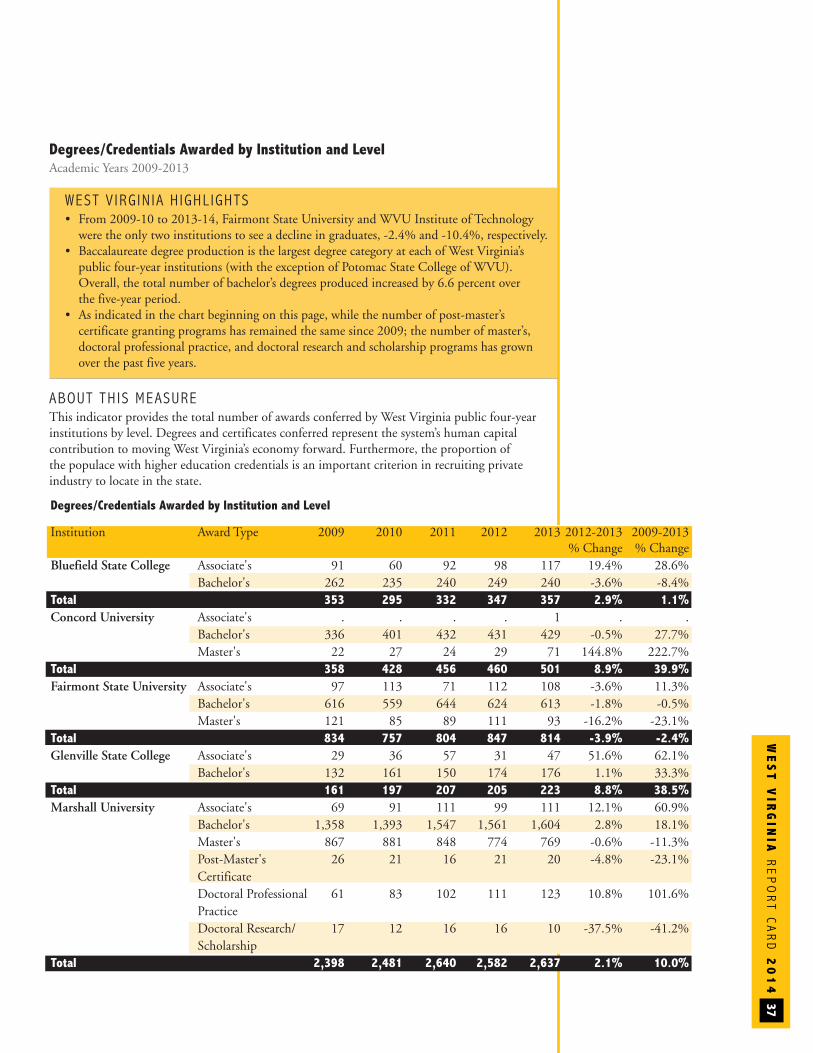
WE
ST
VIR
GIN
IAREPORT C
ARD
20
14
37
Degrees/Credentials Awarded by Institution and LevelAcademic Years 2009-2013
WEST V IRG IN IA H IGHL IGHTS• From 2009-10 to 2013-14, Fairmont State University and WVU Institute of Technology were the only two institutions to see a decline in graduates, -2.4% and -10.4%, respectively.
• Baccalaureate degree production is the largest degree category at each of West Virginia’s public four-year institutions (with the exception of Potomac State College of WVU). Overall, the total number of bachelor’s degrees produced increased by 6.6 percent over the five-year period.
• As indicated in the chart beginning on this page, while the number of post-master’s certificate granting programs has remained the same since 2009; the number of master’s, doctoral professional practice, and doctoral research and scholarship programs has grown over the past five years.
ABOUT TH IS MEASUREThis indicator provides the total number of awards conferred by West Virginia public four-yearinstitutions by level. Degrees and certificates conferred represent the system’s human capital contribution to moving West Virginia’s economy forward. Furthermore, the proportion of the populace with higher education credentials is an important criterion in recruiting private industry to locate in the state.
Degrees/Credentials Awarded by Institution and Level
Institution Award Type 2009 2010 2011 2012 2013 2012-2013 2009-2013 % Change % Change
Bluefield State College Associate's 91 60 92 98 117 19.4% 28.6%Bachelor's 262 235 240 249 240 -3.6% -8.4%
Total 353 295 332 347 357 2.9% 1.1%Concord University Associate's . . . . 1 . .
Bachelor's 336 401 432 431 429 -0.5% 27.7%Master's 22 27 24 29 71 144.8% 222.7%
Total 358 428 456 460 501 8.9% 39.9%Fairmont State University Associate's 97 113 71 112 108 -3.6% 11.3%
Bachelor's 616 559 644 624 613 -1.8% -0.5%Master's 121 85 89 111 93 -16.2% -23.1%
Total 834 757 804 847 814 -3.9% -2.4%Glenville State College Associate's 29 36 57 31 47 51.6% 62.1%
Bachelor's 132 161 150 174 176 1.1% 33.3%Total 161 197 207 205 223 8.8% 38.5%Marshall University Associate's 69 91 111 99 111 12.1% 60.9%
Bachelor's 1,358 1,393 1,547 1,561 1,604 2.8% 18.1%Master's 867 881 848 774 769 -0.6% -11.3%Post-Master's 26 21 16 21 20 -4.8% -23.1%CertificateDoctoral Professional 61 83 102 111 123 10.8% 101.6% Practice Doctoral Research/ 17 12 16 16 10 -37.5% -41.2%Scholarship
Total 2,398 2,481 2,640 2,582 2,637 2.1% 10.0%
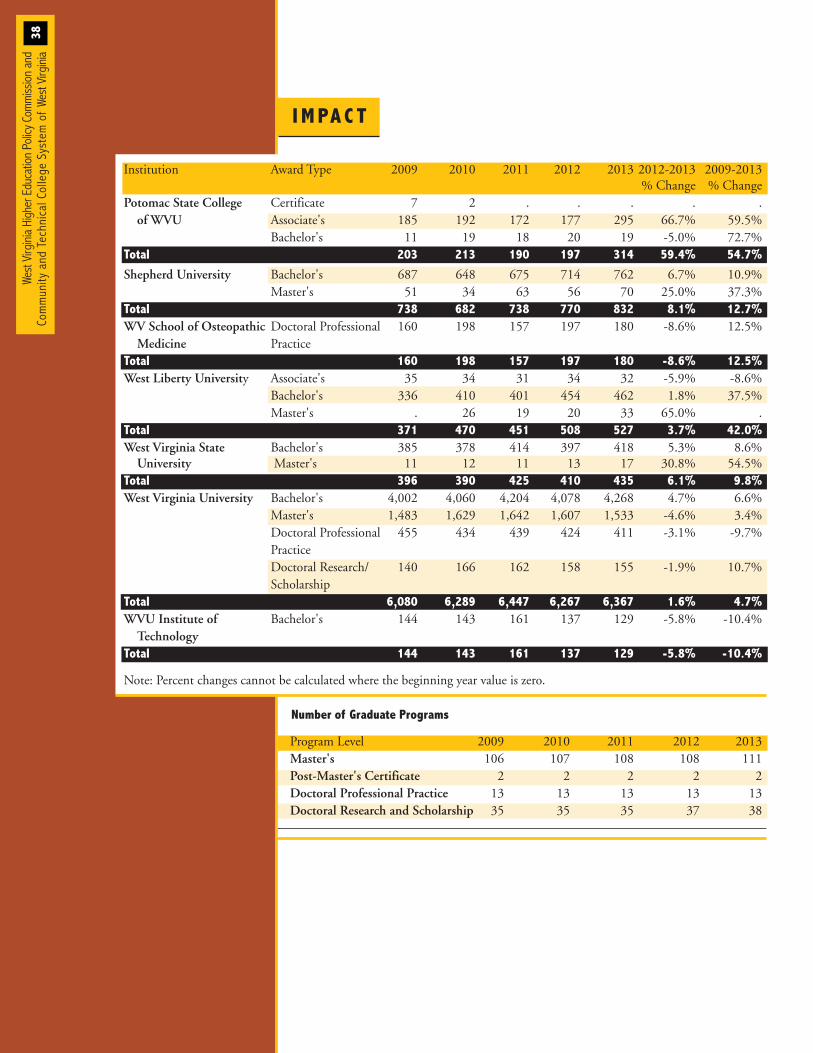
I M PA C T
West Virg
inia Higher Education Po
licy C
ommiss
ion and
Commun
ity and
Tec
hnical College
System of We
st Virg
inia
38
Institution Award Type 2009 2010 2011 2012 2013 2012-2013 2009-2013 % Change % Change
Potomac State College Certificate 7 2 . . . . .of WVU Associate's 185 192 172 177 295 66.7% 59.5%
Bachelor's 11 19 18 20 19 -5.0% 72.7%Total 203 213 190 197 314 59.4% 54.7%
Shepherd University Bachelor's 687 648 675 714 762 6.7% 10.9%Master's 51 34 63 56 70 25.0% 37.3%
Total 738 682 738 770 832 8.1% 12.7%WV School of Osteopathic Doctoral Professional 160 198 157 197 180 -8.6% 12.5%Medicine Practice
Total 160 198 157 197 180 -8.6% 12.5%West Liberty University Associate's 35 34 31 34 32 -5.9% -8.6%
Bachelor's 336 410 401 454 462 1.8% 37.5%Master's . 26 19 20 33 65.0% .
Total 371 470 451 508 527 3.7% 42.0%West Virginia State Bachelor's 385 378 414 397 418 5.3% 8.6%University Master's 11 12 11 13 17 30.8% 54.5%
Total 396 390 425 410 435 6.1% 9.8%West Virginia University Bachelor's 4,002 4,060 4,204 4,078 4,268 4.7% 6.6%
Master's 1,483 1,629 1,642 1,607 1,533 -4.6% 3.4%Doctoral Professional 455 434 439 424 411 -3.1% -9.7%Practice Doctoral Research/ 140 166 162 158 155 -1.9% 10.7%Scholarship
Total 6,080 6,289 6,447 6,267 6,367 1.6% 4.7%WVU Institute of Bachelor's 144 143 161 137 129 -5.8% -10.4%Technology
Total 144 143 161 137 129 -5.8% -10.4%
Note: Percent changes cannot be calculated where the beginning year value is zero.
Number of Graduate Programs
Program Level 2009 2010 2011 2012 2013Master's 106 107 108 108 111Post-Master's Certificate 2 2 2 2 2Doctoral Professional Practice 13 13 13 13 13Doctoral Research and Scholarship 35 35 35 37 38
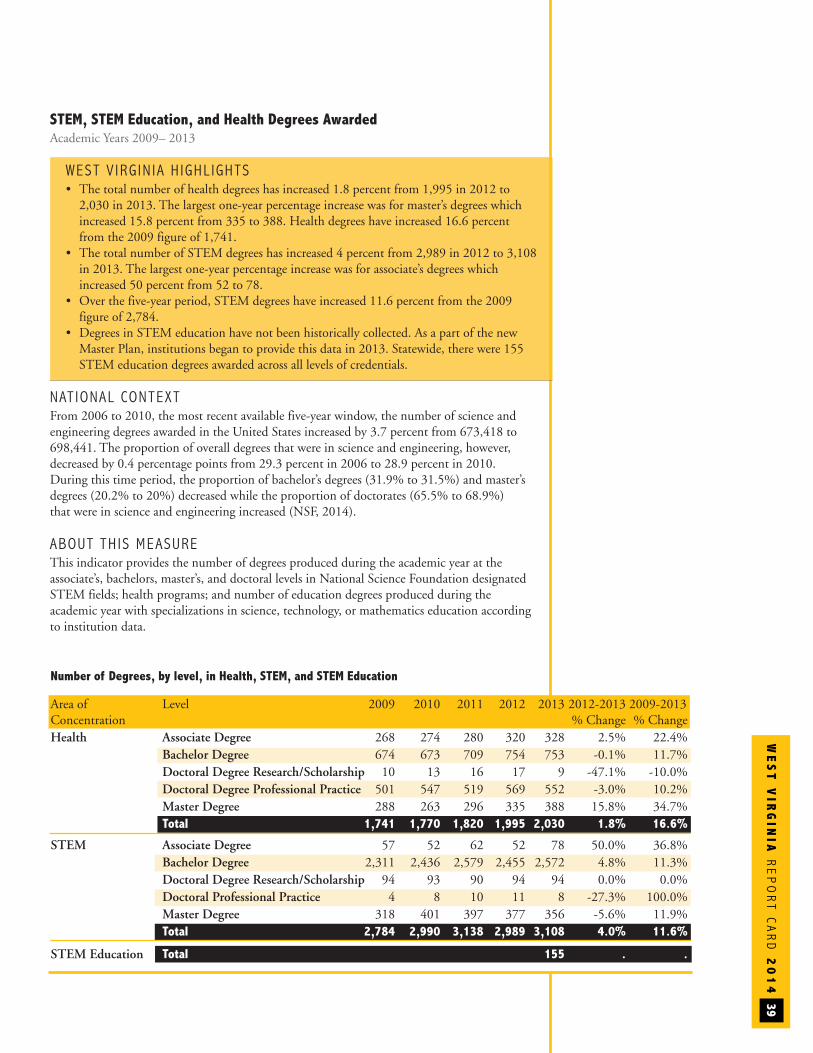
WE
ST
VIR
GIN
IAREPORT C
ARD
20
14
39
STEM, STEM Education, and Health Degrees AwardedAcademic Years 2009– 2013
WEST V IRG IN IA H IGHL IGHTS • The total number of health degrees has increased 1.8 percent from 1,995 in 2012 to 2,030 in 2013. The largest one-year percentage increase was for master’s degrees which increased 15.8 percent from 335 to 388. Health degrees have increased 16.6 percent from the 2009 figure of 1,741.
• The total number of STEM degrees has increased 4 percent from 2,989 in 2012 to 3,108 in 2013. The largest one-year percentage increase was for associate’s degrees which increased 50 percent from 52 to 78.
• Over the five-year period, STEM degrees have increased 11.6 percent from the 2009 figure of 2,784.
• Degrees in STEM education have not been historically collected. As a part of the new Master Plan, institutions began to provide this data in 2013. Statewide, there were 155 STEM education degrees awarded across all levels of credentials.
NAT IONAL CONTEXTFrom 2006 to 2010, the most recent available five-year window, the number of science and engineering degrees awarded in the United States increased by 3.7 percent from 673,418 to698,441. The proportion of overall degrees that were in science and engineering, however, decreased by 0.4 percentage points from 29.3 percent in 2006 to 28.9 percent in 2010. During this time period, the proportion of bachelor’s degrees (31.9% to 31.5%) and master’s degrees (20.2% to 20%) decreased while the proportion of doctorates (65.5% to 68.9%) that were in science and engineering increased (NSF, 2014).
ABOUT TH IS MEASUREThis indicator provides the number of degrees produced during the academic year at the associate’s, bachelors, master’s, and doctoral levels in National Science Foundation designatedSTEM fields; health programs; and number of education degrees produced during the academic year with specializations in science, technology, or mathematics education accordingto institution data.
Number of Degrees, by level, in Health, STEM, and STEM Education
Area of Level 2009 2010 2011 2012 2013 2012-2013 2009-2013Concentration % Change % ChangeHealth Associate Degree 268 274 280 320 328 2.5% 22.4%
Bachelor Degree 674 673 709 754 753 -0.1% 11.7%Doctoral Degree Research/Scholarship 10 13 16 17 9 -47.1% -10.0%Doctoral Degree Professional Practice 501 547 519 569 552 -3.0% 10.2%Master Degree 288 263 296 335 388 15.8% 34.7%Total 1,741 1,770 1,820 1,995 2,030 1.8% 16.6%
STEM Associate Degree 57 52 62 52 78 50.0% 36.8%Bachelor Degree 2,311 2,436 2,579 2,455 2,572 4.8% 11.3%Doctoral Degree Research/Scholarship 94 93 90 94 94 0.0% 0.0%Doctoral Professional Practice 4 8 10 11 8 -27.3% 100.0%Master Degree 318 401 397 377 356 -5.6% 11.9%Total 2,784 2,990 3,138 2,989 3,108 4.0% 11.6%
STEM Education Total 155 . .
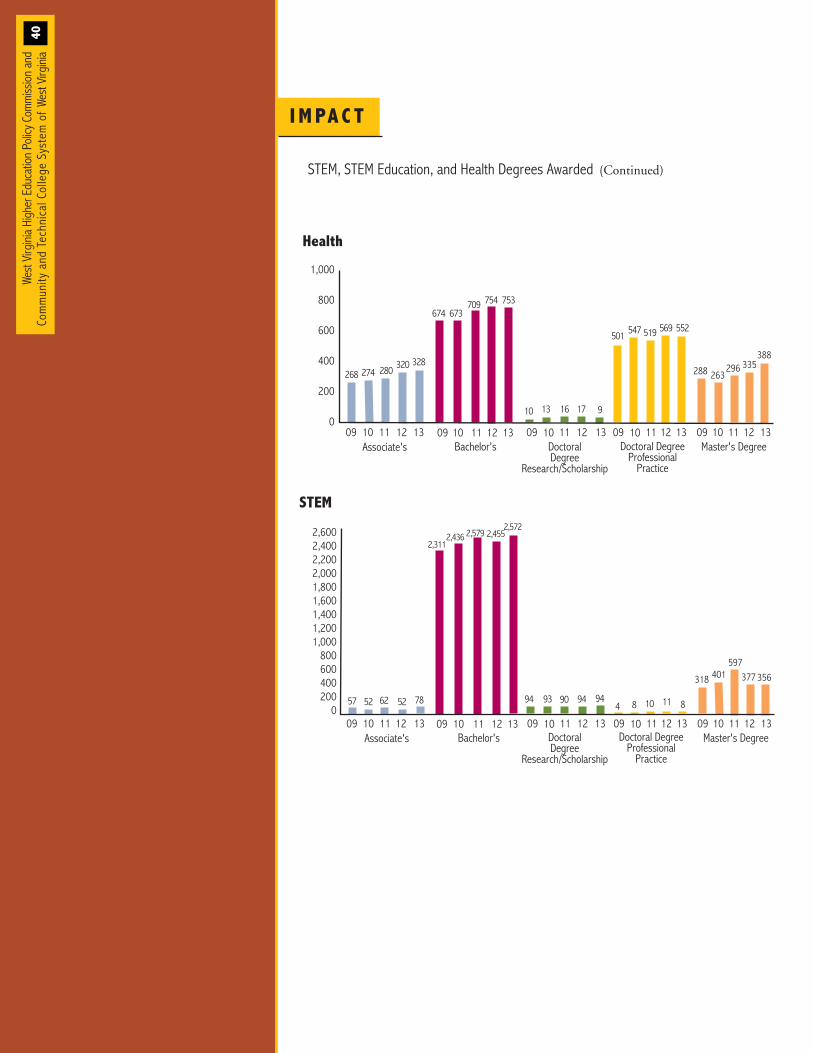
I M PA C T
West Virg
inia Higher Education Po
licy C
ommiss
ion and
Commun
ity and
Tec
hnical College
System of We
st Virg
inia
40
288
1,000
800
600
400
200
011 12
2
Bachelor's Master's Degree09 10 13 09 10 13 1009 10
501
09Doctoral Degree
ProfessionalPractice
11Associate's
268
11
296
1112 1312 1312
335
DoctoralDegree
Research/Scholarship
274 280 320 328
674 673709 754 753
10 13 16 17 9
09 10 11 1312
547 519 569 552
388
263
318
2,6002,4002,2002,0001,8001,6001,4001,2001,000
800600400200
011 12
Bachelor's Master's Degree09 10 13 09 10 13 1009 10
4
0911Associate's
57
11
597
1112 1312 1312
377
52 62 52 78
2,3112,436 2,579 2,455
2,572
94 93 90 94 94
09 10 11 1312
8 10 11 8
356401
Doctoral DegreeProfessional
Practice
DoctoralDegree
Research/Scholarship
STEM, STEM Education, and Health Degrees Awarded (Continued)
Health
STEM
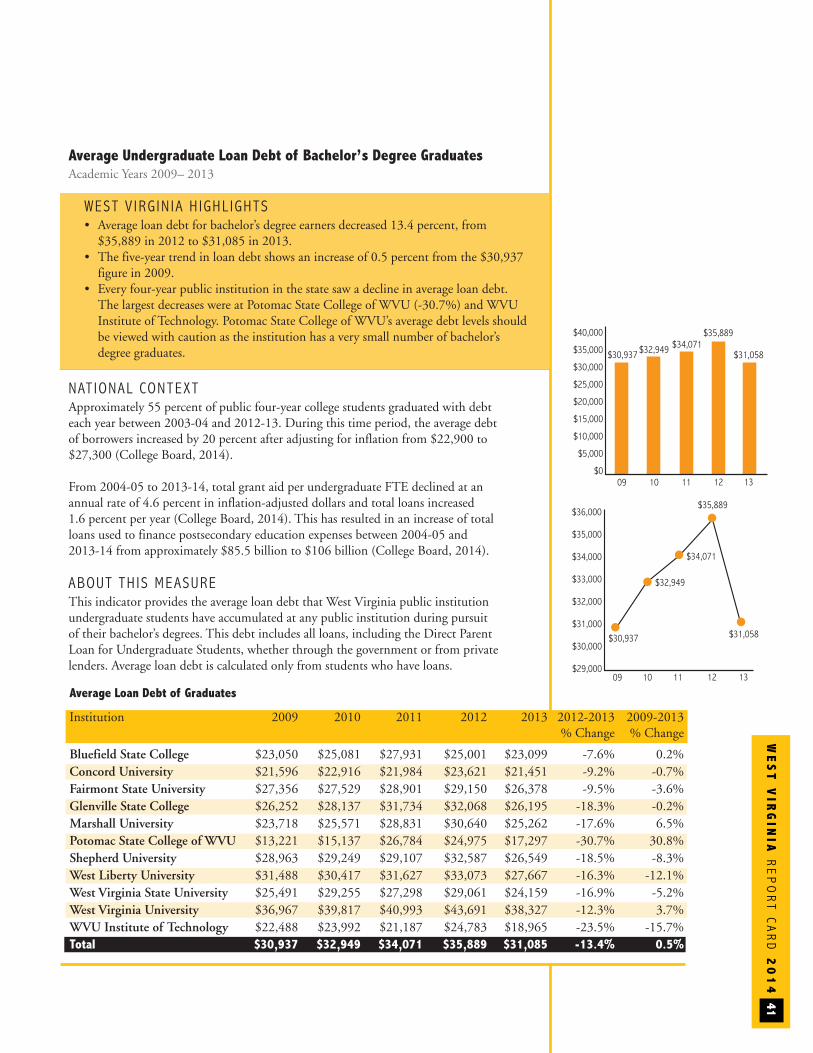
WE
ST
VIR
GIN
IAREPORT C
ARD
20
14
41
Average Undergraduate Loan Debt of Bachelor’s Degree GraduatesAcademic Years 2009– 2013
WEST V IRG IN IA H IGHL IGHTS • Average loan debt for bachelor’s degree earners decreased 13.4 percent, from $35,889 in 2012 to $31,085 in 2013.
• The five-year trend in loan debt shows an increase of 0.5 percent from the $30,937 figure in 2009.
• Every four-year public institution in the state saw a decline in average loan debt. The largest decreases were at Potomac State College of WVU (-30.7%) and WVU Institute of Technology. Potomac State College of WVU’s average debt levels should be viewed with caution as the institution has a very small number of bachelor’s degree graduates.
NAT IONAL CONTEXTApproximately 55 percent of public four-year college students graduated with debt each year between 2003-04 and 2012-13. During this time period, the average debt of borrowers increased by 20 percent after adjusting for inflation from $22,900 to $27,300 (College Board, 2014).
From 2004-05 to 2013-14, total grant aid per undergraduate FTE declined at an annual rate of 4.6 percent in inflation-adjusted dollars and total loans increased 1.6 percent per year (College Board, 2014). This has resulted in an increase of total loans used to finance postsecondary education expenses between 2004-05 and 2013-14 from approximately $85.5 billion to $106 billion (College Board, 2014).
ABOUT TH IS MEASUREThis indicator provides the average loan debt that West Virginia public institution undergraduate students have accumulated at any public institution during pursuit of their bachelor’s degrees. This debt includes all loans, including the Direct Parent Loan for Undergraduate Students, whether through the government or from private lenders. Average loan debt is calculated only from students who have loans.
$36,000
$35,000
$34,000
$33,000
$32,000
$31,000
$30,000
$29,00009 10 11 12 13
$35,889
$31,058$30,937
$32,949
$34,071
$40,000
$35,000
$30,000
$25,000
$20,000
$15,000
$10,000
$5,000
$009 10 11 12 13
$35,889
$31,058$30,937 $32,949 $34,071
Average Loan Debt of Graduates
Institution 2009 2010 2011 2012 2013 2012-2013 2009-2013% Change % Change
Bluefield State College $23,050 $25,081 $27,931 $25,001 $23,099 -7.6% 0.2%Concord University $21,596 $22,916 $21,984 $23,621 $21,451 -9.2% -0.7%Fairmont State University $27,356 $27,529 $28,901 $29,150 $26,378 -9.5% -3.6%Glenville State College $26,252 $28,137 $31,734 $32,068 $26,195 -18.3% -0.2%Marshall University $23,718 $25,571 $28,831 $30,640 $25,262 -17.6% 6.5%Potomac State College of WVU $13,221 $15,137 $26,784 $24,975 $17,297 -30.7% 30.8%Shepherd University $28,963 $29,249 $29,107 $32,587 $26,549 -18.5% -8.3%West Liberty University $31,488 $30,417 $31,627 $33,073 $27,667 -16.3% -12.1%West Virginia State University $25,491 $29,255 $27,298 $29,061 $24,159 -16.9% -5.2%West Virginia University $36,967 $39,817 $40,993 $43,691 $38,327 -12.3% 3.7%WVU Institute of Technology $22,488 $23,992 $21,187 $24,783 $18,965 -23.5% -15.7%Total $30,937 $32,949 $34,071 $35,889 $31,085 -13.4% 0.5%
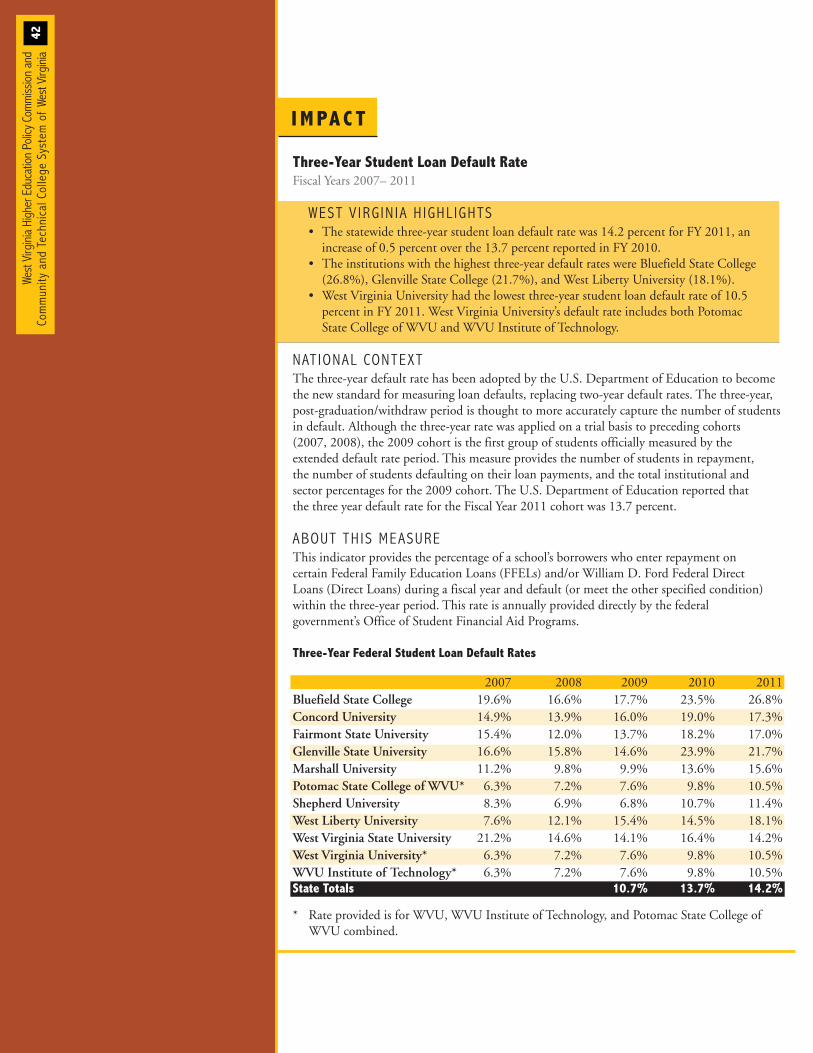
I M PA C T
West Virg
inia Higher Education Po
licy C
ommiss
ion and
Commun
ity and
Tec
hnical College
System of We
st Virg
inia
42
Three-Year Student Loan Default RateFiscal Years 2007– 2011
WEST V IRG IN IA H IGHL IGHTS • The statewide three-year student loan default rate was 14.2 percent for FY 2011, an increase of 0.5 percent over the 13.7 percent reported in FY 2010.
• The institutions with the highest three-year default rates were Bluefield State College (26.8%), Glenville State College (21.7%), and West Liberty University (18.1%).
• West Virginia University had the lowest three-year student loan default rate of 10.5 percent in FY 2011. West Virginia University’s default rate includes both Potomac State College of WVU and WVU Institute of Technology.
NAT IONAL CONTEXTThe three-year default rate has been adopted by the U.S. Department of Education to becomethe new standard for measuring loan defaults, replacing two-year default rates. The three-year,post-graduation/withdraw period is thought to more accurately capture the number of studentsin default. Although the three-year rate was applied on a trial basis to preceding cohorts (2007, 2008), the 2009 cohort is the first group of students officially measured by the extended default rate period. This measure provides the number of students in repayment, the number of students defaulting on their loan payments, and the total institutional and sector percentages for the 2009 cohort. The U.S. Department of Education reported that the three year default rate for the Fiscal Year 2011 cohort was 13.7 percent.
ABOUT TH IS MEASUREThis indicator provides the percentage of a school’s borrowers who enter repayment on certain Federal Family Education Loans (FFELs) and/or William D. Ford Federal Direct Loans (Direct Loans) during a fiscal year and default (or meet the other specified condition)within the three-year period. This rate is annually provided directly by the federal government’s Office of Student Financial Aid Programs.
Three-Year Federal Student Loan Default Rates
2007 2008 2009 2010 2011Bluefield State College 19.6% 16.6% 17.7% 23.5% 26.8%Concord University 14.9% 13.9% 16.0% 19.0% 17.3%Fairmont State University 15.4% 12.0% 13.7% 18.2% 17.0%Glenville State University 16.6% 15.8% 14.6% 23.9% 21.7%Marshall University 11.2% 9.8% 9.9% 13.6% 15.6%Potomac State College of WVU* 6.3% 7.2% 7.6% 9.8% 10.5%Shepherd University 8.3% 6.9% 6.8% 10.7% 11.4%West Liberty University 7.6% 12.1% 15.4% 14.5% 18.1%West Virginia State University 21.2% 14.6% 14.1% 16.4% 14.2%West Virginia University* 6.3% 7.2% 7.6% 9.8% 10.5%WVU Institute of Technology* 6.3% 7.2% 7.6% 9.8% 10.5%State Totals 10.7% 13.7% 14.2%
* Rate provided is for WVU, WVU Institute of Technology, and Potomac State College of WVU combined.
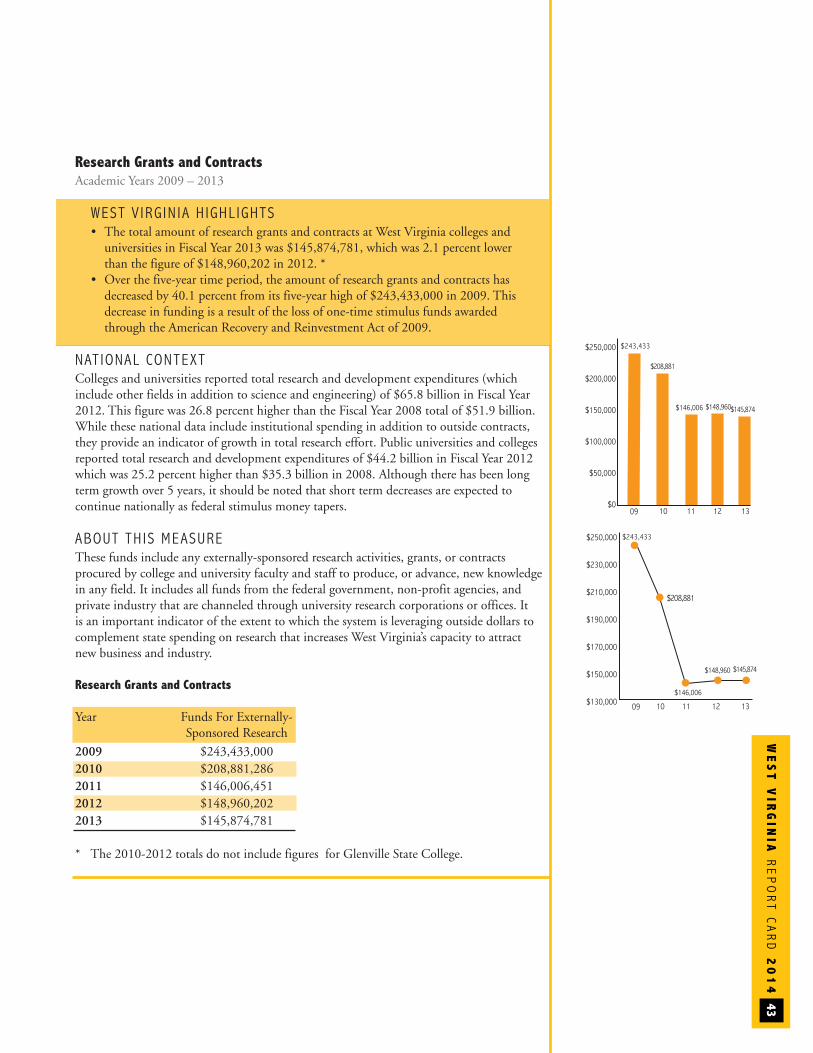
WE
ST
VIR
GIN
IAREPORT C
ARD
20
14
43
Research Grants and ContractsAcademic Years 2009 – 2013
WEST V IRG IN IA H IGHL IGHTS• The total amount of research grants and contracts at West Virginia colleges and universities in Fiscal Year 2013 was $145,874,781, which was 2.1 percent lower than the figure of $148,960,202 in 2012. *
• Over the five-year time period, the amount of research grants and contracts has decreased by 40.1 percent from its five-year high of $243,433,000 in 2009. This decrease in funding is a result of the loss of one-time stimulus funds awarded through the American Recovery and Reinvestment Act of 2009.
NAT IONAL CONTEXTColleges and universities reported total research and development expenditures (which include other fields in addition to science and engineering) of $65.8 billion in Fiscal Year2012. This figure was 26.8 percent higher than the Fiscal Year 2008 total of $51.9 billion.While these national data include institutional spending in addition to outside contracts,they provide an indicator of growth in total research effort. Public universities and collegesreported total research and development expenditures of $44.2 billion in Fiscal Year 2012which was 25.2 percent higher than $35.3 billion in 2008. Although there has been longterm growth over 5 years, it should be noted that short term decreases are expected to continue nationally as federal stimulus money tapers.
ABOUT TH IS MEASUREThese funds include any externally-sponsored research activities, grants, or contracts procured by college and university faculty and staff to produce, or advance, new knowledgein any field. It includes all funds from the federal government, non-profit agencies, and private industry that are channeled through university research corporations or offices. It is an important indicator of the extent to which the system is leveraging outside dollars tocomplement state spending on research that increases West Virginia’s capacity to attractnew business and industry.
Research Grants and Contracts
Year Funds For Externally-Sponsored Research
2009 $243,433,000 2010 $208,881,286 2011 $146,006,451 2012 $148,960,202 2013 $145,874,781
* The 2010-2012 totals do not include figures for Glenville State College.
$250,000
$200,000
$150,000
$100,000
$50,000
$0
$
$145,874
$208,881
$146,006 $148,960
$
$243,433
1
10 11 12 1309
$250,000
$230,000
$210,000
$190,000
$170,000
$150,000
$130,000
$
$208,881
$146,006
$243,433
$
10 11 12 1309
$148,960 $145,874
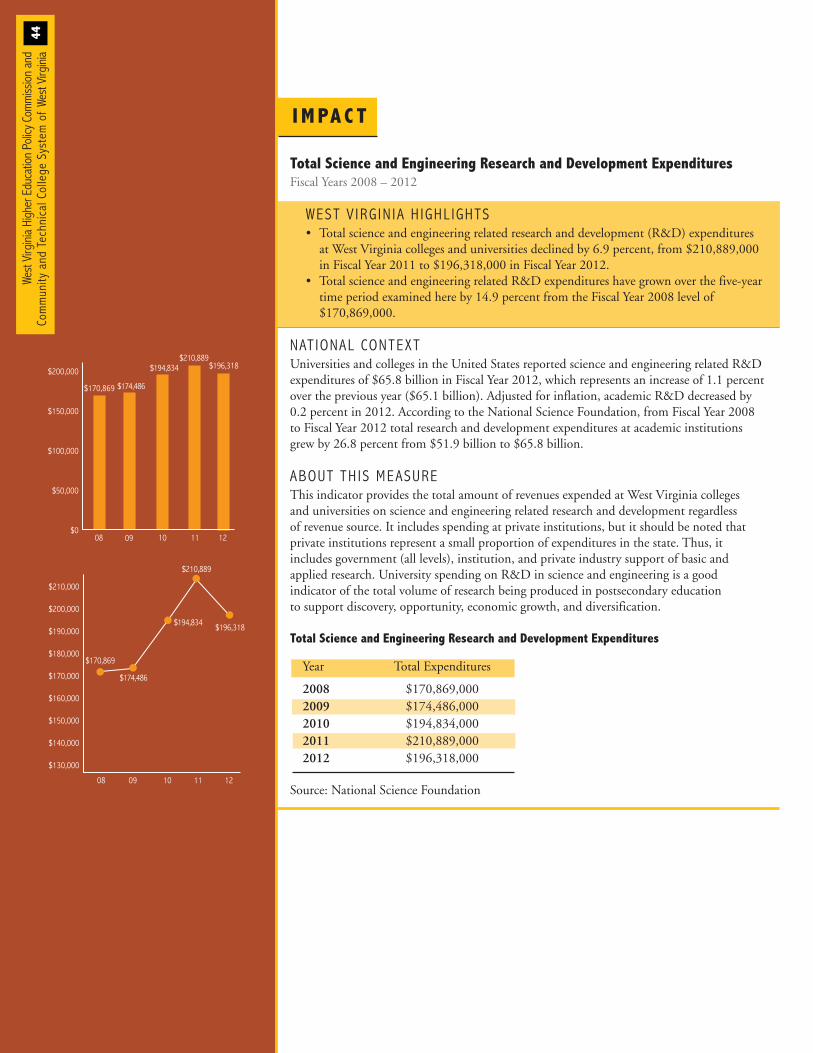
I M PA C T
West Virg
inia Higher Education Po
licy C
ommiss
ion and
Commun
ity and
Tec
hnical College
System of We
st Virg
inia
44
Total Science and Engineering Research and Development ExpendituresFiscal Years 2008 – 2012
WEST V IRG IN IA H IGHL IGHTS• Total science and engineering related research and development (R&D) expenditures at West Virginia colleges and universities declined by 6.9 percent, from $210,889,000 in Fiscal Year 2011 to $196,318,000 in Fiscal Year 2012.
• Total science and engineering related R&D expenditures have grown over the five-year time period examined here by 14.9 percent from the Fiscal Year 2008 level of $170,869,000.
NAT IONAL CONTEXTUniversities and colleges in the United States reported science and engineering related R&Dexpenditures of $65.8 billion in Fiscal Year 2012, which represents an increase of 1.1 percentover the previous year ($65.1 billion). Adjusted for inflation, academic R&D decreased by 0.2 percent in 2012. According to the National Science Foundation, from Fiscal Year 2008 to Fiscal Year 2012 total research and development expenditures at academic institutions grew by 26.8 percent from $51.9 billion to $65.8 billion.
ABOUT TH IS MEASUREThis indicator provides the total amount of revenues expended at West Virginia colleges and universities on science and engineering related research and development regardless of revenue source. It includes spending at private institutions, but it should be noted that private institutions represent a small proportion of expenditures in the state. Thus, it includes government (all levels), institution, and private industry support of basic and applied research. University spending on R&D in science and engineering is a good indicator of the total volume of research being produced in postsecondary education to support discovery, opportunity, economic growth, and diversification.
Total Science and Engineering Research and Development Expenditures
Year Total Expenditures
2008 $170,869,000 2009 $174,486,000 2010 $194,834,000 2011 $210,889,0002012 $196,318,000
Source: National Science Foundation
$200,000
$150,000
$100,000
$50,000
$0
$170,869 $174,486
$194,834$210,889
$
10 11 1208 09
$196,318
$210,000
$200,000
$190,000
$180,000
$170,000
$160,000
$150,000
$140,000
$130,000
$194,834
$210,889
$196,318
$170,869
$174,486
1
10 11 1208 09
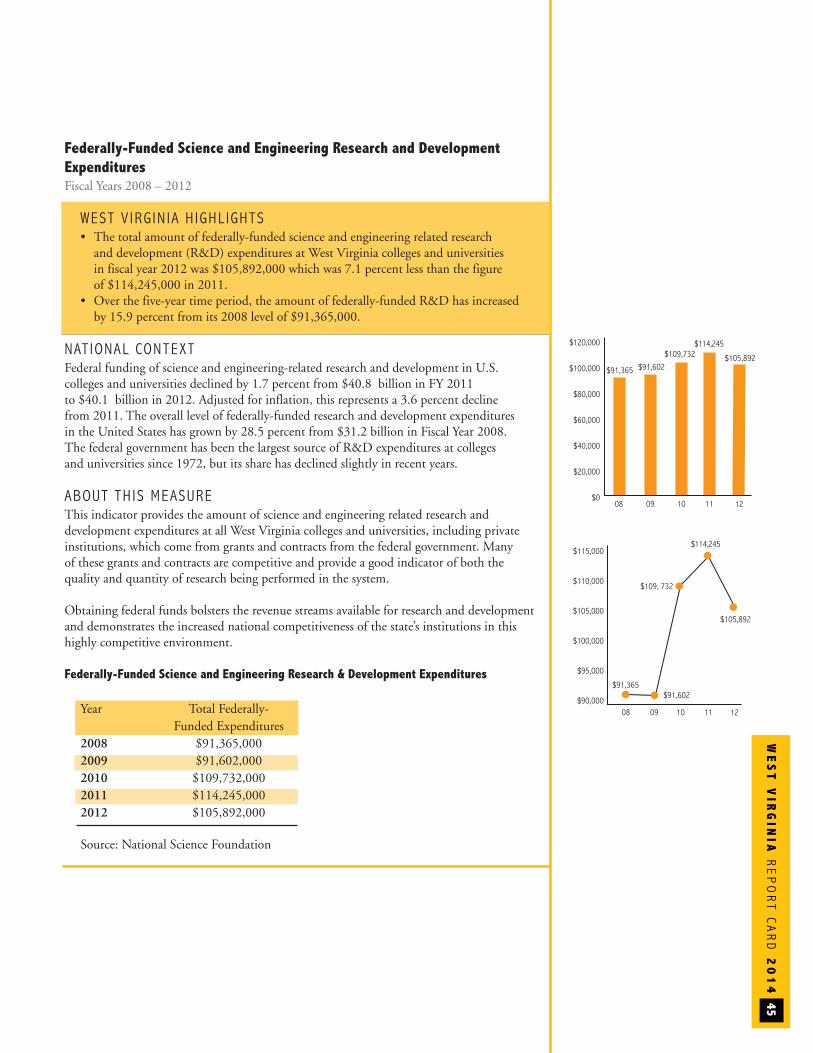
WE
ST
VIR
GIN
IAREPORT C
ARD
20
14
45
Federally-Funded Science and Engineering Research and Development ExpendituresFiscal Years 2008 – 2012
WEST V IRG IN IA H IGHL IGHTS• The total amount of federally-funded science and engineering related research and development (R&D) expenditures at West Virginia colleges and universities in fiscal year 2012 was $105,892,000 which was 7.1 percent less than the figure of $114,245,000 in 2011.
• Over the five-year time period, the amount of federally-funded R&D has increased by 15.9 percent from its 2008 level of $91,365,000.
NAT IONAL CONTEXTFederal funding of science and engineering-related research and development in U.S. colleges and universities declined by 1.7 percent from $40.8 billion in FY 2011 to $40.1 billion in 2012. Adjusted for inflation, this represents a 3.6 percent decline from 2011. The overall level of federally-funded research and development expenditures in the United States has grown by 28.5 percent from $31.2 billion in Fiscal Year 2008. The federal government has been the largest source of R&D expenditures at colleges and universities since 1972, but its share has declined slightly in recent years.
ABOUT TH IS MEASUREThis indicator provides the amount of science and engineering related research and development expenditures at all West Virginia colleges and universities, including privateinstitutions, which come from grants and contracts from the federal government. Many of these grants and contracts are competitive and provide a good indicator of both the quality and quantity of research being performed in the system.
Obtaining federal funds bolsters the revenue streams available for research and developmentand demonstrates the increased national competitiveness of the state’s institutions in thishighly competitive environment.
Federally-Funded Science and Engineering Research & Development Expenditures
Year Total Federally-Funded Expenditures
2008 $91,365,000 2009 $91,602,000 2010 $109,732,0002011 $114,245,0002012 $105,892,000
Source: National Science Foundation
$120,000
$100,000
$80,000
$60,000
$40,000
$20,000
$008 09 10 11 12
$
$91,365
$109,732$114,245
$105,892
$
$91,602
0
$115,000
$110,000
$105,000
$100,000
$95,000
$90,000$91,602
$109, 732
$114,245
$105,892
$91,365
$
08 09 10 11 12
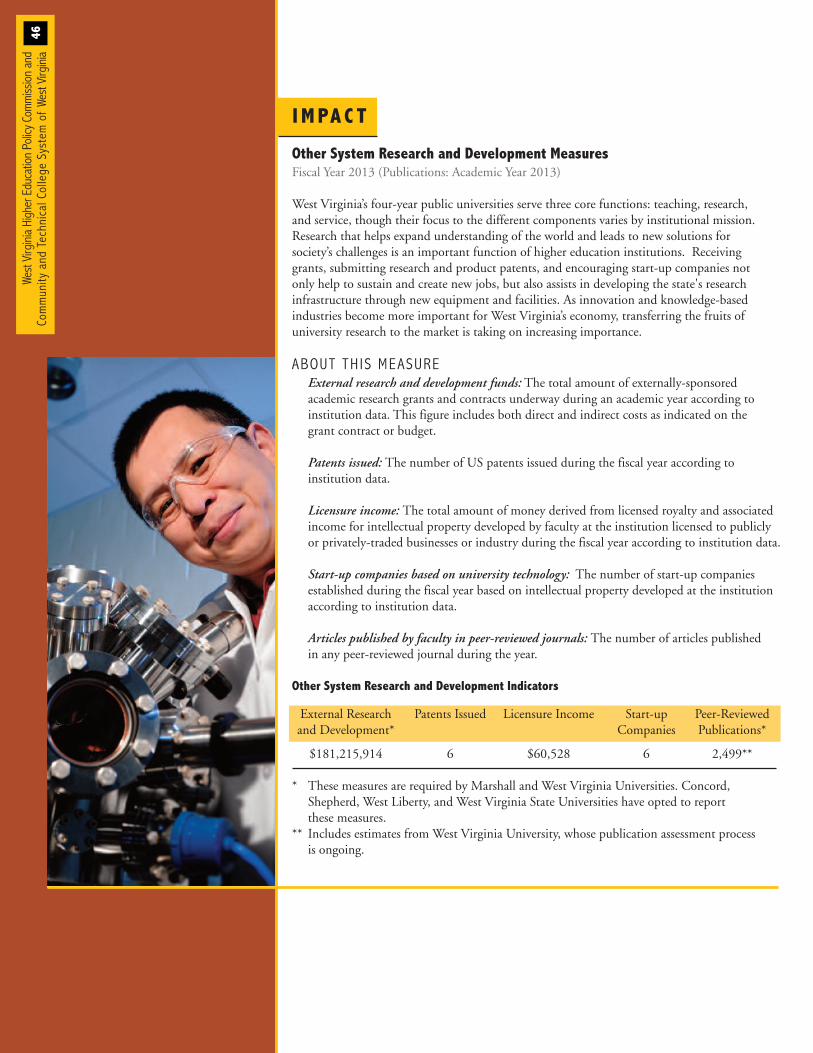
I M PA C T
West Virg
inia Higher Education Po
licy C
ommiss
ion and
Commun
ity and
Tec
hnical College
System of We
st Virg
inia
46
Other System Research and Development MeasuresFiscal Year 2013 (Publications: Academic Year 2013)
West Virginia’s four-year public universities serve three core functions: teaching, research, and service, though their focus to the different components varies by institutional mission. Research that helps expand understanding of the world and leads to new solutions for society’s challenges is an important function of higher education institutions. Receiving grants, submitting research and product patents, and encouraging start-up companies not only help to sustain and create new jobs, but also assists in developing the state's research infrastructure through new equipment and facilities. As innovation and knowledge-based industries become more important for West Virginia’s economy, transferring the fruits of university research to the market is taking on increasing importance.
ABOUT TH IS MEASUREExternal research and development funds: The total amount of externally-sponsored academic research grants and contracts underway during an academic year according to institution data. This figure includes both direct and indirect costs as indicated on the grant contract or budget.
Patents issued: The number of US patents issued during the fiscal year according to institution data.
Licensure income: The total amount of money derived from licensed royalty and associated income for intellectual property developed by faculty at the institution licensed to publicly or privately-traded businesses or industry during the fiscal year according to institution data.
Start-up companies based on university technology: The number of start-up companies established during the fiscal year based on intellectual property developed at the institution according to institution data.
Articles published by faculty in peer-reviewed journals: The number of articles published in any peer-reviewed journal during the year.
Other System Research and Development Indicators
External Research Patents Issued Licensure Income Start-up Peer-Reviewed and Development* Companies Publications*
$181,215,914 6 $60,528 6 2,499**
* These measures are required by Marshall and West Virginia Universities. Concord, Shepherd, West Liberty, and West Virginia State Universities have opted to report these measures.
** Includes estimates from West Virginia University, whose publication assessment process is ongoing.
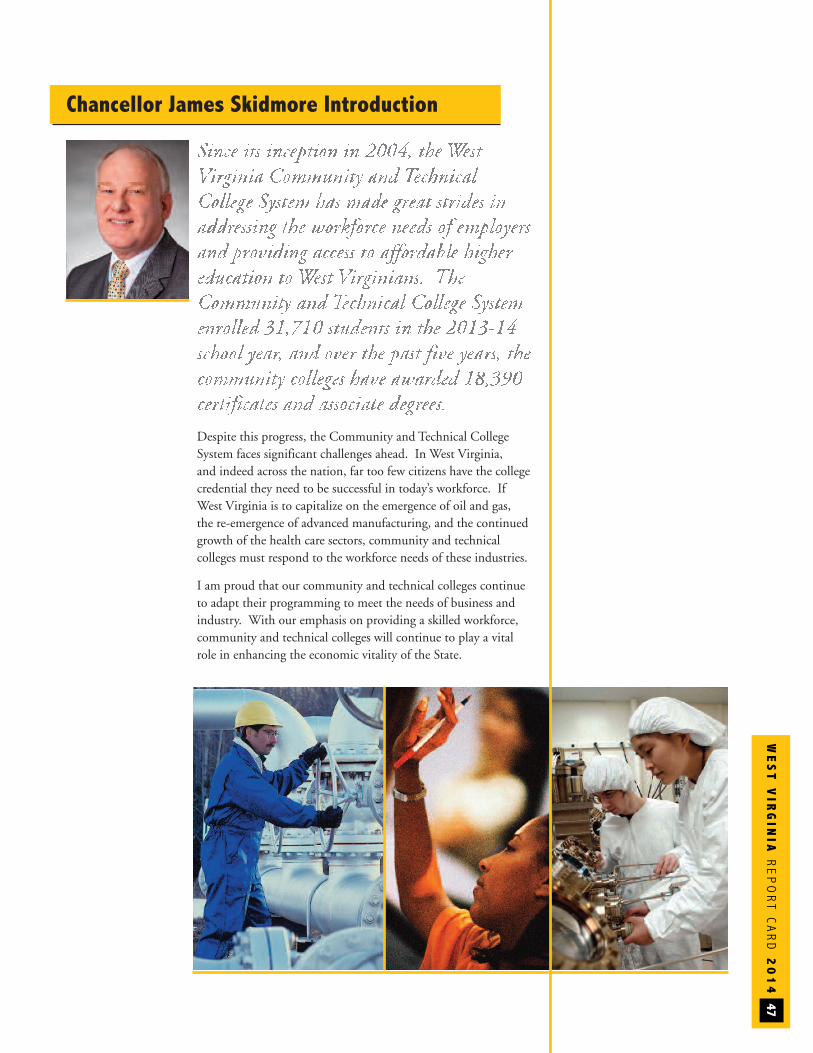
WE
ST
VIR
GIN
IAREPORT C
ARD
20
14
47
Chancellor James Skidmore Introduction
Despite this progress, the Community and Technical CollegeSystem faces significant challenges ahead. In West Virginia, and indeed across the nation, far too few citizens have the collegecredential they need to be successful in today’s workforce. IfWest Virginia is to capitalize on the emergence of oil and gas, the re-emergence of advanced manufacturing, and the continuedgrowth of the health care sectors, community and technical colleges must respond to the workforce needs of these industries.
I am proud that our community and technical colleges continueto adapt their programming to meet the needs of business andindustry. With our emphasis on providing a skilled workforce,community and technical colleges will continue to play a vitalrole in enhancing the economic vitality of the State.
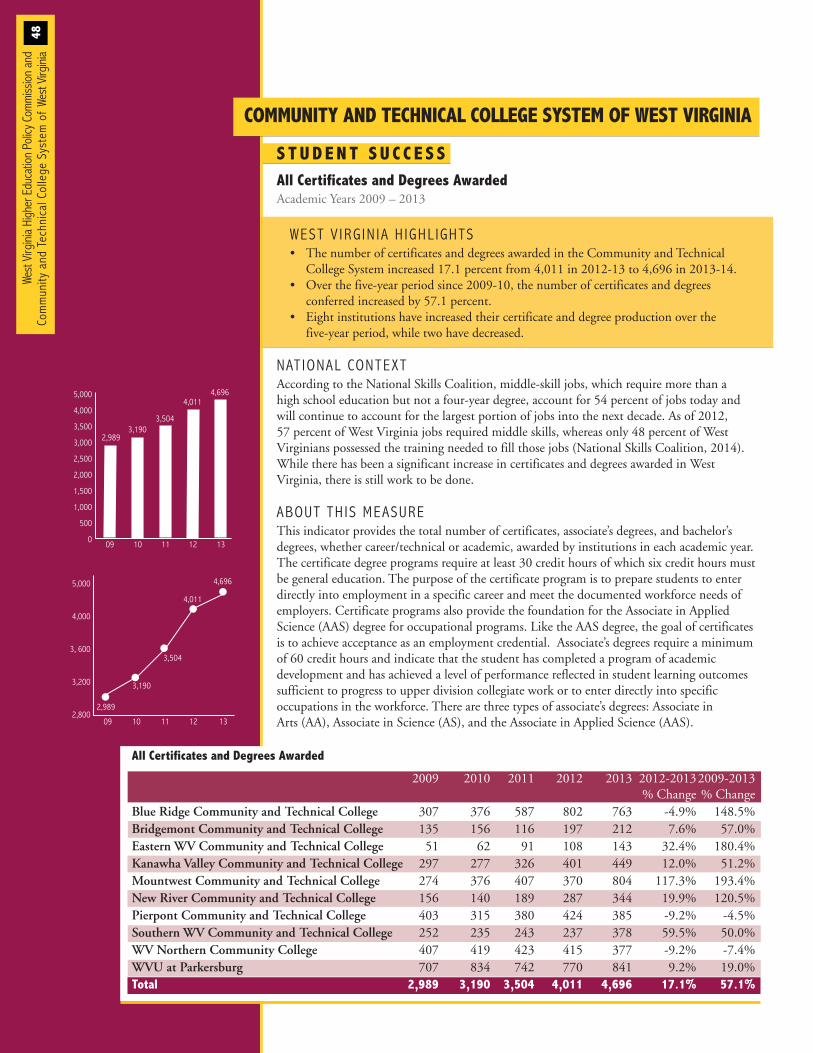
48
COMMUNITY AND TECHNICAL COLLEGE SYSTEM OF WEST VIRGINIA
S TUD EN T S U C C E S SAll Certificates and Degrees AwardedAcademic Years 2009 – 2013
WEST V IRG IN IA H IGHL IGHTS• The number of certificates and degrees awarded in the Community and Technical College System increased 17.1 percent from 4,011 in 2012-13 to 4,696 in 2013-14.
• Over the five-year period since 2009-10, the number of certificates and degrees conferred increased by 57.1 percent.
• Eight institutions have increased their certificate and degree production over the five-year period, while two have decreased.
NAT IONAL CONTEXTAccording to the National Skills Coalition, middle-skill jobs, which require more than a high school education but not a four-year degree, account for 54 percent of jobs today andwill continue to account for the largest portion of jobs into the next decade. As of 2012, 57 percent of West Virginia jobs required middle skills, whereas only 48 percent of West Virginians possessed the training needed to fill those jobs (National Skills Coalition, 2014).While there has been a significant increase in certificates and degrees awarded in West Virginia, there is still work to be done.
ABOUT TH IS MEASUREThis indicator provides the total number of certificates, associate’s degrees, and bachelor’s degrees, whether career/technical or academic, awarded by institutions in each academic year.The certificate degree programs require at least 30 credit hours of which six credit hours mustbe general education. The purpose of the certificate program is to prepare students to enter directly into employment in a specific career and meet the documented workforce needs ofemployers. Certificate programs also provide the foundation for the Associate in Applied Science (AAS) degree for occupational programs. Like the AAS degree, the goal of certificatesis to achieve acceptance as an employment credential. Associate’s degrees require a minimumof 60 credit hours and indicate that the student has completed a program of academic development and has achieved a level of performance reflected in student learning outcomessufficient to progress to upper division collegiate work or to enter directly into specific occupations in the workforce. There are three types of associate’s degrees: Associate in Arts (AA), Associate in Science (AS), and the Associate in Applied Science (AAS).
5,000
4,000
3, 600
3,200
2,80009 10 11 12 13
0
2,989
3,190
3,504
4,011
4,696
4,696
2,9893,190
3,504
4,0115,000
4,000
3,500
3,000
2,500
2,000
1,500
1,000
500
0
09 10 11 12 13
2
All Certificates and Degrees Awarded
2009 2010 2011 2012 2013 2012-20132009-2013% Change % Change
Blue Ridge Community and Technical College 307 376 587 802 763 -4.9% 148.5%Bridgemont Community and Technical College 135 156 116 197 212 7.6% 57.0%Eastern WV Community and Technical College 51 62 91 108 143 32.4% 180.4%Kanawha Valley Community and Technical College 297 277 326 401 449 12.0% 51.2%Mountwest Community and Technical College 274 376 407 370 804 117.3% 193.4%New River Community and Technical College 156 140 189 287 344 19.9% 120.5%Pierpont Community and Technical College 403 315 380 424 385 -9.2% -4.5%Southern WV Community and Technical College 252 235 243 237 378 59.5% 50.0%WV Northern Community College 407 419 423 415 377 -9.2% -7.4%WVU at Parkersburg 707 834 742 770 841 9.2% 19.0%Total 2,989 3,190 3,504 4,011 4,696 17.1% 57.1%
West Virg
inia Higher Education Po
licy C
ommiss
ion and
Commun
ity and
Tec
hnical College
System of We
st Virg
inia
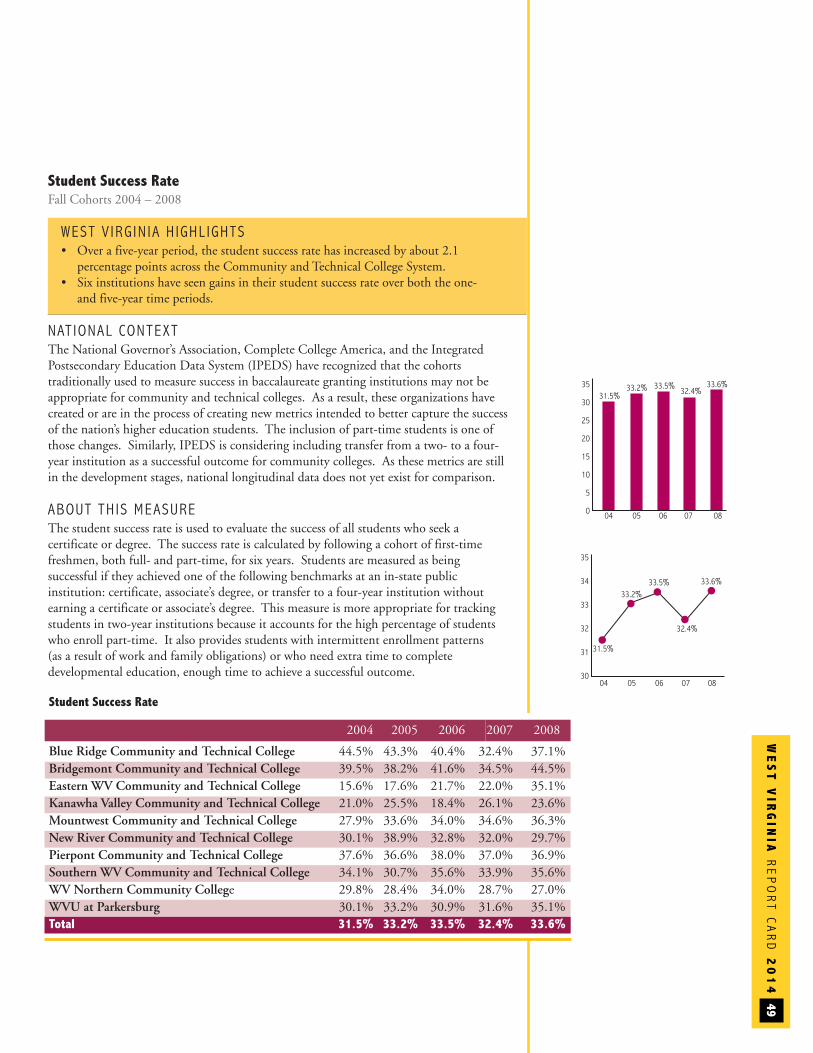
WE
ST
VIR
GIN
IAREPORT C
ARD
20
14
49
Student Success RateFall Cohorts 2004 – 2008
WEST V IRG IN IA H IGHL IGHTS• Over a five-year period, the student success rate has increased by about 2.1 percentage points across the Community and Technical College System.
• Six institutions have seen gains in their student success rate over both the one-and five-year time periods.
NAT IONAL CONTEXTThe National Governor’s Association, Complete College America, and the IntegratedPostsecondary Education Data System (IPEDS) have recognized that the cohorts traditionally used to measure success in baccalaureate granting institutions may not be appropriate for community and technical colleges. As a result, these organizations havecreated or are in the process of creating new metrics intended to better capture the successof the nation’s higher education students. The inclusion of part-time students is one ofthose changes. Similarly, IPEDS is considering including transfer from a two- to a four-year institution as a successful outcome for community colleges. As these metrics are stillin the development stages, national longitudinal data does not yet exist for comparison.
ABOUT TH IS MEASUREThe student success rate is used to evaluate the success of all students who seek a certificate or degree. The success rate is calculated by following a cohort of first-timefreshmen, both full- and part-time, for six years. Students are measured as being successful if they achieved one of the following benchmarks at an in-state public institution: certificate, associate’s degree, or transfer to a four-year institution withoutearning a certificate or associate’s degree. This measure is more appropriate for trackingstudents in two-year institutions because it accounts for the high percentage of studentswho enroll part-time. It also provides students with intermittent enrollment patterns (as a result of work and family obligations) or who need extra time to complete developmental education, enough time to achieve a successful outcome.
31.5%
33.2%33.5% 33.6%
04 05 06 07 08
35
34
33
32
31
30
32.4%
31.5%33.2% 33.5%
32.4%33.6%
04 05 06 07 08
3
35
30
25
20
15
10
5
0
Student Success Rate
2004 2005 2006 2007 2008
Blue Ridge Community and Technical College 44.5% 43.3% 40.4% 32.4% 37.1%Bridgemont Community and Technical College 39.5% 38.2% 41.6% 34.5% 44.5%Eastern WV Community and Technical College 15.6% 17.6% 21.7% 22.0% 35.1%Kanawha Valley Community and Technical College 21.0% 25.5% 18.4% 26.1% 23.6%Mountwest Community and Technical College 27.9% 33.6% 34.0% 34.6% 36.3%New River Community and Technical College 30.1% 38.9% 32.8% 32.0% 29.7%Pierpont Community and Technical College 37.6% 36.6% 38.0% 37.0% 36.9%Southern WV Community and Technical College 34.1% 30.7% 35.6% 33.9% 35.6%WV Northern Community College 29.8% 28.4% 34.0% 28.7% 27.0%WVU at Parkersburg 30.1% 33.2% 30.9% 31.6% 35.1%Total 31.5% 33.2% 33.5% 32.4% 33.6%
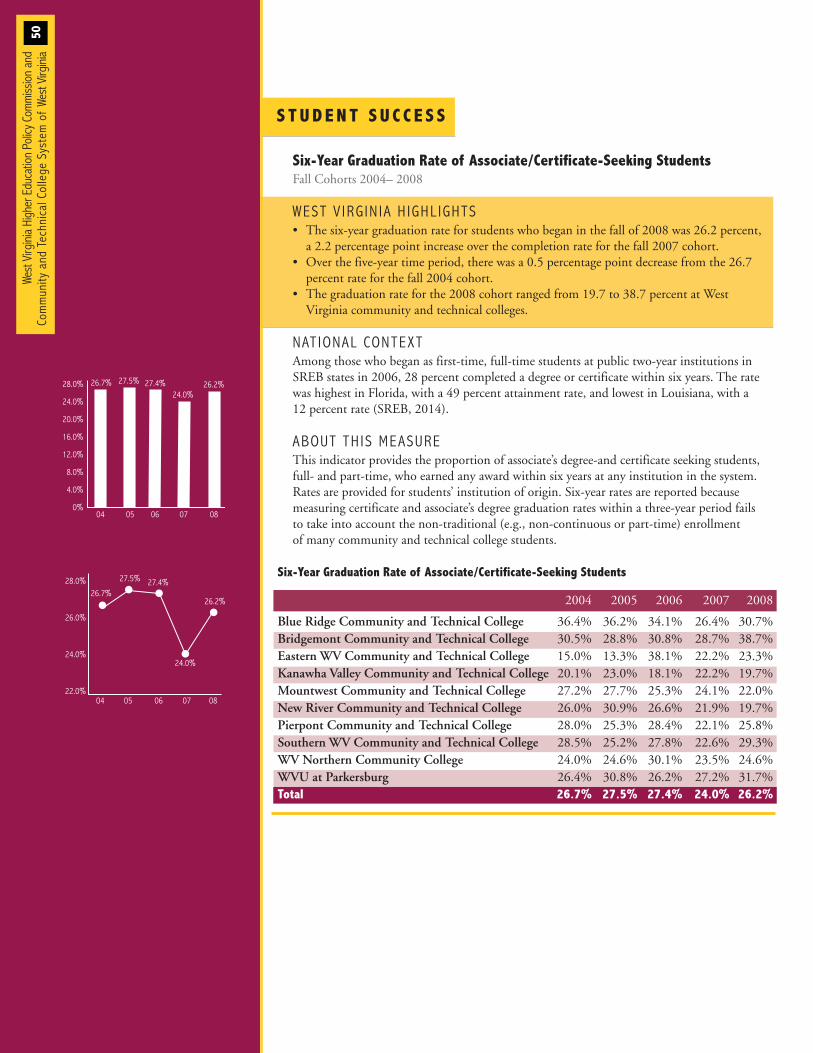
S T UD EN T S U C C E S S
West Virg
inia Higher Education Po
licy C
ommiss
ion and
Commun
ity and
Tec
hnical College
System of We
st Virg
inia
50
Six-Year Graduation Rate of Associate/Certificate-Seeking StudentsFall Cohorts 2004– 2008
WEST V IRG IN IA H IGHL IGHTS• The six-year graduation rate for students who began in the fall of 2008 was 26.2 percent, a 2.2 percentage point increase over the completion rate for the fall 2007 cohort.
• Over the five-year time period, there was a 0.5 percentage point decrease from the 26.7 percent rate for the fall 2004 cohort.
• The graduation rate for the 2008 cohort ranged from 19.7 to 38.7 percent at West Virginia community and technical colleges.
NAT IONAL CONTEXTAmong those who began as first-time, full-time students at public two-year institutions inSREB states in 2006, 28 percent completed a degree or certificate within six years. The ratewas highest in Florida, with a 49 percent attainment rate, and lowest in Louisiana, with a 12 percent rate (SREB, 2014).
ABOUT TH IS MEASUREThis indicator provides the proportion of associate’s degree-and certificate seeking students,full- and part-time, who earned any award within six years at any institution in the system.Rates are provided for students’ institution of origin. Six-year rates are reported becausemeasuring certificate and associate’s degree graduation rates within a three-year period failsto take into account the non-traditional (e.g., non-continuous or part-time) enrollment of many community and technical college students.
04 05 06 07 08
26.2%26.7%
27.4%27.5%28.0%
26.0%
24.0%
22.0%
24.0%
04 05 06 07 08
0
26.2%27.4%27.5%
24.0%26.7%28.0%
24.0%
20.0%
16.0%
12.0%
8.0%
4.0%
0%
Six-Year Graduation Rate of Associate/Certificate-Seeking Students
2004 2005 2006 2007 2008
Blue Ridge Community and Technical College 36.4% 36.2% 34.1% 26.4% 30.7%Bridgemont Community and Technical College 30.5% 28.8% 30.8% 28.7% 38.7%Eastern WV Community and Technical College 15.0% 13.3% 38.1% 22.2% 23.3%Kanawha Valley Community and Technical College 20.1% 23.0% 18.1% 22.2% 19.7%Mountwest Community and Technical College 27.2% 27.7% 25.3% 24.1% 22.0%New River Community and Technical College 26.0% 30.9% 26.6% 21.9% 19.7%Pierpont Community and Technical College 28.0% 25.3% 28.4% 22.1% 25.8%Southern WV Community and Technical College 28.5% 25.2% 27.8% 22.6% 29.3%WV Northern Community College 24.0% 24.6% 30.1% 23.5% 24.6%WVU at Parkersburg 26.4% 30.8% 26.2% 27.2% 31.7%Total 26.7% 27.5% 27.4% 24.0% 26.2%
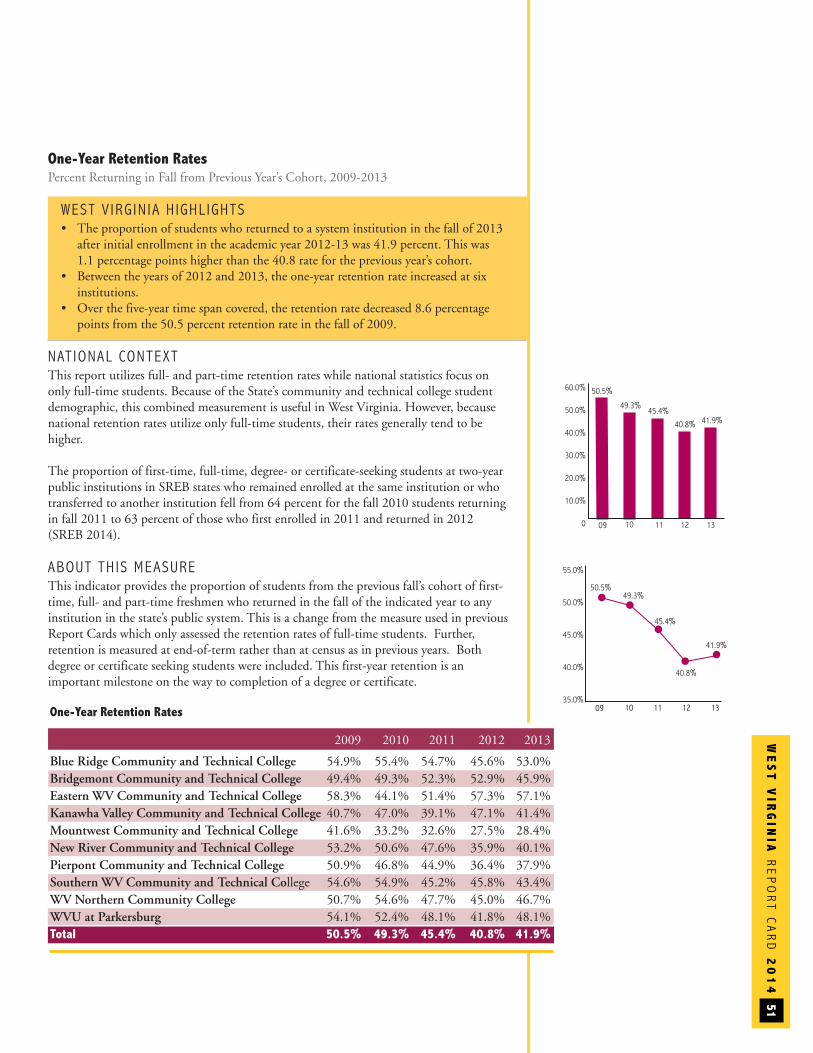
51
60.0%
50.0%
40.0%
30.0%
20.0%
10.0%
0 10 11 12 1309
41.9%
50.5%
49.3%45.4%
40.8%
55.0%
50.0%
45.0%
40.0%
35.0%
41.9%
50.5%49.3%
45.4%
40.8%
1
10 11 12 1309
One-Year Retention RatesPercent Returning in Fall from Previous Year’s Cohort, 2009-2013
WEST V IRG IN IA H IGHL IGHTS• The proportion of students who returned to a system institution in the fall of 2013 after initial enrollment in the academic year 2012-13 was 41.9 percent. This was 1.1 percentage points higher than the 40.8 rate for the previous year’s cohort.
• Between the years of 2012 and 2013, the one-year retention rate increased at six institutions.
• Over the five-year time span covered, the retention rate decreased 8.6 percentage points from the 50.5 percent retention rate in the fall of 2009.
NAT IONAL CONTEXT This report utilizes full- and part-time retention rates while national statistics focus ononly full-time students. Because of the State’s community and technical college studentdemographic, this combined measurement is useful in West Virginia. However, becausenational retention rates utilize only full-time students, their rates generally tend to behigher.
The proportion of first-time, full-time, degree- or certificate-seeking students at two-yearpublic institutions in SREB states who remained enrolled at the same institution or whotransferred to another institution fell from 64 percent for the fall 2010 students returningin fall 2011 to 63 percent of those who first enrolled in 2011 and returned in 2012(SREB 2014).
ABOUT TH IS MEASUREThis indicator provides the proportion of students from the previous fall’s cohort of first-time, full- and part-time freshmen who returned in the fall of the indicated year to anyinstitution in the state’s public system. This is a change from the measure used in previousReport Cards which only assessed the retention rates of full-time students. Further, retention is measured at end-of-term rather than at census as in previous years. Both degree or certificate seeking students were included. This first-year retention is an important milestone on the way to completion of a degree or certificate.
One-Year Retention Rates
2009 2010 2011 2012 2013
Blue Ridge Community and Technical College 54.9% 55.4% 54.7% 45.6% 53.0%Bridgemont Community and Technical College 49.4% 49.3% 52.3% 52.9% 45.9%Eastern WV Community and Technical College 58.3% 44.1% 51.4% 57.3% 57.1%Kanawha Valley Community and Technical College 40.7% 47.0% 39.1% 47.1% 41.4%Mountwest Community and Technical College 41.6% 33.2% 32.6% 27.5% 28.4%New River Community and Technical College 53.2% 50.6% 47.6% 35.9% 40.1%Pierpont Community and Technical College 50.9% 46.8% 44.9% 36.4% 37.9%Southern WV Community and Technical College 54.6% 54.9% 45.2% 45.8% 43.4%WV Northern Community College 50.7% 54.6% 47.7% 45.0% 46.7%WVU at Parkersburg 54.1% 52.4% 48.1% 41.8% 48.1%Total 50.5% 49.3% 45.4% 40.8% 41.9%
WE
ST
VIR
GIN
IAREPORT C
ARD
20
14
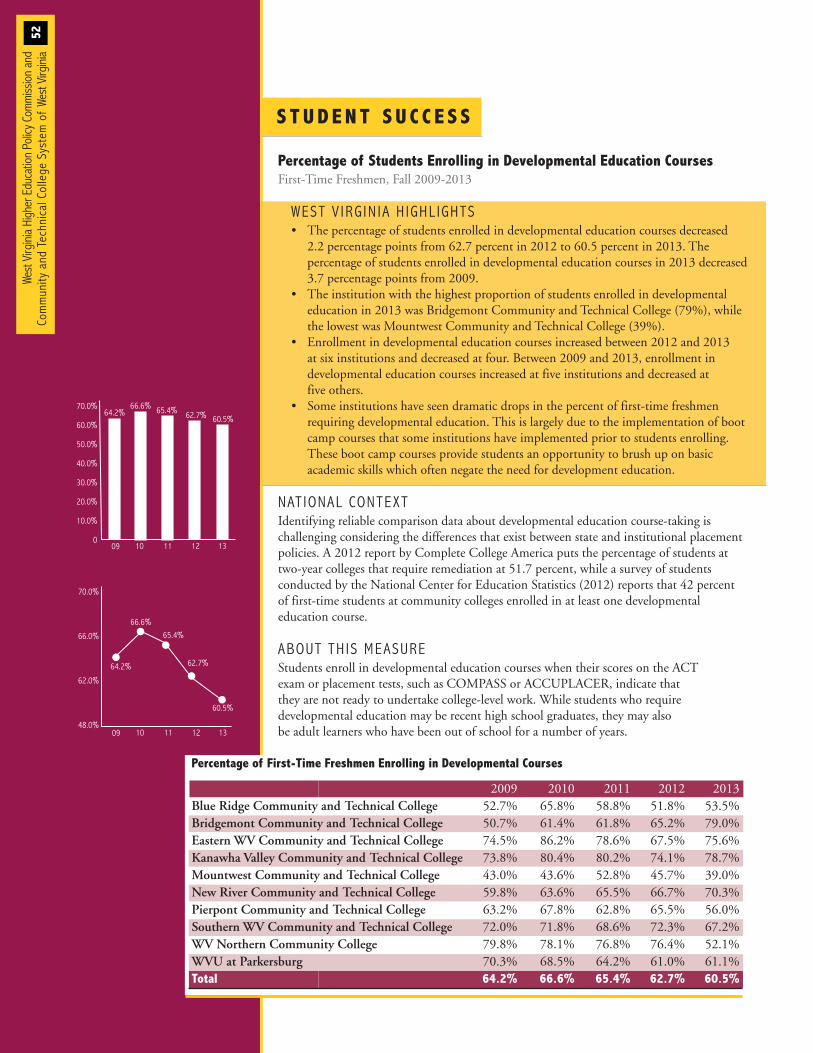
S T UD EN T S U C C E S S
West Virg
inia Higher Education Po
licy C
ommiss
ion and
Commun
ity and
Tec
hnical College
System of We
st Virg
inia
52
Percentage of Students Enrolling in Developmental Education CoursesFirst-Time Freshmen, Fall 2009-2013
WEST V IRG IN IA H IGHL IGHTS• The percentage of students enrolled in developmental education courses decreased 2.2 percentage points from 62.7 percent in 2012 to 60.5 percent in 2013. The percentage of students enrolled in developmental education courses in 2013 decreased 3.7 percentage points from 2009.
• The institution with the highest proportion of students enrolled in developmental education in 2013 was Bridgemont Community and Technical College (79%), while the lowest was Mountwest Community and Technical College (39%).
• Enrollment in developmental education courses increased between 2012 and 2013 at six institutions and decreased at four. Between 2009 and 2013, enrollment in developmental education courses increased at five institutions and decreased at five others.
• Some institutions have seen dramatic drops in the percent of first-time freshmen requiring developmental education. This is largely due to the implementation of boot camp courses that some institutions have implemented prior to students enrolling. These boot camp courses provide students an opportunity to brush up on basic academic skills which often negate the need for development education.
NAT IONAL CONTEXTIdentifying reliable comparison data about developmental education course-taking is challenging considering the differences that exist between state and institutional placementpolicies. A 2012 report by Complete College America puts the percentage of students attwo-year colleges that require remediation at 51.7 percent, while a survey of students conducted by the National Center for Education Statistics (2012) reports that 42 percent of first-time students at community colleges enrolled in at least one developmental education course.
ABOUT TH IS MEASUREStudents enroll in developmental education courses when their scores on the ACT exam or placement tests, such as COMPASS or ACCUPLACER, indicate that they are not ready to undertake college-level work. While students who require developmental education may be recent high school graduates, they may also be adult learners who have been out of school for a number of years.
70.0%
60.0%
50.0%
40.0%
30.0%
20.0%
10.0%
010 11 12 1309
60.5%64.2%
66.6% 65.4% 62.7%
6
70.0%
66.0%
62.0%
48.0%
60.5%
64.2%
66.6%65.4%
62.7%
10 11 12 1309
Percentage of First-Time Freshmen Enrolling in Developmental Courses
2009 2010 2011 2012 2013Blue Ridge Community and Technical College 52.7% 65.8% 58.8% 51.8% 53.5%Bridgemont Community and Technical College 50.7% 61.4% 61.8% 65.2% 79.0%Eastern WV Community and Technical College 74.5% 86.2% 78.6% 67.5% 75.6%Kanawha Valley Community and Technical College 73.8% 80.4% 80.2% 74.1% 78.7%Mountwest Community and Technical College 43.0% 43.6% 52.8% 45.7% 39.0%New River Community and Technical College 59.8% 63.6% 65.5% 66.7% 70.3%Pierpont Community and Technical College 63.2% 67.8% 62.8% 65.5% 56.0%Southern WV Community and Technical College 72.0% 71.8% 68.6% 72.3% 67.2%WV Northern Community College 79.8% 78.1% 76.8% 76.4% 52.1%WVU at Parkersburg 70.3% 68.5% 64.2% 61.0% 61.1%Total 64.2% 66.6% 65.4% 62.7% 60.5%
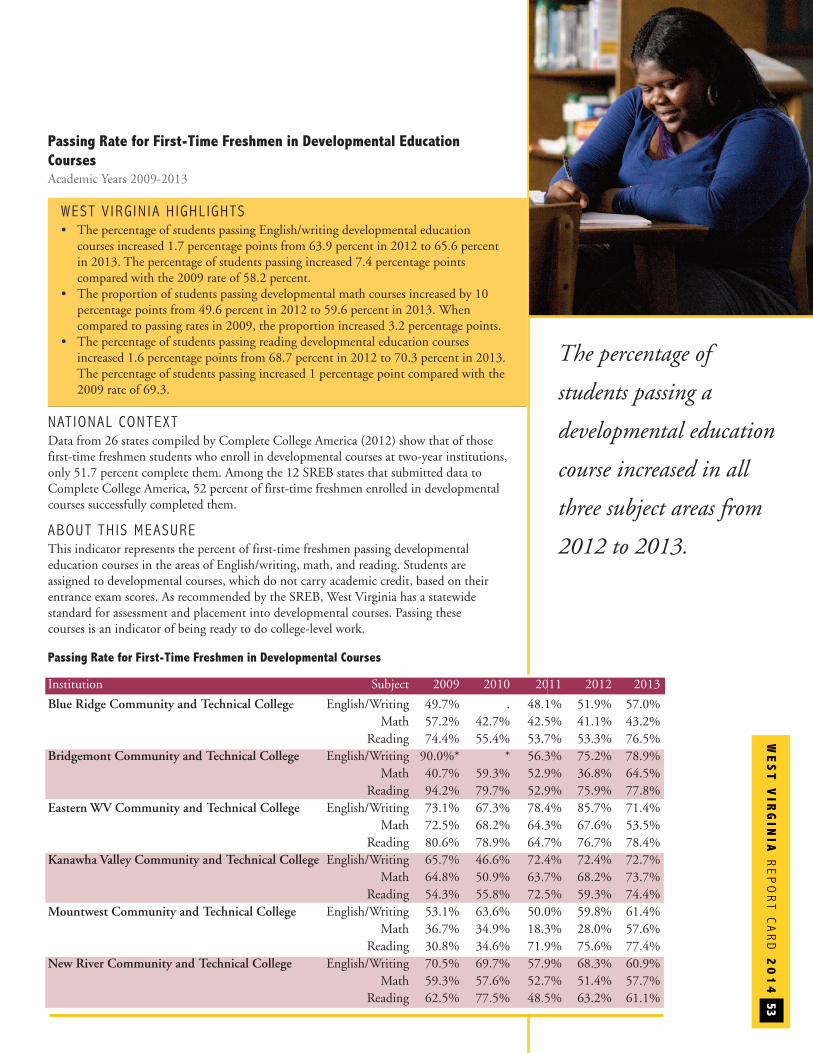
WE
ST
VIR
GIN
IAREPORT C
ARD
20
14
53
Passing Rate for First-Time Freshmen in Developmental EducationCoursesAcademic Years 2009-2013
WEST V IRG IN IA H IGHL IGHTS• The percentage of students passing English/writing developmental education courses increased 1.7 percentage points from 63.9 percent in 2012 to 65.6 percent in 2013. The percentage of students passing increased 7.4 percentage points compared with the 2009 rate of 58.2 percent.
• The proportion of students passing developmental math courses increased by 10 percentage points from 49.6 percent in 2012 to 59.6 percent in 2013. When compared to passing rates in 2009, the proportion increased 3.2 percentage points.
• The percentage of students passing reading developmental education courses increased 1.6 percentage points from 68.7 percent in 2012 to 70.3 percent in 2013.The percentage of students passing increased 1 percentage point compared with the 2009 rate of 69.3.
NAT IONAL CONTEXT Data from 26 states compiled by Complete College America (2012) show that of thosefirst-time freshmen students who enroll in developmental courses at two-year institutions,only 51.7 percent complete them. Among the 12 SREB states that submitted data toComplete College America, 52 percent of first-time freshmen enrolled in developmentalcourses successfully completed them.
ABOUT TH IS MEASUREThis indicator represents the percent of first-time freshmen passing developmental education courses in the areas of English/writing, math, and reading. Students are assigned to developmental courses, which do not carry academic credit, based on their entrance exam scores. As recommended by the SREB, West Virginia has a statewide standard for assessment and placement into developmental courses. Passing these courses is an indicator of being ready to do college-level work.
Passing Rate for First-Time Freshmen in Developmental Courses
Institution Subject 2009 2010 2011 2012 2013
Blue Ridge Community and Technical College English/Writing 49.7% . 48.1% 51.9% 57.0%Math 57.2% 42.7% 42.5% 41.1% 43.2%
Reading 74.4% 55.4% 53.7% 53.3% 76.5%Bridgemont Community and Technical College English/Writing 90.0%* * 56.3% 75.2% 78.9%
Math 40.7% 59.3% 52.9% 36.8% 64.5%Reading 94.2% 79.7% 52.9% 75.9% 77.8%
Eastern WV Community and Technical College English/Writing 73.1% 67.3% 78.4% 85.7% 71.4%Math 72.5% 68.2% 64.3% 67.6% 53.5%
Reading 80.6% 78.9% 64.7% 76.7% 78.4%Kanawha Valley Community and Technical College English/Writing 65.7% 46.6% 72.4% 72.4% 72.7%
Math 64.8% 50.9% 63.7% 68.2% 73.7%Reading 54.3% 55.8% 72.5% 59.3% 74.4%
Mountwest Community and Technical College English/Writing 53.1% 63.6% 50.0% 59.8% 61.4%Math 36.7% 34.9% 18.3% 28.0% 57.6%
Reading 30.8% 34.6% 71.9% 75.6% 77.4%New River Community and Technical College English/Writing 70.5% 69.7% 57.9% 68.3% 60.9%
Math 59.3% 57.6% 52.7% 51.4% 57.7%Reading 62.5% 77.5% 48.5% 63.2% 61.1%
The percentage of
students passing a
developmental education
course increased in all
three subject areas from
2012 to 2013.
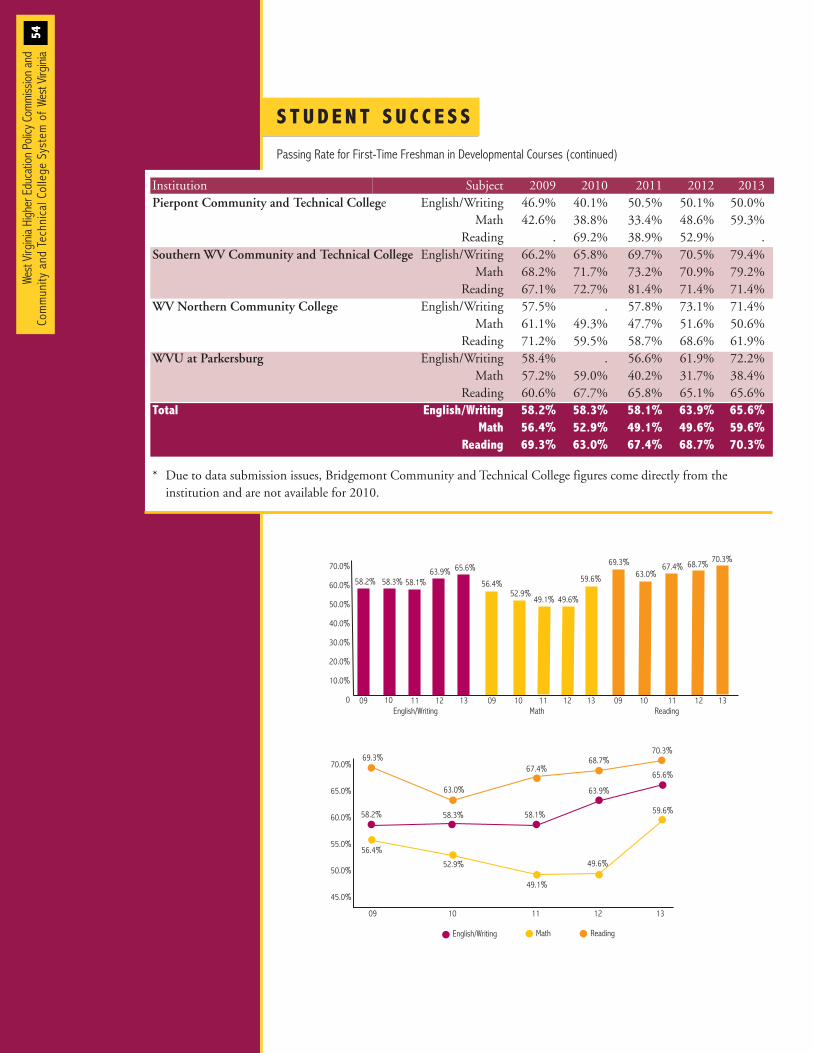
S T UD EN T S U C C E S S
Passing Rate for First-Time Freshman in Developmental Courses (continued)
West Virg
inia Higher Education Po
licy C
ommiss
ion and
Commun
ity and
Tec
hnical College
System of We
st Virg
inia
54
08 0907
70.0%
60.0%
50.0%
40.0%
30.0%
20.0%
10.0%
0 1309 11 12English/Writing
1309
05
11 12Math
1309
05
11 12Reading
10 10 10
65.6%
58.2% 58.1%63.9%
56.4%
49.1% 49.6%
70.3%69.3% 67.4% 68.7%
52.9%
63.0%58.3% 59.6%
1309 10 11 12
59.6%58.2% 58.1%
63.9%
70.3%
56.4%
49.1%
49.6%
65.6%
69.3%67.4%
68.7%70.0%
65.0%
60.0%
55.0%
50.0%
45.0%
English/Writing Math Reading
52.9%
58.3%
63.0%
Institution Subject 2009 2010 2011 2012 2013Pierpont Community and Technical College English/Writing 46.9% 40.1% 50.5% 50.1% 50.0%
Math 42.6% 38.8% 33.4% 48.6% 59.3%Reading . 69.2% 38.9% 52.9% .
Southern WV Community and Technical College English/Writing 66.2% 65.8% 69.7% 70.5% 79.4%Math 68.2% 71.7% 73.2% 70.9% 79.2%
Reading 67.1% 72.7% 81.4% 71.4% 71.4%WV Northern Community College English/Writing 57.5% . 57.8% 73.1% 71.4%
Math 61.1% 49.3% 47.7% 51.6% 50.6%Reading 71.2% 59.5% 58.7% 68.6% 61.9%
WVU at Parkersburg English/Writing 58.4% . 56.6% 61.9% 72.2%Math 57.2% 59.0% 40.2% 31.7% 38.4%
Reading 60.6% 67.7% 65.8% 65.1% 65.6%Total English/Writing 58.2% 58.3% 58.1% 63.9% 65.6%
Math 56.4% 52.9% 49.1% 49.6% 59.6%Reading 69.3% 63.0% 67.4% 68.7% 70.3%
* Due to data submission issues, Bridgemont Community and Technical College figures come directly from the institution and are not available for 2010.
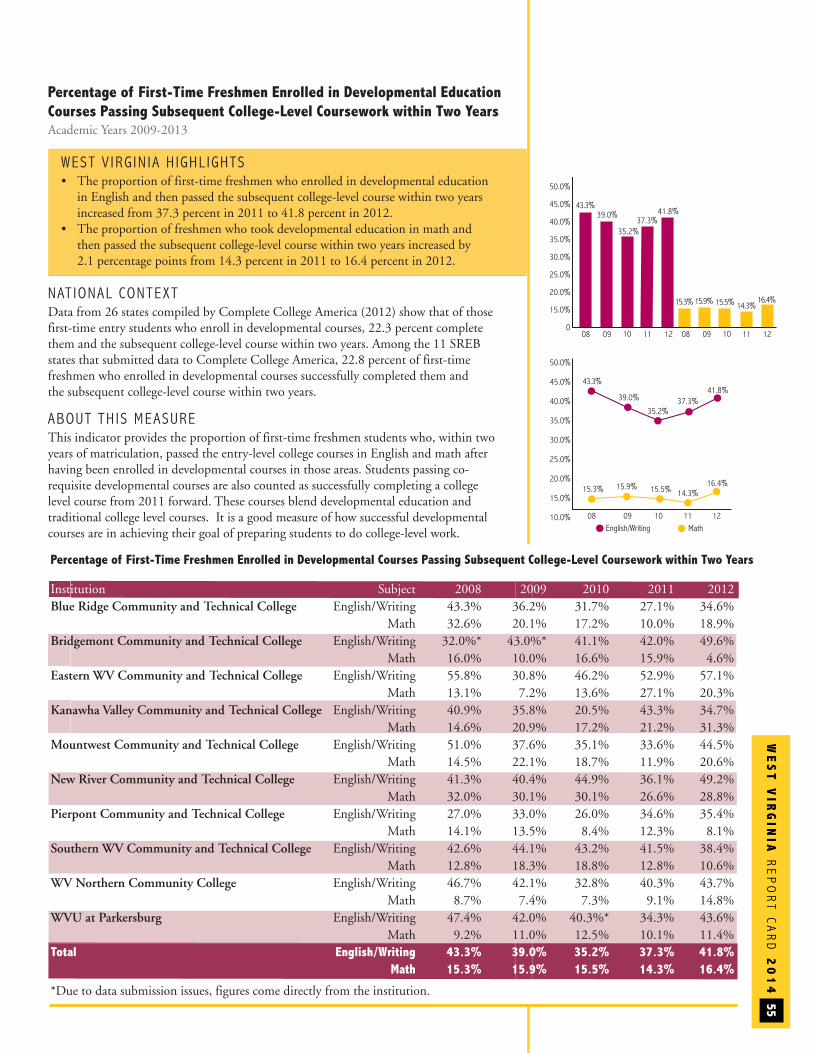
WE
ST
VIR
GIN
IAREPORT C
ARD
20
14
55
9
Percentage of First-Time Freshmen Enrolled in Developmental EducationCourses Passing Subsequent College-Level Coursework within Two YearsAcademic Years 2009-2013
WEST V IRG IN IA H IGHL IGHTS• The proportion of first-time freshmen who enrolled in developmental education in English and then passed the subsequent college-level course within two years increased from 37.3 percent in 2011 to 41.8 percent in 2012.
• The proportion of freshmen who took developmental education in math and then passed the subsequent college-level course within two years increased by 2.1 percentage points from 14.3 percent in 2011 to 16.4 percent in 2012.
NAT IONAL CONTEXT Data from 26 states compiled by Complete College America (2012) show that of thosefirst-time entry students who enroll in developmental courses, 22.3 percent completethem and the subsequent college-level course within two years. Among the 11 SREBstates that submitted data to Complete College America, 22.8 percent of first-time freshmen who enrolled in developmental courses successfully completed them and the subsequent college-level course within two years.
ABOUT TH IS MEASUREThis indicator provides the proportion of first-time freshmen students who, within twoyears of matriculation, passed the entry-level college courses in English and math afterhaving been enrolled in developmental courses in those areas. Students passing co-requisite developmental courses are also counted as successfully completing a college level course from 2011 forward. These courses blend developmental education and traditional college level courses. It is a good measure of how successful developmentalcourses are in achieving their goal of preparing students to do college-level work.
50.0%
45.0%
40.0%
35.0%
30.0%
25.0%
20.0%
15.0%
01209 10 11 1209 1110
1
16.4%15.3% 15.9% 15.5%
41.8%43.3%
39.0%
35.2%
14.3%
37.3%
08 08
1
08 10 11 12
E
50.0%
45.0%
40.0%
35.0%
30.0%
25.0%
20.0%
15.0%
10.0%English/Writing Math
1
16.4%15.3% 15.9% 15.5% 14.3%
41.8%43.3%
39.0%
35.2%37.3%
1
09
1
Percentage of First-Time Freshmen Enrolled in Developmental Courses Passing Subsequent College-Level Coursework within Two Years
Institution Subject 2008 2009 2010 2011 2012Blue Ridge Community and Technical College English/Writing 43.3% 36.2% 31.7% 27.1% 34.6%
Math 32.6% 20.1% 17.2% 10.0% 18.9%Bridgemont Community and Technical College English/Writing 32.0%* 43.0%* 41.1% 42.0% 49.6%
Math 16.0% 10.0% 16.6% 15.9% 4.6%Eastern WV Community and Technical College English/Writing 55.8% 30.8% 46.2% 52.9% 57.1%
Math 13.1% 7.2% 13.6% 27.1% 20.3%Kanawha Valley Community and Technical College English/Writing 40.9% 35.8% 20.5% 43.3% 34.7%
Math 14.6% 20.9% 17.2% 21.2% 31.3%Mountwest Community and Technical College English/Writing 51.0% 37.6% 35.1% 33.6% 44.5%
Math 14.5% 22.1% 18.7% 11.9% 20.6%New River Community and Technical College English/Writing 41.3% 40.4% 44.9% 36.1% 49.2%
Math 32.0% 30.1% 30.1% 26.6% 28.8%Pierpont Community and Technical College English/Writing 27.0% 33.0% 26.0% 34.6% 35.4%
Math 14.1% 13.5% 8.4% 12.3% 8.1%Southern WV Community and Technical College English/Writing 42.6% 44.1% 43.2% 41.5% 38.4%
Math 12.8% 18.3% 18.8% 12.8% 10.6%WV Northern Community College English/Writing 46.7% 42.1% 32.8% 40.3% 43.7%
Math 8.7% 7.4% 7.3% 9.1% 14.8%WVU at Parkersburg English/Writing 47.4% 42.0% 40.3%* 34.3% 43.6%
Math 9.2% 11.0% 12.5% 10.1% 11.4%Total English/Writing 43.3% 39.0% 35.2% 37.3% 41.8%
Math 15.3% 15.9% 15.5% 14.3% 16.4%
*Due to data submission issues, figures come directly from the institution.
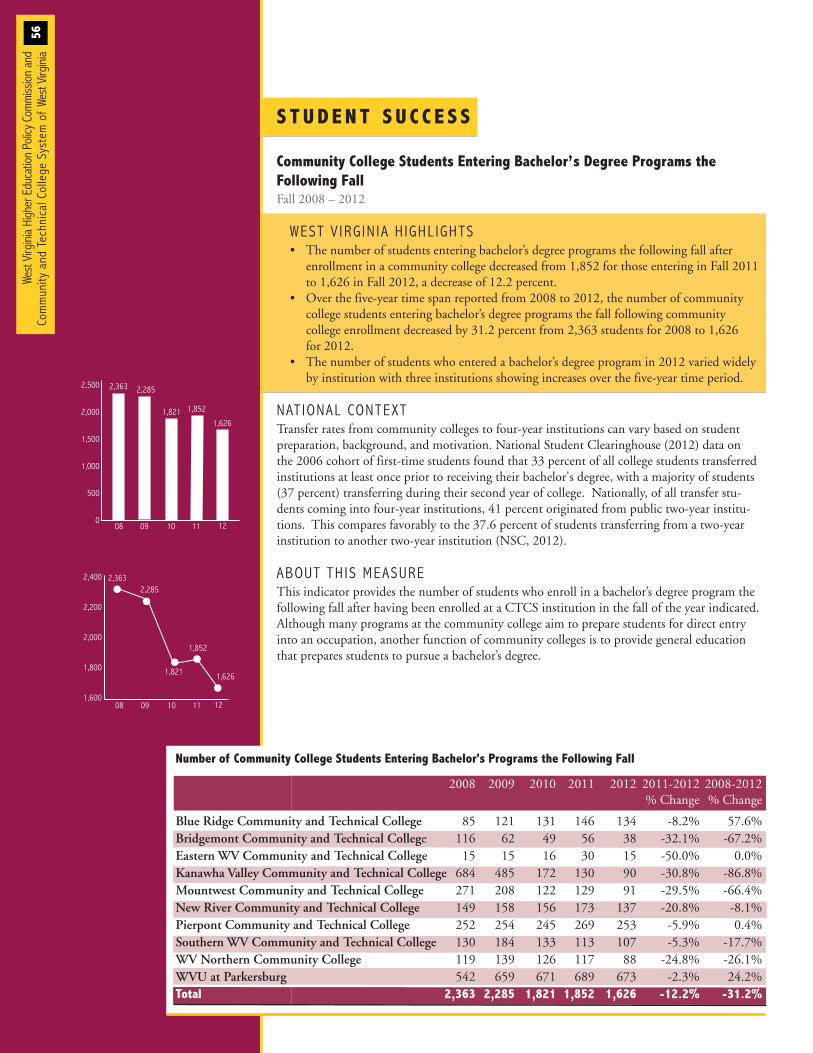
S T UD EN T S U C C E S S
West Virg
inia Higher Education Po
licy C
ommiss
ion and
Commun
ity and
Tec
hnical College
System of We
st Virg
inia
56
Community College Students Entering Bachelor’s Degree Programs the Following FallFall 2008 – 2012
WEST V IRG IN IA H IGHL IGHTS• The number of students entering bachelor’s degree programs the following fall after enrollment in a community college decreased from 1,852 for those entering in Fall 2011to 1,626 in Fall 2012, a decrease of 12.2 percent.
• Over the five-year time span reported from 2008 to 2012, the number of community college students entering bachelor’s degree programs the fall following community college enrollment decreased by 31.2 percent from 2,363 students for 2008 to 1,626 for 2012.
• The number of students who entered a bachelor’s degree program in 2012 varied widely by institution with three institutions showing increases over the five-year time period.
NAT IONAL CONTEXTTransfer rates from community colleges to four-year institutions can vary based on studentpreparation, background, and motivation. National Student Clearinghouse (2012) data on the 2006 cohort of first-time students found that 33 percent of all college students transferredinstitutions at least once prior to receiving their bachelor's degree, with a majority of students(37 percent) transferring during their second year of college. Nationally, of all transfer stu-dents coming into four-year institutions, 41 percent originated from public two-year institu-tions. This compares favorably to the 37.6 percent of students transferring from a two-year institution to another two-year institution (NSC, 2012).
ABOUT TH IS MEASUREThis indicator provides the number of students who enroll in a bachelor’s degree program thefollowing fall after having been enrolled at a CTCS institution in the fall of the year indicated.Although many programs at the community college aim to prepare students for direct entryinto an occupation, another function of community colleges is to provide general educationthat prepares students to pursue a bachelor’s degree.
1,626
2,363 2,285
1,821
0
2,500
2,000
1,500
1,000
500
0
1,852
1208 09 10 11
2,400
2,200
2,000
1,800
1,6001208 09 10 11
1,626
2,3632,285
1,821
1,852
2
Number of Community College Students Entering Bachelor's Programs the Following Fall
2008 2009 2010 2011 2012 2011-2012 2008-2012% Change % Change
Blue Ridge Community and Technical College 85 121 131 146 134 -8.2% 57.6%Bridgemont Community and Technical College 116 62 49 56 38 -32.1% -67.2%Eastern WV Community and Technical College 15 15 16 30 15 -50.0% 0.0%Kanawha Valley Community and Technical College 684 485 172 130 90 -30.8% -86.8%Mountwest Community and Technical College 271 208 122 129 91 -29.5% -66.4%New River Community and Technical College 149 158 156 173 137 -20.8% -8.1%Pierpont Community and Technical College 252 254 245 269 253 -5.9% 0.4%Southern WV Community and Technical College 130 184 133 113 107 -5.3% -17.7%WV Northern Community College 119 139 126 117 88 -24.8% -26.1%WVU at Parkersburg 542 659 671 689 673 -2.3% 24.2%Total 2,363 2,285 1,821 1,852 1,626 -12.2% -31.2%
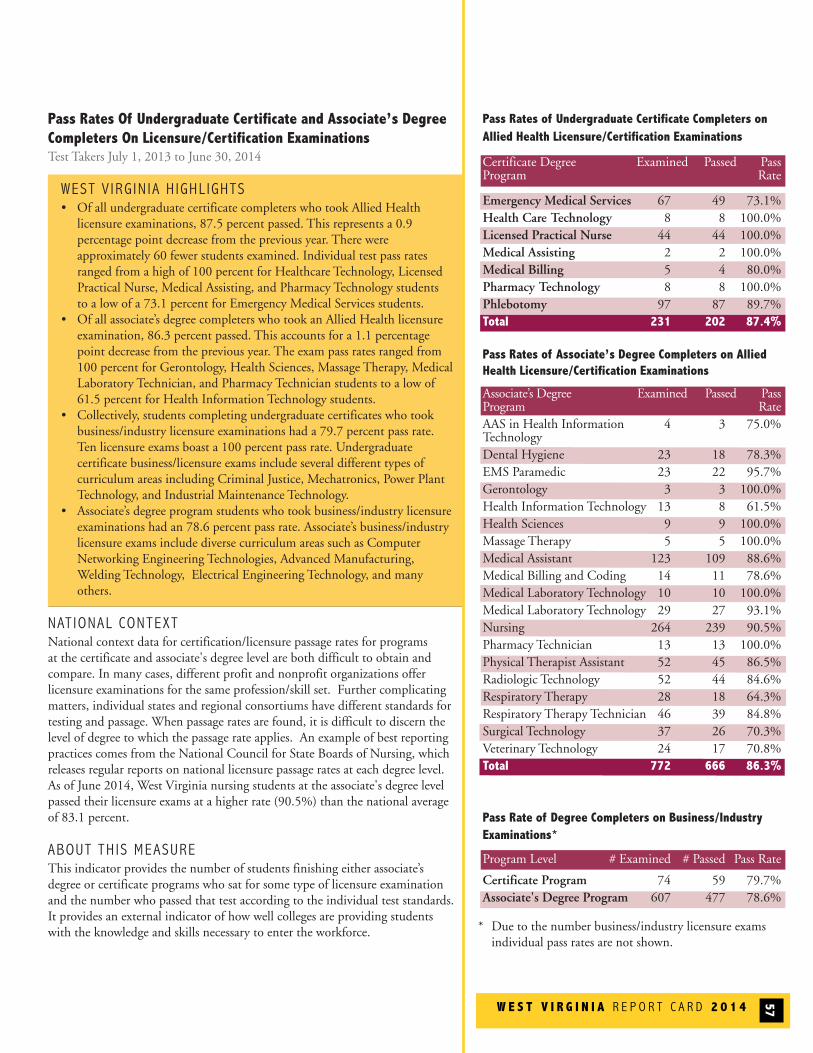
W E S T V I R G I N I A R E P O R T C A R D 2 0 1 4 57
Pass Rates Of Undergraduate Certificate and Associate’s Degree Completers On Licensure/Certification Examinations Test Takers July 1, 2013 to June 30, 2014
WEST V IRG IN IA H IGHL IGHTS• Of all undergraduate certificate completers who took Allied Healthlicensure examinations, 87.5 percent passed. This represents a 0.9 percentage point decrease from the previous year. There were approximately 60 fewer students examined. Individual test pass rates ranged from a high of 100 percent for Healthcare Technology, Licensed Practical Nurse, Medical Assisting, and Pharmacy Technology students to a low of a 73.1 percent for Emergency Medical Services students.
• Of all associate’s degree completers who took an Allied Health licensure examination, 86.3 percent passed. This accounts for a 1.1 percentage point decrease from the previous year. The exam pass rates ranged from 100 percent for Gerontology, Health Sciences, Massage Therapy, Medical Laboratory Technician, and Pharmacy Technician students to a low of 61.5 percent for Health Information Technology students.
• Collectively, students completing undergraduate certificates who took business/industry licensure examinations had a 79.7 percent pass rate. Ten licensure exams boast a 100 percent pass rate. Undergraduate certificate business/licensure exams include several different types of curriculum areas including Criminal Justice, Mechatronics, Power Plant Technology, and Industrial Maintenance Technology.
• Associate’s degree program students who took business/industry licensure examinations had an 78.6 percent pass rate. Associate’s business/industry licensure exams include diverse curriculum areas such as Computer Networking Engineering Technologies, Advanced Manufacturing, Welding Technology, Electrical Engineering Technology, and many others.
NAT IONAL CONTEXTNational context data for certification/licensure passage rates for programs at the certificate and associate's degree level are both difficult to obtain andcompare. In many cases, different profit and nonprofit organizations offer licensure examinations for the same profession/skill set. Further complicatingmatters, individual states and regional consortiums have different standards for testing and passage. When passage rates are found, it is difficult to discern thelevel of degree to which the passage rate applies. An example of best reportingpractices comes from the National Council for State Boards of Nursing, whichreleases regular reports on national licensure passage rates at each degree level.As of June 2014, West Virginia nursing students at the associate's degree levelpassed their licensure exams at a higher rate (90.5%) than the national averageof 83.1 percent.
ABOUT TH IS MEASUREThis indicator provides the number of students finishing either associate’s degree or certificate programs who sat for some type of licensure examinationand the number who passed that test according to the individual test standards.It provides an external indicator of how well colleges are providing studentswith the knowledge and skills necessary to enter the workforce.
Pass Rates of Undergraduate Certificate Completers on Allied Health Licensure/Certification Examinations
Certificate Degree Examined Passed Pass Program Rate
Emergency Medical Services 67 49 73.1%Health Care Technology 8 8 100.0%Licensed Practical Nurse 44 44 100.0%Medical Assisting 2 2 100.0%Medical Billing 5 4 80.0%Pharmacy Technology 8 8 100.0%Phlebotomy 97 87 89.7%Total 231 202 87.4%
Pass Rates of Associate’s Degree Completers on AlliedHealth Licensure/Certification Examinations
Associate’s Degree Examined Passed Pass Program RateAAS in Health Information 4 3 75.0%TechnologyDental Hygiene 23 18 78.3%EMS Paramedic 23 22 95.7%Gerontology 3 3 100.0%Health Information Technology 13 8 61.5%Health Sciences 9 9 100.0%Massage Therapy 5 5 100.0%Medical Assistant 123 109 88.6%Medical Billing and Coding 14 11 78.6%Medical Laboratory Technology 10 10 100.0%Medical Laboratory Technology 29 27 93.1%Nursing 264 239 90.5%Pharmacy Technician 13 13 100.0%Physical Therapist Assistant 52 45 86.5%Radiologic Technology 52 44 84.6%Respiratory Therapy 28 18 64.3%Respiratory Therapy Technician 46 39 84.8%Surgical Technology 37 26 70.3%Veterinary Technology 24 17 70.8%Total 772 666 86.3%
Pass Rate of Degree Completers on Business/Industry Examinations*
Program Level # Examined # Passed Pass Rate
Certificate Program 74 59 79.7%Associate's Degree Program 607 477 78.6%
* Due to the number business/industry licensure exams individual pass rates are not shown.
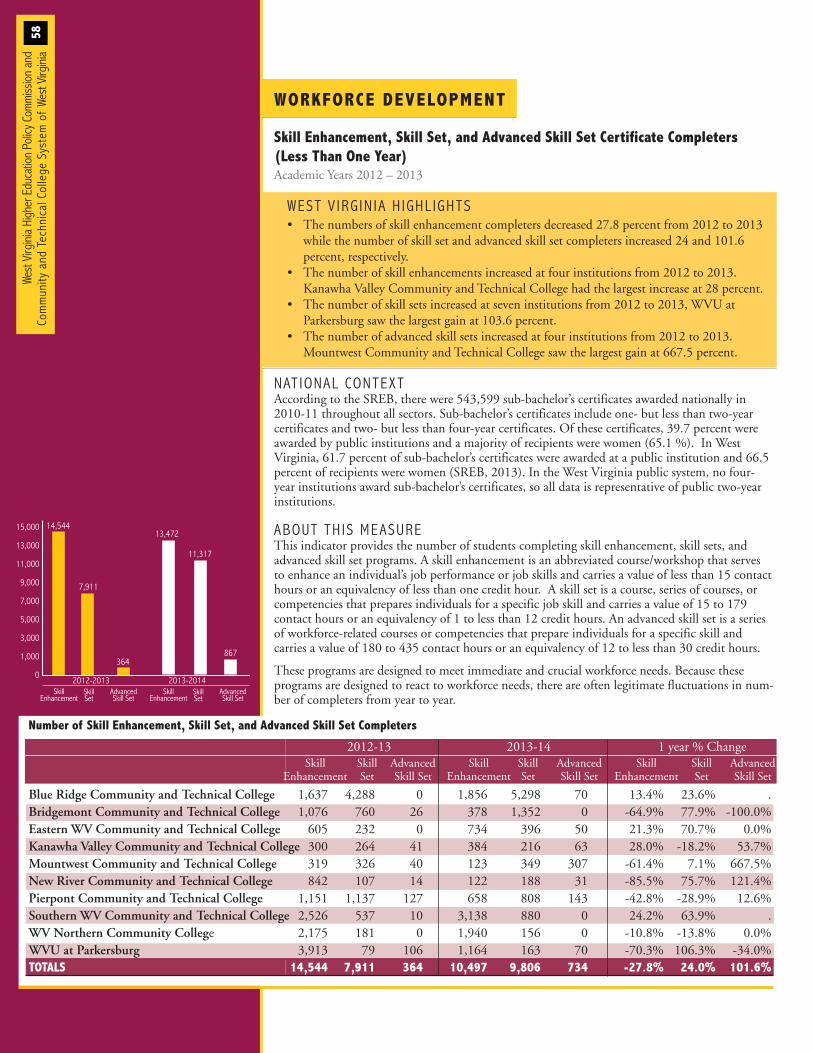
West Virg
inia Higher Education Po
licy C
ommiss
ion and
Commun
ity and
Tec
hnical College
System of We
st Virg
inia
58
WORKFORCE DEVELOPMENT
Skill Enhancement, Skill Set, and Advanced Skill Set Certificate Completers (Less Than One Year)Academic Years 2012 – 2013
WEST V IRG IN IA H IGHL IGHTS• The numbers of skill enhancement completers decreased 27.8 percent from 2012 to 2013 while the number of skill set and advanced skill set completers increased 24 and 101.6 percent, respectively.
• The number of skill enhancements increased at four institutions from 2012 to 2013. Kanawha Valley Community and Technical College had the largest increase at 28 percent.
• The number of skill sets increased at seven institutions from 2012 to 2013, WVU at Parkersburg saw the largest gain at 103.6 percent.
• The number of advanced skill sets increased at four institutions from 2012 to 2013. Mountwest Community and Technical College saw the largest gain at 667.5 percent.
NAT IONAL CONTEXTAccording to the SREB, there were 543,599 sub-bachelor’s certificates awarded nationally in2010-11 throughout all sectors. Sub-bachelor’s certificates include one- but less than two-year certificates and two- but less than four-year certificates. Of these certificates, 39.7 percent wereawarded by public institutions and a majority of recipients were women (65.1 %). In West Virginia, 61.7 percent of sub-bachelor’s certificates were awarded at a public institution and 66.5percent of recipients were women (SREB, 2013). In the West Virginia public system, no four-year institutions award sub-bachelor’s certificates, so all data is representative of public two-yearinstitutions.
ABOUT TH IS MEASUREThis indicator provides the number of students completing skill enhancement, skill sets, and advanced skill set programs. A skill enhancement is an abbreviated course/workshop that serves to enhance an individual’s job performance or job skills and carries a value of less than 15 contacthours or an equivalency of less than one credit hour. A skill set is a course, series of courses, orcompetencies that prepares individuals for a specific job skill and carries a value of 15 to 179 contact hours or an equivalency of 1 to less than 12 credit hours. An advanced skill set is a seriesof workforce-related courses or competencies that prepare individuals for a specific skill andcarries a value of 180 to 435 contact hours or an equivalency of 12 to less than 30 credit hours.
These programs are designed to meet immediate and crucial workforce needs. Because these programs are designed to react to workforce needs, there are often legitimate fluctuations in num-ber of completers from year to year.
SkillEnhancement
SkillSet
AdvancedSkill Set
15,000
13,000
11,000
9,000
7,000
5,000
3,000
1,000
0
13,472
2013-20142012-2013
11,317
867
14,544
7,911
364
SkillEnhancement
SkillSet
AdvancedSkill Set
Number of Skill Enhancement, Skill Set, and Advanced Skill Set Completers
2012-13 2013-14 1 year % ChangeSkill Skill Advanced Skill Skill Advanced Skill Skill Advanced
Enhancement Set Skill Set Enhancement Set Skill Set Enhancement Set Skill Set
Blue Ridge Community and Technical College 1,637 4,288 0 1,856 5,298 70 13.4% 23.6% .Bridgemont Community and Technical College 1,076 760 26 378 1,352 0 -64.9% 77.9% -100.0%Eastern WV Community and Technical College 605 232 0 734 396 50 21.3% 70.7% 0.0%Kanawha Valley Community and Technical College 300 264 41 384 216 63 28.0% -18.2% 53.7%Mountwest Community and Technical College 319 326 40 123 349 307 -61.4% 7.1% 667.5%New River Community and Technical College 842 107 14 122 188 31 -85.5% 75.7% 121.4%Pierpont Community and Technical College 1,151 1,137 127 658 808 143 -42.8% -28.9% 12.6%Southern WV Community and Technical College 2,526 537 10 3,138 880 0 24.2% 63.9% .WV Northern Community College 2,175 181 0 1,940 156 0 -10.8% -13.8% 0.0%WVU at Parkersburg 3,913 79 106 1,164 163 70 -70.3% 106.3% -34.0%TOTALS 14,544 7,911 364 10,497 9,806 734 -27.8% 24.0% 101.6%
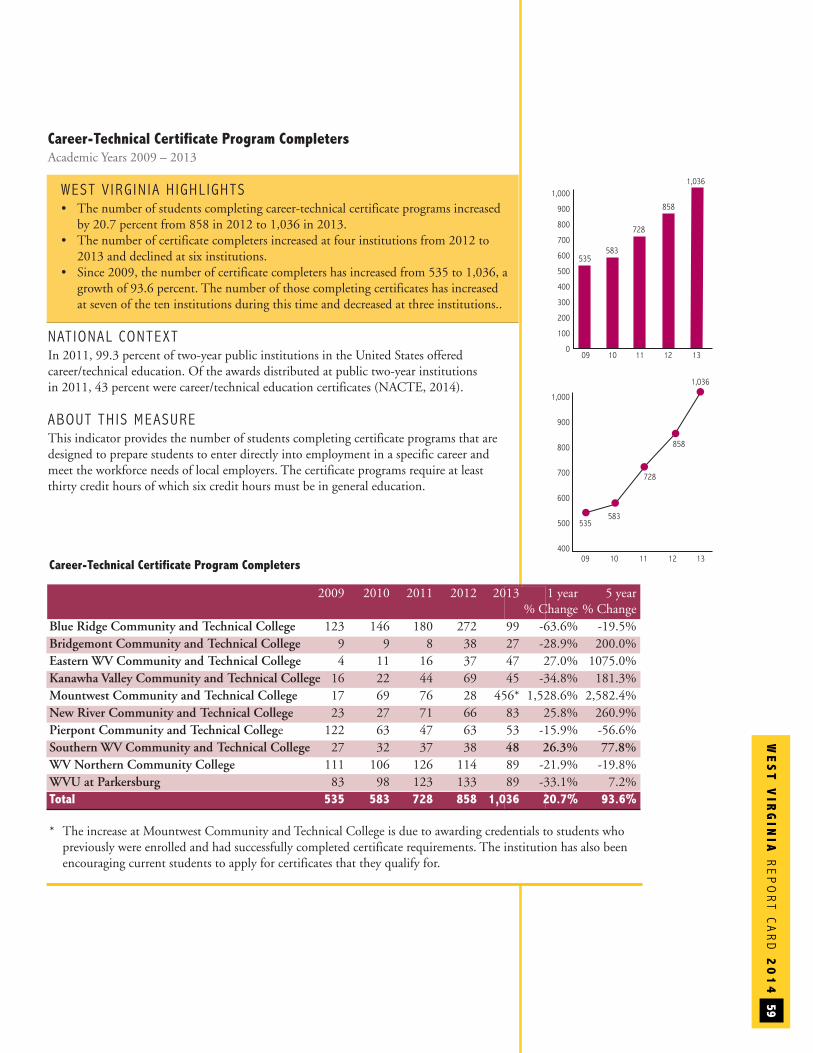
WE
ST
VIR
GIN
IAREPORT C
ARD
20
14
59
Career-Technical Certificate Program CompletersAcademic Years 2009 – 2013
WEST V IRG IN IA H IGHL IGHTS• The number of students completing career-technical certificate programs increased by 20.7 percent from 858 in 2012 to 1,036 in 2013.
• The number of certificate completers increased at four institutions from 2012 to 2013 and declined at six institutions.
• Since 2009, the number of certificate completers has increased from 535 to 1,036, agrowth of 93.6 percent. The number of those completing certificates has increased at seven of the ten institutions during this time and decreased at three institutions..
NAT IONAL CONTEXT In 2011, 99.3 percent of two-year public institutions in the United States offeredcareer/technical education. Of the awards distributed at public two-year institutions in 2011, 43 percent were career/technical education certificates (NACTE, 2014).
ABOUT TH IS MEASUREThis indicator provides the number of students completing certificate programs that aredesigned to prepare students to enter directly into employment in a specific career andmeet the workforce needs of local employers. The certificate programs require at leastthirty credit hours of which six credit hours must be in general education.
Career-Technical Certificate Program Completers
2009 2010 2011 2012 2013 1 year 5 year% Change % Change
Blue Ridge Community and Technical College 123 146 180 272 99 -63.6% -19.5%Bridgemont Community and Technical College 9 9 8 38 27 -28.9% 200.0%Eastern WV Community and Technical College 4 11 16 37 47 27.0% 1075.0%Kanawha Valley Community and Technical College 16 22 44 69 45 -34.8% 181.3%Mountwest Community and Technical College 17 69 76 28 456* 1,528.6% 2,582.4%New River Community and Technical College 23 27 71 66 83 25.8% 260.9%Pierpont Community and Technical College 122 63 47 63 53 -15.9% -56.6%Southern WV Community and Technical College 27 32 37 38 48 26.3% 77.8%WV Northern Community College 111 106 126 114 89 -21.9% -19.8%WVU at Parkersburg 83 98 123 133 89 -33.1% 7.2%Total 535 583 728 858 1,036 20.7% 93.6%
* The increase at Mountwest Community and Technical College is due to awarding credentials to students who previously were enrolled and had successfully completed certificate requirements. The institution has also been encouraging current students to apply for certificates that they qualify for.
1,000
900
800
700
600
500
400
300
200
100
0
535583
728
858
1,036
0
1309 10 11 12
5
09 10 11 12 13
1
583535
728
858
1,036
1,000
900
800
700
600
500
400
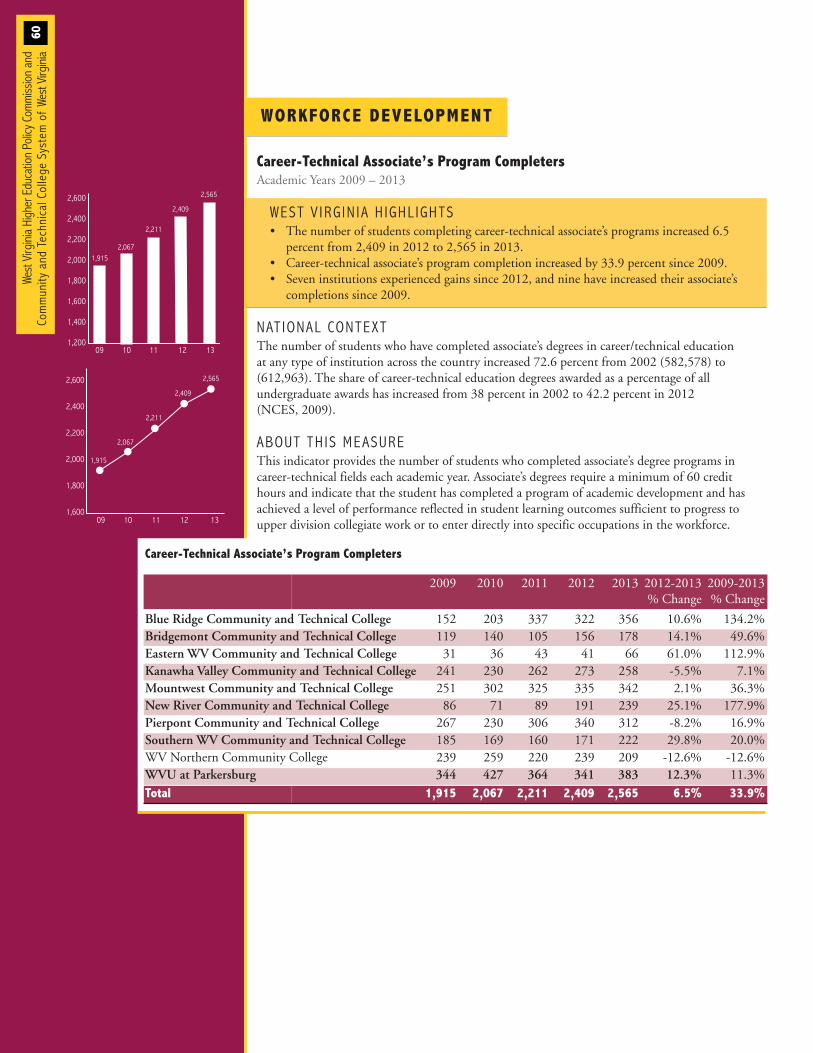
WORKFORCE DEVELOPMENT
60
Career-Technical Associate’s Program CompletersAcademic Years 2009 – 2013
WEST V IRG IN IA H IGHL IGHTS• The number of students completing career-technical associate’s programs increased 6.5 percent from 2,409 in 2012 to 2,565 in 2013.
• Career-technical associate’s program completion increased by 33.9 percent since 2009.• Seven institutions experienced gains since 2012, and nine have increased their associate’s completions since 2009.
NAT IONAL CONTEXTThe number of students who have completed associate’s degrees in career/technical education at any type of institution across the country increased 72.6 percent from 2002 (582,578) to(612,963). The share of career-technical education degrees awarded as a percentage of all undergraduate awards has increased from 38 percent in 2002 to 42.2 percent in 2012 (NCES, 2009).
ABOUT TH IS MEASUREThis indicator provides the number of students who completed associate’s degree programs in career-technical fields each academic year. Associate’s degrees require a minimum of 60 credit hours and indicate that the student has completed a program of academic development and hasachieved a level of performance reflected in student learning outcomes sufficient to progress to upper division collegiate work or to enter directly into specific occupations in the workforce.
2,600
2,400
2,200
2,000
1,800
1,600
1,400
1,2001309 10 11 12
2,211
2,409
2,565
1,9152,067
2,600
2,400
2,200
2,000
1,800
1,600
2,211
2,409
2,565
1,915
2,067
1309 10 11 12
2
Career-Technical Associate’s Program Completers
2009 2010 2011 2012 2013 2012-2013 2009-2013% Change % Change
Blue Ridge Community and Technical College 152 203 337 322 356 10.6% 134.2%Bridgemont Community and Technical College 119 140 105 156 178 14.1% 49.6%Eastern WV Community and Technical College 31 36 43 41 66 61.0% 112.9%Kanawha Valley Community and Technical College 241 230 262 273 258 -5.5% 7.1%Mountwest Community and Technical College 251 302 325 335 342 2.1% 36.3%New River Community and Technical College 86 71 89 191 239 25.1% 177.9%Pierpont Community and Technical College 267 230 306 340 312 -8.2% 16.9%Southern WV Community and Technical College 185 169 160 171 222 29.8% 20.0%WV Northern Community College 239 259 220 239 209 -12.6% -12.6%WVU at Parkersburg 344 427 364 341 383 12.3% 11.3%Total 1,915 2,067 2,211 2,409 2,565 6.5% 33.9%
West Virg
inia Higher Education Po
licy C
ommiss
ion and
Commun
ity and
Tec
hnical College
System of We
st Virg
inia
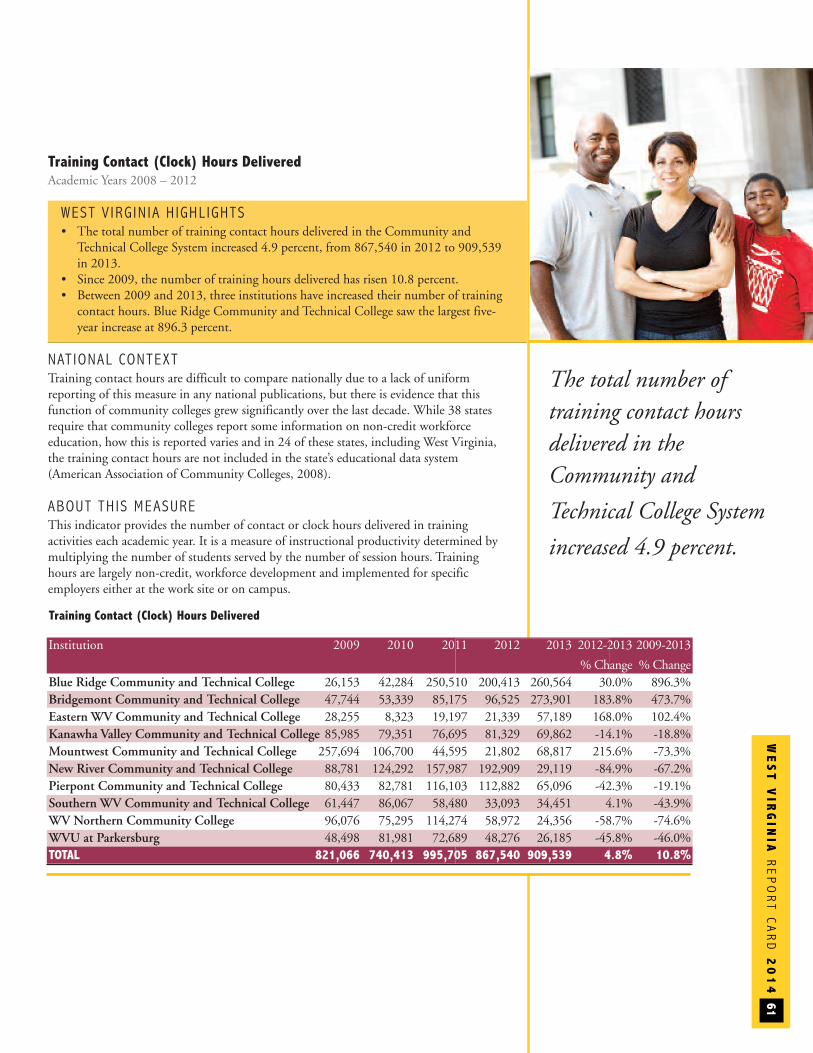
WE
ST
VIR
GIN
IAREPORT C
ARD
20
14
61
Training Contact (Clock) Hours DeliveredAcademic Years 2008 – 2012
WEST V IRG IN IA H IGHL IGHTS• The total number of training contact hours delivered in the Community and Technical College System increased 4.9 percent, from 867,540 in 2012 to 909,539 in 2013.
• Since 2009, the number of training hours delivered has risen 10.8 percent.• Between 2009 and 2013, three institutions have increased their number of training contact hours. Blue Ridge Community and Technical College saw the largest five-year increase at 896.3 percent.
NAT IONAL CONTEXTTraining contact hours are difficult to compare nationally due to a lack of uniform reporting of this measure in any national publications, but there is evidence that thisfunction of community colleges grew significantly over the last decade. While 38 statesrequire that community colleges report some information on non-credit workforce education, how this is reported varies and in 24 of these states, including West Virginia,the training contact hours are not included in the state’s educational data system (American Association of Community Colleges, 2008).
ABOUT TH IS MEASUREThis indicator provides the number of contact or clock hours delivered in training activities each academic year. It is a measure of instructional productivity determined bymultiplying the number of students served by the number of session hours. Traininghours are largely non-credit, workforce development and implemented for specific employers either at the work site or on campus.
Training Contact (Clock) Hours Delivered
Institution 2009 2010 2011 2012 2013 2012-2013 2009-2013
% Change % ChangeBlue Ridge Community and Technical College 26,153 42,284 250,510 200,413 260,564 30.0% 896.3%Bridgemont Community and Technical College 47,744 53,339 85,175 96,525 273,901 183.8% 473.7%Eastern WV Community and Technical College 28,255 8,323 19,197 21,339 57,189 168.0% 102.4%Kanawha Valley Community and Technical College 85,985 79,351 76,695 81,329 69,862 -14.1% -18.8%Mountwest Community and Technical College 257,694 106,700 44,595 21,802 68,817 215.6% -73.3%New River Community and Technical College 88,781 124,292 157,987 192,909 29,119 -84.9% -67.2%Pierpont Community and Technical College 80,433 82,781 116,103 112,882 65,096 -42.3% -19.1%Southern WV Community and Technical College 61,447 86,067 58,480 33,093 34,451 4.1% -43.9%WV Northern Community College 96,076 75,295 114,274 58,972 24,356 -58.7% -74.6%WVU at Parkersburg 48,498 81,981 72,689 48,276 26,185 -45.8% -46.0%TOTAL 821,066 740,413 995,705 867,540 909,539 4.8% 10.8%
The total number oftraining contact hoursdelivered in the Community and
Technical College System
increased 4.9 percent.
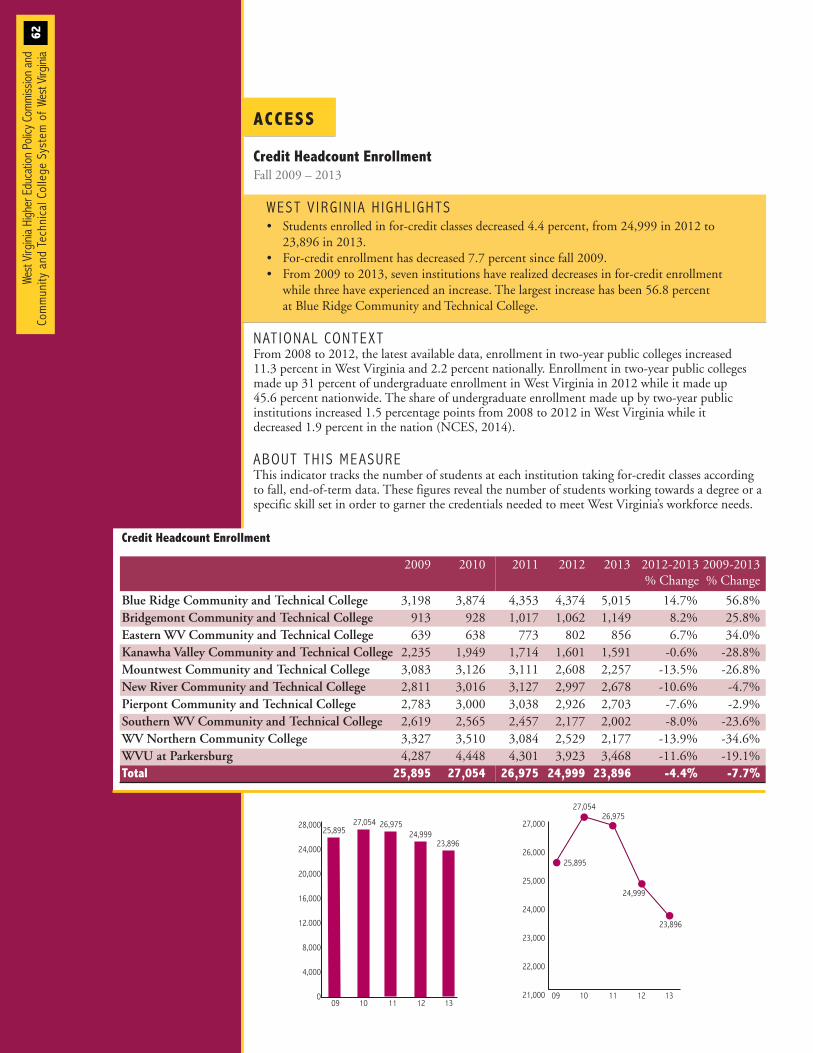
West Virg
inia Higher Education Po
licy C
ommiss
ion and
Commun
ity and
Tec
hnical College
System of We
st Virg
inia
62
23,896
27,05424,99925,895
26,97528,000
24,000
20,000
16,000
12.000
8,000
4,000
01309 10 11 12
27,000
26,000
25,000
24,000
23,000
22,000
21,000 1309 10 11 12
23,896
26,97527,054
25,895
24,999
Credit Headcount Enrollment
2009 2010 2011 2012 2013 2012-2013 2009-2013% Change % Change
Blue Ridge Community and Technical College 3,198 3,874 4,353 4,374 5,015 14.7% 56.8%Bridgemont Community and Technical College 913 928 1,017 1,062 1,149 8.2% 25.8%Eastern WV Community and Technical College 639 638 773 802 856 6.7% 34.0%Kanawha Valley Community and Technical College 2,235 1,949 1,714 1,601 1,591 -0.6% -28.8%Mountwest Community and Technical College 3,083 3,126 3,111 2,608 2,257 -13.5% -26.8%New River Community and Technical College 2,811 3,016 3,127 2,997 2,678 -10.6% -4.7%Pierpont Community and Technical College 2,783 3,000 3,038 2,926 2,703 -7.6% -2.9%Southern WV Community and Technical College 2,619 2,565 2,457 2,177 2,002 -8.0% -23.6%WV Northern Community College 3,327 3,510 3,084 2,529 2,177 -13.9% -34.6%WVU at Parkersburg 4,287 4,448 4,301 3,923 3,468 -11.6% -19.1%Total 25,895 27,054 26,975 24,999 23,896 -4.4% -7.7%
ACCESS
Credit Headcount EnrollmentFall 2009 – 2013
WEST V IRG IN IA H IGHL IGHTS• Students enrolled in for-credit classes decreased 4.4 percent, from 24,999 in 2012 to 23,896 in 2013.
• For-credit enrollment has decreased 7.7 percent since fall 2009.• From 2009 to 2013, seven institutions have realized decreases in for-credit enrollment while three have experienced an increase. The largest increase has been 56.8 percent at Blue Ridge Community and Technical College.
NAT IONAL CONTEXTFrom 2008 to 2012, the latest available data, enrollment in two-year public colleges increased 11.3 percent in West Virginia and 2.2 percent nationally. Enrollment in two-year public collegesmade up 31 percent of undergraduate enrollment in West Virginia in 2012 while it made up 45.6 percent nationwide. The share of undergraduate enrollment made up by two-year public institutions increased 1.5 percentage points from 2008 to 2012 in West Virginia while it decreased 1.9 percent in the nation (NCES, 2014).
ABOUT TH IS MEASUREThis indicator tracks the number of students at each institution taking for-credit classes accordingto fall, end-of-term data. These figures reveal the number of students working towards a degree or a specific skill set in order to garner the credentials needed to meet West Virginia’s workforce needs.
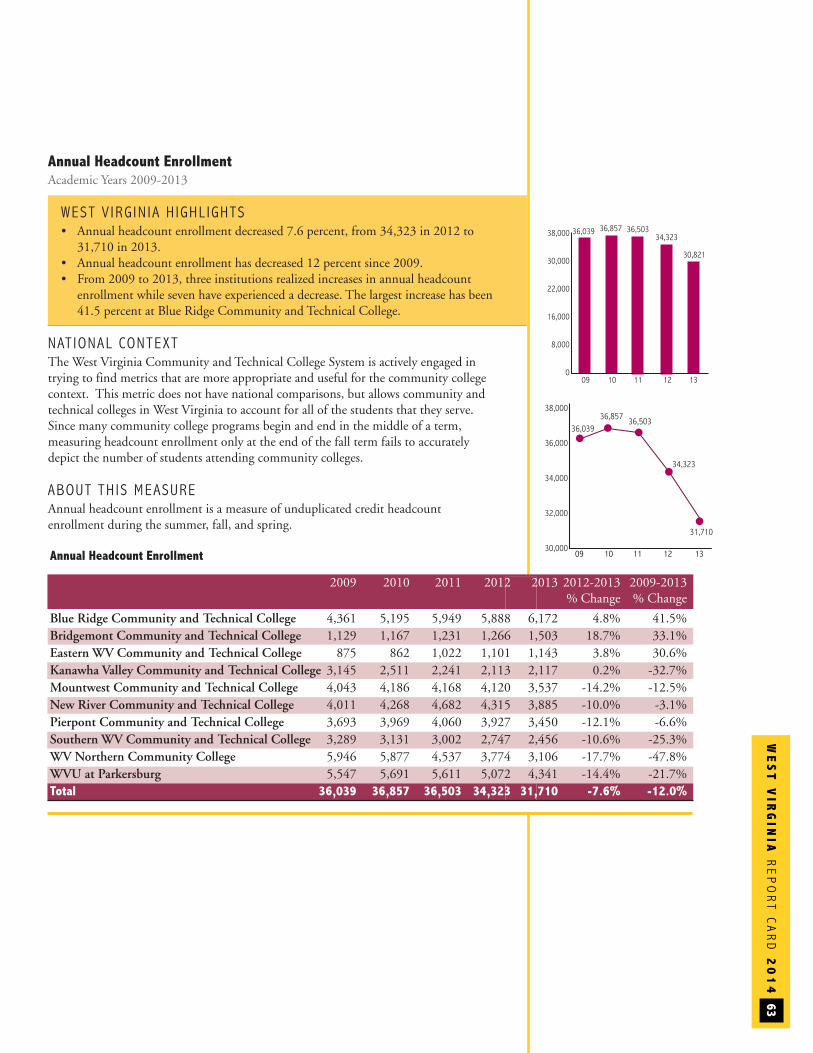
WE
ST
VIR
GIN
IAREPORT C
ARD
20
14
63
36,039 36,857
30,821
1309 10 11 12
36,50338,000
30,000
22,000
16,000
8,000
0
34,323
1
1309 10 11 12
38,000
36,000
34,000
32,000
30,000
36,03936,503
34,323
31,710
36,857
3
Annual Headcount EnrollmentAcademic Years 2009-2013
WEST V IRG IN IA H IGHL IGHTS• Annual headcount enrollment decreased 7.6 percent, from 34,323 in 2012 to 31,710 in 2013.
• Annual headcount enrollment has decreased 12 percent since 2009.• From 2009 to 2013, three institutions realized increases in annual headcount enrollment while seven have experienced a decrease. The largest increase has been 41.5 percent at Blue Ridge Community and Technical College.
NAT IONAL CONTEXTThe West Virginia Community and Technical College System is actively engaged in trying to find metrics that are more appropriate and useful for the community collegecontext. This metric does not have national comparisons, but allows community andtechnical colleges in West Virginia to account for all of the students that they serve. Since many community college programs begin and end in the middle of a term, measuring headcount enrollment only at the end of the fall term fails to accurately depict the number of students attending community colleges.
ABOUT TH IS MEASUREAnnual headcount enrollment is a measure of unduplicated credit headcount enrollment during the summer, fall, and spring.
Annual Headcount Enrollment
2009 2010 2011 2012 2013 2012-2013 2009-2013% Change % Change
Blue Ridge Community and Technical College 4,361 5,195 5,949 5,888 6,172 4.8% 41.5%Bridgemont Community and Technical College 1,129 1,167 1,231 1,266 1,503 18.7% 33.1%Eastern WV Community and Technical College 875 862 1,022 1,101 1,143 3.8% 30.6%Kanawha Valley Community and Technical College 3,145 2,511 2,241 2,113 2,117 0.2% -32.7%Mountwest Community and Technical College 4,043 4,186 4,168 4,120 3,537 -14.2% -12.5%New River Community and Technical College 4,011 4,268 4,682 4,315 3,885 -10.0% -3.1%Pierpont Community and Technical College 3,693 3,969 4,060 3,927 3,450 -12.1% -6.6%Southern WV Community and Technical College 3,289 3,131 3,002 2,747 2,456 -10.6% -25.3%WV Northern Community College 5,946 5,877 4,537 3,774 3,106 -17.7% -47.8%WVU at Parkersburg 5,547 5,691 5,611 5,072 4,341 -14.4% -21.7%Total 36,039 36,857 36,503 34,323 31,710 -7.6% -12.0%
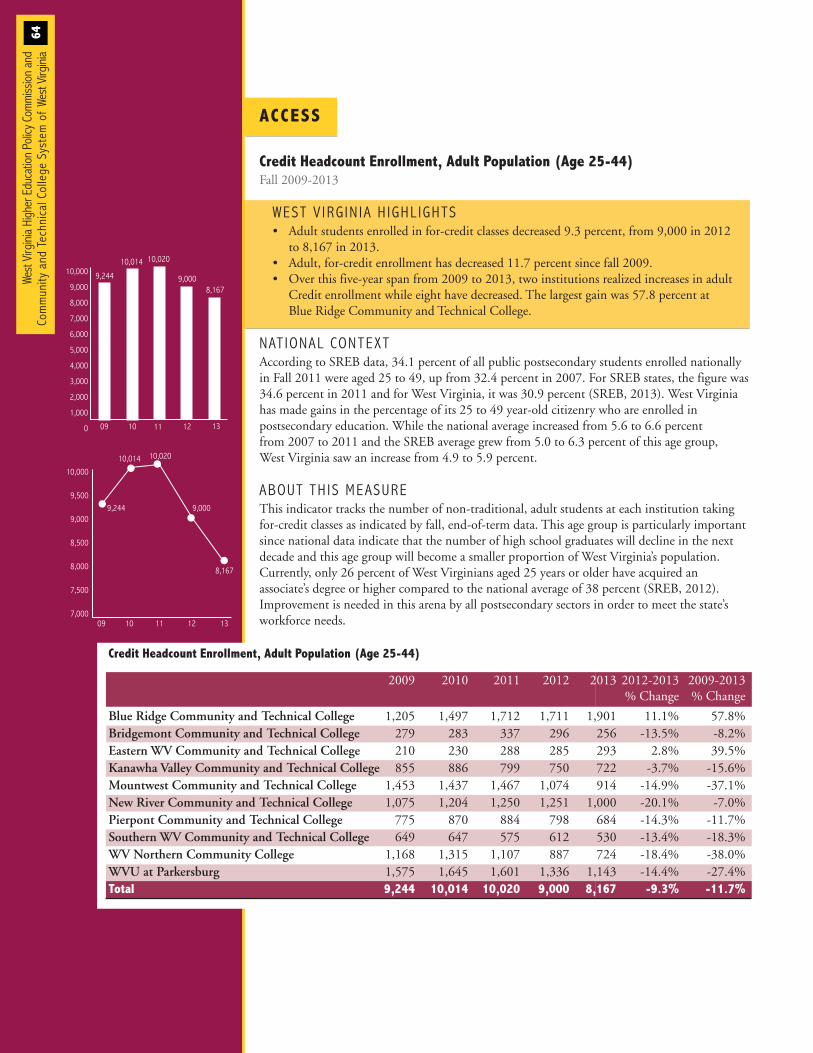
ACCESS
64
Credit Headcount Enrollment, Adult Population (Age 25-44)Fall 2009-2013
WEST V IRG IN IA H IGHL IGHTS• Adult students enrolled in for-credit classes decreased 9.3 percent, from 9,000 in 2012 to 8,167 in 2013.
• Adult, for-credit enrollment has decreased 11.7 percent since fall 2009. • Over this five-year span from 2009 to 2013, two institutions realized increases in adult Credit enrollment while eight have decreased. The largest gain was 57.8 percent at Blue Ridge Community and Technical College.
NAT IONAL CONTEXT According to SREB data, 34.1 percent of all public postsecondary students enrolled nationallyin Fall 2011 were aged 25 to 49, up from 32.4 percent in 2007. For SREB states, the figure was34.6 percent in 2011 and for West Virginia, it was 30.9 percent (SREB, 2013). West Virginiahas made gains in the percentage of its 25 to 49 year-old citizenry who are enrolled in postsecondary education. While the national average increased from 5.6 to 6.6 percent from 2007 to 2011 and the SREB average grew from 5.0 to 6.3 percent of this age group, West Virginia saw an increase from 4.9 to 5.9 percent.
ABOUT TH IS MEASUREThis indicator tracks the number of non-traditional, adult students at each institution takingfor-credit classes as indicated by fall, end-of-term data. This age group is particularly importantsince national data indicate that the number of high school graduates will decline in the nextdecade and this age group will become a smaller proportion of West Virginia’s population. Currently, only 26 percent of West Virginians aged 25 years or older have acquired an associate’s degree or higher compared to the national average of 38 percent (SREB, 2012). Improvement is needed in this arena by all postsecondary sectors in order to meet the state’sworkforce needs.
10,000
9,500
9,000
8,500
8,000
7,500
7,000
9
09 10 11 12 13
9,244
10,014 10,020
9,000
8,167
1
9,244
10,014 10,020
9,0008,167
1309 10 11 12
10,000
9,000
8,000
7,000
6,000
5,000
4,000
3,000
2,000
1,000
0
Credit Headcount Enrollment, Adult Population (Age 25-44)
2009 2010 2011 2012 2013 2012-2013 2009-2013% Change % Change
Blue Ridge Community and Technical College 1,205 1,497 1,712 1,711 1,901 11.1% 57.8%Bridgemont Community and Technical College 279 283 337 296 256 -13.5% -8.2%Eastern WV Community and Technical College 210 230 288 285 293 2.8% 39.5%Kanawha Valley Community and Technical College 855 886 799 750 722 -3.7% -15.6%Mountwest Community and Technical College 1,453 1,437 1,467 1,074 914 -14.9% -37.1%New River Community and Technical College 1,075 1,204 1,250 1,251 1,000 -20.1% -7.0%Pierpont Community and Technical College 775 870 884 798 684 -14.3% -11.7%Southern WV Community and Technical College 649 647 575 612 530 -13.4% -18.3%WV Northern Community College 1,168 1,315 1,107 887 724 -18.4% -38.0%WVU at Parkersburg 1,575 1,645 1,601 1,336 1,143 -14.4% -27.4%Total 9,244 10,014 10,020 9,000 8,167 -9.3% -11.7%
West Virg
inia Higher Education Po
licy C
ommiss
ion and
Commun
ity and
Tec
hnical College
System of We
st Virg
inia
WE
ST
VIR
GIN
IAREPORT C
ARD
20
14
65
Board TrainingIn 2009, the Commission and Council were required by the West Virginia Legislature to coordinate training and development opportunities for members of institutional governing boards. The learning objectives were codified and both began facilitating opportunities for training.
Training opportunities for Commission institution governing boards have included, but are not limited to, the following:• 2010 Board of Governors Summit (nine hours of training credit);• 2011 Capitalizing on the Foundation-Institution Partnership (five hours);• 2011 Strategic Finance (five hours); • 2012 Board of Governors Summit (nine hours); • 2013 Board of Governors Summit (nine hours); and• 2014 Board of Governors Summit (nine hours).
During 2014 fiscal year, the Council hosted various training opportunities including, but not limited to, the following events:• WV Community College Association/WV Association for Developmental Education Conference (12 hours of training credit);
• Summit on College and Career Readiness (4 hours); and• Board of Governor’s College Completion Summit (4 hours)
For the Fiscal Year 2014 reporting period, annual certifications were received from all institutional board chairs and the Commission’s and Council’s chairs with all current members in compliance.
Tech ParkThe West Virginia Regional Technology Park in South Charleston was acquired by the Commission in 2010 from Union Carbide Corporation, a subsidiary of The Dow ChemicalCompany. Under leadership of the Commission and with guidance from a new board of directors, the goal of the Park is to move ideas made in the academic research setting to the marketplace. The Tech Park’s vision is to become a multi-tenant research, development, and commercialization park focused on energy, chemicals, and related technologies for the advancement of education and economic development in West Virginia and the surrounding region. The West Virginia Regional Technology Park is making great progress in this objective. In 2014, ChemCeption, the only chemical incubator in the U.S., was formed at the Tech Park and currently has two tenants.
Facilities Condition and Operations AnalysisThe Commission is conducting a study of institutional facilities and their operations to determine the magnitude of the deferred maintenance backlog. In addition, the study will analyze asset reinvestment, annual stewardship, operating effectiveness and customer service. Data is benchmarked against information from other institutions included in a national database. Included in the study is an analysis of allocations of institutional resources for the upkeep of facilities.
Addit ional Commission and Counci l Updates
Addit ional Commission and Counci l Updates
West Virg
inia Higher Education Po
licy C
ommiss
ion and
Commun
ity and
Tec
hnical College
System of We
st Virg
inia
66
WVNET Initiatives The West Virginia Network (WVNET) took a significant step towards avoiding interruption of service or loss of data by building duplicate copies of data storage and computer systems. A NetApp 50 TB disk storage array and a Cisco UCS Rack Server were brought to life in another data center in Charleston by WVNET. As a result, WVNET has duplicate computer systems and data in both northern and southern West Virginia, both attached to its 10GB fiber ring. Using a process called replication, the two sites stay in sync at all times.
For the sixth time in two years, WVNET lowered its prices for Internet access. In January 2014, the price was lowered to $19.95. In January 2015 WVNET will further lower its price to $9.95 per megabit per month, more than a 50 percent reduction.
In October of 2013 WVNET hosted its annual West Virginia Higher Education Technology Conference. The theme “Trending Technologies and Community Engagement” offered participants an opportunity to engage in discussions about the ways in which collaboration and social engagement enhance learner outcomes, retention, self-efficacy, and workforce preparedness in higher education. Over 200 higher education employees attended the conference that featured thought-inspiring keynote speakers, 60+ concurrent sessions, and the latest technological advances demonstrated by exhibitors, and networking with educators from all of West Virginia.
OASIS Implementation The Commission and Council worked with institutions to implement the procurement and financial phase of wvOASIS, the state’s Enterprise Resource Planning Project. Colleges and universities are interfacing transactions between their financial systems and wvOASIS. Planning is in progress for the next phase, which will include human resources management and payroll processes.
Commission, Council, K-12 Partnership West Virginia is part of the Smarter Balanced Assessment Consortium (SBAC), a group of over 20 states working collaboratively to develop assessment aligned to the Common Core. In West Virginia, nearly 100 teachers across the state customized these standards to benefit West Virginia students and their needs
These standards are called Next Generation Content Standards and Objectives with a primary goal to recognize an agreed upon performance level for 11th grade assessment of English and mathematics. The aim is to improve college readiness in these subject areas and to reduce the number of high school students requiring developmental mathematics or English in their first year of college. The Commission and the West Virginia Department of Education are participating in the SBAC to set appropriate levels of performance to determine college readiness in those subjects.
The Commission created the statewide Higher Education Smarter Balanced Advisory Council to assist in dissemination of Smarter Balanced information and goals to campuses across West Virginia. One goal of the Advisory Council is to provide professional development for teacher education and content area faculty. A Smarter Balanced workshop was held for teacher education majors in August and was well attended with over 150 students and faculty from across the state participating. Other Advisory Council goals include generating higher education support and strengthening and expanding partnerships between higher education and K-12.
WE
ST
VIR
GIN
IAREPORT C
ARD
20
14
67
The Bridging the Gap Consortium In October 2013, West Virginia’s nine community & technical colleges received $25 million from the Department of Labor’s Trade Adjustment Assistance Community College and Career Training (TAACCCT) funding program to create the Bridging the Gap Consortium. The focus of the Bridging the Gap Consortium is to train adults, with a focus on displaced workers and veterans, for high-wage, high-demand jobs within the areas of energy, advanced manufacturing, construction and information technology through focused career pathways, flexible learning opportunities, and expanded student support services. In order to meet this goal, the state’s community and technical colleges have partnered with the state’s seven Workforce Investment Boards, the Affiliated Construction Trades, and 55 employer partners. This four-year grant-funded program is anticipated to serve approximately 1400 participants and increase credential attainment in high-demand programs of study by 58 percent.
Community and Technical College Developmental Education ReformIn 2013, Chancellor Skidmore issued a challenge to all public two-year institutions across West Virginia to phase out traditional forms of developmental education delivery and primarily offer co-requisite developmental education courses. Co-requisite developmental education enrolls students in college-level courses with the additional supports needed for students to be successful with college-level coursework and has been shown to increase the success of students who require developmental education. By the fall of 2014, 70 percent ofstudents requiring developmental education were enrolled in a co-requisite course.
Advanced Technology CenterIn the fall of 2014, a ribbon cutting ceremony at the West Virginia Regional Technology Park was held to dedicate the Advanced Technology Center (ATC) of South Central West Virginia. This facility addresses the emerging needs of West Virginia in offering a well-trained, technically advanced workforce and providing a state-of-the-art setting for collaboration in the delivery of technical programs among community and technical colleges. Built through a state-supported initiative, the center offers high-tech facilities, current resources, and technologically advanced education to continue the legacy of technical innovation in the Kanawha Valley and South Central West Virginia. The ATC also offers ample laboratory space for programs such as: Advanced Manufacturing Technology, Chemical Process Technology, Advanced Welding Technology, Computer Networking Technology, and Emergency Management Technology. A second ATC is being constructed in Fairmont under the direction of Pierpont Community and Technical College.
Workforce DevelopmentThrough the convening of different industry sectors, the Community and Technical College System engages employers to identify their critical workforce needs. These efforts have resulted in community and technical colleges throughout the state implementing new programs in Petroleum Technology, Process Technology, Advanced Manufacturing, and Instrumentation Technology. The programs support the immediate needs of the growing oil and gas, manufacturing, and chemical industry sectors. In addition, employer engagement has led to more Learn and Earn Cooperative Education Programs that provide valuable work and financial assistance for community and technical college students while completing their degree.

West Virginia Higher Education Policy Commission and Community and Technical College System of West Virginia
1018 Kanawha Boulevard, EastSuite 700Charleston, West Virginia 25301
www.wvhepc.orgwww.wvctcs.org