Selected Data for West Virginia Higher Education J. Michael Mullen WVFAA November 6, 2003.
26
Selected Data for West Selected Data for West Virginia Higher Education Virginia Higher Education J. Michael Mullen J. Michael Mullen WVFAA WVFAA November 6, 2003 November 6, 2003
-
Upload
phyllis-wells -
Category
Documents
-
view
215 -
download
1
Transcript of Selected Data for West Virginia Higher Education J. Michael Mullen WVFAA November 6, 2003.

Selected Data for West Virginia Selected Data for West Virginia Higher EducationHigher Education
J. Michael MullenJ. Michael Mullen
WVFAAWVFAANovember 6, 2003November 6, 2003

Projected Population Growth Projected Population Growth
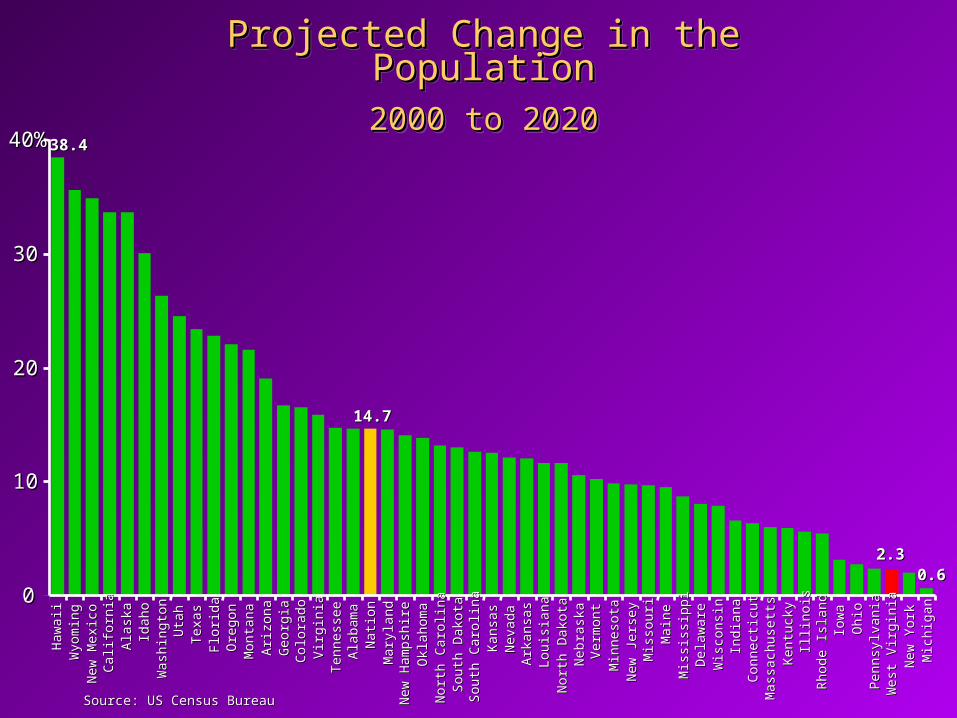
Projected Change in the PopulationProjected Change in the Population2000 to 20202000 to 2020
Projected Change in the PopulationProjected Change in the Population2000 to 20202000 to 2020
38.438.4
14.714.7
0.60.62.32.3
00
1010
2020
3030
40%40%
Haw
aii
Haw
aii
Wyo
min
gW
yom
ing
New
Mex
ico
New
Mex
ico
Cal
ifor
nia
Cal
ifor
nia
Ala
ska
Ala
ska
Idah
oId
aho
Was
hing
ton
Was
hing
ton
Uta
hU
tah
Tex
asT
exas
Flor
ida
Flor
ida
Ore
gon
Ore
gon
Mon
tana
Mon
tana
Ari
zona
Ari
zona
Geo
rgia
Geo
rgia
Col
orad
oC
olor
ado
Vir
gini
aV
irgi
nia
Ten
ness
eeT
enne
ssee
Ala
bam
aA
laba
ma
Nat
ion
Nat
ion
Mar
ylan
dM
aryl
and
New
Ham
pshi
reN
ew H
amps
hire
Okl
ahom
aO
klah
oma
Nor
th C
arol
ina
Nor
th C
arol
ina
Sout
h D
akot
aSo
uth
Dak
ota
Sout
h C
arol
ina
Sout
h C
arol
ina
Kan
sas
Kan
sas
Nev
ada
Nev
ada
Ark
ansa
sA
rkan
sas
Lou
isia
naL
ouis
iana
Nor
th D
akot
aN
orth
Dak
ota
Neb
rask
aN
ebra
ska
Ver
mon
tV
erm
ont
Min
neso
taM
inne
sota
New
Jer
sey
New
Jer
sey
Mis
sour
iM
isso
uri
Mai
neM
aine
Mis
siss
ippi
Mis
siss
ippi
Del
awar
eD
elaw
are
Wis
cons
inW
isco
nsin
Indi
ana
Indi
ana
Con
nect
icut
Con
nect
icut
Mas
sach
uset
tsM
assa
chus
etts
Ken
tuck
yK
entu
cky
Illin
ois
Illin
ois
Rho
de I
slan
dR
hode
Isl
and
Iow
aIo
wa
Ohi
oO
hio
Penn
sylv
ania
Penn
sylv
ania
Wes
t Vir
gini
aW
est V
irgi
nia
New
Yor
kN
ew Y
ork
Mic
higa
nM
ichi
gan
Source: US Census BureauSource: US Census Bureau

Projection of 18-24 Year OldsProjection of 18-24 Year Olds(Traditional College Age – from 2000 to 2025)(Traditional College Age – from 2000 to 2025)
Projection of 18-24 Year OldsProjection of 18-24 Year Olds(Traditional College Age – from 2000 to 2025)(Traditional College Age – from 2000 to 2025)
Source: US Census BureauSource: US Census Bureau
172,431
140,402
120,000
140,000
160,000
180,000
2000 2005 2010 2015 2020 2025
-18.6 % Decline
The Largest Decrease of all 50 States
-18.6 % Decline
The Largest Decrease of all 50 States
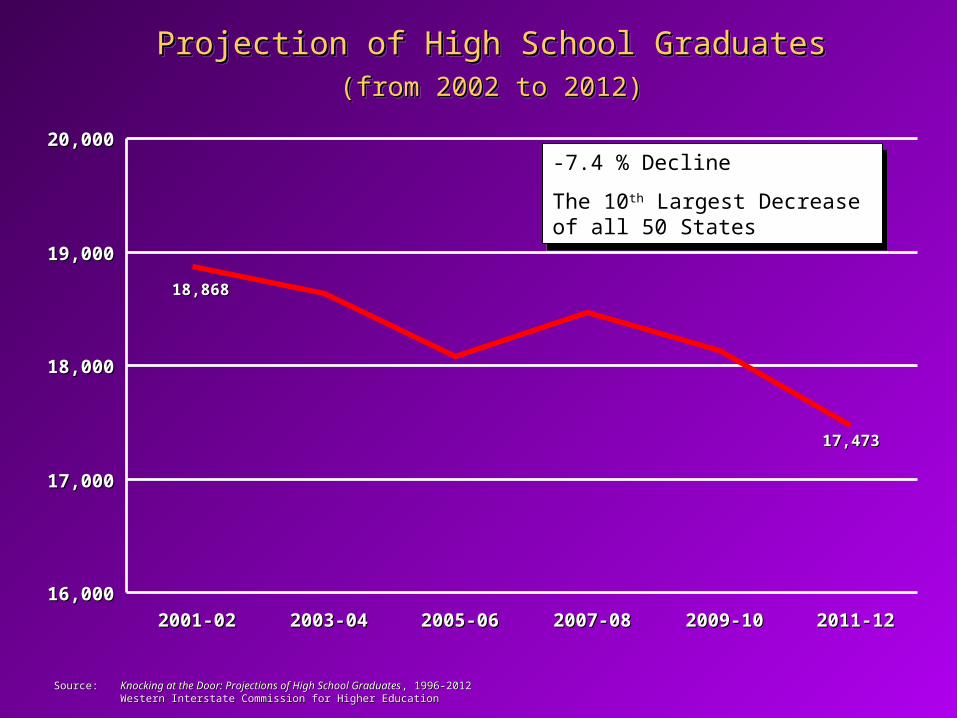
Projection of High School GraduatesProjection of High School Graduates(from 2002 to 2012)(from 2002 to 2012)
Projection of High School GraduatesProjection of High School Graduates(from 2002 to 2012)(from 2002 to 2012)
Source:Source: Knocking at the Door: Projections of High School GraduatesKnocking at the Door: Projections of High School Graduates , 1996-2012, 1996-2012Western Interstate Commission for Higher EducationWestern Interstate Commission for Higher Education
18,86818,868
17,47317,473
16,00016,000
17,00017,000
18,00018,000
19,00019,000
20,00020,000
2001-022001-02 2003-042003-04 2005-062005-06 2007-082007-08 2009-102009-10 2011-122011-12
-7.4 % Decline
The 10th Largest Decrease of all 50 States
-7.4 % Decline
The 10th Largest Decrease of all 50 States

Source: US Census BureauSource: US Census Bureau
Projected West Virginia Population Growth Projected West Virginia Population Growth Number Change from 2000 to 2020 – By RaceNumber Change from 2000 to 2020 – By Race
-52,439
-28,968
-86,299
35,468
119,575
14
-31 -1,151
4,308 1,6061,592 835 2,258 3,101 1,872
-90,000
-60,000
-30,000
0
30,000
60,000
90,000
120,000
0 to 17 18 to 24 25 to 44 45 to 64 65 and Older
White Black Hispanic

ENROLLMENT PATTERNS
0%
10%
20%
30%
40%
50%
60%
70%
80%
90%
National WV ALL Public Four-year
Two-year
Full-time
Part-time

Educational Attainment Educational Attainment

Percent of 18 to 24 Year Olds with at Least a High Percent of 18 to 24 Year Olds with at Least a High School Diploma - 2000 (%)School Diploma - 2000 (%)
Percent of 18 to 24 Year Olds with at Least a High Percent of 18 to 24 Year Olds with at Least a High School Diploma - 2000 (%)School Diploma - 2000 (%)
85.885.8
78.278.2
74.774.7
40%40%
90%90%
Haw
aii
Haw
aii
Nor
th D
akot
aN
orth
Dak
ota
Ver
mon
tV
erm
ont
Mas
sach
uset
tsM
assa
chus
etts
Iow
aIo
wa
Rho
de I
slan
dR
hode
Isl
and
Uta
hU
tah
Neb
rask
aN
ebra
ska
Penn
sylv
ania
Penn
sylv
ania
Mar
ylan
dM
aryl
and
Vir
gini
aV
irgi
nia
Min
neso
taM
inne
sota
Wyo
min
gW
yom
ing
Mai
neM
aine
Wis
cons
inW
isco
nsin
Mon
tana
Mon
tana
Kan
sas
Kan
sas
Con
nect
icut
Con
nect
icut
Sout
h D
akot
aSo
uth
Dak
ota
Wes
t Vir
gini
aW
est V
irgi
nia
New
Ham
pshi
reN
ew H
amps
hire
Del
awar
eD
elaw
are
Idah
oId
aho
Ala
ska
Ala
ska
Ohi
oO
hio
Indi
ana
Indi
ana
Mic
higa
nM
ichi
gan
Mis
sour
iM
isso
uri
New
Jer
sey
New
Jer
sey
New
Yor
kN
ew Y
ork
Illin
ois
Illin
ois
Ark
ansa
sA
rkan
sas
Was
hing
ton
Was
hing
ton
Col
orad
oC
olor
ado
Ten
ness
eeT
enne
ssee
Ken
tuck
yK
entu
cky
Okl
ahom
aO
klah
oma
Nat
ion
Nat
ion
Sout
h C
arol
ina
Sout
h C
arol
ina
Nor
th C
arol
ina
Nor
th C
arol
ina
Ore
gon
Ore
gon
Lou
isia
naL
ouis
iana
Ala
bam
aA
laba
ma
Flor
ida
Flor
ida
Mis
siss
ippi
Mis
siss
ippi
Cal
ifor
nia
Cal
ifor
nia
New
Mex
ico
New
Mex
ico
Geo
rgia
Geo
rgia
Ari
zona
Ari
zona
Tex
asT
exas
Nev
ada
Nev
ada
66.766.7
Source: US Census BureauSource: US Census Bureau

Percent of Adults 25 and Older with at Least a Percent of Adults 25 and Older with at Least a High School Diploma – 2000 (%)High School Diploma – 2000 (%)
Percent of Adults 25 and Older with at Least a Percent of Adults 25 and Older with at Least a High School Diploma – 2000 (%)High School Diploma – 2000 (%)
88.388.3
75.275.2
80.480.4
72.972.9
40%40%
100%100%
Ala
ska
Ala
ska
Wyo
min
gW
yom
ing
Min
neso
taM
inne
sota
Uta
hU
tah
New
Ham
pshi
reN
ew H
amps
hire
Mon
tana
Mon
tana
Was
hing
ton
Was
hing
ton
Col
orad
oC
olor
ado
Neb
rask
aN
ebra
ska
Ver
mon
tV
erm
ont
Iow
aIo
wa
Kan
sas
Kan
sas
Mai
neM
aine
Ore
gon
Ore
gon
Wis
cons
inW
isco
nsin
Mas
sach
uset
tsM
assa
chus
etts
Idah
oId
aho
Haw
aii
Haw
aii
Sout
h D
akot
aSo
uth
Dak
ota
Con
nect
icut
Con
nect
icut
Nor
th D
akot
aN
orth
Dak
ota
Mar
ylan
dM
aryl
and
Mic
higa
nM
ichi
gan
Ohi
oO
hio
Del
awar
eD
elaw
are
Indi
ana
Indi
ana
New
Jer
sey
New
Jer
sey
Penn
sylv
ania
Penn
sylv
ania
Vir
gini
aV
irgi
nia
Illin
ois
Illin
ois
Mis
sour
iM
isso
uri
Ari
zona
Ari
zona
Nev
ada
Nev
ada
Okl
ahom
aO
klah
oma
Nat
ion
Nat
ion
Flor
ida
Flor
ida
New
Yor
kN
ew Y
ork
New
Mex
ico
New
Mex
ico
Geo
rgia
Geo
rgia
Nor
th C
arol
ina
Nor
th C
arol
ina
Rho
de I
slan
dR
hode
Isl
and
Cal
ifor
nia
Cal
ifor
nia
Sout
h C
arol
ina
Sout
h C
arol
ina
Ten
ness
eeT
enne
ssee
Tex
asT
exas
Ark
ansa
sA
rkan
sas
Ala
bam
aA
laba
ma
Wes
t Vir
gini
aW
est V
irgi
nia
Lou
isia
naL
ouis
iana
Ken
tuck
yK
entu
cky
Mis
siss
ippi
Mis
siss
ippi
Source: US Census BureauSource: US Census Bureau
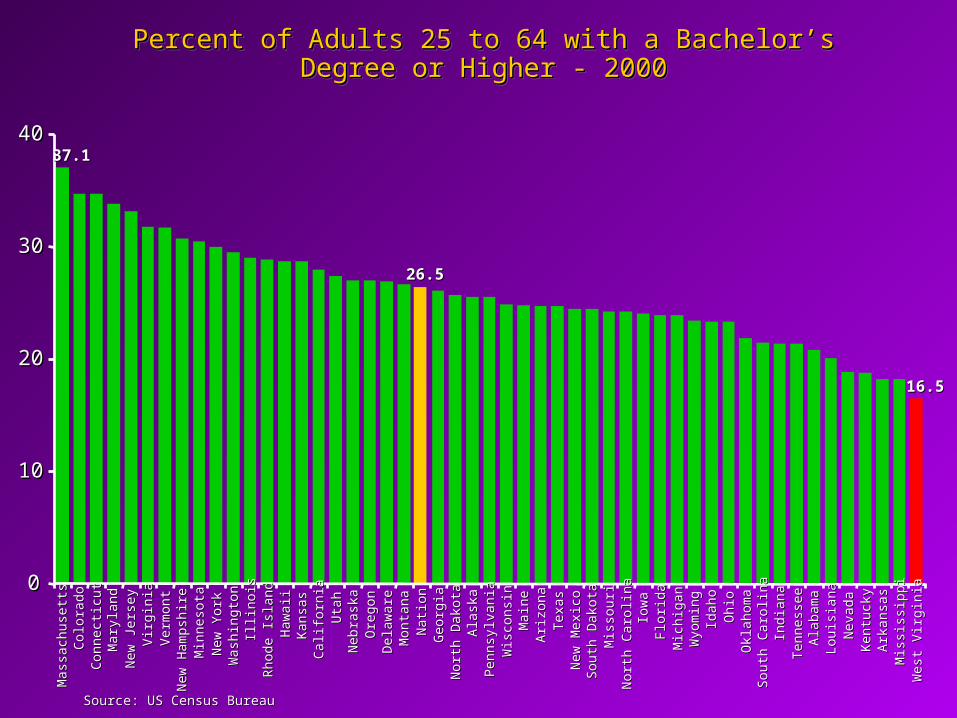
Percent of Adults 25 to 64 with a Bachelor’s Degree Percent of Adults 25 to 64 with a Bachelor’s Degree or Higher - 2000or Higher - 2000
Percent of Adults 25 to 64 with a Bachelor’s Degree Percent of Adults 25 to 64 with a Bachelor’s Degree or Higher - 2000or Higher - 2000
37.137.1
26.526.5
16.516.5
00
1010
2020
3030
4040
Mas
sach
uset
tsM
assa
chus
etts
Col
orad
oC
olor
ado
Con
nect
icut
Con
nect
icut
Mar
ylan
dM
aryl
and
New
Jer
sey
New
Jer
sey
Vir
gini
aV
irgi
nia
Ver
mon
tV
erm
ont
New
Ham
pshi
reN
ew H
amps
hire
Min
neso
taM
inne
sota
New
Yor
kN
ew Y
ork
Was
hing
ton
Was
hing
ton
Illin
ois
Illin
ois
Rho
de I
slan
dR
hode
Isl
and
Haw
aii
Haw
aii
Kan
sas
Kan
sas
Cal
ifor
nia
Cal
ifor
nia
Uta
hU
tah
Neb
rask
aN
ebra
ska
Ore
gon
Ore
gon
Del
awar
eD
elaw
are
Mon
tana
Mon
tana
Nat
ion
Nat
ion
Geo
rgia
Geo
rgia
Nor
th D
akot
aN
orth
Dak
ota
Ala
ska
Ala
ska
Penn
sylv
ania
Penn
sylv
ania
Wis
cons
inW
isco
nsin
Mai
neM
aine
Ari
zona
Ari
zona
Tex
asT
exas
New
Mex
ico
New
Mex
ico
Sout
h D
akot
aSo
uth
Dak
ota
Mis
sour
iM
isso
uri
Nor
th C
arol
ina
Nor
th C
arol
ina
Iow
aIo
wa
Flor
ida
Flor
ida
Mic
higa
nM
ichi
gan
Wyo
min
gW
yom
ing
Idah
oId
aho
Ohi
oO
hio
Okl
ahom
aO
klah
oma
Sout
h C
arol
ina
Sout
h C
arol
ina
Indi
ana
Indi
ana
Ten
ness
eeT
enne
ssee
Ala
bam
aA
laba
ma
Lou
isia
naL
ouis
iana
Nev
ada
Nev
ada
Ken
tuck
yK
entu
cky
Ark
ansa
sA
rkan
sas
Mis
siss
ippi
Mis
siss
ippi
Wes
t Vir
gini
aW
est V
irgi
nia
Source: US Census BureauSource: US Census Bureau

Disparities in Educational Disparities in Educational Attainment, Income, and Poverty Attainment, Income, and Poverty
by County by County

Hancock
Brooke
Ohio
Roane
Putnam
Raleigh
Pocahontas
Berkeley
Morgan
Hampshire
Mineral
Grant
Randolph
DoddridgeHarrison
Ritchie
MonongaliaWetzel
Cabell
Barbour
Boone
Braxton
Calhoun
C lay
Fayette
Gilmer
Greenbrier
Hardy
J ackson
J efferson
Kanawha
Lewis
Lincoln
Logan
Marion
Marshall
Mason
McdowellMercer
Mingo
Monroe
Nicholas
Pendleton
PleasantsPreston
Summers
Taylor
Tucker
Tyler
Upshur
Wayne
Webster
Wirt
Wood
Wyoming
Percent of 18-24 Year Olds With at Least aHigh School Diploma, 2000
West V irginia = 78.2%Source: US Census Bureau, 2000 Census
84.8% to 93.0%76.8% to 84.8%72.2% to 76.8%67.0% to 72.2%58.2% to 67.0%

Hancock
Brooke
Ohio
Roane
Putnam
Raleigh
Pocahontas
Berkeley
Morgan
Hampshire
Mineral
Grant
Randolph
DoddridgeHarrison
Ritchie
MonongaliaWetzel
Cabell
Barbour
Boone
Braxton
Calhoun
C lay
Fayette
Gilmer
Greenbrier
Hardy
J ackson
J efferson
Kanawha
Lewis
Lincoln
Logan
Marion
Marshall
Mason
McdowellMercer
Mingo
Monroe
Nicholas
Pendleton
PleasantsPreston
Summers
Taylor
Tucker
Tyler
Upshur
Wayne
Webster
Wirt
Wood
Wyoming
Percent of Population 25 Years and Older With at Leasta High School Diploma, 2000
West V irginia = 75.2%Source: US Census Bureau, 2000 Census
80.3% to 83.8%75.8% to 80.3%70.8% to 75.8%63.7% to 70.8%50.0% to 63.7%

Hancock
Brooke
Ohio
Roane
Putnam
Raleigh
Pocahontas
Berkeley
Morgan
Hampshire
Mineral
Grant
Randolph
DoddridgeHarrison
Ritchie
MonongaliaWetzel
Cabell
Barbour
Boone
Braxton
Calhoun
C lay
Fayette
Gilmer
Greenbrier
Hardy
J ackson
J efferson
Kanawha
Lewis
Lincoln
Logan
Marion
Marshall
Mason
McdowellMercer
Mingo
Monroe
Nicholas
Pendleton
PleasantsPreston
Summers
Taylor
Tucker
Tyler
Upshur
Wayne
Webster
Wirt
Wood
Wyoming
Percent of 25-64 Year Olds With at Least aBaccalaureate Degree, 2000
West V irginia = 16.5%Source: US Census Bureau, 2000 Census
22.0% to 36.0%13.9% to 22.0%10.9% to 13.9%
8.1% to 10.9%5.9% to 8.1%

Hancock
Brooke
Ohio
Roane
Putnam
Raleigh
Pocahontas
Berkeley
Morgan
Hampshire
Mineral
Grant
Randolph
DoddridgeHarrison
Ritchie
MonongaliaWetzel
Cabell
Barbour
Boone
Braxton
Calhoun
C lay
Fayette
Gilmer
Greenbrier
Hardy
J ackson
J efferson
Kanawha
Lewis
Lincoln
Logan
Marion
Marshall
Mason
McdowellMercer
Mingo
Monroe
Nicholas
Pendleton
PleasantsPreston
Summers
Taylor
Tucker
Tyler
Upshur
Wayne
Webster
Wirt
Wood
Wyoming
Percent of Families Living in Poverty, 1999
West V irginia = 13.9%Source: US Census Bureau, 2000 Census
7.1% to 9.5%9.5% to 12.6%
12.6% to 16.3%16.3% to 20.8%20.8% to 33.8%

Hancock
Brooke
Ohio
Roane
Putnam
Raleigh
Pocahontas
Berkeley
Morgan
Hampshire
Mineral
Grant
Randolph
DoddridgeHarrison
Ritchie
MonongaliaWetzel
Cabell
Barbour
Boone
Braxton
Calhoun
C lay
Fayette
Gilmer
Greenbrier
Hardy
J ackson
J efferson
Kanawha
Lewis
Lincoln
Logan
Marion
Marshall
Mason
McdowellMercer
Mingo
Monroe
Nicholas
Pendleton
PleasantsPreston
Summers
Taylor
Tucker
Tyler
Upshur
Wayne
Webster
Wirt
Wood
Wyoming
Per Capita Personal Income, 1999
West V irginia = $16,477Source: US Census Bureau, 2000 Census
$17,982 to $20,471$16,247 to $17,982$14,102 to $16,247$12,445 to $14,102$10,174 to $12,445
Transition and Completion Transition and Completion Rates – From High School to Rates – From High School to
College CompletionCollege Completion

86.1
74.8
51.0
67.1
0
20
40
60
80
100
New
Jer
sey
Nor
th D
akot
aU
tah
Neb
rask
aM
inne
sota
Iow
aV
erm
ont
Mon
tana
Wis
cons
inC
onne
ctic
utId
aho
Mai
neW
yom
ing
Penn
sylv
ania
Mas
sach
uset
tsW
est V
irgi
nia
Kan
sas
Sout
h D
akot
aN
ew H
amps
hire
Vir
gini
aA
rkan
sas
Mar
ylan
dM
isso
uri
Okl
ahom
aIl
linoi
sW
ashi
ngto
nC
olor
ado
Ohi
oR
hode
Isl
and
Nev
ada
Cal
ifor
nia
Mic
higa
nIn
dian
aO
rego
nN
atio
nK
entu
cky
Haw
aii
Ala
ska
Tex
asD
elaw
are
New
Mex
ico
Ari
zona
Ala
bam
aN
orth
Car
olin
aN
ew Y
ork
Lou
isia
naM
issi
ssip
piFl
orid
aT
enne
ssee
Geo
rgia
Sout
h C
arol
ina
High School Graduation Rates – Public HS Graduates as a High School Graduation Rates – Public HS Graduates as a Percent of 9Percent of 9thth Graders Four Years Earlier (%) - 2000 Graders Four Years Earlier (%) - 2000
Source: Tom Mortenson, Postsecondary Opportunity

65.4
53.0
38.5
22.3
20
30
40
50
60
70
Rho
de I
slan
dN
ew H
amps
hire
Mas
sach
uset
tsPe
nnsy
lvan
iaD
elaw
are
Iow
aM
aryl
and
Was
hing
ton
Ver
mon
tN
ew J
erse
yC
onne
ctic
utV
irgi
nia
Cal
ifor
nia
Nor
th C
arol
ina
Mai
neM
ichi
gan
Illin
ois
New
Yor
kW
isco
nsin
Indi
ana
Min
neso
taFl
orid
aN
atio
nSo
uth
Car
olin
aU
tah
Wyo
min
gO
rego
nO
hio
Col
orad
oM
isso
uri
Ari
zona
Kan
sas
Ten
ness
eeN
ebra
ska
Tex
asA
laba
ma
Haw
aii
Mis
siss
ippi
Nor
th D
akot
aSo
uth
Dak
ota
Nev
ada
Geo
rgia
Mon
tana
New
Mex
ico
Ken
tuck
yW
est V
irgi
nia
Okl
ahom
aId
aho
Ark
ansa
sL
ouis
iana
Ala
ska
Source: NCES-IPEDS, Graduation Rate Survey
Graduation Rates – Percent of Bachelor’s Students Graduating Graduation Rates – Percent of Bachelor’s Students Graduating within Six Years (%) - 2000within Six Years (%) - 2000

63.8
42.4
30.0
11.0
0
10
20
30
40
50
60
70
Sout
h D
akot
aM
aine
Ari
zona
Penn
sylv
ania
Lou
isia
naW
yom
ing
New
Ham
pshi
reC
alif
orni
aId
aho
Wes
t Vir
gini
aN
ebra
ska
Mis
sour
iV
erm
ont
Uta
hC
olor
ado
Iow
aFl
orid
aM
inne
sota
Kan
sas
Wis
cons
inM
onta
naA
lask
aN
evad
aN
orth
Dak
ota
Was
hing
ton
Nat
ion
New
Yor
kM
issi
ssip
piIn
dian
aG
eorg
iaIl
linoi
sT
enne
ssee
Con
nect
icut
Ore
gon
Haw
aii
Okl
ahom
aV
irgi
nia
Ala
bam
aN
orth
Car
olin
aK
entu
cky
Ohi
oA
rkan
sas
New
Mex
ico
Mas
sach
uset
tsM
ichi
gan
Sout
h C
arol
ina
Tex
asN
ew J
erse
yM
aryl
and
Del
awar
eR
hode
Isl
and
Source: NCES-IPEDS, Graduation Rate Survey
Graduation Rates – Percent of Associate Students at Two-Year Graduation Rates – Percent of Associate Students at Two-Year Colleges Graduating within Three Years (%) - 2000Colleges Graduating within Three Years (%) - 2000

Student PipelineStudent Pipeline
Of 100 9Of 100 9thth Graders, How Many . . Graders, How Many . . . .
Student PipelineStudent Pipeline
Of 100 9Of 100 9thth Graders, How Many . . Graders, How Many . . . . 8484
5858
2828
38.838.8
6767
3838
2626
1818
26.726.7
7575
3939
2727
151516.616.6
4242
00
100100
Graduate fromGraduate fromHigh SchoolHigh School
DirectlyDirectly EnrollEnrollSophomore YearSophomore Year
Graduate withinGraduate within150%150% 25 to 44 with a25 to 44 with a
Bachelor'sBachelor's
Best Performing StateBest Performing State US AverageUS Average West VirginiaWest Virginia
Within 4 YearsWithin 4 YearsEnter CollegeEnter College
PopulationPopulation
Sources: Tom Mortenson, ACT, NCES-IPEDS Graduation Rate Survey, US Census BureauSources: Tom Mortenson, ACT, NCES-IPEDS Graduation Rate Survey, US Census Bureau

College Participation College Participation

West Virginia = 43.7%Source: West Virginia Higher Education Policy Commission
Hancock
Brooke
Ohio
Roane
Putnam
Raleigh
Pocahontas
Berkeley
Morgan
Hampshire
Mineral
Grant
Randolph
DoddridgeHarrison
Ritchie
MonongaliaWetzel
Cabell
Barbour
Boone
Braxton
Calhoun
Clay
Fayette
Gilmer
Greenbrier
Hardy
Jackson
Jefferson
Kanawha
Lewis
Lincoln
Logan
Marion
Marshall
Mason
Mcdowell Mercer
Mingo
Monroe
Nicholas
Pendleton
Pleasants
Preston
Summers
Taylor
Tucker
Tyler
Upshur
Wayne
Webster
Wirt
Wood
Wyoming
First Time Full-Time Freshmen as a Percent ofHigh School Graduates, 2000
53.6% to 60.0%45.3% to 53.6%35.7% to 45.3%30.5% to 35.7%21.6% to 30.5%

Hancock
Brooke
Ohio
Roane
Putnam
Raleigh
Pocahontas
Berkeley
Morgan
Hampshire
Mineral
Grant
Randolph
DoddridgeHarrison
Ritchie
MonongaliaWetzel
Cabell
Barbour
Boone
Braxton
Calhoun
Clay
Fayette
Gilmer
Greenbrier
Hardy
J ackson
J efferson
Kanawha
Lewis
Lincoln
Logan
Marion
Marshall
Mason
Mcdowell Mercer
Mingo
Monroe
Nicholas
Pendleton
Pleasants
Preston
Summers
Taylor
Tucker
Tyler
Upshur
Wayne
Webster
Wirt
Wood
Wyoming
Part-Time Undergraduates as a Percent of25-44 Year-Olds, 2000
West Virginia = 3.0%Source: West Virginia Higher Education Policy Commission.U.S. Census Bureau, 2000 Census
3.8% to 4.5%3.3% to 3.8%2.6% to 3.3%2.1% to 2.6%1.2% to 2.1%

Part-Time Undergraduate Enrollment as a Percent of Part-Time Undergraduate Enrollment as a Percent of 25 to 44 Year Olds (%) - 200025 to 44 Year Olds (%) - 2000
Source: NCES-IPEDS, US Census Bureau
10.8
3.6
6.2
3.3
0
3
6
9
12
Ari
zona
Cal
ifor
nia
Uta
hN
ew M
exic
oK
ansa
sA
lask
aW
yom
ing
Nev
ada
Illin
ois
Ore
gon
Mic
higa
nN
ebra
ska
Col
orad
oFl
orid
aM
isso
uri
Was
hing
ton
Rho
de I
slan
dW
isco
nsin
Nat
ion
Mar
ylan
dT
exas
Min
neso
taV
irgi
nia
Iow
aO
klah
oma
Del
awar
eM
aine
Nor
th C
arol
ina
Haw
aii
Mas
sach
uset
tsA
laba
ma
Con
nect
icut
Idah
oO
hio
Sout
h D
akot
aV
erm
ont
Indi
ana
Sout
h C
arol
ina
New
Ham
pshi
reN
ew J
erse
yT
enne
ssee
Ark
ansa
sN
ew Y
ork
Ken
tuck
yG
eorg
iaL
ouis
iana
Mis
siss
ippi
Nor
th D
akot
aW
est V
irgi
nia
Penn
sylv
ania
Mon
tana


![Meet mullen[1]](https://static.fdocuments.us/doc/165x107/54519d3aaf795911068b5332/meet-mullen1.jpg)