West Melbourne Waterfront Development Plan Integrated ... fileWest Melbourne Waterfront Development...
154
West Melbourne Waterfront Development Plan Integrated Transport and Access Plan Client // WMW Developments Pty Ltd Office // VIC Reference // 14M2307000 Date // 21/08/15
Transcript of West Melbourne Waterfront Development Plan Integrated ... fileWest Melbourne Waterfront Development...
West Melbourne Waterfront
Development Plan
Integrated Transport and Access Plan
Client // WMW Developments Pty Ltd
Office // VIC
Reference // 14M2307000
Date // 21/08/15
© GTA Consultants (GTA Consultants (VIC) Pty Ltd) 2014
The information contained in this document is confidential and
intended solely for the use of the client for the purpose for which it has
been prepared and no representation is made or is to be implied as
being made to any third party. Use or copying of this document in
whole or in part without the written permission of GTA Consultants
constitutes an infringement of copyright. The intellectual property
contained in this document remains the property of GTA Consultants.
Bla
nk R
ep
ort
(140829 v
1.6
)
West Melbourne Waterfront
Development Plan
Integrated Transport and Access Plan
Issue: Final 21/08/15
Client: WMW Developments Pty Ltd
Reference: 14M2307000
GTA Consultants Office: VIC
Quality Record
Issue Date Description Prepared By Checked By Approved By Signed
A-Dr 21/11/14 Preliminary Draft
for discussion Rory Rathborne Tom Courtice
Reece
Humphreys
A-Dr2 25/11/14 Draft Final Rory Rathborne Tom Courtice Reece
Humphreys
A 3/12/14 Final Rory Rathborne Tom Courtice Reece
Humphreys
B 21/08/15 Final Rory Rathborne Tom Courtice Reece
Humphreys
14M2307000 // 21/08/15
Integrated Transport and Access Plan // Issue: Final
West Melbourne Waterfront, Development Plan
Executive Summary
A Planning Scheme Amendment and development plan is currently being sought for land at 156
– 250 Kensington Road, known as the West Melbourne Waterfront development. The proposal
includes a mix of residential, commercial and retail uses on the 2.8ha site.
This Integrated Transport and Access Plan (ITAP) has been prepared to address the needs of all
transport network users and modes of transport for the proposed developments. It incorporates
the key findings and recommendations of a separate Transport Impact Assessment Report (TIAR)
which is provided as an Annex to this report.
A key objective of the site response and associated mitigating treatments documented within
this ITAP is the intent to increase the ability and likelihood of residents and visitors to use active
travel or public transport modes.
The review of the existing situation for neighbouring suburbs indicates a downwards trend in car
ownership, with a shift towards public transport and active travel. This development provides a
clear opportunity to build on this trend in an urban environment which will require an increasingly
efficient movement network amid increasing density, which is consistent with the broader intent
of the ‘expanded central city’ concept as part of Plan Melbourne, as well as providing an
important ‘bookend’ to the future development of the Dynon Precinct.
The analysis undertaken as part of the TIAR indicates that the sites access points on Kensington
Road will be able to accommodate the expected traffic generation. It also suggests that the
Kensington Road/Dynon Road and Epsom Road/Kensington Road/Macauley Road intersections
are currently at capacity. Options to improve these intersections do exist however any
improvements will require consultation with stakeholders and will also require input on the
broader requirements of the precinct. Notwithstanding, these issues are not considered reasons
as to why approval of this development plan should not proceed.
In this regard, a range of works and measures, and the stakeholders considered responsible for
their implementation, have been identified in association with the development based on the
principles of ‘need’, ‘nexus’, ‘equity’ and ‘accountability’. These works and measures are
outlined in detail in this ITAP, with the approach generally including:
A ‘wide lens’ to transport and access solutions, including discussion of issues outside the
control or responsibility of the developer, but which can be addressed or improved by
the development and its proposed projects to assist with wider integration with the
transport network
Creation of an environment that supports the use of sustainable and active transport,
through a range of on-site infrastructure, links to external networks and provision of high
amenity, pedestrian and bicycle priority public realm within the development.
A focus on user needs to inform the design, placement and execution of key
sustainable transport elements, to ensure they are well-considered from a user point of
view.
Creation of a safe and vibrant public realm, where walking and cycling will be the
modes of choice. Our approach within the site is informed by the ‘naked streets’
philosophy (outlined in the summary of key policy directions), where low speeds and
negotiation between modes is encouraged.

14M2307000 // 21/08/15
Integrated Transport and Access Plan // Issue: Final
West Melbourne Waterfront, Development Plan
Mitigation of transport network impacts caused by the development under an ‘all
modes’ approach, that seeks to balance network priorities and needs at key
surrounding intersections, rather than just traffic flow.
The works and measures recommended in the ITAP are consistent with an overall transport
approach for the proposed development that seeks to improve the accessibility, safety and
amenity of the site for public and active travel modes ahead of the private motor vehicle. This is
supported by improvements to bicycle and pedestrian paths, bus priority measures and related
works.
A summary of the works and measures proposed for the development are included in the table
below.
Summary of Transport and Access Recommendations
# Project P
ed
est
ria
n
Cy
clin
g
LATM
[1
]
Sta
tuto
ry
Pu
blic
Tra
nsp
ort
Ro
ad
Ne
two
rk
Ap
pro
va
l
Au
tho
rity
Tim
ing
Walking
P.1 Construct pedestrian footpaths on both sides
of all internal roads
Applicant
At construction
of adjacent
Stages
P.2 Implement pedestrian priority crossings
adjacent the internal T-intersection for the
supermarket access as shown in Figure 6.2
Applicant At construction
of adjacent
Stages
P.3
Implement raised threshold pedestrian
crossing points at the intersection of site
access roads with Kensington Road as shown
in Figure 6.2
Applicant
At time of
access road
construction
P.4 Provide signalised pedestrian crossings on the
north and east approaches of the primary
site access intersection as shown in Figure 6.2.
Applicant Stage 2
P.5
Widen the pedestrian footpath on the north
west side of Kensington Road, under the rail
underpass
Applicant Stage 1
Cycling
C.1
Construct an interim cycling link (shared
path) between Kensington Road and the
Maribyrnong River Trail
Applicant Stage 1
C.2
Construct the ‘main street’ including provision
for bicycles in carriageway between
Kensington Road and the Maribyrnong River
Trail, as shown in Figure 6.2
Applicant Stage 2
C.3
Provide resident and employee bicycle
parking in secure locations throughout the
development in accordance with
requirements under Clause 52.34 of the
Planning Scheme
Applicant
At permit
application
stage
C.4 Provide visitor bicycle parking in accordance
with Clause 52.34 of the Planning Scheme
Applicant
At permit
application
stage
C.5
Investigate the provision of share bicycles
which may be utilised by future residents and
visitors (as part of wider bicycle share
scheme)
Applicant Upon
Construction
14M2307000 // 21/08/15
Integrated Transport and Access Plan // Issue: Final
West Melbourne Waterfront, Development Plan
# Project
Pe
de
stria
n
Cy
clin
g
LATM
[1
]
Sta
tuto
ry
Pu
blic
Tra
nsp
ort
Ro
ad
Ne
two
rk
Ap
pro
va
l
Au
tho
rity
Tim
ing
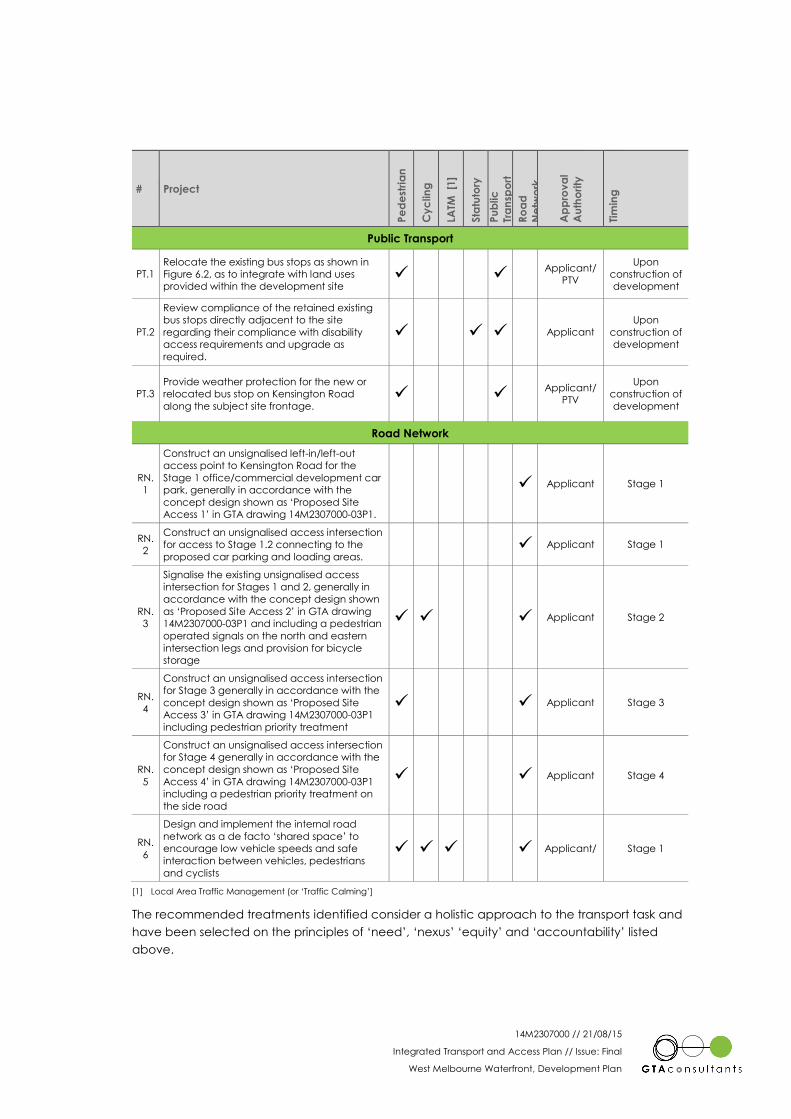
Public Transport
PT.1 Relocate the existing bus stops as shown in
Figure 6.2, as to integrate with land uses
provided within the development site
Applicant/
PTV
Upon
construction of
development
PT.2
Review compliance of the retained existing
bus stops directly adjacent to the site
regarding their compliance with disability
access requirements and upgrade as
required.
Applicant
Upon
construction of
development
PT.3 Provide weather protection for the new or
relocated bus stop on Kensington Road
along the subject site frontage.
Applicant/
PTV
Upon
construction of
development
Road Network
RN.
1
Construct an unsignalised left-in/left-out
access point to Kensington Road for the
Stage 1 office/commercial development car
park, generally in accordance with the
concept design shown as ‘Proposed Site
Access 1’ in GTA drawing 14M2307000-03P1.
Applicant Stage 1
RN.
2
Construct an unsignalised access intersection
for access to Stage 1.2 connecting to the
proposed car parking and loading areas.
Applicant Stage 1
RN.
3
Signalise the existing unsignalised access
intersection for Stages 1 and 2, generally in
accordance with the concept design shown
as ‘Proposed Site Access 2’ in GTA drawing
14M2307000-03P1 and including a pedestrian
operated signals on the north and eastern
intersection legs and provision for bicycle
storage
Applicant Stage 2
RN.
4
Construct an unsignalised access intersection
for Stage 3 generally in accordance with the
concept design shown as ‘Proposed Site
Access 3’ in GTA drawing 14M2307000-03P1
including pedestrian priority treatment
Applicant Stage 3
RN.
5
Construct an unsignalised access intersection
for Stage 4 generally in accordance with the
concept design shown as ‘Proposed Site
Access 4’ in GTA drawing 14M2307000-03P1
including a pedestrian priority treatment on
the side road
Applicant Stage 4
RN.
6
Design and implement the internal road
network as a de facto ‘shared space’ to
encourage low vehicle speeds and safe
interaction between vehicles, pedestrians
and cyclists
Applicant/ Stage 1
[1] Local Area Traffic Management (or ‘Traffic Calming’]
The recommended treatments identified consider a holistic approach to the transport task and
have been selected on the principles of ‘need’, ‘nexus’ ‘equity’ and ‘accountability’ listed
above.
14M2307000 // 21/08/15
Integrated Transport and Access Plan // Issue: Final
West Melbourne Waterfront, Development Plan
Table of Contents
1. Introduction 1
1.1 Background 1
1.2 Purpose of this Report 2
1.3 Scope of this Report 2
1.4 References 3
2. Urban Context 4
2.1 Site Location 4
3. Policy Context 5
3.1 Overview of Key Policy Directions 5
3.2 State Policy 7
3.3 Local Policy 11
4. Existing Conditions 14
4.1 Overview 14
4.2 Travel Behaviour Characteristics 14
4.3 Public Transport Network 19
4.4 Bicycle Infrastructure 21
4.5 Existing Pedestrian Infrastructure 22
4.6 Road Network 23
5. Strategic Response 26
5.1 Principles 26
5.2 Modal Hierarchy 27
6. Development Proposal 28
6.1 Development Schedule 28
6.2 Transport Network 29
6.3 Statutory Considerations 34
7. Summary of Recommendations 37
8. Implementation, Monitoring and Review 39
Appendices
A: Transport Impact Assessment
Figures
Figure 1.1: Subject Site and its Environs 1
14M2307000 // 21/08/15
Integrated Transport and Access Plan // Issue: Final
West Melbourne Waterfront, Development Plan
Figure 1.2: Land Zoning Map 2
Figure 2.1: Transport Context 4
Figure 3.1: Plan Melbourne – Expanded Central City 7
Figure 3.2: Plan Melbourne – Transport Projects 8
Figure 3.3: SmartRoads Network Operating Plan 9
Figure 3.4: VicRoads Principal Bicycle Network 10
Figure 3.5: City of Melbourne Transport Strategy – Proposed Tram Network 2030 12
Figure 3.6: City of Melbourne Transport Strategy – Proposed Public Transport and
Pedestrian Priority 12
Figure 3.7: City of Melbourne Current and Proposed Bicycle Network 13
Figure 4.1: Transport Network Overview 14
Figure 4.2: Geographical Area - Kensington 15
Figure 4.3: Mode Share Data for Kensington Residents – ABS 2011 Method of Travel to
Work 16
Figure 4.4: Mode Share Data for Employees of Kensington – ABS 2011 Method of Travel to
Work 17
Figure 4.5: Maribyrnong Statistical Local Area 18
Figure 4.6: VISTA 09-10 – Resident Mode Splits for all trip types 18
Figure 4.7: Number of Vehicles Owned 19
Figure 4.8: Nearby Public Transport Services 20
Figure 4.9: Existing Bus Stop on Kensington Road 20
Figure 4.10: Kensington Road On-Road Bicycle Lanes 21
Figure 4.11: Childers Street Off-Road Shared Path 21
Figure 4.12: Pedestrian Conditions at the Rail Underpass 22
Figure 4.13: Proposed Underpass Treatment for Pedestrians 23
Figure 4.14: Example of Merging Shared and Pedestrian Paths 23
Figure 4.15: Kensington Road Looking Southwest 23
Figure 4.16: Kensington Road Looking Northeast 23
Figure 4.17: Casualty Accident Locations 24
Figure 6.1: Indicative Land Use and Staging Plan 28
Figure 6.2: Proposed Transport Network 29
Tables
Table 6.1: Indicative Development Schedule 28
Table 6.2: Pedestrian Network Improvements Summary 30
Table 6.3: Cycling Network Improvements Summary 31
Table 6.4: Public Transport Improvements Summary 31
Table 6.5: Road Network Improvements Summary 32
Table 6.6: Bicycle Facility Provision Schedule 35

14M2307000 // 21/08/15
Integrated Transport and Access Plan // Issue: Final
West Melbourne Waterfront, Development Plan
Table 6.7: Table of Potential Green Travel Plan Initiatives 36
Table 7.1: Summary of Recommendations 37
14M2307000 // 21/08/15
Integrated Transport and Access Plan // Issue: Final
West Melbourne Waterfront, Development Plan 1
1. Introduction
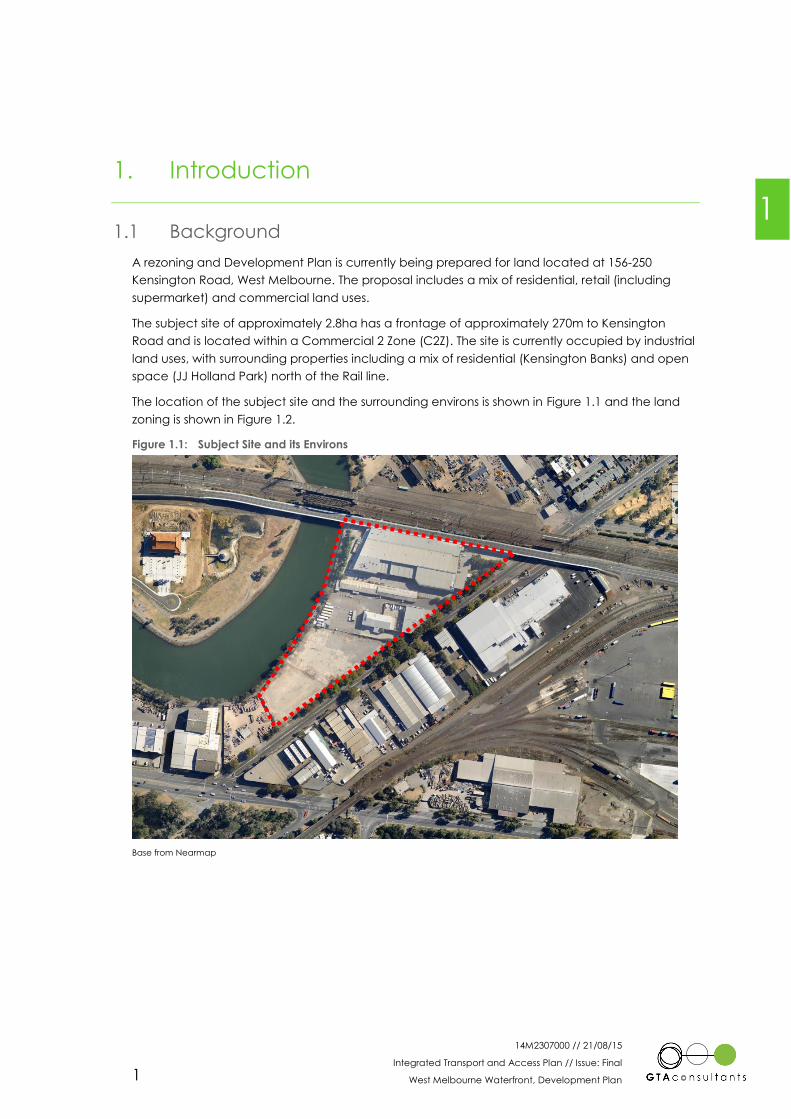
1.1 Background
A rezoning and Development Plan is currently being prepared for land located at 156-250
Kensington Road, West Melbourne. The proposal includes a mix of residential, retail (including
supermarket) and commercial land uses.
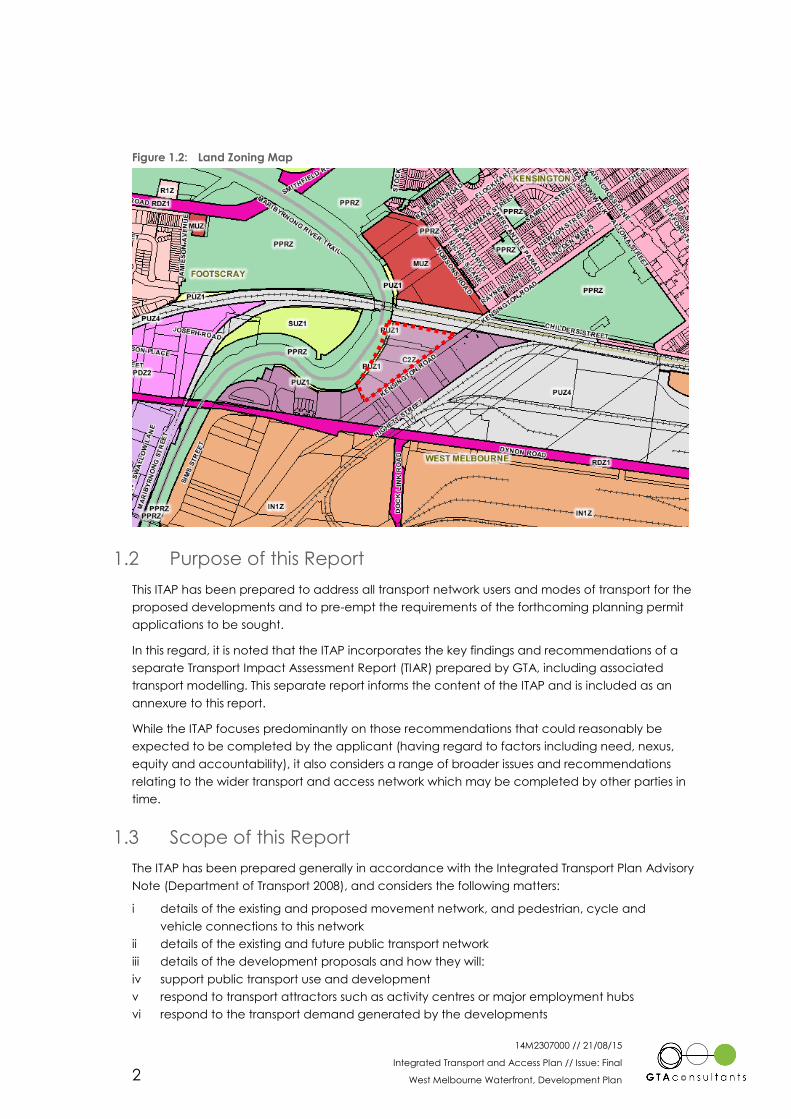
The subject site of approximately 2.8ha has a frontage of approximately 270m to Kensington
Road and is located within a Commercial 2 Zone (C2Z). The site is currently occupied by industrial
land uses, with surrounding properties including a mix of residential (Kensington Banks) and open
space (JJ Holland Park) north of the Rail line.
The location of the subject site and the surrounding environs is shown in Figure 1.1 and the land
zoning is shown in Figure 1.2.
Figure 1.1: Subject Site and its Environs
Base from Nearmap
1
14M2307000 // 21/08/15
Integrated Transport and Access Plan // Issue: Final
West Melbourne Waterfront, Development Plan 2
Figure 1.2: Land Zoning Map
1.2 Purpose of this Report
This ITAP has been prepared to address all transport network users and modes of transport for the
proposed developments and to pre-empt the requirements of the forthcoming planning permit
applications to be sought.
In this regard, it is noted that the ITAP incorporates the key findings and recommendations of a
separate Transport Impact Assessment Report (TIAR) prepared by GTA, including associated
transport modelling. This separate report informs the content of the ITAP and is included as an
annexure to this report.
While the ITAP focuses predominantly on those recommendations that could reasonably be
expected to be completed by the applicant (having regard to factors including need, nexus,
equity and accountability), it also considers a range of broader issues and recommendations
relating to the wider transport and access network which may be completed by other parties in
time.
1.3 Scope of this Report
The ITAP has been prepared generally in accordance with the Integrated Transport Plan Advisory
Note (Department of Transport 2008), and considers the following matters:
i details of the existing and proposed movement network, and pedestrian, cycle and
vehicle connections to this network
ii details of the existing and future public transport network
iii details of the development proposals and how they will:
iv support public transport use and development
v respond to transport attractors such as activity centres or major employment hubs
vi respond to the transport demand generated by the developments
14M2307000 // 21/08/15
Integrated Transport and Access Plan // Issue: Final
West Melbourne Waterfront, Development Plan 3
vii create efficient pedestrian, bicycle and vehicle linkages internally, and connections to
surrounding urban development and public transport infrastructure
viii avoid detriment to the public transport network and be consistent with future public
transport investments
ix measures to improve sustainable transport behaviour for residents and visitors to the
sites
x high level assessment of the proposals’ ability to accommodate event day demands
xi mechanisms to maintain relevance of the Integrated Transport and Access Plan.
1.4 References
This ITAP has been prepared with reference to the following policy, strategies, legislation and
reports:
Plan Melbourne
Transport Integration Act 2010
VicRoads SmartRoads Network Operating Plan
VicRoads Principal Bicycle Network
Melbourne Planning Scheme
City of Melbourne Transport Strategy 2012
City of Melbourne Bicycle Plan 2012-16
other documents and reports as referenced.
14M2307000 // 21/08/15
Integrated Transport and Access Plan // Issue: Final
West Melbourne Waterfront, Development Plan 4
2. Urban Context
2.1 Site Location
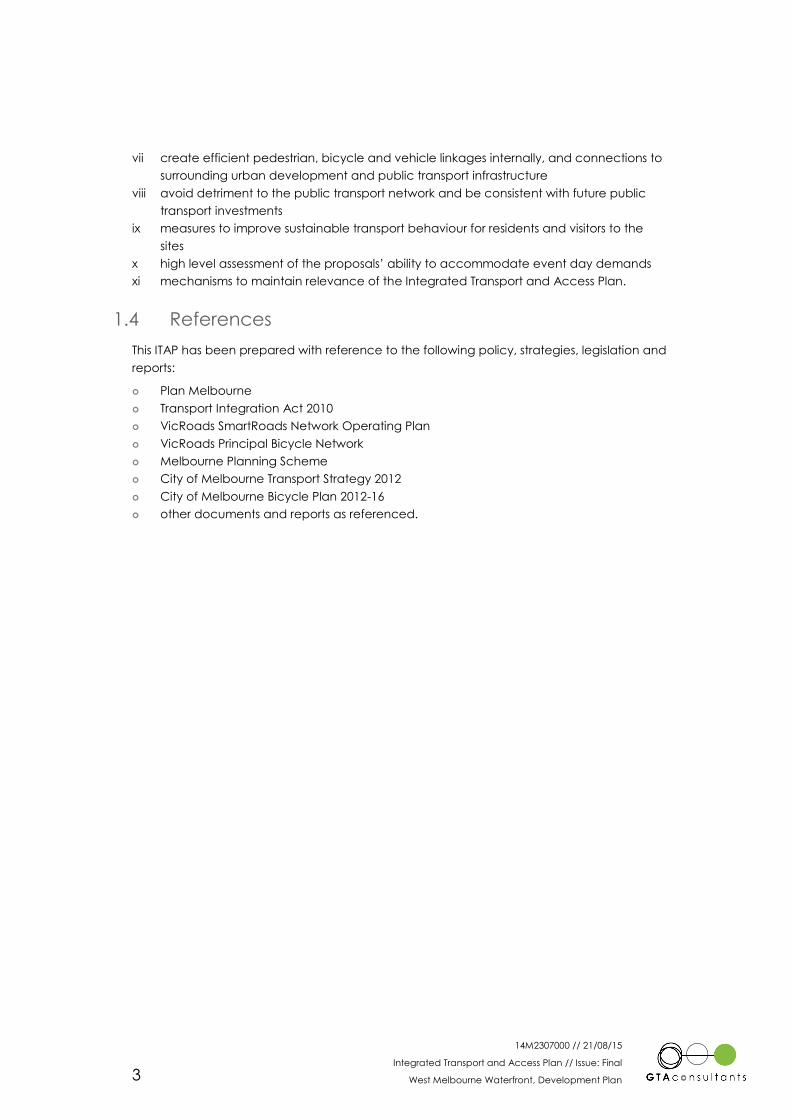
The site is identified within Plan Melbourne as being within the ‘Dynon Corridor’, an urban renewal
opportunity as part of an expanded central city.
At present, the area has a typically industrial character, however is likely to transform into an inner
city mixed use precinct in the medium to long term, with the transport and movement network
changing accordingly.
The transport context of the subject site against its surrounds is shown below in Figure 2.1.
Figure 2.1: Transport Context
2
14M2307000 // 21/08/15
Integrated Transport and Access Plan // Issue: Final
West Melbourne Waterfront, Development Plan 5
3. Policy Context
3.1 Overview of Key Policy Directions
3.1.1 Preamble
The following key policy directions have been identified and have informed the preparation of
the ITAP. These are broad based directions that underpin the transport planning approach of this
report. A more detailed review of the most relevant State and Local policy is included in Sections
3.2 and 3.3.
3.1.2 Road Space Allocation
A systematic and strategic approach is critical to respond to observed issues with the transport
network, and to ensure that the fine detail of the transport system responds to the defined
strategic intent.
In Victoria, the overall road network plan is articulated as a ‘Network Operating Plan’ and ‘Road
User Hierarchy’ that provide the planning basis for decision making with respect to the road
network. The Network Operating Plan is intended to be a ‘live’ document that can be updated
to reflect changed circumstances.
Generally, the Network Operating Plan and Road User Hierarchy will articulate where the
following modes have priority on the road network:
general traffic and freight movement
pedestrians (through the Principal Pedestrian Network)
bicycles (through the Principal Bicycle Network and Municipal Bicycle Network)
road based public transport routes.
3.1.3 Liveable Streets
In urban areas and town centres, there is a strong emerging theme of creating streets for people,
rather than roads for cars. This does not necessarily mean banishing cars entirely, but rather it
involves reorganising space and designing to create a place for people to interact, rather than
an efficient space designed for the movement of vehicles and services.
The key influences on this movement are the “Naked Streets” (negotiated space) and “Shared
Streets” which were pioneered in the Netherlands by Hans Monderman. The underlying
psychology seeks to change behaviour and culture “from priority to equality”, and links with the
Crime Prevention Through Environmental Design (CPTED) philosophy.
Shared space relies on removing almost all delineation from the road space, and leaving only
subtle cues as to the priority of the various modes. A key premise is that increasing uncertainty
(creating ambiguity) for car drivers increases certainty and safety for pedestrians. Traffic will move
slowly enough for pedestrians and drivers to make eye contact, whereas the traditional highly
delineated street does not allow for any negotiation over priority.
There are many examples of highly successful shared spaces in Victoria, including the Melbourne
CBD, Bendigo CBD, and other major centres such as Footscray, Clayton, Dandenong and
others. An important feature of these spaces is that they generally have many other positive
3
14M2307000 // 21/08/15
Integrated Transport and Access Plan // Issue: Final
West Melbourne Waterfront, Development Plan 6
economic and social benefits apart from the transport and safety benefits created by giving
equal priority to pedestrians.
3.1.4 Healthy Cities Promote Safe Walking and Cycling
There is a common and growing understanding of the causal link between good urban and
transport system design that promotes safe walking and cycling, and a healthy community in
terms of both physical and mental health.
The Australian Heart Foundation has encapsulated this body of knowledge in Healthy by Design –
a planner’s guide to environments for active living (Heart Foundation 2004). The guide suggests
design approaches to encourage active living in the following areas:
walking and cycling routes
streets
local destinations
open space
public transport
seating, signage, lighting, fencing and walls
fostering community spirit.
The guide includes a number of case studies from Victoria that illustrate the outcomes in these
areas. In particular, it is worth noting that the application of these principles can add significantly
to the health benefits of any business case, and open up avenues for different funding
opportunities.
The promotion of safe, active transport is usually achieved through the implementation of multi
component strategies that include speed reduction. High levels of safe walking and cycling for
transport are incompatible with high vehicle speed as, for many trips or parts of trips, pedestrians
and cyclists are required to share the road space with motor vehicles. International experience
suggests that speed reduction is not the only change needed to increase safe active transport,
but it is a key component.
The following key findings of the report are presented below:
Reducing motor vehicle speeds in areas with high pedestrian movement (existing or
desired) is critical to creating a safe and attractive transport network. In particular, it is
noted that the likelihood of a fatality increases rapidly at speeds over 30km/h.
Low speed limits in neighbourhoods and town centres are becoming increasingly
common around the world. Generally, speeds of 20-30 kph are associated with safer
streets and higher rates of walking and cycling.
3.1.5 Summary
The review of existing relevant policy clearly illustrates a number of themes that should inform the
approach to future transport projects. These themes include:
All investment decisions should be informed by a road user hierarchy. In Victoria, the
SmartRoads Network Operating Plan / Road User Hierarchy tool developed by
VicRoads is the appropriate planning tool to determine the road user hierarchy across
the road network.
Promoting sustainable transport (walking, cycling and public transport) is important for
a wide range of reasons:
o Socially connected, liveable communities – places where people walk, cycle and
use public transport are likely to perform better on a range of social indicators.
14M2307000 // 21/08/15
Integrated Transport and Access Plan // Issue: Final
West Melbourne Waterfront, Development Plan 7
o Healthy, active communities – there is a strong link between active transport and
health.
o Transport efficiency – increased use of sustainable transport has environmental
and economic benefits through reduced greenhouse emissions and reduced
space required for vehicle movement and storage.
o Access for all members of the community – a large number of people in the
community don’t or can’t drive, and the provision of attractive and viable
alternative means of transport is a key factor in whether a community is affected
by transport disadvantage.
o Safety – Increased sustainable and active transport improves safety and
perceptions of safety.
Planning for new development must consider providing for and promoting sustainable
and active transport modes in accordance with the road user hierarchy.
The City of Melbourne has a number of specific policies and strategies to improve walking,
cycling and public transport, in order to create a healthy, liveable, vibrant and inclusive
municipality. A summary of the relevant State and Local Policy documents is detailed below.
3.2 State Policy
3.2.1 Plan Melbourne
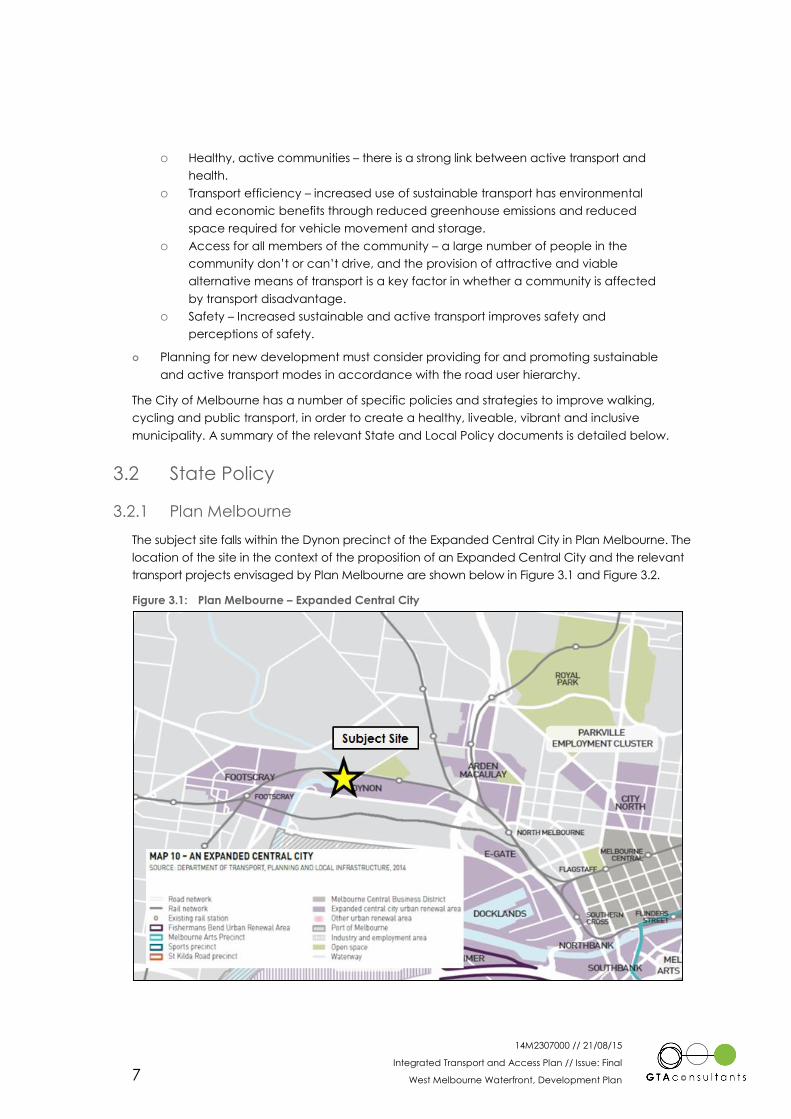
The subject site falls within the Dynon precinct of the Expanded Central City in Plan Melbourne. The
location of the site in the context of the proposition of an Expanded Central City and the relevant
transport projects envisaged by Plan Melbourne are shown below in Figure 3.1 and Figure 3.2.
Figure 3.1: Plan Melbourne – Expanded Central City
14M2307000 // 21/08/15
Integrated Transport and Access Plan // Issue: Final
West Melbourne Waterfront, Development Plan 8
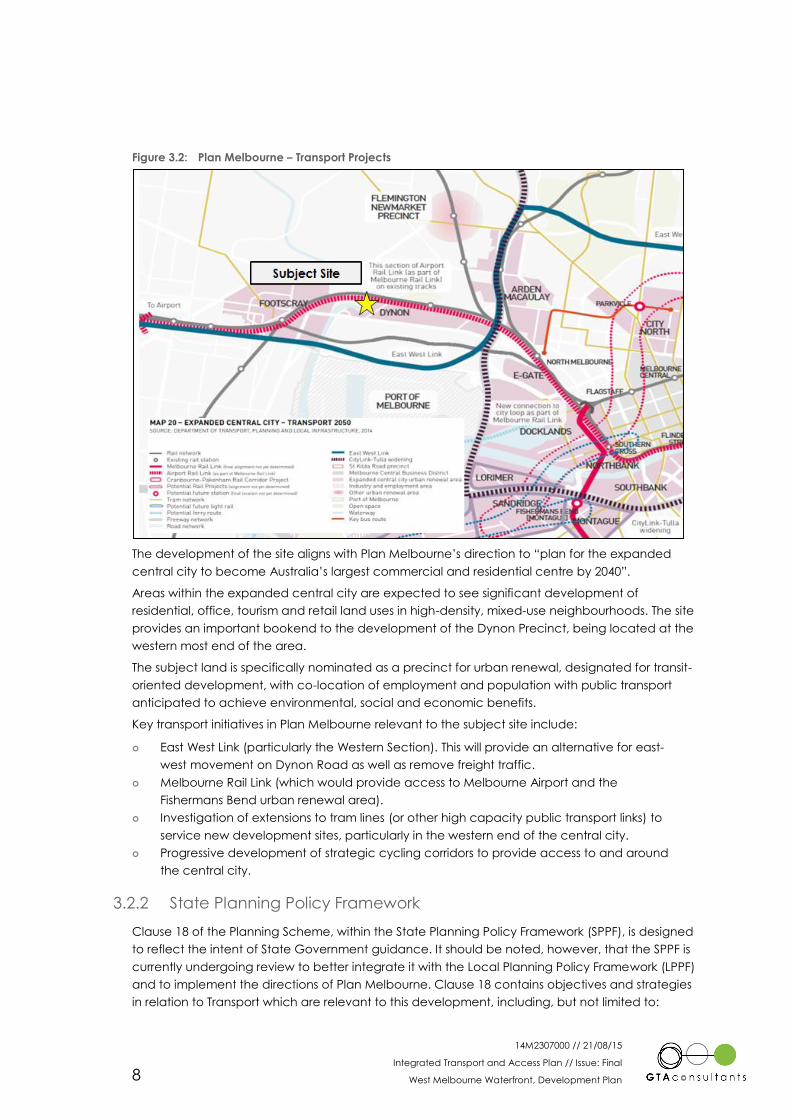
Figure 3.2: Plan Melbourne – Transport Projects
The development of the site aligns with Plan Melbourne’s direction to “plan for the expanded
central city to become Australia’s largest commercial and residential centre by 2040”.
Areas within the expanded central city are expected to see significant development of
residential, office, tourism and retail land uses in high-density, mixed-use neighbourhoods. The site
provides an important bookend to the development of the Dynon Precinct, being located at the
western most end of the area.
The subject land is specifically nominated as a precinct for urban renewal, designated for transit-
oriented development, with co-location of employment and population with public transport
anticipated to achieve environmental, social and economic benefits.
Key transport initiatives in Plan Melbourne relevant to the subject site include:
East West Link (particularly the Western Section). This will provide an alternative for east-
west movement on Dynon Road as well as remove freight traffic.
Melbourne Rail Link (which would provide access to Melbourne Airport and the
Fishermans Bend urban renewal area).
Investigation of extensions to tram lines (or other high capacity public transport links) to
service new development sites, particularly in the western end of the central city.
Progressive development of strategic cycling corridors to provide access to and around
the central city.
3.2.2 State Planning Policy Framework
Clause 18 of the Planning Scheme, within the State Planning Policy Framework (SPPF), is designed
to reflect the intent of State Government guidance. It should be noted, however, that the SPPF is
currently undergoing review to better integrate it with the Local Planning Policy Framework (LPPF)
and to implement the directions of Plan Melbourne. Clause 18 contains objectives and strategies
in relation to Transport which are relevant to this development, including, but not limited to:
14M2307000 // 21/08/15
Integrated Transport and Access Plan // Issue: Final
West Melbourne Waterfront, Development Plan 9
Creating a safe and sustainable transport system by integrating land-use and transport.
Planning new uses or development of land near an existing or proposed transport route
to avoid detriment to, and where possible enhance the service, safety and amenity
desirable for that transport route in the short and long terms.
Encourage higher land use densities and mixed use developments near railway stations,
major bus terminals, transport interchanges, tramways and principal bus routes.
Facilitating and safeguarding pedestrian and cyclist access to public transport.
Achieve greater use of public transport by increasing densities, maximising the use of
existing infrastructure and improving the viability of the public transport operation.
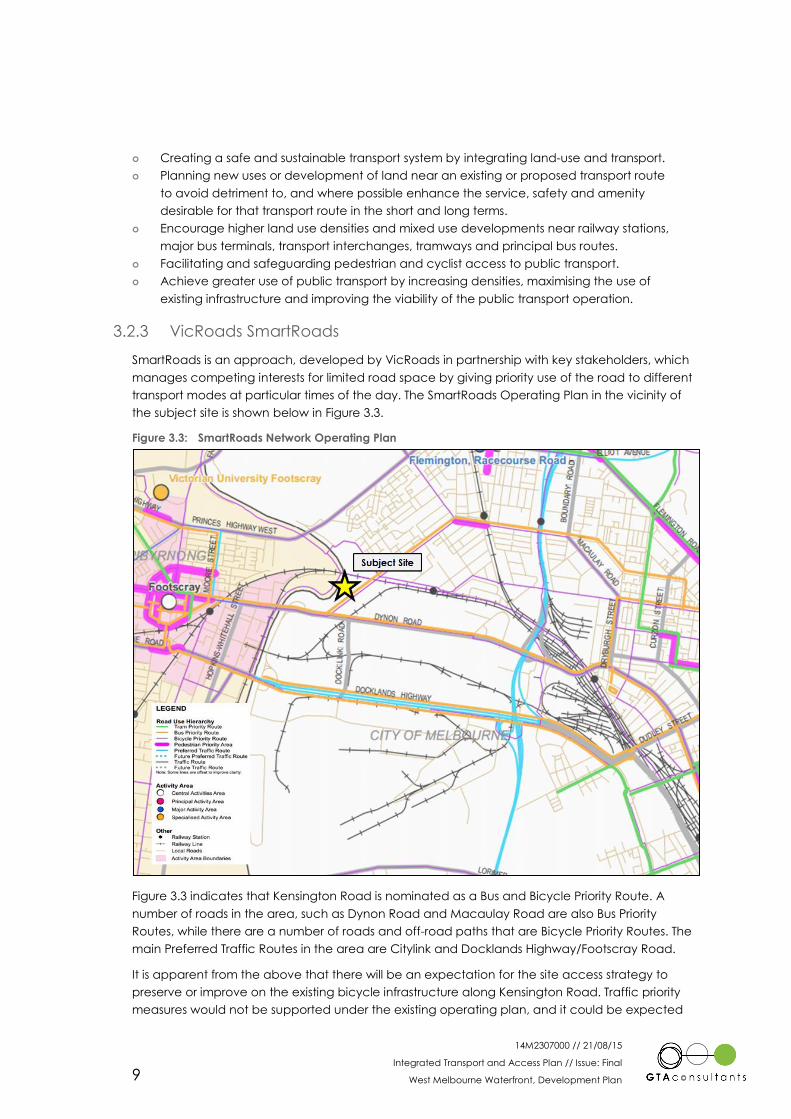
3.2.3 VicRoads SmartRoads
SmartRoads is an approach, developed by VicRoads in partnership with key stakeholders, which
manages competing interests for limited road space by giving priority use of the road to different
transport modes at particular times of the day. The SmartRoads Operating Plan in the vicinity of
the subject site is shown below in Figure 3.3.
Figure 3.3: SmartRoads Network Operating Plan
Figure 3.3 indicates that Kensington Road is nominated as a Bus and Bicycle Priority Route. A
number of roads in the area, such as Dynon Road and Macaulay Road are also Bus Priority
Routes, while there are a number of roads and off-road paths that are Bicycle Priority Routes. The
main Preferred Traffic Routes in the area are Citylink and Docklands Highway/Footscray Road.
It is apparent from the above that there will be an expectation for the site access strategy to
preserve or improve on the existing bicycle infrastructure along Kensington Road. Traffic priority
measures would not be supported under the existing operating plan, and it could be expected
14M2307000 // 21/08/15
Integrated Transport and Access Plan // Issue: Final
West Melbourne Waterfront, Development Plan 10
that the design of site access intersections may require preferential treatment to bus and bicycle
modes.
3.2.4 VicRoads Principal Bicycle Network
The Principal Bicycle Network (PBN) is a network of on and off-road cycling corridors that have
been identified to support cycling for transport and access major destinations in metropolitan
Melbourne. The PBN was reviewed and updated in 2012 by VicRoads and all local Councils.
The PBN is also a ‘bicycle infrastructure planning tool’ to guide State investment in the planning
and development of the future metropolitan Melbourne bicycle network. In this regard, a subset
of the PBN has been identified and elevated to a higher level of priority, mainly on the basis of
potential for separation from motorised traffic, making these routes more attractive to less
experienced bike riders. These cycling corridors are referred to as Bicycle Priority Routes (BPRs)
and form part of the modal priorities for the road network set out in the VicRoads SmartRoads
framework. Strategic Cycle Corridors (SCC) form another subset of the PBN, and represent an
initiative outlined in Plan Melbourne to support walking and cycling in Central Melbourne. SCCs
are intended to be corridors designed to provide high quality bicycle infrastructure to, and
around, major activity areas in metropolitan Melbourne. Plan Melbourne outlines a subset of the
SCCs for the proposed expanded central city area.
It is noted that the type of bicycle facility (i.e. on or off-road and separated or shared) has not
been indicated as part of the PBN and BPRs. Rather, the PBN and BPRs show the proposed
cycling network. The associated facilities should be delivered in accordance with the relevant
standards and guidelines, such as the Australian Standards, Austroads Guides and VicRoads’
Cycle Notes.
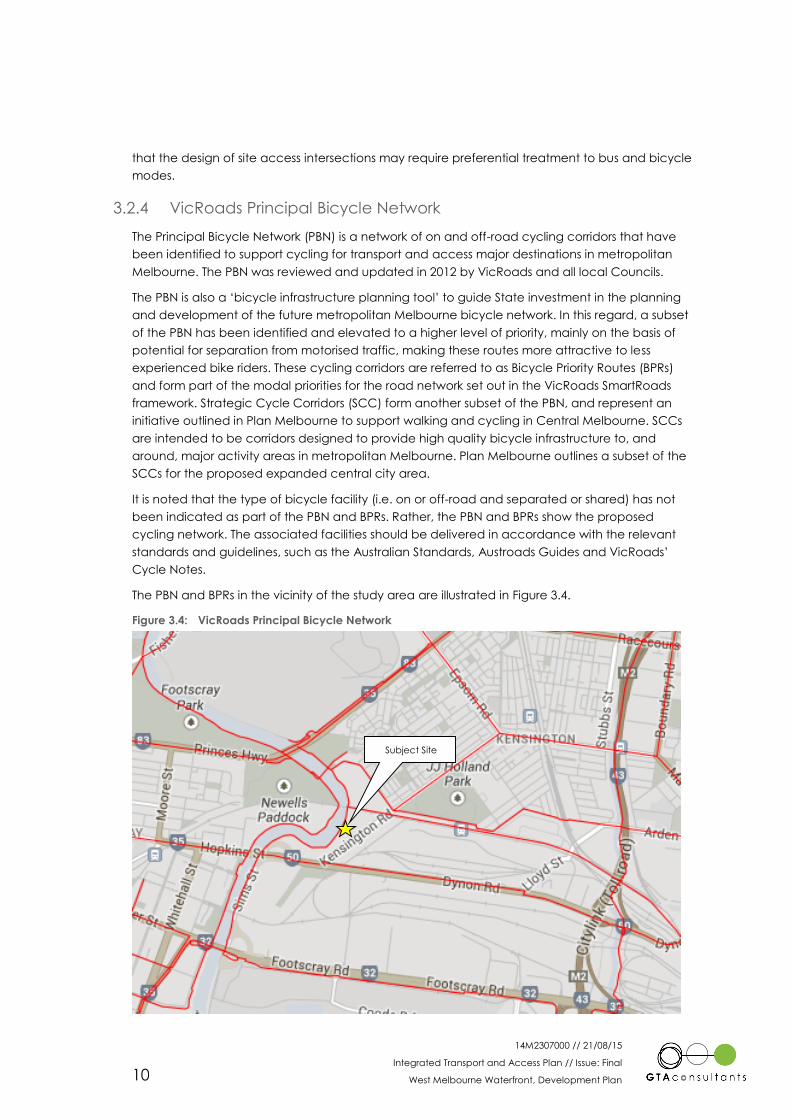
The PBN and BPRs in the vicinity of the study area are illustrated in Figure 3.4.
Figure 3.4: VicRoads Principal Bicycle Network
Subject Site
14M2307000 // 21/08/15
Integrated Transport and Access Plan // Issue: Final
West Melbourne Waterfront, Development Plan 11
The VicRoads PBN includes a proposed cycling route along the alignment of the Railway line
adjacent the northern boundary of the site, as well as along the Maribyrnong River. There is an
opportunity within the site to accommodate an east-west connection to the Maribyrnong River
Trail.
Kensington Road is designated as a Bicycle Priority Route on the Network Operating Plan, and
the existing on-road lanes will be upgraded with green pavement and rumble strip separators as
a City of Melbourne bicycle Plan project. This will ensure that Kensington Road is well connected
to the Dynon Road shared path (also being upgraded) and ultimately will connect to Footscray,
assuming that the PBN is completed on Hopkins Street when the Joseph Road precinct is
developed.
3.3 Local Policy
3.3.1 Local Planning Policy Framework
Clause 21.09 of the Melbourne Planning Scheme sets out the City of Melbourne’s local transport
policy. It states that public transport is the most economic and efficient mode for mass travel to
and from the City, while walking accounts for the greatest proportion of trips within the
municipality. Objectives and strategic therein which are relevant to this development include:
Integrate urban renewal areas with planned major transport infrastructure initiatives.
Encourage development in locations which can maximise the potential use of public
transport.
Ensure development patterns in urban renewal areas is permeable, fine-grained and
legible.
Support the provision of adequate, safe public transport, pedestrian and bicycle
facilities.
Support the extension of the existing pedestrian network throughout the municipality.
Support the extension of principal cycling routes into and through the City from
surrounding municipalities.
Ensure that new development provides bicycle access and high quality, safe and
secure end of trip cycle facilities.
Consolidate development with a mix of uses along tram and bus corridors and at and
around railway stations.
Support the reduction or waiving of car parking for new uses and developments which
have good access to public transport.
Recognise that cars are complementary to other modes of transport and their use
should be managed to minimise adverse impacts on other transport modes.
3.3.2 City of Melbourne Transport Strategy
The Melbourne Transport Strategy was approved by Council in May 2012 and aligns the City of
Melbourne’s transport policy with its review of the Melbourne Planning Scheme. Its key directions
and objectives are generally in supporting of public transport, walking and cycling as the
dominant modes of transport in inner Melbourne, while aiming to reducing the proportion of trips
taken by car. Actions from the Strategy relevant to the proposed development include
commitments to:
Plan and construct a complete safe cycling network throughout the city’s Urban
Renewal Areas
14M2307000 // 21/08/15
Integrated Transport and Access Plan // Issue: Final
West Melbourne Waterfront, Development Plan 12
Work with the Department of Transport to provide excellent quality pedestrian access
to all public transport stops, stations and interchanges
Work with the Department of Transport and VicRoads to ensure that the municipality’s
Road Network Operating Plan provides a high level of priority to pedestrian trips
Install and improve bicycle facilities as part of all traffic works in the municipality
Work with the Department of Transport, VicRoads and Yarra Trams to design and build
safe cycling along the high-mobility streets
Extend bus stops where necessary by removing on-street parking or other measures and
improve bus stop amenity
Work with the Department of Transport, VicRoads and the Bus Association to improve
bus frequency
Work with DoT, Yarra Trams and VicRoads to implement long-term tram network
reconfigurations and extensions
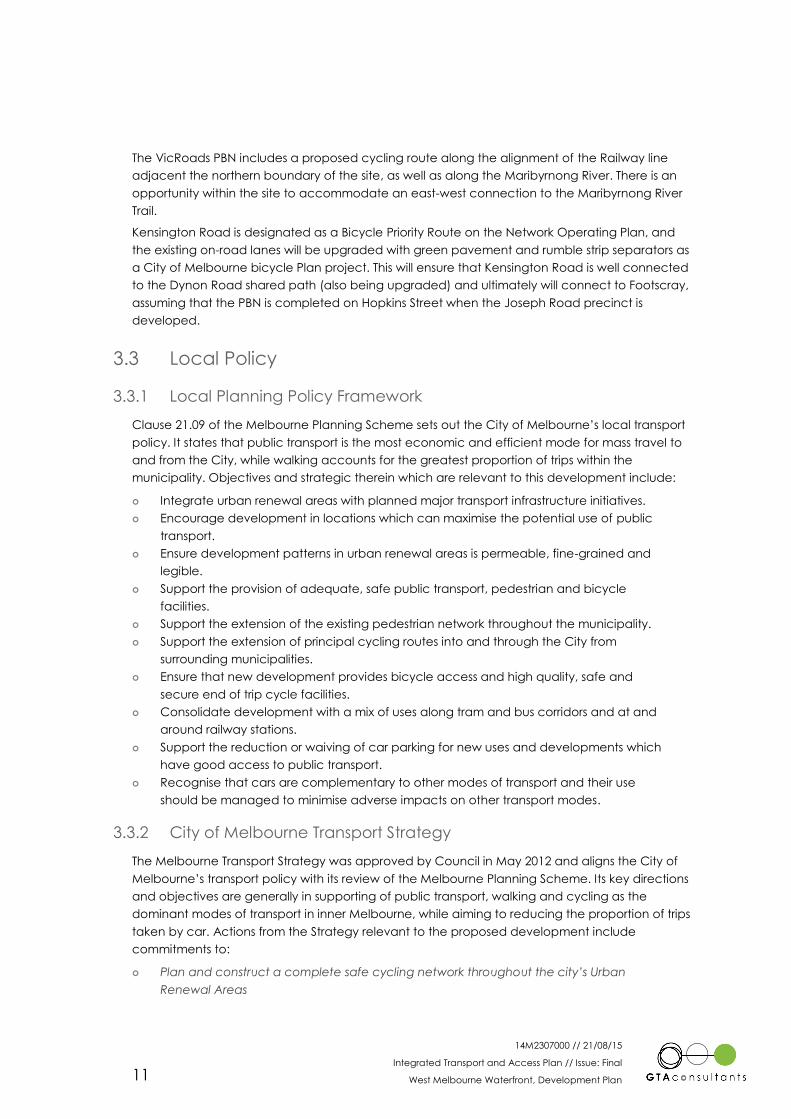
The proposed tram, public transport and pedestrian networks are illustrated below in Figure 3.5
and Figure 3.6.
Figure 3.5: City of Melbourne Transport Strategy
– Proposed Tram Network 2030
Figure 3.6: City of Melbourne Transport
Strategy – Proposed Public Transport
and Pedestrian Priority
It is clear that planning for a tram line along Dynon Road is within the future thinking for the
Transport Strategy of the City of Melbourne. It is noted that this documents predates Plan
Melbourne.
3.3.3 City of Melbourne Bicycle Plan 2012-2016
The Bicycle Plan 2012-16 ‘is the City of Melbourne’s plan for bicycle infrastructure and programs
to make Melbourne safer and more attractive for current and future cyclists’. Part of this plan
includes the acknowledgement that ‘the bicycle network is likely to be required to provide
transport options for a projected population increase particularly in the west of metropolitan
Melbourne.’
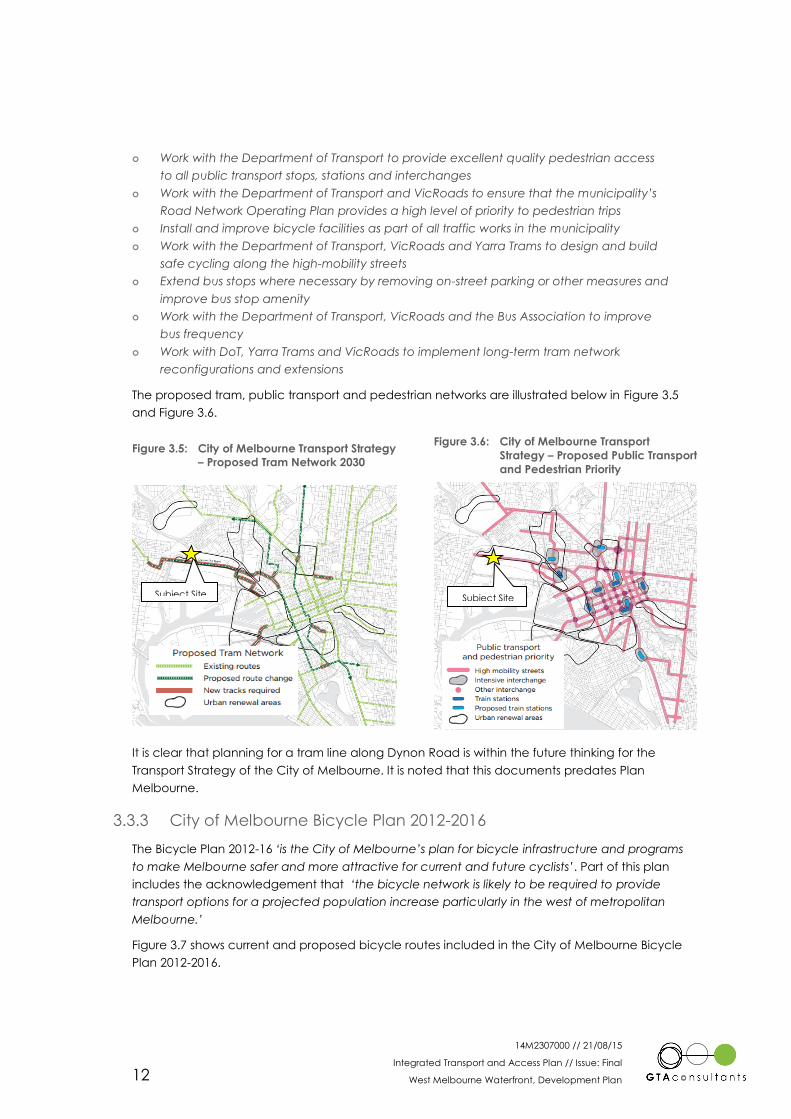
Figure 3.7 shows current and proposed bicycle routes included in the City of Melbourne Bicycle
Plan 2012-2016.
Subject Site Subject Site
14M2307000 // 21/08/15
Integrated Transport and Access Plan // Issue: Final
West Melbourne Waterfront, Development Plan 13
Figure 3.7: City of Melbourne Current and Proposed Bicycle Network
As illustrated in Figure 3.7, the bicycle plan proposes that Kensington Road along the site frontage
as well as Childers Street will be upgraded with green pavement, profiled edge-line and
intersection treatments.
Subject Site
14M2307000 // 21/08/15
Integrated Transport and Access Plan // Issue: Final
West Melbourne Waterfront, Development Plan 14
4. Existing Conditions
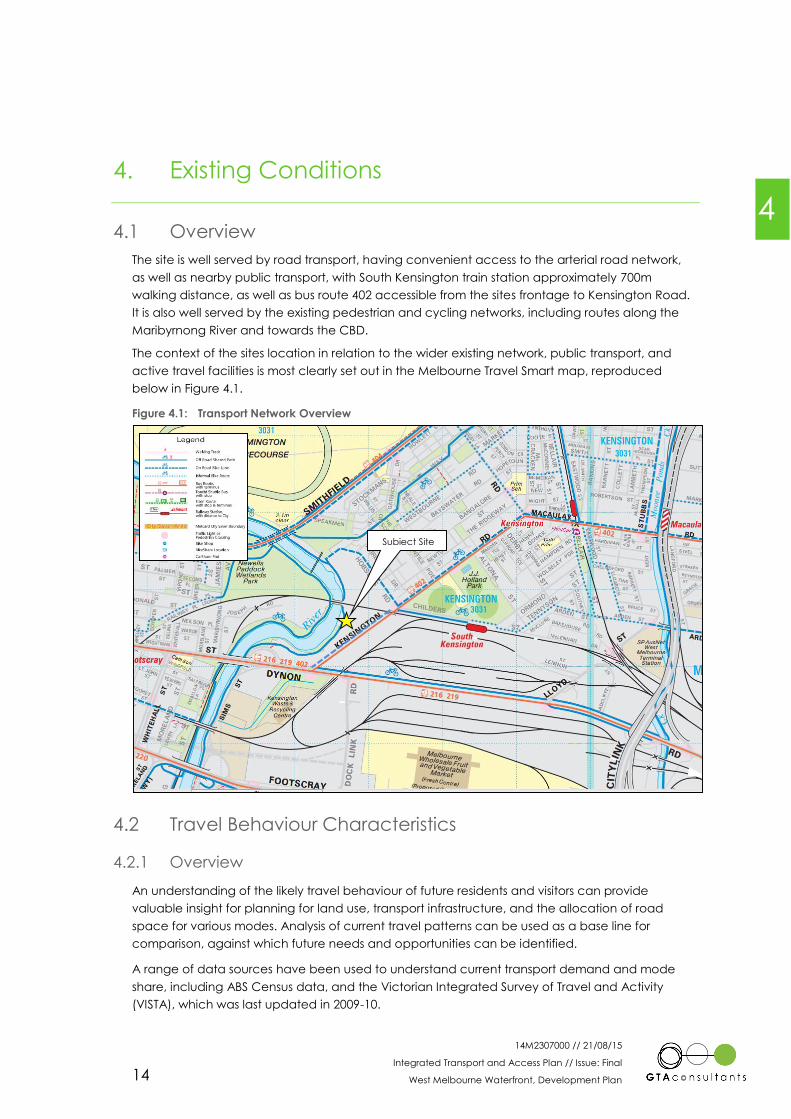
4.1 Overview
The site is well served by road transport, having convenient access to the arterial road network,
as well as nearby public transport, with South Kensington train station approximately 700m
walking distance, as well as bus route 402 accessible from the sites frontage to Kensington Road.
It is also well served by the existing pedestrian and cycling networks, including routes along the
Maribyrnong River and towards the CBD.
The context of the sites location in relation to the wider existing network, public transport, and
active travel facilities is most clearly set out in the Melbourne Travel Smart map, reproduced
below in Figure 4.1.
Figure 4.1: Transport Network Overview
4.2 Travel Behaviour Characteristics
4.2.1 Overview
An understanding of the likely travel behaviour of future residents and visitors can provide
valuable insight for planning for land use, transport infrastructure, and the allocation of road
space for various modes. Analysis of current travel patterns can be used as a base line for
comparison, against which future needs and opportunities can be identified.
A range of data sources have been used to understand current transport demand and mode
share, including ABS Census data, and the Victorian Integrated Survey of Travel and Activity
(VISTA), which was last updated in 2009-10.
Subject Site
4
14M2307000 // 21/08/15
Integrated Transport and Access Plan // Issue: Final
West Melbourne Waterfront, Development Plan 15
4.2.2 Mode Split
Mode split data has been obtained from the following sources:
The Australian Bureau of Statistics (ABS) 2011 Census Method of Travel to Work, which
demonstrates the mode used for work based trips based on both location of residence
and location of workplace.
The Victorian Integrated Survey of Travel and Activity (VISTA) 2009-2010, to understand
mode split for travel across all trip purposes (i.e. including work and non-work trips).
Australian Bureau of Statistics Method of Travel to Work Data
Residents
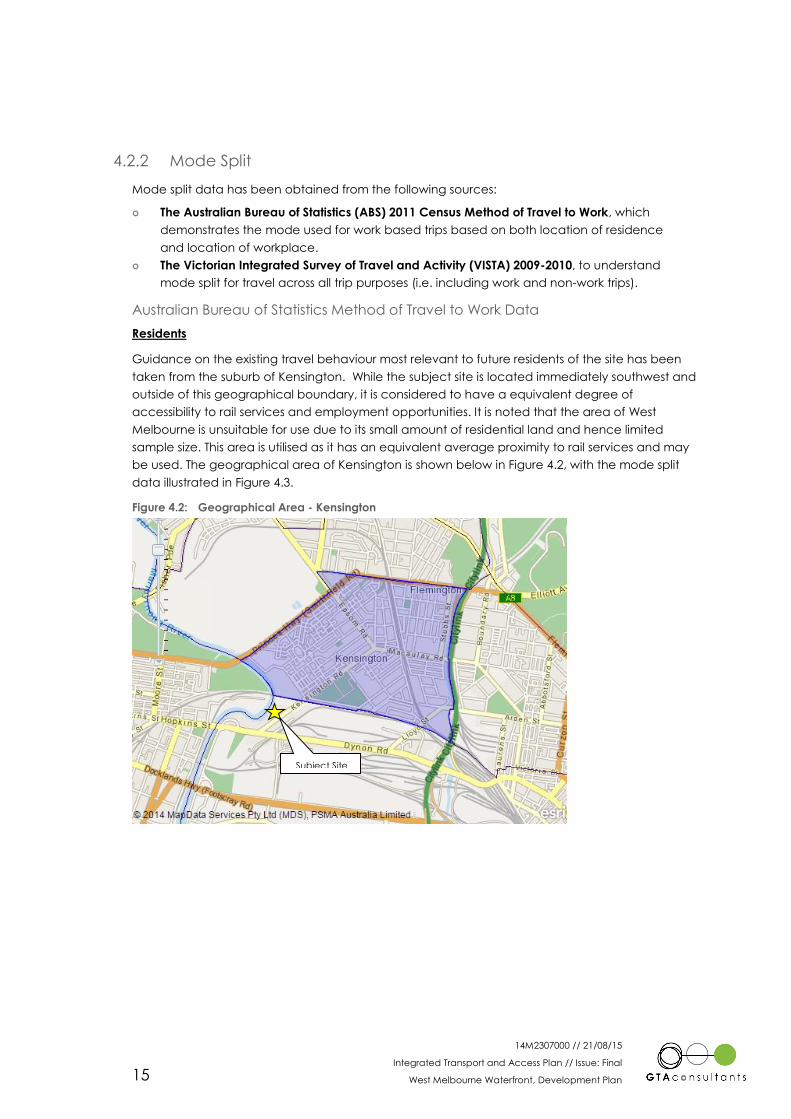
Guidance on the existing travel behaviour most relevant to future residents of the site has been
taken from the suburb of Kensington. While the subject site is located immediately southwest and
outside of this geographical boundary, it is considered to have a equivalent degree of
accessibility to rail services and employment opportunities. It is noted that the area of West
Melbourne is unsuitable for use due to its small amount of residential land and hence limited
sample size. This area is utilised as it has an equivalent average proximity to rail services and may
be used. The geographical area of Kensington is shown below in Figure 4.2, with the mode split
data illustrated in Figure 4.3.
Figure 4.2: Geographical Area - Kensington
Subject Site
14M2307000 // 21/08/15
Integrated Transport and Access Plan // Issue: Final
West Melbourne Waterfront, Development Plan 16
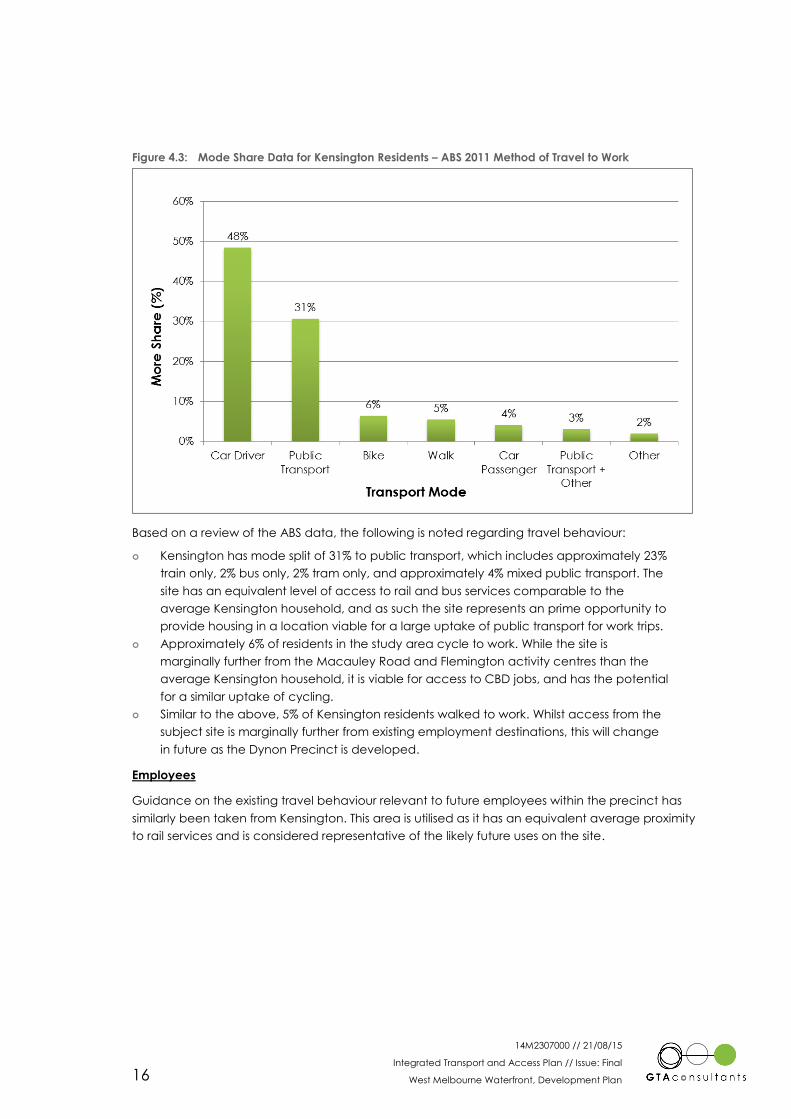
Figure 4.3: Mode Share Data for Kensington Residents – ABS 2011 Method of Travel to Work
Based on a review of the ABS data, the following is noted regarding travel behaviour:
Kensington has mode split of 31% to public transport, which includes approximately 23%
train only, 2% bus only, 2% tram only, and approximately 4% mixed public transport. The
site has an equivalent level of access to rail and bus services comparable to the
average Kensington household, and as such the site represents an prime opportunity to
provide housing in a location viable for a large uptake of public transport for work trips.
Approximately 6% of residents in the study area cycle to work. While the site is
marginally further from the Macauley Road and Flemington activity centres than the
average Kensington household, it is viable for access to CBD jobs, and has the potential
for a similar uptake of cycling.
Similar to the above, 5% of Kensington residents walked to work. Whilst access from the
subject site is marginally further from existing employment destinations, this will change
in future as the Dynon Precinct is developed.
Employees
Guidance on the existing travel behaviour relevant to future employees within the precinct has
similarly been taken from Kensington. This area is utilised as it has an equivalent average proximity
to rail services and is considered representative of the likely future uses on the site.
14M2307000 // 21/08/15
Integrated Transport and Access Plan // Issue: Final
West Melbourne Waterfront, Development Plan 17
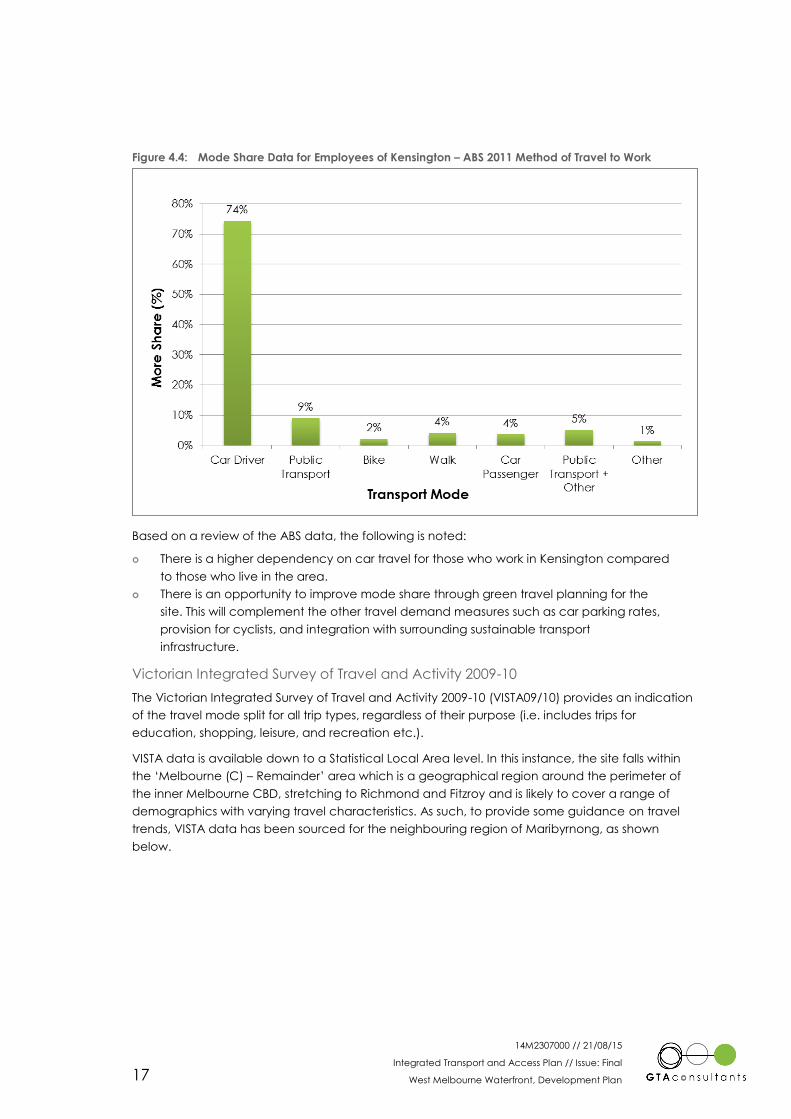
Figure 4.4: Mode Share Data for Employees of Kensington – ABS 2011 Method of Travel to Work
Based on a review of the ABS data, the following is noted:
There is a higher dependency on car travel for those who work in Kensington compared
to those who live in the area.
There is an opportunity to improve mode share through green travel planning for the
site. This will complement the other travel demand measures such as car parking rates,
provision for cyclists, and integration with surrounding sustainable transport
infrastructure.
Victorian Integrated Survey of Travel and Activity 2009-10
The Victorian Integrated Survey of Travel and Activity 2009-10 (VISTA09/10) provides an indication
of the travel mode split for all trip types, regardless of their purpose (i.e. includes trips for
education, shopping, leisure, and recreation etc.).
VISTA data is available down to a Statistical Local Area level. In this instance, the site falls within
the ‘Melbourne (C) – Remainder’ area which is a geographical region around the perimeter of
the inner Melbourne CBD, stretching to Richmond and Fitzroy and is likely to cover a range of
demographics with varying travel characteristics. As such, to provide some guidance on travel
trends, VISTA data has been sourced for the neighbouring region of Maribyrnong, as shown
below.
14M2307000 // 21/08/15
Integrated Transport and Access Plan // Issue: Final
West Melbourne Waterfront, Development Plan 18
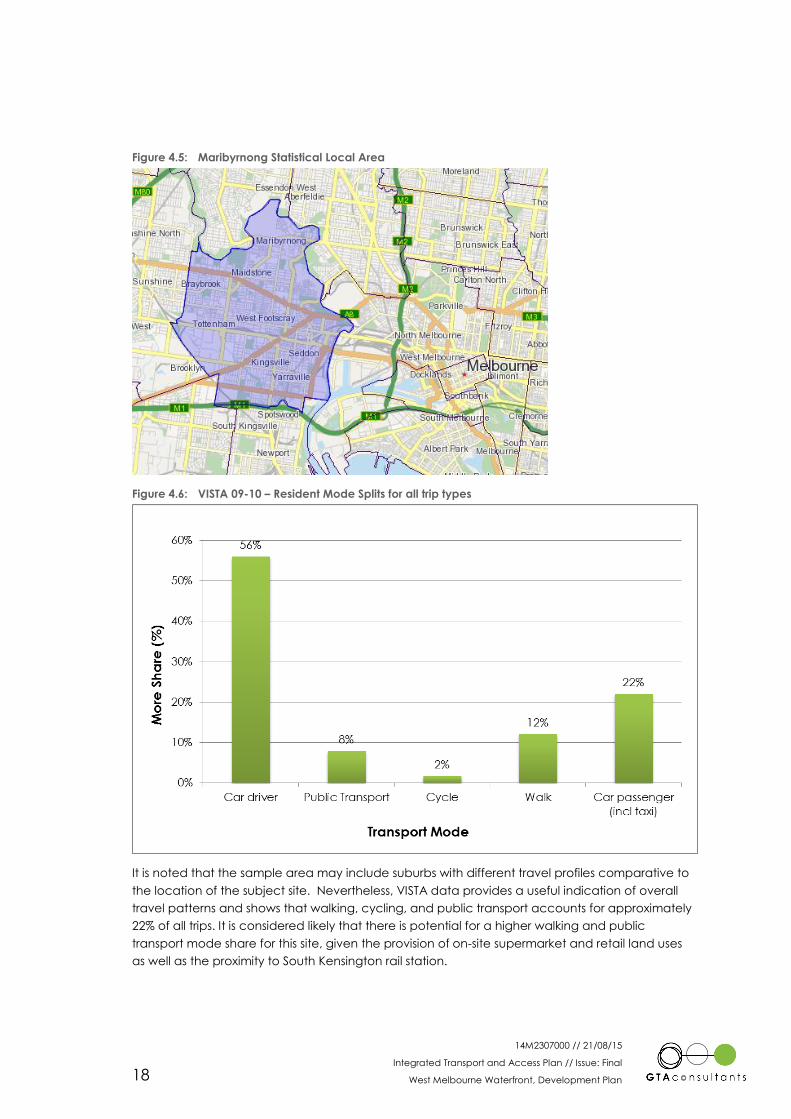
Figure 4.5: Maribyrnong Statistical Local Area
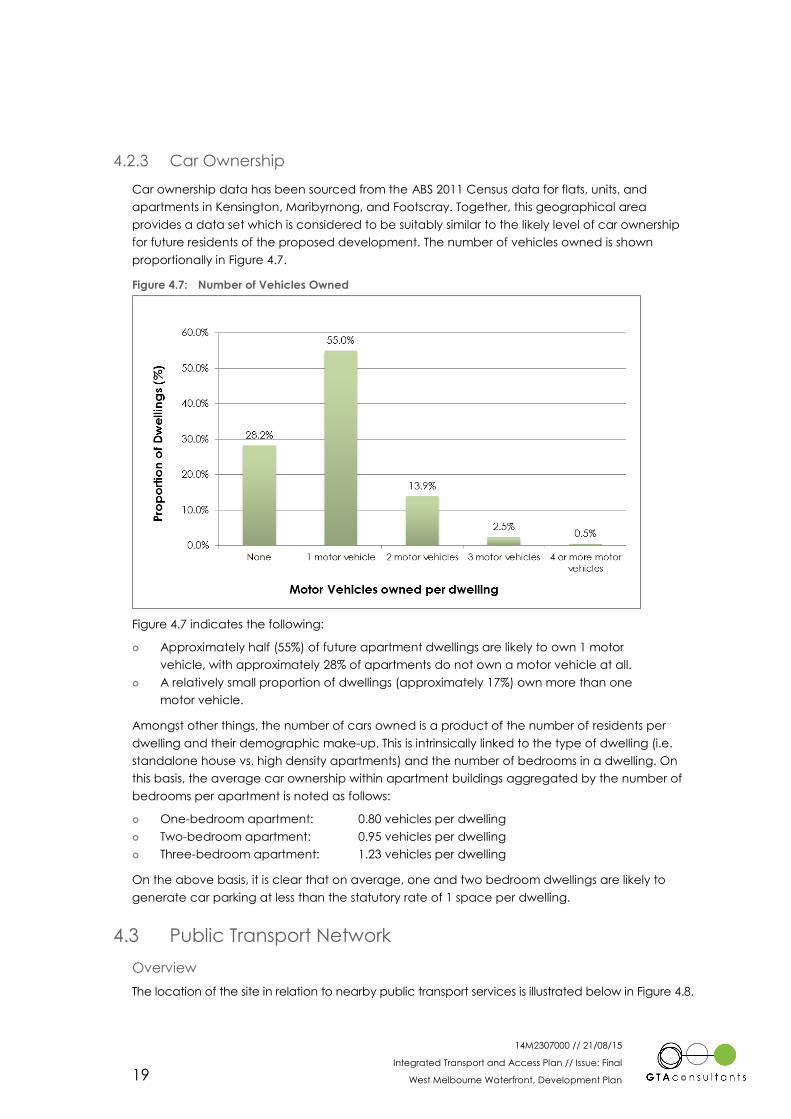
Figure 4.6: VISTA 09-10 – Resident Mode Splits for all trip types
It is noted that the sample area may include suburbs with different travel profiles comparative to
the location of the subject site. Nevertheless, VISTA data provides a useful indication of overall
travel patterns and shows that walking, cycling, and public transport accounts for approximately
22% of all trips. It is considered likely that there is potential for a higher walking and public
transport mode share for this site, given the provision of on-site supermarket and retail land uses
as well as the proximity to South Kensington rail station.
14M2307000 // 21/08/15
Integrated Transport and Access Plan // Issue: Final
West Melbourne Waterfront, Development Plan 19
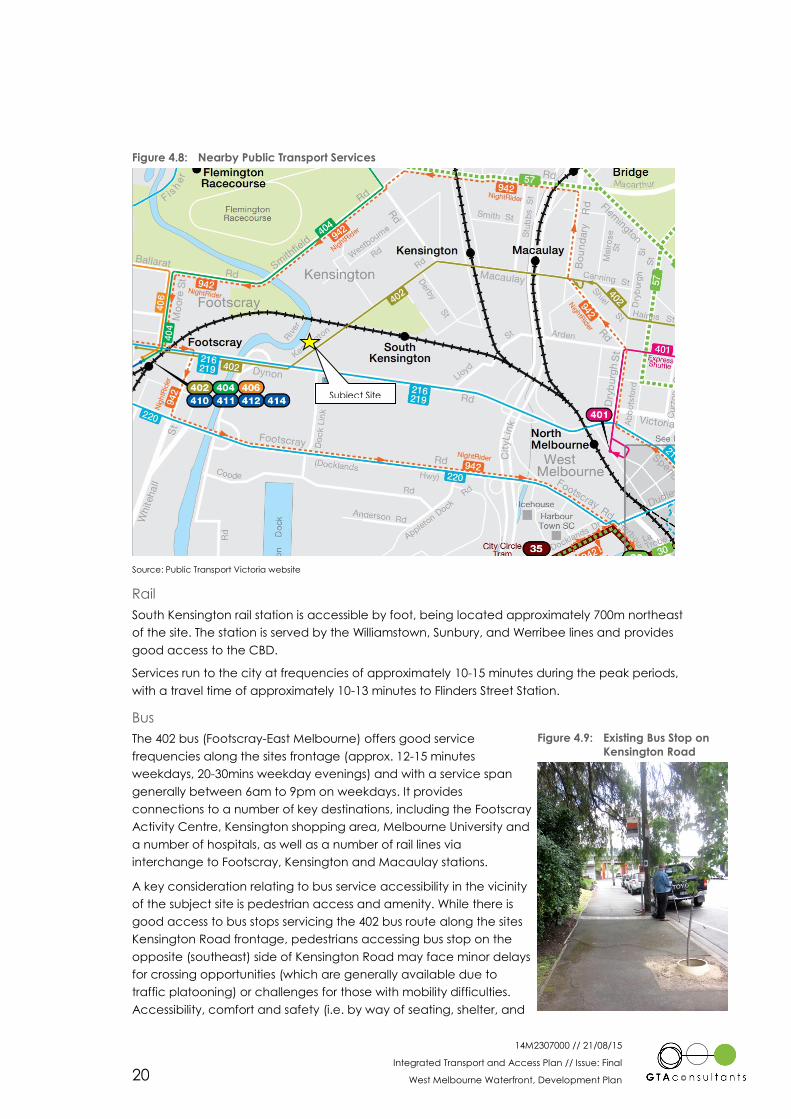
4.2.3 Car Ownership
Car ownership data has been sourced from the ABS 2011 Census data for flats, units, and
apartments in Kensington, Maribyrnong, and Footscray. Together, this geographical area
provides a data set which is considered to be suitably similar to the likely level of car ownership
for future residents of the proposed development. The number of vehicles owned is shown
proportionally in Figure 4.7.
Figure 4.7: Number of Vehicles Owned
Figure 4.7 indicates the following:
Approximately half (55%) of future apartment dwellings are likely to own 1 motor
vehicle, with approximately 28% of apartments do not own a motor vehicle at all.
A relatively small proportion of dwellings (approximately 17%) own more than one
motor vehicle.
Amongst other things, the number of cars owned is a product of the number of residents per
dwelling and their demographic make-up. This is intrinsically linked to the type of dwelling (i.e.
standalone house vs. high density apartments) and the number of bedrooms in a dwelling. On
this basis, the average car ownership within apartment buildings aggregated by the number of
bedrooms per apartment is noted as follows:
One-bedroom apartment: 0.80 vehicles per dwelling
Two-bedroom apartment: 0.95 vehicles per dwelling
Three-bedroom apartment: 1.23 vehicles per dwelling
On the above basis, it is clear that on average, one and two bedroom dwellings are likely to
generate car parking at less than the statutory rate of 1 space per dwelling.
4.3 Public Transport Network
Overview
The location of the site in relation to nearby public transport services is illustrated below in Figure 4.8.
14M2307000 // 21/08/15
Integrated Transport and Access Plan // Issue: Final
West Melbourne Waterfront, Development Plan 20
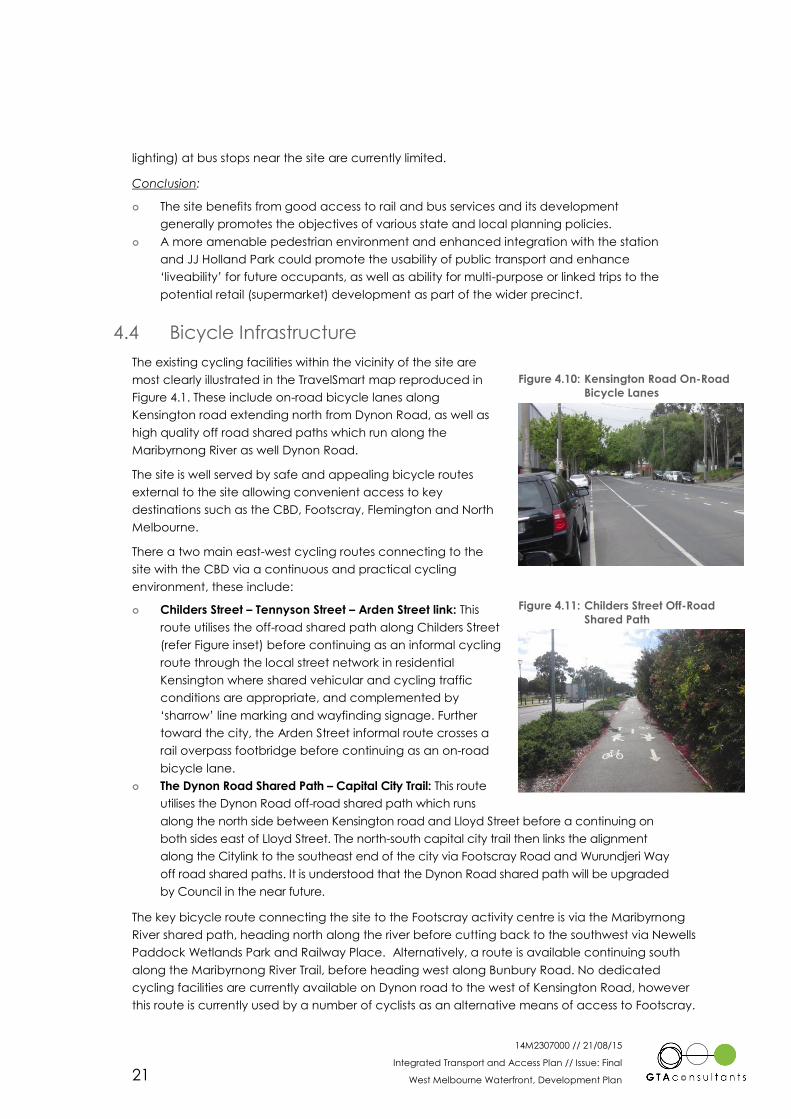
Figure 4.8: Nearby Public Transport Services
Source: Public Transport Victoria website
Rail
South Kensington rail station is accessible by foot, being located approximately 700m northeast
of the site. The station is served by the Williamstown, Sunbury, and Werribee lines and provides
good access to the CBD.
Services run to the city at frequencies of approximately 10-15 minutes during the peak periods,
with a travel time of approximately 10-13 minutes to Flinders Street Station.
Bus
The 402 bus (Footscray-East Melbourne) offers good service
frequencies along the sites frontage (approx. 12-15 minutes
weekdays, 20-30mins weekday evenings) and with a service span
generally between 6am to 9pm on weekdays. It provides
connections to a number of key destinations, including the Footscray
Activity Centre, Kensington shopping area, Melbourne University and
a number of hospitals, as well as a number of rail lines via
interchange to Footscray, Kensington and Macaulay stations.
A key consideration relating to bus service accessibility in the vicinity
of the subject site is pedestrian access and amenity. While there is
good access to bus stops servicing the 402 bus route along the sites
Kensington Road frontage, pedestrians accessing bus stop on the
opposite (southeast) side of Kensington Road may face minor delays
for crossing opportunities (which are generally available due to
traffic platooning) or challenges for those with mobility difficulties.
Accessibility, comfort and safety (i.e. by way of seating, shelter, and
Subject Site
Figure 4.9: Existing Bus Stop on
Kensington Road
14M2307000 // 21/08/15
Integrated Transport and Access Plan // Issue: Final
West Melbourne Waterfront, Development Plan 21
lighting) at bus stops near the site are currently limited.
Conclusion:
The site benefits from good access to rail and bus services and its development
generally promotes the objectives of various state and local planning policies.
A more amenable pedestrian environment and enhanced integration with the station
and JJ Holland Park could promote the usability of public transport and enhance
‘liveability’ for future occupants, as well as ability for multi-purpose or linked trips to the
potential retail (supermarket) development as part of the wider precinct.
4.4 Bicycle Infrastructure
The existing cycling facilities within the vicinity of the site are
most clearly illustrated in the TravelSmart map reproduced in
Figure 4.1. These include on-road bicycle lanes along
Kensington road extending north from Dynon Road, as well as
high quality off road shared paths which run along the
Maribyrnong River as well Dynon Road.
The site is well served by safe and appealing bicycle routes
external to the site allowing convenient access to key
destinations such as the CBD, Footscray, Flemington and North
Melbourne.
There a two main east-west cycling routes connecting to the
site with the CBD via a continuous and practical cycling
environment, these include:
Childers Street – Tennyson Street – Arden Street link: This
route utilises the off-road shared path along Childers Street
(refer Figure inset) before continuing as an informal cycling
route through the local street network in residential
Kensington where shared vehicular and cycling traffic
conditions are appropriate, and complemented by
‘sharrow’ line marking and wayfinding signage. Further
toward the city, the Arden Street informal route crosses a
rail overpass footbridge before continuing as an on-road
bicycle lane.
The Dynon Road Shared Path – Capital City Trail: This route
utilises the Dynon Road off-road shared path which runs
along the north side between Kensington road and Lloyd Street before a continuing on
both sides east of Lloyd Street. The north-south capital city trail then links the alignment
along the Citylink to the southeast end of the city via Footscray Road and Wurundjeri Way
off road shared paths. It is understood that the Dynon Road shared path will be upgraded
by Council in the near future.
The key bicycle route connecting the site to the Footscray activity centre is via the Maribyrnong
River shared path, heading north along the river before cutting back to the southwest via Newells
Paddock Wetlands Park and Railway Place. Alternatively, a route is available continuing south
along the Maribyrnong River Trail, before heading west along Bunbury Road. No dedicated
cycling facilities are currently available on Dynon road to the west of Kensington Road, however
this route is currently used by a number of cyclists as an alternative means of access to Footscray.
Figure 4.11: Childers Street Off-Road
Shared Path
Figure 4.10: Kensington Road On-Road
Bicycle Lanes
14M2307000 // 21/08/15
Integrated Transport and Access Plan // Issue: Final
West Melbourne Waterfront, Development Plan 22
It is anticipated that this route may be formalised with development of the Joseph Road precinct,
notwithstanding the difficulty in providing suitable bicycle facilities on the Hopkins Street bridge.
Conclusion
The site is located amongst an attractive external cycling network. There is an
opportunity to integrate the development with existing facilities along the Maribyrnong
River as well as routes to the CBD to provide an attractive and safe cycling
environment for future occupants and visitors.
4.5 Existing Pedestrian Infrastructure
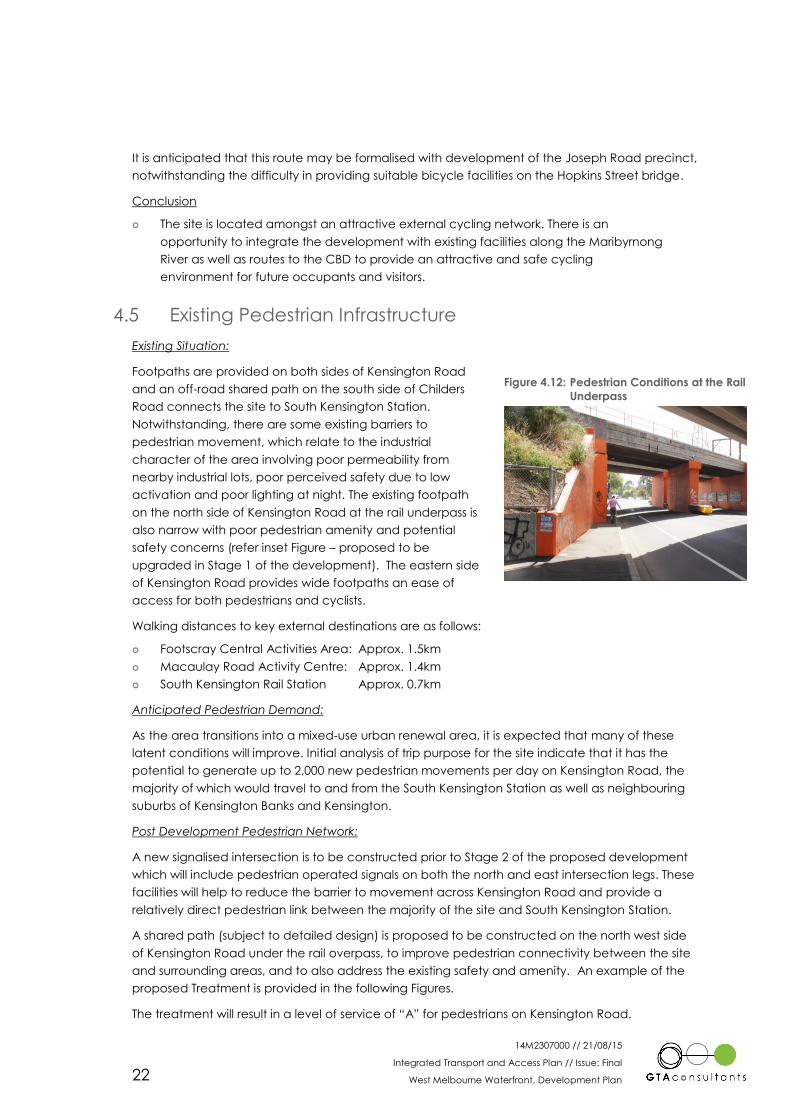
Existing Situation:
Footpaths are provided on both sides of Kensington Road
and an off-road shared path on the south side of Childers
Road connects the site to South Kensington Station.
Notwithstanding, there are some existing barriers to
pedestrian movement, which relate to the industrial
character of the area involving poor permeability from
nearby industrial lots, poor perceived safety due to low
activation and poor lighting at night. The existing footpath
on the north side of Kensington Road at the rail underpass is
also narrow with poor pedestrian amenity and potential
safety concerns (refer inset Figure – proposed to be
upgraded in Stage 1 of the development). The eastern side
of Kensington Road provides wide footpaths an ease of
access for both pedestrians and cyclists.
Walking distances to key external destinations are as follows:
Footscray Central Activities Area: Approx. 1.5km
Macaulay Road Activity Centre: Approx. 1.4km
South Kensington Rail Station Approx. 0.7km
Anticipated Pedestrian Demand:
As the area transitions into a mixed-use urban renewal area, it is expected that many of these
latent conditions will improve. Initial analysis of trip purpose for the site indicate that it has the
potential to generate up to 2,000 new pedestrian movements per day on Kensington Road, the
majority of which would travel to and from the South Kensington Station as well as neighbouring
suburbs of Kensington Banks and Kensington.
Post Development Pedestrian Network:
A new signalised intersection is to be constructed prior to Stage 2 of the proposed development
which will include pedestrian operated signals on both the north and east intersection legs. These
facilities will help to reduce the barrier to movement across Kensington Road and provide a
relatively direct pedestrian link between the majority of the site and South Kensington Station.
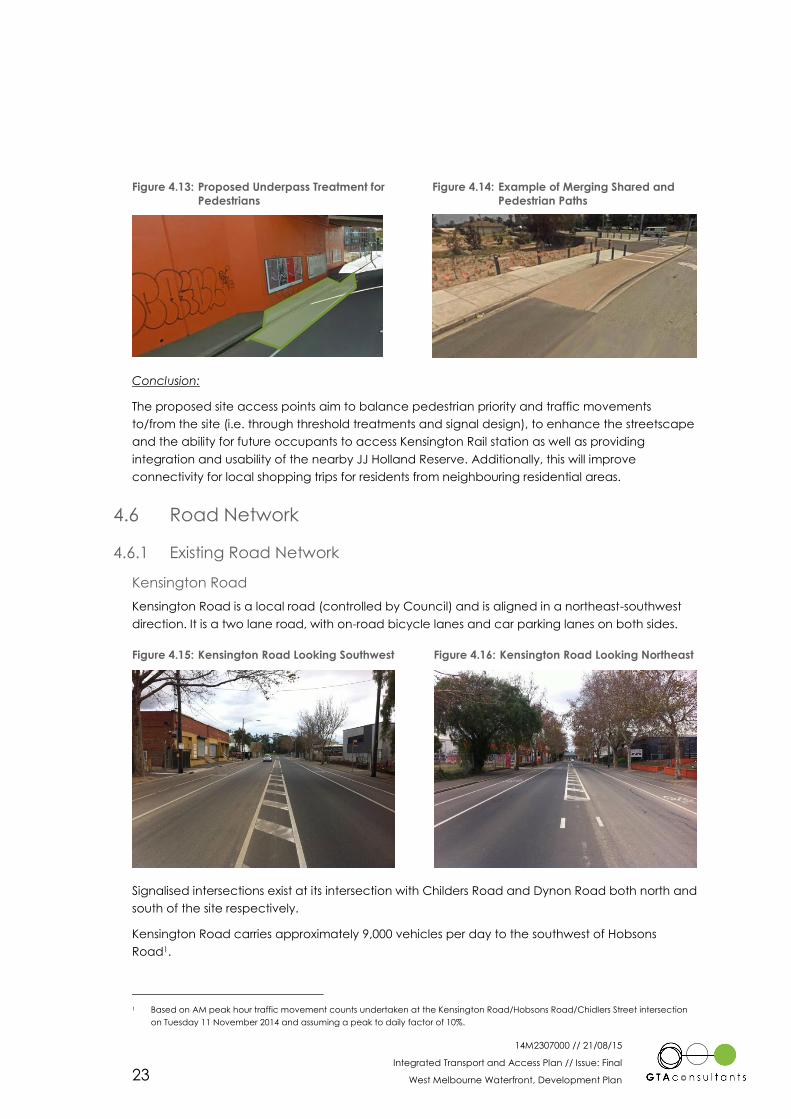
A shared path (subject to detailed design) is proposed to be constructed on the north west side
of Kensington Road under the rail overpass, to improve pedestrian connectivity between the site
and surrounding areas, and to also address the existing safety and amenity. An example of the
proposed Treatment is provided in the following Figures.
The treatment will result in a level of service of “A” for pedestrians on Kensington Road.
Figure 4.12: Pedestrian Conditions at the Rail
Underpass
14M2307000 // 21/08/15
Integrated Transport and Access Plan // Issue: Final
West Melbourne Waterfront, Development Plan 23
Figure 4.13: Proposed Underpass Treatment for
Pedestrians
Figure 4.14: Example of Merging Shared and
Pedestrian Paths
Conclusion:
The proposed site access points aim to balance pedestrian priority and traffic movements
to/from the site (i.e. through threshold treatments and signal design), to enhance the streetscape
and the ability for future occupants to access Kensington Rail station as well as providing
integration and usability of the nearby JJ Holland Reserve. Additionally, this will improve
connectivity for local shopping trips for residents from neighbouring residential areas.
4.6 Road Network
4.6.1 Existing Road Network
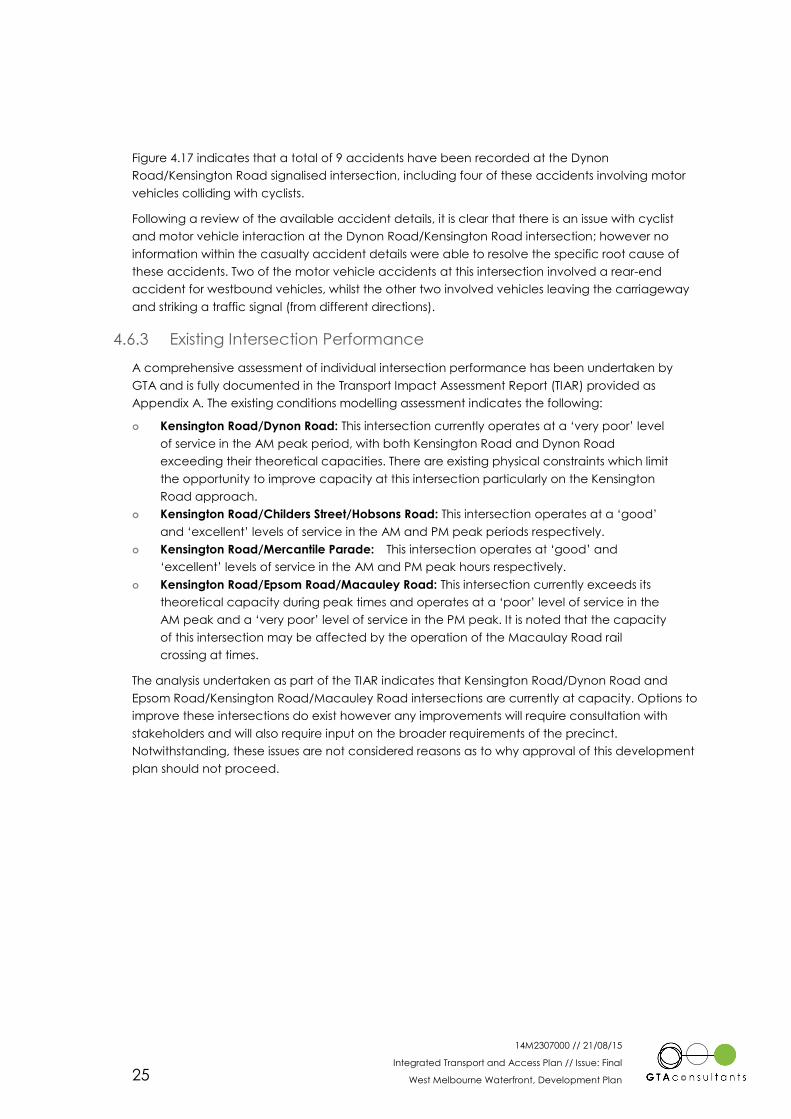
Kensington Road
Kensington Road is a local road (controlled by Council) and is aligned in a northeast-southwest
direction. It is a two lane road, with on-road bicycle lanes and car parking lanes on both sides.
Figure 4.15: Kensington Road Looking Southwest Figure 4.16: Kensington Road Looking Northeast
Signalised intersections exist at its intersection with Childers Road and Dynon Road both north and
south of the site respectively.
Kensington Road carries approximately 9,000 vehicles per day to the southwest of Hobsons
Road1.
1 Based on AM peak hour traffic movement counts undertaken at the Kensington Road/Hobsons Road/Chidlers Street intersection
on Tuesday 11 November 2014 and assuming a peak to daily factor of 10%.

14M2307000 // 21/08/15
Integrated Transport and Access Plan // Issue: Final
West Melbourne Waterfront, Development Plan 24
Dynon Road
Dynon Road is a primary arterial road (Road Zone 1) aligned in an east-west orientation
connecting Footscray and the Melbourne CBD (Spencer Street), and running past the Port of
Melbourne servicing port and freight traffic. It is generally a four lane road with two traffic lanes in
each direction plus turning lanes. It provides access to Citylink and from this to the Tullamarine,
Westgate and Monash Freeways.
Dynon Road is identified in Plan Melbourne as a future high frequency public transport corridor
The intersection of Dynon Road/Kensington Road has road space available to increase its
capacity in terms of the number of turn lanes and the like.
Dynon Road carries approximately 40,000 vehicles per day to the east of Kensington Road2.
4.6.2 Road Safety
A review of the reported casualty accident history for the roads and intersections adjoining the
subject site has been sourced from VicRoads CrashStats accident database. This database
records all accidents causing injury that have occurred in Victoria since 1987. Not all crashes are
accounted for, as accidents without injury are not reported.
Figure 4.17: Casualty Accident Locations
2 Based on AM peak hour traffic movement counts undertaken at the Kensington Road/Dynon Road intersection on Tuesday 11
November 2014 and assuming a peak to daily factor of 8%.
14M2307000 // 21/08/15
Integrated Transport and Access Plan // Issue: Final
West Melbourne Waterfront, Development Plan 25
Figure 4.17 indicates that a total of 9 accidents have been recorded at the Dynon
Road/Kensington Road signalised intersection, including four of these accidents involving motor
vehicles colliding with cyclists.
Following a review of the available accident details, it is clear that there is an issue with cyclist
and motor vehicle interaction at the Dynon Road/Kensington Road intersection; however no
information within the casualty accident details were able to resolve the specific root cause of
these accidents. Two of the motor vehicle accidents at this intersection involved a rear-end
accident for westbound vehicles, whilst the other two involved vehicles leaving the carriageway
and striking a traffic signal (from different directions).
4.6.3 Existing Intersection Performance
A comprehensive assessment of individual intersection performance has been undertaken by
GTA and is fully documented in the Transport Impact Assessment Report (TIAR) provided as
Appendix A. The existing conditions modelling assessment indicates the following:
Kensington Road/Dynon Road: This intersection currently operates at a ‘very poor’ level
of service in the AM peak period, with both Kensington Road and Dynon Road
exceeding their theoretical capacities. There are existing physical constraints which limit
the opportunity to improve capacity at this intersection particularly on the Kensington
Road approach.
Kensington Road/Childers Street/Hobsons Road: This intersection operates at a ‘good’
and ‘excellent’ levels of service in the AM and PM peak periods respectively.
Kensington Road/Mercantile Parade: This intersection operates at ‘good’ and
‘excellent’ levels of service in the AM and PM peak hours respectively.
Kensington Road/Epsom Road/Macauley Road: This intersection currently exceeds its
theoretical capacity during peak times and operates at a ‘poor’ level of service in the
AM peak and a ‘very poor’ level of service in the PM peak. It is noted that the capacity
of this intersection may be affected by the operation of the Macaulay Road rail
crossing at times.
The analysis undertaken as part of the TIAR indicates that Kensington Road/Dynon Road and
Epsom Road/Kensington Road/Macauley Road intersections are currently at capacity. Options to
improve these intersections do exist however any improvements will require consultation with
stakeholders and will also require input on the broader requirements of the precinct.
Notwithstanding, these issues are not considered reasons as to why approval of this development
plan should not proceed.
14M2307000 // 21/08/15
Integrated Transport and Access Plan // Issue: Final
West Melbourne Waterfront, Development Plan 26
5. Strategic Response
5.1 Principles
Three high level principles have been developed to inform the transport network and public
realm within and surrounding the development:
Creating a safe, attractive and accessible public realm.
Supporting sustainable travel behaviour for residents, employees and visitors to the site.
Improving linkages between the site and surrounding areas (including key land use
attractors such as South Kensington Railway Station).
These principles are each elaborated categorically below. In addition, a modal hierarchy has
been adopted within the site to support the above principles. This is detailed at Section 5.2.
Public Realm
The creation of a safe, attractive and accessible public realm relies on a range of measures:
Providing an attractive environment for walking within the site, including shade, shelter,
seating, adequate lighting, and other supporting infrastructure such as water fountains
at key locations.
Ensuring design speeds for vehicles are low, so that pedestrians are able to move freely
about the site including across roads.
Ensuring the urban design of spaces encourages passive surveillance and supports
Crime Prevention Through Environmental Design (CPTED) principles.
Concentration of vehicular access at the periphery of the site.
Supporting Sustainable Travel Behaviour
Ranges of supporting measures are proposed to increase sustainable mode share (walking,
cycling and public transport). Many of these issues will be resolved during the detailed design
(planning permit) stage, and may include:
Providing bicycle end of trip facilities.
Providing car parking at sustainable rates.
Green travel planning to support individual developments (upon development).
Adopting lower speed limits and design speeds within the development to support
walking and cycling as a mode of choice.
Improved Linkages
Improved external linkages are critical to the success of the site as its integration with surrounding
residential areas and other services. In particular, the following key connections are critical to the
success of the scheme:
Providing links to and from the site to allow direct, safe access to key nodes such as
South Kensington Railway Station and the Childers Street shared path.
Supporting integration with adjacent public transport infrastructure (bus stops) which
abut the frontage of the site.
Providing direct, safe and amenable access to adjacent parklands and recreation
opportunities.
Providing bicycle infrastructure within the site and its immediate vicinity, in order to
better link with key bicycle routes on the Principal Bicycle Network.
5
14M2307000 // 21/08/15
Integrated Transport and Access Plan // Issue: Final
West Melbourne Waterfront, Development Plan 27
5.2 Modal Hierarchy
A ‘road user hierarchy’ is a ranking system by which priority is allocated to each transport mode
for the purpose of informing funding decisions, planning, and design of transport infrastructure.
The road user hierarchy should be used as a reference to balance outcomes for road users and
to ensure safe and sustainable transport outcomes are achieved.
The internal road user hierarchy to be adopted is shown below, in order of preferred priority
modes (more sustainable) to less preferred modes.
Pedestrians
Cyclists
Public Transport
Freight(local)
Private Vehicle Local Traffic
Through Traffic
This hierarchy has informed the development of the internal street network, which can generally
be characterised as a low speed, low traffic volume environment (with some higher volumes
adjacent access points to Kensington Road).
The only external road network abutting the subject site is Kensington Road which is a local road
for which Melbourne City Council is the responsible Authority. Modal hierarchies for this road are
provided by the SmartRoads Network Operating Plans (managed by VicRoads) as shown in
Section 3.2.3, and includes the designation of Kensington Road as a Bicycle Priority Route and Bus
Priority Route Notwithstanding the above, appropriate pedestrian facilities and crossings will be
required providing connectivity between the site and key destinations including South Kensington
Station.
14M2307000 // 21/08/15
Integrated Transport and Access Plan // Issue: Final
West Melbourne Waterfront, Development Plan 28
6. Development Proposal
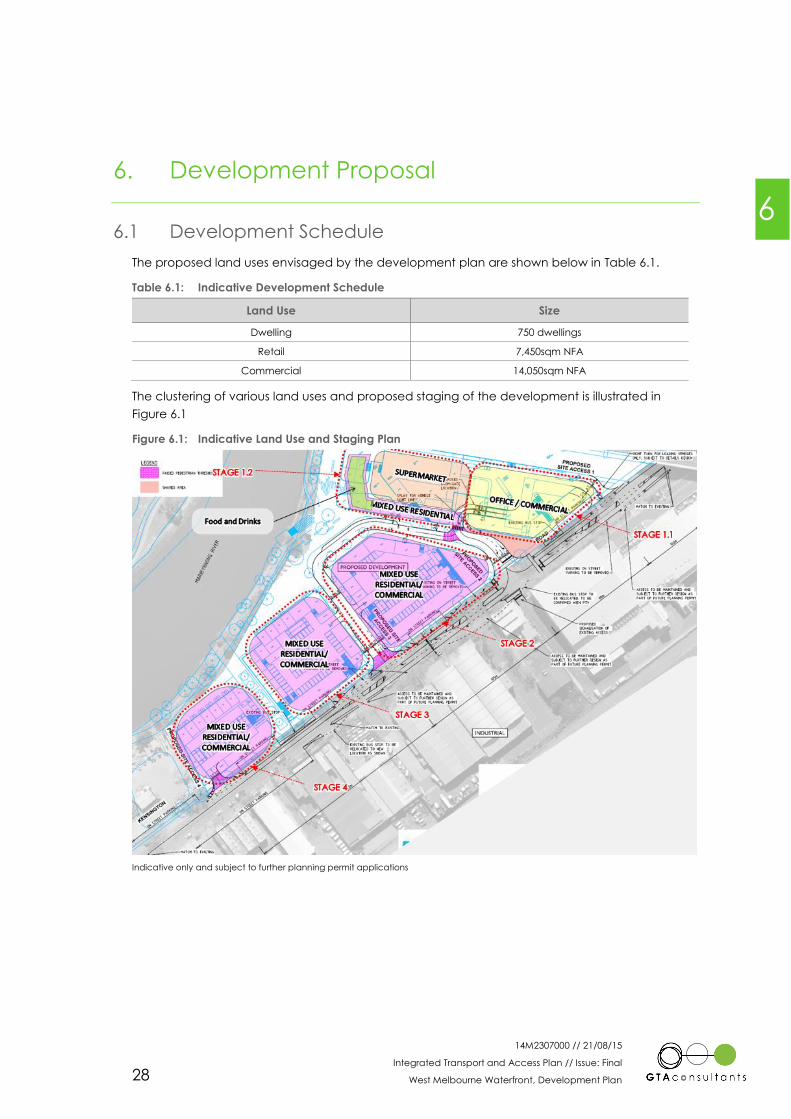
6.1 Development Schedule
The proposed land uses envisaged by the development plan are shown below in Table 6.1.
Table 6.1: Indicative Development Schedule
Land Use Size
Dwelling 750 dwellings
Retail 7,450sqm NFA
Commercial 14,050sqm NFA
The clustering of various land uses and proposed staging of the development is illustrated in
Figure 6.1
Figure 6.1: Indicative Land Use and Staging Plan
Indicative only and subject to further planning permit applications
6
14M2307000 // 21/08/15
Integrated Transport and Access Plan // Issue: Final
West Melbourne Waterfront, Development Plan 29
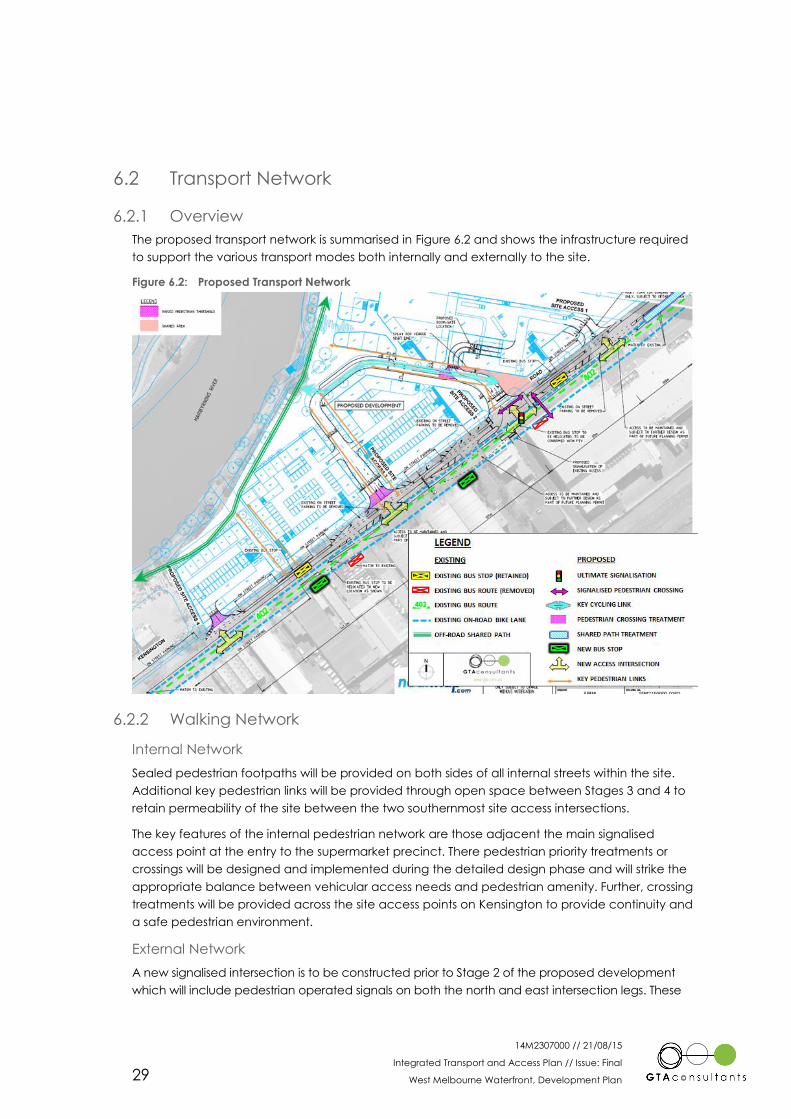
6.2 Transport Network
6.2.1 Overview
The proposed transport network is summarised in Figure 6.2 and shows the infrastructure required
to support the various transport modes both internally and externally to the site.
Figure 6.2: Proposed Transport Network
6.2.2 Walking Network
Internal Network
Sealed pedestrian footpaths will be provided on both sides of all internal streets within the site.
Additional key pedestrian links will be provided through open space between Stages 3 and 4 to
retain permeability of the site between the two southernmost site access intersections.
The key features of the internal pedestrian network are those adjacent the main signalised
access point at the entry to the supermarket precinct. There pedestrian priority treatments or
crossings will be designed and implemented during the detailed design phase and will strike the
appropriate balance between vehicular access needs and pedestrian amenity. Further, crossing
treatments will be provided across the site access points on Kensington to provide continuity and
a safe pedestrian environment.
External Network
A new signalised intersection is to be constructed prior to Stage 2 of the proposed development
which will include pedestrian operated signals on both the north and east intersection legs. These
14M2307000 // 21/08/15
Integrated Transport and Access Plan // Issue: Final
West Melbourne Waterfront, Development Plan 30
facilities will help to reduce the barrier to movement across Kensington Road and provide a
relatively direct pedestrian link between the majority of the site and South Kensington Station.
A shared path (subject to detailed design) is proposed to be constructed on the north west side
of Kensington Road under the rail overpass, to improve pedestrian connectivity between the site
and surrounding areas, and to also address the existing safety and amenity.
Summary
The internal and external pedestrian network improvements proposed for the development are
illustrated in Figure 6.2, and are summarised in Table 6.2
Table 6.2: Pedestrian Network Improvements Summary
# Action Responsibility Timing
P.1 Construct pedestrian footpaths on both sides of all internal
roads Applicant
At construction of
adjacent Stages
P.2 Implement pedestrian priority crossings adjacent the internal T-
intersection for the supermarket access as shown in Figure 6.2 Applicant
At construction of
adjacent Stages
P.3
Implement raised threshold pedestrian crossing points at the
intersection of site access roads with Kensington Road as
shown in Figure 6.2
Applicant At time of access
road construction
P.4
Provide signalised pedestrian crossings on the north and east
approaches of the primary site access intersection as shown in
Figure 6.2.
Applicant Stage 2
P.5 Widen the pedestrian footpath on the north west side of
Kensington Road, under the rail underpass Applicant Stage 1
6.2.3 Cycling Network
Internal Bicycle Network
Cycling traffic on all internal roads will be shared with motor vehicle traffic. This is suitable when
having regard to the low traffic movements estimated on the majority of roads as well as the
proposed 40km/hr local traffic area speed zone (to be confirmed).
This shared traffic environment is considered to be a more efficient use of road space and is
consistent with the Austroads Guidelines which suggest that a mixed traffic approach is
appropriate when traffic volumes are up to 5,000 vehicles/day and at operating speeds of
40km/hr or less.
In the interim (prior to construction of the loop road), provision is made for basic connectivity
between Kensington Road and the Maribyrnong River off-road shared path. Once fully
constructed, east-west connectivity for cyclists will be provided within the carriageway in a mixed
traffic environment.
External Bicycle Network
External to the site, it is proposed that an off-road shared path facility be provided along the
north west side of Kensington Road underneath the rail crossing, to improve the existing
arrangement which provides a very narrow footpath and discontinuous on-road bicycle lane on
the intersection approach to the Kensington Road/Childers Road/Hobsons Road intersection.
Summary
The internal and external bicycle network improvements proposed for the development are
illustrated in Figure 6.2, and are summarised below in table 6.3.
14M2307000 // 21/08/15
Integrated Transport and Access Plan // Issue: Final
West Melbourne Waterfront, Development Plan 31
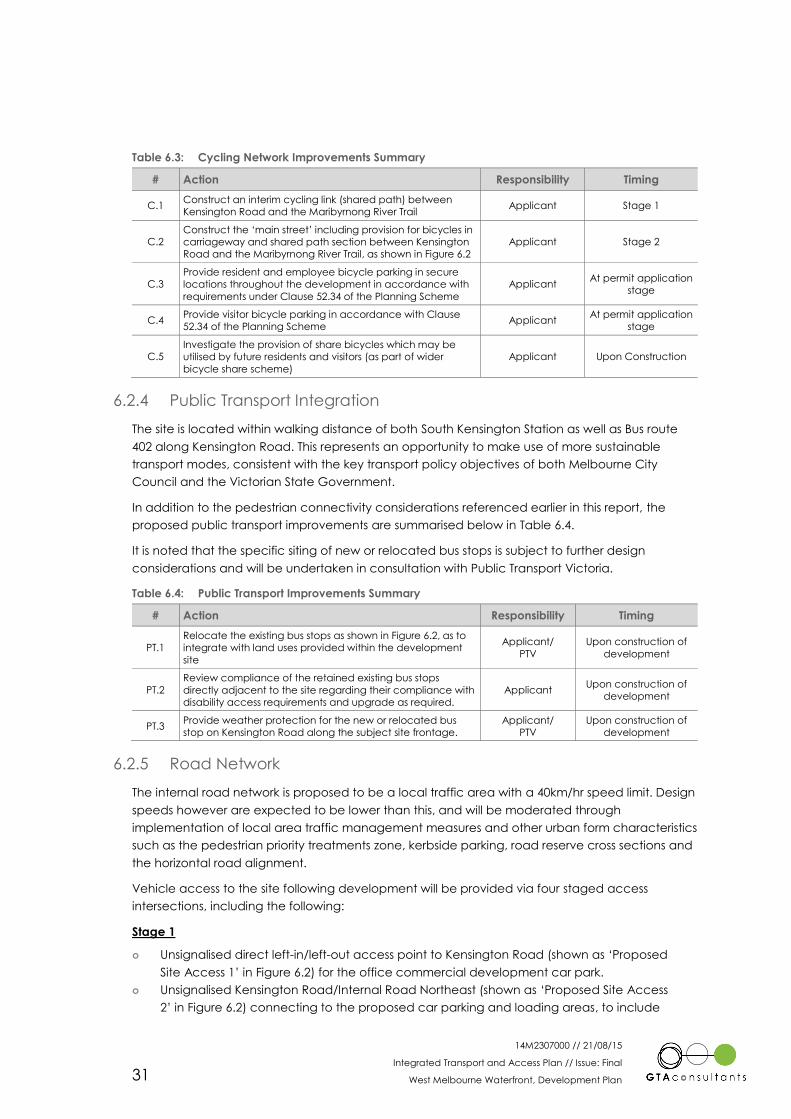
Table 6.3: Cycling Network Improvements Summary
# Action Responsibility Timing
C.1 Construct an interim cycling link (shared path) between
Kensington Road and the Maribyrnong River Trail Applicant Stage 1
C.2 Construct the ‘main street’ including provision for bicycles in
carriageway and shared path section between Kensington
Road and the Maribyrnong River Trail, as shown in Figure 6.2
Applicant Stage 2
C.3 Provide resident and employee bicycle parking in secure
locations throughout the development in accordance with
requirements under Clause 52.34 of the Planning Scheme
Applicant At permit application
stage
C.4 Provide visitor bicycle parking in accordance with Clause
52.34 of the Planning Scheme Applicant
At permit application
stage
C.5 Investigate the provision of share bicycles which may be
utilised by future residents and visitors (as part of wider
bicycle share scheme)
Applicant Upon Construction
6.2.4 Public Transport Integration
The site is located within walking distance of both South Kensington Station as well as Bus route
402 along Kensington Road. This represents an opportunity to make use of more sustainable
transport modes, consistent with the key transport policy objectives of both Melbourne City
Council and the Victorian State Government.
In addition to the pedestrian connectivity considerations referenced earlier in this report, the
proposed public transport improvements are summarised below in Table 6.4.
It is noted that the specific siting of new or relocated bus stops is subject to further design
considerations and will be undertaken in consultation with Public Transport Victoria.
Table 6.4: Public Transport Improvements Summary
# Action Responsibility Timing
PT.1
Relocate the existing bus stops as shown in Figure 6.2, as to
integrate with land uses provided within the development
site
Applicant/
PTV
Upon construction of
development
PT.2
Review compliance of the retained existing bus stops
directly adjacent to the site regarding their compliance with
disability access requirements and upgrade as required.
Applicant Upon construction of
development
PT.3 Provide weather protection for the new or relocated bus
stop on Kensington Road along the subject site frontage.
Applicant/
PTV
Upon construction of
development
6.2.5 Road Network
The internal road network is proposed to be a local traffic area with a 40km/hr speed limit. Design
speeds however are expected to be lower than this, and will be moderated through
implementation of local area traffic management measures and other urban form characteristics
such as the pedestrian priority treatments zone, kerbside parking, road reserve cross sections and
the horizontal road alignment.
Vehicle access to the site following development will be provided via four staged access
intersections, including the following:
Stage 1
Unsignalised direct left-in/left-out access point to Kensington Road (shown as ‘Proposed
Site Access 1’ in Figure 6.2) for the office commercial development car park.
Unsignalised Kensington Road/Internal Road Northeast (shown as ‘Proposed Site Access
2’ in Figure 6.2) connecting to the proposed car parking and loading areas, to include
14M2307000 // 21/08/15
Integrated Transport and Access Plan // Issue: Final
West Melbourne Waterfront, Development Plan 32
dedicated left and right turn deceleration lanes on entry as well as left and right turn
stand-up lanes for exiting traffic.
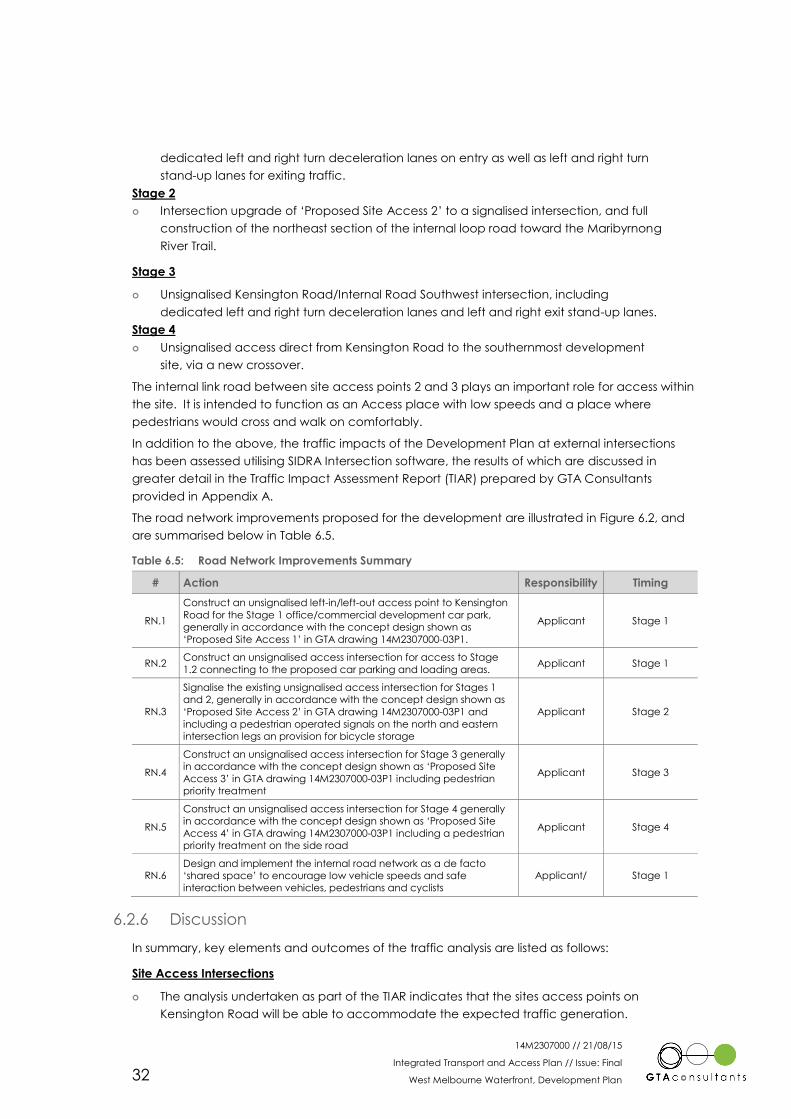
Stage 2
Intersection upgrade of ‘Proposed Site Access 2’ to a signalised intersection, and full
construction of the northeast section of the internal loop road toward the Maribyrnong
River Trail.
Stage 3
Unsignalised Kensington Road/Internal Road Southwest intersection, including
dedicated left and right turn deceleration lanes and left and right exit stand-up lanes.
Stage 4
Unsignalised access direct from Kensington Road to the southernmost development
site, via a new crossover.
The internal link road between site access points 2 and 3 plays an important role for access within
the site. It is intended to function as an Access place with low speeds and a place where
pedestrians would cross and walk on comfortably.
In addition to the above, the traffic impacts of the Development Plan at external intersections
has been assessed utilising SIDRA Intersection software, the results of which are discussed in
greater detail in the Traffic Impact Assessment Report (TIAR) prepared by GTA Consultants
provided in Appendix A.
The road network improvements proposed for the development are illustrated in Figure 6.2, and
are summarised below in Table 6.5.
Table 6.5: Road Network Improvements Summary
# Action Responsibility Timing
RN.1
Construct an unsignalised left-in/left-out access point to Kensington
Road for the Stage 1 office/commercial development car park,
generally in accordance with the concept design shown as
‘Proposed Site Access 1’ in GTA drawing 14M2307000-03P1.
Applicant Stage 1
RN.2 Construct an unsignalised access intersection for access to Stage
1.2 connecting to the proposed car parking and loading areas. Applicant Stage 1
RN.3
Signalise the existing unsignalised access intersection for Stages 1
and 2, generally in accordance with the concept design shown as
‘Proposed Site Access 2’ in GTA drawing 14M2307000-03P1 and
including a pedestrian operated signals on the north and eastern
intersection legs an provision for bicycle storage
Applicant Stage 2
RN.4
Construct an unsignalised access intersection for Stage 3 generally
in accordance with the concept design shown as ‘Proposed Site
Access 3’ in GTA drawing 14M2307000-03P1 including pedestrian
priority treatment
Applicant Stage 3
RN.5
Construct an unsignalised access intersection for Stage 4 generally
in accordance with the concept design shown as ‘Proposed Site
Access 4’ in GTA drawing 14M2307000-03P1 including a pedestrian
priority treatment on the side road
Applicant Stage 4
RN.6 Design and implement the internal road network as a de facto
‘shared space’ to encourage low vehicle speeds and safe
interaction between vehicles, pedestrians and cyclists
Applicant/ Stage 1
6.2.6 Discussion
In summary, key elements and outcomes of the traffic analysis are listed as follows:
Site Access Intersections
The analysis undertaken as part of the TIAR indicates that the sites access points on
Kensington Road will be able to accommodate the expected traffic generation.
14M2307000 // 21/08/15
Integrated Transport and Access Plan // Issue: Final
West Melbourne Waterfront, Development Plan 33
External Intersections
The capacity of the Dynon Road / Kensington Road intersection is constrained.
Improving the intersection should not be viewed to be an outcome of this proposal for
a number of reasons including:
o Limited road space exists on Kensington Road to provide substantial capacity
increases. One such improvement investigated would result in a loss in car
parking.
o The right turn lane from Dynon Road into Kensington Road cannot be increased
without affecting the existing transfer station site on the south side of Dynon Road.
o Any works to increase east west capacity on Dynon Road would have an
insignificant nexus with this development. While detailed studies are not yet
available, the East West link western section is likely to reduce traffic volumes on
this link. It is recognised that uncertainty for the project exists, however its need is
not undisputed. It is recognised that there is uncertainty over the timing and design
of this project.
o The impact of the Melbourne Metro Rail Project will provide increased rail capacity
between Parkville, the CBD and the western suburbs. Detailed modelling and
outputs are not available however this project is expected to result in a major
increase in rail mode share and reduce the vehicle demand for Dynon Road.
o The role of the Dynon precinct as depicted in Plan Melbourne, and its potential
treatment as a Boulevard.
o Further dialogue and consultation will be required with the relevant authorities to
understand the future transport conditions for the precinct, and its impact on the
Dynon Road / Kensington Road intersection, and to determine the appropriate
quantum (if any) that this development should contribute.
The Epsom Road / Kensington Road / Macaulay Road intersection is anticipated to
slightly reduce in the level of service. There is, however, a limited need or nexus for this
development to resolve an existing capacity issue. Further, limited ability exists to
meaningfully improve its capacity. The role of Kensington Road as a collector road,
rather than a through route, supports the approach that it should be maintained in its
current format.
Traffic Distribution through neighbouring residential areas
The existing issue of ‘rat running’ through Kensington Banks and past the site has been
discussed with the City of Melbourne.
This issue is considered partly a result of relatively free flowing traffic conditions. The
development is expected to reinforce the role of Kensington Road as a local
destination and as such may affect its desirability as part of the rat running route
through the area.
The site will generate a small number of trips to/from the north, of which some may
choose to access through Kensington Banks. It is noted that this is an existing issue, and
given the possible displacement of non-local traffic discussed above, is unlikely to
worsen noticeably as a result of the development. If required, further traffic calming
measures or signage could be considered to further reduce rat running through
Kensington Banks, however the nexus with this development is considered to be minor.
In addition, the mix of uses on the site (including a supermarket and significant
employment uses) is likely to benefit local residents, who will form the main catchment
for the supermarket.
14M2307000 // 21/08/15
Integrated Transport and Access Plan // Issue: Final
West Melbourne Waterfront, Development Plan 34
6.3 Statutory Considerations
6.3.1 Car Parking (Clause 52.06)
Statutory car parking requirements for new development are outlined in Clause 52.06 of the
Victoria Planning Provisions. Further, Clause 52.06 provides a number of decision guidelines for
determining instances of where a dispensation from the statutory rate is considered appropriate
or acceptable.
Having regard to the strategic location of the site and its access to public transport and active
travel modes, in line with sustainable transport objectives, the provision of parking at rates lower
than the statutory rates is considered to be suitable. Further, based on the likely demands of
future residents (as briefly discussed in in Section 4.2.3)) it is evident that a reduction from the
statutory rates may be appropriate for the residential component.
An assessment of empirical car parking demands expected to be generated by the site are
documented in the Transport Impact Assessment included as an Annex to this report.
6.3.2 On-Street Car Parking
Approximately 53 on-street car parking spaces on both sides of Kensington Road are anticipated
to be lost due to the proposed site access arrangements as well as the reconfiguration of
Kensington Road. This loss of on-street parking spaces could possibly be offset by the availability
of spaces in the public parking areas of the proposed development, noting that consultation
would be required with adjoining businesses and land owners. It is anticipated the impact to on-
street car parking will be investigated in consultation with the City of Melbourne and relevant
stakeholders as part of a permit condition.
In addition, an existing bus stop located on the southern side of Kensington Road opposite
proposed Site Access 2, is proposed to be relocated approximately 200m south-east of the
existing bus stop. It is noted that this is subject to further investigation and consultation with Public
Transport Victoria and would be undertaken at later stage of the project. The location of the on-
street spaces lost as well as site access arrangements have been shown conceptually in a plan
prepared by GTA included as Appendix C to the TIAR.
6.3.3 Bicycle Parking (Clause 52.34)
Provision
Clause 52.34 of the Melbourne Planning Scheme presents the statutory bicycle parking rates for
new development applications. The statutory bicycle parking requirements using these rates are
presented in Table 6.6.
At a minimum, statutory provisions for bicycle parking will be met. In instances where a waiver of
car parking is being sought, it is recommended that an increased provision of bicycle facilities be
provided, in the order of one space per dwelling.
An assessment of the minimum statutory requirements for bicycle parking based on the
preliminary yields is set out below in Table 6.6.
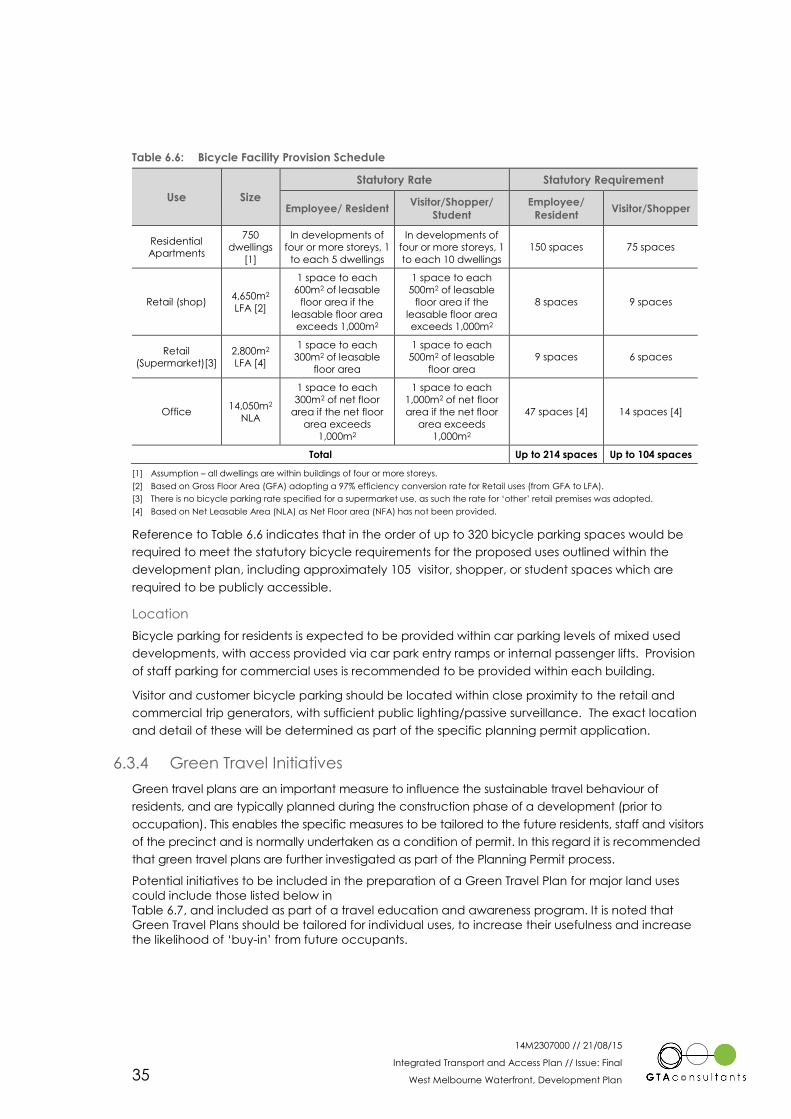
14M2307000 // 21/08/15
Integrated Transport and Access Plan // Issue: Final
West Melbourne Waterfront, Development Plan 35
Table 6.6: Bicycle Facility Provision Schedule
Use Size
Statutory Rate Statutory Requirement
Employee/ Resident Visitor/Shopper/
Student
Employee/
Resident Visitor/Shopper
Residential
Apartments
750
dwellings
[1]
In developments of
four or more storeys, 1
to each 5 dwellings
In developments of
four or more storeys, 1
to each 10 dwellings
150 spaces 75 spaces
Retail (shop) 4,650m2
LFA [2]
1 space to each
600m2 of leasable
floor area if the
leasable floor area
exceeds 1,000m2
1 space to each
500m2 of leasable
floor area if the
leasable floor area
exceeds 1,000m2
8 spaces 9 spaces
Retail
(Supermarket)[3]
2,800m2
LFA [4]
1 space to each
300m2 of leasable
floor area
1 space to each
500m2 of leasable
floor area
9 spaces 6 spaces
Office 14,050m2
NLA
1 space to each
300m2 of net floor
area if the net floor
area exceeds
1,000m2
1 space to each
1,000m2 of net floor
area if the net floor
area exceeds
1,000m2
47 spaces [4] 14 spaces [4]
Total Up to 214 spaces Up to 104 spaces
[1] Assumption – all dwellings are within buildings of four or more storeys.
[2] Based on Gross Floor Area (GFA) adopting a 97% efficiency conversion rate for Retail uses (from GFA to LFA).
[3] There is no bicycle parking rate specified for a supermarket use, as such the rate for ‘other’ retail premises was adopted.
[4] Based on Net Leasable Area (NLA) as Net Floor area (NFA) has not been provided.
Reference to Table 6.6 indicates that in the order of up to 320 bicycle parking spaces would be
required to meet the statutory bicycle requirements for the proposed uses outlined within the
development plan, including approximately 105 visitor, shopper, or student spaces which are
required to be publicly accessible.
Location
Bicycle parking for residents is expected to be provided within car parking levels of mixed used
developments, with access provided via car park entry ramps or internal passenger lifts. Provision
of staff parking for commercial uses is recommended to be provided within each building.
Visitor and customer bicycle parking should be located within close proximity to the retail and
commercial trip generators, with sufficient public lighting/passive surveillance. The exact location
and detail of these will be determined as part of the specific planning permit application.
6.3.4 Green Travel Initiatives
Green travel plans are an important measure to influence the sustainable travel behaviour of
residents, and are typically planned during the construction phase of a development (prior to
occupation). This enables the specific measures to be tailored to the future residents, staff and visitors
of the precinct and is normally undertaken as a condition of permit. In this regard it is recommended
that green travel plans are further investigated as part of the Planning Permit process.
Potential initiatives to be included in the preparation of a Green Travel Plan for major land uses
could include those listed below in
Table 6.7, and included as part of a travel education and awareness program. It is noted that
Green Travel Plans should be tailored for individual uses, to increase their usefulness and increase
the likelihood of ‘buy-in’ from future occupants.
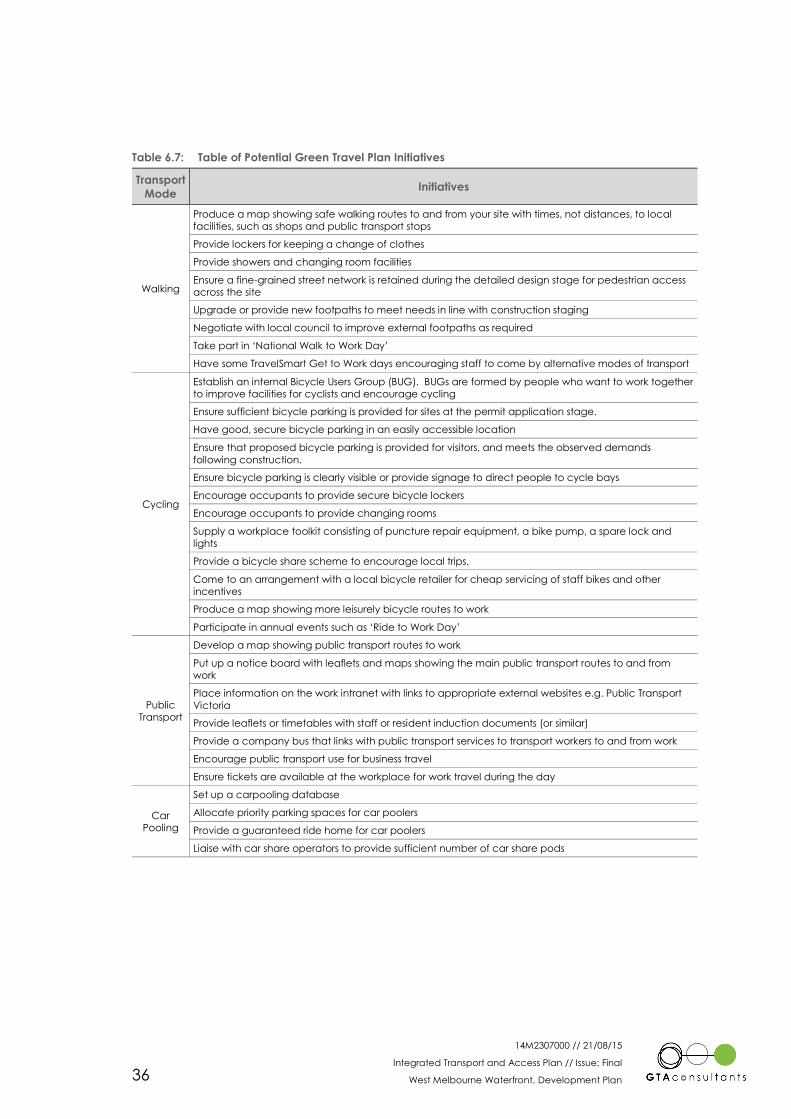
14M2307000 // 21/08/15
Integrated Transport and Access Plan // Issue: Final
West Melbourne Waterfront, Development Plan 36
Table 6.7: Table of Potential Green Travel Plan Initiatives
Transport
Mode Initiatives
Walking
Produce a map showing safe walking routes to and from your site with times, not distances, to local
facilities, such as shops and public transport stops
Provide lockers for keeping a change of clothes
Provide showers and changing room facilities
Ensure a fine-grained street network is retained during the detailed design stage for pedestrian access
across the site
Upgrade or provide new footpaths to meet needs in line with construction staging
Negotiate with local council to improve external footpaths as required
Take part in ‘National Walk to Work Day’
Have some TravelSmart Get to Work days encouraging staff to come by alternative modes of transport
Cycling
Establish an internal Bicycle Users Group (BUG). BUGs are formed by people who want to work together
to improve facilities for cyclists and encourage cycling
Ensure sufficient bicycle parking is provided for sites at the permit application stage.
Have good, secure bicycle parking in an easily accessible location
Ensure that proposed bicycle parking is provided for visitors, and meets the observed demands
following construction.
Ensure bicycle parking is clearly visible or provide signage to direct people to cycle bays
Encourage occupants to provide secure bicycle lockers
Encourage occupants to provide changing rooms
Supply a workplace toolkit consisting of puncture repair equipment, a bike pump, a spare lock and
lights
Provide a bicycle share scheme to encourage local trips.
Come to an arrangement with a local bicycle retailer for cheap servicing of staff bikes and other
incentives
Produce a map showing more leisurely bicycle routes to work
Participate in annual events such as ‘Ride to Work Day’
Public
Transport
Develop a map showing public transport routes to work
Put up a notice board with leaflets and maps showing the main public transport routes to and from
work
Place information on the work intranet with links to appropriate external websites e.g. Public Transport
Victoria
Provide leaflets or timetables with staff or resident induction documents (or similar)
Provide a company bus that links with public transport services to transport workers to and from work
Encourage public transport use for business travel
Ensure tickets are available at the workplace for work travel during the day
Car
Pooling
Set up a carpooling database
Allocate priority parking spaces for car poolers
Provide a guaranteed ride home for car poolers
Liaise with car share operators to provide sufficient number of car share pods
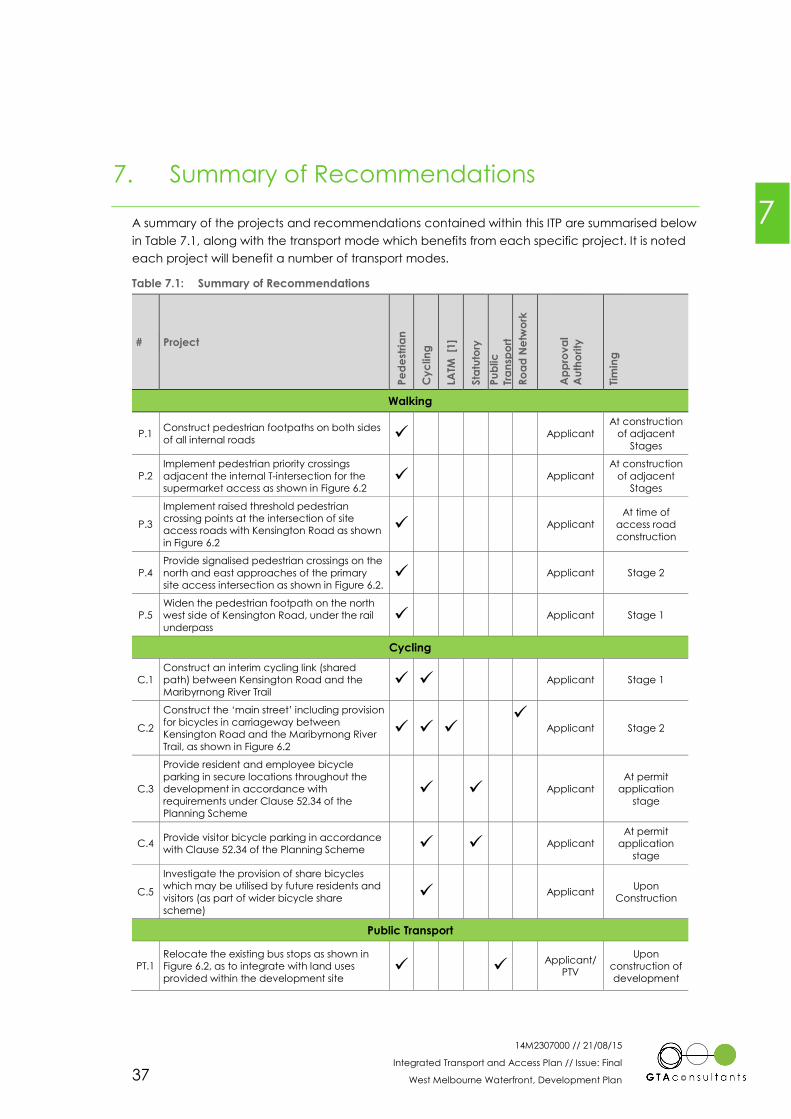
14M2307000 // 21/08/15
Integrated Transport and Access Plan // Issue: Final
West Melbourne Waterfront, Development Plan 37
7. Summary of Recommendations
A summary of the projects and recommendations contained within this ITP are summarised below
in Table 7.1, along with the transport mode which benefits from each specific project. It is noted
each project will benefit a number of transport modes.
Table 7.1: Summary of Recommendations
# Project
Pe
de
stria
n
Cy
clin
g
LATM
[1
]
Sta
tuto
ry
Pu
blic
Tra
nsp
ort
Ro
ad
Ne
two
rk
Ap
pro
va
l
Au
tho
rity
Tim
ing
Walking
P.1 Construct pedestrian footpaths on both sides
of all internal roads
Applicant
At construction
of adjacent
Stages
P.2
Implement pedestrian priority crossings
adjacent the internal T-intersection for the
supermarket access as shown in Figure 6.2
Applicant
At construction
of adjacent
Stages
P.3
Implement raised threshold pedestrian
crossing points at the intersection of site
access roads with Kensington Road as shown
in Figure 6.2
Applicant At time of
access road
construction
P.4
Provide signalised pedestrian crossings on the
north and east approaches of the primary
site access intersection as shown in Figure 6.2.
Applicant Stage 2
P.5 Widen the pedestrian footpath on the north
west side of Kensington Road, under the rail
underpass
Applicant Stage 1
Cycling
C.1
Construct an interim cycling link (shared
path) between Kensington Road and the
Maribyrnong River Trail
Applicant Stage 1
C.2
Construct the ‘main street’ including provision
for bicycles in carriageway between
Kensington Road and the Maribyrnong River
Trail, as shown in Figure 6.2
Applicant Stage 2
C.3
Provide resident and employee bicycle
parking in secure locations throughout the
development in accordance with
requirements under Clause 52.34 of the
Planning Scheme
Applicant
At permit
application
stage
C.4 Provide visitor bicycle parking in accordance
with Clause 52.34 of the Planning Scheme
Applicant At permit
application
stage
C.5
Investigate the provision of share bicycles
which may be utilised by future residents and
visitors (as part of wider bicycle share
scheme)
Applicant Upon
Construction
Public Transport
PT.1 Relocate the existing bus stops as shown in
Figure 6.2, as to integrate with land uses
provided within the development site
Applicant/
PTV
Upon
construction of
development
7
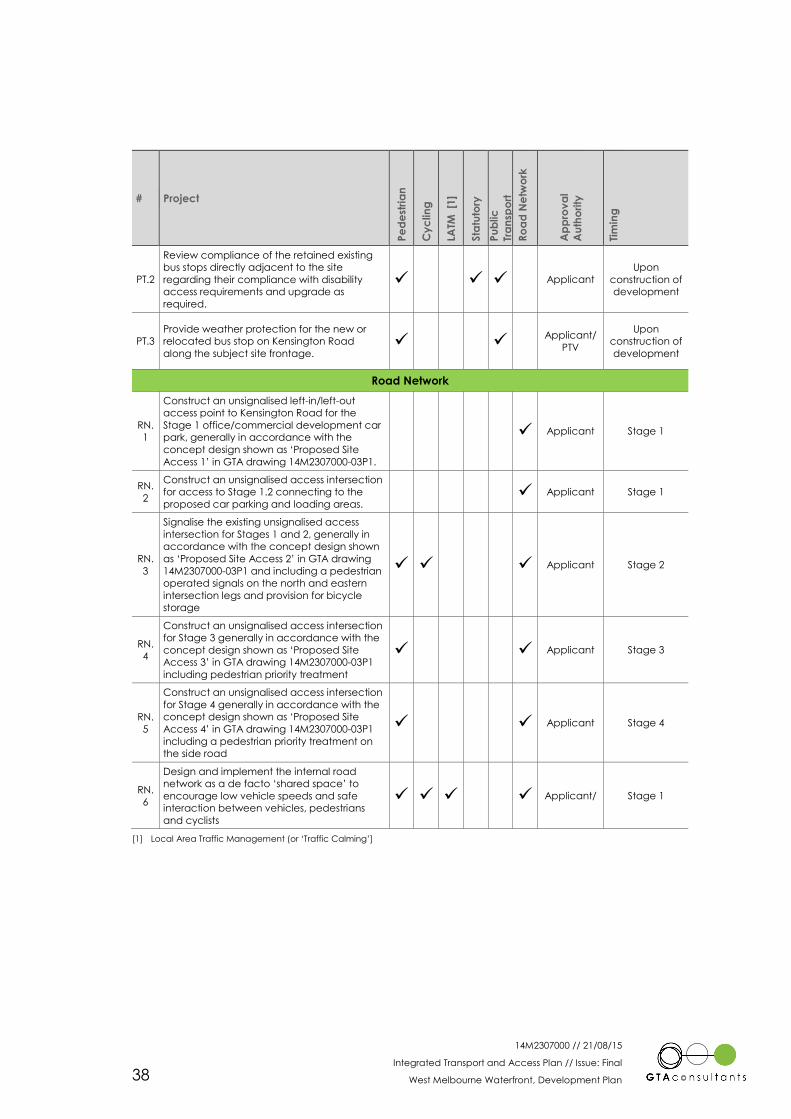
14M2307000 // 21/08/15
Integrated Transport and Access Plan // Issue: Final
West Melbourne Waterfront, Development Plan 38
# Project
Pe
de
stria
n
Cy
clin
g
LATM
[1
]
Sta
tuto
ry
Pu
blic
Tra
nsp
ort
Ro
ad
Ne
two
rk
Ap
pro
va
l
Au
tho
rity
Tim
ing
PT.2
Review compliance of the retained existing
bus stops directly adjacent to the site
regarding their compliance with disability
access requirements and upgrade as
required.
Applicant
Upon
construction of
development
PT.3
Provide weather protection for the new or
relocated bus stop on Kensington Road
along the subject site frontage.
Applicant/
PTV
Upon
construction of
development
Road Network
RN.
1
Construct an unsignalised left-in/left-out
access point to Kensington Road for the
Stage 1 office/commercial development car
park, generally in accordance with the
concept design shown as ‘Proposed Site
Access 1’ in GTA drawing 14M2307000-03P1.
Applicant Stage 1
RN.
2
Construct an unsignalised access intersection
for access to Stage 1.2 connecting to the
proposed car parking and loading areas.
Applicant Stage 1
RN.
3
Signalise the existing unsignalised access
intersection for Stages 1 and 2, generally in
accordance with the concept design shown
as ‘Proposed Site Access 2’ in GTA drawing
14M2307000-03P1 and including a pedestrian
operated signals on the north and eastern
intersection legs and provision for bicycle
storage
Applicant Stage 2
RN.
4
Construct an unsignalised access intersection
for Stage 3 generally in accordance with the
concept design shown as ‘Proposed Site
Access 3’ in GTA drawing 14M2307000-03P1
including pedestrian priority treatment
Applicant Stage 3
RN.
5
Construct an unsignalised access intersection
for Stage 4 generally in accordance with the
concept design shown as ‘Proposed Site
Access 4’ in GTA drawing 14M2307000-03P1
including a pedestrian priority treatment on
the side road
Applicant Stage 4
RN.
6
Design and implement the internal road
network as a de facto ‘shared space’ to
encourage low vehicle speeds and safe
interaction between vehicles, pedestrians
and cyclists
Applicant/ Stage 1
[1] Local Area Traffic Management (or ‘Traffic Calming’]
14M2307000 // 21/08/15
Integrated Transport and Access Plan // Issue: Final
West Melbourne Waterfront, Development Plan 39
8. Implementation, Monitoring and Review
Further detailed planning and coordination with state and local authorities will be required
through the Planning Permit application process to achieve the integrated and sustainable
outcome for the site as identified within this ITAP. The coordination should focus on assets to be
handed over to end users (e.g. footpaths and internal road ways) as well as effective integration
with future public transport facilities. In addition, liaison will be required with car share operators,
as opportunities exist to expand the offer of these facilities in the vicinity of the site.
It is also important that future planning for each site includes Green Travel Plans with robust
mechanisms (including funding and ongoing governance mechanisms) to implement a range of
travel and behaviour change programs, as applicable.
In order for green travel planning to be effective, it must be reviewed on a regular basis to ensure
that the objectives set out in section five of this report are being met. Post occupancy, it is
recommended that resident travel surveys are conducted every 1-2 years, and the results of the
surveys are used to inform a review of actions, such as targeting modes or user groups that are
not improving.
8
14M2307000 // 21/08/15
Integrated Transport and Access Plan // Issue: Final
West Melbourne Waterfront, Development Plan
Appendix A
Transport Impact Assessment
Ap
pe
nd
ix A
West Melbourne Waterfront
Development Plan
Transport Impact Assessment Report
Client // WMW Developments Pty Ltd
Office // VIC
Reference // 14M2307000
Date // 21/08/15
© GTA Consultants (GTA Consultants (VIC) Pty Ltd) 2014
The information contained in this document is confidential and
intended solely for the use of the client for the purpose for which it has
been prepared and no representation is made or is to be implied as
being made to any third party. Use or copying of this document in
whole or in part without the written permission of GTA Consultants
constitutes an infringement of copyright. The intellectual property
contained in this document remains the property of GTA Consultants.
TIA
/RSA
MA
- V
IC (
140918 v
7.1
0)
West Melbourne Waterfront
Development Plan
Transport Impact Assessment Report
Issue: Final 21/08/15
Client: WMW Developments Pty Ltd
Reference: 14M2307000
GTA Consultants Office: VIC
Quality Record
Issue Date Description Prepared By Checked By Approved By Signed
A 03/12/14 Final Mark Stephens
Emma Akiyama Reeves
Reece
Humphreys
Reece
Humphreys
F 21/08/15 Final Alex Connell Reece
Humphreys
Reece
Humphreys
14M2307000 // 21/08/15
Transport Impact Assessment // Issue: Final
West Melbourne Waterfront, Development Plan
Table of Contents
1. Introduction 1
1.1 Background & Proposal 1
1.2 Purpose of this Report 1
2. Assessment Overview 2
2.1 Introduction 2
2.2 Key Assumptions 2
2.3 Data Collection 2
2.4 SIDRA Analysis 3
3. Traffic Generation & Distribution 5
3.1 Traffic Generation 5
3.2 Traffic Distribution and Assignment 6
4. Existing Network Performance 10
4.1 Overview 10
4.2 SIDRA Analysis 10
5. Car Parking 15
5.1 Statutory Car Parking Requirements 15
5.2 Car Parking Demand Assessment 16
5.3 On-Street Parking 20
5.4 Car Parking Layout 20
6. Bicycle Parking 22
6.1 Statutory Requirements 22
7. Proposed Mitigating Works 24
7.1 Introduction 24
7.2 SIDRA Analysis 24
8. Conclusion 29
Appendices
A: Traffic Generation Rates and Distribution
B: Input Volumes
C: Concept Plan – Site Access Arrangements
D: SIDRA Movement Summaries
14M2307000 // 21/08/15
Transport Impact Assessment // Issue: Final
West Melbourne Waterfront, Development Plan
Figures
Figure 2.1: Location of Intersection Counts 3
Figure 3.1: Adopted Traffic Distribution 8
Tables
Table 2.1: Percentage Increase Summary 4
Table 3.1: In/Out Traffic Splits 6
Table 3.2: Development Generated Traffic Volumes 6
Table 4.1: SIDRA Level of Service 10
Table 4.2: Existing Operating Conditions 11
Table 4.3: ‘Base Case’ Operating Conditions 12
Table 5.1: Statutory Car Parking Requirements 15
Table 5.2: BCA Car Parking Requirements for People with Disabilities 15
Table 5.3: Anticipated Resident Car Parking Demand (ABS Assessment) 17
Table 5.4: Variation in Residential Visitor Car Parking Demand 17
Table 5.5: Variation in Supermarket/Retail Car Parking Demand 19
Table 5.6: Anticipated Overall Car Parking Demand 19
Table 6.1: Statutory Requirement for Bicycle Facilities 22
Table 7.1: Post Development ‘Do Nothing’ Operating Conditions 24
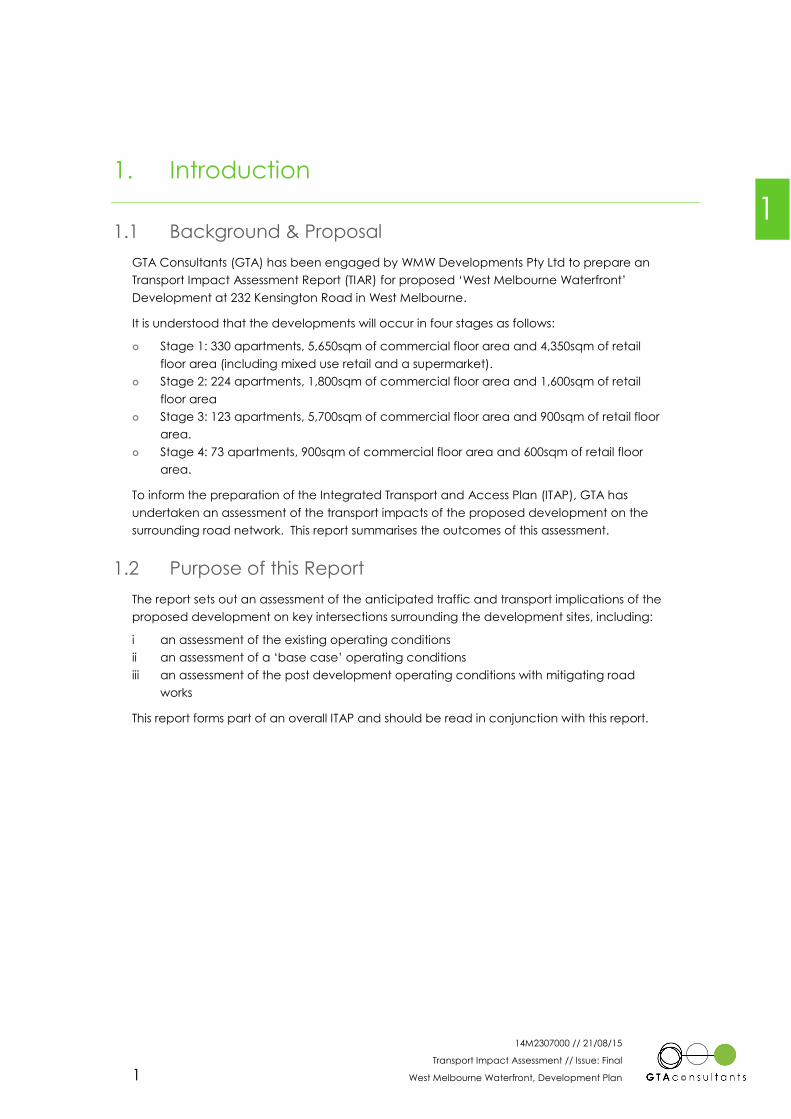
14M2307000 // 21/08/15
Transport Impact Assessment // Issue: Final
West Melbourne Waterfront, Development Plan 1
1. Introduction
1.1 Background & Proposal
GTA Consultants (GTA) has been engaged by WMW Developments Pty Ltd to prepare an
Transport Impact Assessment Report (TIAR) for proposed ‘West Melbourne Waterfront’
Development at 232 Kensington Road in West Melbourne.
It is understood that the developments will occur in four stages as follows:
Stage 1: 330 apartments, 5,650sqm of commercial floor area and 4,350sqm of retail
floor area (including mixed use retail and a supermarket).
Stage 2: 224 apartments, 1,800sqm of commercial floor area and 1,600sqm of retail
floor area
Stage 3: 123 apartments, 5,700sqm of commercial floor area and 900sqm of retail floor
area.
Stage 4: 73 apartments, 900sqm of commercial floor area and 600sqm of retail floor
area.
To inform the preparation of the Integrated Transport and Access Plan (ITAP), GTA has
undertaken an assessment of the transport impacts of the proposed development on the
surrounding road network. This report summarises the outcomes of this assessment.
1.2 Purpose of this Report
The report sets out an assessment of the anticipated traffic and transport implications of the
proposed development on key intersections surrounding the development sites, including:
i an assessment of the existing operating conditions
ii an assessment of a ‘base case’ operating conditions
iii an assessment of the post development operating conditions with mitigating road
works
This report forms part of an overall ITAP and should be read in conjunction with this report.
1
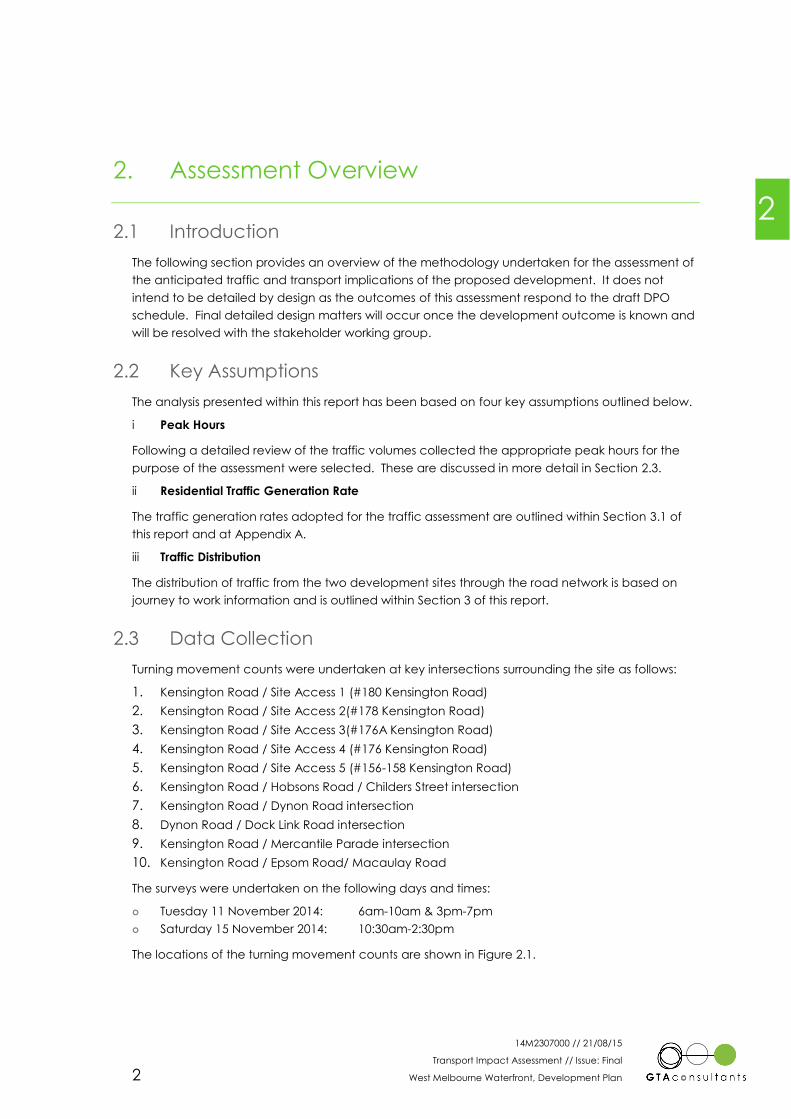
14M2307000 // 21/08/15
Transport Impact Assessment // Issue: Final
West Melbourne Waterfront, Development Plan 2
2. Assessment Overview
2.1 Introduction
The following section provides an overview of the methodology undertaken for the assessment of
the anticipated traffic and transport implications of the proposed development. It does not
intend to be detailed by design as the outcomes of this assessment respond to the draft DPO
schedule. Final detailed design matters will occur once the development outcome is known and
will be resolved with the stakeholder working group.
2.2 Key Assumptions
The analysis presented within this report has been based on four key assumptions outlined below.
i Peak Hours
Following a detailed review of the traffic volumes collected the appropriate peak hours for the
purpose of the assessment were selected. These are discussed in more detail in Section 2.3.
ii Residential Traffic Generation Rate
The traffic generation rates adopted for the traffic assessment are outlined within Section 3.1 of
this report and at Appendix A.
iii Traffic Distribution
The distribution of traffic from the two development sites through the road network is based on
journey to work information and is outlined within Section 3 of this report.
2.3 Data Collection
Turning movement counts were undertaken at key intersections surrounding the site as follows:
1. Kensington Road / Site Access 1 (#180 Kensington Road)
2. Kensington Road / Site Access 2(#178 Kensington Road)
3. Kensington Road / Site Access 3(#176A Kensington Road)
4. Kensington Road / Site Access 4 (#176 Kensington Road)
5. Kensington Road / Site Access 5 (#156-158 Kensington Road)
6. Kensington Road / Hobsons Road / Childers Street intersection
7. Kensington Road / Dynon Road intersection
8. Dynon Road / Dock Link Road intersection
9. Kensington Road / Mercantile Parade intersection
10. Kensington Road / Epsom Road/ Macaulay Road
The surveys were undertaken on the following days and times:
Tuesday 11 November 2014: 6am-10am & 3pm-7pm
Saturday 15 November 2014: 10:30am-2:30pm
The locations of the turning movement counts are shown in Figure 2.1.
2
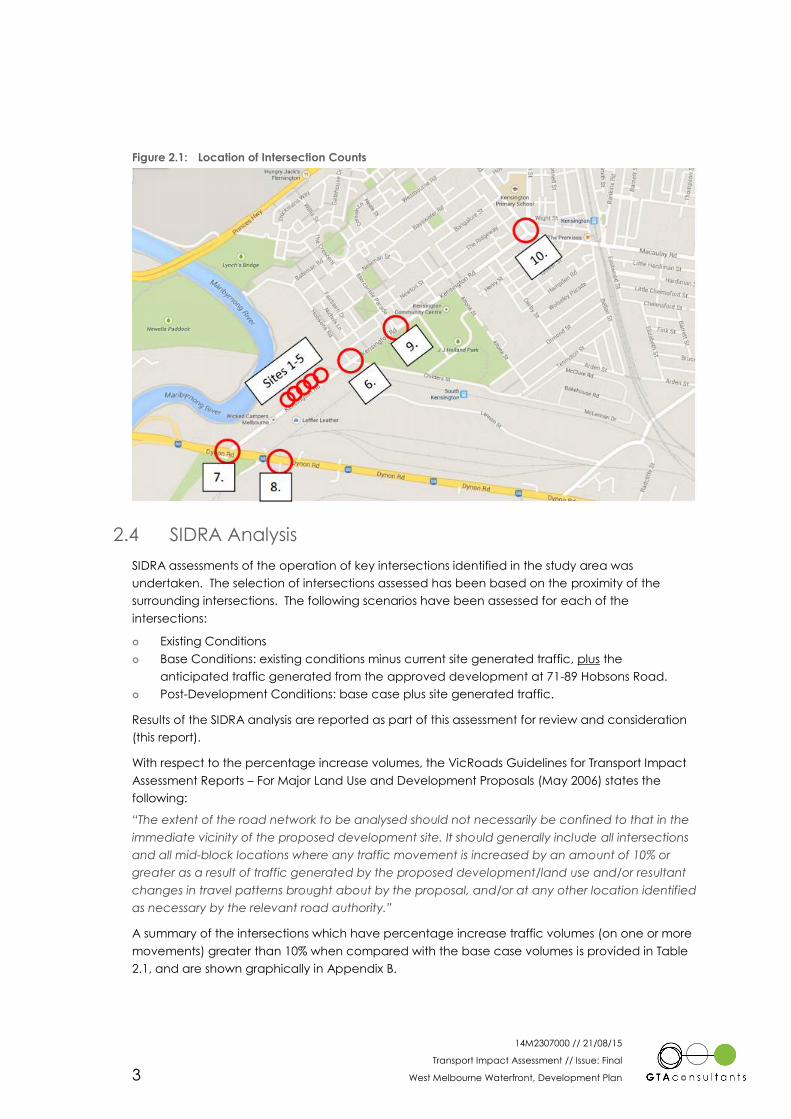
14M2307000 // 21/08/15
Transport Impact Assessment // Issue: Final
West Melbourne Waterfront, Development Plan 3
Figure 2.1: Location of Intersection Counts
2.4 SIDRA Analysis
SIDRA assessments of the operation of key intersections identified in the study area was
undertaken. The selection of intersections assessed has been based on the proximity of the
surrounding intersections. The following scenarios have been assessed for each of the
intersections:
Existing Conditions
Base Conditions: existing conditions minus current site generated traffic, plus the
anticipated traffic generated from the approved development at 71-89 Hobsons Road.
Post-Development Conditions: base case plus site generated traffic.
Results of the SIDRA analysis are reported as part of this assessment for review and consideration
(this report).
With respect to the percentage increase volumes, the VicRoads Guidelines for Transport Impact
Assessment Reports – For Major Land Use and Development Proposals (May 2006) states the
following:
“The extent of the road network to be analysed should not necessarily be confined to that in the
immediate vicinity of the proposed development site. It should generally include all intersections
and all mid-block locations where any traffic movement is increased by an amount of 10% or
greater as a result of traffic generated by the proposed development/land use and/or resultant
changes in travel patterns brought about by the proposal, and/or at any other location identified
as necessary by the relevant road authority.”
A summary of the intersections which have percentage increase traffic volumes (on one or more
movements) greater than 10% when compared with the base case volumes is provided in Table
2.1, and are shown graphically in Appendix B.
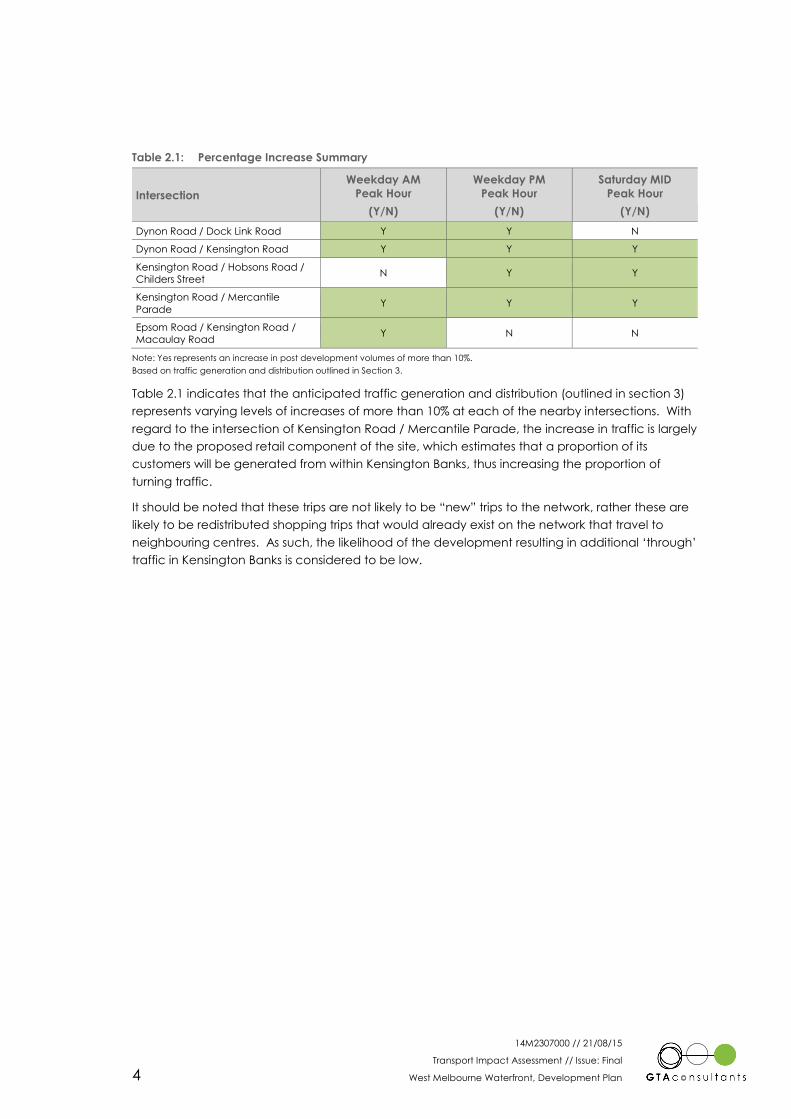
14M2307000 // 21/08/15
Transport Impact Assessment // Issue: Final
West Melbourne Waterfront, Development Plan 4
Table 2.1: Percentage Increase Summary
Intersection
Weekday AM
Peak Hour
(Y/N)
Weekday PM
Peak Hour
(Y/N)
Saturday MID
Peak Hour
(Y/N)
Dynon Road / Dock Link Road Y Y N
Dynon Road / Kensington Road Y Y Y
Kensington Road / Hobsons Road /
Childers Street N Y Y
Kensington Road / Mercantile
Parade Y Y Y
Epsom Road / Kensington Road /
Macaulay Road Y N N
Note: Yes represents an increase in post development volumes of more than 10%.
Based on traffic generation and distribution outlined in Section 3.
Table 2.1 indicates that the anticipated traffic generation and distribution (outlined in section 3)
represents varying levels of increases of more than 10% at each of the nearby intersections. With
regard to the intersection of Kensington Road / Mercantile Parade, the increase in traffic is largely
due to the proposed retail component of the site, which estimates that a proportion of its
customers will be generated from within Kensington Banks, thus increasing the proportion of
turning traffic.
It should be noted that these trips are not likely to be “new” trips to the network, rather these are
likely to be redistributed shopping trips that would already exist on the network that travel to
neighbouring centres. As such, the likelihood of the development resulting in additional ‘through’
traffic in Kensington Banks is considered to be low.
14M2307000 // 21/08/15
Transport Impact Assessment // Issue: Final
West Melbourne Waterfront, Development Plan 5
3. Traffic Generation & Distribution
3.1 Traffic Generation
3.1.1 Rates Summary
The traffic generation rates adopted for the proposed developments are as follows:
Residential Use
Weekday AM Peak Hour – 0.30 movements per dwelling
Weekday PM Peak Hour – 0.25 movements per dwelling
Saturday MID Peak Hour – 0.275 movements per dwelling.
Retail Use (including Specialty Retail)
Weekday AM Peak Hour – 1.12 movements per 100sqm
Weekday PM Peak Hour – 5.60* movements per 100sqm
Saturday MID Peak Hour – 10.70* movements per 100sqm.
Supermarket Use
Weekday AM Peak Hour – 1.44 movements per 100sqm
Weekday PM Peak Hour – 7.22* movements per 100sqm
Saturday MID Peak Hour – 8.15* movements per 100sqm.
*Note: A 20% reduction factor was applied to the retail and supermarket rates for the weekday
PM and Saturday periods. This is to account for the portion of demand which is generated from
within the site.
Commercial Use1
Weekday AM Peak Hour – 2.00 movements per 100sqm
Weekday PM Peak Hour – 2.00 movements per 100sqm
Saturday MID Peak Hour – 0.00 movements per 100sqm.
It is noted that the commercial sites are not expected to generate any traffic on a Saturday. The
traffic generation rates adopted in this report reflect those of comparable developments within
Melbourne, as discussed in Appendix A.
3.1.2 Resultant Traffic Movements
Table 3.2 provides an estimate of the expected overall development generated peak hour traffic
volumes, assuming industry adopted traffic splits (in and out) for the proposed residential, retail
and commercial land uses.
The in/out traffic splits adopted for each use has been summarised in Table 3.1.
1 These commercial rates were not confirmed by the Transport Working Group but are considered to be appropriate
3
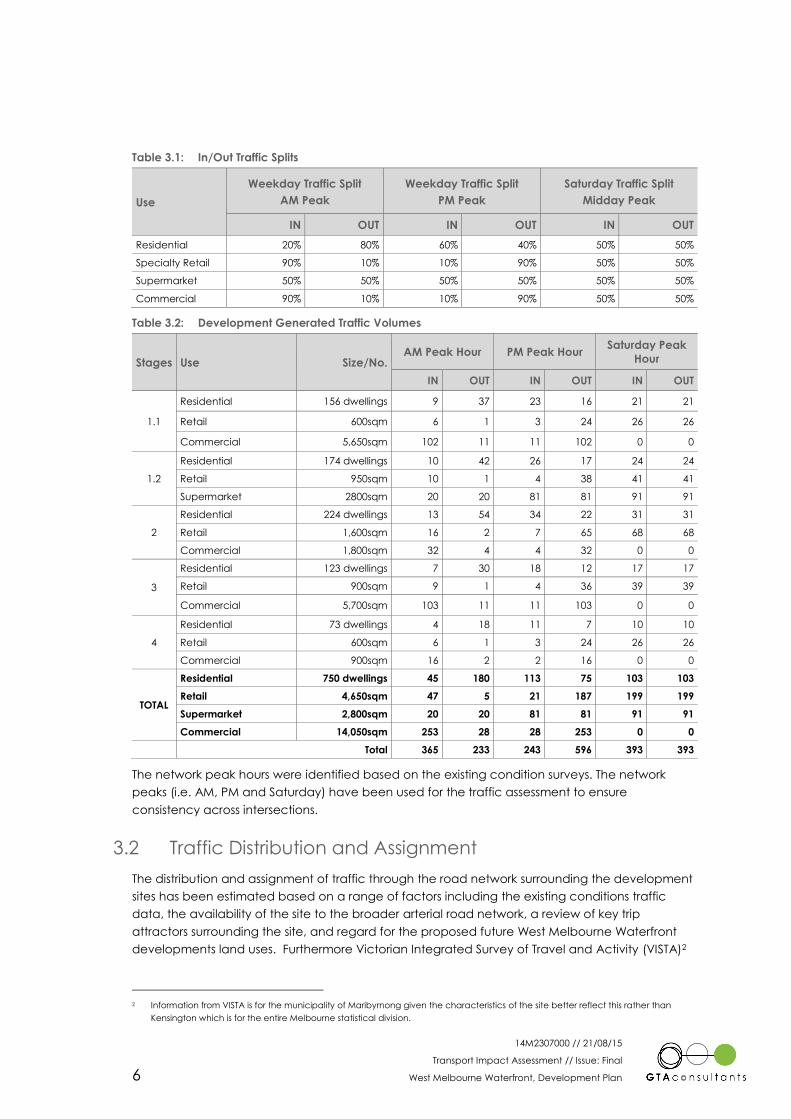
14M2307000 // 21/08/15
Transport Impact Assessment // Issue: Final
West Melbourne Waterfront, Development Plan 6
Table 3.1: In/Out Traffic Splits
Use
Weekday Traffic Split
AM Peak
Weekday Traffic Split
PM Peak
Saturday Traffic Split
Midday Peak
IN OUT IN OUT IN OUT
Residential 20% 80% 60% 40% 50% 50%
Specialty Retail 90% 10% 10% 90% 50% 50%
Supermarket 50% 50% 50% 50% 50% 50%
Commercial 90% 10% 10% 90% 50% 50%
Table 3.2: Development Generated Traffic Volumes
Stages Use Size/No. AM Peak Hour PM Peak Hour
Saturday Peak
Hour
IN OUT IN OUT IN OUT
1.1
Residential 156 dwellings 9 37 23 16 21 21
Retail 600sqm 6 1 3 24 26 26
Commercial 5,650sqm 102 11 11 102 0 0
1.2
Residential 174 dwellings 10 42 26 17 24 24
Retail 950sqm 10 1 4 38 41 41
Supermarket 2800sqm 20 20 81 81 91 91
2
Residential 224 dwellings 13 54 34 22 31 31
Retail 1,600sqm 16 2 7 65 68 68
Commercial 1,800sqm 32 4 4 32 0 0
3
Residential 123 dwellings 7 30 18 12 17 17
Retail 900sqm 9 1 4 36 39 39
Commercial 5,700sqm 103 11 11 103 0 0
4
Residential 73 dwellings 4 18 11 7 10 10
Retail 600sqm 6 1 3 24 26 26
Commercial 900sqm 16 2 2 16 0 0
TOTAL
Residential 750 dwellings 45 180 113 75 103 103
Retail 4,650sqm 47 5 21 187 199 199
Supermarket 2,800sqm 20 20 81 81 91 91
Commercial 14,050sqm 253 28 28 253 0 0
Total 365 233 243 596 393 393
The network peak hours were identified based on the existing condition surveys. The network
peaks (i.e. AM, PM and Saturday) have been used for the traffic assessment to ensure
consistency across intersections.
3.2 Traffic Distribution and Assignment
The distribution and assignment of traffic through the road network surrounding the development
sites has been estimated based on a range of factors including the existing conditions traffic
data, the availability of the site to the broader arterial road network, a review of key trip
attractors surrounding the site, and regard for the proposed future West Melbourne Waterfront
developments land uses. Furthermore Victorian Integrated Survey of Travel and Activity (VISTA)2
2 Information from VISTA is for the municipality of Maribyrnong given the characteristics of the site better reflect this rather than
Kensington which is for the entire Melbourne statistical division.

14M2307000 // 21/08/15
Transport Impact Assessment // Issue: Final
West Melbourne Waterfront, Development Plan 7
has been sourced to estimate the likely traffic distribution/direction between home and work and
vice versa.
With regard to the above the distribution of traffic was separated by use with each of the
proposed uses having a slightly different directional distribution. The adopted broad distribution is
shown in Figure 3.1, with full details of the data summary is provided in Appendix A.
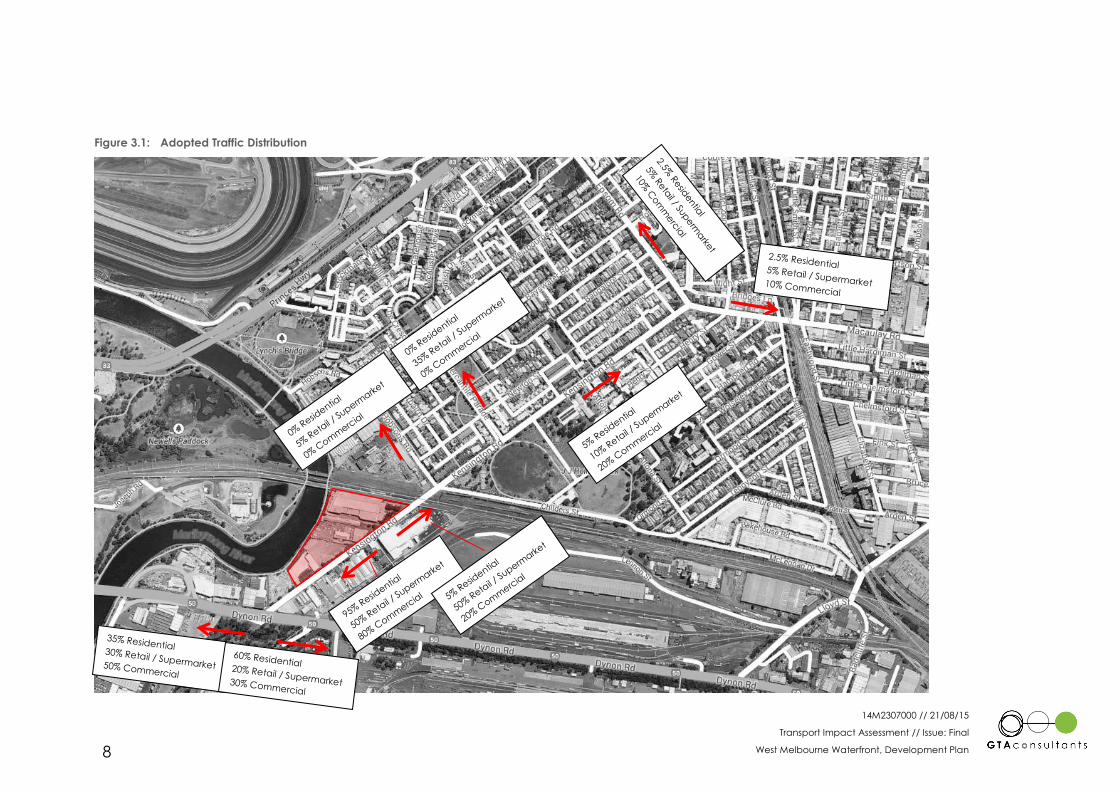
14M2307000 // 21/08/15
Transport Impact Assessment // Issue: Final
West Melbourne Waterfront, Development Plan 8
Figure 3.1: Adopted Traffic Distribution
14M2307000 // 21/08/15
Transport Impact Assessment // Issue: Final
West Melbourne Waterfront, Development Plan 9
Some key points to note regarding the anticipated traffic distributions are:
There is a proportion of trips travelling to (7% residents) the northern municipalities of
Moreland, Hume and Whittlesea. Due to direct and convenient access, the majority of
these trips have been assumed to travel to the site via Citylink and Dynon Road.
All of the commercial trips from Moreland, Hume and Whittlesea have been assumed
to travel via Epsom Road and McCauley Road. It is more likely that a proportion of
these would use Dynon Road given its more direct access, however this approach
adopted is considered conservative.
The proposed retail supermarket component assumes that a high proportion of its users
will be from the Kensington Banks and Kensington areas. As previously discussed, these
trips generated will not be new trips in the network, rather these will be redistributed
from existing shopping trips of these neighbourhoods. Any redistribution of existing trips
in the network to this site has not been included in this analysis.
The traffic distribution does not consider any “passer-by” or “linked” trips on Kensington
Road from the network.
The distribution does not consider a displacement of existing traffic movements. Indeed,
the flexibility of the wider network is such that it would be able to respond to changes in
travel behaviour as new development comes on line. In particular the changing
landscape of the Dynon Precinct.
Internally, the site access points have assumed that vehicles will travel to and from their
nearest access point onto Kensington Road. Some minor redistribution in the analysis
has been undertaken for the PM peak for right turning traffic exiting Stages 2 and 3 to
access via the signalised Access Point 2.
Overall, the distribution and assignment, as well as the traffic generation and volumes, is
considered a conservative approach to assessing the performance of the network, likely
representing an over estimate of the likely traffic impact. Further discussion on the post
development operation of the network is provided in Section 7.
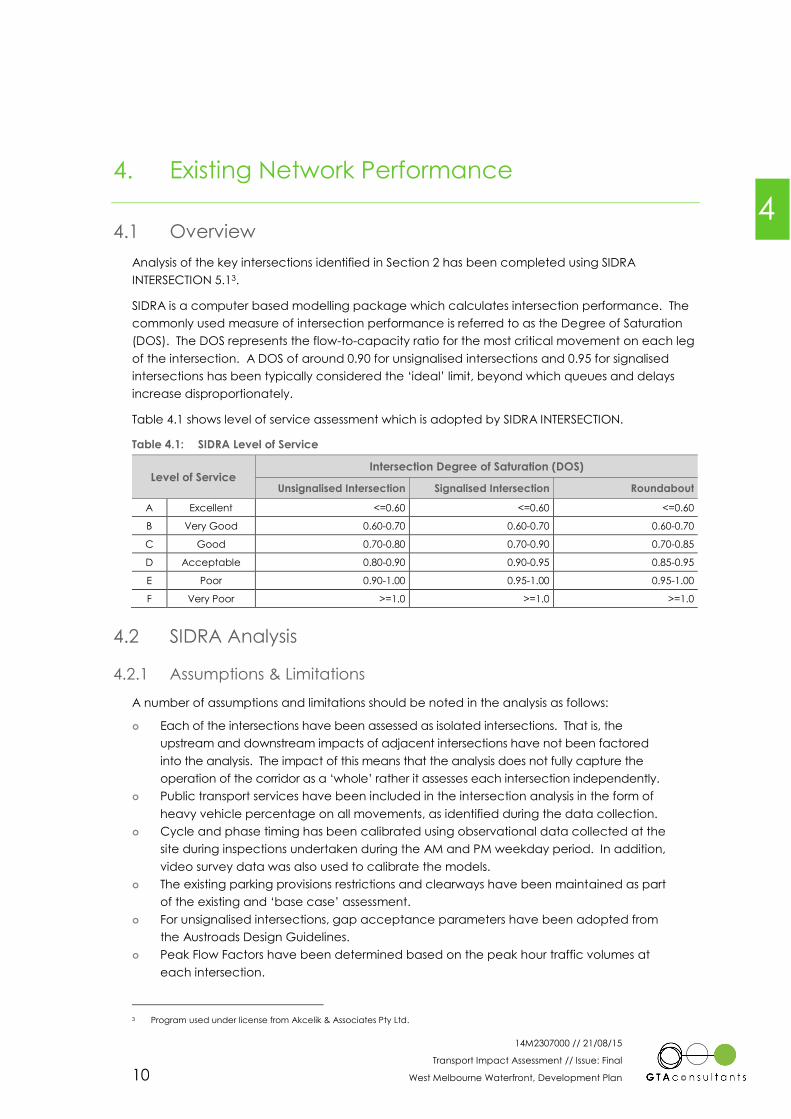
14M2307000 // 21/08/15
Transport Impact Assessment // Issue: Final
West Melbourne Waterfront, Development Plan 10
4. Existing Network Performance
4.1 Overview
Analysis of the key intersections identified in Section 2 has been completed using SIDRA
INTERSECTION 5.13.
SIDRA is a computer based modelling package which calculates intersection performance. The
commonly used measure of intersection performance is referred to as the Degree of Saturation
(DOS). The DOS represents the flow-to-capacity ratio for the most critical movement on each leg
of the intersection. A DOS of around 0.90 for unsignalised intersections and 0.95 for signalised
intersections has been typically considered the ‘ideal’ limit, beyond which queues and delays
increase disproportionately.
Table 4.1 shows level of service assessment which is adopted by SIDRA INTERSECTION.
Table 4.1: SIDRA Level of Service
Level of Service Intersection Degree of Saturation (DOS)
Unsignalised Intersection Signalised Intersection Roundabout
A Excellent <=0.60 <=0.60 <=0.60
B Very Good 0.60-0.70 0.60-0.70 0.60-0.70
C Good 0.70-0.80 0.70-0.90 0.70-0.85
D Acceptable 0.80-0.90 0.90-0.95 0.85-0.95
E Poor 0.90-1.00 0.95-1.00 0.95-1.00
F Very Poor >=1.0 >=1.0 >=1.0
4.2 SIDRA Analysis
4.2.1 Assumptions & Limitations
A number of assumptions and limitations should be noted in the analysis as follows:
Each of the intersections have been assessed as isolated intersections. That is, the
upstream and downstream impacts of adjacent intersections have not been factored
into the analysis. The impact of this means that the analysis does not fully capture the
operation of the corridor as a ‘whole’ rather it assesses each intersection independently.
Public transport services have been included in the intersection analysis in the form of
heavy vehicle percentage on all movements, as identified during the data collection.
Cycle and phase timing has been calibrated using observational data collected at the
site during inspections undertaken during the AM and PM weekday period. In addition,
video survey data was also used to calibrate the models.
The existing parking provisions restrictions and clearways have been maintained as part
of the existing and ‘base case’ assessment.
For unsignalised intersections, gap acceptance parameters have been adopted from
the Austroads Design Guidelines.
Peak Flow Factors have been determined based on the peak hour traffic volumes at
each intersection.
3 Program used under license from Akcelik & Associates Pty Ltd.
4
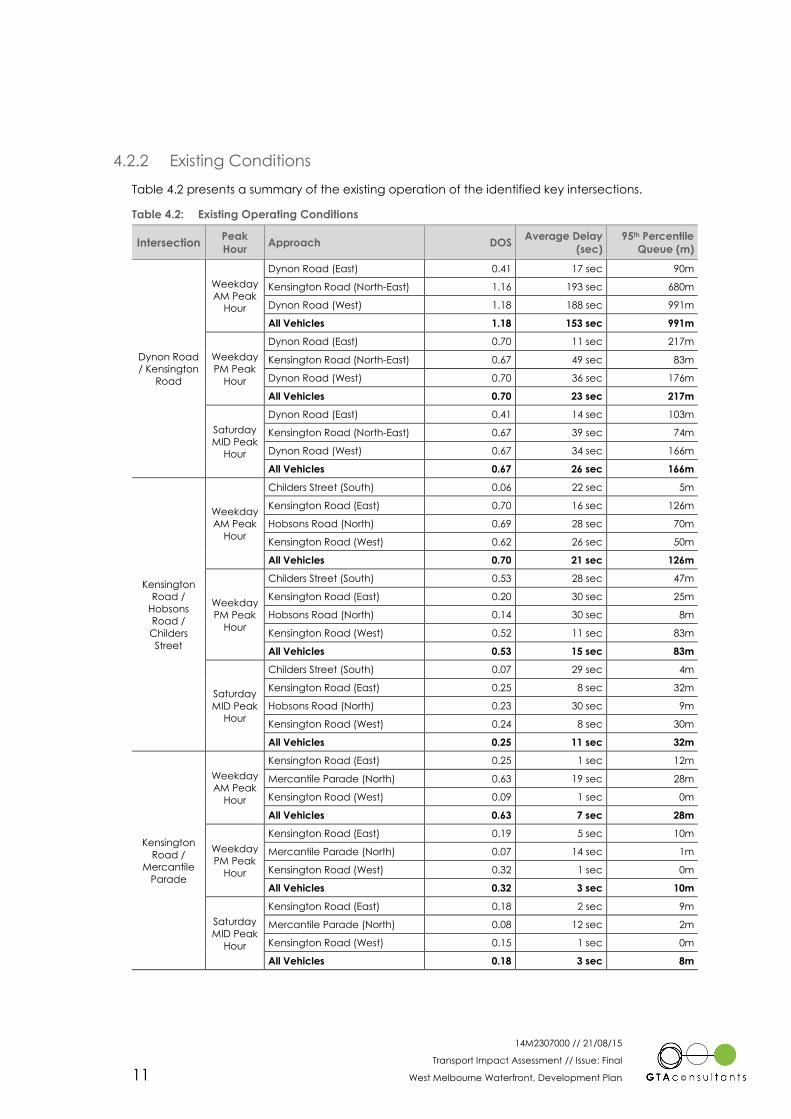
14M2307000 // 21/08/15
Transport Impact Assessment // Issue: Final
West Melbourne Waterfront, Development Plan 11
4.2.2 Existing Conditions
Table 4.2 presents a summary of the existing operation of the identified key intersections.
Table 4.2: Existing Operating Conditions
Intersection Peak
Hour Approach DOS
Average Delay
(sec)
95th Percentile
Queue (m)
Dynon Road
/ Kensington
Road
Weekday
AM Peak
Hour
Dynon Road (East) 0.41 17 sec 90m
Kensington Road (North-East) 1.16 193 sec 680m
Dynon Road (West) 1.18 188 sec 991m
All Vehicles 1.18 153 sec 991m
Weekday
PM Peak
Hour
Dynon Road (East) 0.70 11 sec 217m
Kensington Road (North-East) 0.67 49 sec 83m
Dynon Road (West) 0.70 36 sec 176m
All Vehicles 0.70 23 sec 217m
Saturday
MID Peak
Hour
Dynon Road (East) 0.41 14 sec 103m
Kensington Road (North-East) 0.67 39 sec 74m
Dynon Road (West) 0.67 34 sec 166m
All Vehicles 0.67 26 sec 166m
Kensington
Road /
Hobsons
Road /
Childers
Street
Weekday
AM Peak
Hour
Childers Street (South) 0.06 22 sec 5m
Kensington Road (East) 0.70 16 sec 126m
Hobsons Road (North) 0.69 28 sec 70m
Kensington Road (West) 0.62 26 sec 50m
All Vehicles 0.70 21 sec 126m
Weekday
PM Peak
Hour
Childers Street (South) 0.53 28 sec 47m
Kensington Road (East) 0.20 30 sec 25m
Hobsons Road (North) 0.14 30 sec 8m
Kensington Road (West) 0.52 11 sec 83m
All Vehicles 0.53 15 sec 83m
Saturday
MID Peak
Hour
Childers Street (South) 0.07 29 sec 4m
Kensington Road (East) 0.25 8 sec 32m
Hobsons Road (North) 0.23 30 sec 9m
Kensington Road (West) 0.24 8 sec 30m
All Vehicles 0.25 11 sec 32m
Kensington
Road /
Mercantile
Parade
Weekday
AM Peak
Hour
Kensington Road (East) 0.25 1 sec 12m
Mercantile Parade (North) 0.63 19 sec 28m
Kensington Road (West) 0.09 1 sec 0m
All Vehicles 0.63 7 sec 28m
Weekday
PM Peak
Hour
Kensington Road (East) 0.19 5 sec 10m
Mercantile Parade (North) 0.07 14 sec 1m
Kensington Road (West) 0.32 1 sec 0m
All Vehicles 0.32 3 sec 10m
Saturday
MID Peak
Hour
Kensington Road (East) 0.18 2 sec 9m
Mercantile Parade (North) 0.08 12 sec 2m
Kensington Road (West) 0.15 1 sec 0m
All Vehicles 0.18 3 sec 8m
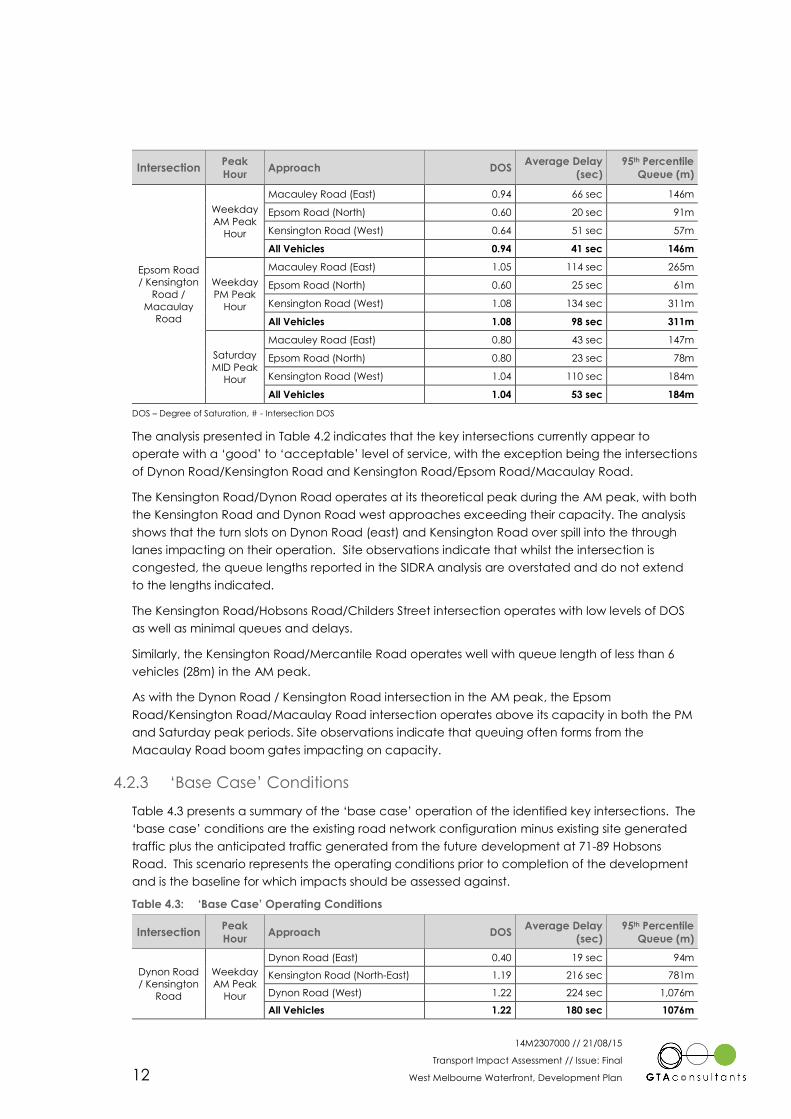
14M2307000 // 21/08/15
Transport Impact Assessment // Issue: Final
West Melbourne Waterfront, Development Plan 12
Intersection Peak
Hour Approach DOS
Average Delay
(sec)
95th Percentile
Queue (m)
Epsom Road
/ Kensington
Road /
Macaulay
Road
Weekday
AM Peak
Hour
Macauley Road (East) 0.94 66 sec 146m
Epsom Road (North) 0.60 20 sec 91m
Kensington Road (West) 0.64 51 sec 57m
All Vehicles 0.94 41 sec 146m
Weekday
PM Peak
Hour
Macauley Road (East) 1.05 114 sec 265m
Epsom Road (North) 0.60 25 sec 61m
Kensington Road (West) 1.08 134 sec 311m
All Vehicles 1.08 98 sec 311m
Saturday
MID Peak
Hour
Macauley Road (East) 0.80 43 sec 147m
Epsom Road (North) 0.80 23 sec 78m
Kensington Road (West) 1.04 110 sec 184m
All Vehicles 1.04 53 sec 184m
DOS – Degree of Saturation, # - Intersection DOS
The analysis presented in Table 4.2 indicates that the key intersections currently appear to
operate with a ‘good’ to ‘acceptable’ level of service, with the exception being the intersections
of Dynon Road/Kensington Road and Kensington Road/Epsom Road/Macaulay Road.
The Kensington Road/Dynon Road operates at its theoretical peak during the AM peak, with both
the Kensington Road and Dynon Road west approaches exceeding their capacity. The analysis
shows that the turn slots on Dynon Road (east) and Kensington Road over spill into the through
lanes impacting on their operation. Site observations indicate that whilst the intersection is
congested, the queue lengths reported in the SIDRA analysis are overstated and do not extend
to the lengths indicated.
The Kensington Road/Hobsons Road/Childers Street intersection operates with low levels of DOS
as well as minimal queues and delays.
Similarly, the Kensington Road/Mercantile Road operates well with queue length of less than 6
vehicles (28m) in the AM peak.
As with the Dynon Road / Kensington Road intersection in the AM peak, the Epsom
Road/Kensington Road/Macaulay Road intersection operates above its capacity in both the PM
and Saturday peak periods. Site observations indicate that queuing often forms from the
Macaulay Road boom gates impacting on capacity.
4.2.3 ‘Base Case’ Conditions
Table 4.3 presents a summary of the ‘base case’ operation of the identified key intersections. The
‘base case’ conditions are the existing road network configuration minus existing site generated
traffic plus the anticipated traffic generated from the future development at 71-89 Hobsons
Road. This scenario represents the operating conditions prior to completion of the development
and is the baseline for which impacts should be assessed against.
Table 4.3: ‘Base Case’ Operating Conditions
Intersection Peak
Hour Approach DOS
Average Delay
(sec)
95th Percentile
Queue (m)
Dynon Road
/ Kensington
Road
Weekday
AM Peak
Hour
Dynon Road (East) 0.40 19 sec 94m
Kensington Road (North-East) 1.19 216 sec 781m
Dynon Road (West) 1.22 224 sec 1,076m
All Vehicles 1.22 180 sec 1076m
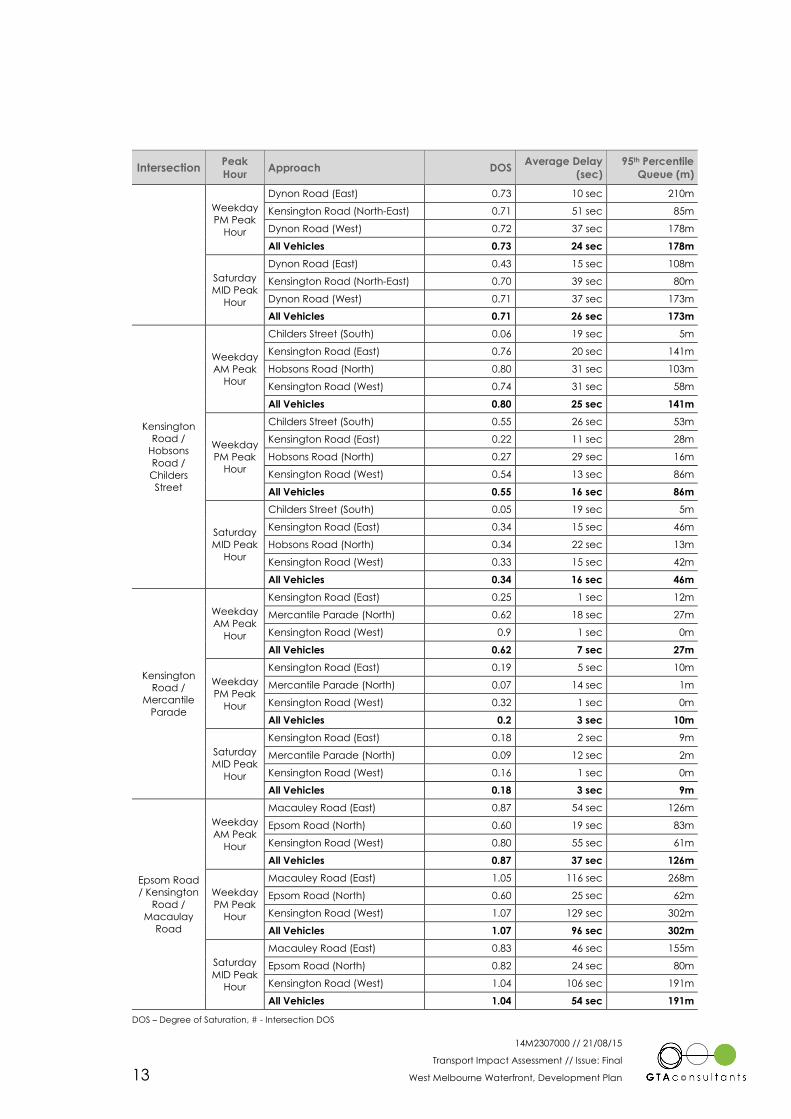
14M2307000 // 21/08/15
Transport Impact Assessment // Issue: Final
West Melbourne Waterfront, Development Plan 13
Intersection Peak
Hour Approach DOS
Average Delay
(sec)
95th Percentile
Queue (m)
Weekday
PM Peak
Hour
Dynon Road (East) 0.73 10 sec 210m
Kensington Road (North-East) 0.71 51 sec 85m
Dynon Road (West) 0.72 37 sec 178m
All Vehicles 0.73 24 sec 178m
Saturday
MID Peak
Hour
Dynon Road (East) 0.43 15 sec 108m
Kensington Road (North-East) 0.70 39 sec 80m
Dynon Road (West) 0.71 37 sec 173m
All Vehicles 0.71 26 sec 173m
Kensington
Road /
Hobsons
Road /
Childers
Street
Weekday
AM Peak
Hour
Childers Street (South) 0.06 19 sec 5m
Kensington Road (East) 0.76 20 sec 141m
Hobsons Road (North) 0.80 31 sec 103m
Kensington Road (West) 0.74 31 sec 58m
All Vehicles 0.80 25 sec 141m
Weekday
PM Peak
Hour
Childers Street (South) 0.55 26 sec 53m
Kensington Road (East) 0.22 11 sec 28m
Hobsons Road (North) 0.27 29 sec 16m
Kensington Road (West) 0.54 13 sec 86m
All Vehicles 0.55 16 sec 86m
Saturday
MID Peak
Hour
Childers Street (South) 0.05 19 sec 5m
Kensington Road (East) 0.34 15 sec 46m
Hobsons Road (North) 0.34 22 sec 13m
Kensington Road (West) 0.33 15 sec 42m
All Vehicles 0.34 16 sec 46m
Kensington
Road /
Mercantile
Parade
Weekday
AM Peak
Hour
Kensington Road (East) 0.25 1 sec 12m
Mercantile Parade (North) 0.62 18 sec 27m
Kensington Road (West) 0.9 1 sec 0m
All Vehicles 0.62 7 sec 27m
Weekday
PM Peak
Hour
Kensington Road (East) 0.19 5 sec 10m
Mercantile Parade (North) 0.07 14 sec 1m
Kensington Road (West) 0.32 1 sec 0m
All Vehicles 0.2 3 sec 10m
Saturday
MID Peak
Hour
Kensington Road (East) 0.18 2 sec 9m
Mercantile Parade (North) 0.09 12 sec 2m
Kensington Road (West) 0.16 1 sec 0m
All Vehicles 0.18 3 sec 9m
Epsom Road
/ Kensington
Road /
Macaulay
Road
Weekday
AM Peak
Hour
Macauley Road (East) 0.87 54 sec 126m
Epsom Road (North) 0.60 19 sec 83m
Kensington Road (West) 0.80 55 sec 61m
All Vehicles 0.87 37 sec 126m
Weekday
PM Peak
Hour
Macauley Road (East) 1.05 116 sec 268m
Epsom Road (North) 0.60 25 sec 62m
Kensington Road (West) 1.07 129 sec 302m
All Vehicles 1.07 96 sec 302m
Saturday
MID Peak
Hour
Macauley Road (East) 0.83 46 sec 155m
Epsom Road (North) 0.82 24 sec 80m
Kensington Road (West) 1.04 106 sec 191m
All Vehicles 1.04 54 sec 191m
DOS – Degree of Saturation, # - Intersection DOS
14M2307000 // 21/08/15
Transport Impact Assessment // Issue: Final
West Melbourne Waterfront, Development Plan 14
Table 4.3 indicates that the performance of the key intersections decreases slightly when
compared with the existing conditions performances. Of note is the Dynon Road / Kensington
Road intersection, which increased its DOS by four percent in the AM peak, with queue lengths
anticipated to be in the order of one kilometre. As discussed in the previous section, site
observations indicate that queue lengths are significantly less than those predicted in SIDRA,
nevertheless, these are relevant in understanding the ‘relative’ impact of the proposal.

14M2307000 // 21/08/15
Transport Impact Assessment // Issue: Final
West Melbourne Waterfront, Development Plan 15
5. Car Parking
5.1 Statutory Car Parking Requirements
Statutory requirements for the provision of car parking are set out in Clause 52.06 of the Melbourne
Planning Scheme, with parking rates specified in Table 1 to Clause 52.06-5. An assessment of the
statutory parking requirements for the development proposal is set out in Table 5.1.
Table 5.1: Statutory Car Parking Requirements
Description Use Size [1] Statutory Parking Rate Statutory Parking
Requirement
Residential
Apartments
Dwelling
(Residents)
750 dwellings
(375 x one-bedroom
+ 375 x two-bedroom)
1 space per one or two
bedroom dwelling 750 spaces
Dwelling
(Visitors) 750 dwellings 1 space per five dwellings 150 spaces
Specialty Retail Shop
4,650m2 NLA
(includes 950sqm of mixed
use??)
4 spaces to each 100m2 of
leasable floor area 186 spaces
Supermarket Supermarket 2,800m2 NLA 5 spaces to each 100m2 of
leasable floor area 140 spaces
Commercial Office 14,050m2 NLA 3.5 spaces to each 100m2 of
net floor area 491 spaces
Total 1,717 spaces
[1] Based on Net Leasable Area (NLA) as Net Floor area (NFA) or Leasable Floor Area (LFA).
The above assessment anticipates the development proposal has statutory requirement of
1,717 spaces, including 750 spaces for residential use, 150 spaces for residential visitor use, 186
spaces to retail uses, 140 spaces to the supermarket use and 491 spaces for commercial uses.
In this instance, the proposed on-site parking provision of 1,397 car spaces does not meet the
statutory requirement and a permit will be required to reduce this requirement.
In addition to the statutory car parking requirements in the Planning Scheme, the Building Code
of Australia (BCA) outlines requirements for the provision of car parking for people with disabilities.
An assessment of the BCA disabled car parking requirements for the development proposal is set
out in Table 5.2.
Table 5.2: BCA Car Parking Requirements for People with Disabilities
Description BCA Class BCA Disabled Parking Requirement
Residential (Apartments) Class 2 None
Commercial (Office) Class 5 1 space for every 100 car parking spaces or part thereof
Retail (Shop) Class 6
1 Space for every 50 car parking spaces or part thereof for up to 1000
car spaces and then 1 space for each additional 100 car parking
spaces of part thereof in excess of 1000 car parking spaces
Supermarket [1] Class 6
1 Space for every 50 car parking spaces or part thereof for up to 1000
car spaces and then 1 space for each additional 100 car parking
spaces of part thereof in excess of 1000 car parking spaces
[1] Supermarket is assumed to have the same rate as a retail use
Parking spaces for people with disabilities can be included in the total number of spaces required
by the Planning Scheme.
5
14M2307000 // 21/08/15
Transport Impact Assessment // Issue: Final
West Melbourne Waterfront, Development Plan 16
5.2 Car Parking Demand Assessment
5.2.1 Preamble
The proposed development presents an excellent opportunity to promote the vision of state and
local policy objectives of encouraging the use of public transport, cycling, and walking and not
encouraging an abundance of car parking within this area, and in turn over use of motor
vehicles.
All on-site car parking spaces are to be allocated to residents and staff (i.e. long term parking),
noting that the vast majority of on-street car parking in the vicinity of the site is subject to time
restrictions.
Accordingly, long-term car parking demands associated with the site (i.e. staff and residents) will
be generally limited to on-site provisions. In addition, the subject site is generally in close proximity
to the Capital City Zone and Parking Overlay – Precinct 10 (P010) and Precinct 12 (P012) with
statutory parking guidelines within these areas stipulating a maximum number of car parking
spaces, as opposed to the ‘standard’ minimum requirement, in order to discourage the use of
motor vehicles and promote the utilisation of alternative and sustainable transport modes.
5.2.2 Decision Guidelines
With regard to not providing the statutory parking requirement on-site, the Planning Scheme
indicates that a Car Parking Demand Assessment must assess the car parking demand likely to
be generated by the proposal. The assessment must consider the following:
“The likelihood of multi-purpose trips within the locality which are likely to be combined
with a trip to the land in connection with the proposed use.
The variation of car parking demand likely to be generated by the proposed use over
time.
The short-stay and long-stay car parking demand likely to be generated by the
proposed use.
The availability of public transport in the locality of the land.
The convenience of pedestrian and cyclist access to the land.
The provision of bicycle parking and end of trip facilities for cyclists in the locality of the
land.
The anticipated car ownership rates of likely or proposed visitors to or occupants
(residents or employees) of the land.
Any empirical assessment or case study”
The combination of these factors often results in car parking demand being generated at rates
different to the statutory rates. An assessment of the likely car parking demand for each of the
proposed land uses is presented below.
5.2.3 Residential Car Parking Demand
The 2011 Census by the Australian Bureau of Statistics (ABS) provides an indicator of typical resident
car parking demands within the suburb of Kensington, Footscray and West Melbourne. This ABS
data reports the following car ownership levels for apartments4 (excluding social housing):
4 Note that in order to ensure that individuals aren’t able to be identified using census data, the ABS deliberately introduces random
errors into some data sets. (see http://www.abs.gov.au/ausstats/[email protected]/Lookup/2901.0Chapter38202011) To minimise the
potential impact of random errors the data used in this analysis has been rounded up and only quoted to one decimal place.
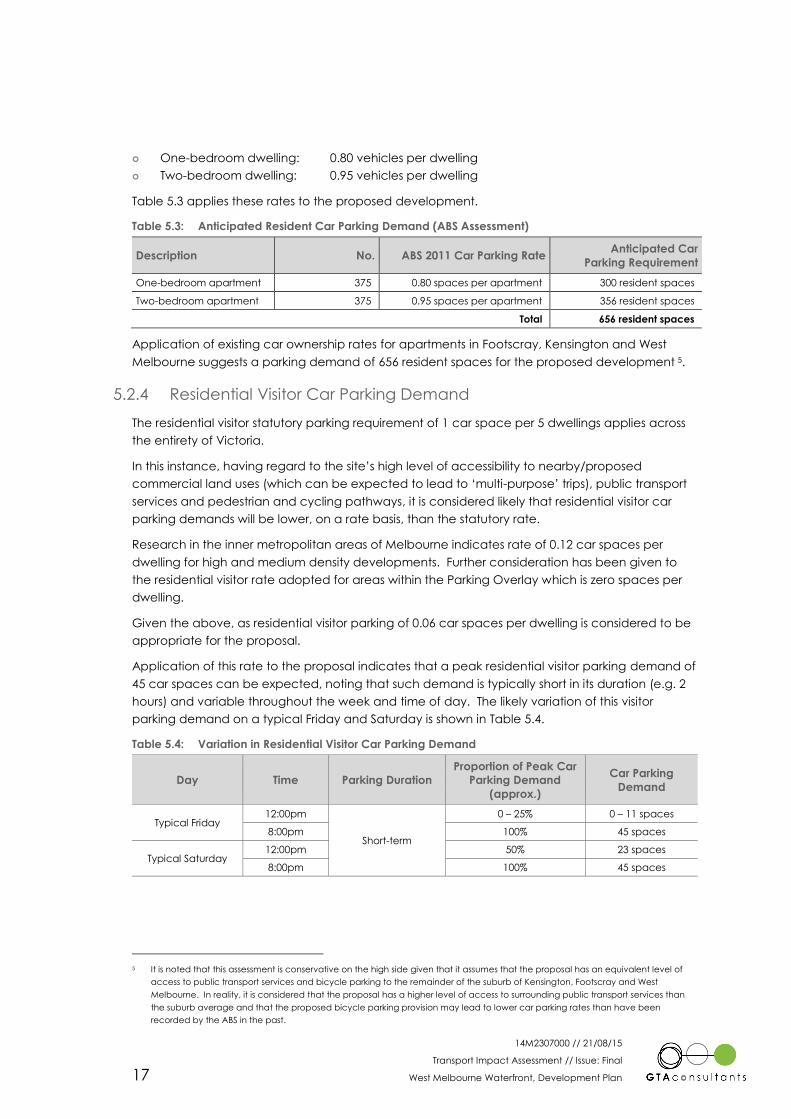
14M2307000 // 21/08/15
Transport Impact Assessment // Issue: Final
West Melbourne Waterfront, Development Plan 17
One-bedroom dwelling: 0.80 vehicles per dwelling
Two-bedroom dwelling: 0.95 vehicles per dwelling
Table 5.3 applies these rates to the proposed development.
Table 5.3: Anticipated Resident Car Parking Demand (ABS Assessment)
Description No. ABS 2011 Car Parking Rate Anticipated Car
Parking Requirement
One-bedroom apartment 375 0.80 spaces per apartment 300 resident spaces
Two-bedroom apartment 375 0.95 spaces per apartment 356 resident spaces
Total 656 resident spaces
Application of existing car ownership rates for apartments in Footscray, Kensington and West
Melbourne suggests a parking demand of 656 resident spaces for the proposed development 5.
5.2.4 Residential Visitor Car Parking Demand
The residential visitor statutory parking requirement of 1 car space per 5 dwellings applies across
the entirety of Victoria.
In this instance, having regard to the site’s high level of accessibility to nearby/proposed
commercial land uses (which can be expected to lead to ‘multi-purpose’ trips), public transport
services and pedestrian and cycling pathways, it is considered likely that residential visitor car
parking demands will be lower, on a rate basis, than the statutory rate.
Research in the inner metropolitan areas of Melbourne indicates rate of 0.12 car spaces per
dwelling for high and medium density developments. Further consideration has been given to
the residential visitor rate adopted for areas within the Parking Overlay which is zero spaces per
dwelling.
Given the above, as residential visitor parking of 0.06 car spaces per dwelling is considered to be
appropriate for the proposal.
Application of this rate to the proposal indicates that a peak residential visitor parking demand of
45 car spaces can be expected, noting that such demand is typically short in its duration (e.g. 2
hours) and variable throughout the week and time of day. The likely variation of this visitor
parking demand on a typical Friday and Saturday is shown in Table 5.4.
Table 5.4: Variation in Residential Visitor Car Parking Demand
Day Time Parking Duration
Proportion of Peak Car
Parking Demand
(approx.)
Car Parking
Demand
Typical Friday 12:00pm
Short-term
0 – 25% 0 – 11 spaces
8:00pm 100% 45 spaces
Typical Saturday 12:00pm 50% 23 spaces
8:00pm 100% 45 spaces
5 It is noted that this assessment is conservative on the high side given that it assumes that the proposal has an equivalent level of
access to public transport services and bicycle parking to the remainder of the suburb of Kensington, Footscray and West
Melbourne. In reality, it is considered that the proposal has a higher level of access to surrounding public transport services than
the suburb average and that the proposed bicycle parking provision may lead to lower car parking rates than have been
recorded by the ABS in the past.
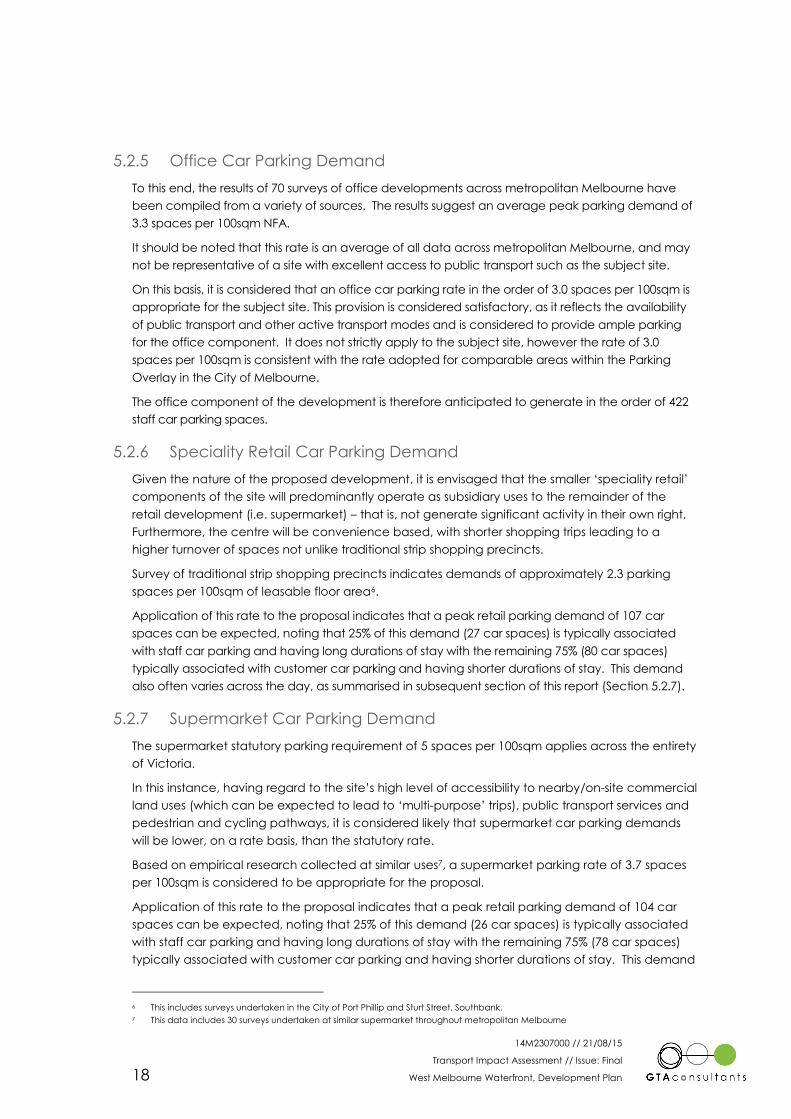
14M2307000 // 21/08/15
Transport Impact Assessment // Issue: Final
West Melbourne Waterfront, Development Plan 18
5.2.5 Office Car Parking Demand
To this end, the results of 70 surveys of office developments across metropolitan Melbourne have
been compiled from a variety of sources. The results suggest an average peak parking demand of
3.3 spaces per 100sqm NFA.
It should be noted that this rate is an average of all data across metropolitan Melbourne, and may
not be representative of a site with excellent access to public transport such as the subject site.
On this basis, it is considered that an office car parking rate in the order of 3.0 spaces per 100sqm is
appropriate for the subject site. This provision is considered satisfactory, as it reflects the availability
of public transport and other active transport modes and is considered to provide ample parking
for the office component. It does not strictly apply to the subject site, however the rate of 3.0
spaces per 100sqm is consistent with the rate adopted for comparable areas within the Parking
Overlay in the City of Melbourne.
The office component of the development is therefore anticipated to generate in the order of 422
staff car parking spaces.
5.2.6 Speciality Retail Car Parking Demand
Given the nature of the proposed development, it is envisaged that the smaller ‘speciality retail’
components of the site will predominantly operate as subsidiary uses to the remainder of the
retail development (i.e. supermarket) – that is, not generate significant activity in their own right.
Furthermore, the centre will be convenience based, with shorter shopping trips leading to a
higher turnover of spaces not unlike traditional strip shopping precincts.
Survey of traditional strip shopping precincts indicates demands of approximately 2.3 parking
spaces per 100sqm of leasable floor area6.
Application of this rate to the proposal indicates that a peak retail parking demand of 107 car
spaces can be expected, noting that 25% of this demand (27 car spaces) is typically associated
with staff car parking and having long durations of stay with the remaining 75% (80 car spaces)
typically associated with customer car parking and having shorter durations of stay. This demand
also often varies across the day, as summarised in subsequent section of this report (Section 5.2.7).
5.2.7 Supermarket Car Parking Demand
The supermarket statutory parking requirement of 5 spaces per 100sqm applies across the entirety
of Victoria.
In this instance, having regard to the site’s high level of accessibility to nearby/on-site commercial
land uses (which can be expected to lead to ‘multi-purpose’ trips), public transport services and
pedestrian and cycling pathways, it is considered likely that supermarket car parking demands
will be lower, on a rate basis, than the statutory rate.
Based on empirical research collected at similar uses7, a supermarket parking rate of 3.7 spaces
per 100sqm is considered to be appropriate for the proposal.
Application of this rate to the proposal indicates that a peak retail parking demand of 104 car
spaces can be expected, noting that 25% of this demand (26 car spaces) is typically associated
with staff car parking and having long durations of stay with the remaining 75% (78 car spaces)
typically associated with customer car parking and having shorter durations of stay. This demand
6 This includes surveys undertaken in the City of Port Phillip and Sturt Street, Southbank.
7 This data includes 30 surveys undertaken at similar supermarket throughout metropolitan Melbourne
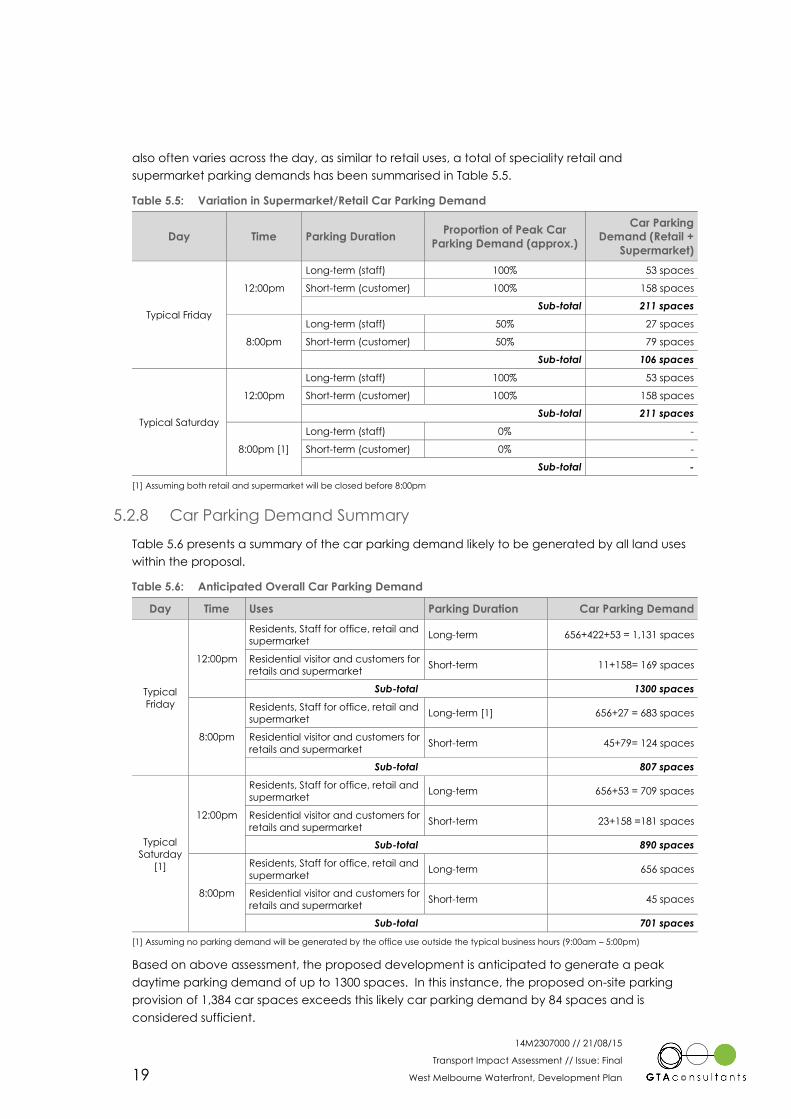
14M2307000 // 21/08/15
Transport Impact Assessment // Issue: Final
West Melbourne Waterfront, Development Plan 19
also often varies across the day, as similar to retail uses, a total of speciality retail and
supermarket parking demands has been summarised in Table 5.5.
Table 5.5: Variation in Supermarket/Retail Car Parking Demand
Day Time Parking Duration Proportion of Peak Car
Parking Demand (approx.)
Car Parking
Demand (Retail +
Supermarket)
Typical Friday
12:00pm
Long-term (staff) 100% 53 spaces
Short-term (customer) 100% 158 spaces
Sub-total 211 spaces
8:00pm
Long-term (staff) 50% 27 spaces
Short-term (customer) 50% 79 spaces
Sub-total 106 spaces
Typical Saturday
12:00pm
Long-term (staff) 100% 53 spaces
Short-term (customer) 100% 158 spaces
Sub-total 211 spaces
8:00pm [1]
Long-term (staff) 0% -
Short-term (customer) 0% -
Sub-total -
[1] Assuming both retail and supermarket will be closed before 8:00pm
5.2.8 Car Parking Demand Summary
Table 5.6 presents a summary of the car parking demand likely to be generated by all land uses
within the proposal.
Table 5.6: Anticipated Overall Car Parking Demand
Day Time Uses Parking Duration Car Parking Demand
Typical
Friday
12:00pm
Residents, Staff for office, retail and
supermarket Long-term 656+422+53 = 1,131 spaces
Residential visitor and customers for
retails and supermarket Short-term 11+158= 169 spaces
Sub-total 1300 spaces
8:00pm
Residents, Staff for office, retail and
supermarket Long-term [1] 656+27 = 683 spaces
Residential visitor and customers for
retails and supermarket Short-term 45+79= 124 spaces
Sub-total 807 spaces
Typical
Saturday
[1]
12:00pm
Residents, Staff for office, retail and
supermarket Long-term 656+53 = 709 spaces
Residential visitor and customers for
retails and supermarket Short-term 23+158 =181 spaces
Sub-total 890 spaces
8:00pm
Residents, Staff for office, retail and
supermarket Long-term 656 spaces
Residential visitor and customers for
retails and supermarket Short-term 45 spaces
Sub-total 701 spaces
[1] Assuming no parking demand will be generated by the office use outside the typical business hours (9:00am – 5:00pm)
Based on above assessment, the proposed development is anticipated to generate a peak
daytime parking demand of up to 1300 spaces. In this instance, the proposed on-site parking
provision of 1,384 car spaces exceeds this likely car parking demand by 84 spaces and is
considered sufficient.
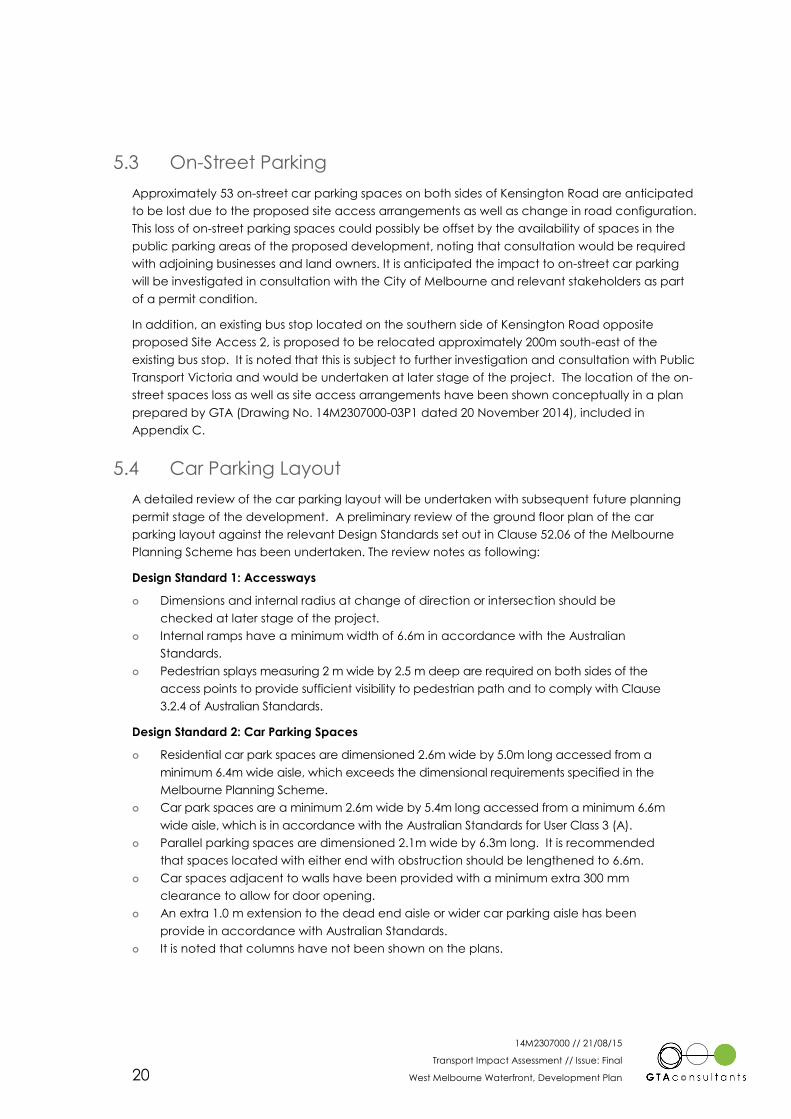
14M2307000 // 21/08/15
Transport Impact Assessment // Issue: Final
West Melbourne Waterfront, Development Plan 20
5.3 On-Street Parking
Approximately 53 on-street car parking spaces on both sides of Kensington Road are anticipated
to be lost due to the proposed site access arrangements as well as change in road configuration.
This loss of on-street parking spaces could possibly be offset by the availability of spaces in the
public parking areas of the proposed development, noting that consultation would be required
with adjoining businesses and land owners. It is anticipated the impact to on-street car parking
will be investigated in consultation with the City of Melbourne and relevant stakeholders as part
of a permit condition.
In addition, an existing bus stop located on the southern side of Kensington Road opposite
proposed Site Access 2, is proposed to be relocated approximately 200m south-east of the
existing bus stop. It is noted that this is subject to further investigation and consultation with Public
Transport Victoria and would be undertaken at later stage of the project. The location of the on-
street spaces loss as well as site access arrangements have been shown conceptually in a plan
prepared by GTA (Drawing No. 14M2307000-03P1 dated 20 November 2014), included in
Appendix C.
5.4 Car Parking Layout
A detailed review of the car parking layout will be undertaken with subsequent future planning
permit stage of the development. A preliminary review of the ground floor plan of the car
parking layout against the relevant Design Standards set out in Clause 52.06 of the Melbourne
Planning Scheme has been undertaken. The review notes as following:
Design Standard 1: Accessways
Dimensions and internal radius at change of direction or intersection should be
checked at later stage of the project.
Internal ramps have a minimum width of 6.6m in accordance with the Australian
Standards.
Pedestrian splays measuring 2 m wide by 2.5 m deep are required on both sides of the
access points to provide sufficient visibility to pedestrian path and to comply with Clause
3.2.4 of Australian Standards.
Design Standard 2: Car Parking Spaces
Residential car park spaces are dimensioned 2.6m wide by 5.0m long accessed from a
minimum 6.4m wide aisle, which exceeds the dimensional requirements specified in the
Melbourne Planning Scheme.
Car park spaces are a minimum 2.6m wide by 5.4m long accessed from a minimum 6.6m
wide aisle, which is in accordance with the Australian Standards for User Class 3 (A).
Parallel parking spaces are dimensioned 2.1m wide by 6.3m long. It is recommended
that spaces located with either end with obstruction should be lengthened to 6.6m.
Car spaces adjacent to walls have been provided with a minimum extra 300 mm
clearance to allow for door opening.
An extra 1.0 m extension to the dead end aisle or wider car parking aisle has been
provide in accordance with Australian Standards.
It is noted that columns have not been shown on the plans.
14M2307000 // 21/08/15
Transport Impact Assessment // Issue: Final
West Melbourne Waterfront, Development Plan 21
Design Standard 3: Gradients
Internal ramp gradients have not been shown on the plans.
Design Standard 4: Mechanical Parking
Not applicable.
Design Standard 5: Urban Design
Urban design is outside the scope of this report.
Design Standard 6: Safety
Lighting and signage is not shown but should be incorporated at the detailed design
stage.
Design Standard 7: Landscaping
Landscaping is outside the scope of this report.
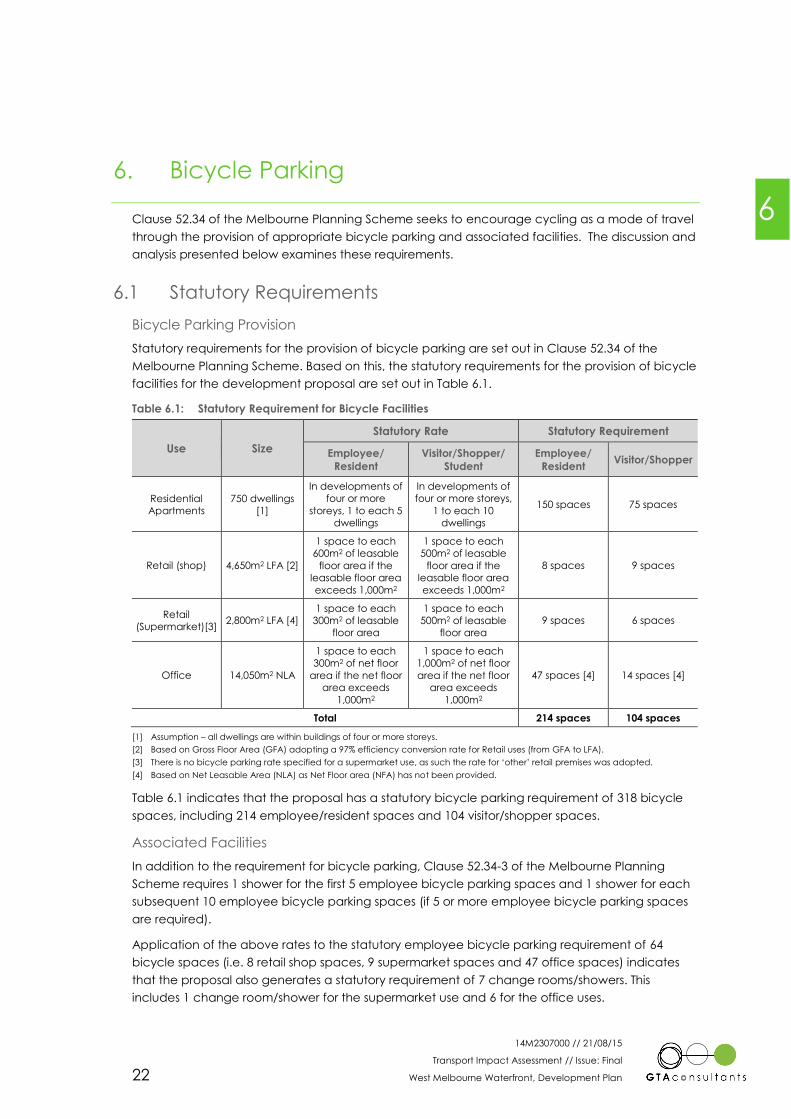
14M2307000 // 21/08/15
Transport Impact Assessment // Issue: Final
West Melbourne Waterfront, Development Plan 22
6. Bicycle Parking
Clause 52.34 of the Melbourne Planning Scheme seeks to encourage cycling as a mode of travel
through the provision of appropriate bicycle parking and associated facilities. The discussion and
analysis presented below examines these requirements.
6.1 Statutory Requirements
Bicycle Parking Provision
Statutory requirements for the provision of bicycle parking are set out in Clause 52.34 of the
Melbourne Planning Scheme. Based on this, the statutory requirements for the provision of bicycle
facilities for the development proposal are set out in Table 6.1.
Table 6.1: Statutory Requirement for Bicycle Facilities
Use Size
Statutory Rate Statutory Requirement
Employee/
Resident
Visitor/Shopper/
Student
Employee/
Resident Visitor/Shopper
Residential
Apartments
750 dwellings
[1]
In developments of
four or more
storeys, 1 to each 5
dwellings
In developments of
four or more storeys,
1 to each 10
dwellings
150 spaces 75 spaces
Retail (shop) 4,650m2 LFA [2]
1 space to each
600m2 of leasable
floor area if the
leasable floor area
exceeds 1,000m2
1 space to each
500m2 of leasable
floor area if the
leasable floor area
exceeds 1,000m2
8 spaces 9 spaces
Retail
(Supermarket)[3] 2,800m2 LFA [4]
1 space to each
300m2 of leasable
floor area
1 space to each
500m2 of leasable
floor area
9 spaces 6 spaces
Office 14,050m2 NLA
1 space to each
300m2 of net floor
area if the net floor
area exceeds
1,000m2
1 space to each
1,000m2 of net floor
area if the net floor
area exceeds
1,000m2
47 spaces [4] 14 spaces [4]
Total 214 spaces 104 spaces
[1] Assumption – all dwellings are within buildings of four or more storeys.
[2] Based on Gross Floor Area (GFA) adopting a 97% efficiency conversion rate for Retail uses (from GFA to LFA).
[3] There is no bicycle parking rate specified for a supermarket use, as such the rate for ‘other’ retail premises was adopted.
[4] Based on Net Leasable Area (NLA) as Net Floor area (NFA) has not been provided.
Table 6.1 indicates that the proposal has a statutory bicycle parking requirement of 318 bicycle
spaces, including 214 employee/resident spaces and 104 visitor/shopper spaces.
Associated Facilities
In addition to the requirement for bicycle parking, Clause 52.34-3 of the Melbourne Planning
Scheme requires 1 shower for the first 5 employee bicycle parking spaces and 1 shower for each
subsequent 10 employee bicycle parking spaces (if 5 or more employee bicycle parking spaces
are required).
Application of the above rates to the statutory employee bicycle parking requirement of 64
bicycle spaces (i.e. 8 retail shop spaces, 9 supermarket spaces and 47 office spaces) indicates
that the proposal also generates a statutory requirement of 7 change rooms/showers. This
includes 1 change room/shower for the supermarket use and 6 for the office uses.
6

14M2307000 // 21/08/15
Transport Impact Assessment // Issue: Final
West Melbourne Waterfront, Development Plan 23
6.1.1 Adequacy of Bicycle Parking/Facilities Provision
As this is a rezoning and development application, the specific details of the bicycle facilities
have not been shown on the plans. It is understood that the details of these provisions will be
outlined in the more detailed planning stage of the development proposal and can be provided
on a project by project basis.
The proposed provisions should aim to accommodate the above statutory requirements on site.
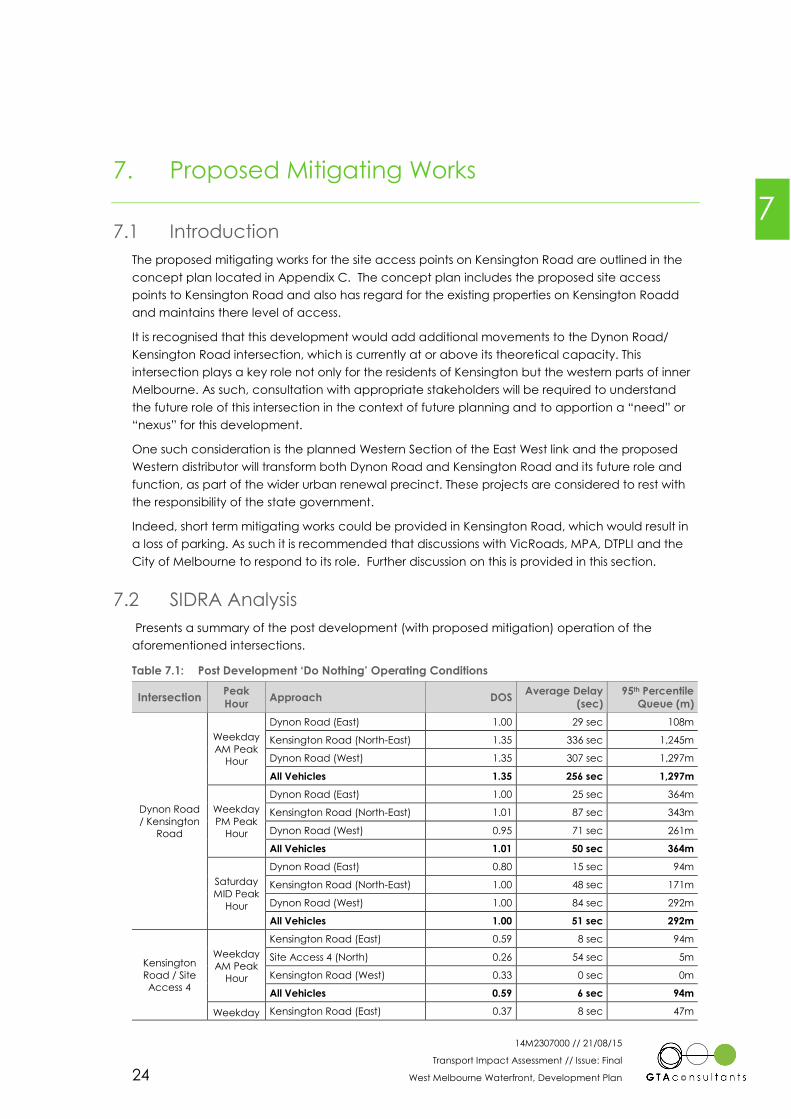
14M2307000 // 21/08/15
Transport Impact Assessment // Issue: Final
West Melbourne Waterfront, Development Plan 24
7. Proposed Mitigating Works
7.1 Introduction
The proposed mitigating works for the site access points on Kensington Road are outlined in the
concept plan located in Appendix C. The concept plan includes the proposed site access
points to Kensington Road and also has regard for the existing properties on Kensington Roadd
and maintains there level of access.
It is recognised that this development would add additional movements to the Dynon Road/
Kensington Road intersection, which is currently at or above its theoretical capacity. This
intersection plays a key role not only for the residents of Kensington but the western parts of inner
Melbourne. As such, consultation with appropriate stakeholders will be required to understand
the future role of this intersection in the context of future planning and to apportion a “need” or
“nexus” for this development.
One such consideration is the planned Western Section of the East West link and the proposed
Western distributor will transform both Dynon Road and Kensington Road and its future role and
function, as part of the wider urban renewal precinct. These projects are considered to rest with
the responsibility of the state government.
Indeed, short term mitigating works could be provided in Kensington Road, which would result in
a loss of parking. As such it is recommended that discussions with VicRoads, MPA, DTPLI and the
City of Melbourne to respond to its role. Further discussion on this is provided in this section.
7.2 SIDRA Analysis
Presents a summary of the post development (with proposed mitigation) operation of the
aforementioned intersections.
Table 7.1: Post Development ‘Do Nothing’ Operating Conditions
Intersection Peak
Hour Approach DOS
Average Delay
(sec)
95th Percentile
Queue (m)
Dynon Road
/ Kensington
Road
Weekday
AM Peak
Hour
Dynon Road (East) 1.00 29 sec 108m
Kensington Road (North-East) 1.35 336 sec 1,245m
Dynon Road (West) 1.35 307 sec 1,297m
All Vehicles 1.35 256 sec 1,297m
Weekday
PM Peak
Hour
Dynon Road (East) 1.00 25 sec 364m
Kensington Road (North-East) 1.01 87 sec 343m
Dynon Road (West) 0.95 71 sec 261m
All Vehicles 1.01 50 sec 364m
Saturday
MID Peak
Hour
Dynon Road (East) 0.80 15 sec 94m
Kensington Road (North-East) 1.00 48 sec 171m
Dynon Road (West) 1.00 84 sec 292m
All Vehicles 1.00 51 sec 292m
Kensington
Road / Site
Access 4
Weekday
AM Peak
Hour
Kensington Road (East) 0.59 8 sec 94m
Site Access 4 (North) 0.26 54 sec 5m
Kensington Road (West) 0.33 0 sec 0m
All Vehicles 0.59 6 sec 94m
Weekday Kensington Road (East) 0.37 8 sec 47m
7
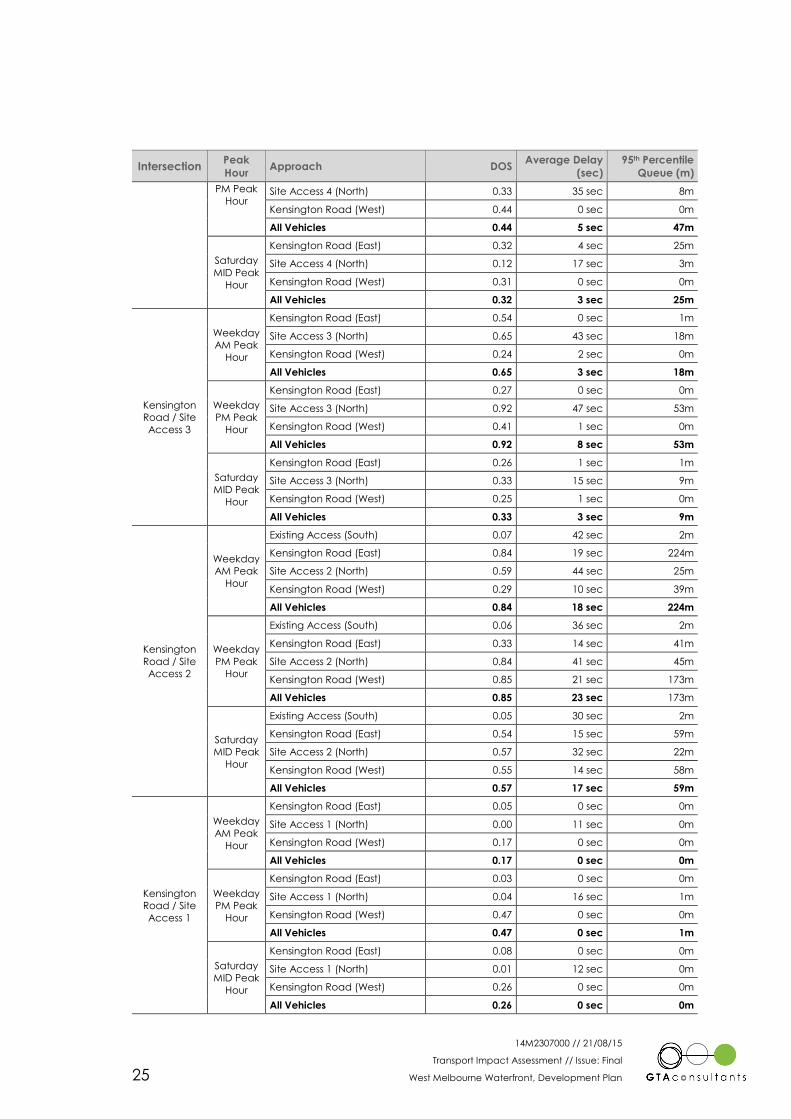
14M2307000 // 21/08/15
Transport Impact Assessment // Issue: Final
West Melbourne Waterfront, Development Plan 25
Intersection Peak
Hour Approach DOS
Average Delay
(sec)
95th Percentile
Queue (m)
PM Peak
Hour Site Access 4 (North) 0.33 35 sec 8m
Kensington Road (West) 0.44 0 sec 0m
All Vehicles 0.44 5 sec 47m
Saturday
MID Peak
Hour
Kensington Road (East) 0.32 4 sec 25m
Site Access 4 (North) 0.12 17 sec 3m
Kensington Road (West) 0.31 0 sec 0m
All Vehicles 0.32 3 sec 25m
Kensington
Road / Site
Access 3
Weekday
AM Peak
Hour
Kensington Road (East) 0.54 0 sec 1m
Site Access 3 (North) 0.65 43 sec 18m
Kensington Road (West) 0.24 2 sec 0m
All Vehicles 0.65 3 sec 18m
Weekday
PM Peak
Hour
Kensington Road (East) 0.27 0 sec 0m
Site Access 3 (North) 0.92 47 sec 53m
Kensington Road (West) 0.41 1 sec 0m
All Vehicles 0.92 8 sec 53m
Saturday
MID Peak
Hour
Kensington Road (East) 0.26 1 sec 1m
Site Access 3 (North) 0.33 15 sec 9m
Kensington Road (West) 0.25 1 sec 0m
All Vehicles 0.33 3 sec 9m
Kensington
Road / Site
Access 2
Weekday
AM Peak
Hour
Existing Access (South) 0.07 42 sec 2m
Kensington Road (East) 0.84 19 sec 224m
Site Access 2 (North) 0.59 44 sec 25m
Kensington Road (West) 0.29 10 sec 39m
All Vehicles 0.84 18 sec 224m
Weekday
PM Peak
Hour
Existing Access (South) 0.06 36 sec 2m
Kensington Road (East) 0.33 14 sec 41m
Site Access 2 (North) 0.84 41 sec 45m
Kensington Road (West) 0.85 21 sec 173m
All Vehicles 0.85 23 sec 173m
Saturday
MID Peak
Hour
Existing Access (South) 0.05 30 sec 2m
Kensington Road (East) 0.54 15 sec 59m
Site Access 2 (North) 0.57 32 sec 22m
Kensington Road (West) 0.55 14 sec 58m
All Vehicles 0.57 17 sec 59m
Kensington
Road / Site
Access 1
Weekday
AM Peak
Hour
Kensington Road (East) 0.05 0 sec 0m
Site Access 1 (North) 0.00 11 sec 0m
Kensington Road (West) 0.17 0 sec 0m
All Vehicles 0.17 0 sec 0m
Weekday
PM Peak
Hour
Kensington Road (East) 0.03 0 sec 0m
Site Access 1 (North) 0.04 16 sec 1m
Kensington Road (West) 0.47 0 sec 0m
All Vehicles 0.47 0 sec 1m
Saturday
MID Peak
Hour
Kensington Road (East) 0.08 0 sec 0m
Site Access 1 (North) 0.01 12 sec 0m
Kensington Road (West) 0.26 0 sec 0m
All Vehicles 0.26 0 sec 0m
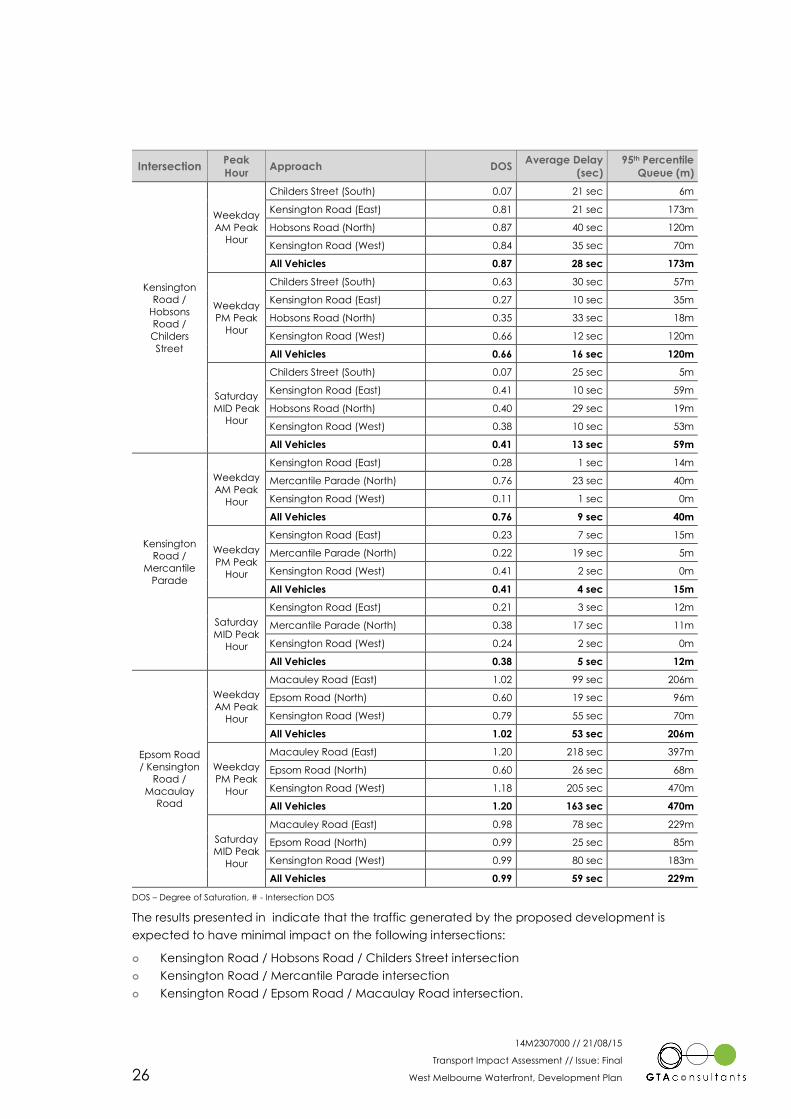
14M2307000 // 21/08/15
Transport Impact Assessment // Issue: Final
West Melbourne Waterfront, Development Plan 26
Intersection Peak
Hour Approach DOS
Average Delay
(sec)
95th Percentile
Queue (m)
Kensington
Road /
Hobsons
Road /
Childers
Street
Weekday
AM Peak
Hour
Childers Street (South) 0.07 21 sec 6m
Kensington Road (East) 0.81 21 sec 173m
Hobsons Road (North) 0.87 40 sec 120m
Kensington Road (West) 0.84 35 sec 70m
All Vehicles 0.87 28 sec 173m
Weekday
PM Peak
Hour
Childers Street (South) 0.63 30 sec 57m
Kensington Road (East) 0.27 10 sec 35m
Hobsons Road (North) 0.35 33 sec 18m
Kensington Road (West) 0.66 12 sec 120m
All Vehicles 0.66 16 sec 120m
Saturday
MID Peak
Hour
Childers Street (South) 0.07 25 sec 5m
Kensington Road (East) 0.41 10 sec 59m
Hobsons Road (North) 0.40 29 sec 19m
Kensington Road (West) 0.38 10 sec 53m
All Vehicles 0.41 13 sec 59m
Kensington
Road /
Mercantile
Parade
Weekday
AM Peak
Hour
Kensington Road (East) 0.28 1 sec 14m
Mercantile Parade (North) 0.76 23 sec 40m
Kensington Road (West) 0.11 1 sec 0m
All Vehicles 0.76 9 sec 40m
Weekday
PM Peak
Hour
Kensington Road (East) 0.23 7 sec 15m
Mercantile Parade (North) 0.22 19 sec 5m
Kensington Road (West) 0.41 2 sec 0m
All Vehicles 0.41 4 sec 15m
Saturday
MID Peak
Hour
Kensington Road (East) 0.21 3 sec 12m
Mercantile Parade (North) 0.38 17 sec 11m
Kensington Road (West) 0.24 2 sec 0m
All Vehicles 0.38 5 sec 12m
Epsom Road
/ Kensington
Road /
Macaulay
Road
Weekday
AM Peak
Hour
Macauley Road (East) 1.02 99 sec 206m
Epsom Road (North) 0.60 19 sec 96m
Kensington Road (West) 0.79 55 sec 70m
All Vehicles 1.02 53 sec 206m
Weekday
PM Peak
Hour
Macauley Road (East) 1.20 218 sec 397m
Epsom Road (North) 0.60 26 sec 68m
Kensington Road (West) 1.18 205 sec 470m
All Vehicles 1.20 163 sec 470m
Saturday
MID Peak
Hour
Macauley Road (East) 0.98 78 sec 229m
Epsom Road (North) 0.99 25 sec 85m
Kensington Road (West) 0.99 80 sec 183m
All Vehicles 0.99 59 sec 229m
DOS – Degree of Saturation, # - Intersection DOS
The results presented in indicate that the traffic generated by the proposed development is
expected to have minimal impact on the following intersections:
Kensington Road / Hobsons Road / Childers Street intersection
Kensington Road / Mercantile Parade intersection
Kensington Road / Epsom Road / Macaulay Road intersection.
14M2307000 // 21/08/15
Transport Impact Assessment // Issue: Final
West Melbourne Waterfront, Development Plan 27
The proposed development does, however, expect a moderate impact on the intersection of
Dynon Road and Kensington Road, although noting that this intersection is currently operating at
a high capacity the overall change is considered to increase exponentially.
The performance of the intersections which were operating at a DOS in excess of 1.22 in the AM peak
period and 1.07 in the PM peak period in the base case scenario is expected to deteriorate to a DOS
of between 1.35 and 1.20 (if unchanged). Notwithstanding, mitigation works have been investigated
for these intersections in order to reduce the impact of the proposed development.
With regard to the proposed site access points, these are expected to operate well under post
development operating conditions.
7.2.1 External Intersections
In reviewing the outputs for the Dynon Road / Kensington Road intersection, it is clear that the
operation of the intersection will be constrained with the development traffic. Improving the
intersection should not be viewed in this regard for a number of reasons including:
Limited road space exists on Kensington Road to provide substantial capacity
increases. One such improvement investigated could be to increase the length of the
left turn lane on the approach to Dynon Road. This would result in a loss of up to 12 on
street parking spaces and discussions with CoM will be required to determine the
suitability of this approach.
The right turn lane from Dynon Road into Kensington Road is at the maximum length
possible and increasing its length would result in a reduced lane length for the right turn
into the existing transfer station site on the south side of Dynon Road.
Increasing east west capacity on Dynon Road (via additional lane capacity) would
improve the current situation, however any contribution needs to have regard for the
nexus between this development and any intersection works. That is, providing
improved capacity would be a longer term outcome for the road network and would
require revisiting as part of the future development of the Dynon Precinct. It should also
have regard for the upstream and downstream intersection capacities.
Additional east-west capacity on Dynon Road will have to have regard for the future
legacy of the link in the network. This includes having regard for:
o Understanding the impact of the Western Section of the East-West Link. The Linking
Melbourne Authority website indicates that “Detailed planning on the western
section is now underway, including site investigations, design work, community
engagement and a planning approvals process. Construction of the western
section is expected to start by the end of 2015.” Information on the resultant traffic
numbers on Dynon Road are not available, however it is assumed with this link
volumes would reduce. It is recognised that uncertainty for the project exists,
however its need is not undisputed.
o The impact of the Melbourne Metro Rail Project will provide increased rail capacity
between Parkville, the CBD and the western suburbs. Detailed modelling and
outputs are not available however this project is expected to result in a major
increase in rail mode share and reduce the vehicle demand for Dynon Road.
o As per the Melbourne Metro Project, the Regional Rail Link will also provide
improved and increased capacity for commuters in western Melbourne and is
expected in impact on the current mode share for commuters.
o The role of the Dynon precinct as depicted in Plan Melbourne. A solution for the
intersection is incumbent on the overall precinct.
14M2307000 // 21/08/15
Transport Impact Assessment // Issue: Final
West Melbourne Waterfront, Development Plan 28
Given the above, further dialogue and consultation will be required with the relevant authorities
to understand the future transport conditions for the precinct, and its impact on the Dynon Road
/ Kensington Road intersection, to determine the appropriate quantum (if any) that this
development should be required to contribute.
Similarly, the analysis suggests that the Epsom Road / Kensington Road / Macaulay Road
Intersection is anticipated to marginally increase its DOS and resultant queue lengths and delays.
As stated in Section 2, the anticipated increase in traffic predicted to pass through this
intersection marginally exceeds 10% on some movements. As such, any improvements should
have regard for need or nexus for this development to increase and resolve an existing capacity
issue.
Further, review of the current intersection configuration and adjacent land uses indicate that
limited ability exists to meaningfully improve its capacity. Potential or possible improvements to
the intersection capacity could include: removal of parking to increase lane lengths, or phasing
optimisation changes. Any capacity improvements at this site will likely be offset by downstream
impacts and queuing from the Macaulay Road rail crossing. Indeed, the role of Kensington Road
as a connecting road, rather than a through route, supports the approach that it should be
maintained in its current format.
In summary, it is clear that current congestion exists at the two aforementioned intersections, and
that a network wide review of their role should be undertaken. In this regard, possible solution
exist that could alter travel behaviour that would have consideration of their role in the network.
As such these intersections are not considered to be the determining factor underpinning
approval of this development plan.
14M2307000 // 21/08/15
Transport Impact Assessment // Issue: Final
West Melbourne Waterfront, Development Plan 29
8. Conclusion
Based on the inputs, analysis and discussions presented within this report, the following
conclusions are made:
i The proposed rezoning and development plan generates in the order of 600, 840 and
790 vehicle movements in the AM, PM and Saturday peak periods respectively.
ii Application of the distribution and assignment for each of the uses has regard for
catchment areas, access to the arterial road network and journey to work patterns and
have been applied accordingly.
iii The existing network currently operates close to its theoretical capacity at Dynon road /
Kensington Road (AM peak) and at Epsom Road / Kensington Road / Macaulay Road
in the AM, PM and Saturday peak periods.
iv The site will provide four access points on Kensington Road. Each of the access points
have varying levels of control including a signalised intersection providing full turning
movements.
v The analysis indicates that the site access points are expected to operate satisfactorily
at full development of the site.
vi The site is expected to generate a demand for some 1,300 car parking spaces.
vii The proposed supply of some 1,384 spaces is expected to accommodate the
anticipated parking demand.
viii The proposed parking layout is generally consistent with the dimensional requirements
as set out in the Melbourne Planning Scheme and where relevant the Australian/New
Zealand Standards for Off Street Car Parking (AS/NZS2890.1:2004 and
AS/NZS2890.6:2009).
ix The site will be required to provide provision 318 bicycle spaces and associated
facilities, and will be subject to further detailed planning as part of subsequent
development applications.
The analysis presented in this report is underpinned by range of inputs and assumptions that are
based on engineering best practice. The outcomes of the analysis clearly indicate that the
proposed access points on Kensington Road will be more than capable of accommodating the
site generated traffic.
Indeed, further dialogue and consultation will be required with the relevant authorities to
understand the future transport conditions for the precinct, more specifically, their impact on the
Dynon Road / Kensington Road as well as Epsom Road / Kensington Road / McCauley Road
intersections, to determine an appropriate quantum of works that this development should be
required to contribute.
Notwithstanding, approval of the development should not be reliant on the outcomes of these
works as these discussions apply more to the broader precinct. As such, based on traffic and
transport grounds, there are no fundamental reasons as to why approval of this development
application should not proceed.
8
14M2307000 // 21/08/15
Transport Impact Assessment // Issue: Final
West Melbourne Waterfront, Development Plan
Appendix A
Traffic Generation Rates and Distribution
Ap
pe
nd
ix A

14M2307000 // 21/08/15
Transport Impact Assessment // Issue: Final
West Melbourne Waterfront, Development Plan
Generation Rates Overview
Traffic generation estimates for the various components of the proposed development have
been arrived at by using a number of sources including the RTANSW ‘A Guide to Traffic
Generating Developments’, the ‘Inner Municipalities Parking Study’ (IMPS), GTA Consultants
survey database and our experiences on projects of a similar nature.
Indeed, the generation rates used for this development are somewhat aggressive. This is
considered appropriate having regard for the type of use for the site (i.e. mixed use), its proximity
to good public transport as well as the overall future development of the precinct as a place to
live and work.
Residential Apartments
A single house on a standard lot in an outer metropolitan area will typically generate traffic in the
order of 1 trip in the peak hour and 10 trips per day. Medium density dwellings generally exhibit a
lower traffic generation rate. In the outer metropolitan areas, where public transport accessibility
is relatively low, the rate for medium density units is typically in the order of 8 trips per day. Closer
to the Melbourne CAD the rate reduces to in the order of 3 to 6 trips per day depending on
dwelling size, parking provision and accessibility to public transport and local amenities, among
other things. Peak hour rates are typically 10 to 12% of daily rates.
A further review of the traffic generation rates indicates that the rate of 0.31 trips per dwelling has
been supported through numerous development approvals and tribunals, including VCAT and
can be supported by the following:
Traffic surveys undertaken by GTA at Chapel Street in South Yarra, Barkly Street in
Footscray, Eureka Tower and Freshwater Place provide a rate of between 0.1 and 0.3
trips per dwelling in the peak hour.
The RTANSW ‘A Guide to Traffic Generating Developments’ indicates a peak hour
traffic generation rate of 0.29 movements per dwelling for high density residential
buildings in metropolitan sub-regional centres.
The VISTA 07 data indicates that for the municipalities located within 7km of Melbourne
CBD the traffic generation rate is between 0.25 and 0.36 trips in the peak hour.
Rates of 0.30 for the AM peak, 0.25 for the PM peak and 0.275 for the Saturday peak
rates have been tested for similar uses in the vicinity of the site by VicRoads, Melbourne
City Council, Moonee Valley City Council and PTV.
Taking the above into account, and that the site is adjacent to a high frequency bus line and
800m of a railway station the rates of 0.30 for the AM peak, 0.25 for the PM peak and 0.275 for the
Saturday peak are considered appropriate.
Specialty Retail Design Rates
Traffic generation estimates for the proposed specialty retail uses have been adopted from RTA
NSW, with the traffic generation estimates for the AM peak hour, PM peak hour and Saturday
midday peak hour. A further reduction of 20% has been applied to account for the fact that a
proportion of the catchment for the specialty retail is located within the development site and
will not generate a trip onto the external road network. Table A.1 provides a summary of the
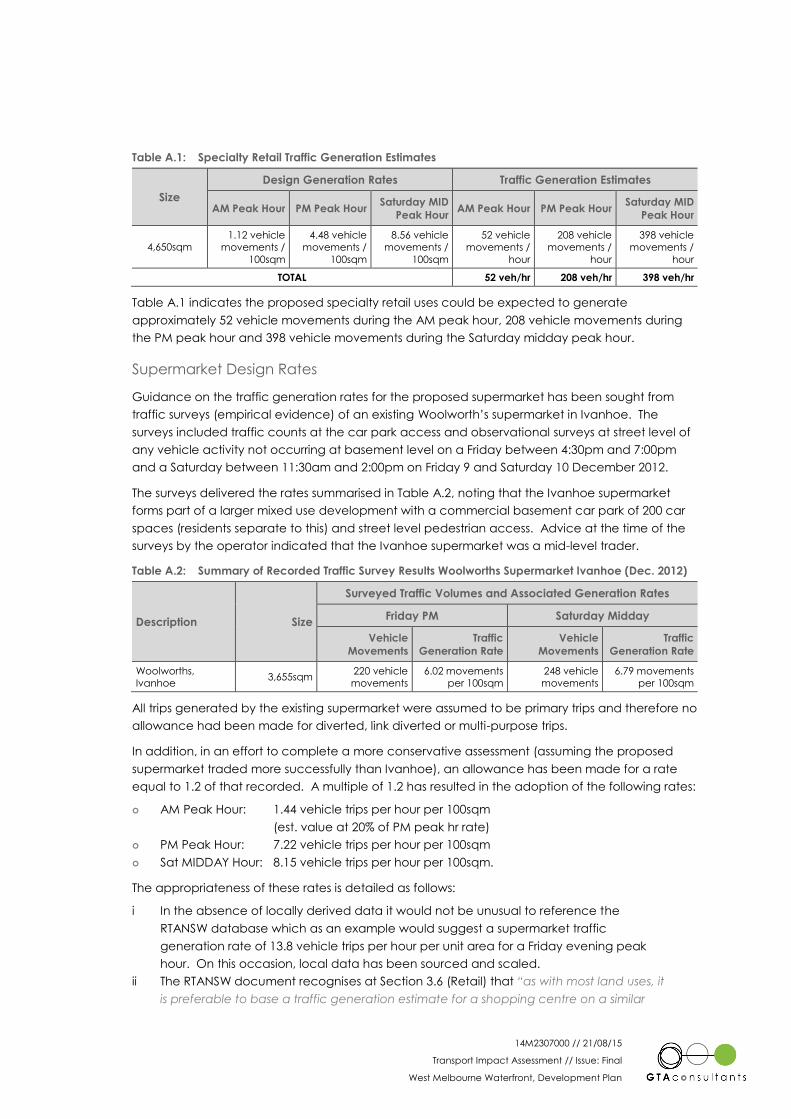
14M2307000 // 21/08/15
Transport Impact Assessment // Issue: Final
West Melbourne Waterfront, Development Plan
Table A.1: Specialty Retail Traffic Generation Estimates
Size
Design Generation Rates Traffic Generation Estimates
AM Peak Hour PM Peak Hour Saturday MID
Peak Hour AM Peak Hour PM Peak Hour
Saturday MID
Peak Hour
4,650sqm 1.12 vehicle
movements /
100sqm
4.48 vehicle
movements /
100sqm
8.56 vehicle
movements /
100sqm
52 vehicle
movements /
hour
208 vehicle
movements /
hour
398 vehicle
movements /
hour
TOTAL 52 veh/hr 208 veh/hr 398 veh/hr
Table A.1 indicates the proposed specialty retail uses could be expected to generate
approximately 52 vehicle movements during the AM peak hour, 208 vehicle movements during
the PM peak hour and 398 vehicle movements during the Saturday midday peak hour.
Supermarket Design Rates
Guidance on the traffic generation rates for the proposed supermarket has been sought from
traffic surveys (empirical evidence) of an existing Woolworth’s supermarket in Ivanhoe. The
surveys included traffic counts at the car park access and observational surveys at street level of
any vehicle activity not occurring at basement level on a Friday between 4:30pm and 7:00pm
and a Saturday between 11:30am and 2:00pm on Friday 9 and Saturday 10 December 2012.
The surveys delivered the rates summarised in Table A.2, noting that the Ivanhoe supermarket
forms part of a larger mixed use development with a commercial basement car park of 200 car
spaces (residents separate to this) and street level pedestrian access. Advice at the time of the
surveys by the operator indicated that the Ivanhoe supermarket was a mid-level trader.
Table A.2: Summary of Recorded Traffic Survey Results Woolworths Supermarket Ivanhoe (Dec. 2012)
Description Size
Surveyed Traffic Volumes and Associated Generation Rates
Friday PM Saturday Midday
Vehicle
Movements
Traffic
Generation Rate
Vehicle
Movements
Traffic
Generation Rate
Woolworths,
Ivanhoe 3,655sqm
220 vehicle
movements
6.02 movements
per 100sqm
248 vehicle
movements
6.79 movements
per 100sqm
All trips generated by the existing supermarket were assumed to be primary trips and therefore no
allowance had been made for diverted, link diverted or multi-purpose trips.
In addition, in an effort to complete a more conservative assessment (assuming the proposed
supermarket traded more successfully than Ivanhoe), an allowance has been made for a rate
equal to 1.2 of that recorded. A multiple of 1.2 has resulted in the adoption of the following rates:
AM Peak Hour: 1.44 vehicle trips per hour per 100sqm
(est. value at 20% of PM peak hr rate)
PM Peak Hour: 7.22 vehicle trips per hour per 100sqm
Sat MIDDAY Hour: 8.15 vehicle trips per hour per 100sqm.
The appropriateness of these rates is detailed as follows:
i In the absence of locally derived data it would not be unusual to reference the
RTANSW database which as an example would suggest a supermarket traffic
generation rate of 13.8 vehicle trips per hour per unit area for a Friday evening peak
hour. On this occasion, local data has been sourced and scaled.
ii The RTANSW document recognises at Section 3.6 (Retail) that “as with most land uses, it
is preferable to base a traffic generation estimate for a shopping centre on a similar
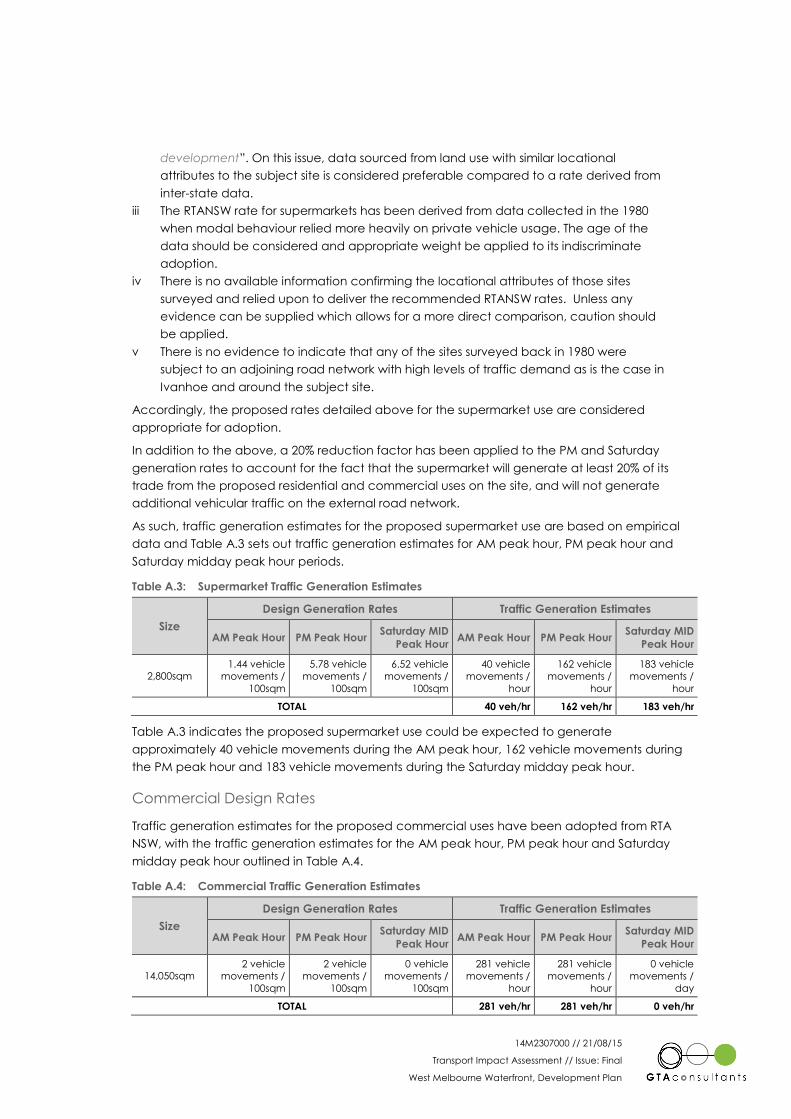
14M2307000 // 21/08/15
Transport Impact Assessment // Issue: Final
West Melbourne Waterfront, Development Plan
development”. On this issue, data sourced from land use with similar locational
attributes to the subject site is considered preferable compared to a rate derived from
inter-state data.
iii The RTANSW rate for supermarkets has been derived from data collected in the 1980
when modal behaviour relied more heavily on private vehicle usage. The age of the
data should be considered and appropriate weight be applied to its indiscriminate
adoption.
iv There is no available information confirming the locational attributes of those sites
surveyed and relied upon to deliver the recommended RTANSW rates. Unless any
evidence can be supplied which allows for a more direct comparison, caution should
be applied.
v There is no evidence to indicate that any of the sites surveyed back in 1980 were
subject to an adjoining road network with high levels of traffic demand as is the case in
Ivanhoe and around the subject site.
Accordingly, the proposed rates detailed above for the supermarket use are considered
appropriate for adoption.
In addition to the above, a 20% reduction factor has been applied to the PM and Saturday
generation rates to account for the fact that the supermarket will generate at least 20% of its
trade from the proposed residential and commercial uses on the site, and will not generate
additional vehicular traffic on the external road network.
As such, traffic generation estimates for the proposed supermarket use are based on empirical
data and Table A.3 sets out traffic generation estimates for AM peak hour, PM peak hour and
Saturday midday peak hour periods.
Table A.3: Supermarket Traffic Generation Estimates
Size
Design Generation Rates Traffic Generation Estimates
AM Peak Hour PM Peak Hour Saturday MID
Peak Hour AM Peak Hour PM Peak Hour
Saturday MID
Peak Hour
2,800sqm 1.44 vehicle
movements /
100sqm
5.78 vehicle
movements /
100sqm
6.52 vehicle
movements /
100sqm
40 vehicle
movements /
hour
162 vehicle
movements /
hour
183 vehicle
movements /
hour
TOTAL 40 veh/hr 162 veh/hr 183 veh/hr
Table A.3 indicates the proposed supermarket use could be expected to generate
approximately 40 vehicle movements during the AM peak hour, 162 vehicle movements during
the PM peak hour and 183 vehicle movements during the Saturday midday peak hour.
Commercial Design Rates
Traffic generation estimates for the proposed commercial uses have been adopted from RTA
NSW, with the traffic generation estimates for the AM peak hour, PM peak hour and Saturday
midday peak hour outlined in Table A.4.
Table A.4: Commercial Traffic Generation Estimates
Size
Design Generation Rates Traffic Generation Estimates
AM Peak Hour PM Peak Hour Saturday MID
Peak Hour AM Peak Hour PM Peak Hour
Saturday MID
Peak Hour
14,050sqm 2 vehicle
movements /
100sqm
2 vehicle
movements /
100sqm
0 vehicle
movements /
100sqm
281 vehicle
movements /
hour
281 vehicle
movements /
hour
0 vehicle
movements /
day
TOTAL 281 veh/hr 281 veh/hr 0 veh/hr
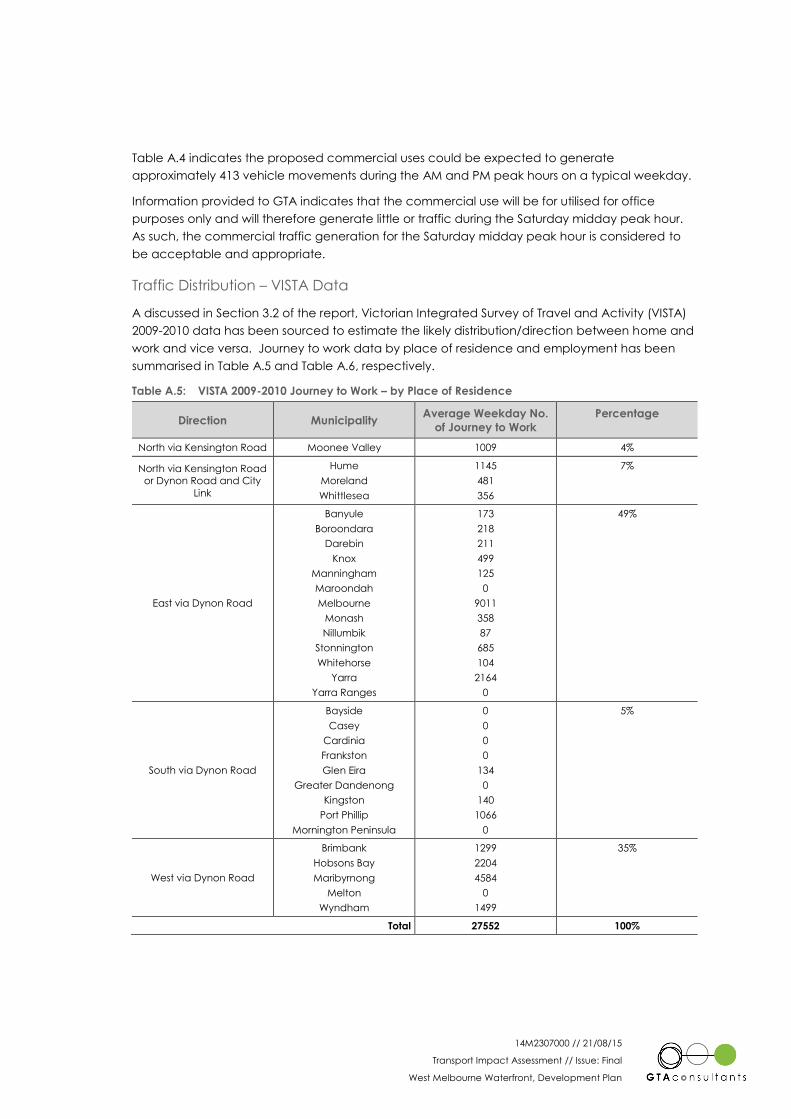
14M2307000 // 21/08/15
Transport Impact Assessment // Issue: Final
West Melbourne Waterfront, Development Plan
Table A.4 indicates the proposed commercial uses could be expected to generate
approximately 413 vehicle movements during the AM and PM peak hours on a typical weekday.
Information provided to GTA indicates that the commercial use will be for utilised for office
purposes only and will therefore generate little or traffic during the Saturday midday peak hour.
As such, the commercial traffic generation for the Saturday midday peak hour is considered to
be acceptable and appropriate.
Traffic Distribution – VISTA Data
A discussed in Section 3.2 of the report, Victorian Integrated Survey of Travel and Activity (VISTA)
2009-2010 data has been sourced to estimate the likely distribution/direction between home and
work and vice versa. Journey to work data by place of residence and employment has been
summarised in Table A.5 and Table A.6, respectively.
Table A.5: VISTA 2009-2010 Journey to Work – by Place of Residence
Direction Municipality Average Weekday No.
of Journey to Work
Percentage
North via Kensington Road Moonee Valley 1009 4%
North via Kensington Road
or Dynon Road and City
Link
Hume
Moreland
Whittlesea
1145
481
356
7%
East via Dynon Road
Banyule
Boroondara
Darebin
Knox
Manningham
Maroondah
Melbourne
Monash
Nillumbik
Stonnington
Whitehorse
Yarra
Yarra Ranges
173
218
211
499
125
0
9011
358
87
685
104
2164
0
49%
South via Dynon Road
Bayside
Casey
Cardinia
Frankston
Glen Eira
Greater Dandenong
Kingston
Port Phillip
Mornington Peninsula
0
0
0
0
134
0
140
1066
0
5%
West via Dynon Road
Brimbank
Hobsons Bay
Maribyrnong
Melton
Wyndham
1299
2204
4584
0
1499
35%
Total 27552 100%
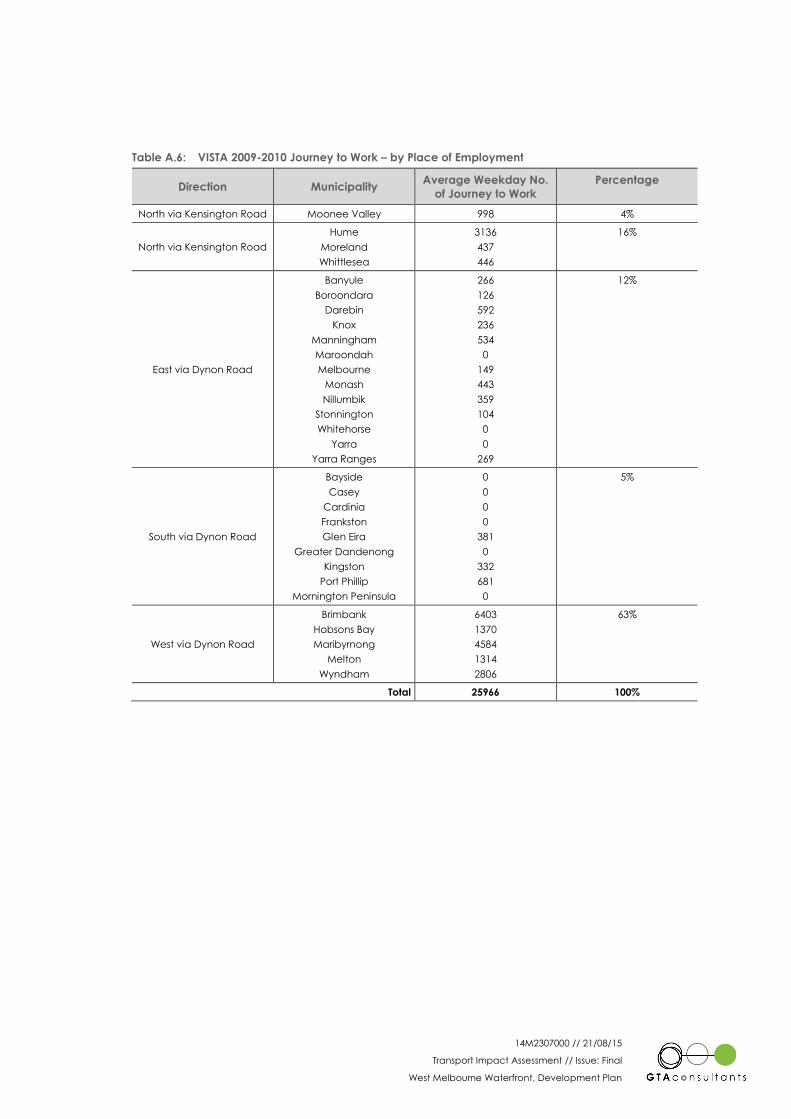
14M2307000 // 21/08/15
Transport Impact Assessment // Issue: Final
West Melbourne Waterfront, Development Plan
Table A.6: VISTA 2009-2010 Journey to Work – by Place of Employment
Direction Municipality Average Weekday No.
of Journey to Work
Percentage
North via Kensington Road Moonee Valley 998 4%
North via Kensington Road
Hume
Moreland
Whittlesea
3136
437
446
16%
East via Dynon Road
Banyule
Boroondara
Darebin
Knox
Manningham
Maroondah
Melbourne
Monash
Nillumbik
Stonnington
Whitehorse
Yarra
Yarra Ranges
266
126
592
236
534
0
149
443
359
104
0
0
269
12%
South via Dynon Road
Bayside
Casey
Cardinia
Frankston
Glen Eira
Greater Dandenong
Kingston
Port Phillip
Mornington Peninsula
0
0
0
0
381
0
332
681
0
5%
West via Dynon Road
Brimbank
Hobsons Bay
Maribyrnong
Melton
Wyndham
6403
1370
4584
1314
2806
63%
Total 25966 100%
14M2307000 // 21/08/15
Transport Impact Assessment // Issue: Final
West Melbourne Waterfront, Development Plan
Appendix B
Input Volumes
Ap
pe
nd
ix B
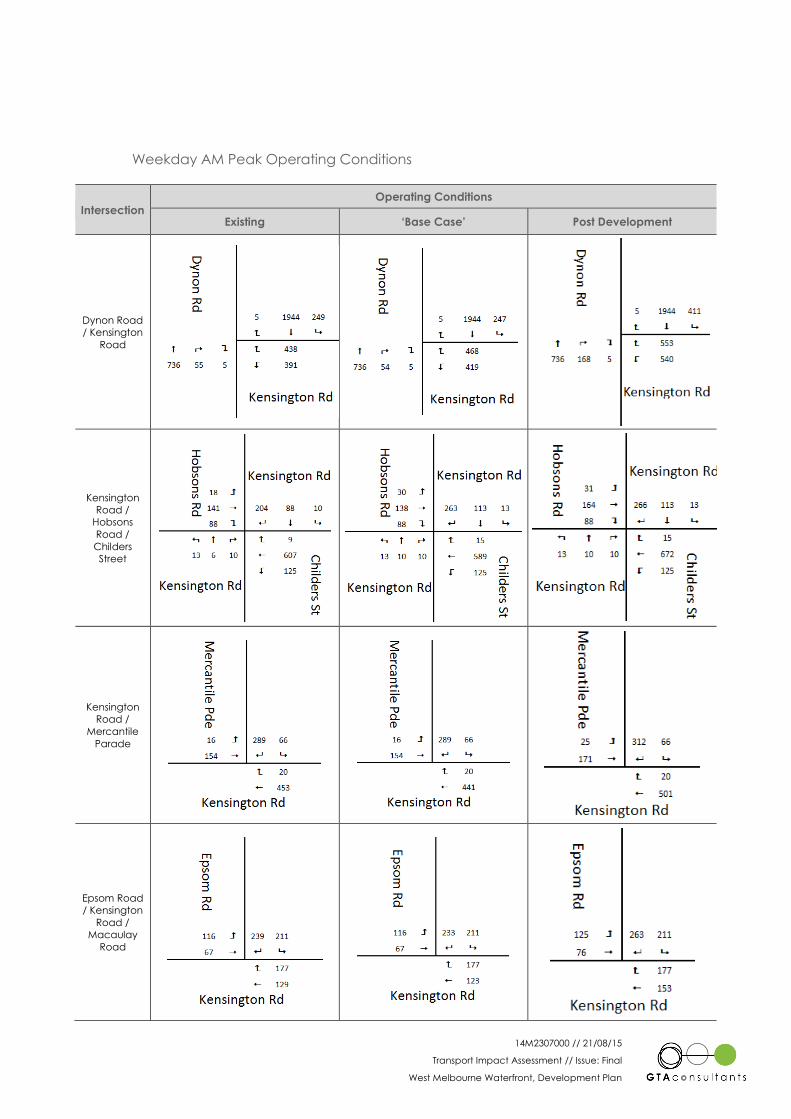
14M2307000 // 21/08/15
Transport Impact Assessment // Issue: Final
West Melbourne Waterfront, Development Plan
Weekday AM Peak Operating Conditions
Intersection Operating Conditions
Existing ‘Base Case’ Post Development
Dynon Road
/ Kensington
Road
Kensington
Road /
Hobsons
Road /
Childers
Street
Kensington
Road /
Mercantile
Parade
Epsom Road
/ Kensington
Road /
Macaulay
Road
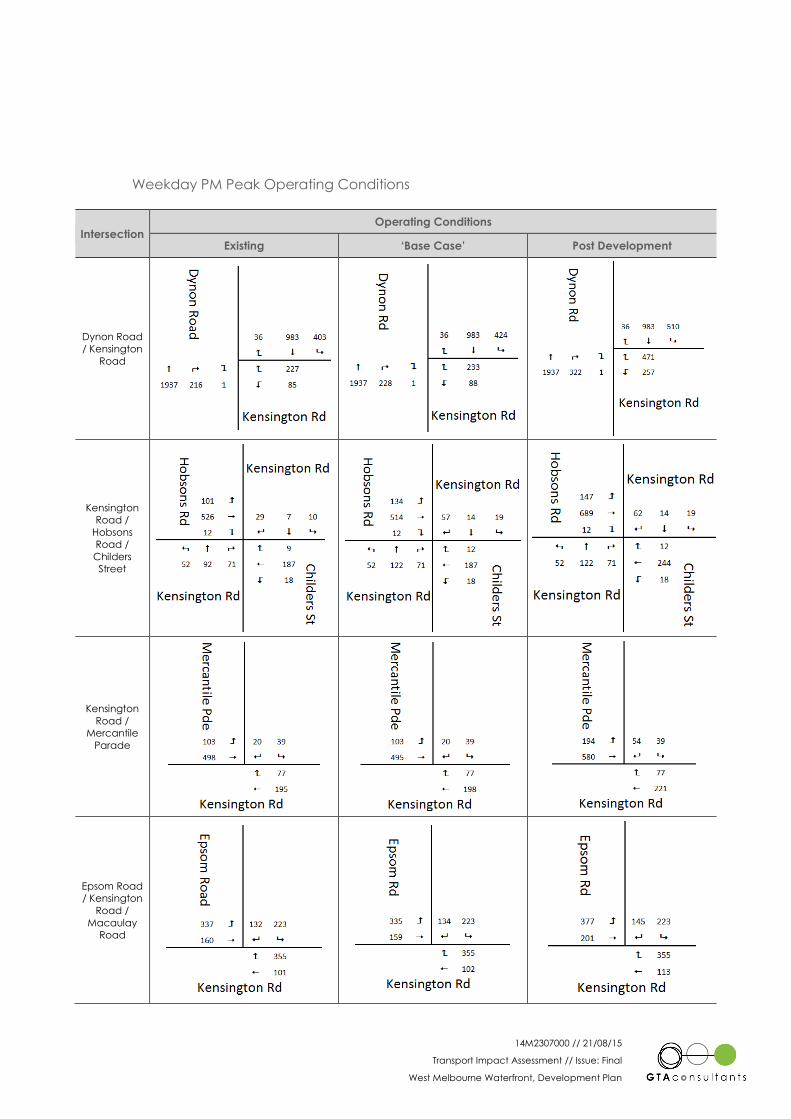
14M2307000 // 21/08/15
Transport Impact Assessment // Issue: Final
West Melbourne Waterfront, Development Plan
Weekday PM Peak Operating Conditions
Intersection Operating Conditions
Existing ‘Base Case’ Post Development
Dynon Road
/ Kensington
Road
Kensington
Road /
Hobsons
Road /
Childers
Street
Kensington
Road /
Mercantile
Parade
Epsom Road
/ Kensington
Road /
Macaulay
Road
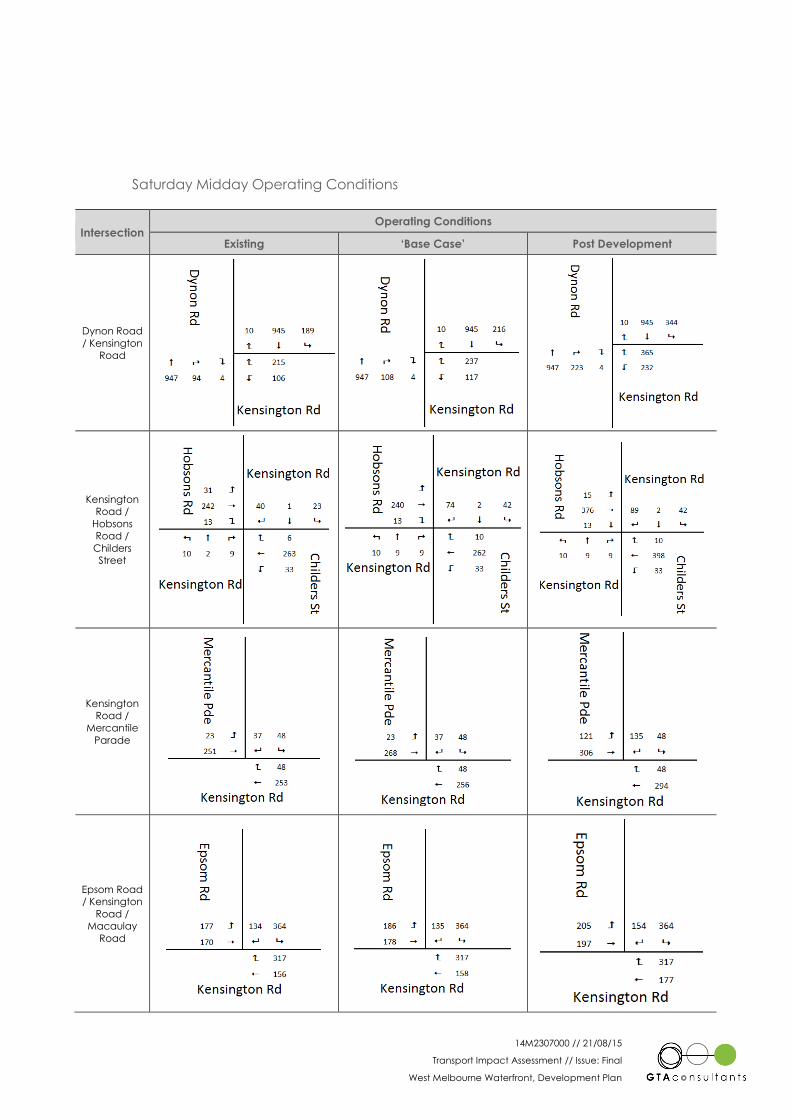
14M2307000 // 21/08/15
Transport Impact Assessment // Issue: Final
West Melbourne Waterfront, Development Plan
Saturday Midday Operating Conditions
Intersection Operating Conditions
Existing ‘Base Case’ Post Development
Dynon Road
/ Kensington
Road
Kensington
Road /
Hobsons
Road /
Childers
Street
Kensington
Road /
Mercantile
Parade
Epsom Road
/ Kensington
Road /
Macaulay
Road
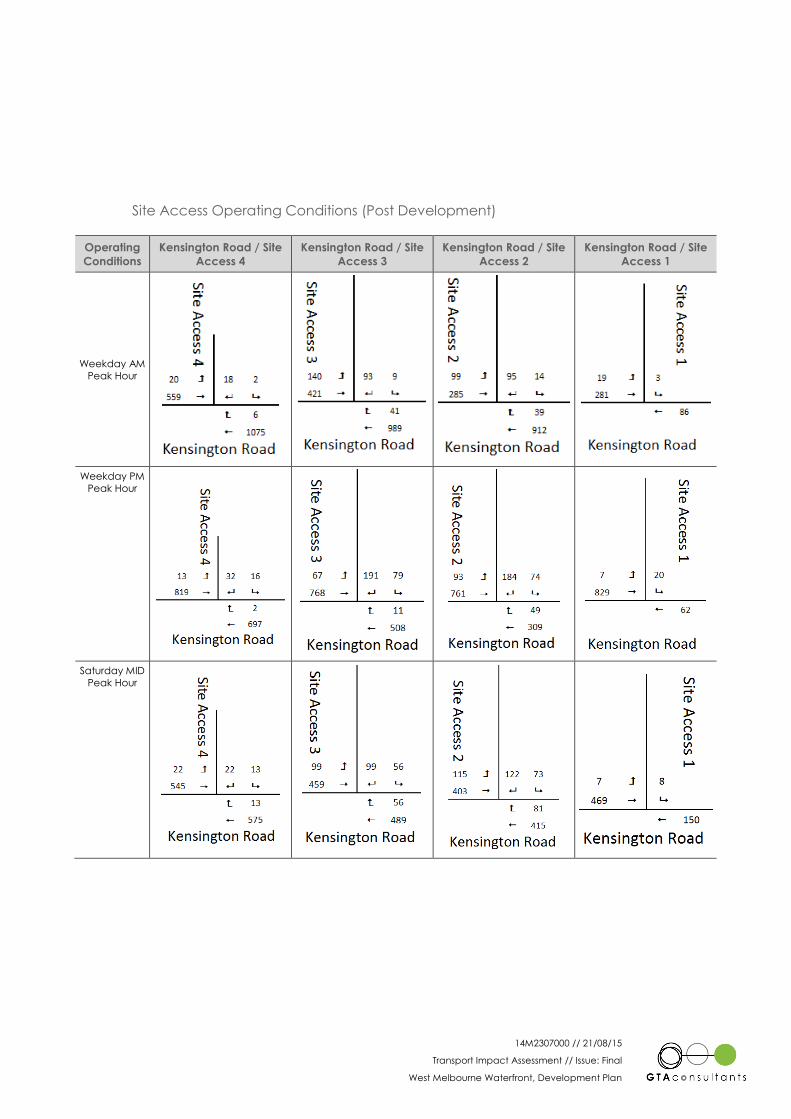
14M2307000 // 21/08/15
Transport Impact Assessment // Issue: Final
West Melbourne Waterfront, Development Plan
Site Access Operating Conditions (Post Development)
Operating
Conditions
Kensington Road / Site
Access 4
Kensington Road / Site
Access 3
Kensington Road / Site
Access 2
Kensington Road / Site
Access 1
Weekday AM
Peak Hour
Weekday PM
Peak Hour
Saturday MID
Peak Hour
14M2307000 // 21/08/15
Transport Impact Assessment // Issue: Final
West Melbourne Waterfront, Development Plan
Appendix C
Concept Plan – Site Access Arrangements
Ap
pe
nd
ix C
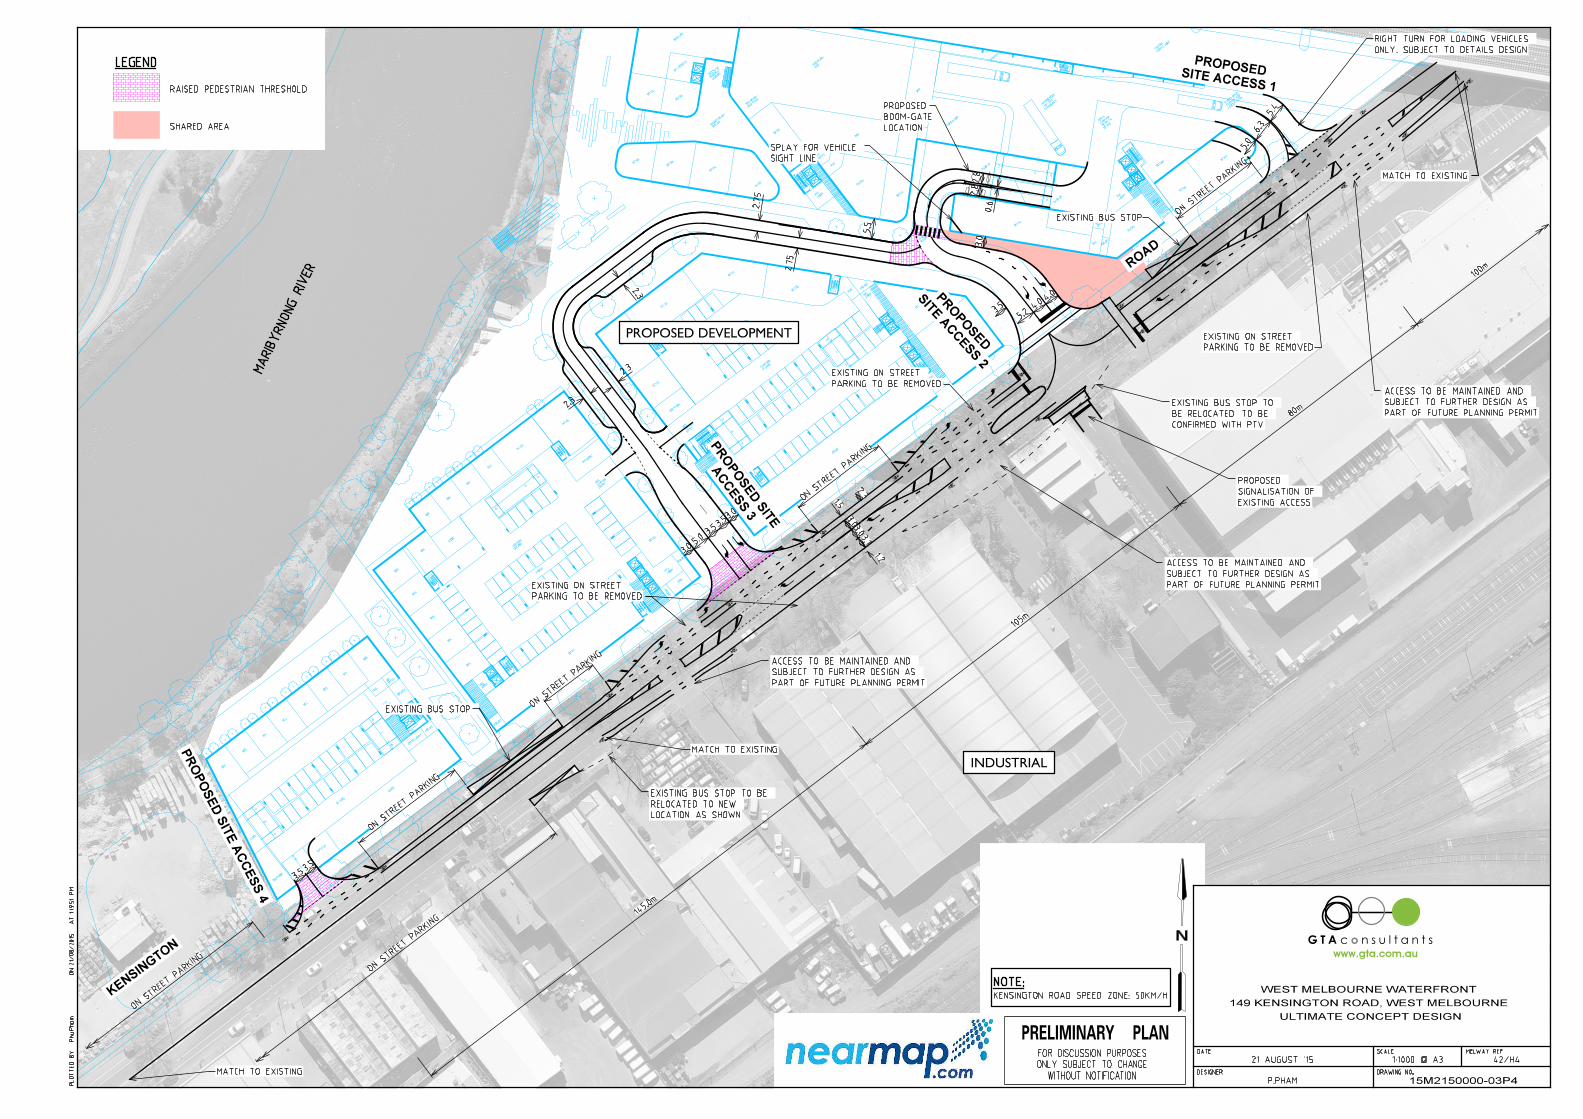
24 C
ARS
ALDIMI
NI M
AJOR -
MIXED USE
RETAI
L
RETAI
L
RETAI
L
LOBBY
OFFICELO
BBYRE
S
OFFICE L
OBBY
LOBBY
RES
LOBBY
OFFICE
SHOWROOM
RETAI
L
RETAI
L
BELO
WENTR
Y TO
CARP
ARK
OFFICE
REFU
SE
ARCADE
MARKET PL
ACE
RETAI
L
1:5
1:8
1:8
1:5
1:8
1:8
RES
RES
OFFICE L
OBBY
RES
RES
RES
RES
RES
BIN ST
ORE
RES
SERVI
CES
OFFICE
AIRL
OCKMAIL
STORE
AIRL
OCK
OFFICEBM
AIRL
OCK
RETAI
LOFFICEBM
AIRL
OCK
RETAI
L
RETAI
L
RES
LOBBY
RAMP UP
RAMP DOW
N
LOBBY
RES
ENTR
YCA
RPARK
RES
RETAI
L BOH
OFFICE
LOBBY
RES
ENTR
YCA
RPARK
RES
RETAI
L
RETAI
L
AIRL
OCK
1:5
1:8
1:8
RETAI
L
AIRL
OCK
61 C
ARSCA
R PARK
LOBBY
RES
1:5
1:10
1:8
55 C
ARSCA
R PARK
ENTR
YCA
RPARK
RES
STORE
S
SERVI
CES
RETAI
L
LOBBY
RES
AIRL
OCK
AIR
LOCK
AIRL
OCK
OFFICE
COMPACT
OR
SERVI
CES
LOADI
NG EN
TRY
CARP
ARK A
ND
SHARED
OFFICE
RETAI
L
RETAI
L
RETAI
L
RETAI
L
RETAI
L
ALDI E
NTRY
MINI M
AJOR -
REFU
SE
RETAI
L
OFFICEBM
RES
RES
RES
RES
RES
BIN ST
ORE
STORE
RES
RES
RES
RES
RES
CARP
ARK
BASEMEN
T
ACCES
S TO
WC
AMENITIES
CLEA
REANCE
- 6.2
HEAD
LOADI
NG DOCK
RETAI
L
RETAI
L
SERVI
CE Z
ONE
EXISTI
NG
BIN ST
ORE
RETAI
L
1:5
1:10
1:8
RAMP UP
BOH
1:8
PL
OTTE
D B
Y :
Phu.P
ha
mO
N21/
08/2015
AT
1:19:51
PM
GTA onsultantsc
www.gta.com.au
DRAWING NO.
SCALEDATE
DESIGNER
PRELIMINARY PLAN
WITHOUT NOTIFICATION
ONLY SUBJECT TO CHANGE
FOR DISCUSSION PURPOSES MELWAY REF
42/H41:1000 @ A3
15M2150000-03P4
ULTIMATE CONCEPT DESIGN
149 KENSINGTON ROAD, WEST MELBOURNE
WEST MELBOURNE WATERFRONT
3.1
3.0
3.0
1.5
1.2
2.3
4.0
4.0
5.2
3.5
3.5
KEN
SIN
GTO
N
RO
AD
LOCATION AS SHOWN
RELOCATED TO NEW
EXISTING BUS STOP TO BE
MATCH TO EXISTING
MATCH TO EXISTING
MATCH TO EXISTING
PROPOSED DEVELOPMENT
INDUSTRIAL
MA
RIB
YR
NO
NG RIV
ER
PARKING TO BE REMOVED
EXISTING ON STREET
PARKING TO BE REMOVED
EXISTING ON STREET
PARKING TO BE REMOVED
EXISTING ON STREET
SITE ACCESS 1
PROPOSED
SIT
E A
CCESS 2
PR
OPOSED
AC
CESS 3
PR
OP
OSE
D SIT
E
PR
OP
OSE
D SIT
E A
CC
ESS 4
NOTE:KENSINGTON ROAD SPEED ZONE: 50KM/H
EXISTING BUS STOP
CONFIRMED WITH PTV
BE RELOCATED. TO BE
EXISTING BUS STOP TO
EXISTING BUS STOP
LEGEND
RAISED PEDESTRIAN THRESHOLD
ON ST
REET P
ARKING
ON ST
REET P
ARKING
ON ST
REET P
ARKING
ON ST
REET P
ARKING
ON ST
REET P
ARKING
ON ST
REET P
ARKING
100m
80m
105m
145.0m
SHARED AREA
5.0
6.3
5.4
2.75
2.75 2.8
2.8
0.6
21 AUGUST '15
P.PHAM
LOCATION
BOOM-GATE
PROPOSED
5.5
3.05.03.53.53.0
PART OF FUTURE PLANNING PERMIT
SUBJECT TO FURTHER DESIGN AS
ACCESS TO BE MAINTAINED AND
PART OF FUTURE PLANNING PERMIT
SUBJECT TO FURTHER DESIGN AS
ACCESS TO BE MAINTAINED AND
PART OF FUTURE PLANNING PERMIT
SUBJECT TO FURTHER DESIGN AS
ACCESS TO BE MAINTAINED AND
EXISTING ACCESS
SIGNALISATION OF
PROPOSED
3.0
3.5
ONLY. SUBJECT TO DETAILS DESIGN
RIGHT TURN FOR LOADING VEHICLES
SIGHT LINE
SPLAY FOR VEHICLE
2.3
2.3
2.3
14M2307000 // 21/08/15
Transport Impact Assessment // Issue: Final
West Melbourne Waterfront, Development Plan
Appendix D
SIDRA Movement Summaries
Ap
pe
nd
ix D
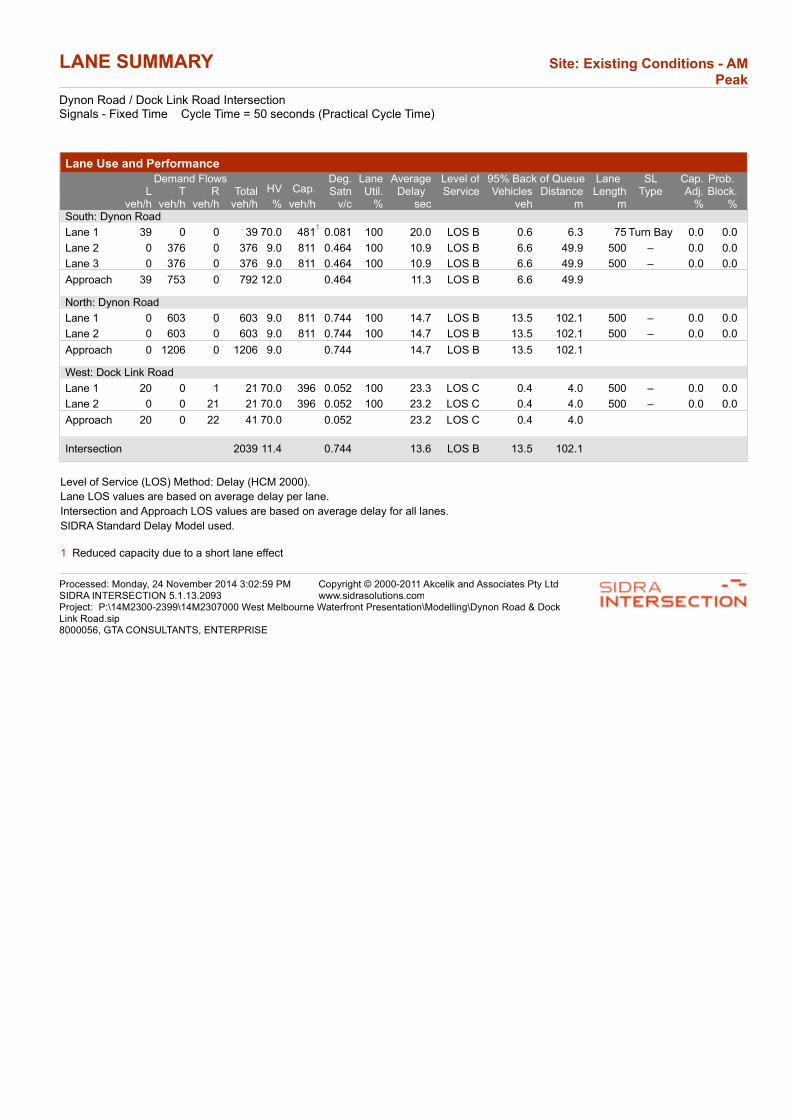
LANE SUMMARY Site: Existing Conditions - AM Peak
Dynon Road / Dock Link Road IntersectionSignals - Fixed Time Cycle Time = 50 seconds (Practical Cycle Time)
Lane Use and Performance
Demand Flows 95% Back of QueueHV Cap.
Deg.Satn
LaneUtil.
AverageDelay
Level ofService
Lane Length
SL Type
Cap.Adj.
Prob. Block.L T R Total Vehicles Distance
veh/h veh/h veh/h veh/h % veh/h v/c % sec veh m m % %South: Dynon Road
Lane 1 39 0 0 39 70.0 4811
0.081 100 20.0 LOS B 0.6 6.3 75 Turn Bay 0.0 0.0
Lane 2 0 376 0 376 9.0 811 0.464 100 10.9 LOS B 6.6 49.9 500 – 0.0 0.0
Lane 3 0 376 0 376 9.0 811 0.464 100 10.9 LOS B 6.6 49.9 500 – 0.0 0.0
Approach 39 753 0 792 12.0 0.464 11.3 LOS B 6.6 49.9
North: Dynon Road
Lane 1 0 603 0 603 9.0 811 0.744 100 14.7 LOS B 13.5 102.1 500 – 0.0 0.0
Lane 2 0 603 0 603 9.0 811 0.744 100 14.7 LOS B 13.5 102.1 500 – 0.0 0.0
Approach 0 1206 0 1206 9.0 0.744 14.7 LOS B 13.5 102.1
West: Dock Link Road
Lane 1 20 0 1 21 70.0 396 0.052 100 23.3 LOS C 0.4 4.0 500 – 0.0 0.0
Lane 2 0 0 21 21 70.0 396 0.052 100 23.2 LOS C 0.4 4.0 500 – 0.0 0.0
Approach 20 0 22 41 70.0 0.052 23.2 LOS C 0.4 4.0
Intersection 2039 11.4 0.744 13.6 LOS B 13.5 102.1
Level of Service (LOS) Method: Delay (HCM 2000).
Lane LOS values are based on average delay per lane.
Intersection and Approach LOS values are based on average delay for all lanes.
SIDRA Standard Delay Model used.
1 Reduced capacity due to a short lane effect
Processed: Monday, 24 November 2014 3:02:59 PMSIDRA INTERSECTION 5.1.13.2093
Copyright © 2000-2011 Akcelik and Associates Pty Ltdwww.sidrasolutions.com
Project: P:\14M2300-2399\14M2307000 West Melbourne Waterfront Presentation\Modelling\Dynon Road & Dock Link Road.sip8000056, GTA CONSULTANTS, ENTERPRISE
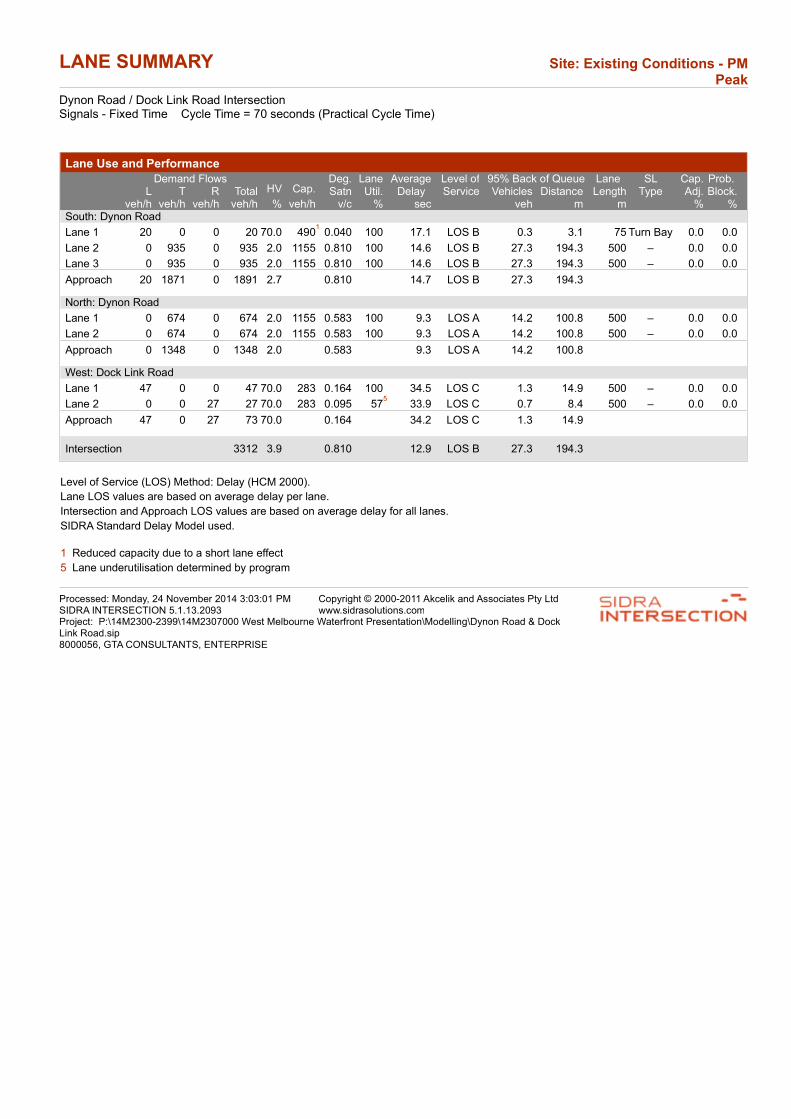
LANE SUMMARY Site: Existing Conditions - PM Peak
Dynon Road / Dock Link Road IntersectionSignals - Fixed Time Cycle Time = 70 seconds (Practical Cycle Time)
Lane Use and Performance
Demand Flows 95% Back of QueueHV Cap.
Deg.Satn
LaneUtil.
AverageDelay
Level ofService
Lane Length
SL Type
Cap.Adj.
Prob. Block.L T R Total Vehicles Distance
veh/h veh/h veh/h veh/h % veh/h v/c % sec veh m m % %South: Dynon Road
Lane 1 20 0 0 20 70.0 4901
0.040 100 17.1 LOS B 0.3 3.1 75 Turn Bay 0.0 0.0
Lane 2 0 935 0 935 2.0 1155 0.810 100 14.6 LOS B 27.3 194.3 500 – 0.0 0.0
Lane 3 0 935 0 935 2.0 1155 0.810 100 14.6 LOS B 27.3 194.3 500 – 0.0 0.0
Approach 20 1871 0 1891 2.7 0.810 14.7 LOS B 27.3 194.3
North: Dynon Road
Lane 1 0 674 0 674 2.0 1155 0.583 100 9.3 LOS A 14.2 100.8 500 – 0.0 0.0
Lane 2 0 674 0 674 2.0 1155 0.583 100 9.3 LOS A 14.2 100.8 500 – 0.0 0.0
Approach 0 1348 0 1348 2.0 0.583 9.3 LOS A 14.2 100.8
West: Dock Link Road
Lane 1 47 0 0 47 70.0 283 0.164 100 34.5 LOS C 1.3 14.9 500 – 0.0 0.0
Lane 2 0 0 27 27 70.0 283 0.095 575
33.9 LOS C 0.7 8.4 500 – 0.0 0.0
Approach 47 0 27 73 70.0 0.164 34.2 LOS C 1.3 14.9
Intersection 3312 3.9 0.810 12.9 LOS B 27.3 194.3
Level of Service (LOS) Method: Delay (HCM 2000).
Lane LOS values are based on average delay per lane.
Intersection and Approach LOS values are based on average delay for all lanes.
SIDRA Standard Delay Model used.
1 Reduced capacity due to a short lane effect
5 Lane underutilisation determined by program
Processed: Monday, 24 November 2014 3:03:01 PMSIDRA INTERSECTION 5.1.13.2093
Copyright © 2000-2011 Akcelik and Associates Pty Ltdwww.sidrasolutions.com
Project: P:\14M2300-2399\14M2307000 West Melbourne Waterfront Presentation\Modelling\Dynon Road & Dock Link Road.sip8000056, GTA CONSULTANTS, ENTERPRISE
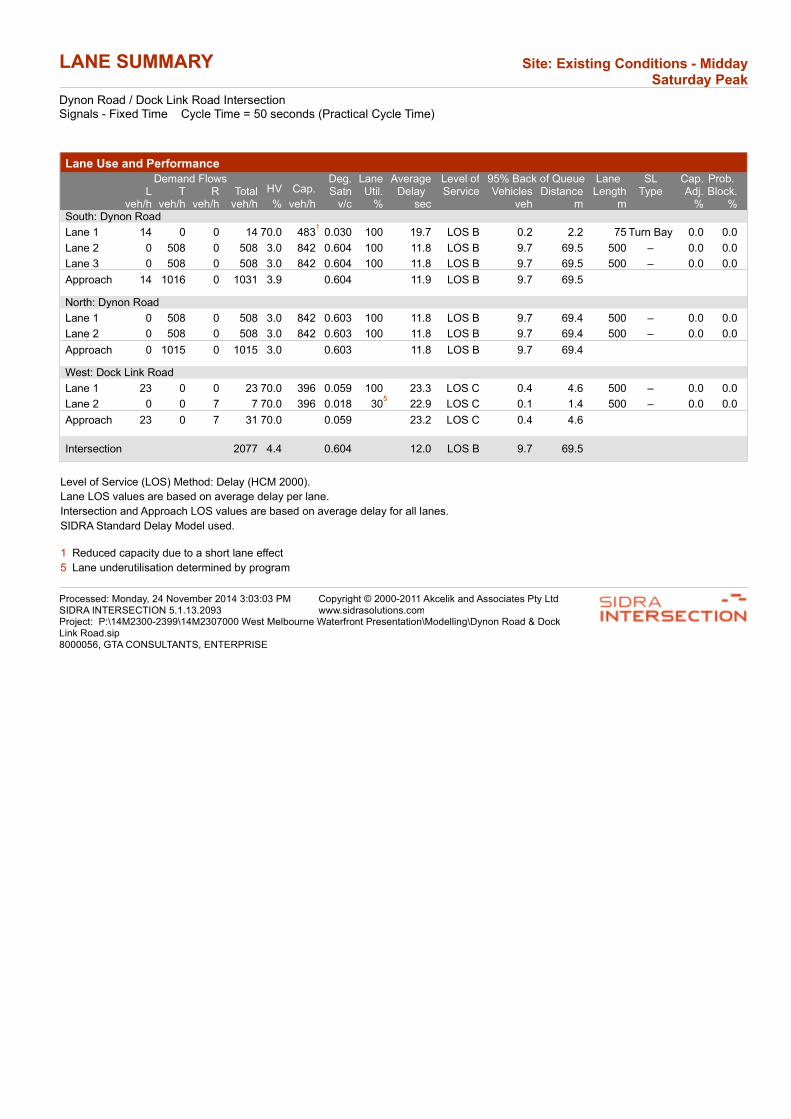
LANE SUMMARY Site: Existing Conditions - Midday Saturday Peak
Dynon Road / Dock Link Road IntersectionSignals - Fixed Time Cycle Time = 50 seconds (Practical Cycle Time)
Lane Use and Performance
Demand Flows 95% Back of QueueHV Cap.
Deg.Satn
LaneUtil.
AverageDelay
Level ofService
Lane Length
SL Type
Cap.Adj.
Prob. Block.L T R Total Vehicles Distance
veh/h veh/h veh/h veh/h % veh/h v/c % sec veh m m % %South: Dynon Road
Lane 1 14 0 0 14 70.0 4831
0.030 100 19.7 LOS B 0.2 2.2 75 Turn Bay 0.0 0.0
Lane 2 0 508 0 508 3.0 842 0.604 100 11.8 LOS B 9.7 69.5 500 – 0.0 0.0
Lane 3 0 508 0 508 3.0 842 0.604 100 11.8 LOS B 9.7 69.5 500 – 0.0 0.0
Approach 14 1016 0 1031 3.9 0.604 11.9 LOS B 9.7 69.5
North: Dynon Road
Lane 1 0 508 0 508 3.0 842 0.603 100 11.8 LOS B 9.7 69.4 500 – 0.0 0.0
Lane 2 0 508 0 508 3.0 842 0.603 100 11.8 LOS B 9.7 69.4 500 – 0.0 0.0
Approach 0 1015 0 1015 3.0 0.603 11.8 LOS B 9.7 69.4
West: Dock Link Road
Lane 1 23 0 0 23 70.0 396 0.059 100 23.3 LOS C 0.4 4.6 500 – 0.0 0.0
Lane 2 0 0 7 7 70.0 396 0.018 305
22.9 LOS C 0.1 1.4 500 – 0.0 0.0
Approach 23 0 7 31 70.0 0.059 23.2 LOS C 0.4 4.6
Intersection 2077 4.4 0.604 12.0 LOS B 9.7 69.5
Level of Service (LOS) Method: Delay (HCM 2000).
Lane LOS values are based on average delay per lane.
Intersection and Approach LOS values are based on average delay for all lanes.
SIDRA Standard Delay Model used.
1 Reduced capacity due to a short lane effect
5 Lane underutilisation determined by program
Processed: Monday, 24 November 2014 3:03:03 PMSIDRA INTERSECTION 5.1.13.2093
Copyright © 2000-2011 Akcelik and Associates Pty Ltdwww.sidrasolutions.com
Project: P:\14M2300-2399\14M2307000 West Melbourne Waterfront Presentation\Modelling\Dynon Road & Dock Link Road.sip8000056, GTA CONSULTANTS, ENTERPRISE

LANE SUMMARY Site: Existing Conditions AM Peak
Dynon Road/Kensington Road IntersectionSignals - Fixed Time Cycle Time = 120 seconds (User-Given Cycle Time)
Lane Use and Performance
Demand Flows 95% Back of QueueHV Cap.
Deg.Satn
LaneUtil.
AverageDelay
Level ofService
Lane Length
SL Type
Cap.Adj.
Prob. Block.L T R Total Vehicles Distance
veh/h veh/h veh/h veh/h % veh/h v/c % sec veh m m % %East: Dynon Road
Lane 1 0 376 0 376 9.0 1029 0.365 100 15.6 LOS B 12.0 90.4 500 – 0.0 0.0
Lane 2 0 376 0 376 9.0 1029 0.365 100 15.6 LOS B 12.0 90.4 500 – 0.0 0.0
Lane 3 0 0 61 61 9.9 150 0.409 100 40.0 LOS D 2.0 14.9 37 Turn Bay 0.0 0.0
Approach 0 751 61 812 9.1 0.409 17.4 LOS B 12.0 90.4
North East: Kensington Road
Lane 1 135 0 0 135 5.0 1351
1.0003
865
41.88
LOS D8
4.78
34.38
21 Parking 0.0 50.0
Lane 2 2640
0 447 711 5.0 613 1.161 100 221.3 LOS F 93.1 680.0 500 – 0.0 33.0
Approach 399 0 447 846 5.0 1.161 192.7 LOS F 93.1 680.0
West: Dynon Road
Lane 1 254 0 0 254 10.0 7881
0.323 275
25.6 LOS C 7.1 54.0 160 Turn Bay 0.0 0.0
Lane 2 0 992 0 992 9.0 844 1.175 100 208.8 LOS F 131.4 990.6 500 – 0.0 68.4
Lane 3 0 992 0 992 9.0 844 1.175 100 208.8 LOS F 131.4 990.6 500 – 0.0 68.4
Lane 4 0 0 5 5 9.0 2481
0.021 100 26.7 LOS C 0.1 0.9 40 Turn Bay 0.0 0.0
Approach 254 1984 5 2243 9.1 1.175 187.6 LOS F 131.4 990.6
Intersection 3901 8.2 1.175 153.2 LOS F 131.4 990.6
Level of Service (LOS) Method: Delay (HCM 2000).
Lane LOS values are based on average delay per lane.
Intersection and Approach LOS values are based on average delay for all lanes.
SIDRA Standard Delay Model used.
0 Excess flow from back of an adjacent short lane
1 Reduced capacity due to a short lane effect
3 x = 1.00 due to short lane.
5 Lane underutilisation determined by program
8 Delay, queue length and stops for the short lane have been cut down to fit in the queuing space. You may wish to change the short lane to a full lane to investigate the effect on the adjacent lane performance.
Processed: Monday, 24 November 2014 4:09:00 PMSIDRA INTERSECTION 5.1.13.2093
Copyright © 2000-2011 Akcelik and Associates Pty Ltdwww.sidrasolutions.com
Project: P:\14M2300-2399\14M2307000 West Melbourne Waterfront Presentation\Modelling\Dynon Road & Kensington Road.sip8000056, GTA CONSULTANTS, ENTERPRISE
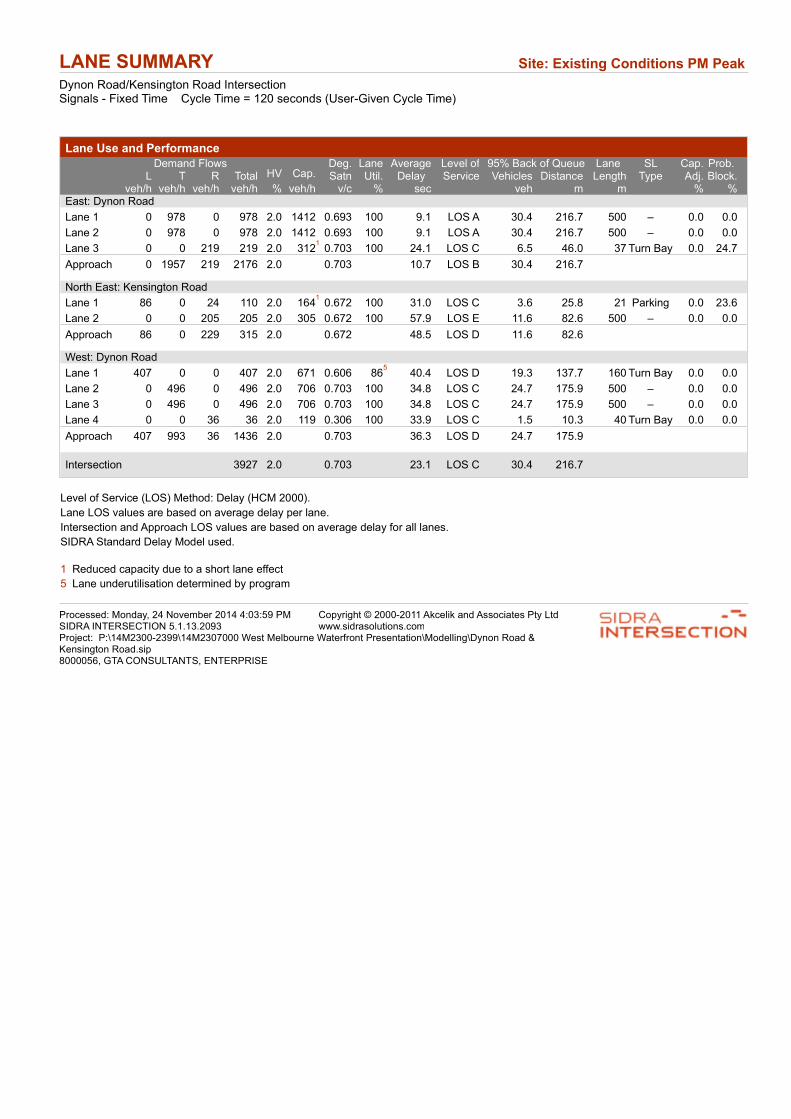
LANE SUMMARY Site: Existing Conditions PM Peak
Dynon Road/Kensington Road IntersectionSignals - Fixed Time Cycle Time = 120 seconds (User-Given Cycle Time)
Lane Use and Performance
Demand Flows 95% Back of QueueHV Cap.
Deg.Satn
LaneUtil.
AverageDelay
Level ofService
Lane Length
SL Type
Cap.Adj.
Prob. Block.L T R Total Vehicles Distance
veh/h veh/h veh/h veh/h % veh/h v/c % sec veh m m % %East: Dynon Road
Lane 1 0 978 0 978 2.0 1412 0.693 100 9.1 LOS A 30.4 216.7 500 – 0.0 0.0
Lane 2 0 978 0 978 2.0 1412 0.693 100 9.1 LOS A 30.4 216.7 500 – 0.0 0.0
Lane 3 0 0 219 219 2.0 3121
0.703 100 24.1 LOS C 6.5 46.0 37 Turn Bay 0.0 24.7
Approach 0 1957 219 2176 2.0 0.703 10.7 LOS B 30.4 216.7
North East: Kensington Road
Lane 1 86 0 24 110 2.0 1641
0.672 100 31.0 LOS C 3.6 25.8 21 Parking 0.0 23.6
Lane 2 0 0 205 205 2.0 305 0.672 100 57.9 LOS E 11.6 82.6 500 – 0.0 0.0
Approach 86 0 229 315 2.0 0.672 48.5 LOS D 11.6 82.6
West: Dynon Road
Lane 1 407 0 0 407 2.0 671 0.606 865
40.4 LOS D 19.3 137.7 160 Turn Bay 0.0 0.0
Lane 2 0 496 0 496 2.0 706 0.703 100 34.8 LOS C 24.7 175.9 500 – 0.0 0.0
Lane 3 0 496 0 496 2.0 706 0.703 100 34.8 LOS C 24.7 175.9 500 – 0.0 0.0
Lane 4 0 0 36 36 2.0 119 0.306 100 33.9 LOS C 1.5 10.3 40 Turn Bay 0.0 0.0
Approach 407 993 36 1436 2.0 0.703 36.3 LOS D 24.7 175.9
Intersection 3927 2.0 0.703 23.1 LOS C 30.4 216.7
Level of Service (LOS) Method: Delay (HCM 2000).
Lane LOS values are based on average delay per lane.
Intersection and Approach LOS values are based on average delay for all lanes.
SIDRA Standard Delay Model used.
1 Reduced capacity due to a short lane effect
5 Lane underutilisation determined by program
Processed: Monday, 24 November 2014 4:03:59 PMSIDRA INTERSECTION 5.1.13.2093
Copyright © 2000-2011 Akcelik and Associates Pty Ltdwww.sidrasolutions.com
Project: P:\14M2300-2399\14M2307000 West Melbourne Waterfront Presentation\Modelling\Dynon Road & Kensington Road.sip8000056, GTA CONSULTANTS, ENTERPRISE
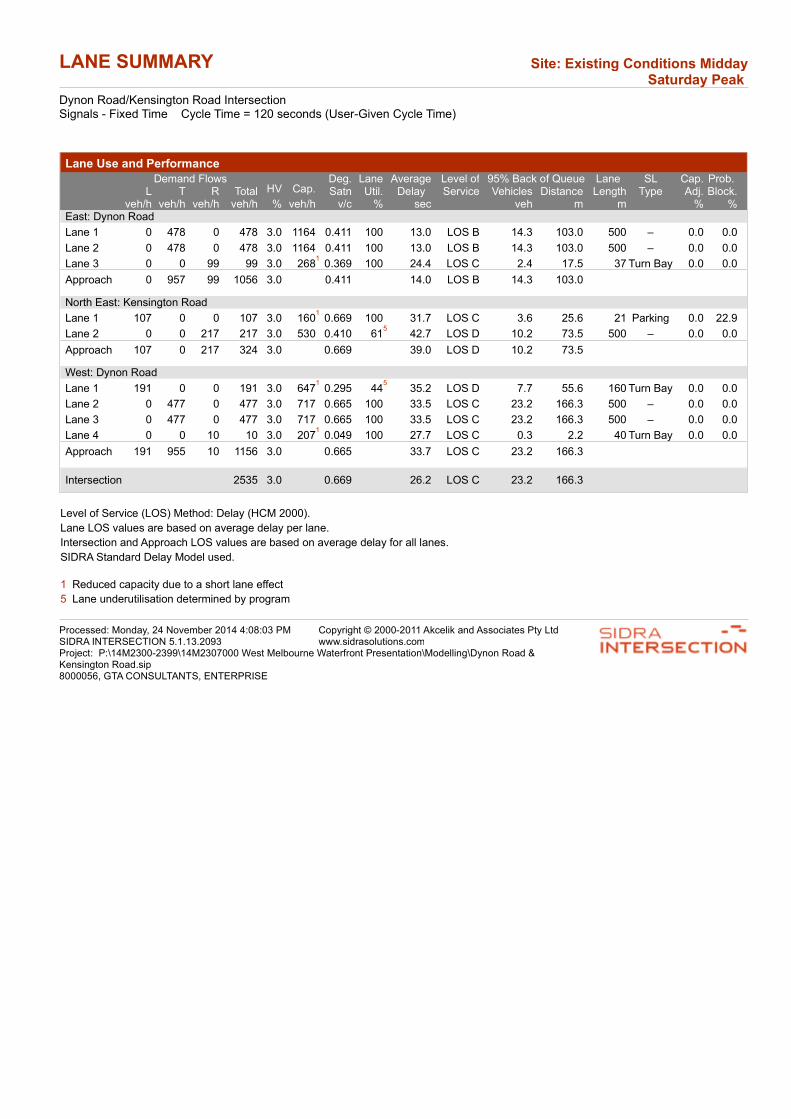
LANE SUMMARY Site: Existing Conditions Midday Saturday Peak
Dynon Road/Kensington Road IntersectionSignals - Fixed Time Cycle Time = 120 seconds (User-Given Cycle Time)
Lane Use and Performance
Demand Flows 95% Back of QueueHV Cap.
Deg.Satn
LaneUtil.
AverageDelay
Level ofService
Lane Length
SL Type
Cap.Adj.
Prob. Block.L T R Total Vehicles Distance
veh/h veh/h veh/h veh/h % veh/h v/c % sec veh m m % %East: Dynon Road
Lane 1 0 478 0 478 3.0 1164 0.411 100 13.0 LOS B 14.3 103.0 500 – 0.0 0.0
Lane 2 0 478 0 478 3.0 1164 0.411 100 13.0 LOS B 14.3 103.0 500 – 0.0 0.0
Lane 3 0 0 99 99 3.0 2681
0.369 100 24.4 LOS C 2.4 17.5 37 Turn Bay 0.0 0.0
Approach 0 957 99 1056 3.0 0.411 14.0 LOS B 14.3 103.0
North East: Kensington Road
Lane 1 107 0 0 107 3.0 1601
0.669 100 31.7 LOS C 3.6 25.6 21 Parking 0.0 22.9
Lane 2 0 0 217 217 3.0 530 0.410 615
42.7 LOS D 10.2 73.5 500 – 0.0 0.0
Approach 107 0 217 324 3.0 0.669 39.0 LOS D 10.2 73.5
West: Dynon Road
Lane 1 191 0 0 191 3.0 6471
0.295 445
35.2 LOS D 7.7 55.6 160 Turn Bay 0.0 0.0
Lane 2 0 477 0 477 3.0 717 0.665 100 33.5 LOS C 23.2 166.3 500 – 0.0 0.0
Lane 3 0 477 0 477 3.0 717 0.665 100 33.5 LOS C 23.2 166.3 500 – 0.0 0.0
Lane 4 0 0 10 10 3.0 2071
0.049 100 27.7 LOS C 0.3 2.2 40 Turn Bay 0.0 0.0
Approach 191 955 10 1156 3.0 0.665 33.7 LOS C 23.2 166.3
Intersection 2535 3.0 0.669 26.2 LOS C 23.2 166.3
Level of Service (LOS) Method: Delay (HCM 2000).
Lane LOS values are based on average delay per lane.
Intersection and Approach LOS values are based on average delay for all lanes.
SIDRA Standard Delay Model used.
1 Reduced capacity due to a short lane effect
5 Lane underutilisation determined by program
Processed: Monday, 24 November 2014 4:08:03 PMSIDRA INTERSECTION 5.1.13.2093
Copyright © 2000-2011 Akcelik and Associates Pty Ltdwww.sidrasolutions.com
Project: P:\14M2300-2399\14M2307000 West Melbourne Waterfront Presentation\Modelling\Dynon Road & Kensington Road.sip8000056, GTA CONSULTANTS, ENTERPRISE

LANE SUMMARY Site: Existing Conditions - AM Peak
Kensington Road / Epsom Road / Macaulay RoadSignals - Fixed Time Cycle Time = 100 seconds (User-Given Cycle Time)
Lane Use and Performance
Demand Flows 95% Back of QueueHV Cap.
Deg.Satn
LaneUtil.
AverageDelay
Level ofService
Lane Length
SL Type
Cap.Adj.
Prob. Block.L T R Total Vehicles Distance
veh/h veh/h veh/h veh/h % veh/h v/c % sec veh m m % %South East: Macaulay Road
Lane 1 60 0 0 60 10.0 1011
0.600 100 43.8 LOS D 2.6 19.6 20 Parking 0.0 3.4
Lane 2 950
0 213 308 10.0 329 0.936 100 69.7 LOS E 19.2 146.2 500 – 0.0 0.0
Approach 155 0 213 369 10.0 0.936 65.5 LOS E 19.2 146.2
North: Epsom Road
Lane 1 254 0 1770
431 5.0 976 0.442 100 18.6 LOS B 12.4 90.5 500 – 0.0 0.0
Lane 2 0 0 111 111 5.0 1851
0.600 100 24.0 LOS C 2.8 20.1 21 Turn Bay 0.0 1.2
Approach 254 0 288 542 5.0 0.600 19.8 LOS B 12.4 90.5
West: Kensington Road
Lane 1 59 0 0 59 5.0 981
0.600 100 49.1 LOS D 2.7 19.5 20 Parking 0.0 2.8
Lane 2 810
0 81 162 5.0 251 0.644 100 51.2 LOS D 7.8 57.1 500 – 0.0 0.0
Approach 140 0 81 220 5.0 0.644 50.7 LOS D 7.8 57.1
Intersection 1131 6.6 0.936 40.7 LOS D 19.2 146.2
Level of Service (LOS) Method: Delay (HCM 2000).
Lane LOS values are based on average delay per lane.
Intersection and Approach LOS values are based on average delay for all lanes.
SIDRA Standard Delay Model used.
0 Excess flow from back of an adjacent short lane
1 Reduced capacity due to a short lane effect
Processed: Monday, 24 November 2014 5:18:11 PMSIDRA INTERSECTION 5.1.13.2093
Copyright © 2000-2011 Akcelik and Associates Pty Ltdwww.sidrasolutions.com
Project: P:\14M2300-2399\14M2307000 West Melbourne Waterfront Presentation\Modelling\Kensington Road & Epsom Road & Macaulay Road.sip8000056, GTA CONSULTANTS, ENTERPRISE
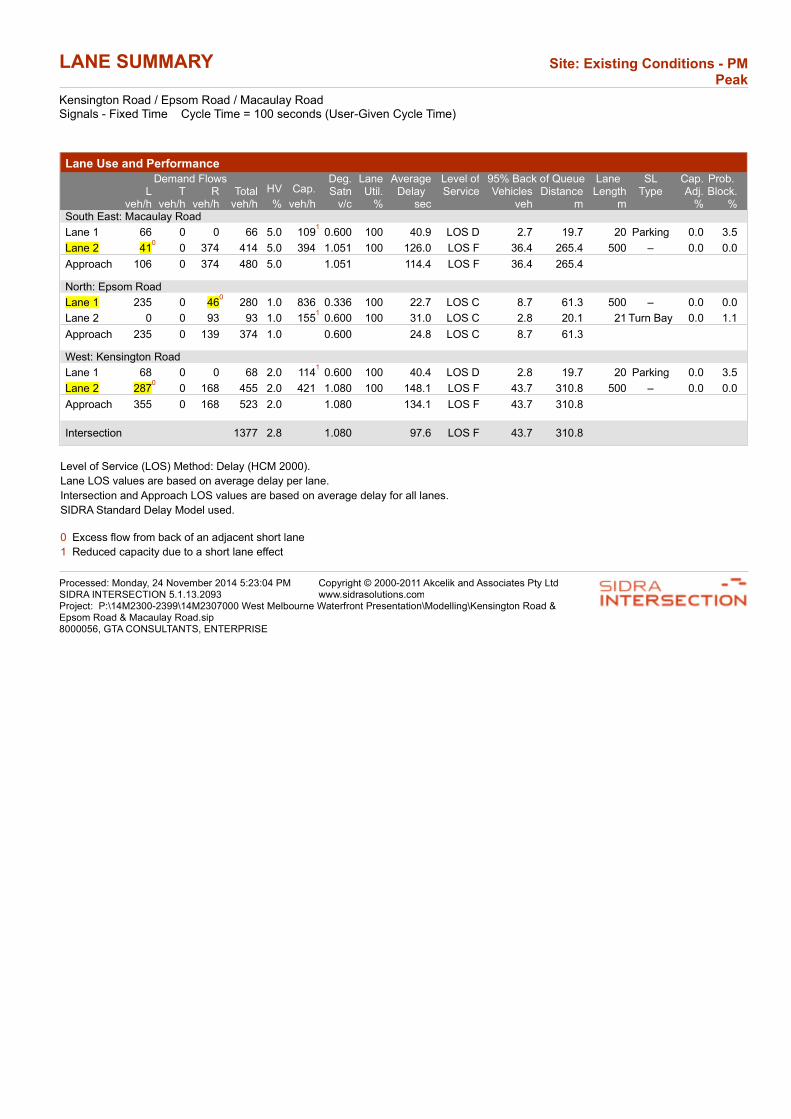
LANE SUMMARY Site: Existing Conditions - PM Peak
Kensington Road / Epsom Road / Macaulay RoadSignals - Fixed Time Cycle Time = 100 seconds (User-Given Cycle Time)
Lane Use and Performance
Demand Flows 95% Back of QueueHV Cap.
Deg.Satn
LaneUtil.
AverageDelay
Level ofService
Lane Length
SL Type
Cap.Adj.
Prob. Block.L T R Total Vehicles Distance
veh/h veh/h veh/h veh/h % veh/h v/c % sec veh m m % %South East: Macaulay Road
Lane 1 66 0 0 66 5.0 1091
0.600 100 40.9 LOS D 2.7 19.7 20 Parking 0.0 3.5
Lane 2 410
0 374 414 5.0 394 1.051 100 126.0 LOS F 36.4 265.4 500 – 0.0 0.0
Approach 106 0 374 480 5.0 1.051 114.4 LOS F 36.4 265.4
North: Epsom Road
Lane 1 235 0 460
280 1.0 836 0.336 100 22.7 LOS C 8.7 61.3 500 – 0.0 0.0
Lane 2 0 0 93 93 1.0 1551
0.600 100 31.0 LOS C 2.8 20.1 21 Turn Bay 0.0 1.1
Approach 235 0 139 374 1.0 0.600 24.8 LOS C 8.7 61.3
West: Kensington Road
Lane 1 68 0 0 68 2.0 1141
0.600 100 40.4 LOS D 2.8 19.7 20 Parking 0.0 3.5
Lane 2 2870
0 168 455 2.0 421 1.080 100 148.1 LOS F 43.7 310.8 500 – 0.0 0.0
Approach 355 0 168 523 2.0 1.080 134.1 LOS F 43.7 310.8
Intersection 1377 2.8 1.080 97.6 LOS F 43.7 310.8
Level of Service (LOS) Method: Delay (HCM 2000).
Lane LOS values are based on average delay per lane.
Intersection and Approach LOS values are based on average delay for all lanes.
SIDRA Standard Delay Model used.
0 Excess flow from back of an adjacent short lane
1 Reduced capacity due to a short lane effect
Processed: Monday, 24 November 2014 5:23:04 PMSIDRA INTERSECTION 5.1.13.2093
Copyright © 2000-2011 Akcelik and Associates Pty Ltdwww.sidrasolutions.com
Project: P:\14M2300-2399\14M2307000 West Melbourne Waterfront Presentation\Modelling\Kensington Road & Epsom Road & Macaulay Road.sip8000056, GTA CONSULTANTS, ENTERPRISE

LANE SUMMARY Site: Existing Conditions - Midday SAT Peak
Kensington Road / Epsom Road / Macaulay RoadSignals - Fixed Time Cycle Time = 100 seconds (User-Given Cycle Time)
Lane Use and Performance
Demand Flows 95% Back of QueueHV Cap.
Deg.Satn
LaneUtil.
AverageDelay
Level ofService
Lane Length
SL Type
Cap.Adj.
Prob. Block.L T R Total Vehicles Distance
veh/h veh/h veh/h veh/h % veh/h v/c % sec veh m m % %South East: Macaulay Road
Lane 1 74 0 0 74 2.0 1231
0.600 100 34.9 LOS C 2.8 19.8 20 Parking 0.0 4.0
Lane 2 900
0 334 424 2.0 531 0.798 100 44.1 LOS D 20.6 146.8 500 – 0.0 0.0
Approach 164 0 334 498 2.0 0.798 42.7 LOS D 20.6 146.8
North: Epsom Road
Lane 1 383 0 0 383 1.0 960 0.399 100 19.2 LOS B 11.0 77.9 500 – 0.0 0.0
Lane 2 0 0 141 141 1.0 1761
0.800 100 34.6 LOS C 4.3 30.1 21 Turn Bay 0.0 38.0
Approach 383 0 141 524 1.0 0.800 23.4 LOS C 11.0 77.9
West: Kensington Road
Lane 1 61 0 0 61 3.0 1021
0.600 100 47.0 LOS D 2.7 19.5 20 Parking 0.0 2.9
Lane 2 1250
0 179 304 3.0 291 1.044 100 122.6 LOS F 25.6 184.1 500 – 0.0 0.0
Approach 186 0 179 365 3.0 1.044 109.8 LOS F 25.6 184.1
Intersection 1387 1.9 1.044 53.1 LOS D 25.6 184.1
Level of Service (LOS) Method: Delay (HCM 2000).
Lane LOS values are based on average delay per lane.
Intersection and Approach LOS values are based on average delay for all lanes.
SIDRA Standard Delay Model used.
0 Excess flow from back of an adjacent short lane
1 Reduced capacity due to a short lane effect
Processed: Monday, 24 November 2014 5:31:50 PMSIDRA INTERSECTION 5.1.13.2093
Copyright © 2000-2011 Akcelik and Associates Pty Ltdwww.sidrasolutions.com
Project: P:\14M2300-2399\14M2307000 West Melbourne Waterfront Presentation\Modelling\Kensington Road & Epsom Road & Macaulay Road.sip8000056, GTA CONSULTANTS, ENTERPRISE

LANE SUMMARY Site: Existing Conditions AM Peak
Childers Street/Kensington Road/Hobsons Road IntersectionSignals - Fixed Time Cycle Time = 70 seconds (Optimum Cycle Time - Minimum Delay)
Lane Use and Performance
Demand Flows 95% Back of QueueHV Cap.
Deg.Satn
LaneUtil.
AverageDelay
Level ofService
Lane Length
SL Type
Cap.Adj.
Prob. Block.L T R Total Vehicles Distance
veh/h veh/h veh/h veh/h % veh/h v/c % sec veh m m % %South: Childers Road
Lane 1 14 6 10 30 2.0 483 0.063 100 22.0 LOS C 0.7 5.0 500 – 0.0 0.0
Approach 14 6 10 30 2.0 0.063 22.0 LOS C 0.7 5.0
East: Kensington Road
Lane 1 130 0 0 130 2.0 2871
0.454 100 17.2 LOS B 2.5 17.5 26 Parking 0.0 0.0
Lane 2 0 632 9 642 5.0 912 0.703 100 15.4 LOS B 17.3 126.0 500 – 0.0 0.0
Approach 130 632 9 772 4.5 0.703 15.7 LOS B 17.3 126.0
North: Hobsons Road
Lane 1 10 0 0 10 5.0 1221
0.086 100 22.8 LOS C 0.2 1.7 13 Parking 0.0 0.0
Lane 2 0 92 213 304 5.0 441 0.690 100 28.1 LOS C 9.6 70.4 500 – 0.0 0.0
Approach 10 92 213 315 5.0 0.690 27.9 LOS C 9.6 70.4
West: Kensington Road
Lane 1 19 25 0 44 7.9 3541
0.124 206
12.9 LOS B 0.8 5.8 35 Turn Bay 0.0 0.0
Lane 2 0 122 92 213 6.6 344 0.620 100 28.5 LOS C 6.8 50.1 500 – 0.0 0.0
Approach 19 147 92 257 6.8 0.620 25.9 LOS C 6.8 50.1
Intersection 1374 5.0 0.703 20.5 LOS C 17.3 126.0
Level of Service (LOS) Method: Delay (HCM 2000).
Lane LOS values are based on average delay per lane.
Intersection and Approach LOS values are based on average delay for all lanes.
SIDRA Standard Delay Model used.
1 Reduced capacity due to a short lane effect
6 Lane underutilisation due to downstream effects
Processed: Tuesday, 25 November 2014 10:19:15 AMSIDRA INTERSECTION 5.1.13.2093
Copyright © 2000-2011 Akcelik and Associates Pty Ltdwww.sidrasolutions.com
Project: P:\14M2300-2399\14M2307000 West Melbourne Waterfront Presentation\Modelling\Childers Street & Kensington Road & Hobsons Road.sip8000056, GTA CONSULTANTS, ENTERPRISE

LANE SUMMARY Site: Existing Conditions PM Peak
Childers Street/Kensington Road/Hobsons Road IntersectionSignals - Fixed Time Cycle Time = 70 seconds (Optimum Cycle Time - Minimum Delay)
Lane Use and Performance
Demand Flows 95% Back of QueueHV Cap.
Deg.Satn
LaneUtil.
AverageDelay
Level ofService
Lane Length
SL Type
Cap.Adj.
Prob. Block.L T R Total Vehicles Distance
veh/h veh/h veh/h veh/h % veh/h v/c % sec veh m m % %South: Childers Road
Lane 1 53 94 72 219 2.0 413 0.531 100 28.0 LOS C 6.6 47.1 500 – 0.0 0.0
Approach 53 94 72 219 2.0 0.531 28.0 LOS C 6.6 47.1
East: Kensington Road
Lane 1 18 0 0 18 2.0 3291
0.056 100 13.8 LOS B 0.3 2.0 26 Parking 0.0 0.0
Lane 2 0 191 9 200 2.0 990 0.202 100 9.1 LOS A 3.5 24.9 500 – 0.0 0.0
Approach 18 191 9 218 2.0 0.202 9.5 LOS A 3.5 24.9
North: Hobsons Road
Lane 1 10 0 0 10 5.0 1101
0.093 100 26.7 LOS C 0.3 1.9 13 Parking 0.0 0.0
Lane 2 0 7 30 37 5.0 260 0.141 100 30.5 LOS C 1.1 7.8 500 – 0.0 0.0
Approach 10 7 30 47 5.0 0.141 29.7 LOS C 1.1 7.8
West: Kensington Road
Lane 1 103 0 0 103 2.0 4141
0.249 485
14.2 LOS B 1.6 11.7 35 Turn Bay 0.0 0.0
Lane 2 0 537 12 549 2.0 1056 0.520 100 10.6 LOS B 11.7 83.4 500 – 0.0 0.0
Approach 103 537 12 652 2.0 0.520 11.1 LOS B 11.7 83.4
Intersection 1137 2.1 0.531 14.8 LOS B 11.7 83.4
Level of Service (LOS) Method: Delay (HCM 2000).
Lane LOS values are based on average delay per lane.
Intersection and Approach LOS values are based on average delay for all lanes.
SIDRA Standard Delay Model used.
1 Reduced capacity due to a short lane effect
5 Lane underutilisation determined by program
Processed: Tuesday, 25 November 2014 10:19:17 AMSIDRA INTERSECTION 5.1.13.2093
Copyright © 2000-2011 Akcelik and Associates Pty Ltdwww.sidrasolutions.com
Project: P:\14M2300-2399\14M2307000 West Melbourne Waterfront Presentation\Modelling\Childers Street & Kensington Road & Hobsons Road.sip8000056, GTA CONSULTANTS, ENTERPRISE
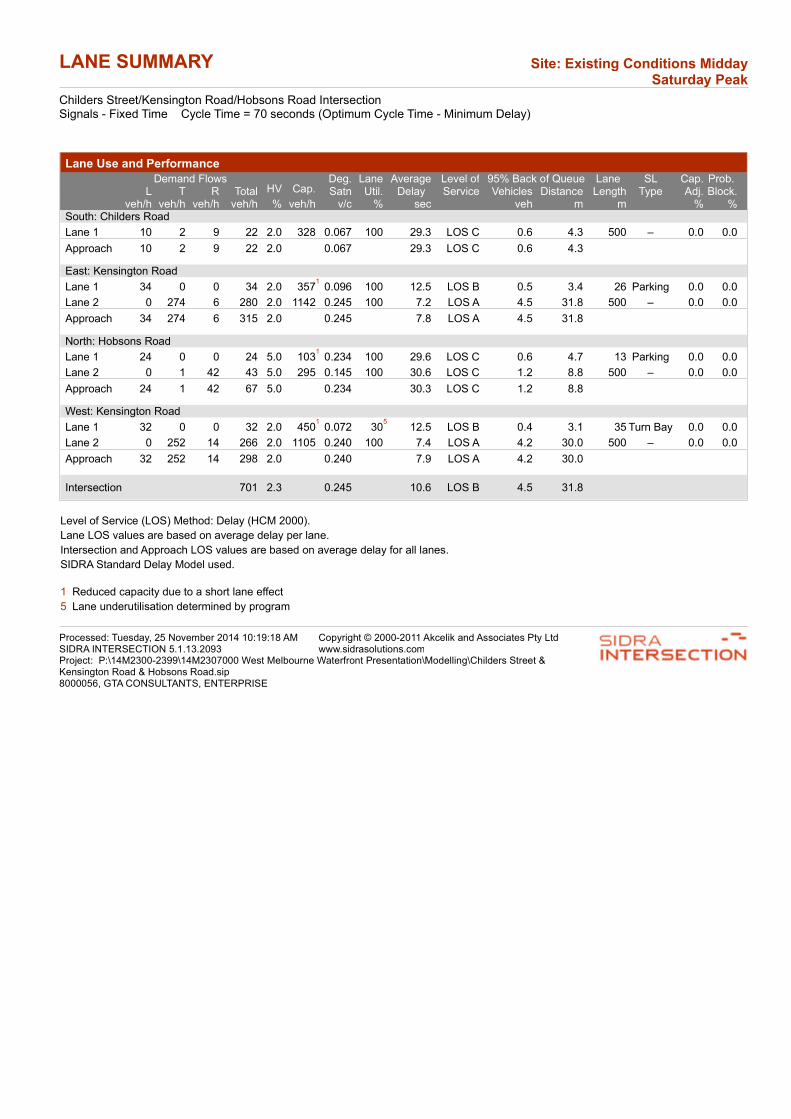
LANE SUMMARY Site: Existing Conditions Midday Saturday Peak
Childers Street/Kensington Road/Hobsons Road IntersectionSignals - Fixed Time Cycle Time = 70 seconds (Optimum Cycle Time - Minimum Delay)
Lane Use and Performance
Demand Flows 95% Back of QueueHV Cap.
Deg.Satn
LaneUtil.
AverageDelay
Level ofService
Lane Length
SL Type
Cap.Adj.
Prob. Block.L T R Total Vehicles Distance
veh/h veh/h veh/h veh/h % veh/h v/c % sec veh m m % %South: Childers Road
Lane 1 10 2 9 22 2.0 328 0.067 100 29.3 LOS C 0.6 4.3 500 – 0.0 0.0
Approach 10 2 9 22 2.0 0.067 29.3 LOS C 0.6 4.3
East: Kensington Road
Lane 1 34 0 0 34 2.0 3571
0.096 100 12.5 LOS B 0.5 3.4 26 Parking 0.0 0.0
Lane 2 0 274 6 280 2.0 1142 0.245 100 7.2 LOS A 4.5 31.8 500 – 0.0 0.0
Approach 34 274 6 315 2.0 0.245 7.8 LOS A 4.5 31.8
North: Hobsons Road
Lane 1 24 0 0 24 5.0 1031
0.234 100 29.6 LOS C 0.6 4.7 13 Parking 0.0 0.0
Lane 2 0 1 42 43 5.0 295 0.145 100 30.6 LOS C 1.2 8.8 500 – 0.0 0.0
Approach 24 1 42 67 5.0 0.234 30.3 LOS C 1.2 8.8
West: Kensington Road
Lane 1 32 0 0 32 2.0 4501
0.072 305
12.5 LOS B 0.4 3.1 35 Turn Bay 0.0 0.0
Lane 2 0 252 14 266 2.0 1105 0.240 100 7.4 LOS A 4.2 30.0 500 – 0.0 0.0
Approach 32 252 14 298 2.0 0.240 7.9 LOS A 4.2 30.0
Intersection 701 2.3 0.245 10.6 LOS B 4.5 31.8
Level of Service (LOS) Method: Delay (HCM 2000).
Lane LOS values are based on average delay per lane.
Intersection and Approach LOS values are based on average delay for all lanes.
SIDRA Standard Delay Model used.
1 Reduced capacity due to a short lane effect
5 Lane underutilisation determined by program
Processed: Tuesday, 25 November 2014 10:19:18 AMSIDRA INTERSECTION 5.1.13.2093
Copyright © 2000-2011 Akcelik and Associates Pty Ltdwww.sidrasolutions.com
Project: P:\14M2300-2399\14M2307000 West Melbourne Waterfront Presentation\Modelling\Childers Street & Kensington Road & Hobsons Road.sip8000056, GTA CONSULTANTS, ENTERPRISE

LANE SUMMARY Site: Existing Conditions - AM Peak
Kensington Road / Mercantile Parade IntersectionStop (Two-Way)
Lane Use and Performance
Demand Flows 95% Back of QueueHV Cap.
Deg.Satn
LaneUtil.
AverageDelay
Level ofService
Lane Length
SL Type
Cap.Adj.
Prob. Block.L T R Total Vehicles Distance
veh/h veh/h veh/h veh/h % veh/h v/c % sec veh m m % %East: Kensington Road
Lane 1 0 453 20 473 4.8 1871 0.253 100 1.0 LOS A 1.7 12.4 500 – 0.0 0.0
Approach 0 453 20 473 4.8 0.253 1.0 NA 1.7 12.4
North: Mercantile Parade
Lane 1 66 0 0 66 0.0 7601
0.087 100 9.9 LOS A 0.2 1.5 14 Parking 0.0 0.0
Lane 2 0 0 289 289 0.0 457 0.632 100 20.7 LOS C 4.0 27.9 500 – 0.0 0.0
Approach 66 0 289 355 0.0 0.632 18.7 LOS C 4.0 27.9
West: Kensington Road
Lane 1 16 154 0 170 9.1 1833 0.093 100 0.6 LOS A 0.0 0.0 500 – 0.0 0.0
Approach 16 154 0 170 9.1 0.093 0.6 NA 0.0 0.0
Intersection 998 3.8 0.632 7.2 NA 4.0 27.9
Level of Service (LOS) Method: Delay (HCM 2000).
Lane LOS values are based on average delay per lane.
Minor Road Approach LOS values are based on average delay for all lanes.
NA: Intersection LOS and Major Road Approach LOS values are Not Applicable for two-way sign control since the average delay is not a good LOS measure due to zero delays associated with major road lanes.
SIDRA Standard Delay Model used.
1 Reduced capacity due to a short lane effect
Processed: Tuesday, 25 November 2014 10:29:19 AMSIDRA INTERSECTION 5.1.13.2093
Copyright © 2000-2011 Akcelik and Associates Pty Ltdwww.sidrasolutions.com
Project: P:\14M2300-2399\14M2307000 West Melbourne Waterfront Presentation\Modelling\Kensington Road & Mercantile Parade.sip8000056, GTA CONSULTANTS, ENTERPRISE
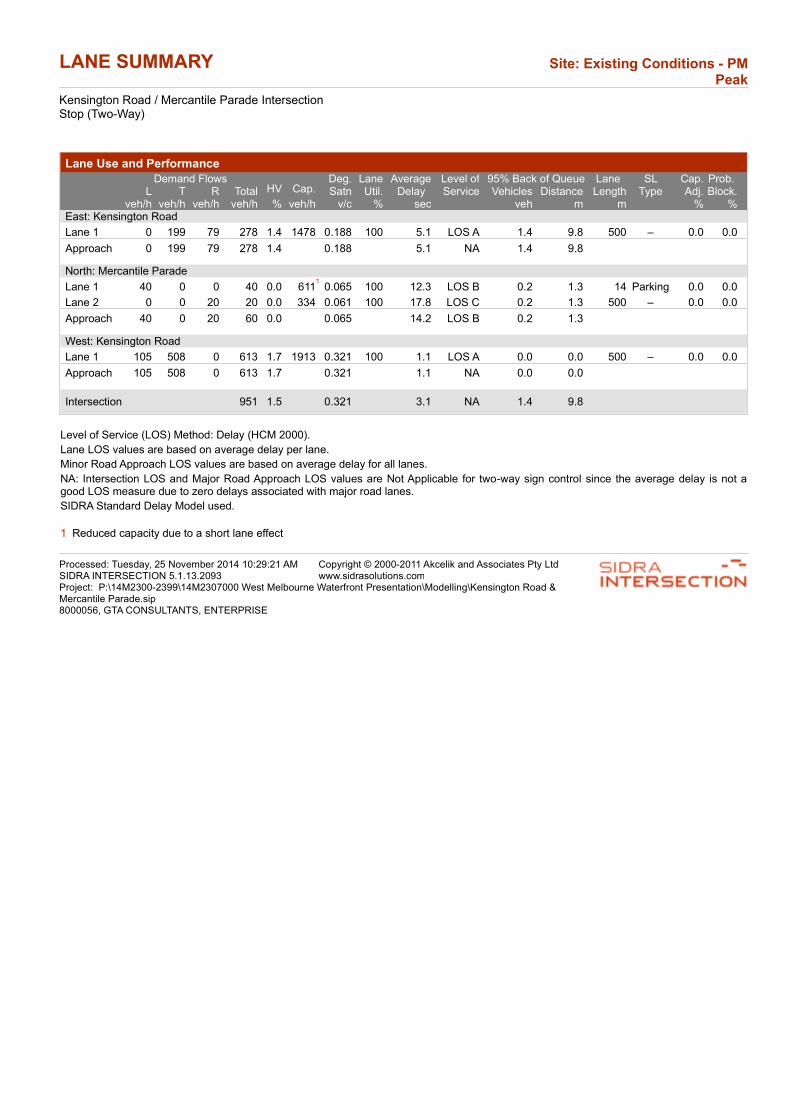
LANE SUMMARY Site: Existing Conditions - PM Peak
Kensington Road / Mercantile Parade IntersectionStop (Two-Way)
Lane Use and Performance
Demand Flows 95% Back of QueueHV Cap.
Deg.Satn
LaneUtil.
AverageDelay
Level ofService
Lane Length
SL Type
Cap.Adj.
Prob. Block.L T R Total Vehicles Distance
veh/h veh/h veh/h veh/h % veh/h v/c % sec veh m m % %East: Kensington Road
Lane 1 0 199 79 278 1.4 1478 0.188 100 5.1 LOS A 1.4 9.8 500 – 0.0 0.0
Approach 0 199 79 278 1.4 0.188 5.1 NA 1.4 9.8
North: Mercantile Parade
Lane 1 40 0 0 40 0.0 6111
0.065 100 12.3 LOS B 0.2 1.3 14 Parking 0.0 0.0
Lane 2 0 0 20 20 0.0 334 0.061 100 17.8 LOS C 0.2 1.3 500 – 0.0 0.0
Approach 40 0 20 60 0.0 0.065 14.2 LOS B 0.2 1.3
West: Kensington Road
Lane 1 105 508 0 613 1.7 1913 0.321 100 1.1 LOS A 0.0 0.0 500 – 0.0 0.0
Approach 105 508 0 613 1.7 0.321 1.1 NA 0.0 0.0
Intersection 951 1.5 0.321 3.1 NA 1.4 9.8
Level of Service (LOS) Method: Delay (HCM 2000).
Lane LOS values are based on average delay per lane.
Minor Road Approach LOS values are based on average delay for all lanes.
NA: Intersection LOS and Major Road Approach LOS values are Not Applicable for two-way sign control since the average delay is not a good LOS measure due to zero delays associated with major road lanes.
SIDRA Standard Delay Model used.
1 Reduced capacity due to a short lane effect
Processed: Tuesday, 25 November 2014 10:29:21 AMSIDRA INTERSECTION 5.1.13.2093
Copyright © 2000-2011 Akcelik and Associates Pty Ltdwww.sidrasolutions.com
Project: P:\14M2300-2399\14M2307000 West Melbourne Waterfront Presentation\Modelling\Kensington Road & Mercantile Parade.sip8000056, GTA CONSULTANTS, ENTERPRISE
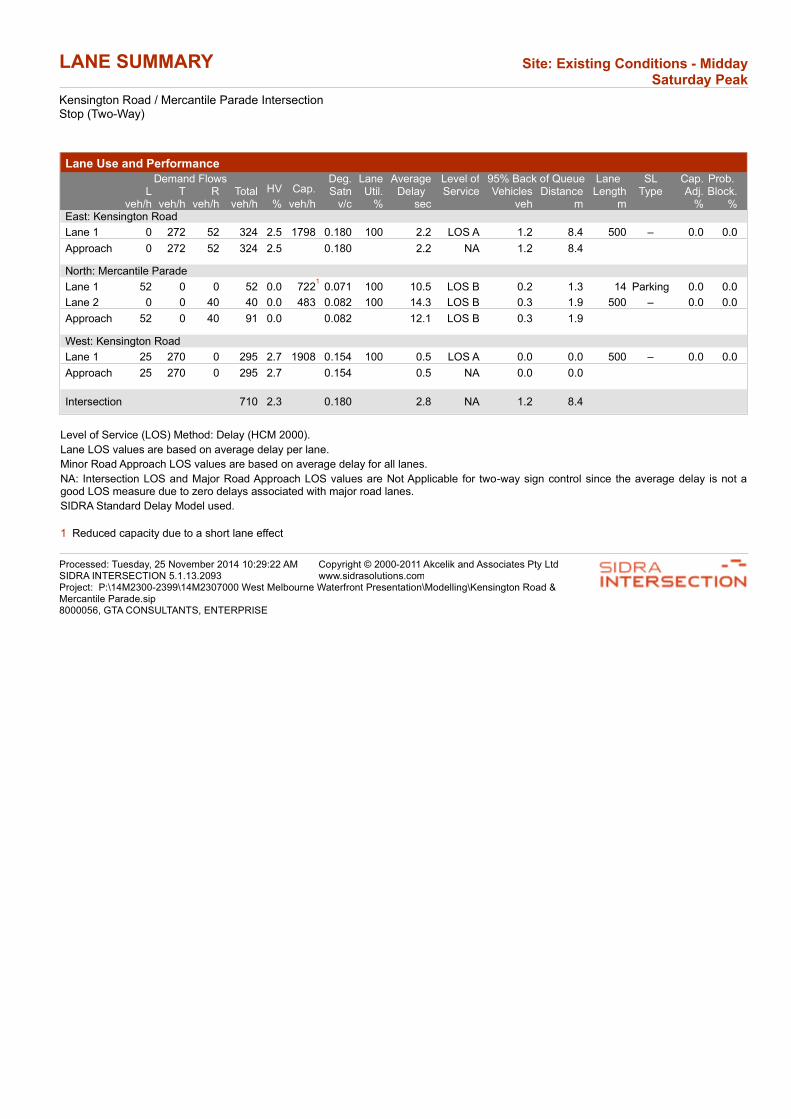
LANE SUMMARY Site: Existing Conditions - Midday Saturday Peak
Kensington Road / Mercantile Parade IntersectionStop (Two-Way)
Lane Use and Performance
Demand Flows 95% Back of QueueHV Cap.
Deg.Satn
LaneUtil.
AverageDelay
Level ofService
Lane Length
SL Type
Cap.Adj.
Prob. Block.L T R Total Vehicles Distance
veh/h veh/h veh/h veh/h % veh/h v/c % sec veh m m % %East: Kensington Road
Lane 1 0 272 52 324 2.5 1798 0.180 100 2.2 LOS A 1.2 8.4 500 – 0.0 0.0
Approach 0 272 52 324 2.5 0.180 2.2 NA 1.2 8.4
North: Mercantile Parade
Lane 1 52 0 0 52 0.0 7221
0.071 100 10.5 LOS B 0.2 1.3 14 Parking 0.0 0.0
Lane 2 0 0 40 40 0.0 483 0.082 100 14.3 LOS B 0.3 1.9 500 – 0.0 0.0
Approach 52 0 40 91 0.0 0.082 12.1 LOS B 0.3 1.9
West: Kensington Road
Lane 1 25 270 0 295 2.7 1908 0.154 100 0.5 LOS A 0.0 0.0 500 – 0.0 0.0
Approach 25 270 0 295 2.7 0.154 0.5 NA 0.0 0.0
Intersection 710 2.3 0.180 2.8 NA 1.2 8.4
Level of Service (LOS) Method: Delay (HCM 2000).
Lane LOS values are based on average delay per lane.
Minor Road Approach LOS values are based on average delay for all lanes.
NA: Intersection LOS and Major Road Approach LOS values are Not Applicable for two-way sign control since the average delay is not a good LOS measure due to zero delays associated with major road lanes.
SIDRA Standard Delay Model used.
1 Reduced capacity due to a short lane effect
Processed: Tuesday, 25 November 2014 10:29:22 AMSIDRA INTERSECTION 5.1.13.2093
Copyright © 2000-2011 Akcelik and Associates Pty Ltdwww.sidrasolutions.com
Project: P:\14M2300-2399\14M2307000 West Melbourne Waterfront Presentation\Modelling\Kensington Road & Mercantile Parade.sip8000056, GTA CONSULTANTS, ENTERPRISE
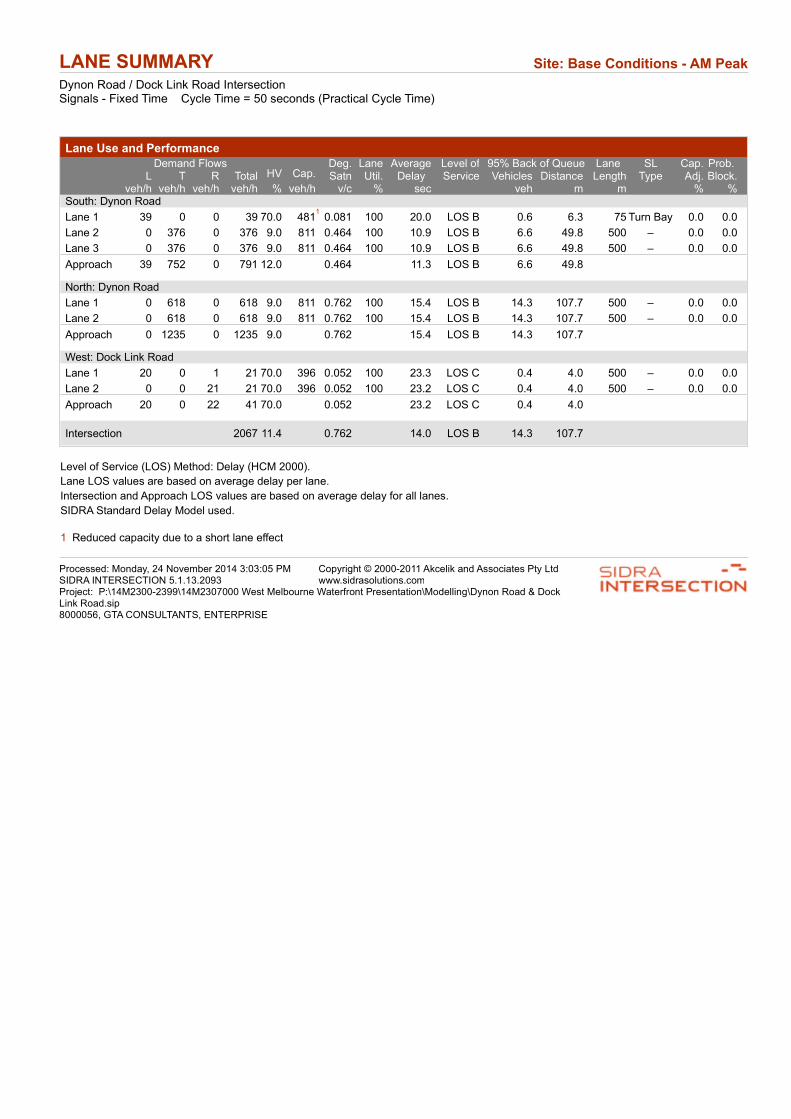
LANE SUMMARY Site: Base Conditions - AM Peak
Dynon Road / Dock Link Road IntersectionSignals - Fixed Time Cycle Time = 50 seconds (Practical Cycle Time)
Lane Use and Performance
Demand Flows 95% Back of QueueHV Cap.
Deg.Satn
LaneUtil.
AverageDelay
Level ofService
Lane Length
SL Type
Cap.Adj.
Prob. Block.L T R Total Vehicles Distance
veh/h veh/h veh/h veh/h % veh/h v/c % sec veh m m % %South: Dynon Road
Lane 1 39 0 0 39 70.0 4811
0.081 100 20.0 LOS B 0.6 6.3 75 Turn Bay 0.0 0.0
Lane 2 0 376 0 376 9.0 811 0.464 100 10.9 LOS B 6.6 49.8 500 – 0.0 0.0
Lane 3 0 376 0 376 9.0 811 0.464 100 10.9 LOS B 6.6 49.8 500 – 0.0 0.0
Approach 39 752 0 791 12.0 0.464 11.3 LOS B 6.6 49.8
North: Dynon Road
Lane 1 0 618 0 618 9.0 811 0.762 100 15.4 LOS B 14.3 107.7 500 – 0.0 0.0
Lane 2 0 618 0 618 9.0 811 0.762 100 15.4 LOS B 14.3 107.7 500 – 0.0 0.0
Approach 0 1235 0 1235 9.0 0.762 15.4 LOS B 14.3 107.7
West: Dock Link Road
Lane 1 20 0 1 21 70.0 396 0.052 100 23.3 LOS C 0.4 4.0 500 – 0.0 0.0
Lane 2 0 0 21 21 70.0 396 0.052 100 23.2 LOS C 0.4 4.0 500 – 0.0 0.0
Approach 20 0 22 41 70.0 0.052 23.2 LOS C 0.4 4.0
Intersection 2067 11.4 0.762 14.0 LOS B 14.3 107.7
Level of Service (LOS) Method: Delay (HCM 2000).
Lane LOS values are based on average delay per lane.
Intersection and Approach LOS values are based on average delay for all lanes.
SIDRA Standard Delay Model used.
1 Reduced capacity due to a short lane effect
Processed: Monday, 24 November 2014 3:03:05 PMSIDRA INTERSECTION 5.1.13.2093
Copyright © 2000-2011 Akcelik and Associates Pty Ltdwww.sidrasolutions.com
Project: P:\14M2300-2399\14M2307000 West Melbourne Waterfront Presentation\Modelling\Dynon Road & Dock Link Road.sip8000056, GTA CONSULTANTS, ENTERPRISE
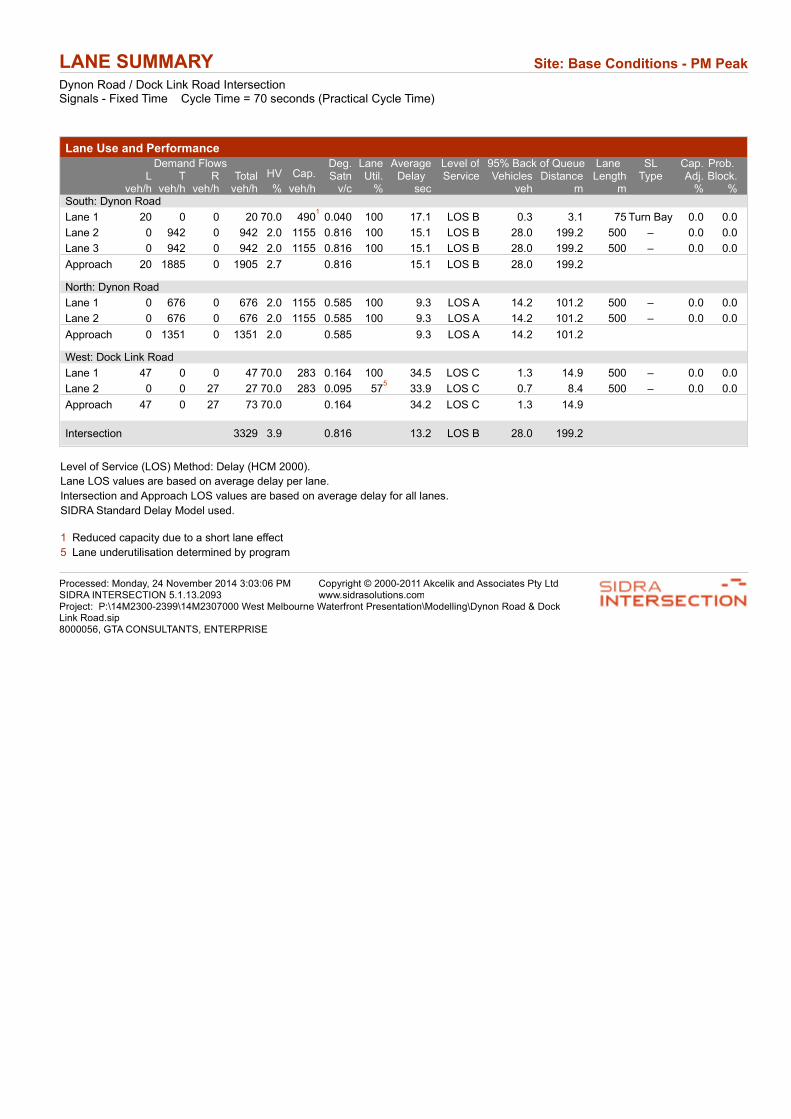
LANE SUMMARY Site: Base Conditions - PM Peak
Dynon Road / Dock Link Road IntersectionSignals - Fixed Time Cycle Time = 70 seconds (Practical Cycle Time)
Lane Use and Performance
Demand Flows 95% Back of QueueHV Cap.
Deg.Satn
LaneUtil.
AverageDelay
Level ofService
Lane Length
SL Type
Cap.Adj.
Prob. Block.L T R Total Vehicles Distance
veh/h veh/h veh/h veh/h % veh/h v/c % sec veh m m % %South: Dynon Road
Lane 1 20 0 0 20 70.0 4901
0.040 100 17.1 LOS B 0.3 3.1 75 Turn Bay 0.0 0.0
Lane 2 0 942 0 942 2.0 1155 0.816 100 15.1 LOS B 28.0 199.2 500 – 0.0 0.0
Lane 3 0 942 0 942 2.0 1155 0.816 100 15.1 LOS B 28.0 199.2 500 – 0.0 0.0
Approach 20 1885 0 1905 2.7 0.816 15.1 LOS B 28.0 199.2
North: Dynon Road
Lane 1 0 676 0 676 2.0 1155 0.585 100 9.3 LOS A 14.2 101.2 500 – 0.0 0.0
Lane 2 0 676 0 676 2.0 1155 0.585 100 9.3 LOS A 14.2 101.2 500 – 0.0 0.0
Approach 0 1351 0 1351 2.0 0.585 9.3 LOS A 14.2 101.2
West: Dock Link Road
Lane 1 47 0 0 47 70.0 283 0.164 100 34.5 LOS C 1.3 14.9 500 – 0.0 0.0
Lane 2 0 0 27 27 70.0 283 0.095 575
33.9 LOS C 0.7 8.4 500 – 0.0 0.0
Approach 47 0 27 73 70.0 0.164 34.2 LOS C 1.3 14.9
Intersection 3329 3.9 0.816 13.2 LOS B 28.0 199.2
Level of Service (LOS) Method: Delay (HCM 2000).
Lane LOS values are based on average delay per lane.
Intersection and Approach LOS values are based on average delay for all lanes.
SIDRA Standard Delay Model used.
1 Reduced capacity due to a short lane effect
5 Lane underutilisation determined by program
Processed: Monday, 24 November 2014 3:03:06 PMSIDRA INTERSECTION 5.1.13.2093
Copyright © 2000-2011 Akcelik and Associates Pty Ltdwww.sidrasolutions.com
Project: P:\14M2300-2399\14M2307000 West Melbourne Waterfront Presentation\Modelling\Dynon Road & Dock Link Road.sip8000056, GTA CONSULTANTS, ENTERPRISE
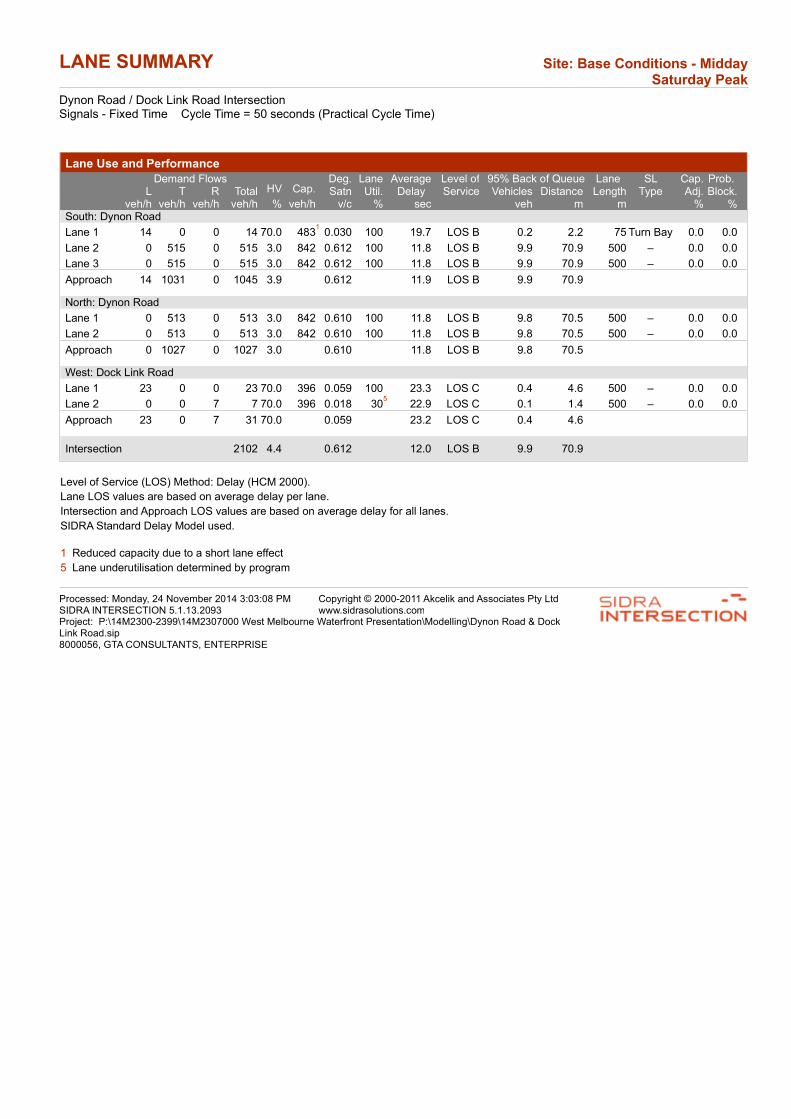
LANE SUMMARY Site: Base Conditions - Midday Saturday Peak
Dynon Road / Dock Link Road IntersectionSignals - Fixed Time Cycle Time = 50 seconds (Practical Cycle Time)
Lane Use and Performance
Demand Flows 95% Back of QueueHV Cap.
Deg.Satn
LaneUtil.
AverageDelay
Level ofService
Lane Length
SL Type
Cap.Adj.
Prob. Block.L T R Total Vehicles Distance
veh/h veh/h veh/h veh/h % veh/h v/c % sec veh m m % %South: Dynon Road
Lane 1 14 0 0 14 70.0 4831
0.030 100 19.7 LOS B 0.2 2.2 75 Turn Bay 0.0 0.0
Lane 2 0 515 0 515 3.0 842 0.612 100 11.8 LOS B 9.9 70.9 500 – 0.0 0.0
Lane 3 0 515 0 515 3.0 842 0.612 100 11.8 LOS B 9.9 70.9 500 – 0.0 0.0
Approach 14 1031 0 1045 3.9 0.612 11.9 LOS B 9.9 70.9
North: Dynon Road
Lane 1 0 513 0 513 3.0 842 0.610 100 11.8 LOS B 9.8 70.5 500 – 0.0 0.0
Lane 2 0 513 0 513 3.0 842 0.610 100 11.8 LOS B 9.8 70.5 500 – 0.0 0.0
Approach 0 1027 0 1027 3.0 0.610 11.8 LOS B 9.8 70.5
West: Dock Link Road
Lane 1 23 0 0 23 70.0 396 0.059 100 23.3 LOS C 0.4 4.6 500 – 0.0 0.0
Lane 2 0 0 7 7 70.0 396 0.018 305
22.9 LOS C 0.1 1.4 500 – 0.0 0.0
Approach 23 0 7 31 70.0 0.059 23.2 LOS C 0.4 4.6
Intersection 2102 4.4 0.612 12.0 LOS B 9.9 70.9
Level of Service (LOS) Method: Delay (HCM 2000).
Lane LOS values are based on average delay per lane.
Intersection and Approach LOS values are based on average delay for all lanes.
SIDRA Standard Delay Model used.
1 Reduced capacity due to a short lane effect
5 Lane underutilisation determined by program
Processed: Monday, 24 November 2014 3:03:08 PMSIDRA INTERSECTION 5.1.13.2093
Copyright © 2000-2011 Akcelik and Associates Pty Ltdwww.sidrasolutions.com
Project: P:\14M2300-2399\14M2307000 West Melbourne Waterfront Presentation\Modelling\Dynon Road & Dock Link Road.sip8000056, GTA CONSULTANTS, ENTERPRISE
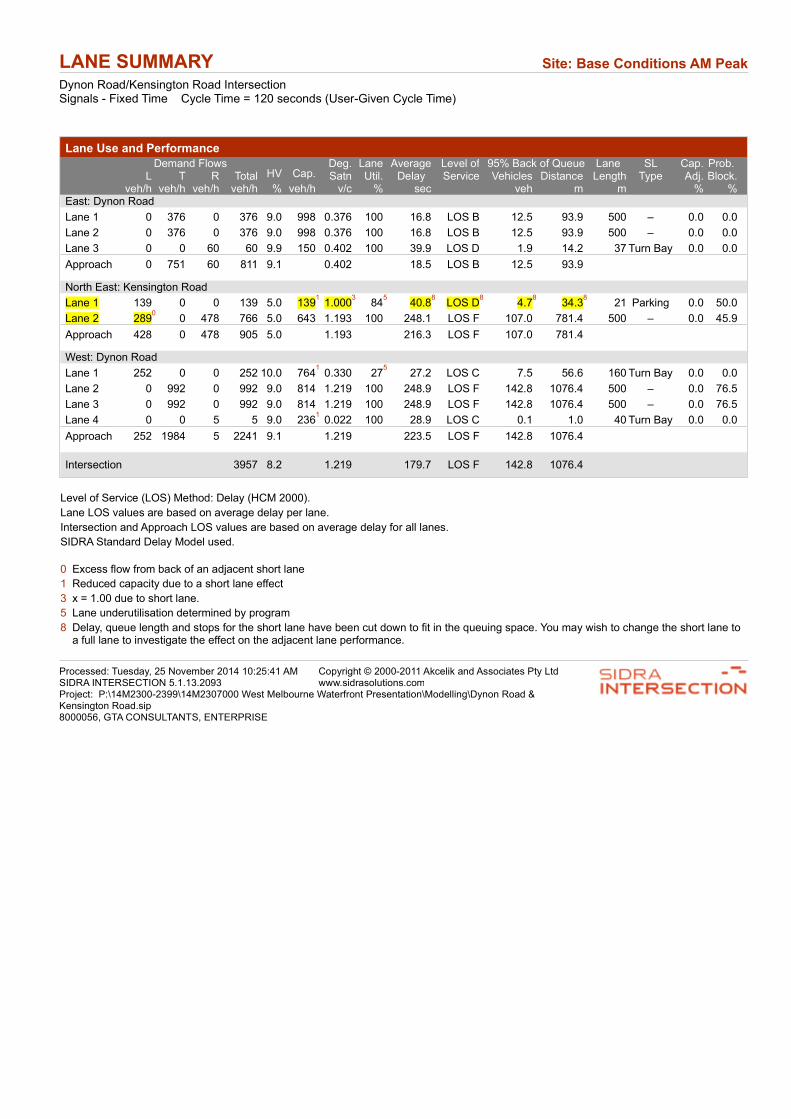
LANE SUMMARY Site: Base Conditions AM Peak
Dynon Road/Kensington Road IntersectionSignals - Fixed Time Cycle Time = 120 seconds (User-Given Cycle Time)
Lane Use and Performance
Demand Flows 95% Back of QueueHV Cap.
Deg.Satn
LaneUtil.
AverageDelay
Level ofService
Lane Length
SL Type
Cap.Adj.
Prob. Block.L T R Total Vehicles Distance
veh/h veh/h veh/h veh/h % veh/h v/c % sec veh m m % %East: Dynon Road
Lane 1 0 376 0 376 9.0 998 0.376 100 16.8 LOS B 12.5 93.9 500 – 0.0 0.0
Lane 2 0 376 0 376 9.0 998 0.376 100 16.8 LOS B 12.5 93.9 500 – 0.0 0.0
Lane 3 0 0 60 60 9.9 150 0.402 100 39.9 LOS D 1.9 14.2 37 Turn Bay 0.0 0.0
Approach 0 751 60 811 9.1 0.402 18.5 LOS B 12.5 93.9
North East: Kensington Road
Lane 1 139 0 0 139 5.0 1391
1.0003
845
40.88
LOS D8
4.78
34.38
21 Parking 0.0 50.0
Lane 2 2890
0 478 766 5.0 643 1.193 100 248.1 LOS F 107.0 781.4 500 – 0.0 45.9
Approach 428 0 478 905 5.0 1.193 216.3 LOS F 107.0 781.4
West: Dynon Road
Lane 1 252 0 0 252 10.0 7641
0.330 275
27.2 LOS C 7.5 56.6 160 Turn Bay 0.0 0.0
Lane 2 0 992 0 992 9.0 814 1.219 100 248.9 LOS F 142.8 1076.4 500 – 0.0 76.5
Lane 3 0 992 0 992 9.0 814 1.219 100 248.9 LOS F 142.8 1076.4 500 – 0.0 76.5
Lane 4 0 0 5 5 9.0 2361
0.022 100 28.9 LOS C 0.1 1.0 40 Turn Bay 0.0 0.0
Approach 252 1984 5 2241 9.1 1.219 223.5 LOS F 142.8 1076.4
Intersection 3957 8.2 1.219 179.7 LOS F 142.8 1076.4
Level of Service (LOS) Method: Delay (HCM 2000).
Lane LOS values are based on average delay per lane.
Intersection and Approach LOS values are based on average delay for all lanes.
SIDRA Standard Delay Model used.
0 Excess flow from back of an adjacent short lane
1 Reduced capacity due to a short lane effect
3 x = 1.00 due to short lane.
5 Lane underutilisation determined by program
8 Delay, queue length and stops for the short lane have been cut down to fit in the queuing space. You may wish to change the short lane to a full lane to investigate the effect on the adjacent lane performance.
Processed: Tuesday, 25 November 2014 10:25:41 AMSIDRA INTERSECTION 5.1.13.2093
Copyright © 2000-2011 Akcelik and Associates Pty Ltdwww.sidrasolutions.com
Project: P:\14M2300-2399\14M2307000 West Melbourne Waterfront Presentation\Modelling\Dynon Road & Kensington Road.sip8000056, GTA CONSULTANTS, ENTERPRISE

LANE SUMMARY Site: Base Conditions PM Peak
Dynon Road/Kensington Road IntersectionSignals - Fixed Time Cycle Time = 120 seconds (User-Given Cycle Time)
Lane Use and Performance
Demand Flows 95% Back of QueueHV Cap.
Deg.Satn
LaneUtil.
AverageDelay
Level ofService
Lane Length
SL Type
Cap.Adj.
Prob. Block.L T R Total Vehicles Distance
veh/h veh/h veh/h veh/h % veh/h v/c % sec veh m m % %East: Dynon Road
Lane 1 0 978 0 978 2.0 1428 0.685 100 8.6 LOS A 29.5 209.8 500 – 0.0 0.0
Lane 2 0 978 0 978 2.0 1428 0.685 100 8.6 LOS A 29.5 209.8 500 – 0.0 0.0
Lane 3 0 0 231 231 2.0 3181
0.728 100 25.8 LOS C 7.0 49.9 37 Turn Bay 0.0 32.3
Approach 0 1957 231 2188 2.0 0.728 10.4 LOS B 29.5 209.8
North East: Kensington Road
Lane 1 89 0 30 118 2.0 1671
0.710 100 34.6 LOS C 4.1 29.2 21 Parking 0.0 35.2
Lane 2 0 0 206 206 2.0 290 0.710 100 59.8 LOS E 11.9 84.9 500 – 0.0 0.0
Approach 89 0 235 324 2.0 0.710 50.6 LOS D 11.9 84.9
West: Dynon Road
Lane 1 428 0 0 428 2.0 656 0.653 915
41.9 LOS D 21.0 149.2 160 Turn Bay 0.0 0.0
Lane 2 0 496 0 496 2.0 690 0.720 100 35.7 LOS D 25.1 178.4 500 – 0.0 0.0
Lane 3 0 496 0 496 2.0 690 0.720 100 35.7 LOS D 25.1 178.4 500 – 0.0 0.0
Lane 4 0 0 36 36 2.0 122 0.297 100 32.4 LOS C 1.4 10.0 40 Turn Bay 0.0 0.0
Approach 428 993 36 1458 2.0 0.720 37.4 LOS D 25.1 178.4
Intersection 3970 2.0 0.728 23.6 LOS C 29.5 209.8
Level of Service (LOS) Method: Delay (HCM 2000).
Lane LOS values are based on average delay per lane.
Intersection and Approach LOS values are based on average delay for all lanes.
SIDRA Standard Delay Model used.
1 Reduced capacity due to a short lane effect
5 Lane underutilisation determined by program
Processed: Monday, 24 November 2014 4:21:05 PMSIDRA INTERSECTION 5.1.13.2093
Copyright © 2000-2011 Akcelik and Associates Pty Ltdwww.sidrasolutions.com
Project: P:\14M2300-2399\14M2307000 West Melbourne Waterfront Presentation\Modelling\Dynon Road & Kensington Road.sip8000056, GTA CONSULTANTS, ENTERPRISE

LANE SUMMARY Site: Base Conditions Midday Saturday Peak
Dynon Road/Kensington Road IntersectionSignals - Fixed Time Cycle Time = 120 seconds (User-Given Cycle Time)
Lane Use and Performance
Demand Flows 95% Back of QueueHV Cap.
Deg.Satn
LaneUtil.
AverageDelay
Level ofService
Lane Length
SL Type
Cap.Adj.
Prob. Block.L T R Total Vehicles Distance
veh/h veh/h veh/h veh/h % veh/h v/c % sec veh m m % %East: Dynon Road
Lane 1 0 478 0 478 3.0 1132 0.423 100 14.1 LOS B 15.0 107.5 500 – 0.0 0.0
Lane 2 0 478 0 478 3.0 1132 0.423 100 14.1 LOS B 15.0 107.5 500 – 0.0 0.0
Lane 3 0 0 113 113 3.0 2611
0.433 100 25.9 LOS C 2.9 21.0 37 Turn Bay 0.0 0.0
Approach 0 957 113 1070 3.0 0.433 15.3 LOS B 15.0 107.5
North East: Kensington Road
Lane 1 118 0 0 118 3.0 1681
0.703 100 34.1 LOS C 4.0 28.7 21 Parking 0.0 33.4
Lane 2 0 0 239 239 3.0 561 0.427 615
41.4 LOS D 11.2 80.1 500 – 0.0 0.0
Approach 118 0 239 358 3.0 0.703 39.0 LOS D 11.2 80.1
West: Dynon Road
Lane 1 218 0 0 218 3.0 636 0.343 485
38.1 LOS D 9.4 67.4 160 Turn Bay 0.0 0.0
Lane 2 0 477 0 477 3.0 669 0.713 100 36.3 LOS D 24.1 173.4 500 – 0.0 0.0
Lane 3 0 477 0 477 3.0 669 0.713 100 36.3 LOS D 24.1 173.4 500 – 0.0 0.0
Lane 4 0 0 10 10 3.0 2011
0.050 100 29.4 LOS C 0.3 2.3 40 Turn Bay 0.0 0.0
Approach 218 955 10 1183 3.0 0.713 36.5 LOS D 24.1 173.4
Intersection 2610 3.0 0.713 28.2 LOS C 24.1 173.4
Level of Service (LOS) Method: Delay (HCM 2000).
Lane LOS values are based on average delay per lane.
Intersection and Approach LOS values are based on average delay for all lanes.
SIDRA Standard Delay Model used.
1 Reduced capacity due to a short lane effect
5 Lane underutilisation determined by program
Processed: Monday, 24 November 2014 6:55:00 PMSIDRA INTERSECTION 5.1.13.2093
Copyright © 2000-2011 Akcelik and Associates Pty Ltdwww.sidrasolutions.com
Project: P:\14M2300-2399\14M2307000 West Melbourne Waterfront Presentation\Modelling\Dynon Road & Kensington Road.sip8000056, GTA CONSULTANTS, ENTERPRISE

LANE SUMMARY Site: Base Conditions AM Peak
Childers Street/Kensington Road/Hobsons Road IntersectionSignals - Fixed Time Cycle Time = 70 seconds (Optimum Cycle Time - Minimum Delay)
Lane Use and Performance
Demand Flows 95% Back of QueueHV Cap.
Deg.Satn
LaneUtil.
AverageDelay
Level ofService
Lane Length
SL Type
Cap.Adj.
Prob. Block.L T R Total Vehicles Distance
veh/h veh/h veh/h veh/h % veh/h v/c % sec veh m m % %South: Childers Road
Lane 1 14 10 10 34 2.0 547 0.063 100 19.2 LOS B 0.7 5.3 500 – 0.0 0.0
Approach 14 10 10 34 2.0 0.063 19.2 LOS B 0.7 5.3
East: Kensington Road
Lane 1 130 0 0 130 2.0 2671
0.487 100 19.1 LOS B 2.7 19.0 26 Parking 0.0 0.0
Lane 2 0 614 16 629 5.0 827 0.761 100 19.7 LOS B 19.2 140.5 500 – 0.0 0.0
Approach 130 614 16 759 4.5 0.761 19.6 LOS B 19.2 140.5
North: Hobsons Road
Lane 1 14 0 0 14 5.0 1301
0.104 100 20.7 LOS C 0.3 2.1 13 Parking 0.0 0.0
Lane 2 0 118 274 392 5.0 488 0.802 100 31.8 LOS C 14.1 103.0 500 – 0.0 0.0
Approach 14 118 274 405 5.0 0.802 31.4 LOS C 14.1 103.0
West: Kensington Road
Lane 1 31 18 0 49 6.8 3321
0.149 206
16.1 LOS B 1.0 7.1 35 Turn Bay 0.0 0.0
Lane 2 0 126 92 217 6.6 292 0.744 100 34.9 LOS C 7.8 57.8 500 – 0.0 0.0
Approach 31 144 92 267 6.7 0.744 31.4 LOS C 7.8 57.8
Intersection 1466 5.0 0.802 25.0 LOS C 19.2 140.5
Level of Service (LOS) Method: Delay (HCM 2000).
Lane LOS values are based on average delay per lane.
Intersection and Approach LOS values are based on average delay for all lanes.
SIDRA Standard Delay Model used.
1 Reduced capacity due to a short lane effect
6 Lane underutilisation due to downstream effects
Processed: Tuesday, 25 November 2014 10:19:20 AMSIDRA INTERSECTION 5.1.13.2093
Copyright © 2000-2011 Akcelik and Associates Pty Ltdwww.sidrasolutions.com
Project: P:\14M2300-2399\14M2307000 West Melbourne Waterfront Presentation\Modelling\Childers Street & Kensington Road & Hobsons Road.sip8000056, GTA CONSULTANTS, ENTERPRISE

LANE SUMMARY Site: Base Conditions PM Peak
Childers Street/Kensington Road/Hobsons Road IntersectionSignals - Fixed Time Cycle Time = 70 seconds (Optimum Cycle Time - Minimum Delay)
Lane Use and Performance
Demand Flows 95% Back of QueueHV Cap.
Deg.Satn
LaneUtil.
AverageDelay
Level ofService
Lane Length
SL Type
Cap.Adj.
Prob. Block.L T R Total Vehicles Distance
veh/h veh/h veh/h veh/h % veh/h v/c % sec veh m m % %South: Childers Road
Lane 1 53 124 72 250 2.0 459 0.545 100 26.1 LOS C 7.4 52.5 500 – 0.0 0.0
Approach 53 124 72 250 2.0 0.545 26.1 LOS C 7.4 52.5
East: Kensington Road
Lane 1 18 0 0 18 2.0 3121
0.059 100 14.8 LOS B 0.3 2.1 26 Parking 0.0 0.0
Lane 2 0 191 12 203 2.0 912 0.223 100 11.0 LOS B 3.9 27.8 500 – 0.0 0.0
Approach 18 191 12 221 2.0 0.223 11.3 LOS B 3.9 27.8
North: Hobsons Road
Lane 1 19 0 0 19 5.0 1141
0.171 100 25.2 LOS C 0.5 3.4 13 Parking 0.0 0.0
Lane 2 0 14 58 72 5.0 269 0.269 100 30.5 LOS C 2.1 15.6 500 – 0.0 0.0
Approach 19 14 58 92 5.0 0.269 29.4 LOS C 2.1 15.6
West: Kensington Road
Lane 1 137 0 0 137 2.0 3931
0.348 655
15.5 LOS B 2.4 16.9 35 Turn Bay 0.0 0.0
Lane 2 0 524 12 537 2.0 1001 0.536 100 11.9 LOS B 12.1 86.2 500 – 0.0 0.0
Approach 137 524 12 673 2.0 0.536 12.6 LOS B 12.1 86.2
Intersection 1237 2.2 0.545 16.3 LOS B 12.1 86.2
Level of Service (LOS) Method: Delay (HCM 2000).
Lane LOS values are based on average delay per lane.
Intersection and Approach LOS values are based on average delay for all lanes.
SIDRA Standard Delay Model used.
1 Reduced capacity due to a short lane effect
5 Lane underutilisation determined by program
Processed: Tuesday, 25 November 2014 10:19:21 AMSIDRA INTERSECTION 5.1.13.2093
Copyright © 2000-2011 Akcelik and Associates Pty Ltdwww.sidrasolutions.com
Project: P:\14M2300-2399\14M2307000 West Melbourne Waterfront Presentation\Modelling\Childers Street & Kensington Road & Hobsons Road.sip8000056, GTA CONSULTANTS, ENTERPRISE

LANE SUMMARY Site: Base Conditions Midday Saturday Peak
Childers Street/Kensington Road/Hobsons Road IntersectionSignals - Fixed Time Cycle Time = 70 seconds (Optimum Cycle Time - Minimum Delay)
Lane Use and Performance
Demand Flows 95% Back of QueueHV Cap.
Deg.Satn
LaneUtil.
AverageDelay
Level ofService
Lane Length
SL Type
Cap.Adj.
Prob. Block.L T R Total Vehicles Distance
veh/h veh/h veh/h veh/h % veh/h v/c % sec veh m m % %South: Childers Road
Lane 1 10 9 9 29 2.0 577 0.051 100 19.0 LOS B 0.6 4.5 500 – 0.0 0.0
Approach 10 9 9 29 2.0 0.051 19.0 LOS B 0.6 4.5
East: Kensington Road
Lane 1 34 0 0 34 2.0 2691
0.128 100 18.3 LOS B 0.7 4.7 26 Parking 0.0 0.0
Lane 2 0 273 10 283 2.0 830 0.341 100 14.1 LOS B 6.4 45.5 500 – 0.0 0.0
Approach 34 273 10 318 2.0 0.341 14.5 LOS B 6.4 45.5
North: Hobsons Road
Lane 1 44 0 0 44 5.0 1291
0.340 100 21.1 LOS C 0.9 6.9 13 Parking 0.0 0.0
Lane 2 0 2 77 79 5.0 452 0.175 100 22.2 LOS C 1.8 13.3 500 – 0.0 0.0
Approach 44 2 77 123 5.0 0.340 21.8 LOS C 1.8 13.3
West: Kensington Road
Lane 1 77 0 0 77 2.0 3431
0.224 695
18.6 LOS B 1.5 10.9 35 Turn Bay 0.0 0.0
Lane 2 0 250 14 264 2.0 808 0.326 100 14.1 LOS B 5.9 42.0 500 – 0.0 0.0
Approach 77 250 14 341 2.0 0.326 15.1 LOS B 5.9 42.0
Intersection 810 2.5 0.341 16.0 LOS B 6.4 45.5
Level of Service (LOS) Method: Delay (HCM 2000).
Lane LOS values are based on average delay per lane.
Intersection and Approach LOS values are based on average delay for all lanes.
SIDRA Standard Delay Model used.
1 Reduced capacity due to a short lane effect
5 Lane underutilisation determined by program
Processed: Tuesday, 25 November 2014 10:19:23 AMSIDRA INTERSECTION 5.1.13.2093
Copyright © 2000-2011 Akcelik and Associates Pty Ltdwww.sidrasolutions.com
Project: P:\14M2300-2399\14M2307000 West Melbourne Waterfront Presentation\Modelling\Childers Street & Kensington Road & Hobsons Road.sip8000056, GTA CONSULTANTS, ENTERPRISE
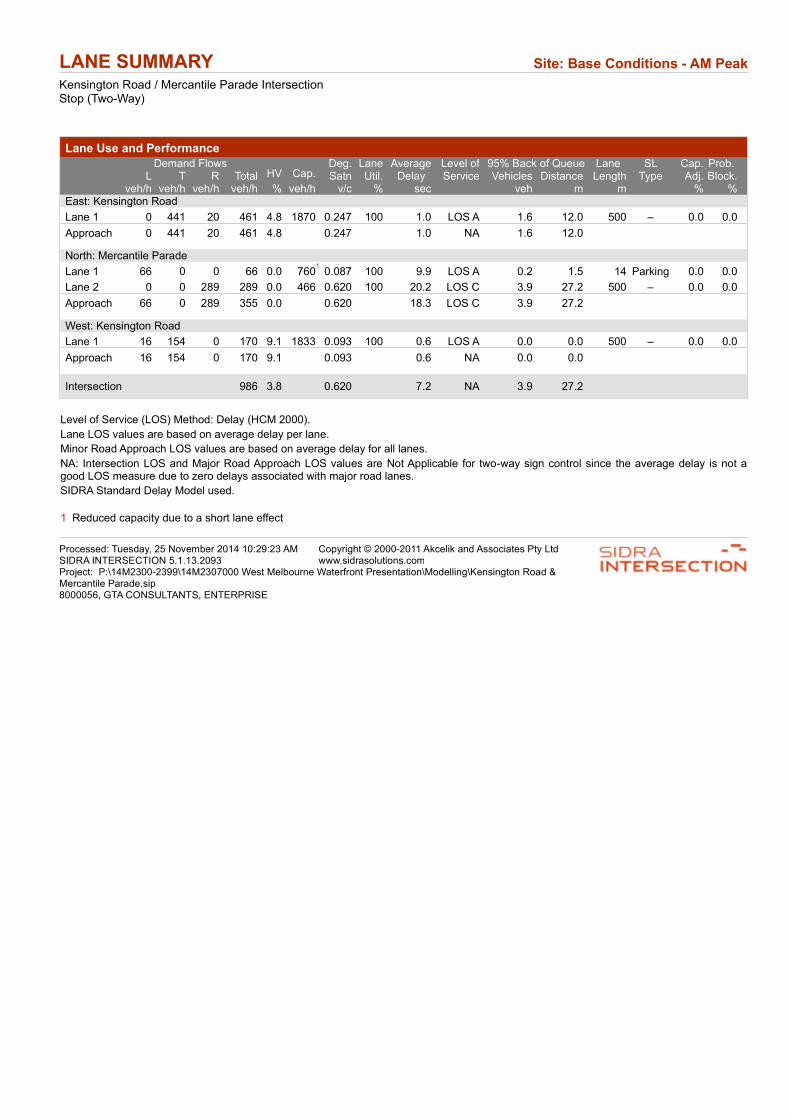
LANE SUMMARY Site: Base Conditions - AM Peak
Kensington Road / Mercantile Parade IntersectionStop (Two-Way)
Lane Use and Performance
Demand Flows 95% Back of QueueHV Cap.
Deg.Satn
LaneUtil.
AverageDelay
Level ofService
Lane Length
SL Type
Cap.Adj.
Prob. Block.L T R Total Vehicles Distance
veh/h veh/h veh/h veh/h % veh/h v/c % sec veh m m % %East: Kensington Road
Lane 1 0 441 20 461 4.8 1870 0.247 100 1.0 LOS A 1.6 12.0 500 – 0.0 0.0
Approach 0 441 20 461 4.8 0.247 1.0 NA 1.6 12.0
North: Mercantile Parade
Lane 1 66 0 0 66 0.0 7601
0.087 100 9.9 LOS A 0.2 1.5 14 Parking 0.0 0.0
Lane 2 0 0 289 289 0.0 466 0.620 100 20.2 LOS C 3.9 27.2 500 – 0.0 0.0
Approach 66 0 289 355 0.0 0.620 18.3 LOS C 3.9 27.2
West: Kensington Road
Lane 1 16 154 0 170 9.1 1833 0.093 100 0.6 LOS A 0.0 0.0 500 – 0.0 0.0
Approach 16 154 0 170 9.1 0.093 0.6 NA 0.0 0.0
Intersection 986 3.8 0.620 7.2 NA 3.9 27.2
Level of Service (LOS) Method: Delay (HCM 2000).
Lane LOS values are based on average delay per lane.
Minor Road Approach LOS values are based on average delay for all lanes.
NA: Intersection LOS and Major Road Approach LOS values are Not Applicable for two-way sign control since the average delay is not a good LOS measure due to zero delays associated with major road lanes.
SIDRA Standard Delay Model used.
1 Reduced capacity due to a short lane effect
Processed: Tuesday, 25 November 2014 10:29:23 AMSIDRA INTERSECTION 5.1.13.2093
Copyright © 2000-2011 Akcelik and Associates Pty Ltdwww.sidrasolutions.com
Project: P:\14M2300-2399\14M2307000 West Melbourne Waterfront Presentation\Modelling\Kensington Road & Mercantile Parade.sip8000056, GTA CONSULTANTS, ENTERPRISE
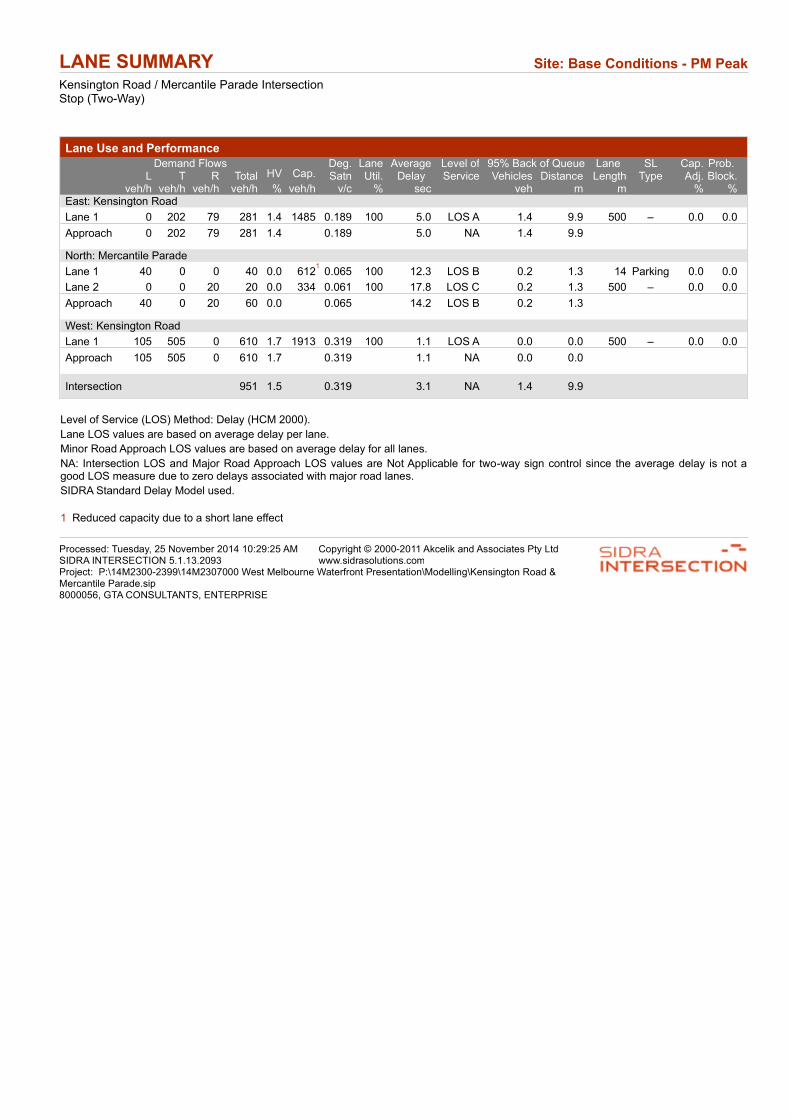
LANE SUMMARY Site: Base Conditions - PM Peak
Kensington Road / Mercantile Parade IntersectionStop (Two-Way)
Lane Use and Performance
Demand Flows 95% Back of QueueHV Cap.
Deg.Satn
LaneUtil.
AverageDelay
Level ofService
Lane Length
SL Type
Cap.Adj.
Prob. Block.L T R Total Vehicles Distance
veh/h veh/h veh/h veh/h % veh/h v/c % sec veh m m % %East: Kensington Road
Lane 1 0 202 79 281 1.4 1485 0.189 100 5.0 LOS A 1.4 9.9 500 – 0.0 0.0
Approach 0 202 79 281 1.4 0.189 5.0 NA 1.4 9.9
North: Mercantile Parade
Lane 1 40 0 0 40 0.0 6121
0.065 100 12.3 LOS B 0.2 1.3 14 Parking 0.0 0.0
Lane 2 0 0 20 20 0.0 334 0.061 100 17.8 LOS C 0.2 1.3 500 – 0.0 0.0
Approach 40 0 20 60 0.0 0.065 14.2 LOS B 0.2 1.3
West: Kensington Road
Lane 1 105 505 0 610 1.7 1913 0.319 100 1.1 LOS A 0.0 0.0 500 – 0.0 0.0
Approach 105 505 0 610 1.7 0.319 1.1 NA 0.0 0.0
Intersection 951 1.5 0.319 3.1 NA 1.4 9.9
Level of Service (LOS) Method: Delay (HCM 2000).
Lane LOS values are based on average delay per lane.
Minor Road Approach LOS values are based on average delay for all lanes.
NA: Intersection LOS and Major Road Approach LOS values are Not Applicable for two-way sign control since the average delay is not a good LOS measure due to zero delays associated with major road lanes.
SIDRA Standard Delay Model used.
1 Reduced capacity due to a short lane effect
Processed: Tuesday, 25 November 2014 10:29:25 AMSIDRA INTERSECTION 5.1.13.2093
Copyright © 2000-2011 Akcelik and Associates Pty Ltdwww.sidrasolutions.com
Project: P:\14M2300-2399\14M2307000 West Melbourne Waterfront Presentation\Modelling\Kensington Road & Mercantile Parade.sip8000056, GTA CONSULTANTS, ENTERPRISE
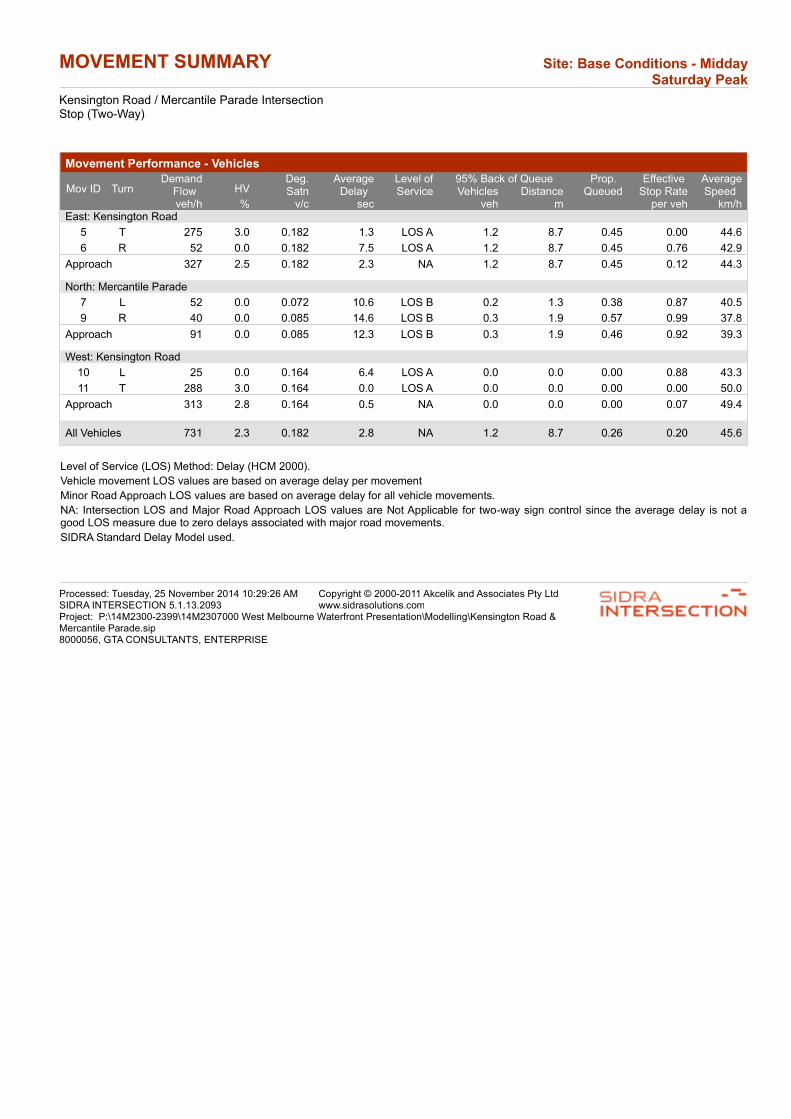
MOVEMENT SUMMARY Site: Base Conditions - Midday Saturday Peak
Kensington Road / Mercantile Parade IntersectionStop (Two-Way)
Movement Performance - Vehicles
95% Back of QueueMov ID Turn
DemandFlow HV
Deg.Satn
AverageDelay
Level ofService
Prop. Queued
Effective Stop Rate
AverageSpeed Vehicles Distance
veh/h % v/c sec veh m per veh km/hEast: Kensington Road
5 T 275 3.0 0.182 1.3 LOS A 1.2 8.7 0.45 0.00 44.6
6 R 52 0.0 0.182 7.5 LOS A 1.2 8.7 0.45 0.76 42.9
Approach 327 2.5 0.182 2.3 NA 1.2 8.7 0.45 0.12 44.3
North: Mercantile Parade
7 L 52 0.0 0.072 10.6 LOS B 0.2 1.3 0.38 0.87 40.5
9 R 40 0.0 0.085 14.6 LOS B 0.3 1.9 0.57 0.99 37.8
Approach 91 0.0 0.085 12.3 LOS B 0.3 1.9 0.46 0.92 39.3
West: Kensington Road
10 L 25 0.0 0.164 6.4 LOS A 0.0 0.0 0.00 0.88 43.3
11 T 288 3.0 0.164 0.0 LOS A 0.0 0.0 0.00 0.00 50.0
Approach 313 2.8 0.164 0.5 NA 0.0 0.0 0.00 0.07 49.4
All Vehicles 731 2.3 0.182 2.8 NA 1.2 8.7 0.26 0.20 45.6
Level of Service (LOS) Method: Delay (HCM 2000).
Vehicle movement LOS values are based on average delay per movement
Minor Road Approach LOS values are based on average delay for all vehicle movements.
NA: Intersection LOS and Major Road Approach LOS values are Not Applicable for two-way sign control since the average delay is not a good LOS measure due to zero delays associated with major road movements.
SIDRA Standard Delay Model used.
Processed: Tuesday, 25 November 2014 10:29:26 AMSIDRA INTERSECTION 5.1.13.2093
Copyright © 2000-2011 Akcelik and Associates Pty Ltdwww.sidrasolutions.com
Project: P:\14M2300-2399\14M2307000 West Melbourne Waterfront Presentation\Modelling\Kensington Road & Mercantile Parade.sip8000056, GTA CONSULTANTS, ENTERPRISE

LANE SUMMARY Site: Base Conditions - AM Peak
Kensington Road / Epsom Road / Macaulay RoadSignals - Fixed Time Cycle Time = 100 seconds (User-Given Cycle Time)
Lane Use and Performance
Demand Flows 95% Back of QueueHV Cap.
Deg.Satn
LaneUtil.
AverageDelay
Level ofService
Lane Length
SL Type
Cap.Adj.
Prob. Block.L T R Total Vehicles Distance
veh/h veh/h veh/h veh/h % veh/h v/c % sec veh m m % %South East: Macaulay Road
Lane 1 61 0 0 61 10.0 1021
0.600 100 42.9 LOS D 2.6 19.7 20 Parking 0.0 3.5
Lane 2 870
0 213 300 10.0 347 0.866 100 56.8 LOS E 16.5 125.5 500 – 0.0 0.0
Approach 148 0 213 361 10.0 0.866 54.4 LOS D 16.5 125.5
North: Epsom Road
Lane 1 254 0 1650
419 5.0 1011 0.415 100 17.3 LOS B 11.4 83.2 500 – 0.0 0.0
Lane 2 0 0 116 116 5.0 1931
0.600 100 23.3 LOS C 2.8 20.1 21 Turn Bay 0.0 1.0
Approach 254 0 281 535 5.0 0.600 18.6 LOS B 11.4 83.2
West: Kensington Road
Lane 1 57 0 0 57 5.0 951
0.600 100 51.3 LOS D 2.7 19.5 20 Parking 0.0 2.6
Lane 2 830
0 81 163 5.0 215 0.759 100 55.8 LOS E 8.4 61.4 500 – 0.0 0.0
Approach 140 0 81 220 5.0 0.759 54.6 LOS D 8.4 61.4
Intersection 1117 6.6 0.866 37.3 LOS D 16.5 125.5
Level of Service (LOS) Method: Delay (HCM 2000).
Lane LOS values are based on average delay per lane.
Intersection and Approach LOS values are based on average delay for all lanes.
SIDRA Standard Delay Model used.
0 Excess flow from back of an adjacent short lane
1 Reduced capacity due to a short lane effect
Processed: Monday, 24 November 2014 5:34:08 PMSIDRA INTERSECTION 5.1.13.2093
Copyright © 2000-2011 Akcelik and Associates Pty Ltdwww.sidrasolutions.com
Project: P:\14M2300-2399\14M2307000 West Melbourne Waterfront Presentation\Modelling\Kensington Road & Epsom Road & Macaulay Road.sip8000056, GTA CONSULTANTS, ENTERPRISE
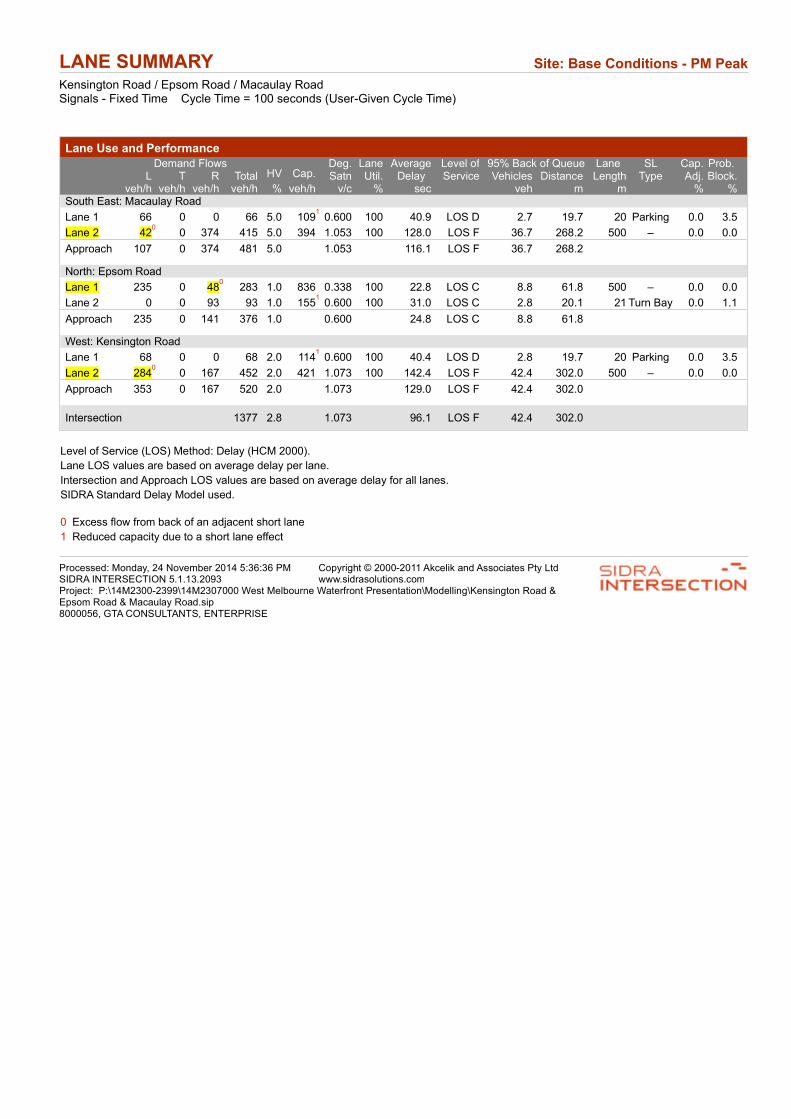
LANE SUMMARY Site: Base Conditions - PM Peak
Kensington Road / Epsom Road / Macaulay RoadSignals - Fixed Time Cycle Time = 100 seconds (User-Given Cycle Time)
Lane Use and Performance
Demand Flows 95% Back of QueueHV Cap.
Deg.Satn
LaneUtil.
AverageDelay
Level ofService
Lane Length
SL Type
Cap.Adj.
Prob. Block.L T R Total Vehicles Distance
veh/h veh/h veh/h veh/h % veh/h v/c % sec veh m m % %South East: Macaulay Road
Lane 1 66 0 0 66 5.0 1091
0.600 100 40.9 LOS D 2.7 19.7 20 Parking 0.0 3.5
Lane 2 420
0 374 415 5.0 394 1.053 100 128.0 LOS F 36.7 268.2 500 – 0.0 0.0
Approach 107 0 374 481 5.0 1.053 116.1 LOS F 36.7 268.2
North: Epsom Road
Lane 1 235 0 480
283 1.0 836 0.338 100 22.8 LOS C 8.8 61.8 500 – 0.0 0.0
Lane 2 0 0 93 93 1.0 1551
0.600 100 31.0 LOS C 2.8 20.1 21 Turn Bay 0.0 1.1
Approach 235 0 141 376 1.0 0.600 24.8 LOS C 8.8 61.8
West: Kensington Road
Lane 1 68 0 0 68 2.0 1141
0.600 100 40.4 LOS D 2.8 19.7 20 Parking 0.0 3.5
Lane 2 2840
0 167 452 2.0 421 1.073 100 142.4 LOS F 42.4 302.0 500 – 0.0 0.0
Approach 353 0 167 520 2.0 1.073 129.0 LOS F 42.4 302.0
Intersection 1377 2.8 1.073 96.1 LOS F 42.4 302.0
Level of Service (LOS) Method: Delay (HCM 2000).
Lane LOS values are based on average delay per lane.
Intersection and Approach LOS values are based on average delay for all lanes.
SIDRA Standard Delay Model used.
0 Excess flow from back of an adjacent short lane
1 Reduced capacity due to a short lane effect
Processed: Monday, 24 November 2014 5:36:36 PMSIDRA INTERSECTION 5.1.13.2093
Copyright © 2000-2011 Akcelik and Associates Pty Ltdwww.sidrasolutions.com
Project: P:\14M2300-2399\14M2307000 West Melbourne Waterfront Presentation\Modelling\Kensington Road & Epsom Road & Macaulay Road.sip8000056, GTA CONSULTANTS, ENTERPRISE
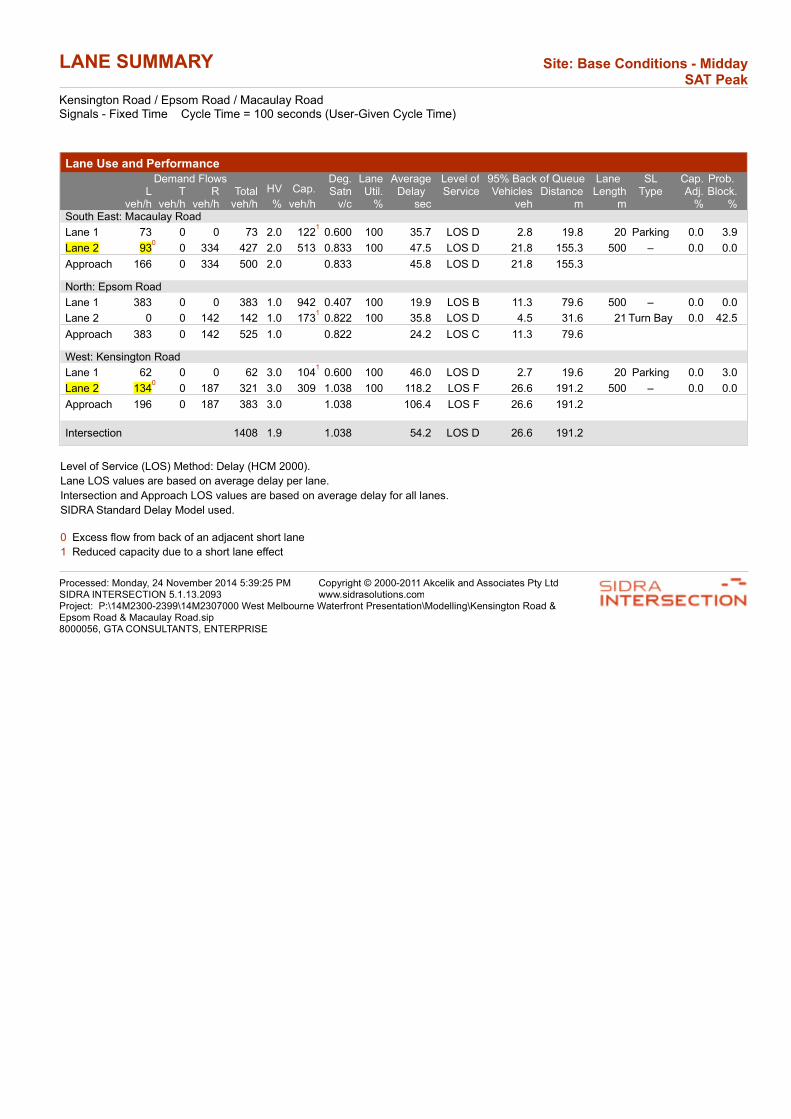
LANE SUMMARY Site: Base Conditions - Midday SAT Peak
Kensington Road / Epsom Road / Macaulay RoadSignals - Fixed Time Cycle Time = 100 seconds (User-Given Cycle Time)
Lane Use and Performance
Demand Flows 95% Back of QueueHV Cap.
Deg.Satn
LaneUtil.
AverageDelay
Level ofService
Lane Length
SL Type
Cap.Adj.
Prob. Block.L T R Total Vehicles Distance
veh/h veh/h veh/h veh/h % veh/h v/c % sec veh m m % %South East: Macaulay Road
Lane 1 73 0 0 73 2.0 1221
0.600 100 35.7 LOS D 2.8 19.8 20 Parking 0.0 3.9
Lane 2 930
0 334 427 2.0 513 0.833 100 47.5 LOS D 21.8 155.3 500 – 0.0 0.0
Approach 166 0 334 500 2.0 0.833 45.8 LOS D 21.8 155.3
North: Epsom Road
Lane 1 383 0 0 383 1.0 942 0.407 100 19.9 LOS B 11.3 79.6 500 – 0.0 0.0
Lane 2 0 0 142 142 1.0 1731
0.822 100 35.8 LOS D 4.5 31.6 21 Turn Bay 0.0 42.5
Approach 383 0 142 525 1.0 0.822 24.2 LOS C 11.3 79.6
West: Kensington Road
Lane 1 62 0 0 62 3.0 1041
0.600 100 46.0 LOS D 2.7 19.6 20 Parking 0.0 3.0
Lane 2 1340
0 187 321 3.0 309 1.038 100 118.2 LOS F 26.6 191.2 500 – 0.0 0.0
Approach 196 0 187 383 3.0 1.038 106.4 LOS F 26.6 191.2
Intersection 1408 1.9 1.038 54.2 LOS D 26.6 191.2
Level of Service (LOS) Method: Delay (HCM 2000).
Lane LOS values are based on average delay per lane.
Intersection and Approach LOS values are based on average delay for all lanes.
SIDRA Standard Delay Model used.
0 Excess flow from back of an adjacent short lane
1 Reduced capacity due to a short lane effect
Processed: Monday, 24 November 2014 5:39:25 PMSIDRA INTERSECTION 5.1.13.2093
Copyright © 2000-2011 Akcelik and Associates Pty Ltdwww.sidrasolutions.com
Project: P:\14M2300-2399\14M2307000 West Melbourne Waterfront Presentation\Modelling\Kensington Road & Epsom Road & Macaulay Road.sip8000056, GTA CONSULTANTS, ENTERPRISE
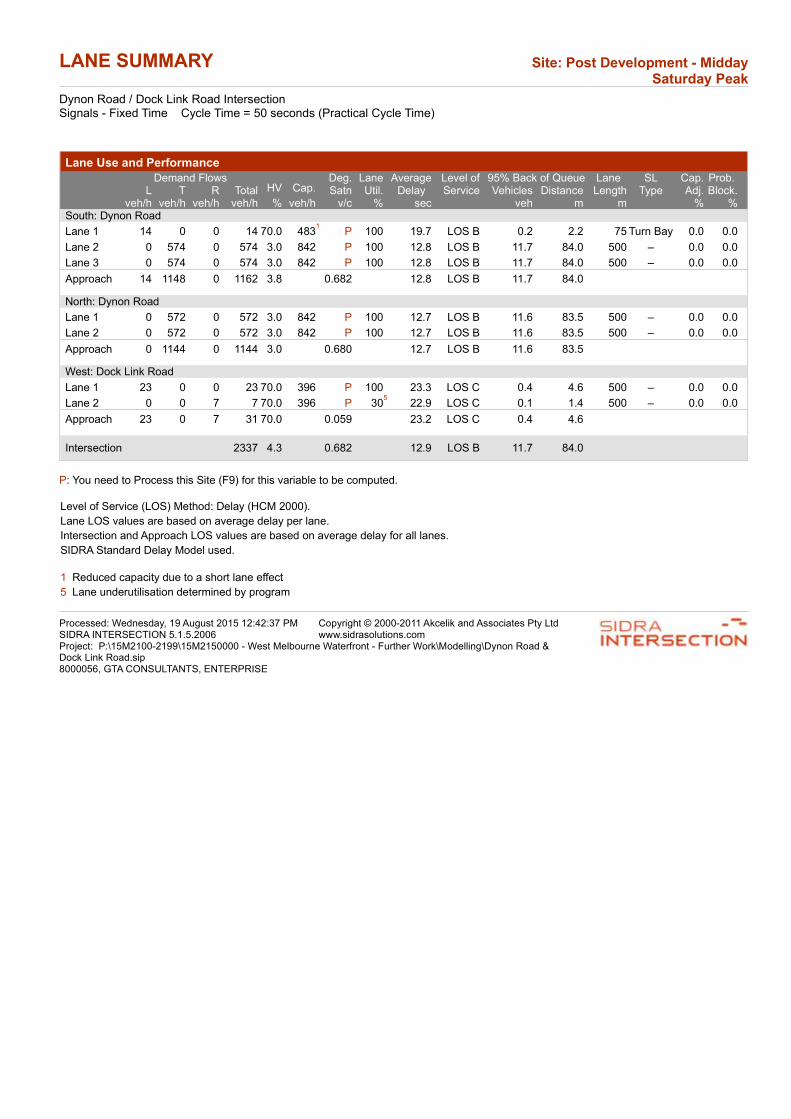
LANE SUMMARY Site: Post Development - Midday Saturday Peak
Dynon Road / Dock Link Road IntersectionSignals - Fixed Time Cycle Time = 50 seconds (Practical Cycle Time)
Lane Use and PerformanceDemand Flows 95% Back of Queue
HV Cap.Deg.Satn
LaneUtil.
AverageDelay
Level ofService
Lane Length
SL Type
Cap.Adj.
Prob. Block.L T R Total Vehicles Distance
veh/h veh/h veh/h veh/h % veh/h v/c % sec veh m m % %South: Dynon Road
Lane 1 14 0 0 14 70.0 4831
P 100 19.7 LOS B 0.2 2.2 75 Turn Bay 0.0 0.0
Lane 2 0 574 0 574 3.0 842 P 100 12.8 LOS B 11.7 84.0 500 – 0.0 0.0
Lane 3 0 574 0 574 3.0 842 P 100 12.8 LOS B 11.7 84.0 500 – 0.0 0.0
Approach 14 1148 0 1162 3.8 0.682 12.8 LOS B 11.7 84.0
North: Dynon Road
Lane 1 0 572 0 572 3.0 842 P 100 12.7 LOS B 11.6 83.5 500 – 0.0 0.0
Lane 2 0 572 0 572 3.0 842 P 100 12.7 LOS B 11.6 83.5 500 – 0.0 0.0
Approach 0 1144 0 1144 3.0 0.680 12.7 LOS B 11.6 83.5
West: Dock Link Road
Lane 1 23 0 0 23 70.0 396 P 100 23.3 LOS C 0.4 4.6 500 – 0.0 0.0
Lane 2 0 0 7 7 70.0 396 P 305
22.9 LOS C 0.1 1.4 500 – 0.0 0.0
Approach 23 0 7 31 70.0 0.059 23.2 LOS C 0.4 4.6
Intersection 2337 4.3 0.682 12.9 LOS B 11.7 84.0
P: You need to Process this Site (F9) for this variable to be computed.
Level of Service (LOS) Method: Delay (HCM 2000).
Lane LOS values are based on average delay per lane.
Intersection and Approach LOS values are based on average delay for all lanes.
SIDRA Standard Delay Model used.
1 Reduced capacity due to a short lane effect
5 Lane underutilisation determined by program
Processed: Wednesday, 19 August 2015 12:42:37 PMSIDRA INTERSECTION 5.1.5.2006
Copyright © 2000-2011 Akcelik and Associates Pty Ltdwww.sidrasolutions.com
Project: P:\15M2100-2199\15M2150000 - West Melbourne Waterfront - Further Work\Modelling\Dynon Road & Dock Link Road.sip8000056, GTA CONSULTANTS, ENTERPRISE
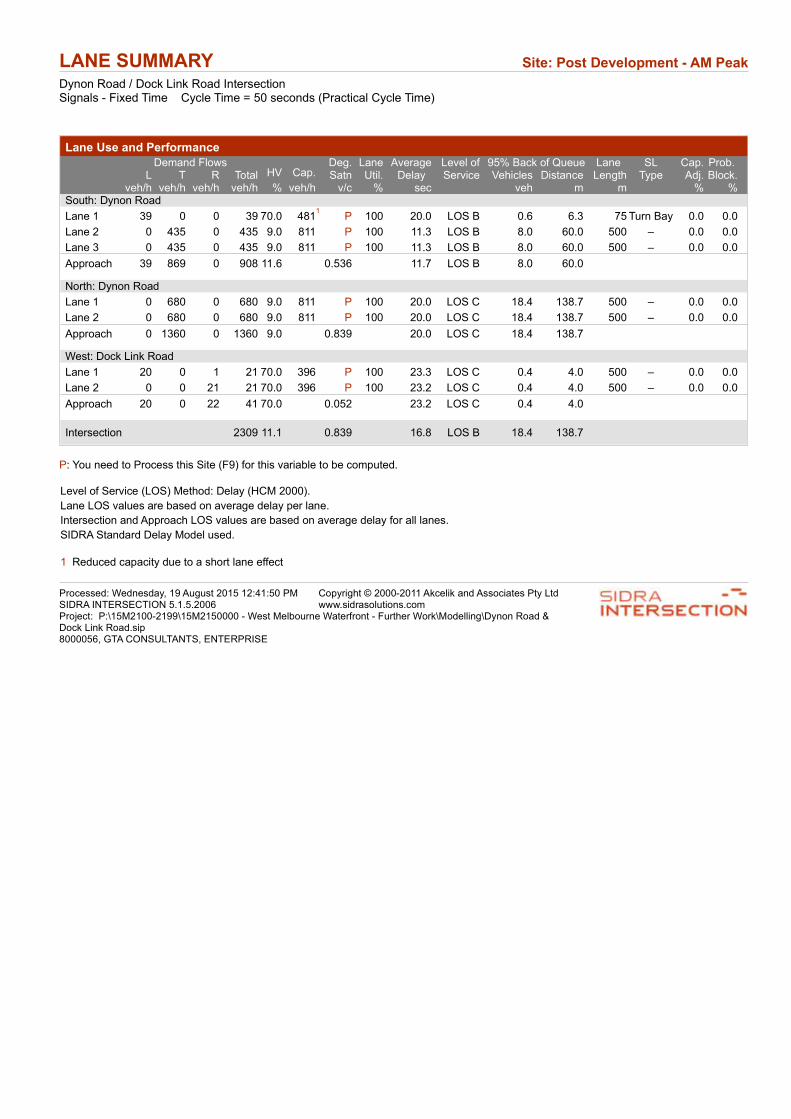
LANE SUMMARY Site: Post Development - AM Peak
Dynon Road / Dock Link Road IntersectionSignals - Fixed Time Cycle Time = 50 seconds (Practical Cycle Time)
Lane Use and PerformanceDemand Flows 95% Back of Queue
HV Cap.Deg.Satn
LaneUtil.
AverageDelay
Level ofService
Lane Length
SL Type
Cap.Adj.
Prob. Block.L T R Total Vehicles Distance
veh/h veh/h veh/h veh/h % veh/h v/c % sec veh m m % %South: Dynon Road
Lane 1 39 0 0 39 70.0 4811
P 100 20.0 LOS B 0.6 6.3 75 Turn Bay 0.0 0.0
Lane 2 0 435 0 435 9.0 811 P 100 11.3 LOS B 8.0 60.0 500 – 0.0 0.0
Lane 3 0 435 0 435 9.0 811 P 100 11.3 LOS B 8.0 60.0 500 – 0.0 0.0
Approach 39 869 0 908 11.6 0.536 11.7 LOS B 8.0 60.0
North: Dynon Road
Lane 1 0 680 0 680 9.0 811 P 100 20.0 LOS C 18.4 138.7 500 – 0.0 0.0
Lane 2 0 680 0 680 9.0 811 P 100 20.0 LOS C 18.4 138.7 500 – 0.0 0.0
Approach 0 1360 0 1360 9.0 0.839 20.0 LOS C 18.4 138.7
West: Dock Link Road
Lane 1 20 0 1 21 70.0 396 P 100 23.3 LOS C 0.4 4.0 500 – 0.0 0.0
Lane 2 0 0 21 21 70.0 396 P 100 23.2 LOS C 0.4 4.0 500 – 0.0 0.0
Approach 20 0 22 41 70.0 0.052 23.2 LOS C 0.4 4.0
Intersection 2309 11.1 0.839 16.8 LOS B 18.4 138.7
P: You need to Process this Site (F9) for this variable to be computed.
Level of Service (LOS) Method: Delay (HCM 2000).
Lane LOS values are based on average delay per lane.
Intersection and Approach LOS values are based on average delay for all lanes.
SIDRA Standard Delay Model used.
1 Reduced capacity due to a short lane effect
Processed: Wednesday, 19 August 2015 12:41:50 PMSIDRA INTERSECTION 5.1.5.2006
Copyright © 2000-2011 Akcelik and Associates Pty Ltdwww.sidrasolutions.com
Project: P:\15M2100-2199\15M2150000 - West Melbourne Waterfront - Further Work\Modelling\Dynon Road & Dock Link Road.sip8000056, GTA CONSULTANTS, ENTERPRISE
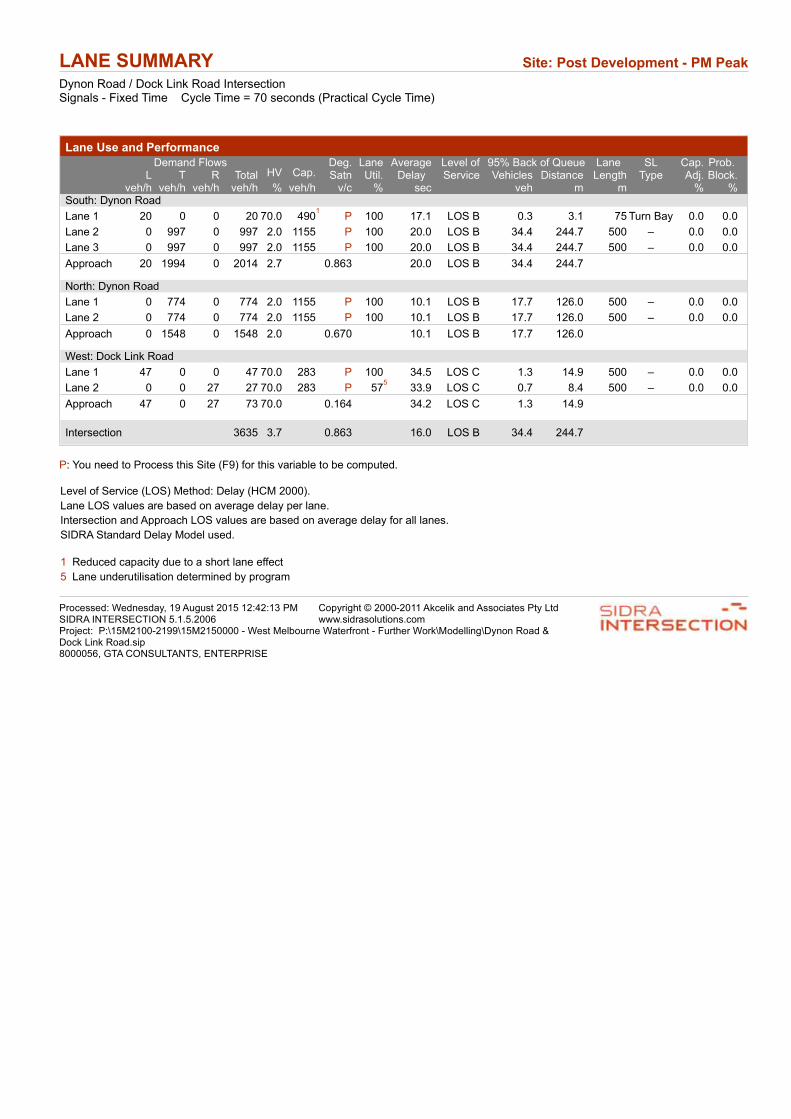
LANE SUMMARY Site: Post Development - PM Peak
Dynon Road / Dock Link Road IntersectionSignals - Fixed Time Cycle Time = 70 seconds (Practical Cycle Time)
Lane Use and PerformanceDemand Flows 95% Back of Queue
HV Cap.Deg.Satn
LaneUtil.
AverageDelay
Level ofService
Lane Length
SL Type
Cap.Adj.
Prob. Block.L T R Total Vehicles Distance
veh/h veh/h veh/h veh/h % veh/h v/c % sec veh m m % %South: Dynon Road
Lane 1 20 0 0 20 70.0 4901
P 100 17.1 LOS B 0.3 3.1 75 Turn Bay 0.0 0.0
Lane 2 0 997 0 997 2.0 1155 P 100 20.0 LOS B 34.4 244.7 500 – 0.0 0.0
Lane 3 0 997 0 997 2.0 1155 P 100 20.0 LOS B 34.4 244.7 500 – 0.0 0.0
Approach 20 1994 0 2014 2.7 0.863 20.0 LOS B 34.4 244.7
North: Dynon Road
Lane 1 0 774 0 774 2.0 1155 P 100 10.1 LOS B 17.7 126.0 500 – 0.0 0.0
Lane 2 0 774 0 774 2.0 1155 P 100 10.1 LOS B 17.7 126.0 500 – 0.0 0.0
Approach 0 1548 0 1548 2.0 0.670 10.1 LOS B 17.7 126.0
West: Dock Link Road
Lane 1 47 0 0 47 70.0 283 P 100 34.5 LOS C 1.3 14.9 500 – 0.0 0.0
Lane 2 0 0 27 27 70.0 283 P 575
33.9 LOS C 0.7 8.4 500 – 0.0 0.0
Approach 47 0 27 73 70.0 0.164 34.2 LOS C 1.3 14.9
Intersection 3635 3.7 0.863 16.0 LOS B 34.4 244.7
P: You need to Process this Site (F9) for this variable to be computed.
Level of Service (LOS) Method: Delay (HCM 2000).
Lane LOS values are based on average delay per lane.
Intersection and Approach LOS values are based on average delay for all lanes.
SIDRA Standard Delay Model used.
1 Reduced capacity due to a short lane effect
5 Lane underutilisation determined by program
Processed: Wednesday, 19 August 2015 12:42:13 PMSIDRA INTERSECTION 5.1.5.2006
Copyright © 2000-2011 Akcelik and Associates Pty Ltdwww.sidrasolutions.com
Project: P:\15M2100-2199\15M2150000 - West Melbourne Waterfront - Further Work\Modelling\Dynon Road & Dock Link Road.sip8000056, GTA CONSULTANTS, ENTERPRISE
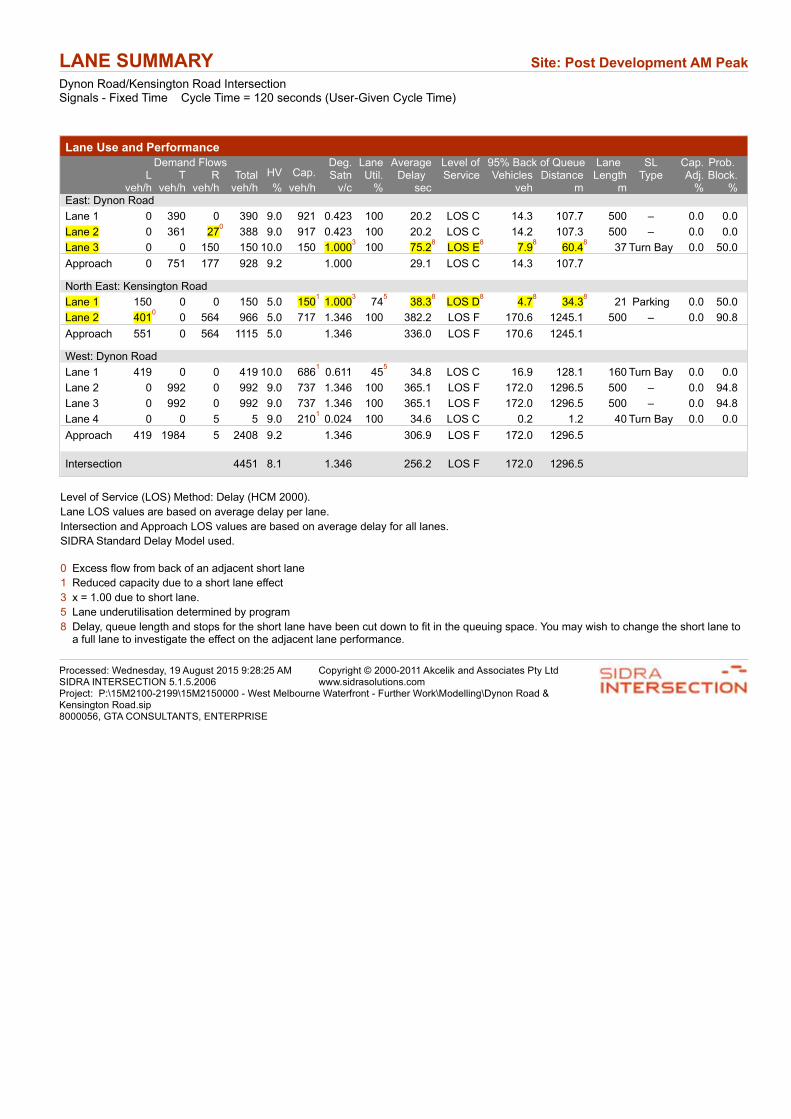
LANE SUMMARY Site: Post Development AM Peak
Dynon Road/Kensington Road IntersectionSignals - Fixed Time Cycle Time = 120 seconds (User-Given Cycle Time)
Lane Use and PerformanceDemand Flows 95% Back of Queue
HV Cap.Deg.Satn
LaneUtil.
AverageDelay
Level ofService
Lane Length
SL Type
Cap.Adj.
Prob. Block.L T R Total Vehicles Distance
veh/h veh/h veh/h veh/h % veh/h v/c % sec veh m m % %East: Dynon Road
Lane 1 0 390 0 390 9.0 921 0.423 100 20.2 LOS C 14.3 107.7 500 – 0.0 0.0
Lane 2 0 361 270
388 9.0 917 0.423 100 20.2 LOS C 14.2 107.3 500 – 0.0 0.0
Lane 3 0 0 150 150 10.0 150 1.0003
100 75.28
LOS E8
7.98
60.48
37 Turn Bay 0.0 50.0
Approach 0 751 177 928 9.2 1.000 29.1 LOS C 14.3 107.7
North East: Kensington Road
Lane 1 150 0 0 150 5.0 1501
1.0003
745
38.38
LOS D8
4.78
34.38
21 Parking 0.0 50.0
Lane 2 4010
0 564 966 5.0 717 1.346 100 382.2 LOS F 170.6 1245.1 500 – 0.0 90.8
Approach 551 0 564 1115 5.0 1.346 336.0 LOS F 170.6 1245.1
West: Dynon Road
Lane 1 419 0 0 419 10.0 6861
0.611 455
34.8 LOS C 16.9 128.1 160 Turn Bay 0.0 0.0
Lane 2 0 992 0 992 9.0 737 1.346 100 365.1 LOS F 172.0 1296.5 500 – 0.0 94.8
Lane 3 0 992 0 992 9.0 737 1.346 100 365.1 LOS F 172.0 1296.5 500 – 0.0 94.8
Lane 4 0 0 5 5 9.0 2101
0.024 100 34.6 LOS C 0.2 1.2 40 Turn Bay 0.0 0.0
Approach 419 1984 5 2408 9.2 1.346 306.9 LOS F 172.0 1296.5
Intersection 4451 8.1 1.346 256.2 LOS F 172.0 1296.5
Level of Service (LOS) Method: Delay (HCM 2000).
Lane LOS values are based on average delay per lane.
Intersection and Approach LOS values are based on average delay for all lanes.
SIDRA Standard Delay Model used.
0 Excess flow from back of an adjacent short lane
1 Reduced capacity due to a short lane effect
3 x = 1.00 due to short lane.
5 Lane underutilisation determined by program
8 Delay, queue length and stops for the short lane have been cut down to fit in the queuing space. You may wish to change the short lane to a full lane to investigate the effect on the adjacent lane performance.
Processed: Wednesday, 19 August 2015 9:28:25 AMSIDRA INTERSECTION 5.1.5.2006
Copyright © 2000-2011 Akcelik and Associates Pty Ltdwww.sidrasolutions.com
Project: P:\15M2100-2199\15M2150000 - West Melbourne Waterfront - Further Work\Modelling\Dynon Road & Kensington Road.sip8000056, GTA CONSULTANTS, ENTERPRISE

LANE SUMMARY Site: Post Development PM Peak
Dynon Road/Kensington Road IntersectionSignals - Fixed Time Cycle Time = 120 seconds (User-Given Cycle Time)
Lane Use and PerformanceDemand Flows 95% Back of Queue
HV Cap.Deg.Satn
LaneUtil.
AverageDelay
Level ofService
Lane Length
SL Type
Cap.Adj.
Prob. Block.L T R Total Vehicles Distance
veh/h veh/h veh/h veh/h % veh/h v/c % sec veh m m % %East: Dynon Road
Lane 1 0 1012 0 1012 2.0 1171 0.864 100 23.7 LOS C 51.1 363.6 500 – 0.0 0.0
Lane 2 0 944 640
1009 2.0 1167 0.864 100 23.8 LOS C 51.0 362.8 500 – 0.0 0.0
Lane 3 0 0 262 262 2.0 2621
1.0003
100 32.58
LOS C8
8.58
60.58
37 Turn Bay 0.0 50.2
Approach 0 1957 326 2283 2.0 1.000 24.8 LOS C 51.1 363.6
North East: Kensington Road
Lane 1 196 0 0 196 2.0 1961
1.0003
995
31.28
LOS C8
4.88
34.38
21 Parking 0.0 50.0
Lane 2 640
0 476 539 2.0 534 1.010 100 107.8 LOS F 48.1 342.5 500 – 0.0 0.0
Approach 260 0 476 735 2.0 1.010 87.4 LOS F 48.1 342.5
West: Dynon Road
Lane 1 492 0 0 492 2.0 519 0.948 100 78.7 LOS E 36.7 261.1 160 Turn Bay 0.0 50.0
Lane 2 230
485 0 508 2.0 545 0.932 985
69.2 LOS E 36.2 257.4 500 – 0.0 0.0
Lane 3 0 508 0 508 2.0 545 0.932 985
65.5 LOS E 36.2 257.4 500 – 0.0 0.0
Lane 4 0 0 36 36 2.0 84 0.435 100 62.5 LOS E 2.1 14.9 40 Turn Bay 0.0 0.0
Approach 515 993 36 1544 2.0 0.948 70.9 LOS E 36.7 261.1
Intersection 4563 2.0 1.010 50.0 LOS D 51.1 363.6
Level of Service (LOS) Method: Delay (HCM 2000).
Lane LOS values are based on average delay per lane.
Intersection and Approach LOS values are based on average delay for all lanes.
SIDRA Standard Delay Model used.
0 Excess flow from back of an adjacent short lane
1 Reduced capacity due to a short lane effect
3 x = 1.00 due to short lane.
5 Lane underutilisation determined by program
8 Delay, queue length and stops for the short lane have been cut down to fit in the queuing space. You may wish to change the short lane to a full lane to investigate the effect on the adjacent lane performance.
Processed: Wednesday, 19 August 2015 9:32:29 AMSIDRA INTERSECTION 5.1.5.2006
Copyright © 2000-2011 Akcelik and Associates Pty Ltdwww.sidrasolutions.com
Project: P:\15M2100-2199\15M2150000 - West Melbourne Waterfront - Further Work\Modelling\Dynon Road & Kensington Road.sip8000056, GTA CONSULTANTS, ENTERPRISE
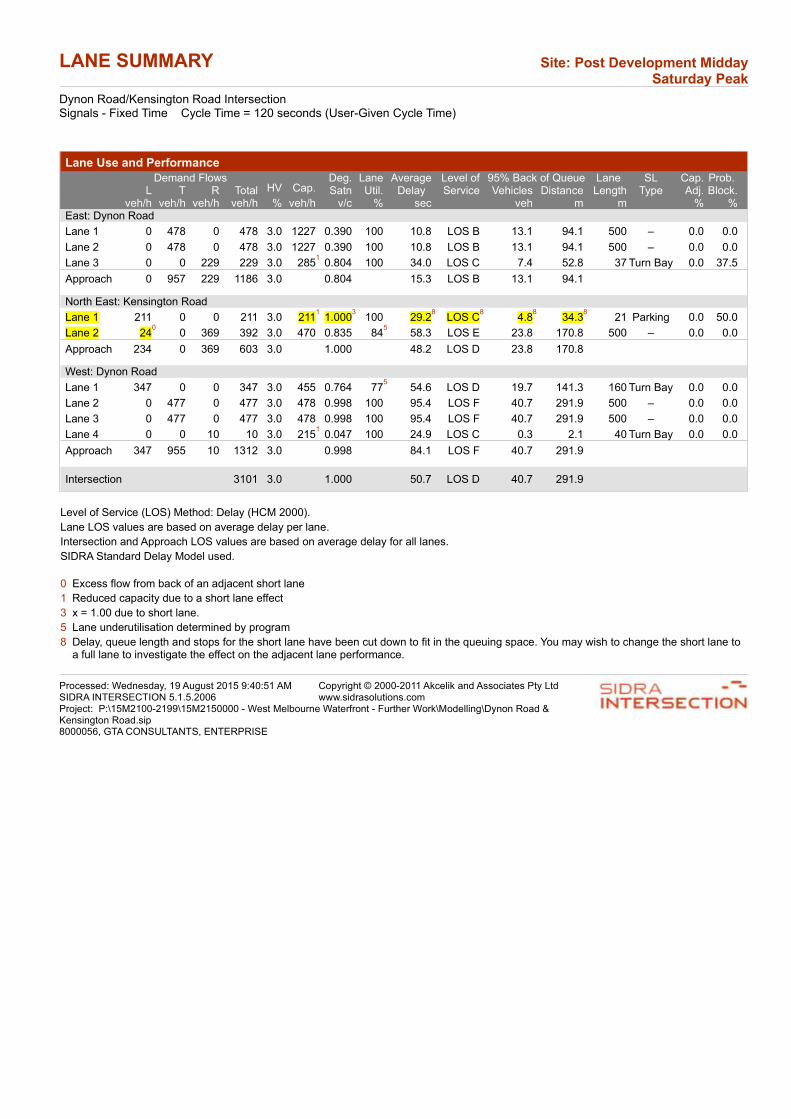
LANE SUMMARY Site: Post Development Midday Saturday Peak
Dynon Road/Kensington Road IntersectionSignals - Fixed Time Cycle Time = 120 seconds (User-Given Cycle Time)
Lane Use and PerformanceDemand Flows 95% Back of Queue
HV Cap.Deg.Satn
LaneUtil.
AverageDelay
Level ofService
Lane Length
SL Type
Cap.Adj.
Prob. Block.L T R Total Vehicles Distance
veh/h veh/h veh/h veh/h % veh/h v/c % sec veh m m % %East: Dynon Road
Lane 1 0 478 0 478 3.0 1227 0.390 100 10.8 LOS B 13.1 94.1 500 – 0.0 0.0
Lane 2 0 478 0 478 3.0 1227 0.390 100 10.8 LOS B 13.1 94.1 500 – 0.0 0.0
Lane 3 0 0 229 229 3.0 2851
0.804 100 34.0 LOS C 7.4 52.8 37 Turn Bay 0.0 37.5
Approach 0 957 229 1186 3.0 0.804 15.3 LOS B 13.1 94.1
North East: Kensington Road
Lane 1 211 0 0 211 3.0 2111
1.0003
100 29.28
LOS C8
4.88
34.38
21 Parking 0.0 50.0
Lane 2 240
0 369 392 3.0 470 0.835 845
58.3 LOS E 23.8 170.8 500 – 0.0 0.0
Approach 234 0 369 603 3.0 1.000 48.2 LOS D 23.8 170.8
West: Dynon Road
Lane 1 347 0 0 347 3.0 455 0.764 775
54.6 LOS D 19.7 141.3 160 Turn Bay 0.0 0.0
Lane 2 0 477 0 477 3.0 478 0.998 100 95.4 LOS F 40.7 291.9 500 – 0.0 0.0
Lane 3 0 477 0 477 3.0 478 0.998 100 95.4 LOS F 40.7 291.9 500 – 0.0 0.0
Lane 4 0 0 10 10 3.0 2151
0.047 100 24.9 LOS C 0.3 2.1 40 Turn Bay 0.0 0.0
Approach 347 955 10 1312 3.0 0.998 84.1 LOS F 40.7 291.9
Intersection 3101 3.0 1.000 50.7 LOS D 40.7 291.9
Level of Service (LOS) Method: Delay (HCM 2000).
Lane LOS values are based on average delay per lane.
Intersection and Approach LOS values are based on average delay for all lanes.
SIDRA Standard Delay Model used.
0 Excess flow from back of an adjacent short lane
1 Reduced capacity due to a short lane effect
3 x = 1.00 due to short lane.
5 Lane underutilisation determined by program
8 Delay, queue length and stops for the short lane have been cut down to fit in the queuing space. You may wish to change the short lane to a full lane to investigate the effect on the adjacent lane performance.
Processed: Wednesday, 19 August 2015 9:40:51 AMSIDRA INTERSECTION 5.1.5.2006
Copyright © 2000-2011 Akcelik and Associates Pty Ltdwww.sidrasolutions.com
Project: P:\15M2100-2199\15M2150000 - West Melbourne Waterfront - Further Work\Modelling\Dynon Road & Kensington Road.sip8000056, GTA CONSULTANTS, ENTERPRISE
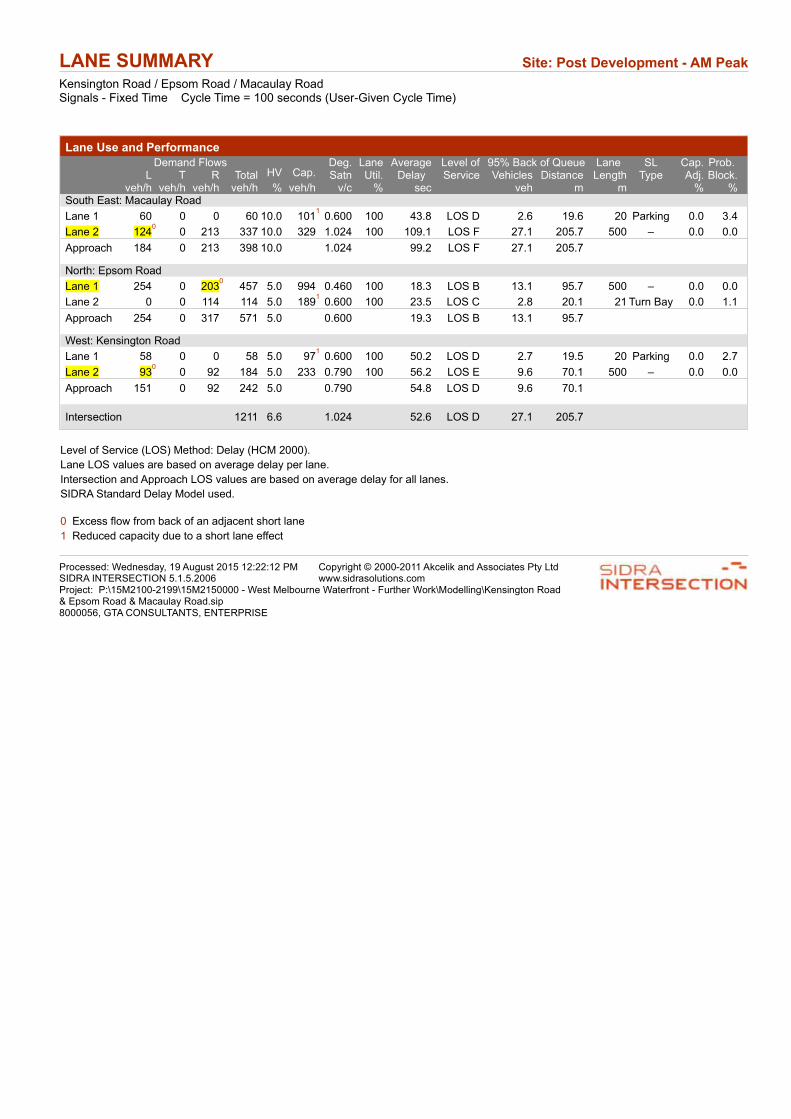
LANE SUMMARY Site: Post Development - AM Peak
Kensington Road / Epsom Road / Macaulay RoadSignals - Fixed Time Cycle Time = 100 seconds (User-Given Cycle Time)
Lane Use and PerformanceDemand Flows 95% Back of Queue
HV Cap.Deg.Satn
LaneUtil.
AverageDelay
Level ofService
Lane Length
SL Type
Cap.Adj.
Prob. Block.L T R Total Vehicles Distance
veh/h veh/h veh/h veh/h % veh/h v/c % sec veh m m % %South East: Macaulay Road
Lane 1 60 0 0 60 10.0 1011
0.600 100 43.8 LOS D 2.6 19.6 20 Parking 0.0 3.4
Lane 2 1240
0 213 337 10.0 329 1.024 100 109.1 LOS F 27.1 205.7 500 – 0.0 0.0
Approach 184 0 213 398 10.0 1.024 99.2 LOS F 27.1 205.7
North: Epsom Road
Lane 1 254 0 2030
457 5.0 994 0.460 100 18.3 LOS B 13.1 95.7 500 – 0.0 0.0
Lane 2 0 0 114 114 5.0 1891
0.600 100 23.5 LOS C 2.8 20.1 21 Turn Bay 0.0 1.1
Approach 254 0 317 571 5.0 0.600 19.3 LOS B 13.1 95.7
West: Kensington Road
Lane 1 58 0 0 58 5.0 971
0.600 100 50.2 LOS D 2.7 19.5 20 Parking 0.0 2.7
Lane 2 930
0 92 184 5.0 233 0.790 100 56.2 LOS E 9.6 70.1 500 – 0.0 0.0
Approach 151 0 92 242 5.0 0.790 54.8 LOS D 9.6 70.1
Intersection 1211 6.6 1.024 52.6 LOS D 27.1 205.7
Level of Service (LOS) Method: Delay (HCM 2000).
Lane LOS values are based on average delay per lane.
Intersection and Approach LOS values are based on average delay for all lanes.
SIDRA Standard Delay Model used.
0 Excess flow from back of an adjacent short lane
1 Reduced capacity due to a short lane effect
Processed: Wednesday, 19 August 2015 12:22:12 PMSIDRA INTERSECTION 5.1.5.2006
Copyright © 2000-2011 Akcelik and Associates Pty Ltdwww.sidrasolutions.com
Project: P:\15M2100-2199\15M2150000 - West Melbourne Waterfront - Further Work\Modelling\Kensington Road & Epsom Road & Macaulay Road.sip8000056, GTA CONSULTANTS, ENTERPRISE
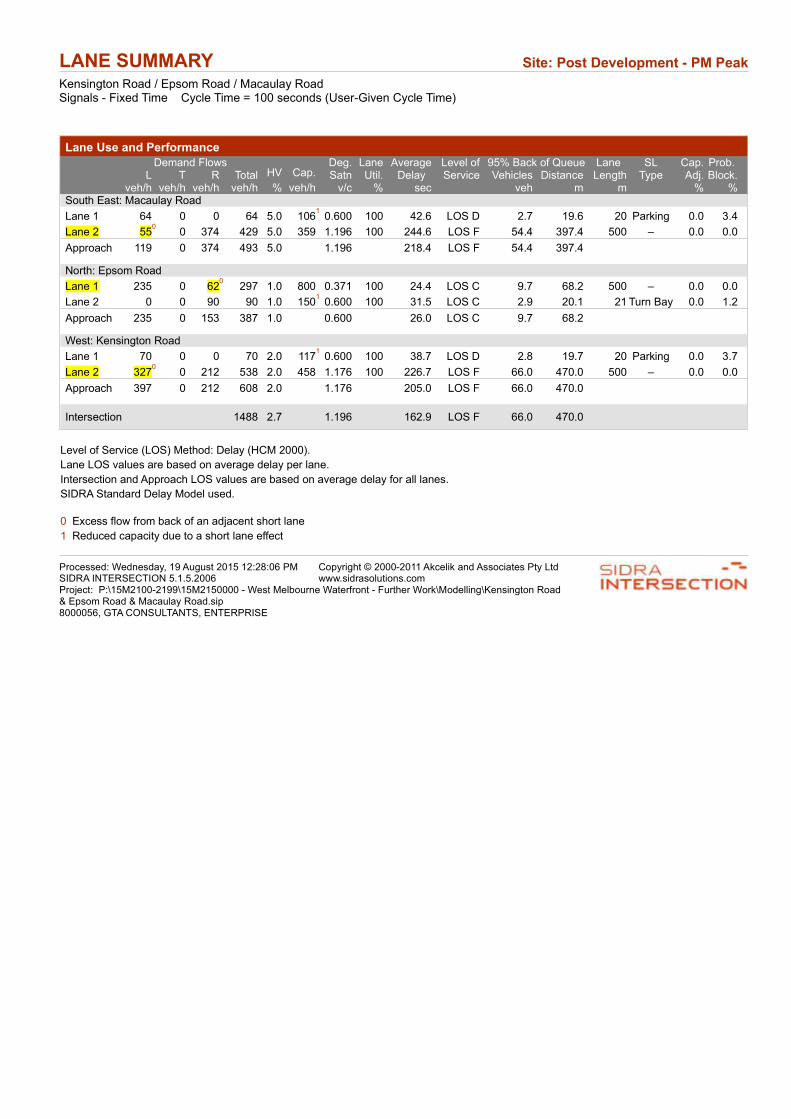
LANE SUMMARY Site: Post Development - PM Peak
Kensington Road / Epsom Road / Macaulay RoadSignals - Fixed Time Cycle Time = 100 seconds (User-Given Cycle Time)
Lane Use and PerformanceDemand Flows 95% Back of Queue
HV Cap.Deg.Satn
LaneUtil.
AverageDelay
Level ofService
Lane Length
SL Type
Cap.Adj.
Prob. Block.L T R Total Vehicles Distance
veh/h veh/h veh/h veh/h % veh/h v/c % sec veh m m % %South East: Macaulay Road
Lane 1 64 0 0 64 5.0 1061
0.600 100 42.6 LOS D 2.7 19.6 20 Parking 0.0 3.4
Lane 2 550
0 374 429 5.0 359 1.196 100 244.6 LOS F 54.4 397.4 500 – 0.0 0.0
Approach 119 0 374 493 5.0 1.196 218.4 LOS F 54.4 397.4
North: Epsom Road
Lane 1 235 0 620
297 1.0 800 0.371 100 24.4 LOS C 9.7 68.2 500 – 0.0 0.0
Lane 2 0 0 90 90 1.0 1501
0.600 100 31.5 LOS C 2.9 20.1 21 Turn Bay 0.0 1.2
Approach 235 0 153 387 1.0 0.600 26.0 LOS C 9.7 68.2
West: Kensington Road
Lane 1 70 0 0 70 2.0 1171
0.600 100 38.7 LOS D 2.8 19.7 20 Parking 0.0 3.7
Lane 2 3270
0 212 538 2.0 458 1.176 100 226.7 LOS F 66.0 470.0 500 – 0.0 0.0
Approach 397 0 212 608 2.0 1.176 205.0 LOS F 66.0 470.0
Intersection 1488 2.7 1.196 162.9 LOS F 66.0 470.0
Level of Service (LOS) Method: Delay (HCM 2000).
Lane LOS values are based on average delay per lane.
Intersection and Approach LOS values are based on average delay for all lanes.
SIDRA Standard Delay Model used.
0 Excess flow from back of an adjacent short lane
1 Reduced capacity due to a short lane effect
Processed: Wednesday, 19 August 2015 12:28:06 PMSIDRA INTERSECTION 5.1.5.2006
Copyright © 2000-2011 Akcelik and Associates Pty Ltdwww.sidrasolutions.com
Project: P:\15M2100-2199\15M2150000 - West Melbourne Waterfront - Further Work\Modelling\Kensington Road & Epsom Road & Macaulay Road.sip8000056, GTA CONSULTANTS, ENTERPRISE
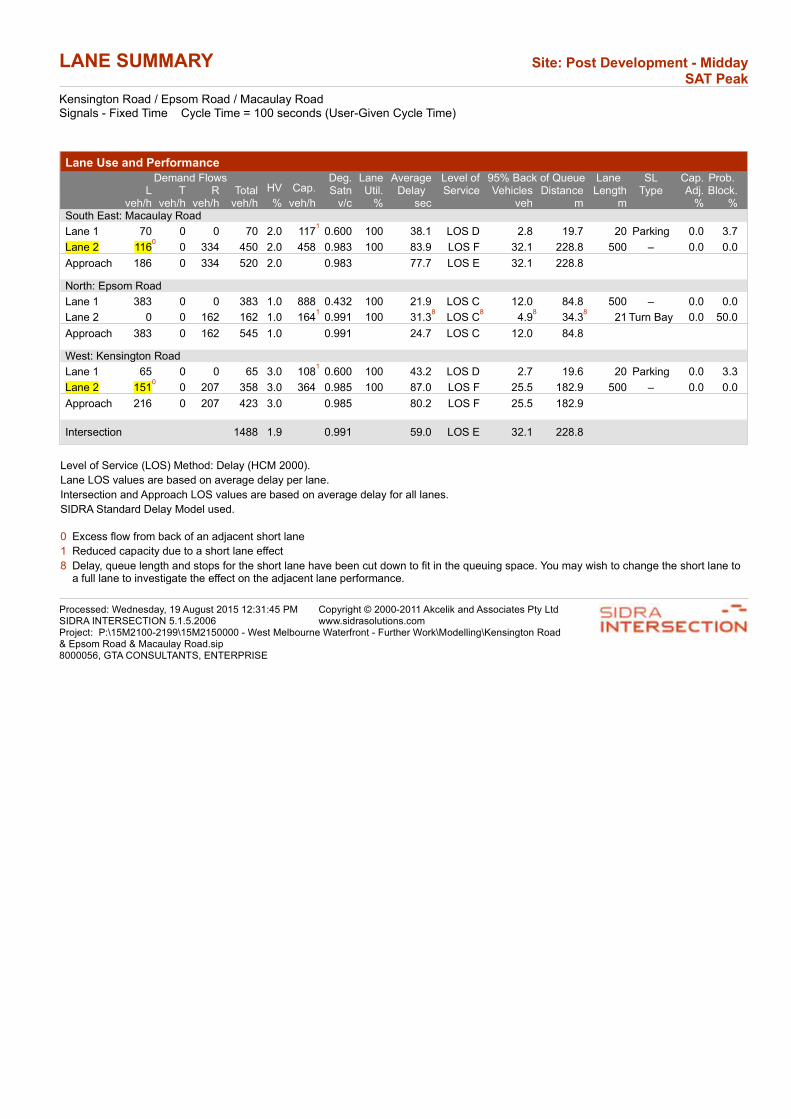
LANE SUMMARY Site: Post Development - Midday SAT Peak
Kensington Road / Epsom Road / Macaulay RoadSignals - Fixed Time Cycle Time = 100 seconds (User-Given Cycle Time)
Lane Use and PerformanceDemand Flows 95% Back of Queue
HV Cap.Deg.Satn
LaneUtil.
AverageDelay
Level ofService
Lane Length
SL Type
Cap.Adj.
Prob. Block.L T R Total Vehicles Distance
veh/h veh/h veh/h veh/h % veh/h v/c % sec veh m m % %South East: Macaulay Road
Lane 1 70 0 0 70 2.0 1171
0.600 100 38.1 LOS D 2.8 19.7 20 Parking 0.0 3.7
Lane 2 1160
0 334 450 2.0 458 0.983 100 83.9 LOS F 32.1 228.8 500 – 0.0 0.0
Approach 186 0 334 520 2.0 0.983 77.7 LOS E 32.1 228.8
North: Epsom Road
Lane 1 383 0 0 383 1.0 888 0.432 100 21.9 LOS C 12.0 84.8 500 – 0.0 0.0
Lane 2 0 0 162 162 1.0 1641
0.991 100 31.38
LOS C8
4.98
34.38
21 Turn Bay 0.0 50.0
Approach 383 0 162 545 1.0 0.991 24.7 LOS C 12.0 84.8
West: Kensington Road
Lane 1 65 0 0 65 3.0 1081
0.600 100 43.2 LOS D 2.7 19.6 20 Parking 0.0 3.3
Lane 2 1510
0 207 358 3.0 364 0.985 100 87.0 LOS F 25.5 182.9 500 – 0.0 0.0
Approach 216 0 207 423 3.0 0.985 80.2 LOS F 25.5 182.9
Intersection 1488 1.9 0.991 59.0 LOS E 32.1 228.8
Level of Service (LOS) Method: Delay (HCM 2000).
Lane LOS values are based on average delay per lane.
Intersection and Approach LOS values are based on average delay for all lanes.
SIDRA Standard Delay Model used.
0 Excess flow from back of an adjacent short lane
1 Reduced capacity due to a short lane effect
8 Delay, queue length and stops for the short lane have been cut down to fit in the queuing space. You may wish to change the short lane to a full lane to investigate the effect on the adjacent lane performance.
Processed: Wednesday, 19 August 2015 12:31:45 PMSIDRA INTERSECTION 5.1.5.2006
Copyright © 2000-2011 Akcelik and Associates Pty Ltdwww.sidrasolutions.com
Project: P:\15M2100-2199\15M2150000 - West Melbourne Waterfront - Further Work\Modelling\Kensington Road & Epsom Road & Macaulay Road.sip8000056, GTA CONSULTANTS, ENTERPRISE

LANE SUMMARY Site: Post Development AM Peak
Childers Street/Kensington Road/Hobsons Road IntersectionSignals - Fixed Time Cycle Time = 70 seconds (Optimum Cycle Time - Minimum Delay)
Lane Use and PerformanceDemand Flows 95% Back of Queue
HV Cap.Deg.Satn
LaneUtil.
AverageDelay
Level ofService
Lane Length
SL Type
Cap.Adj.
Prob. Block.L T R Total Vehicles Distance
veh/h veh/h veh/h veh/h % veh/h v/c % sec veh m m % %South: Childers Road
Lane 1 14 10 10 34 2.0 506 0.068 100 20.7 LOS C 0.8 5.6 500 – 0.0 0.0
Approach 14 10 10 34 2.0 0.068 20.7 LOS C 0.8 5.6
East: Kensington Road
Lane 1 130 0 0 130 2.0 2801
0.465 100 17.8 LOS B 2.5 18.0 26 Parking 0.0 0.0
Lane 2 0 700 16 716 5.0 880 0.813 100 21.5 LOS C 23.6 172.6 500 – 0.0 0.0
Approach 130 700 16 846 4.5 0.813 20.9 LOS C 23.6 172.6
North: Hobsons Road
Lane 1 14 0 0 14 5.0 1241
0.109 100 22.1 LOS C 0.3 2.2 13 Parking 0.0 0.0
Lane 2 0 118 277 395 5.0 454 0.869 100 40.2 LOS D 16.4 119.8 500 – 0.0 0.0
Approach 14 118 277 408 5.0 0.869 39.6 LOS D 16.4 119.8
West: Kensington Road
Lane 1 32 26 0 58 7.2 3461
0.167 206
14.5 LOS B 1.1 8.0 35 Turn Bay 0.0 0.0
Lane 2 0 145 92 237 6.9 284 0.835 100 39.8 LOS D 9.4 69.6 500 – 0.0 0.0
Approach 32 171 92 295 7.0 0.835 34.8 LOS C 9.4 69.6
Intersection 1583 5.1 0.869 28.3 LOS C 23.6 172.6
Level of Service (LOS) Method: Delay (HCM 2000).
Lane LOS values are based on average delay per lane.
Intersection and Approach LOS values are based on average delay for all lanes.
SIDRA Standard Delay Model used.
1 Reduced capacity due to a short lane effect
6 Lane underutilisation due to downstream effects
Processed: Wednesday, 19 August 2015 11:41:38 AMSIDRA INTERSECTION 5.1.5.2006
Copyright © 2000-2011 Akcelik and Associates Pty Ltdwww.sidrasolutions.com
Project: P:\15M2100-2199\15M2150000 - West Melbourne Waterfront - Further Work\Modelling\Childers Street & Kensington Road & Hobsons Road.sip8000056, GTA CONSULTANTS, ENTERPRISE
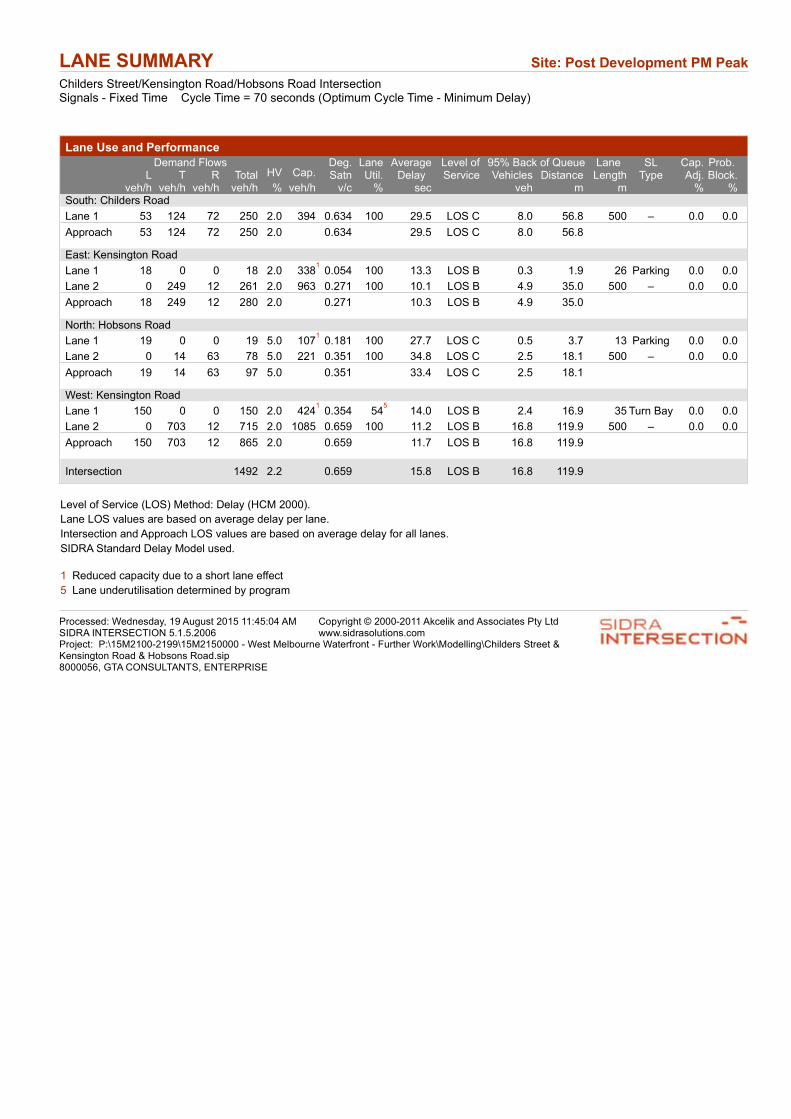
LANE SUMMARY Site: Post Development PM Peak
Childers Street/Kensington Road/Hobsons Road IntersectionSignals - Fixed Time Cycle Time = 70 seconds (Optimum Cycle Time - Minimum Delay)
Lane Use and PerformanceDemand Flows 95% Back of Queue
HV Cap.Deg.Satn
LaneUtil.
AverageDelay
Level ofService
Lane Length
SL Type
Cap.Adj.
Prob. Block.L T R Total Vehicles Distance
veh/h veh/h veh/h veh/h % veh/h v/c % sec veh m m % %South: Childers Road
Lane 1 53 124 72 250 2.0 394 0.634 100 29.5 LOS C 8.0 56.8 500 – 0.0 0.0
Approach 53 124 72 250 2.0 0.634 29.5 LOS C 8.0 56.8
East: Kensington Road
Lane 1 18 0 0 18 2.0 3381
0.054 100 13.3 LOS B 0.3 1.9 26 Parking 0.0 0.0
Lane 2 0 249 12 261 2.0 963 0.271 100 10.1 LOS B 4.9 35.0 500 – 0.0 0.0
Approach 18 249 12 280 2.0 0.271 10.3 LOS B 4.9 35.0
North: Hobsons Road
Lane 1 19 0 0 19 5.0 1071
0.181 100 27.7 LOS C 0.5 3.7 13 Parking 0.0 0.0
Lane 2 0 14 63 78 5.0 221 0.351 100 34.8 LOS C 2.5 18.1 500 – 0.0 0.0
Approach 19 14 63 97 5.0 0.351 33.4 LOS C 2.5 18.1
West: Kensington Road
Lane 1 150 0 0 150 2.0 4241
0.354 545
14.0 LOS B 2.4 16.9 35 Turn Bay 0.0 0.0
Lane 2 0 703 12 715 2.0 1085 0.659 100 11.2 LOS B 16.8 119.9 500 – 0.0 0.0
Approach 150 703 12 865 2.0 0.659 11.7 LOS B 16.8 119.9
Intersection 1492 2.2 0.659 15.8 LOS B 16.8 119.9
Level of Service (LOS) Method: Delay (HCM 2000).
Lane LOS values are based on average delay per lane.
Intersection and Approach LOS values are based on average delay for all lanes.
SIDRA Standard Delay Model used.
1 Reduced capacity due to a short lane effect
5 Lane underutilisation determined by program
Processed: Wednesday, 19 August 2015 11:45:04 AMSIDRA INTERSECTION 5.1.5.2006
Copyright © 2000-2011 Akcelik and Associates Pty Ltdwww.sidrasolutions.com
Project: P:\15M2100-2199\15M2150000 - West Melbourne Waterfront - Further Work\Modelling\Childers Street & Kensington Road & Hobsons Road.sip8000056, GTA CONSULTANTS, ENTERPRISE
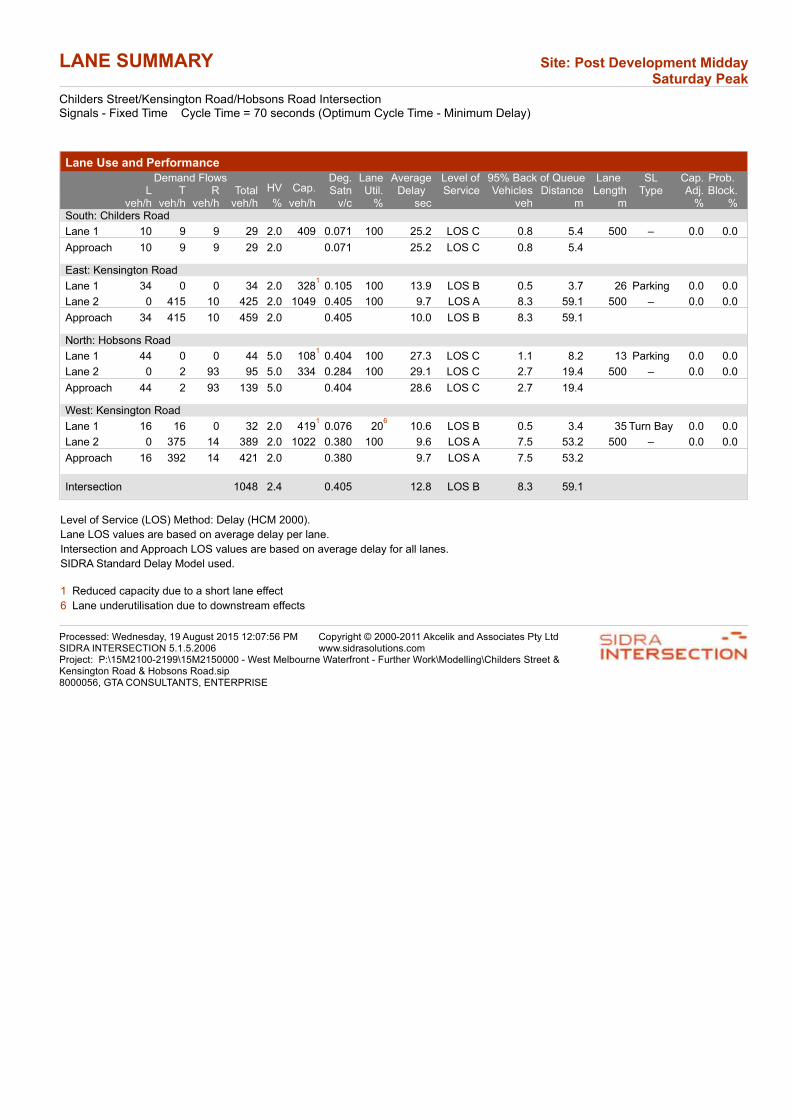
LANE SUMMARY Site: Post Development Midday Saturday Peak
Childers Street/Kensington Road/Hobsons Road IntersectionSignals - Fixed Time Cycle Time = 70 seconds (Optimum Cycle Time - Minimum Delay)
Lane Use and PerformanceDemand Flows 95% Back of Queue
HV Cap.Deg.Satn
LaneUtil.
AverageDelay
Level ofService
Lane Length
SL Type
Cap.Adj.
Prob. Block.L T R Total Vehicles Distance
veh/h veh/h veh/h veh/h % veh/h v/c % sec veh m m % %South: Childers Road
Lane 1 10 9 9 29 2.0 409 0.071 100 25.2 LOS C 0.8 5.4 500 – 0.0 0.0
Approach 10 9 9 29 2.0 0.071 25.2 LOS C 0.8 5.4
East: Kensington Road
Lane 1 34 0 0 34 2.0 3281
0.105 100 13.9 LOS B 0.5 3.7 26 Parking 0.0 0.0
Lane 2 0 415 10 425 2.0 1049 0.405 100 9.7 LOS A 8.3 59.1 500 – 0.0 0.0
Approach 34 415 10 459 2.0 0.405 10.0 LOS B 8.3 59.1
North: Hobsons Road
Lane 1 44 0 0 44 5.0 1081
0.404 100 27.3 LOS C 1.1 8.2 13 Parking 0.0 0.0
Lane 2 0 2 93 95 5.0 334 0.284 100 29.1 LOS C 2.7 19.4 500 – 0.0 0.0
Approach 44 2 93 139 5.0 0.404 28.6 LOS C 2.7 19.4
West: Kensington Road
Lane 1 16 16 0 32 2.0 4191
0.076 206
10.6 LOS B 0.5 3.4 35 Turn Bay 0.0 0.0
Lane 2 0 375 14 389 2.0 1022 0.380 100 9.6 LOS A 7.5 53.2 500 – 0.0 0.0
Approach 16 392 14 421 2.0 0.380 9.7 LOS A 7.5 53.2
Intersection 1048 2.4 0.405 12.8 LOS B 8.3 59.1
Level of Service (LOS) Method: Delay (HCM 2000).
Lane LOS values are based on average delay per lane.
Intersection and Approach LOS values are based on average delay for all lanes.
SIDRA Standard Delay Model used.
1 Reduced capacity due to a short lane effect
6 Lane underutilisation due to downstream effects
Processed: Wednesday, 19 August 2015 12:07:56 PMSIDRA INTERSECTION 5.1.5.2006
Copyright © 2000-2011 Akcelik and Associates Pty Ltdwww.sidrasolutions.com
Project: P:\15M2100-2199\15M2150000 - West Melbourne Waterfront - Further Work\Modelling\Childers Street & Kensington Road & Hobsons Road.sip8000056, GTA CONSULTANTS, ENTERPRISE
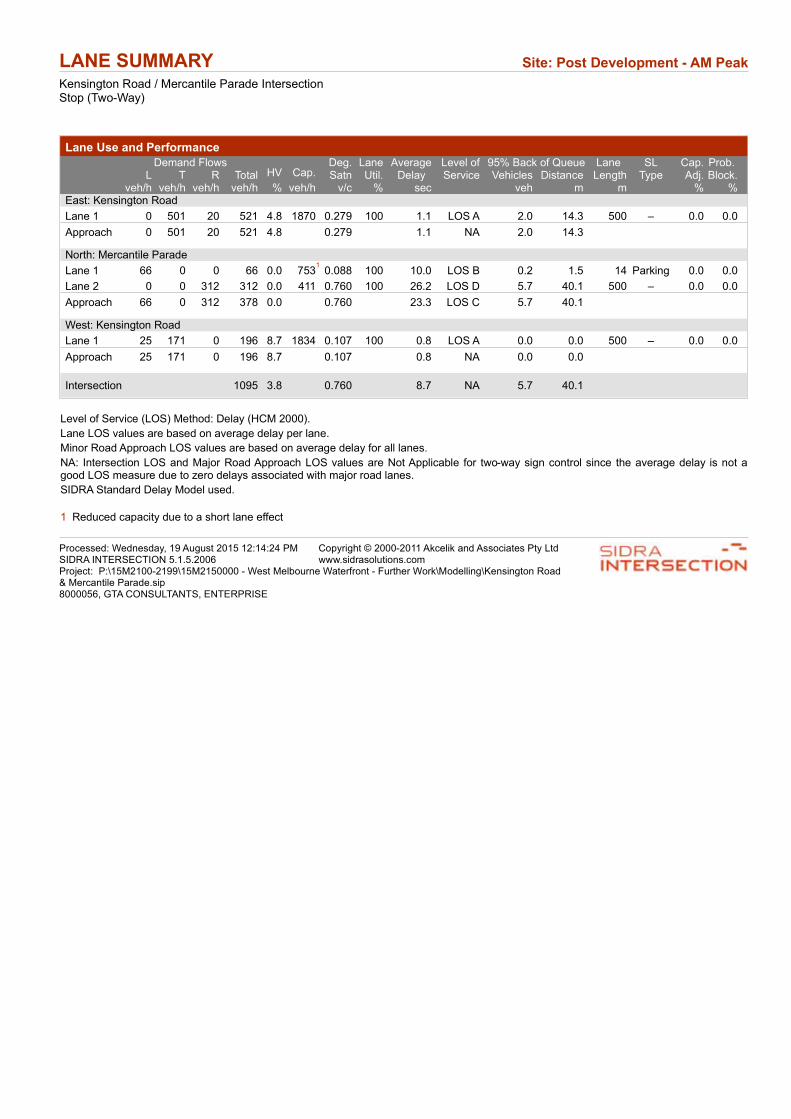
LANE SUMMARY Site: Post Development - AM Peak
Kensington Road / Mercantile Parade IntersectionStop (Two-Way)
Lane Use and PerformanceDemand Flows 95% Back of Queue
HV Cap.Deg.Satn
LaneUtil.
AverageDelay
Level ofService
Lane Length
SL Type
Cap.Adj.
Prob. Block.L T R Total Vehicles Distance
veh/h veh/h veh/h veh/h % veh/h v/c % sec veh m m % %East: Kensington Road
Lane 1 0 501 20 521 4.8 1870 0.279 100 1.1 LOS A 2.0 14.3 500 – 0.0 0.0
Approach 0 501 20 521 4.8 0.279 1.1 NA 2.0 14.3
North: Mercantile Parade
Lane 1 66 0 0 66 0.0 7531
0.088 100 10.0 LOS B 0.2 1.5 14 Parking 0.0 0.0
Lane 2 0 0 312 312 0.0 411 0.760 100 26.2 LOS D 5.7 40.1 500 – 0.0 0.0
Approach 66 0 312 378 0.0 0.760 23.3 LOS C 5.7 40.1
West: Kensington Road
Lane 1 25 171 0 196 8.7 1834 0.107 100 0.8 LOS A 0.0 0.0 500 – 0.0 0.0
Approach 25 171 0 196 8.7 0.107 0.8 NA 0.0 0.0
Intersection 1095 3.8 0.760 8.7 NA 5.7 40.1
Level of Service (LOS) Method: Delay (HCM 2000).
Lane LOS values are based on average delay per lane.
Minor Road Approach LOS values are based on average delay for all lanes.
NA: Intersection LOS and Major Road Approach LOS values are Not Applicable for two-way sign control since the average delay is not a good LOS measure due to zero delays associated with major road lanes.
SIDRA Standard Delay Model used.
1 Reduced capacity due to a short lane effect
Processed: Wednesday, 19 August 2015 12:14:24 PMSIDRA INTERSECTION 5.1.5.2006
Copyright © 2000-2011 Akcelik and Associates Pty Ltdwww.sidrasolutions.com
Project: P:\15M2100-2199\15M2150000 - West Melbourne Waterfront - Further Work\Modelling\Kensington Road & Mercantile Parade.sip8000056, GTA CONSULTANTS, ENTERPRISE

LANE SUMMARY Site: Post Development - PM Peak
Kensington Road / Mercantile Parade IntersectionStop (Two-Way)
Lane Use and PerformanceDemand Flows 95% Back of Queue
HV Cap.Deg.Satn
LaneUtil.
AverageDelay
Level ofService
Lane Length
SL Type
Cap.Adj.
Prob. Block.L T R Total Vehicles Distance
veh/h veh/h veh/h veh/h % veh/h v/c % sec veh m m % %East: Kensington Road
Lane 1 0 226 79 304 1.5 1335 0.228 100 7.2 LOS A 2.1 14.6 500 – 0.0 0.0
Approach 0 226 79 304 1.5 0.228 7.2 NA 2.1 14.6
North: Mercantile Parade
Lane 1 40 0 0 40 0.0 5501
0.072 100 13.7 LOS B 0.2 1.6 14 Parking 0.0 0.0
Lane 2 0 0 55 55 0.0 253 0.217 100 22.9 LOS C 0.7 5.0 500 – 0.0 0.0
Approach 40 0 55 95 0.0 0.217 19.0 LOS C 0.7 5.0
West: Kensington Road
Lane 1 198 592 0 790 1.5 1908 0.414 100 1.6 LOS A 0.0 0.0 500 – 0.0 0.0
Approach 198 592 0 790 1.5 0.414 1.6 NA 0.0 0.0
Intersection 1189 1.4 0.414 4.4 NA 2.1 14.6
Level of Service (LOS) Method: Delay (HCM 2000).
Lane LOS values are based on average delay per lane.
Minor Road Approach LOS values are based on average delay for all lanes.
NA: Intersection LOS and Major Road Approach LOS values are Not Applicable for two-way sign control since the average delay is not a good LOS measure due to zero delays associated with major road lanes.
SIDRA Standard Delay Model used.
1 Reduced capacity due to a short lane effect
Processed: Wednesday, 19 August 2015 12:17:28 PMSIDRA INTERSECTION 5.1.5.2006
Copyright © 2000-2011 Akcelik and Associates Pty Ltdwww.sidrasolutions.com
Project: P:\15M2100-2199\15M2150000 - West Melbourne Waterfront - Further Work\Modelling\Kensington Road & Mercantile Parade.sip8000056, GTA CONSULTANTS, ENTERPRISE
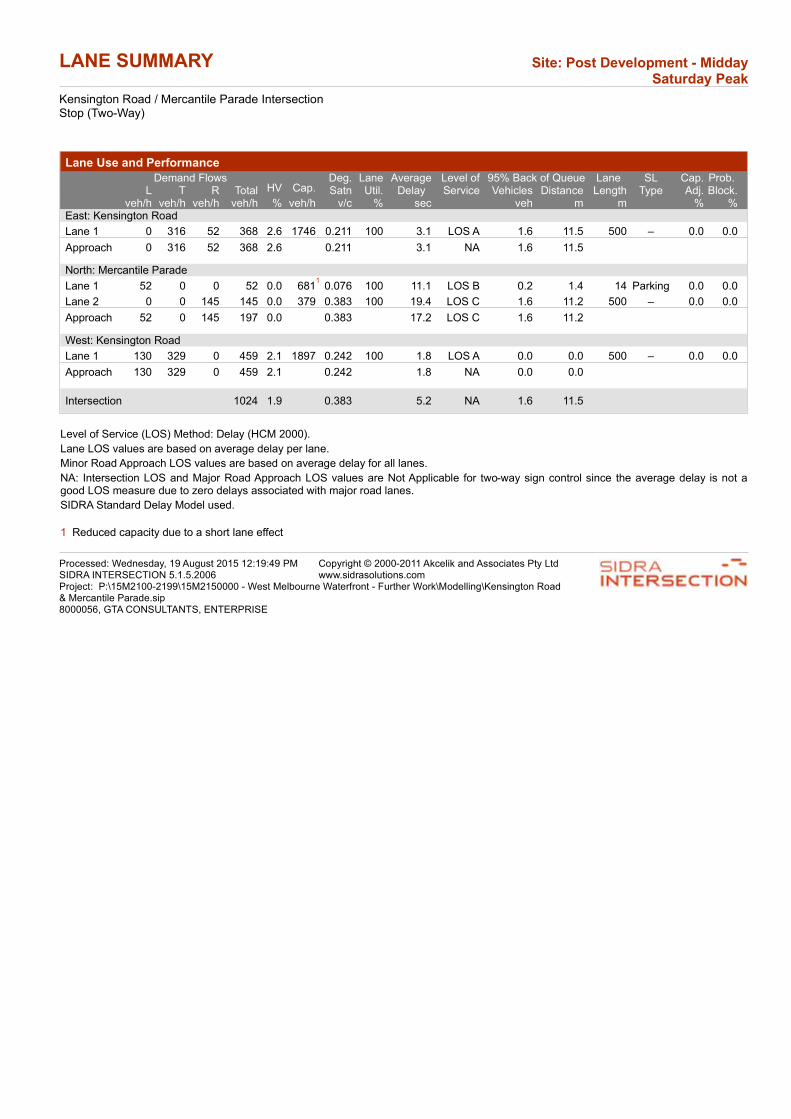
LANE SUMMARY Site: Post Development - Midday Saturday Peak
Kensington Road / Mercantile Parade IntersectionStop (Two-Way)
Lane Use and PerformanceDemand Flows 95% Back of Queue
HV Cap.Deg.Satn
LaneUtil.
AverageDelay
Level ofService
Lane Length
SL Type
Cap.Adj.
Prob. Block.L T R Total Vehicles Distance
veh/h veh/h veh/h veh/h % veh/h v/c % sec veh m m % %East: Kensington Road
Lane 1 0 316 52 368 2.6 1746 0.211 100 3.1 LOS A 1.6 11.5 500 – 0.0 0.0
Approach 0 316 52 368 2.6 0.211 3.1 NA 1.6 11.5
North: Mercantile Parade
Lane 1 52 0 0 52 0.0 6811
0.076 100 11.1 LOS B 0.2 1.4 14 Parking 0.0 0.0
Lane 2 0 0 145 145 0.0 379 0.383 100 19.4 LOS C 1.6 11.2 500 – 0.0 0.0
Approach 52 0 145 197 0.0 0.383 17.2 LOS C 1.6 11.2
West: Kensington Road
Lane 1 130 329 0 459 2.1 1897 0.242 100 1.8 LOS A 0.0 0.0 500 – 0.0 0.0
Approach 130 329 0 459 2.1 0.242 1.8 NA 0.0 0.0
Intersection 1024 1.9 0.383 5.2 NA 1.6 11.5
Level of Service (LOS) Method: Delay (HCM 2000).
Lane LOS values are based on average delay per lane.
Minor Road Approach LOS values are based on average delay for all lanes.
NA: Intersection LOS and Major Road Approach LOS values are Not Applicable for two-way sign control since the average delay is not a good LOS measure due to zero delays associated with major road lanes.
SIDRA Standard Delay Model used.
1 Reduced capacity due to a short lane effect
Processed: Wednesday, 19 August 2015 12:19:49 PMSIDRA INTERSECTION 5.1.5.2006
Copyright © 2000-2011 Akcelik and Associates Pty Ltdwww.sidrasolutions.com
Project: P:\15M2100-2199\15M2150000 - West Melbourne Waterfront - Further Work\Modelling\Kensington Road & Mercantile Parade.sip8000056, GTA CONSULTANTS, ENTERPRISE

LANE SUMMARY Site: Post Development AM Peak
Kensington Road/Site Access 1 (Site 1.1) IntersectionStop (Two-Way)
Lane Use and PerformanceDemand Flows 95% Back of Queue
HV Cap.Deg.Satn
LaneUtil.
AverageDelay
Level ofService
Lane Length
SL Type
Cap.Adj.
Prob. Block.L T R Total Vehicles Distance
veh/h veh/h veh/h veh/h % veh/h v/c % sec veh m m % %East: Kensington Road
Lane 1 0 89 0 89 5.0 1889 0.047 100 0.0 LOS A 0.0 0.0 500 – 0.0 0.0
Approach 0 89 0 89 5.0 0.047 0.0 NA 0.0 0.0
North: Site Access 1 (Site 1.1)
Lane 1 3 0 0 3 0.0 1069 0.003 100 10.5 LOS B 0.0 0.1 500 – 0.0 0.0
Approach 3 0 0 3 0.0 0.003 10.5 LOS B 0.0 0.1
West: Kensington Road
Lane 1 20 290 0 309 9.4 1833 0.169 100 0.4 LOS A 0.0 0.0 500 – 0.0 0.0
Approach 20 290 0 309 9.4 0.169 0.4 NA 0.0 0.0
Intersection 401 8.3 0.169 0.4 NA 0.0 0.1
Level of Service (LOS) Method: Delay (HCM 2000).
Lane LOS values are based on average delay per lane.
Minor Road Approach LOS values are based on average delay for all lanes.
NA: Intersection LOS and Major Road Approach LOS values are Not Applicable for two-way sign control since the average delay is not a good LOS measure due to zero delays associated with major road lanes.
SIDRA Standard Delay Model used.
Processed: Wednesday, 19 August 2015 11:03:23 AMSIDRA INTERSECTION 5.1.5.2006
Copyright © 2000-2011 Akcelik and Associates Pty Ltdwww.sidrasolutions.com
Project: P:\15M2100-2199\15M2150000 - West Melbourne Waterfront - Further Work\Modelling\Kensington Road & Site Access 1 (Site 1.1).sip8000056, GTA CONSULTANTS, ENTERPRISE

LANE SUMMARY Site: Post Development PM Peak
Kensington Road/Site Access 1 (Site 1.1) IntersectionStop (Two-Way)
Lane Use and PerformanceDemand Flows 95% Back of Queue
HV Cap.Deg.Satn
LaneUtil.
AverageDelay
Level ofService
Lane Length
SL Type
Cap.Adj.
Prob. Block.L T R Total Vehicles Distance
veh/h veh/h veh/h veh/h % veh/h v/c % sec veh m m % %East: Kensington Road
Lane 1 0 63 0 63 5.0 1889 0.033 100 0.0 LOS A 0.0 0.0 500 – 0.0 0.0
Approach 0 63 0 63 5.0 0.033 0.0 NA 0.0 0.0
North: Site Access 1 (Site 1.1)
Lane 1 20 0 0 20 0.0 472 0.043 100 15.9 LOS C 0.2 1.1 500 – 0.0 0.0
Approach 20 0 0 20 0.0 0.043 15.9 LOS C 0.2 1.1
West: Kensington Road
Lane 1 7 846 0 853 9.9 1831 0.466 100 0.1 LOS A 0.0 0.0 500 – 0.0 0.0
Approach 7 846 0 853 9.9 0.466 0.1 NA 0.0 0.0
Intersection 937 9.4 0.466 0.4 NA 0.2 1.1
Level of Service (LOS) Method: Delay (HCM 2000).
Lane LOS values are based on average delay per lane.
Minor Road Approach LOS values are based on average delay for all lanes.
NA: Intersection LOS and Major Road Approach LOS values are Not Applicable for two-way sign control since the average delay is not a good LOS measure due to zero delays associated with major road lanes.
SIDRA Standard Delay Model used.
Processed: Wednesday, 19 August 2015 11:14:41 AMSIDRA INTERSECTION 5.1.5.2006
Copyright © 2000-2011 Akcelik and Associates Pty Ltdwww.sidrasolutions.com
Project: P:\15M2100-2199\15M2150000 - West Melbourne Waterfront - Further Work\Modelling\Kensington Road & Site Access 1 (Site 1.1).sip8000056, GTA CONSULTANTS, ENTERPRISE
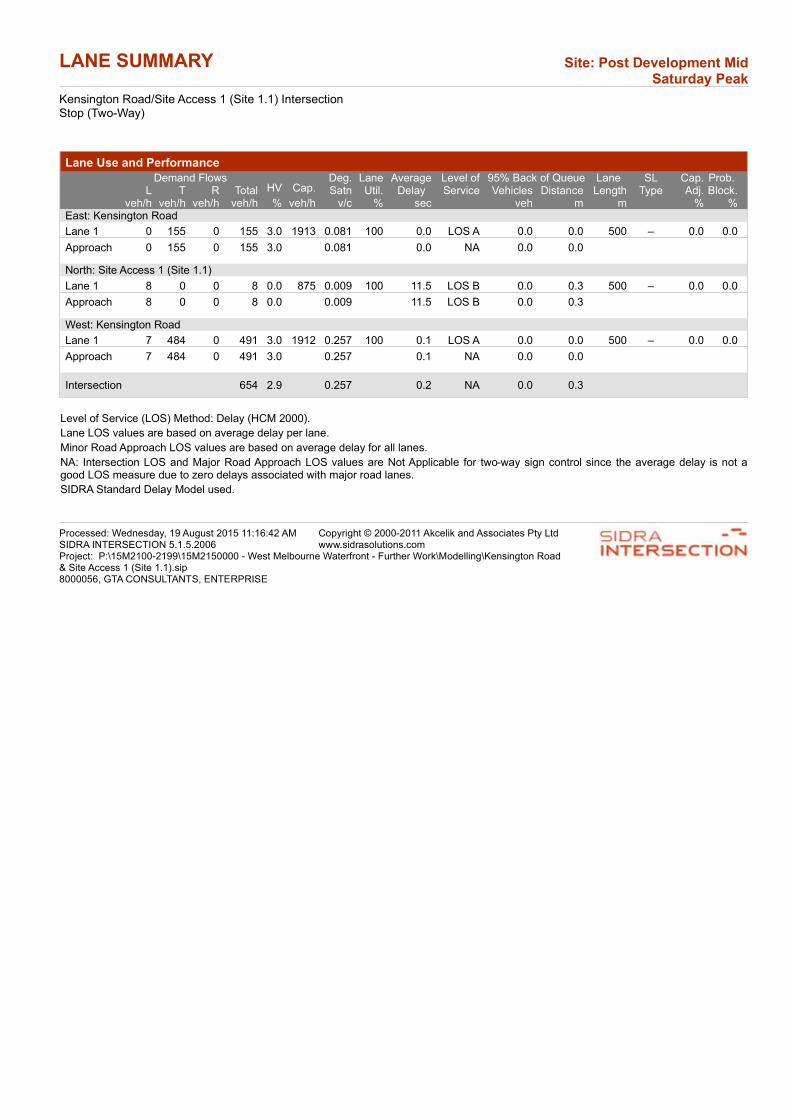
LANE SUMMARY Site: Post Development Mid Saturday Peak
Kensington Road/Site Access 1 (Site 1.1) IntersectionStop (Two-Way)
Lane Use and PerformanceDemand Flows 95% Back of Queue
HV Cap.Deg.Satn
LaneUtil.
AverageDelay
Level ofService
Lane Length
SL Type
Cap.Adj.
Prob. Block.L T R Total Vehicles Distance
veh/h veh/h veh/h veh/h % veh/h v/c % sec veh m m % %East: Kensington Road
Lane 1 0 155 0 155 3.0 1913 0.081 100 0.0 LOS A 0.0 0.0 500 – 0.0 0.0
Approach 0 155 0 155 3.0 0.081 0.0 NA 0.0 0.0
North: Site Access 1 (Site 1.1)
Lane 1 8 0 0 8 0.0 875 0.009 100 11.5 LOS B 0.0 0.3 500 – 0.0 0.0
Approach 8 0 0 8 0.0 0.009 11.5 LOS B 0.0 0.3
West: Kensington Road
Lane 1 7 484 0 491 3.0 1912 0.257 100 0.1 LOS A 0.0 0.0 500 – 0.0 0.0
Approach 7 484 0 491 3.0 0.257 0.1 NA 0.0 0.0
Intersection 654 2.9 0.257 0.2 NA 0.0 0.3
Level of Service (LOS) Method: Delay (HCM 2000).
Lane LOS values are based on average delay per lane.
Minor Road Approach LOS values are based on average delay for all lanes.
NA: Intersection LOS and Major Road Approach LOS values are Not Applicable for two-way sign control since the average delay is not a good LOS measure due to zero delays associated with major road lanes.
SIDRA Standard Delay Model used.
Processed: Wednesday, 19 August 2015 11:16:42 AMSIDRA INTERSECTION 5.1.5.2006
Copyright © 2000-2011 Akcelik and Associates Pty Ltdwww.sidrasolutions.com
Project: P:\15M2100-2199\15M2150000 - West Melbourne Waterfront - Further Work\Modelling\Kensington Road & Site Access 1 (Site 1.1).sip8000056, GTA CONSULTANTS, ENTERPRISE
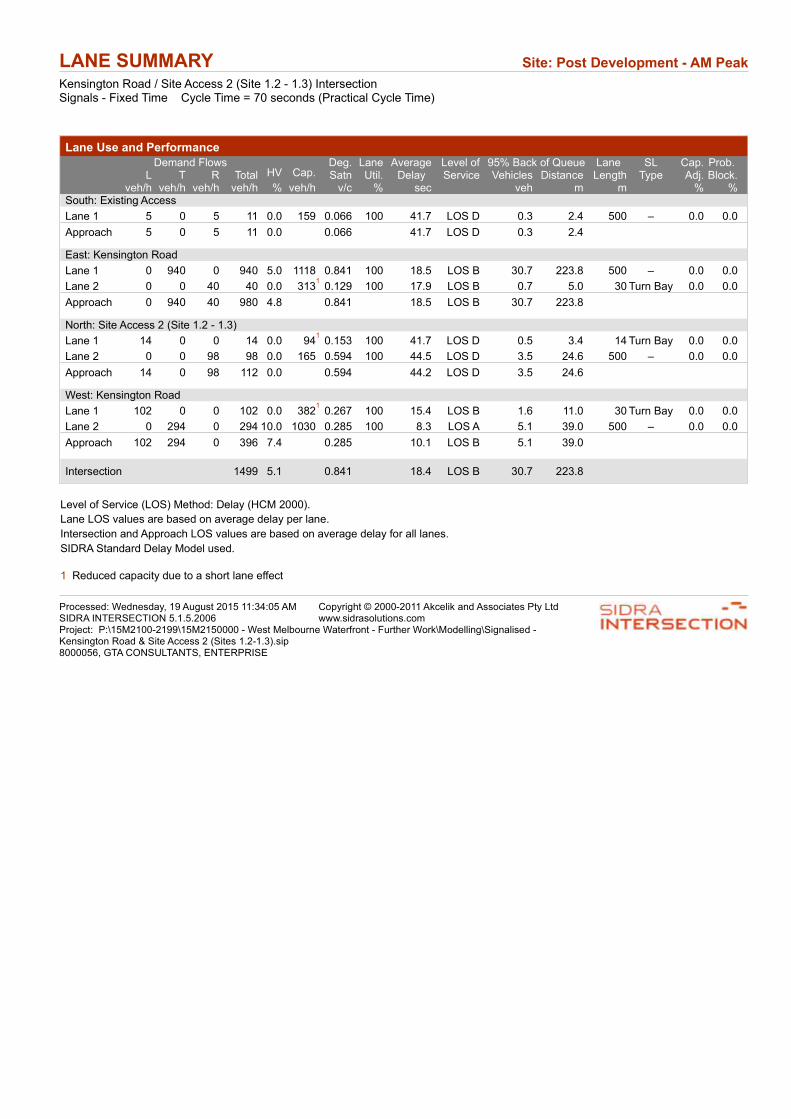
LANE SUMMARY Site: Post Development - AM Peak
Kensington Road / Site Access 2 (Site 1.2 - 1.3) IntersectionSignals - Fixed Time Cycle Time = 70 seconds (Practical Cycle Time)
Lane Use and PerformanceDemand Flows 95% Back of Queue
HV Cap.Deg.Satn
LaneUtil.
AverageDelay
Level ofService
Lane Length
SL Type
Cap.Adj.
Prob. Block.L T R Total Vehicles Distance
veh/h veh/h veh/h veh/h % veh/h v/c % sec veh m m % %South: Existing Access
Lane 1 5 0 5 11 0.0 159 0.066 100 41.7 LOS D 0.3 2.4 500 – 0.0 0.0
Approach 5 0 5 11 0.0 0.066 41.7 LOS D 0.3 2.4
East: Kensington Road
Lane 1 0 940 0 940 5.0 1118 0.841 100 18.5 LOS B 30.7 223.8 500 – 0.0 0.0
Lane 2 0 0 40 40 0.0 3131
0.129 100 17.9 LOS B 0.7 5.0 30 Turn Bay 0.0 0.0
Approach 0 940 40 980 4.8 0.841 18.5 LOS B 30.7 223.8
North: Site Access 2 (Site 1.2 - 1.3)
Lane 1 14 0 0 14 0.0 941
0.153 100 41.7 LOS D 0.5 3.4 14 Turn Bay 0.0 0.0
Lane 2 0 0 98 98 0.0 165 0.594 100 44.5 LOS D 3.5 24.6 500 – 0.0 0.0
Approach 14 0 98 112 0.0 0.594 44.2 LOS D 3.5 24.6
West: Kensington Road
Lane 1 102 0 0 102 0.0 3821
0.267 100 15.4 LOS B 1.6 11.0 30 Turn Bay 0.0 0.0
Lane 2 0 294 0 294 10.0 1030 0.285 100 8.3 LOS A 5.1 39.0 500 – 0.0 0.0
Approach 102 294 0 396 7.4 0.285 10.1 LOS B 5.1 39.0
Intersection 1499 5.1 0.841 18.4 LOS B 30.7 223.8
Level of Service (LOS) Method: Delay (HCM 2000).
Lane LOS values are based on average delay per lane.
Intersection and Approach LOS values are based on average delay for all lanes.
SIDRA Standard Delay Model used.
1 Reduced capacity due to a short lane effect
Processed: Wednesday, 19 August 2015 11:34:05 AMSIDRA INTERSECTION 5.1.5.2006
Copyright © 2000-2011 Akcelik and Associates Pty Ltdwww.sidrasolutions.com
Project: P:\15M2100-2199\15M2150000 - West Melbourne Waterfront - Further Work\Modelling\Signalised -Kensington Road & Site Access 2 (Sites 1.2-1.3).sip8000056, GTA CONSULTANTS, ENTERPRISE
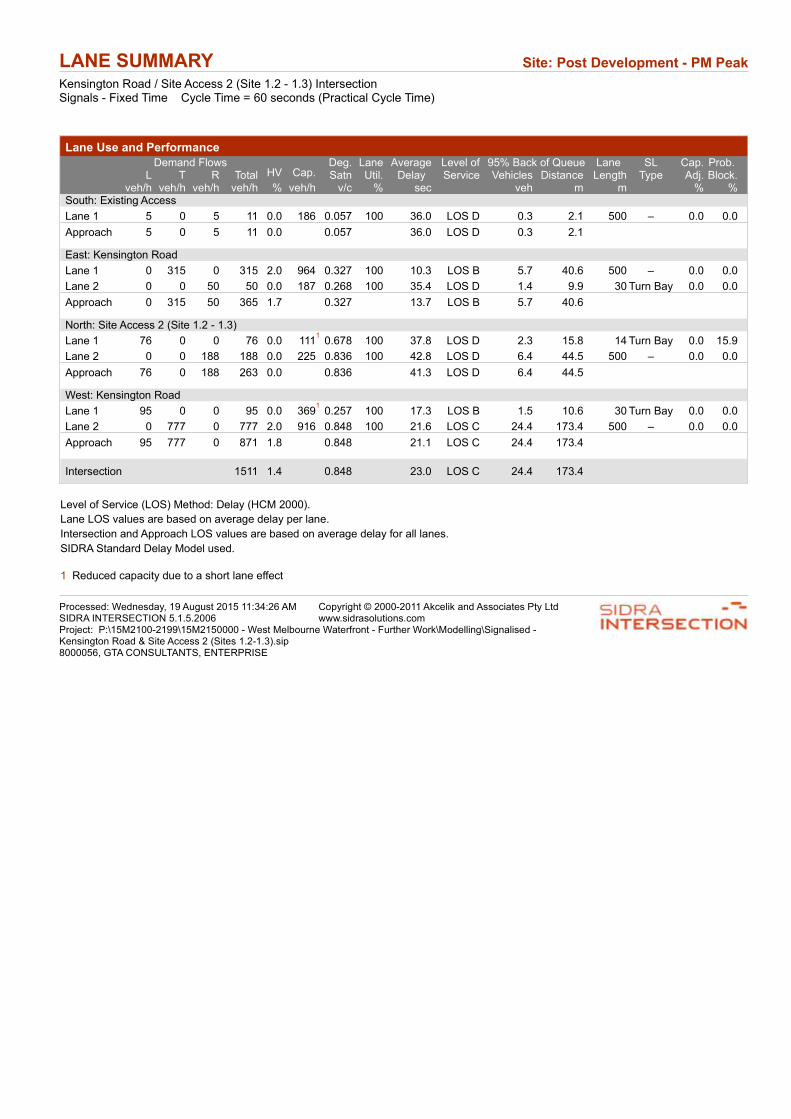
LANE SUMMARY Site: Post Development - PM Peak
Kensington Road / Site Access 2 (Site 1.2 - 1.3) IntersectionSignals - Fixed Time Cycle Time = 60 seconds (Practical Cycle Time)
Lane Use and PerformanceDemand Flows 95% Back of Queue
HV Cap.Deg.Satn
LaneUtil.
AverageDelay
Level ofService
Lane Length
SL Type
Cap.Adj.
Prob. Block.L T R Total Vehicles Distance
veh/h veh/h veh/h veh/h % veh/h v/c % sec veh m m % %South: Existing Access
Lane 1 5 0 5 11 0.0 186 0.057 100 36.0 LOS D 0.3 2.1 500 – 0.0 0.0
Approach 5 0 5 11 0.0 0.057 36.0 LOS D 0.3 2.1
East: Kensington Road
Lane 1 0 315 0 315 2.0 964 0.327 100 10.3 LOS B 5.7 40.6 500 – 0.0 0.0
Lane 2 0 0 50 50 0.0 187 0.268 100 35.4 LOS D 1.4 9.9 30 Turn Bay 0.0 0.0
Approach 0 315 50 365 1.7 0.327 13.7 LOS B 5.7 40.6
North: Site Access 2 (Site 1.2 - 1.3)
Lane 1 76 0 0 76 0.0 1111
0.678 100 37.8 LOS D 2.3 15.8 14 Turn Bay 0.0 15.9
Lane 2 0 0 188 188 0.0 225 0.836 100 42.8 LOS D 6.4 44.5 500 – 0.0 0.0
Approach 76 0 188 263 0.0 0.836 41.3 LOS D 6.4 44.5
West: Kensington Road
Lane 1 95 0 0 95 0.0 3691
0.257 100 17.3 LOS B 1.5 10.6 30 Turn Bay 0.0 0.0
Lane 2 0 777 0 777 2.0 916 0.848 100 21.6 LOS C 24.4 173.4 500 – 0.0 0.0
Approach 95 777 0 871 1.8 0.848 21.1 LOS C 24.4 173.4
Intersection 1511 1.4 0.848 23.0 LOS C 24.4 173.4
Level of Service (LOS) Method: Delay (HCM 2000).
Lane LOS values are based on average delay per lane.
Intersection and Approach LOS values are based on average delay for all lanes.
SIDRA Standard Delay Model used.
1 Reduced capacity due to a short lane effect
Processed: Wednesday, 19 August 2015 11:34:26 AMSIDRA INTERSECTION 5.1.5.2006
Copyright © 2000-2011 Akcelik and Associates Pty Ltdwww.sidrasolutions.com
Project: P:\15M2100-2199\15M2150000 - West Melbourne Waterfront - Further Work\Modelling\Signalised -Kensington Road & Site Access 2 (Sites 1.2-1.3).sip8000056, GTA CONSULTANTS, ENTERPRISE
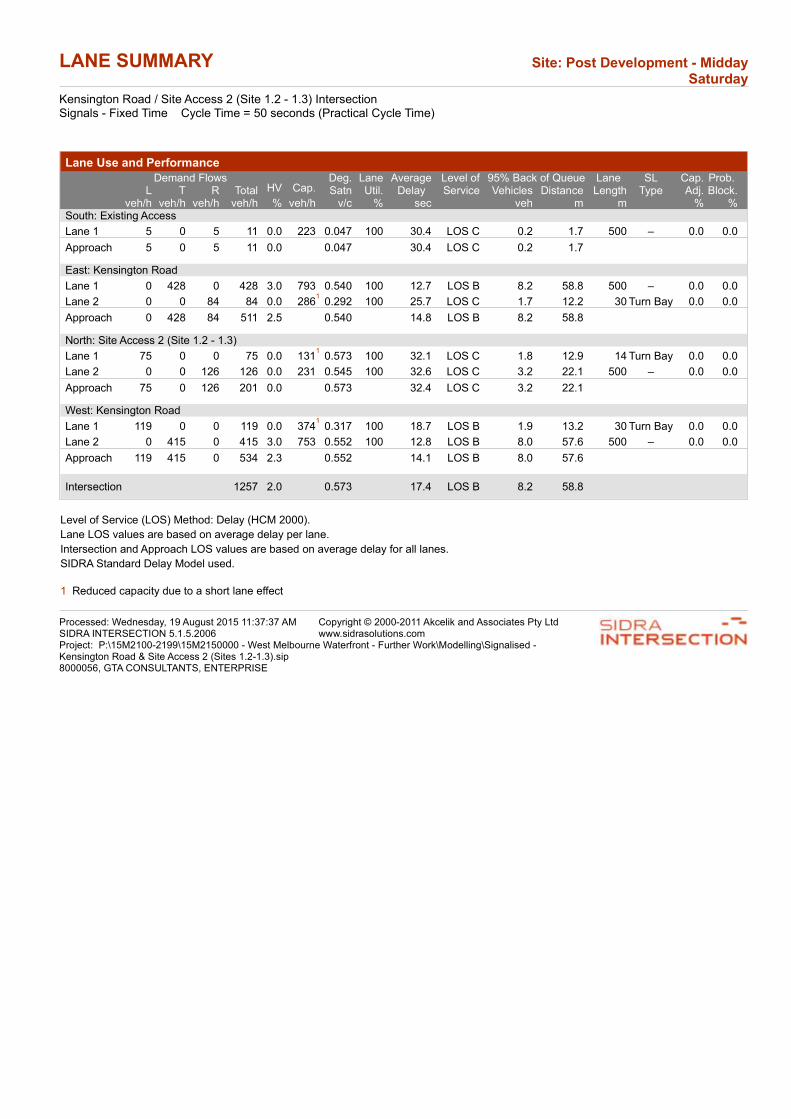
LANE SUMMARY Site: Post Development - Midday Saturday
Kensington Road / Site Access 2 (Site 1.2 - 1.3) IntersectionSignals - Fixed Time Cycle Time = 50 seconds (Practical Cycle Time)
Lane Use and PerformanceDemand Flows 95% Back of Queue
HV Cap.Deg.Satn
LaneUtil.
AverageDelay
Level ofService
Lane Length
SL Type
Cap.Adj.
Prob. Block.L T R Total Vehicles Distance
veh/h veh/h veh/h veh/h % veh/h v/c % sec veh m m % %South: Existing Access
Lane 1 5 0 5 11 0.0 223 0.047 100 30.4 LOS C 0.2 1.7 500 – 0.0 0.0
Approach 5 0 5 11 0.0 0.047 30.4 LOS C 0.2 1.7
East: Kensington Road
Lane 1 0 428 0 428 3.0 793 0.540 100 12.7 LOS B 8.2 58.8 500 – 0.0 0.0
Lane 2 0 0 84 84 0.0 2861
0.292 100 25.7 LOS C 1.7 12.2 30 Turn Bay 0.0 0.0
Approach 0 428 84 511 2.5 0.540 14.8 LOS B 8.2 58.8
North: Site Access 2 (Site 1.2 - 1.3)
Lane 1 75 0 0 75 0.0 1311
0.573 100 32.1 LOS C 1.8 12.9 14 Turn Bay 0.0 0.0
Lane 2 0 0 126 126 0.0 231 0.545 100 32.6 LOS C 3.2 22.1 500 – 0.0 0.0
Approach 75 0 126 201 0.0 0.573 32.4 LOS C 3.2 22.1
West: Kensington Road
Lane 1 119 0 0 119 0.0 3741
0.317 100 18.7 LOS B 1.9 13.2 30 Turn Bay 0.0 0.0
Lane 2 0 415 0 415 3.0 753 0.552 100 12.8 LOS B 8.0 57.6 500 – 0.0 0.0
Approach 119 415 0 534 2.3 0.552 14.1 LOS B 8.0 57.6
Intersection 1257 2.0 0.573 17.4 LOS B 8.2 58.8
Level of Service (LOS) Method: Delay (HCM 2000).
Lane LOS values are based on average delay per lane.
Intersection and Approach LOS values are based on average delay for all lanes.
SIDRA Standard Delay Model used.
1 Reduced capacity due to a short lane effect
Processed: Wednesday, 19 August 2015 11:37:37 AMSIDRA INTERSECTION 5.1.5.2006
Copyright © 2000-2011 Akcelik and Associates Pty Ltdwww.sidrasolutions.com
Project: P:\15M2100-2199\15M2150000 - West Melbourne Waterfront - Further Work\Modelling\Signalised -Kensington Road & Site Access 2 (Sites 1.2-1.3).sip8000056, GTA CONSULTANTS, ENTERPRISE
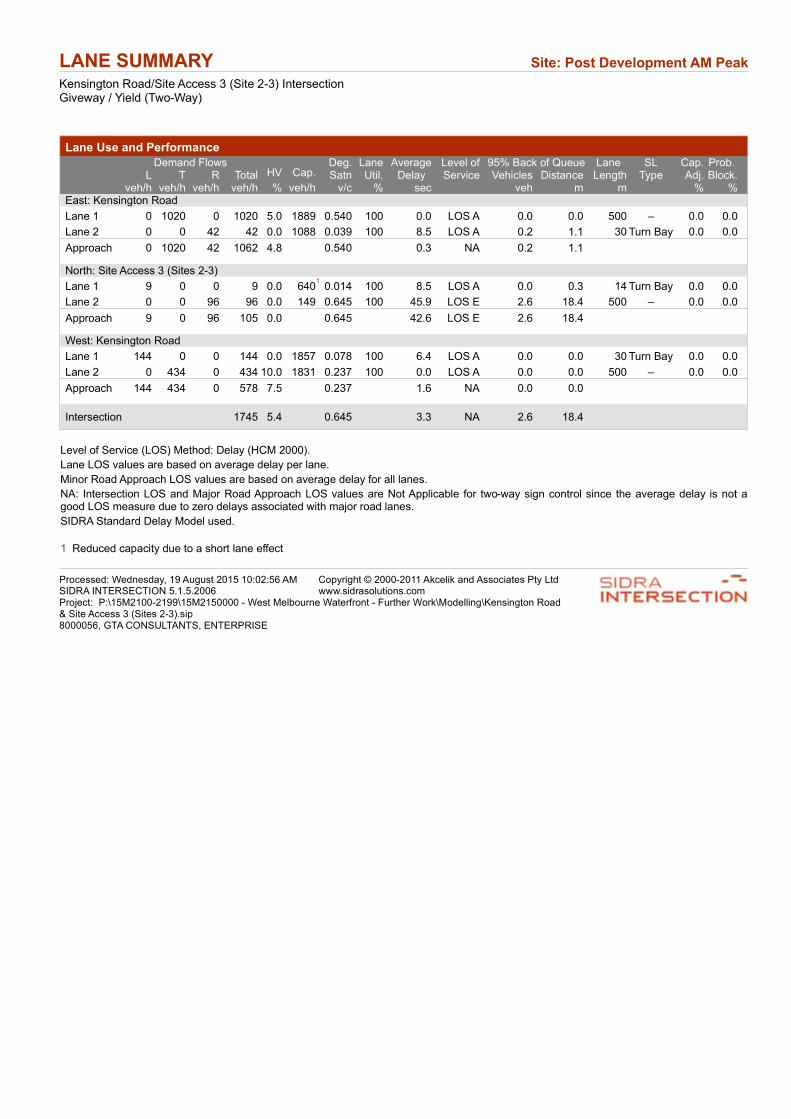
LANE SUMMARY Site: Post Development AM Peak
Kensington Road/Site Access 3 (Site 2-3) IntersectionGiveway / Yield (Two-Way)
Lane Use and PerformanceDemand Flows 95% Back of Queue
HV Cap.Deg.Satn
LaneUtil.
AverageDelay
Level ofService
Lane Length
SL Type
Cap.Adj.
Prob. Block.L T R Total Vehicles Distance
veh/h veh/h veh/h veh/h % veh/h v/c % sec veh m m % %East: Kensington Road
Lane 1 0 1020 0 1020 5.0 1889 0.540 100 0.0 LOS A 0.0 0.0 500 – 0.0 0.0
Lane 2 0 0 42 42 0.0 1088 0.039 100 8.5 LOS A 0.2 1.1 30 Turn Bay 0.0 0.0
Approach 0 1020 42 1062 4.8 0.540 0.3 NA 0.2 1.1
North: Site Access 3 (Sites 2-3)
Lane 1 9 0 0 9 0.0 6401
0.014 100 8.5 LOS A 0.0 0.3 14 Turn Bay 0.0 0.0
Lane 2 0 0 96 96 0.0 149 0.645 100 45.9 LOS E 2.6 18.4 500 – 0.0 0.0
Approach 9 0 96 105 0.0 0.645 42.6 LOS E 2.6 18.4
West: Kensington Road
Lane 1 144 0 0 144 0.0 1857 0.078 100 6.4 LOS A 0.0 0.0 30 Turn Bay 0.0 0.0
Lane 2 0 434 0 434 10.0 1831 0.237 100 0.0 LOS A 0.0 0.0 500 – 0.0 0.0
Approach 144 434 0 578 7.5 0.237 1.6 NA 0.0 0.0
Intersection 1745 5.4 0.645 3.3 NA 2.6 18.4
Level of Service (LOS) Method: Delay (HCM 2000).
Lane LOS values are based on average delay per lane.
Minor Road Approach LOS values are based on average delay for all lanes.
NA: Intersection LOS and Major Road Approach LOS values are Not Applicable for two-way sign control since the average delay is not a good LOS measure due to zero delays associated with major road lanes.
SIDRA Standard Delay Model used.
1 Reduced capacity due to a short lane effect
Processed: Wednesday, 19 August 2015 10:02:56 AMSIDRA INTERSECTION 5.1.5.2006
Copyright © 2000-2011 Akcelik and Associates Pty Ltdwww.sidrasolutions.com
Project: P:\15M2100-2199\15M2150000 - West Melbourne Waterfront - Further Work\Modelling\Kensington Road & Site Access 3 (Sites 2-3).sip8000056, GTA CONSULTANTS, ENTERPRISE

LANE SUMMARY Site: Post Development PM Peak
Kensington Road/Site Access 3 (Site 2-3) IntersectionGiveway / Yield (Two-Way)
Lane Use and PerformanceDemand Flows 95% Back of Queue
HV Cap.Deg.Satn
LaneUtil.
AverageDelay
Level ofService
Lane Length
SL Type
Cap.Adj.
Prob. Block.L T R Total Vehicles Distance
veh/h veh/h veh/h veh/h % veh/h v/c % sec veh m m % %East: Kensington Road
Lane 1 0 518 0 518 2.0 1925 0.269 100 0.0 LOS A 0.0 0.0 500 – 0.0 0.0
Lane 2 0 0 11 11 0.0 834 0.013 100 9.8 LOS A 0.0 0.3 30 Turn Bay 0.0 0.0
Approach 0 518 11 530 2.0 0.269 0.2 NA 0.0 0.3
North: Site Access 3 (Sites 2-3)
Lane 1 81 0 0 81 0.0 5441
0.148 100 10.8 LOS B 0.5 3.4 14 Turn Bay 0.0 0.0
Lane 2 0 0 195 195 0.0 213 0.915 100 62.4 LOS F 7.6 53.1 500 – 0.0 0.0
Approach 81 0 195 276 0.0 0.915 47.3 LOS E 7.6 53.1
West: Kensington Road
Lane 1 68 0 0 68 0.0 1857 0.037 100 6.4 LOS A 0.0 0.0 30 Turn Bay 0.0 0.0
Lane 2 0 784 0 784 2.0 1925 0.407 100 0.0 LOS A 0.0 0.0 500 – 0.0 0.0
Approach 68 784 0 852 1.8 0.407 0.5 NA 0.0 0.0
Intersection 1657 1.6 0.915 8.2 NA 7.6 53.1
Level of Service (LOS) Method: Delay (HCM 2000).
Lane LOS values are based on average delay per lane.
Minor Road Approach LOS values are based on average delay for all lanes.
NA: Intersection LOS and Major Road Approach LOS values are Not Applicable for two-way sign control since the average delay is not a good LOS measure due to zero delays associated with major road lanes.
SIDRA Standard Delay Model used.
1 Reduced capacity due to a short lane effect
Processed: Wednesday, 19 August 2015 10:38:59 AMSIDRA INTERSECTION 5.1.5.2006
Copyright © 2000-2011 Akcelik and Associates Pty Ltdwww.sidrasolutions.com
Project: P:\15M2100-2199\15M2150000 - West Melbourne Waterfront - Further Work\Modelling\Kensington Road & Site Access 3 (Sites 2-3).sip8000056, GTA CONSULTANTS, ENTERPRISE
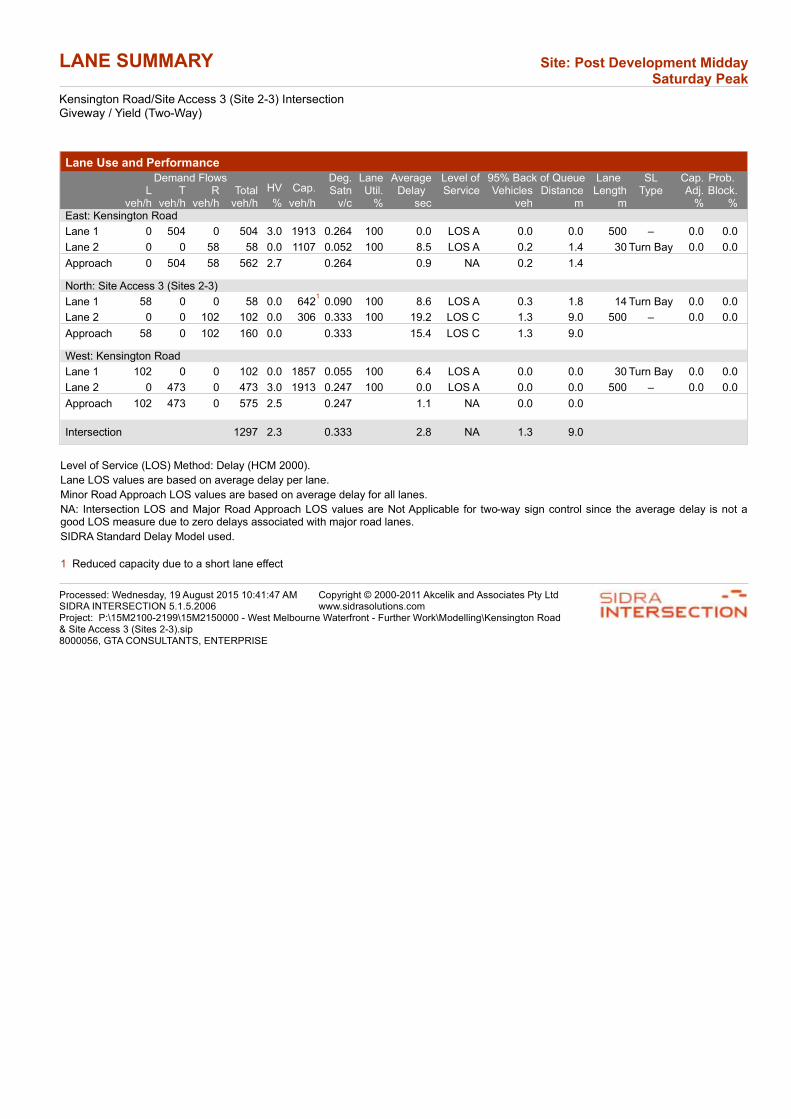
LANE SUMMARY Site: Post Development Midday Saturday Peak
Kensington Road/Site Access 3 (Site 2-3) IntersectionGiveway / Yield (Two-Way)
Lane Use and PerformanceDemand Flows 95% Back of Queue
HV Cap.Deg.Satn
LaneUtil.
AverageDelay
Level ofService
Lane Length
SL Type
Cap.Adj.
Prob. Block.L T R Total Vehicles Distance
veh/h veh/h veh/h veh/h % veh/h v/c % sec veh m m % %East: Kensington Road
Lane 1 0 504 0 504 3.0 1913 0.264 100 0.0 LOS A 0.0 0.0 500 – 0.0 0.0
Lane 2 0 0 58 58 0.0 1107 0.052 100 8.5 LOS A 0.2 1.4 30 Turn Bay 0.0 0.0
Approach 0 504 58 562 2.7 0.264 0.9 NA 0.2 1.4
North: Site Access 3 (Sites 2-3)
Lane 1 58 0 0 58 0.0 6421
0.090 100 8.6 LOS A 0.3 1.8 14 Turn Bay 0.0 0.0
Lane 2 0 0 102 102 0.0 306 0.333 100 19.2 LOS C 1.3 9.0 500 – 0.0 0.0
Approach 58 0 102 160 0.0 0.333 15.4 LOS C 1.3 9.0
West: Kensington Road
Lane 1 102 0 0 102 0.0 1857 0.055 100 6.4 LOS A 0.0 0.0 30 Turn Bay 0.0 0.0
Lane 2 0 473 0 473 3.0 1913 0.247 100 0.0 LOS A 0.0 0.0 500 – 0.0 0.0
Approach 102 473 0 575 2.5 0.247 1.1 NA 0.0 0.0
Intersection 1297 2.3 0.333 2.8 NA 1.3 9.0
Level of Service (LOS) Method: Delay (HCM 2000).
Lane LOS values are based on average delay per lane.
Minor Road Approach LOS values are based on average delay for all lanes.
NA: Intersection LOS and Major Road Approach LOS values are Not Applicable for two-way sign control since the average delay is not a good LOS measure due to zero delays associated with major road lanes.
SIDRA Standard Delay Model used.
1 Reduced capacity due to a short lane effect
Processed: Wednesday, 19 August 2015 10:41:47 AMSIDRA INTERSECTION 5.1.5.2006
Copyright © 2000-2011 Akcelik and Associates Pty Ltdwww.sidrasolutions.com
Project: P:\15M2100-2199\15M2150000 - West Melbourne Waterfront - Further Work\Modelling\Kensington Road & Site Access 3 (Sites 2-3).sip8000056, GTA CONSULTANTS, ENTERPRISE

LANE SUMMARY Site: Post Development AM Peak
Kensington Road/Site Access 4 (Site 4) IntersectionGiveway / Yield (Two-Way)
Lane Use and PerformanceDemand Flows 95% Back of Queue
HV Cap.Deg.Satn
LaneUtil.
AverageDelay
Level ofService
Lane Length
SL Type
Cap.Adj.
Prob. Block.L T R Total Vehicles Distance
veh/h veh/h veh/h veh/h % veh/h v/c % sec veh m m % %East: Kensington Road
Lane 1 0 1108 6 1114 5.0 1879 0.593 100 8.3 LOS A 12.9 93.8 500 – 0.0 0.0
Approach 0 1108 6 1114 5.0 0.593 8.3 NA 12.9 93.8
North: Site Access 4 (Site 4)
Lane 1 2 0 19 21 0.0 81 0.255 100 53.9 LOS F 0.7 5.1 500 – 0.0 0.0
Approach 2 0 19 21 0.0 0.255 53.9 LOS F 0.7 5.1
West: Kensington Road
Lane 1 21 576 0 597 9.7 1832 0.326 100 0.2 LOS A 0.0 0.0 500 – 0.0 0.0
Approach 21 576 0 597 9.7 0.326 0.2 NA 0.0 0.0
Intersection 1732 6.5 0.593 6.1 NA 12.9 93.8
Level of Service (LOS) Method: Delay (HCM 2000).
Lane LOS values are based on average delay per lane.
Minor Road Approach LOS values are based on average delay for all lanes.
NA: Intersection LOS and Major Road Approach LOS values are Not Applicable for two-way sign control since the average delay is not a good LOS measure due to zero delays associated with major road lanes.
SIDRA Standard Delay Model used.
Processed: Wednesday, 19 August 2015 9:47:50 AMSIDRA INTERSECTION 5.1.5.2006
Copyright © 2000-2011 Akcelik and Associates Pty Ltdwww.sidrasolutions.com
Project: P:\15M2100-2199\15M2150000 - West Melbourne Waterfront - Further Work\Modelling\Kensington Road & Site Access 4 (Site 4).sip8000056, GTA CONSULTANTS, ENTERPRISE
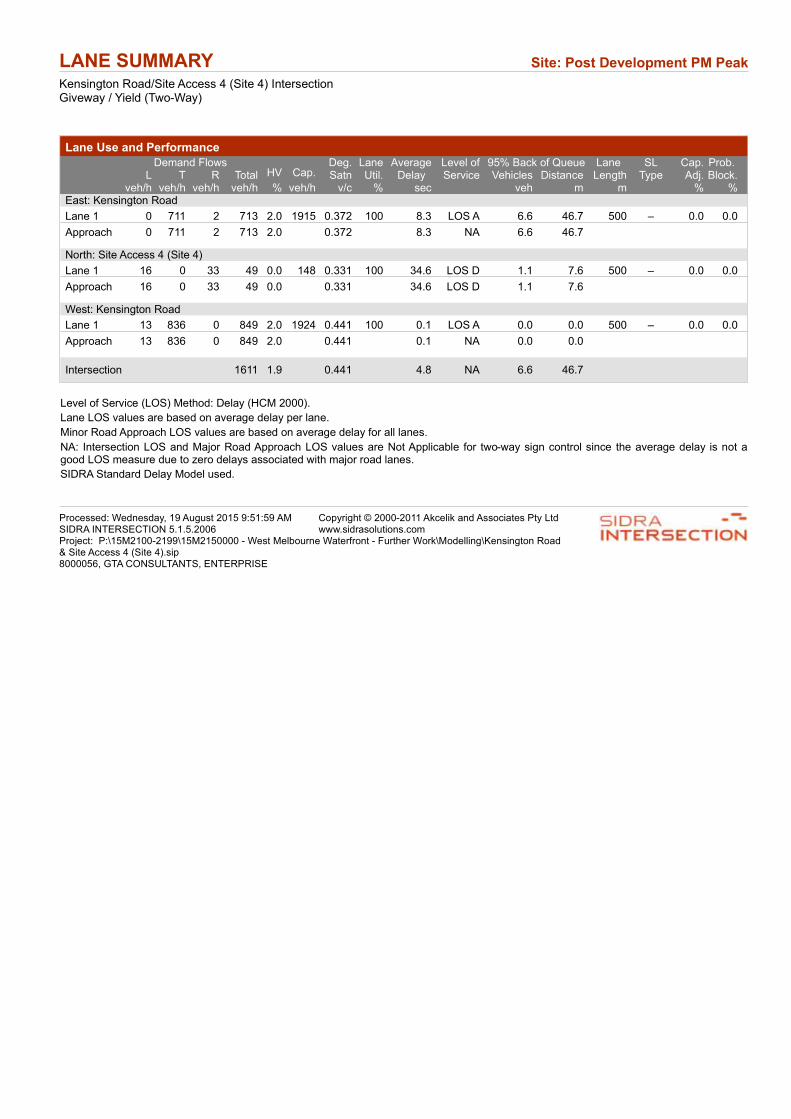
LANE SUMMARY Site: Post Development PM Peak
Kensington Road/Site Access 4 (Site 4) IntersectionGiveway / Yield (Two-Way)
Lane Use and PerformanceDemand Flows 95% Back of Queue
HV Cap.Deg.Satn
LaneUtil.
AverageDelay
Level ofService
Lane Length
SL Type
Cap.Adj.
Prob. Block.L T R Total Vehicles Distance
veh/h veh/h veh/h veh/h % veh/h v/c % sec veh m m % %East: Kensington Road
Lane 1 0 711 2 713 2.0 1915 0.372 100 8.3 LOS A 6.6 46.7 500 – 0.0 0.0
Approach 0 711 2 713 2.0 0.372 8.3 NA 6.6 46.7
North: Site Access 4 (Site 4)
Lane 1 16 0 33 49 0.0 148 0.331 100 34.6 LOS D 1.1 7.6 500 – 0.0 0.0
Approach 16 0 33 49 0.0 0.331 34.6 LOS D 1.1 7.6
West: Kensington Road
Lane 1 13 836 0 849 2.0 1924 0.441 100 0.1 LOS A 0.0 0.0 500 – 0.0 0.0
Approach 13 836 0 849 2.0 0.441 0.1 NA 0.0 0.0
Intersection 1611 1.9 0.441 4.8 NA 6.6 46.7
Level of Service (LOS) Method: Delay (HCM 2000).
Lane LOS values are based on average delay per lane.
Minor Road Approach LOS values are based on average delay for all lanes.
NA: Intersection LOS and Major Road Approach LOS values are Not Applicable for two-way sign control since the average delay is not a good LOS measure due to zero delays associated with major road lanes.
SIDRA Standard Delay Model used.
Processed: Wednesday, 19 August 2015 9:51:59 AMSIDRA INTERSECTION 5.1.5.2006
Copyright © 2000-2011 Akcelik and Associates Pty Ltdwww.sidrasolutions.com
Project: P:\15M2100-2199\15M2150000 - West Melbourne Waterfront - Further Work\Modelling\Kensington Road & Site Access 4 (Site 4).sip8000056, GTA CONSULTANTS, ENTERPRISE
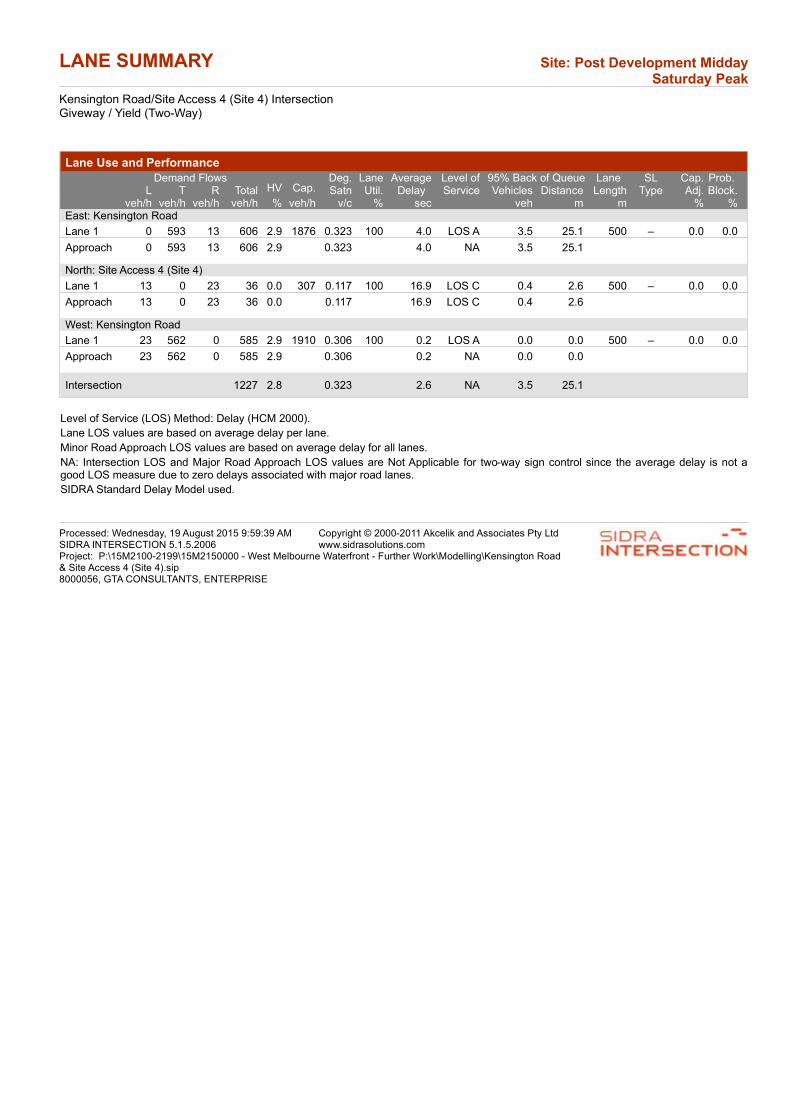
LANE SUMMARY Site: Post Development Midday Saturday Peak
Kensington Road/Site Access 4 (Site 4) IntersectionGiveway / Yield (Two-Way)
Lane Use and PerformanceDemand Flows 95% Back of Queue
HV Cap.Deg.Satn
LaneUtil.
AverageDelay
Level ofService
Lane Length
SL Type
Cap.Adj.
Prob. Block.L T R Total Vehicles Distance
veh/h veh/h veh/h veh/h % veh/h v/c % sec veh m m % %East: Kensington Road
Lane 1 0 593 13 606 2.9 1876 0.323 100 4.0 LOS A 3.5 25.1 500 – 0.0 0.0
Approach 0 593 13 606 2.9 0.323 4.0 NA 3.5 25.1
North: Site Access 4 (Site 4)
Lane 1 13 0 23 36 0.0 307 0.117 100 16.9 LOS C 0.4 2.6 500 – 0.0 0.0
Approach 13 0 23 36 0.0 0.117 16.9 LOS C 0.4 2.6
West: Kensington Road
Lane 1 23 562 0 585 2.9 1910 0.306 100 0.2 LOS A 0.0 0.0 500 – 0.0 0.0
Approach 23 562 0 585 2.9 0.306 0.2 NA 0.0 0.0
Intersection 1227 2.8 0.323 2.6 NA 3.5 25.1
Level of Service (LOS) Method: Delay (HCM 2000).
Lane LOS values are based on average delay per lane.
Minor Road Approach LOS values are based on average delay for all lanes.
NA: Intersection LOS and Major Road Approach LOS values are Not Applicable for two-way sign control since the average delay is not a good LOS measure due to zero delays associated with major road lanes.
SIDRA Standard Delay Model used.
Processed: Wednesday, 19 August 2015 9:59:39 AMSIDRA INTERSECTION 5.1.5.2006
Copyright © 2000-2011 Akcelik and Associates Pty Ltdwww.sidrasolutions.com
Project: P:\15M2100-2199\15M2150000 - West Melbourne Waterfront - Further Work\Modelling\Kensington Road & Site Access 4 (Site 4).sip8000056, GTA CONSULTANTS, ENTERPRISE

Melbourne
A Level 25, 55 Collins Street
PO Box 24055
MELBOURNE VIC 3000
P +613 9851 9600
Brisbane
A Level 4, 283 Elizabeth Street
BRISBANE QLD 4000
GPO Box 115
BRISBANE QLD 4001
P +617 3113 5000
Adelaide
A Suite 4, Level 1, 136 The Parade
PO Box 3421
NORWOOD SA 5067
P +618 8334 3600
Townsville
A Level 1, 25 Sturt Street
PO Box 1064
TOWNSVILLE QLD 4810
P +617 4722 2765
Sydney
A Level 6, 15 Help Street
CHATSWOOD NSW 2067
PO Box 5254
WEST CHATSWOOD NSW 1515
P +612 8448 1800
Canberra
A Unit 4, Level 1, Sparta Building,
55 Woolley Street
PO Box 62
DICKSON ACT 2602
P +612 6243 4826
Gold Coast
A Level 9, Corporate Centre 2
Box 37, 1 Corporate Court
BUNDALL QLD 4217
P +617 5510 4800
F +617 5510 4814
Perth
A Level 27, 44 St Georges Terrace
PERTH WA 6000
P +618 6361 4634
www.gta.com.au www.gta.com.au