Evaluation of Instream Flow Needs in the Lower Klamath River
Wenatchee River Temperature
Total Maximum Daily Load Study
August 2005
Publication No. 05-03-011

This report is available on the Department of Ecology home page on the World Wide Web at http://www.ecy.wa.gov/biblio/0503011.html Data for this project are available at Ecology’s Environmental Information Management (EIM) website http://www.ecy.wa.gov/eim/index.htm. Search User Study ID, WENRTMDL. Ecology’s Activity Tracker Code for this project is 02-063-02. For additional copies of this publication, please contact:
Department of Ecology Publications Distributions Office
Address: PO Box 47600, Olympia WA 98504-7600 E-mail: [email protected] Phone: (360) 407-7472
Refer to Publication Number 05-03-011
Any use of product or firm names in this publication is for descriptive purposes only and does not imply endorsement by the author or the Department of Ecology. If you need this publication in an alternate format, call Joan LeTourneau at (360) 407-6764. For persons with a speech or hearing impairment, call 711 for relay service or 800-833-6388 for TTY.

Wenatchee River Temperature
Total Maximum Daily Load Study
by
Nicoleta Cristea and Greg Pelletier
Washington State Department of Ecology Environmental Assessment Program
August 2005
Publication No. 05-03-011

This page is purposely left blank

Page i
Table of Contents
Page
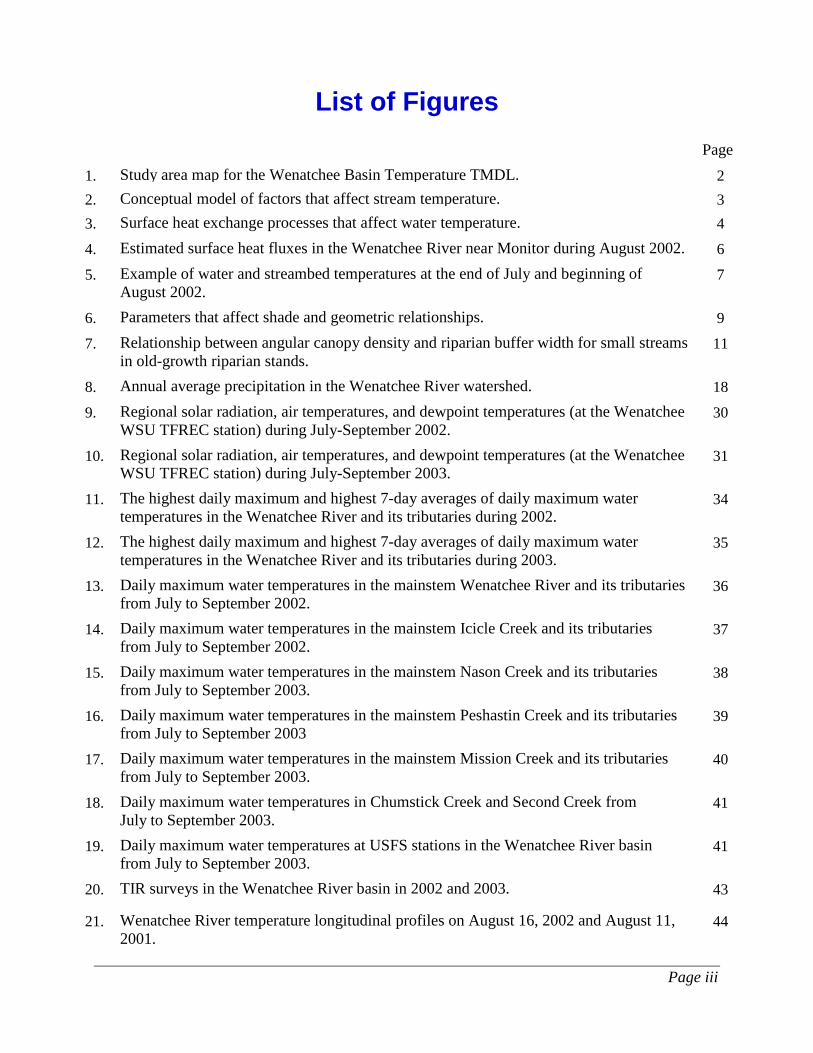
List of Figures .................................................................................................................... iii
List of Tables .......................................................................................................................v
Abstract ............................................................................................................................. vii
Acknowledgements .......................................................................................................... viii
Executive Summary ........................................................................................................... ix
Introduction ..........................................................................................................................1 Overview of stream heating processes .........................................................................3 Pollutant sources ........................................................................................................14 Pollutants and surrogate measures .............................................................................14
Background ........................................................................................................................17 Land ownership ..........................................................................................................19 Forest land cover ........................................................................................................19 Instream flow rule for the Wenatchee River ..............................................................23
Applicable Water Quality Criteria .....................................................................................25 Current water quality criteria .....................................................................................25 2003 revised water quality criteria .............................................................................26
Seasonal Variation .............................................................................................................28
Technical Analysis .............................................................................................................29 Stream heating processes ...........................................................................................29 Current conditions ......................................................................................................29 Riparian vegetation and effective shade ....................................................................50 Analytical framework ................................................................................................57 Calibration and confirmation of the QUAL2Kw model ............................................58 Loading capacity ........................................................................................................65 Load allocations .........................................................................................................74 Wasteload allocations ................................................................................................75 Margin of safety .........................................................................................................77
Conclusions and Recommendations ..................................................................................79
Adaptive Management Process ..........................................................................................81
References Cited ................................................................................................................83
Appendices .........................................................................................................................89 Appendix A. Use designations for the revised WAC 173-201a for WRIA 45 (Wenatchee) ...............................................................................................................91 Appendix B. Load allocations for effective shade for the Wenatchee River, Icicle Creek, and Nason Creek...................................................................................95 Appendix C. Load allocations for effective shade for miscellaneous perennial streams in the Wenatchee River basin based on bankfull width and stream aspect 107

Page ii
Appendix D. Year 1: Monitoring stations and data quality descriptions ................111 Appendix E. Year 2: Monitoring stations and data quality descriptions ................121
Page iii
List of Figures Page
1. Study area map for the Wenatchee Basin Temperature TMDL. 2 2. Conceptual model of factors that affect stream temperature. 3 3. Surface heat exchange processes that affect water temperature. 4
4. Estimated surface heat fluxes in the Wenatchee River near Monitor during August 2002. 6
5. Example of water and streambed temperatures at the end of July and beginning of August 2002.
7
6. Parameters that affect shade and geometric relationships. 9
7. Relationship between angular canopy density and riparian buffer width for small streams in old-growth riparian stands.
11
8. Annual average precipitation in the Wenatchee River watershed. 18
9. Regional solar radiation, air temperatures, and dewpoint temperatures (at the Wenatchee WSU TFREC station) during July-September 2002.
30
10. Regional solar radiation, air temperatures, and dewpoint temperatures (at the Wenatchee WSU TFREC station) during July-September 2003.
31
11. The highest daily maximum and highest 7-day averages of daily maximum water temperatures in the Wenatchee River and its tributaries during 2002.
34
12. The highest daily maximum and highest 7-day averages of daily maximum water temperatures in the Wenatchee River and its tributaries during 2003.
35
13. Daily maximum water temperatures in the mainstem Wenatchee River and its tributaries from July to September 2002.
36
14. Daily maximum water temperatures in the mainstem Icicle Creek and its tributaries from July to September 2002.
37
15. Daily maximum water temperatures in the mainstem Nason Creek and its tributaries from July to September 2003.
38
16. Daily maximum water temperatures in the mainstem Peshastin Creek and its tributaries from July to September 2003
39
17. Daily maximum water temperatures in the mainstem Mission Creek and its tributaries from July to September 2003.
40
18. Daily maximum water temperatures in Chumstick Creek and Second Creek from July to September 2003.
41
19. Daily maximum water temperatures at USFS stations in the Wenatchee River basin from July to September 2003.
41
20. TIR surveys in the Wenatchee River basin in 2002 and 2003. 43
21. Wenatchee River temperature longitudinal profiles on August 16, 2002 and August 11, 2001.
44
Page iv
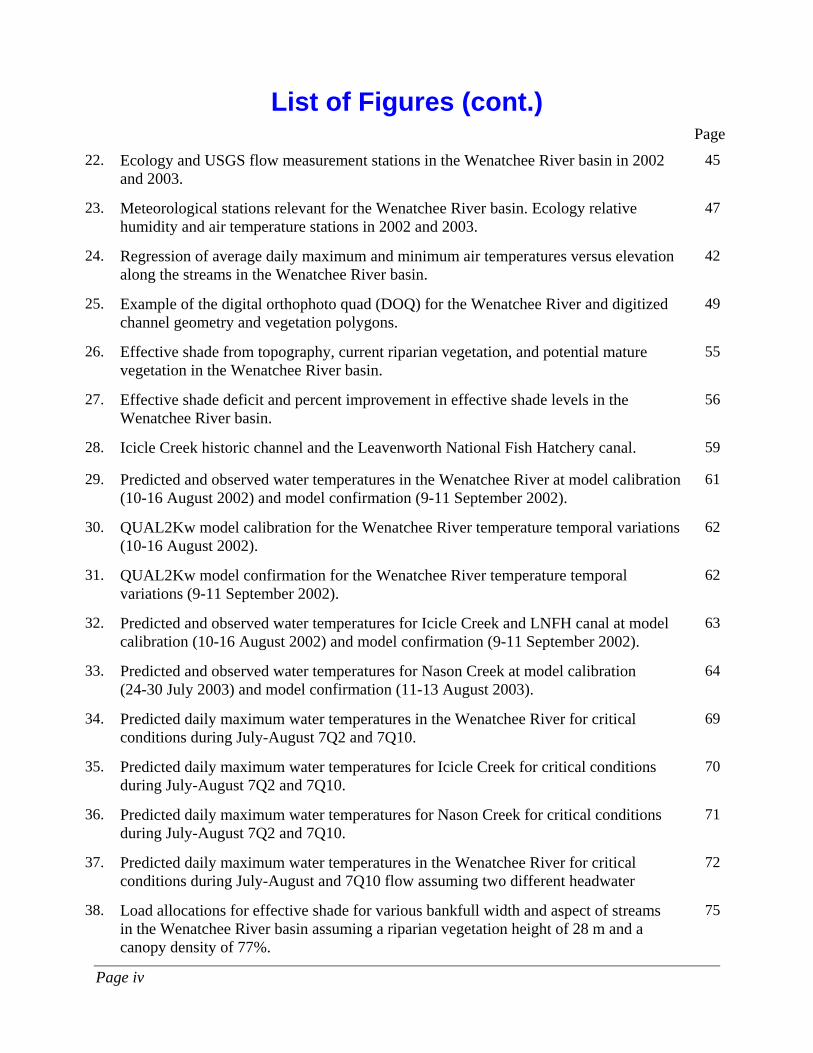
List of Figures (cont.) Page
22. Ecology and USGS flow measurement stations in the Wenatchee River basin in 2002 and 2003.
45
23. Meteorological stations relevant for the Wenatchee River basin. Ecology relative humidity and air temperature stations in 2002 and 2003.
47
24. Regression of average daily maximum and minimum air temperatures versus elevation along the streams in the Wenatchee River basin.
42
25. Example of the digital orthophoto quad (DOQ) for the Wenatchee River and digitized channel geometry and vegetation polygons.
49
26. Effective shade from topography, current riparian vegetation, and potential mature vegetation in the Wenatchee River basin.
55
27. Effective shade deficit and percent improvement in effective shade levels in the Wenatchee River basin.
56
28. Icicle Creek historic channel and the Leavenworth National Fish Hatchery canal. 59
29. Predicted and observed water temperatures in the Wenatchee River at model calibration (10-16 August 2002) and model confirmation (9-11 September 2002).
61
30. QUAL2Kw model calibration for the Wenatchee River temperature temporal variations (10-16 August 2002).
62
31. QUAL2Kw model confirmation for the Wenatchee River temperature temporal variations (9-11 September 2002).
62
32. Predicted and observed water temperatures for Icicle Creek and LNFH canal at model calibration (10-16 August 2002) and model confirmation (9-11 September 2002).
63
33. Predicted and observed water temperatures for Nason Creek at model calibration (24-30 July 2003) and model confirmation (11-13 August 2003).
64
34. Predicted daily maximum water temperatures in the Wenatchee River for critical conditions during July-August 7Q2 and 7Q10.
69
35. Predicted daily maximum water temperatures for Icicle Creek for critical conditions during July-August 7Q2 and 7Q10.
70
36. Predicted daily maximum water temperatures for Nason Creek for critical conditions during July-August 7Q2 and 7Q10.
71
37. Predicted daily maximum water temperatures in the Wenatchee River for critical conditions during July-August and 7Q10 flow assuming two different headwater
72
38. Load allocations for effective shade for various bankfull width and aspect of streams in the Wenatchee River basin assuming a riparian vegetation height of 28 m and a canopy density of 77%.
75

Page v
List of Tables Page
1. 1998 303(d) listings for temperature in the Wenatchee River watershed 1
2. Factors that influence stream shade. 9
3. Land cover in the Wenatchee River watershed. 17
4. Summary of maximum water temperatures in the Wenatchee River basin during 2002. 32
5. Summary of maximum water temperatures in the Wenatchee River basin during 2003. 33
6. Low flow statistics for July-August at USGS gaging stations in the Wenatchee River basin.
46
7. Estimated daily maximum and minimum air temperatures on weeks and days with the highest daily mean air temperatures for a median year and 90th percentile year at the NOAA-COOP station in Leavenworth.
48
8. Maximum tree heights in the Wenatchee River basin. 52
9. QMD classes in the Icicle Creek riparian buffer. 53
10. Near-stream potential vegetation heights and densities in the Wenatchee River basin. 54
11. Summary of RMSE of differences between the predicted and observed daily maximum and minimum temperatures in the Wenatchee River basin.
60
12. Summary of RMSE of differences between the predicted and observed daily temperatures in the Wenatchee River basin – temporal variation.
60
13. Summary of average predicted daily mean/maximum water temperatures at critical conditions in the Wenatchee River basin.
67
14. Wasteload allocation for effluent temperatures for selected NPDES dischargers in the Wenatchee River basin for the current standard.
76
15. Wasteload allocation for effluent temperatures for selected NPDES dischargers in the Wenatchee River basin for the revised standard.
76

Page vi
This page is purposely left blank for duplex printing.
Page vii
Abstract The Wenatchee River and some of its tributaries – Chiwaukum Creek, Icicle Creek, Little Wenatchee River, Nason Creek, Mission Creek, and Peshastin Creek – are included in the 1998 303(d) list for impaired waters for temperature in Washington State. As part of the Wenatchee River Total Maximum Daily Load (TMDL) study for temperature, the Washington State Department of Ecology conducted field work during 2002-2003. This report presents an analysis of the stream water spatial and temporal temperature patterns of selected streams in the Wenatchee River basin based on instream data and thermal infrared radiation (TIR) surveys from 2002 and 2003. A stream temperature model, QUAL2Kw, was used to investigate possible thermal behaviors of the streams for different meteorological, shade, and flow conditions. Reductions in water temperature are predicted for hypothetical conditions with mature riparian vegetation and improvements in riparian microclimate. Model simulations performed at 7-day average with 10-year return (7Q10) period flow conditions show that an average reduction of 2.7ºC is expected compared with the current conditions. Potential reduced temperatures are predicted to be less than the threshold for fish lethality of 23ºC, but greater than 18ºC in Class A and greater than 16ºC in Class AA waters in some or most of the segments in all streams that were evaluated. This technical assessment uses effective shade as a surrogate measure of heat flux to fulfill the requirements of the federal Clean Water Act Section 303(d) for a temperature TMDL. Effective shade is defined as the fraction of incoming solar shortwave radiation that is blocked by vegetation and topography from reaching the surface of the stream. In addition to load allocations for effective shade, other management activities are recommended for compliance with the water quality standards for water temperature.
Page viii
Acknowledgements The Wenatchee River Basin TMDL study is the result of a partnership between the Department of Ecology and the Water Resource Inventory Area (WRIA) 45 Water Quality Technical Subcommittee (consisting of Ecology TMDL staff and the WRIA 45 Watershed Planning Unit’s Water Quality Subcommittee). Ecology authored this TMDL technical report for temperature, and the Water Quality Technical Subcommittee reviewed, discussed, and commented on the report. The authors would like to thank the following Department of Ecology staff for their contributions to this study:
• Dave Schneider for review of the draft report and coordination of the public review process.
• Karol Erickson for review of the draft report and many valuable comments.
• Dustin Bilhimer for extensive field work and analysis of environmental data.
• Joan LeTourneau for formatting and editing the final report.
Page ix
,
Wenatchee River Temperature Total Maximum Daily Load Study
Executive Summary
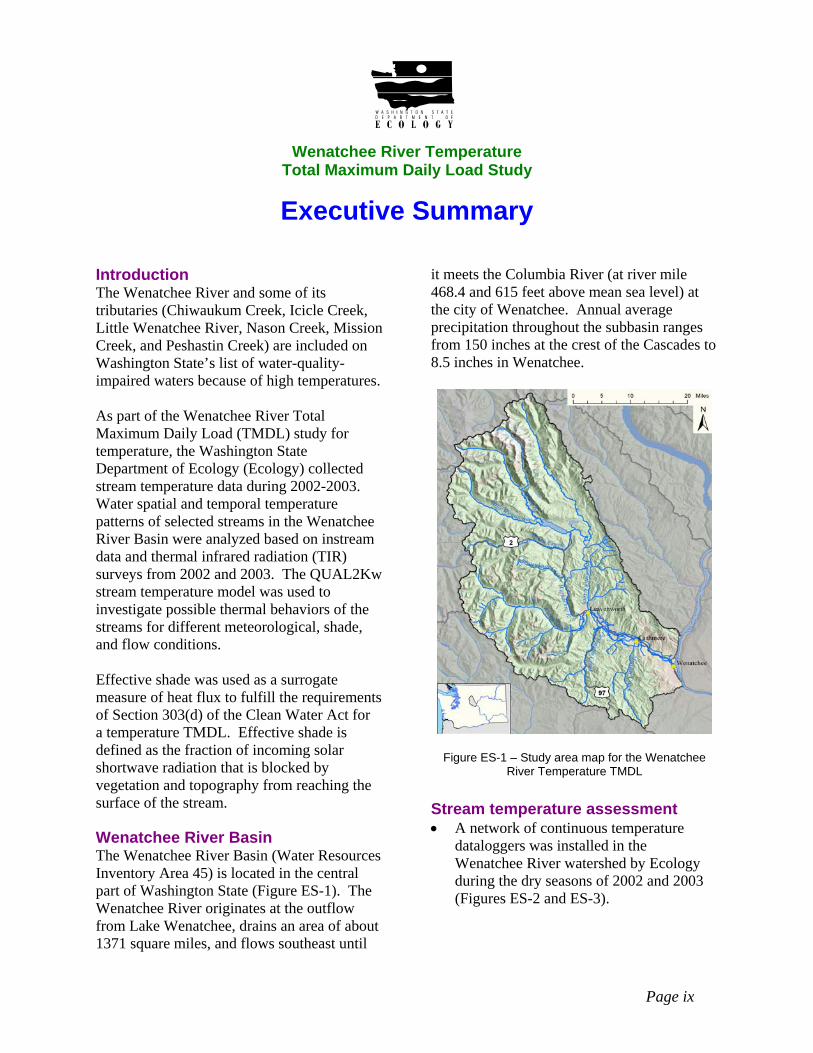
Introduction The Wenatchee River and some of its tributaries (Chiwaukum Creek, Icicle Creek, Little Wenatchee River, Nason Creek, Mission Creek, and Peshastin Creek) are included on Washington State’s list of water-quality-impaired waters because of high temperatures. As part of the Wenatchee River Total Maximum Daily Load (TMDL) study for temperature, the Washington State Department of Ecology (Ecology) collected stream temperature data during 2002-2003. Water spatial and temporal temperature patterns of selected streams in the Wenatchee River Basin were analyzed based on instream data and thermal infrared radiation (TIR) surveys from 2002 and 2003. The QUAL2Kw stream temperature model was used to investigate possible thermal behaviors of the streams for different meteorological, shade, and flow conditions. Effective shade was used as a surrogate measure of heat flux to fulfill the requirements of Section 303(d) of the Clean Water Act for a temperature TMDL. Effective shade is defined as the fraction of incoming solar shortwave radiation that is blocked by vegetation and topography from reaching the surface of the stream. Wenatchee River Basin The Wenatchee River Basin (Water Resources Inventory Area 45) is located in the central part of Washington State (Figure ES-1). The Wenatchee River originates at the outflow from Lake Wenatchee, drains an area of about 1371 square miles, and flows southeast until
it meets the Columbia River (at river mile 468.4 and 615 feet above mean sea level) at the city of Wenatchee. Annual average precipitation throughout the subbasin ranges from 150 inches at the crest of the Cascades to 8.5 inches in Wenatchee.
Figure ES-1 – Study area map for the Wenatchee River Temperature TMDL
Stream temperature assessment • A network of continuous temperature
dataloggers was installed in the Wenatchee River watershed by Ecology during the dry seasons of 2002 and 2003 (Figures ES-2 and ES-3).

Page x
• In general, the warmest temperatures were found at downstream locations in the Wenatchee River, Icicle Creek, and Nason Creek, and cooler temperatures were found in relatively small tributaries or headwater locations. Stream temperature is higher in the historic channel of Icicle Creek due to low flows and modified hydraulic conditions.
Water Quality Standards The observed stream temperatures in the Wenatchee River watershed during 2002 and 2003 showed that current conditions at many locations are warmer than the current and proposed revised water quality numeric criteria. In addition, many locations were found to be cooler than the temperature numeric criteria. Washington State water quality standards state: “Temperature shall not exceed 16.0°C for Class AA waters and 18.0°C for Class A waters due to human activities. When natural conditions exceed standards, no temperature increases will be allowed which will raise the receiving water temperature by greater than 0.3°C.” [WAC 173-201A-030(1)] The TMDL stream temperature target is the respective 16/18°C and an improved riparian corridor. The natural conditions in some portions of the watershed are likely to be warmer than the 16/18°C numeric criteria of the state standards during critical conditions. The natural conditions provision of the water quality standard is the basis of the load allocations in this TMDL: "Whenever the natural conditions of said waters are of a lower quality than the criteria assigned, the natural conditions shall constitute the water quality criteria [WAC 173-201A-070(2)]."
#S
$T
#S
%U
%U
#S
#S
#S
%U
$T
%U
#S
$T
%U
%U
$T
#S%U
%U#S
#S
#S
#S
#S#S
#S
#S
#S
#S
%U
%U#S
$T
#S#S
$T
#S
$T
$T#S
#S
$T
#S
#S
$T$T#S
#S
#S
streamsmajor streamswaterbodies
Maximum daily max temperature (deg C)$T 12 - 14 deg C$T 14 - 16#S 16 - 18#S 18 - 21%U 21 - 23%U 23 - 30
10 0 10 Kilometers
N
#S
$T
#S
%U
%U
#S
#S
#S
%U
$T
%U
#S
$T
%U
%U
$T
#S%U
%U#S
#S
#S
#S
#S#S
#S
#S
#S
#S
%U
%U#S
$T
#S#S
$T
#S
$T
$T#S
#S
$T
#S
#S
$T$T#S
#S
#S
streamsmajor streamswaterbodies
Maximum daily max temperature (deg C)$T 12 - 14 deg C$T 14 - 16#S 16 - 18#S 18 - 21%U 21 - 23%U 23 - 30
10 0 10 Kilometers
N
Figure ES-2 – The highest daily maximum water temperatures in the Wenatchee River Basin
during 2002
$T %U
#S$T
#S
%U
$T
%U
%U#S
%U
%U
#S#S
%U
%U
#S
#S
%U %U%U%U
%U
%U
#S #S #S%U%U
#S
%U
$T #S#S
$T
%U#S
#S
%U
#S
#S
#S
#S%U
#S
#S
$T
N
10 0 10 Kilometers
streamswaterbodiesmajor streams
Maximum daily max temperature (deg C)$T 12 - 14 deg C$T 14 - 16#S 16 - 18#S 18 - 20%U 20 - 23%U 23 - 30
Figure ES-3 – The highest daily maximum water temperatures in the Wenatchee River Basin
during 2003
Stream temperature modeling • Near-stream vegetation cover, along with
channel morphology and stream hydrology, represent the most important factors that influence stream temperature. Stream temperature modeling predicts reductions in water temperature for hypothetical conditions with mature riparian vegetation, improvements in riparian microclimate, and reduced channel widths. Model simulations performed at 7-day average 10-year return
Page xi
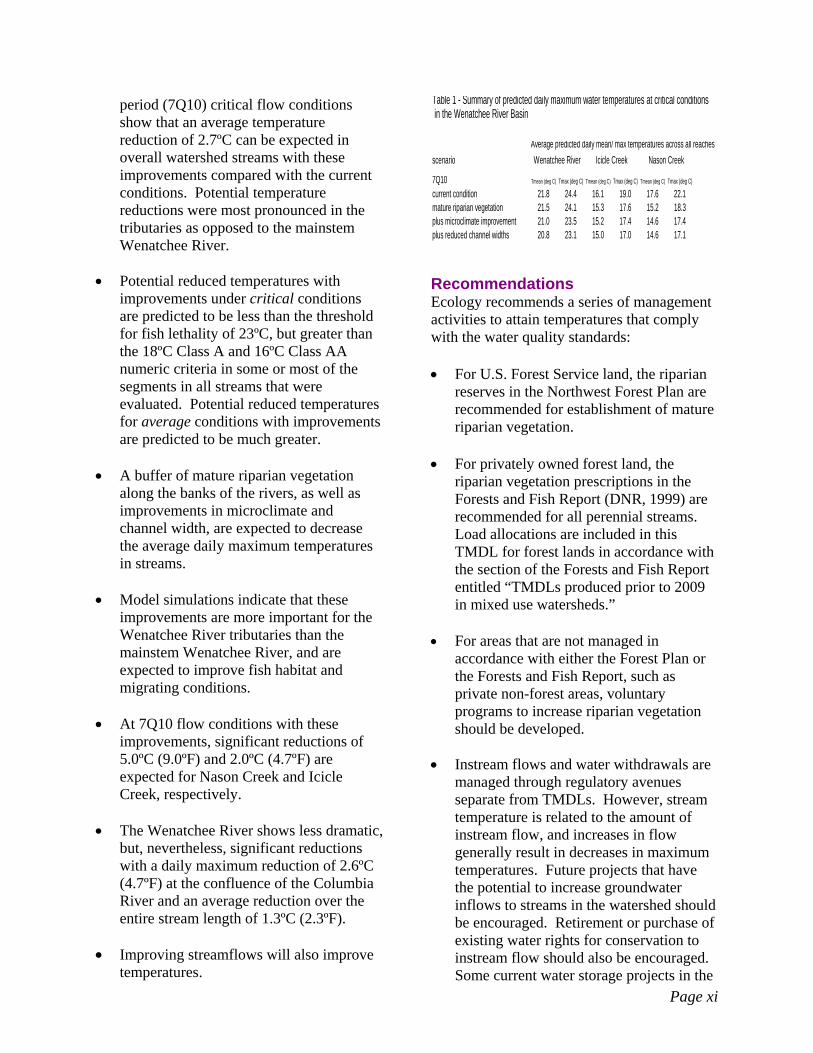
period (7Q10) critical flow conditions show that an average temperature reduction of 2.7ºC can be expected in overall watershed streams with these improvements compared with the current conditions. Potential temperature reductions were most pronounced in the tributaries as opposed to the mainstem Wenatchee River.
• Potential reduced temperatures with
improvements under critical conditions are predicted to be less than the threshold for fish lethality of 23ºC, but greater than the 18ºC Class A and 16ºC Class AA numeric criteria in some or most of the segments in all streams that were evaluated. Potential reduced temperatures for average conditions with improvements are predicted to be much greater.
• A buffer of mature riparian vegetation along the banks of the rivers, as well as improvements in microclimate and channel width, are expected to decrease the average daily maximum temperatures in streams.
• Model simulations indicate that these
improvements are more important for the Wenatchee River tributaries than the mainstem Wenatchee River, and are expected to improve fish habitat and migrating conditions.
• At 7Q10 flow conditions with these
improvements, significant reductions of 5.0ºC (9.0ºF) and 2.0ºC (4.7ºF) are expected for Nason Creek and Icicle Creek, respectively.
• The Wenatchee River shows less dramatic,
but, nevertheless, significant reductions with a daily maximum reduction of 2.6ºC (4.7ºF) at the confluence of the Columbia River and an average reduction over the entire stream length of 1.3ºC (2.3ºF).
• Improving streamflows will also improve
temperatures.
Table 1 - Summary of predicted daily maximum water temperatures at critical conditionsin the Wenatchee River Basin
Average predicted daily mean/ max temperatures across all reachesscenario
7Q10 Tmean (deg C) Tmax (deg C) Tmean (deg C) Tmax (deg C) Tmean (deg C) Tmax (deg C)
current condition 21.8 24.4 16.1 19.0 17.6 22.1mature riparian vegetation 21.5 24.1 15.3 17.6 15.2 18.3plus microclimate improvement 21.0 23.5 15.2 17.4 14.6 17.4plus reduced channel widths 20.8 23.1 15.0 17.0 14.6 17.1
Wenatchee River Icicle Creek Nason Creek
Recommendations Ecology recommends a series of management activities to attain temperatures that comply with the water quality standards: • For U.S. Forest Service land, the riparian
reserves in the Northwest Forest Plan are recommended for establishment of mature riparian vegetation.
• For privately owned forest land, the
riparian vegetation prescriptions in the Forests and Fish Report (DNR, 1999) are recommended for all perennial streams. Load allocations are included in this TMDL for forest lands in accordance with the section of the Forests and Fish Report entitled “TMDLs produced prior to 2009 in mixed use watersheds.”
• For areas that are not managed in accordance with either the Forest Plan or the Forests and Fish Report, such as private non-forest areas, voluntary programs to increase riparian vegetation should be developed.
• Instream flows and water withdrawals are
managed through regulatory avenues separate from TMDLs. However, stream temperature is related to the amount of instream flow, and increases in flow generally result in decreases in maximum temperatures. Future projects that have the potential to increase groundwater inflows to streams in the watershed should be encouraged. Retirement or purchase of existing water rights for conservation to instream flow should also be encouraged. Some current water storage projects in the

Page xii
area collect water during high runoff periods, and release that water during critical low-flow periods to provide benefits for irrigation, habitat, wildlife, and fish. In addition, other water storage projects that have the potential to increase instream flows during critical periods should be evaluated.
• Management activities should control
potential channel widening processes. Reductions in channel width are expected as mature riparian vegetation is established. Management activities that would reduce the loading of sediment to the surface waters from upland and channel erosion are also recommended.
• Hyporheic exchange flows and
groundwater discharges are important to maintain the current temperature regime and reduce maximum daily instream temperatures. Factors that influence hyporheic exchange flow include the vertical hydraulic gradient between surface and subsurface waters as well as the hydraulic conductivity of streambed sediments. Activities that reduce the hydraulic conductivity of streambed sediments could increase stream temperatures. Management activities should reduce upland and channel erosion and avoid sedimentation of fine materials in the stream substrate.
• To determine the effects of management
strategies within the Wenatchee River Basin, regular monitoring is recommended. Continuously-recording water temperature monitors should be deployed from July through August to capture the critical conditions. The following locations are suggested for a minimal sampling program:
Wenatchee River near mouth Icicle Creek near mouth Nason Creek near mouth Peshastin Creek near mouth Mission Creek near mouth
• Shade management practices involve the development of mature riparian vegetation, which requires many years to become established. Figure ES-4 shows an effective shade deficit map that can be used to prioritize reaches that need riparian restoration efforts. Data on spawning area locations can be compared against the shade deficit map to further prioritize reaches that need riparian restoration. Also, TIR images can be useful for describing spatial distribution patterns of the surveyed streams water temperature. The TIR and visible band images are effective tools to map cold-water refuge for fish and to detect regions that can be improved for fish survival.
#########################
################################################
###########
############################################################
##############################################################################################
###############################################################################
#####
############################################
#######################################
10 0 10 20 Kilometers
Nstreamswaterbodies
Effective shade deficit# < 5%# 5 - 20%# 20 - 35%# 35 - 100%
Figure ES-4 – Effective shade deficit in the
Wenatchee River Basin
• Interim monitoring of water temperatures during summer is recommended, perhaps at 5-year intervals.
• Interim monitoring of the composition and
extent of riparian vegetation is also recommended (for example, by using photogrammetry or remote sensing methods, hemispherical photography, angular canopy densiometers, or solar pathfinder instruments).
Page 1
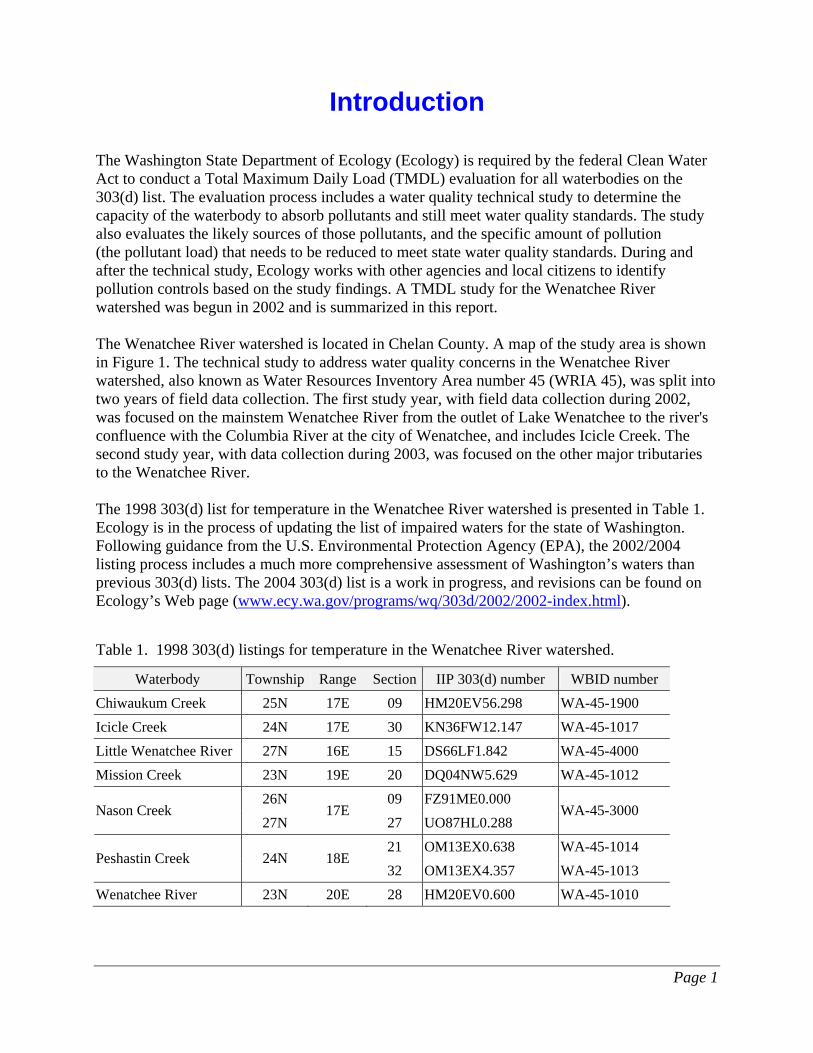
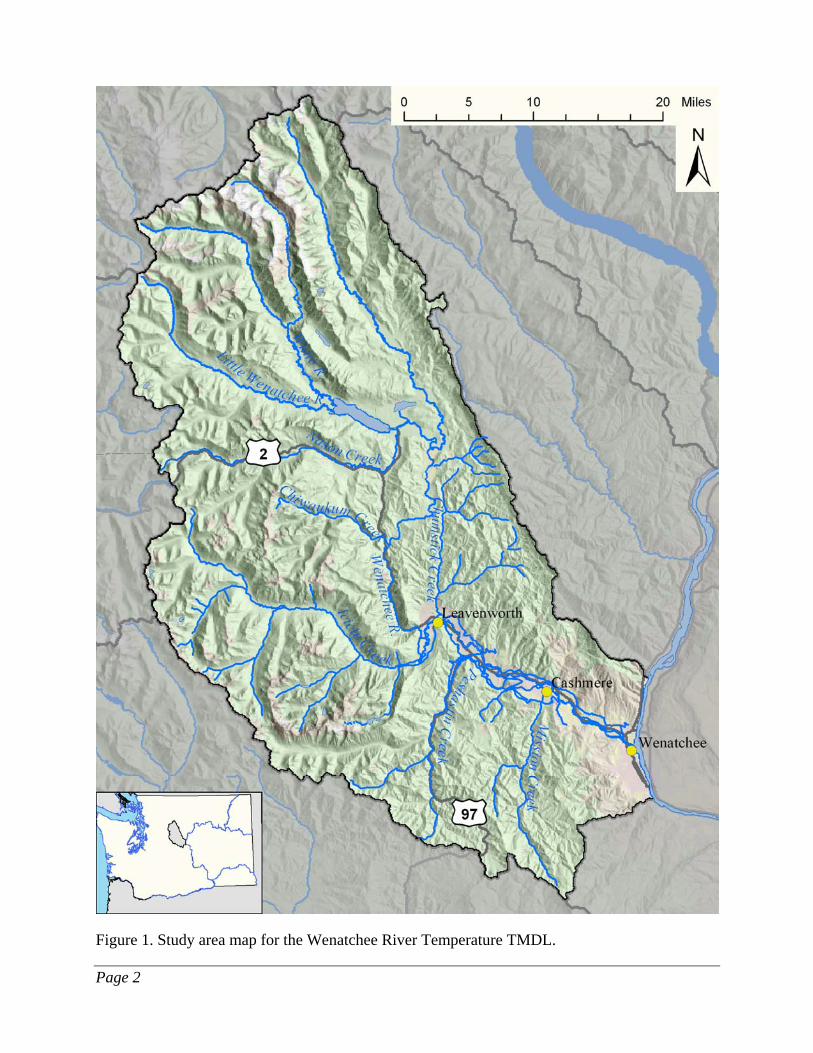
Introduction The Washington State Department of Ecology (Ecology) is required by the federal Clean Water Act to conduct a Total Maximum Daily Load (TMDL) evaluation for all waterbodies on the 303(d) list. The evaluation process includes a water quality technical study to determine the capacity of the waterbody to absorb pollutants and still meet water quality standards. The study also evaluates the likely sources of those pollutants, and the specific amount of pollution (the pollutant load) that needs to be reduced to meet state water quality standards. During and after the technical study, Ecology works with other agencies and local citizens to identify pollution controls based on the study findings. A TMDL study for the Wenatchee River watershed was begun in 2002 and is summarized in this report. The Wenatchee River watershed is located in Chelan County. A map of the study area is shown in Figure 1. The technical study to address water quality concerns in the Wenatchee River watershed, also known as Water Resources Inventory Area number 45 (WRIA 45), was split into two years of field data collection. The first study year, with field data collection during 2002, was focused on the mainstem Wenatchee River from the outlet of Lake Wenatchee to the river's confluence with the Columbia River at the city of Wenatchee, and includes Icicle Creek. The second study year, with data collection during 2003, was focused on the other major tributaries to the Wenatchee River. The 1998 303(d) list for temperature in the Wenatchee River watershed is presented in Table 1. Ecology is in the process of updating the list of impaired waters for the state of Washington. Following guidance from the U.S. Environmental Protection Agency (EPA), the 2002/2004 listing process includes a much more comprehensive assessment of Washington’s waters than previous 303(d) lists. The 2004 303(d) list is a work in progress, and revisions can be found on Ecology’s Web page (www.ecy.wa.gov/programs/wq/303d/2002/2002-index.html). Table 1. 1998 303(d) listings for temperature in the Wenatchee River watershed.
Waterbody Township Range Section IIP 303(d) number WBID number Chiwaukum Creek 25N 17E 09 HM20EV56.298 WA-45-1900 Icicle Creek 24N 17E 30 KN36FW12.147 WA-45-1017 Little Wenatchee River 27N 16E 15 DS66LF1.842 WA-45-4000 Mission Creek 23N 19E 20 DQ04NW5.629 WA-45-1012
26N 09 FZ91ME0.000 Nason Creek
27N 17E
27 UO87HL0.288 WA-45-3000
21 OM13EX0.638 WA-45-1014 Peshastin Creek 24N 18E
32 OM13EX4.357 WA-45-1013 Wenatchee River 23N 20E 28 HM20EV0.600 WA-45-1010
Page 2
Figure 1. Study area map for the Wenatchee River Temperature TMDL.

Page 3
Overview of stream heating processes The temperature of a stream reflects the amount of heat energy in the water. Changes in water temperature within a particular segment of a stream are induced by the balance of heat exchange between the water and the surrounding environment during transport through the segment. If there is more heat energy entering the water in a stream segment than there is leaving, then the temperature will increase. If there is less heat energy entering the water in a stream segment than leaving, the temperature will decrease. The general relationships between stream parameters, thermodynamic processes (heat and mass transfer), and stream temperature change are outlined in Figure 2.
Figure 2. Conceptual model of factors that affect stream temperature.
Page 4
Adams and Sullivan (1989) reported that the following environmental variables were the most important drivers of water temperature in forested streams:
• Stream depth. Stream depth is the most important variable of stream size for evaluating energy transfer. Stream depth affects both the magnitude of the stream temperature fluctuations and the response time of the stream to changes in environmental conditions.
• Solar radiation and riparian vegetation. The daily maximum temperatures in a stream are strongly influenced by removal of riparian vegetation because of diurnal patterns of solar heat flux. Daily average temperatures are less affected by removal of riparian vegetation.
• Groundwater. Inflows of groundwater can have an important cooling effect on stream temperature. This effect will depend on the rate of groundwater inflow relative to the flow in the stream and the difference in temperatures between the groundwater and the stream.
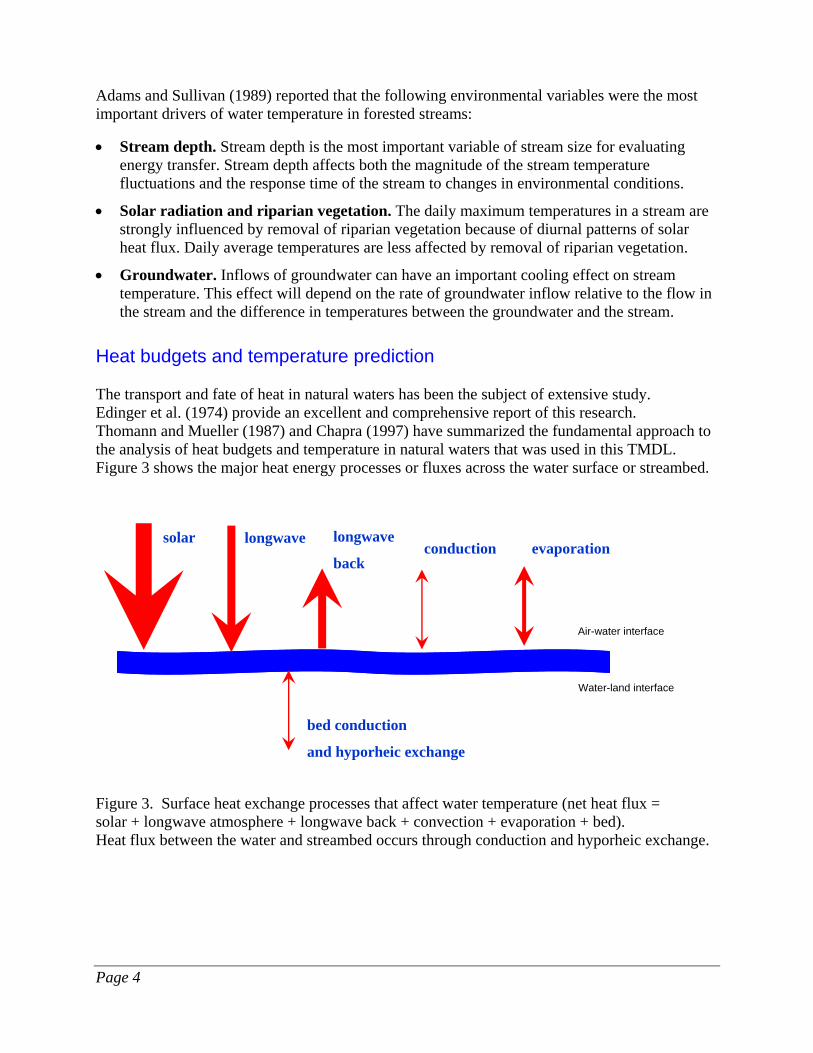
Heat budgets and temperature prediction The transport and fate of heat in natural waters has been the subject of extensive study. Edinger et al. (1974) provide an excellent and comprehensive report of this research. Thomann and Mueller (1987) and Chapra (1997) have summarized the fundamental approach to the analysis of heat budgets and temperature in natural waters that was used in this TMDL. Figure 3 shows the major heat energy processes or fluxes across the water surface or streambed.
Figure 3. Surface heat exchange processes that affect water temperature (net heat flux = solar + longwave atmosphere + longwave back + convection + evaporation + bed). Heat flux between the water and streambed occurs through conduction and hyporheic exchange.
bed conduction
and hyporheic exchange
Air-water interface
solar longwave longwave
back conduction evaporation
Water-land interface

Page 5
The heat exchange processes with the greatest magnitude are as follows (Edinger et al., 1974):
• Shortwave solar radiation. Shortwave solar radiation is the radiant energy which passes directly from the sun to the earth. Shortwave solar radiation is contained in a wavelength range between 0.14 µm and about 4 µm. At Washington State University’s (WSU) Tree Forest Research and Extension Center (TFREC) station in Wenatchee, the daily average global shortwave solar radiation for August 2002 was 259 W/m2. The peak values during daylight hours are typically about three times higher than the daily average. Shortwave solar radiation constitutes the major thermal input to an un-shaded body of water during the day when the sky is clear.
• Longwave atmospheric radiation. The longwave radiation from the atmosphere ranges in wavelength from about 4 µm to 120 µm. Longwave atmospheric radiation depends primarily on air temperature and humidity and increases as both of those increase. It constitutes the major thermal input to a body of water at night and on warm cloudy days. The daily average heat flux from longwave atmospheric radiation typically ranges from about 300 to 450 W/m2 at mid latitudes (Edinger et al., 1974).
• Longwave back radiation from the water to the atmosphere. Water sends heat energy back to the atmosphere in the form of longwave radiation in the wavelength range from about 4 µm to 120 µm. Back radiation accounts for a major portion of the heat loss from a body of water. Back radiation increases as water temperature increases. The daily average heat flux out of the water from longwave back radiation typically ranges from about 300 to 500 W/m2
(Edinger et al., 1974). An example of the estimated surface heat fluxes in the Wenatchee River near the town of Monitor (RM 7.0) during August 2002 is shown in Figure 4. The daily maximum temperatures in a stream are strongly influenced by removal of riparian vegetation because of diurnal patterns of solar shortwave heat flux (Adams and Sullivan, 1989). The net heat flux into a stream can be managed by increasing the shade from vegetation, which reduces the shortwave solar flux. Other processes – such as longwave radiation, convection, evaporation, bed conduction, or hyporheic exchange – also influence the net heat flux into or out of a stream. Heat exchange between the stream and the streambed has an important influence on water temperature. The temperature of the streambed is typically warmer than the overlying water at night and cooler than the water during the daylight hours (Figure 5). Heat is typically transferred from the water into the streambed during the day then back into the stream during the night (Adams and Sullivan, 1989). This has the effect of dampening the diurnal range of stream temperature variations without affecting the daily average stream temperature. The bulk temperature of a vertically mixed volume of water in a stream segment under natural conditions tends to increase or decrease with time during the day according to whether the net heat flux is either positive or negative. When the sun is not shining, the water temperature tends toward the dew-point temperature (Edinger et al., 1974; Brady et al., 1969). The equilibrium temperature of a natural body of water is defined as the temperature at which the water is in equilibrium with its surrounding environment and the net rate of surface heat exchange would be zero (Edinger et al., 1968; Edinger et al., 1974).

Page 6
-600
-400
-200
0
200
400
600
800
1000
8/1/02 8/8/02 8/15/02 8/22/02 8/29/02
Date/Time
Hea
t flu
x (W
/m^2
)solarlongwave atmosphericair convectionsediment conductionevaporationlongwave back
Figure 4. Estimated surface heat fluxes in the Wenatchee River near Monitor (RM 7.0) during August 2002 (net heat flux = solar + longwave atmosphere + longwave back + air convection + evaporation + sediment conduction) The dominant contribution to the seasonal variations in the equilibrium temperature of water is from seasonal variations in the dew-point temperature (Edinger et al., 1974). The main source of hourly fluctuations in water temperature during the day is solar radiation. Solar radiation generally reaches a maximum during the day when the sun is highest in the sky unless cloud cover or shade from vegetation interferes. The complete heat budget for a stream also accounts for the mass transfer processes which depend on the amount of flow and the temperature of water flowing into and out of a particular volume of water in a segment of a stream. Mass transfer processes in open channel systems can occur through advection, dispersion, and mixing with tributaries and groundwater inflows and outflows. Mass transfer relates to transport of flow volume downstream, instream mixing, and the introduction or removal of water from a stream. For instance, flow from a tributary will cause a temperature change in the mainstem river if the temperature is different in the two waterbodies.

Page 7
17
18
19
20
21
22
23
7/26/03 12:00AM
7/27/03 12:00AM
7/28/03 12:00AM
7/29/03 12:00AM
7/30/03 12:00AM
7/31/03 12:00AM
8/1/03 12:00AM
8/2/03 12:00AM
8/3/03 12:00AM
8/4/03 12:00AM
8/5/03 12:00AM
Measurement date/time
Wat
er te
mpe
ratu
re (d
eg C
)
Stream thermistor
Hyporheic tidbit 0.40 ft below streambed
Figure 5. Example of water and streambed temperatures at the end of July and beginning of August 2002 (Wenatchee River at USGS gage near Peshastin, RM 21.5). Thermal role of riparian vegetation The role of riparian vegetation in maintaining a healthy stream condition and water quality is well documented and accepted in the scientific literature. Summer stream temperature increases due to the removal of riparian vegetation is well documented (e.g., Holtby, 1988; Lynch et al., 1984; Rishel et al., 1982; Patric, 1980; Swift and Messer, 1971; Brown et al., 1971; and Levno and Rothacher, 1967). These studies generally support the findings of Brown and Krygier (1970) that loss of riparian vegetation results in larger daily temperature variations and elevated monthly and annual temperatures. Adams and Sullivan (1989) also concluded that daily maximum temperatures are strongly influenced by the removal or riparian vegetation because of the effect of diurnal fluctuations in solar heat flux. Summaries of the scientific literature on the thermal role of riparian vegetation in forested and agricultural areas are provided by Belt et al., 1992; Beschta et al., 1987; Bolton and Monahan, 2001; Castelle and Johnson, 2000; CH2MHill, 2000; GEI, 2002; Ice, 2001; and Wenger, 1999. All of these summaries recognize that the scientific literature indicates that riparian vegetation plays an important role in controlling stream temperature.

Page 8
The list of important benefits that riparian vegetation has upon the stream temperature includes:
• Near-stream vegetation height, width, and density combine to produce shadows that can reduce solar heat flux to the surface of the water.
• Riparian vegetation creates a thermal microclimate that generally maintains cooler air temperatures, higher relative humidity, lower wind speeds, and cooler ground temperatures along stream corridors.
• Near-stream vegetation increases bank stability. Channel morphology is often highly influenced by land cover type and condition. Near-stream vegetation affects flood plain and instream roughness, contributing coarse woody debris and influencing sedimentation, stream substrate compositions, and streambank stability.
The warming of water temperatures as a stream flows downstream is a natural process. However, the rates of heating can be dramatically reduced when high levels of shade exist and heat flux from solar radiation is minimized. The overriding justification for increases in shade from riparian vegetation is to minimize the contribution of solar heat flux in stream heating. There is a natural maximum level of shade that a given stream is capable of attaining. The importance of shade decreases as the width of a stream increases. The distinction between reduced heating of streams and actual cooling is important. Shade can significantly reduce the amount of heat flux that enters a stream. Whether there is a reduction in the amount of warming of the stream, maintenance of inflowing temperatures, or cooling of a stream as it flows downstream depends on the balance of all of the heat exchange and mass transfer processes in the stream. Effective shade Shade is an important parameter that controls the stream heating derived from solar radiation. Solar radiation has the potential to be one of the largest heat transfer mechanisms in a stream system. Human activities can degrade near-stream vegetation and/or channel morphology, and in turn, decrease shade. Reductions in shade have the potential to cause significant increases in heat delivery to a stream system. Stream shade may be measured or calculated using a variety of methods (Chen, 1996; Chen et al., 1998a,b; Ice, 2001; OWEB, 1999; Teti, 2001). Shade is the amount of solar energy that is obscured or reflected by vegetation or topography above a stream. Effective shade is defined as the fraction or percentage of the total possible solar radiation heat energy that is prevented from reaching the surface of the water:
effective shade = (J1 – J2)/J1 where J1 is the potential solar heat flux above the influence of riparian vegetation and topography and J2 is the solar heat flux at the stream surface. In the Northern Hemisphere, the earth tilts on its axis toward the sun during summer months, allowing longer day length and higher solar altitude, both of which are functions of solar declination (i.e., a measure of the earth’s tilt toward the sun) (Figure 6). Geographic position (i.e., latitude and longitude) fixes the stream to a position on the globe, while aspect provides the stream/riparian orientation (direction of streamflow).

Page 9
vertic
al
horizontal
solarazimuth
solaraltitude
Figure 6. Parameters that affect shade and geometric relationships. Solar altitude is a measure of the vertical angle of the sun’s position relative to the horizon. Solar azimuth is a measure of the horizontal angle of the sun’s position relative to north.
Near-stream vegetation height, width and density describe the physical barriers between the stream and sun that can attenuate and scatter incoming solar radiation (produce shade) (Table 2). The solar position has a vertical component (solar altitude) and a horizontal component (solar azimuth) that are both functions of time/date (solar declination) and the earth’s rotation. Table 2. Factors that influence stream shade.
Description Parameter Season/time Date/time Stream characteristics Aspect, channel width Geographic position Latitude, longitude
Vegetative characteristics Riparian vegetation height, width, and density Solar position Solar altitude, solar azimuth
Bold indicates those factors influenced by human activities.

Page 10
While the interaction of these shade variables may seem complex, the mathematics that describes them is relatively straightforward geometry. Using solar tables or mathematical simulations, the potential daily solar load can be quantified. The shade from riparian vegetation can be measured with a variety of methods, including (Ice, 2001; OWEB, 1999; Teti, 2001):
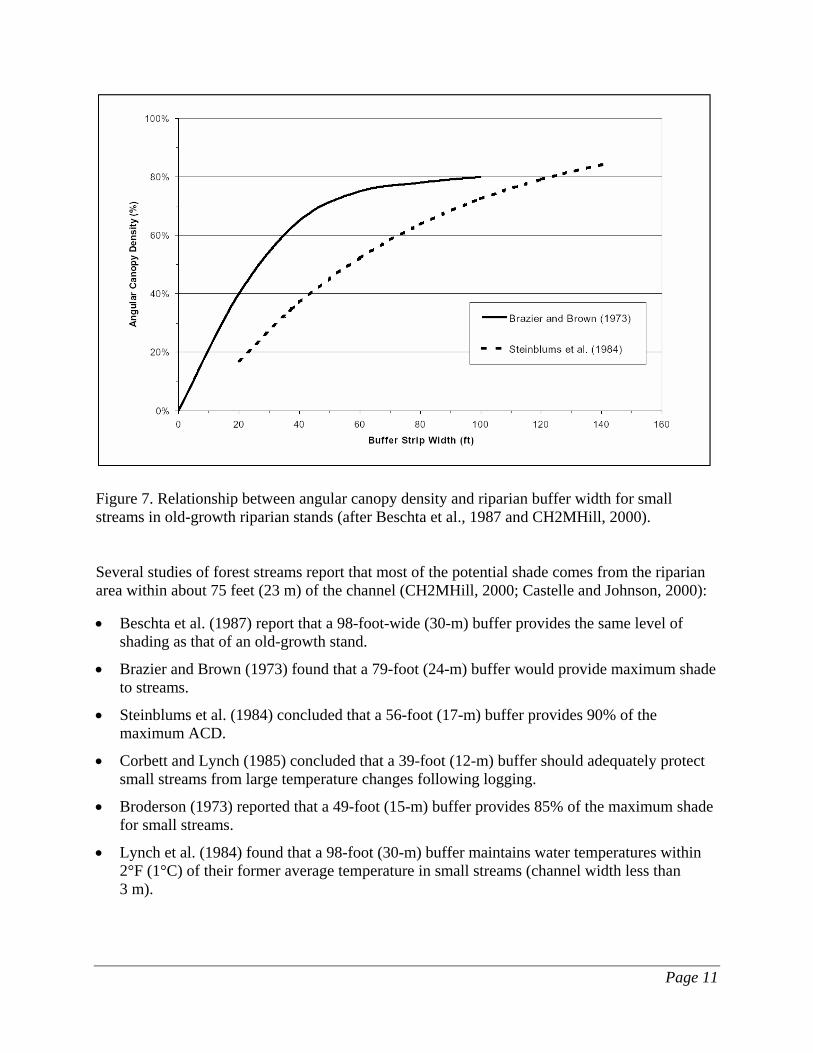
• Hemispherical photography • Angular canopy densiometer • Solar pathfinder Hemispherical photography is generally regarded as the most accurate method for measuring shade, although the equipment that is required is significantly more expensive compared with other methods. Angular canopy densiometers (ACD) provide a good balance of cost and accuracy for measuring the importance of riparian vegetation for preventing increases in stream temperature (Teti, 2001; Beschta et al. 1987). Whereas canopy density is usually expressed as a vertical projection of the canopy onto a horizontal surface, the ACD is a projection of the canopy measured at an angle above the horizon at which direct beam solar radiation passes through the canopy. This angle is typically determined by the position of the sun above the horizon during that portion of the day (usually between 10 A.M. and 2 P.M. in mid to late summer) when the potential solar heat flux is most significant. Typical values of the ACD for old-growth stands in western Oregon have been reported to range from 80% to 90%. Computer programs for the mathematical simulation of shade may also be used to estimate shade from measurements or estimates of the key parameters listed in Table 2 (Ecology, 2003a; Chen, 1996; Chen et al., 1998a,b; Boyd, 1996; Boyd and Park, 1998). Riparian buffers and effective shade Trees in riparian areas provide shade to streams and minimize undesirable water temperature changes (Brazier and Brown, 1973; Steinblums et al., 1984). The shading effectiveness of riparian vegetation is correlated to riparian area width (Figure 7). The shade as represented by angular canopy density (ACD), for a given riparian buffer width varies over space and time because of differences among site potential vegetation, forest development stages (e.g., height and density), and stream width. For example, a 50-foot-wide riparian area with fully developed trees could provide from 45% to 72% of the potential shade in the two studies shown in Figure 7. The Brazier and Brown (1973) shade data show a stronger relationship between ACD and buffer strip width than the Steinblums et al. (1984) data. The r2 correlation for ACD and buffer width was 0.87 and 0.61 in Brazier and Brown (1973) and Steinblums et al. (1984), respectively. This difference supports the use of the Brazier and Brown curve as a basis for measuring shade effectiveness under various riparian buffer proposals. These results reflect the natural variation among old growth sites studied, and show a possible range of potential shade.
Page 11
Figure 7. Relationship between angular canopy density and riparian buffer width for small streams in old-growth riparian stands (after Beschta et al., 1987 and CH2MHill, 2000). Several studies of forest streams report that most of the potential shade comes from the riparian area within about 75 feet (23 m) of the channel (CH2MHill, 2000; Castelle and Johnson, 2000):
• Beschta et al. (1987) report that a 98-foot-wide (30-m) buffer provides the same level of shading as that of an old-growth stand.
• Brazier and Brown (1973) found that a 79-foot (24-m) buffer would provide maximum shade to streams.
• Steinblums et al. (1984) concluded that a 56-foot (17-m) buffer provides 90% of the maximum ACD.
• Corbett and Lynch (1985) concluded that a 39-foot (12-m) buffer should adequately protect small streams from large temperature changes following logging.
• Broderson (1973) reported that a 49-foot (15-m) buffer provides 85% of the maximum shade for small streams.
• Lynch et al. (1984) found that a 98-foot (30-m) buffer maintains water temperatures within 2°F (1°C) of their former average temperature in small streams (channel width less than 3 m).
Page 12
GEI (2002) reviewed the scientific literature related to the effectiveness of buffers for shade protection in agricultural areas in Washington and concluded that buffer widths of 10 m (33 feet) provide nearly 80% of the maximum potential shade in agricultural areas. Wenger (1999) concluded that a minimum continuous buffer width of 10-30 m should be preserved or restored along each side of all streams on a municipal or county-wide scale to provide stream temperature control and maintain aquatic habitat. GEI (2002) considered the recommendations of Wenger (1999) to be relevant for agricultural areas in Washington. Steinblums et al. (1984) concluded that that shade could be delivered to forest streams from beyond 75 feet (22 m) and potentially out to 140 feet (43 m). In some site-specific cases, forest practices between 75 and 140 feet from the channel have the potential to reduce shade delivery by up to 25% of maximum. However, any reduction in shade beyond 75 feet would probably be relatively low on the horizon, and the impact on stream heating would be relatively low because the potential solar radiation decreases significantly as solar elevation decreases. Microclimate - surrounding thermal environment A secondary consequence of near-stream vegetation is its effect on the riparian microclimate. Riparian corridors often produce a microclimate that surrounds the stream where cooler air temperatures, higher relative humidity, and lower wind speeds are characteristic. Riparian microclimates tend to moderate daily air temperatures. Relative humidity increases result from the evapotranspiration that is occurring by riparian plant communities. Wind speed is reduced by the physical blockage produced by riparian vegetation. Riparian buffers commonly occur on both sides of the stream, compounding the edge influence on the microclimate. Brosofske et al. (1997) reported that a buffer width of at least 150 feet (45 m) on each side of the stream was required to maintain a natural riparian microclimate environment in small forest streams (channel width less than 4 m) in the foothills of the western slope of the Cascade Mountains in western Washington, with predominantly Douglas-fir and western hemlock. Bartholow (2000) provided a thorough summary of literature of documented changes to the environment of streams and watersheds associated with extensive forest clearing. Changes summarized by Bartholow (2000) are representative of hot summer days and indicate the mean daily effect unless otherwise indicated:
• Air temperature. Edgerton and McConnell (1976) showed that removing all or a portion of the tree canopy resulted in cooler terrestrial air temperatures at night and warmer temperatures during the day, enough to influence thermal cover sought by elk (Cervus canadensis) on their eastern Oregon summer range. Increases in maximum air temperature varied from 5 to 7ºC for the hottest days (estimate). However, the mean daily air temperature did not appear to have changed substantially since the maximum temperatures were offset by almost equal changes to the minima. Similar temperatures have been commonly reported (Childs and Flint, 1987; Fowler et al., 1987), even with extensive clearcuts (Holtby, 1988). In an evaluation of buffer strip width, Brosofske et al. (1997) found that air temperatures immediately adjacent to the ground increased 4.5ºC during the day and about 0.5ºC at night (estimate). Fowler and Anderson (1987) measured a 0.9ºC air temperature increase in
Page 13
clearcut areas, but temperatures were also 3ºC higher in the adjacent forest. Chen et al. (1993) found similar (2.1ºC) increases. All measurements reported here were made over land instead of water, but in aggregate support about a 2ºC increase in ambient mean daily air temperature resulting from extensive clearcutting.
• Relative humidity. Brosofske et al. (1997) examined changes in relative humidity within 17 to 72 m buffer strips. The focus of their study was to document changes along the gradient from forested to clearcut areas, so they did not explicitly report pre- to post-harvest changes at the stream. However, there appeared to be a reduction in relative humidity at the stream of 7% during the day and 6% at night (estimate). Relative humidity at stream sites increased exponentially with buffer width. Similarly, a study by Chen et al. (1993) showed a decrease of about 11% in mean daily relative humidity on clear days at the edges of clearcuts.
• Wind speed. Brosofske et al. (1997) reported almost no change in wind speed at stream locations within buffer strips adjacent to clearcuts. Speeds quickly approached upland conditions toward the edges of the buffers, with an indication that wind actually increased substantially at distances of about 15 m from the edge of the strip, and then declined farther upslope to pre-harvest conditions. Chen et al. (1993) documented increases in both peak and steady winds in clearcut areas; increments ranged from 0.7 to 1.2 m/s (estimated).
Spence et al. (1996) also provided a summary of literature related to the influence of riparian vegetation on microclimate as follows:
• Chen (1991) reported that soil and air temperatures, relative wind speed, humidity, soil moisture, and solar radiation all changed with increasing distance from the edges of clearcuts in the western Cascades.
• FEMAT (1993) concluded from Chen’s work that the loss of upland forests probably influences conditions within the riparian zone. FEMAT also suggested that riparian buffers for maintaining microclimates need to be wider than those for protecting other riparian functions.
Thermal role of channel morphology Changes in channel morphology (widening) affect stream temperatures. As a stream widens, the surface area exposed to heat flux increases, resulting in increased energy exchange between a stream and its environment (Chapra, 1997). Further, wide channels are likely to have decreased levels of shade due to the increased distance created between vegetation and the wetted channel and the decreased fraction of the stream width that could potentially be covered by shadows from riparian vegetation. Conversely, narrow channels are more likely to experience higher levels of shade. Channel widening is often related to degraded riparian conditions that allow increased streambank erosion and sedimentation of the streambed, both of which correlate strongly with riparian vegetation type and condition (Rosgen, 1996). Channel morphology is not solely dependent on riparian conditions. Sedimentation can deposit material in the channel, fill pools, and aggrade the streambed, reducing channel depth and increasing channel width.

Page 14
Channel modification usually occurs during high flow events. Land uses that affect the magnitude and timing of high flow events may negatively impact channel width and depth. Riparian vegetation conditions will affect the resilience of the streambanks/flood plain during periods of sediment introduction and high flow. Disturbance processes may have differing results depending on the ability of riparian vegetation to shape and protect channels. Channel morphology is related to riparian vegetation composition and condition by:
• Building streambanks. Trap suspended sediments, encourage deposition of sediment in the flood plain, and reduce incoming sources of sediment.
• Maintaining stable streambanks. High rooting strength and high streambank and flood plain roughness prevent streambank erosion.
• Reducing flow velocity (erosive kinetic energy). Supplying large woody debris to the active channel, high pool:riffle ratios and adding channel complexity reduce flow velocities.
Pollutant sources The pollutants targeted in this TMDL are heat from anthropogenic increases in solar radiation loading to the stream network, and heat from warm water discharges of human origin. Riparian vegetation, stream morphology, hydrology, climate, and geographic location influence stream temperature. While climate and geographic location are outside of human control, riparian condition, channel morphology, and hydrology are affected by land use activities. Low summertime flows decrease the thermal assimilative capacity of streams. Pollutant loading causes larger temperature increases in stream segments where flows are reduced. Heat loading from point sources occurs when waters with differing temperatures are mixed. Wasteload allocations are developed for point sources that discharge to temperature-impaired waterbodies or discharge into waterbodies that drain to temperature-impaired waterbodies.
Pollutants and surrogate measures Heat loads to the stream are calculated in this TMDL in units of calories per square centimeter per day or watts per square meter (W/m2). However, heat loads are of limited value in guiding management activities needed to solve identified water quality problems. The Wenatchee River temperature TMDL will incorporate measures other than “daily loads” to fulfill the requirements of Section 303(d). This TMDL allocates other appropriate measures, or “surrogate measures,” as provided under EPA regulations [40 CFR 130.2(i)]. The “Report of the Federal Advisory Committee on the Total Maximum Daily Load (TMDL) Program” (EPA, 1998) includes the following guidance on the use of surrogate measures for TMDL development: “When the impairment is tied to a pollutant for which a numeric criterion is not possible, or where the impairment is identified but cannot be attributed to a single traditional “pollutant,” the state should try to identify another (surrogate) environmental indicator that can be used to

Page 15
develop a quantified TMDL, using numeric analytical techniques where they are available, and best professional judgment (BPJ) where they are not.” Water temperature increases as a result of increased heat flux loads. A loading capacity for radiant heat energy (e.g., incoming solar radiation) can be used to define a reduction target that forms the basis for identifying a surrogate for heat loading from solar radiation. This technical assessment for the Wenatchee River temperature TMDL uses effective shade as a surrogate measure of heat flux from solar radiation to fulfill the requirements of Section 303(d). Effective shade is defined as the fraction of the potential solar shortwave radiation that is blocked by vegetation and topography before it reaches the stream surface. The definition of effective shade allows direct translation of the solar radiation loading capacity. Because factors that affect water temperature are interrelated, the surrogate measure (effective shade) relies on restoring/protecting riparian vegetation to increase stream surface shade levels, reducing streambank erosion, stabilizing channels, reducing the near-stream disturbance zone width, and reducing the surface area of the stream exposed to radiant processes. Effective shade screens the water’s surface from direct rays of the sun. Other factors influencing heat flux and water temperature were also considered, including microclimate, channel geometry, groundwater recharge, and instream flow.

Page 16
This page is purposely left blank for duplex printing.
Page 17
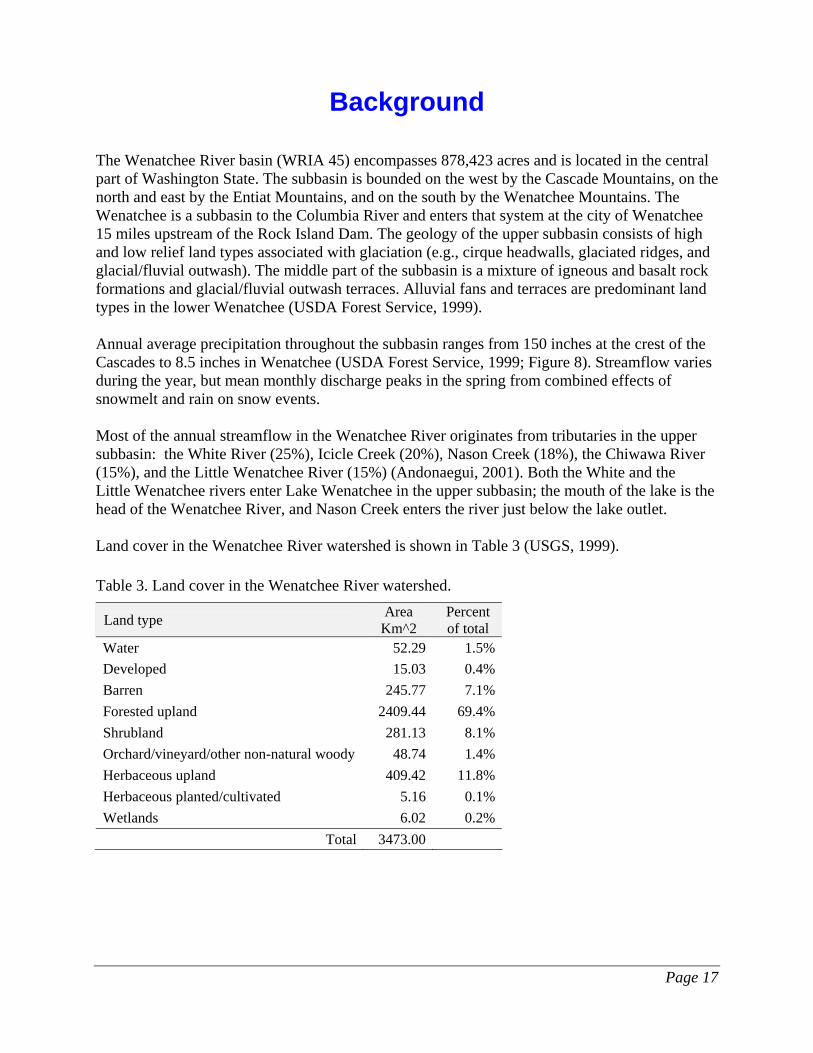
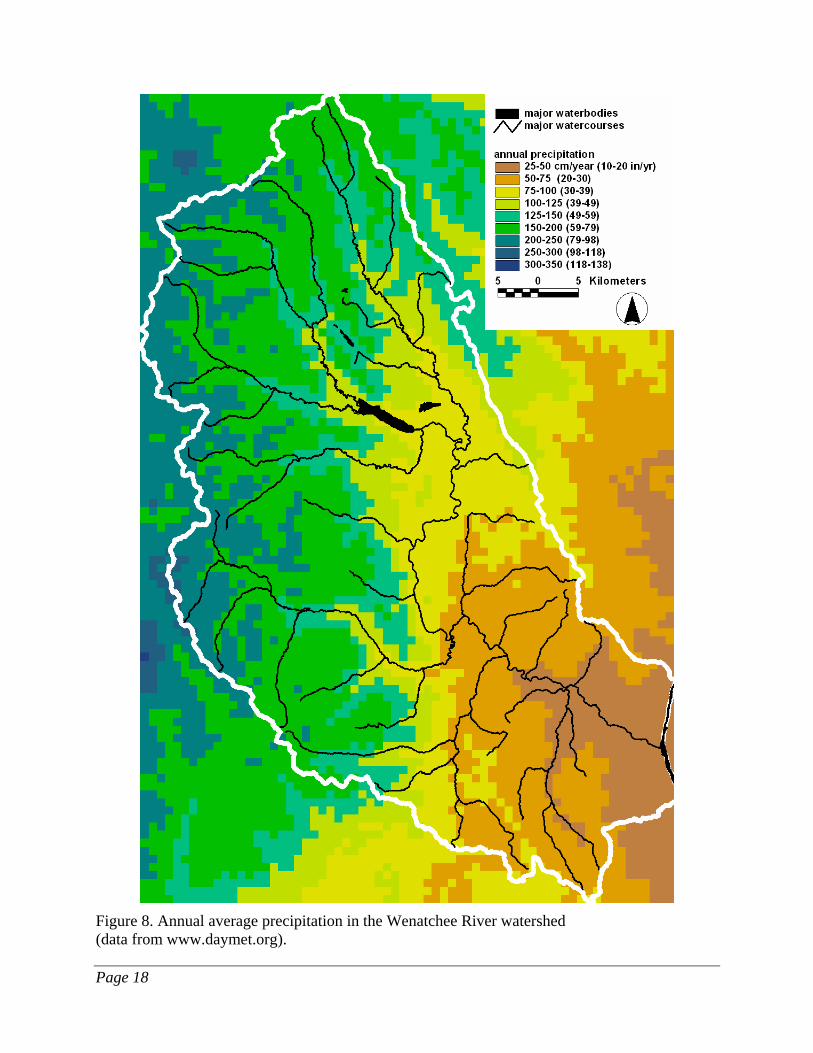
Background The Wenatchee River basin (WRIA 45) encompasses 878,423 acres and is located in the central part of Washington State. The subbasin is bounded on the west by the Cascade Mountains, on the north and east by the Entiat Mountains, and on the south by the Wenatchee Mountains. The Wenatchee is a subbasin to the Columbia River and enters that system at the city of Wenatchee 15 miles upstream of the Rock Island Dam. The geology of the upper subbasin consists of high and low relief land types associated with glaciation (e.g., cirque headwalls, glaciated ridges, and glacial/fluvial outwash). The middle part of the subbasin is a mixture of igneous and basalt rock formations and glacial/fluvial outwash terraces. Alluvial fans and terraces are predominant land types in the lower Wenatchee (USDA Forest Service, 1999). Annual average precipitation throughout the subbasin ranges from 150 inches at the crest of the Cascades to 8.5 inches in Wenatchee (USDA Forest Service, 1999; Figure 8). Streamflow varies during the year, but mean monthly discharge peaks in the spring from combined effects of snowmelt and rain on snow events. Most of the annual streamflow in the Wenatchee River originates from tributaries in the upper subbasin: the White River (25%), Icicle Creek (20%), Nason Creek (18%), the Chiwawa River (15%), and the Little Wenatchee River (15%) (Andonaegui, 2001). Both the White and the Little Wenatchee rivers enter Lake Wenatchee in the upper subbasin; the mouth of the lake is the head of the Wenatchee River, and Nason Creek enters the river just below the lake outlet. Land cover in the Wenatchee River watershed is shown in Table 3 (USGS, 1999). Table 3. Land cover in the Wenatchee River watershed.
Land type Area Km^2
Percent of total
Water 52.29 1.5%Developed 15.03 0.4%Barren 245.77 7.1%Forested upland 2409.44 69.4%Shrubland 281.13 8.1%Orchard/vineyard/other non-natural woody 48.74 1.4%Herbaceous upland 409.42 11.8%Herbaceous planted/cultivated 5.16 0.1%Wetlands 6.02 0.2%
Total 3473.00
Page 18
Figure 8. Annual average precipitation in the Wenatchee River watershed (data from www.daymet.org).

Page 19
Land ownership There is a mixture of federal, state, county, and private land ownership throughout the subbasin. Most of the upper subbasin is designated federal wilderness area and is under the jurisdiction of the U.S. Forest Service Lake Wenatchee and Leavenworth Ranger Districts. East of Peshastin, state highways 2 and 97 parallel much of the Wenatchee mainstem and Nason Creek and contain portions of their streambanks. The incorporated cities designated in the 2000 census are Wenatchee (population 27,856), Cashmere (population 2,965), and Leavenworth (population 2,074). There are smaller unincorporated towns and communities located along State Highways 2 and 97 (2000 census information).
Forest land cover Most of the land area in the Wenatchee River watershed is covered with forest (Table 3). Federally owned forest land is managed according to the USFS Forest Plan. A technical report published by Ecology in 2003 presents the TMDL for water temperature and the load allocations that are required on forest land owned and managed by the USFS in the Wenatchee National Forest (Whiley and Cleland, 2003). Forest land in the watershed that is not owned and managed by the USFS is subject to the Washington State Department of Natural Resources (DNR) Forest and Fish Report. USFS Forest Plan Forest plans are required by the National Forest Management Act (NFMA) for each national forest. These plans establish land allocations, goals and objectives, and standards and guidelines that direct how National Forest System lands are managed. The Aquatic Conservation Strategy, a component of the amended forest plan, is designed to protect and restore the ecological health of the aquatic system and its dependent species. Restoration priorities are based on watershed analysis and planning which will help to determine areas where the greatest benefits can be achieved along with the likelihood of success. In general, watersheds that currently have the best habitat, or those with the greatest potential for recovery, are priority areas for increased protection and for restoration treatments. The conservation strategy aims to maintain the natural disturbance regime. Components of the Aquatic Conservation Strategy include:
• Riparian Reserves: Lands along streams, wetlands, ponds, lakes, and unstable and potentially unstable areas where special standards and guidelines direct land use. Riparian reserves are designed to maintain and restore the ecological health of watersheds and aquatic ecosystems. Interim widths for riparian reserves are established based on ecological, hydrologic, and geomorphic factors. Interim riparian reserves for federal lands are delineated as part of the watershed analysis process based on identification and evaluation of critical hillslope, riparian, and channel processes. Final riparian reserve boundaries are determined at the site-specific level during the appropriate National Environmental Policy Act analysis.
Page 20
• Key Watersheds: A system of refugia comprising watersheds crucial to at-risk fish species and stocks while also providing high quality habitat. Key watersheds are generally those identified as having the best habitat or those with the greatest potential for recovery. Key watersheds are priority areas for increased protection and for restoration treatments. Activities to protect and restore aquatic habitat in key watersheds are a higher priority than similar activities in other watersheds.
• Watershed Analysis: An on-going, iterative analysis procedure for characterizing watershed and ecological processes to meet specific management objectives within the subject watershed. This analysis should enable watershed planning that achieves Aquatic Conservation Strategy objectives. Watershed analysis provides the basis for monitoring and restoration programs and the foundation from which the riparian reserves can be delineated.
• Watershed Restoration: A comprehensive, long-term program of watershed restoration to restore watershed health and aquatic ecosystems, including habitats supporting fish and other aquatic and riparian-dependent organisms.
Riparian reserves are specified for categories of streams or waterbodies as follows:
• Fish-bearing streams - Riparian reserves consist of the stream and the area on each side of the stream extending from the edges of the active stream channel to the top of the inner gorge, or to the outer edges of the 100-year flood plain, or to the outer edges of riparian vegetation, or to a slope distance equal to the height of two site-potential trees, or 300 feet slope distance (600 feet total, including both sides of the stream channel), whichever is greatest.
• Permanently flowing non-fish-bearing streams - Riparian reserves consist of the stream and the area on each side of the stream extending from the edges of the active stream channel to the top of the inner gorge, or to the outer edges of the 100-year flood plain, or to the outer edges of riparian vegetation, or to a slope distance equal to the height of one site-potential tree, or 150 feet slope distance (300 feet total, including both sides of the stream channel), whichever is greatest.
• Specific riparian reserves ranging from 100 to 300 feet of slope distance are also specified for the following categories of riparian areas: constructed ponds and reservoirs; wetlands (greater than one acre), lakes, and natural ponds; seasonally flowing or intermittent streams; wetlands less than one acre; and unstable and potentially unstable areas.
Additional measures are being undertaken within the Wenatchee Forest through a roads analysis. The objective of the roads analysis is to provide critical information needed to identify and manage a minimum road system that is safe and responsive to public needs while having minimal adverse effects on ecological processes and health. This planning action is being accomplished with public and agency (federal and state) input. Water Quality Restoration Plans are Forest Service planning documents that identify Best Management Practice actions appropriate to correct water quality issues within defined drainage areas. These plans will enhance and focus activities to improve shade levels in areas where the plans are developed.
Page 21
Ecology staff are involved in review of USFS planning and implementation activities to ensure that state water quality laws and regulations are being met or exceeded. This includes the responsibility to certify that general water quality Best Management Practices (BMPs) and current Forest Plans are consistent with the federal Clean Water Act. The certification process includes the comparison of state BMPs and USFS BMPs. If Ecology or the USFS determines that USFS BMPs provide less resource protection than state BMPs, the USFS will review their BMPs for amendment. TFW and the Forest and Fish Report In 1986, as an alternative to competitive lobbying and court cases, four caucuses (the Tribes, the timber industry, the state, and the environmental community) decided to try to resolve contentious forest practices problems on non-federal land through negotiations. This resulted in the first Timber Fish Wildlife (TFW) agreement in February 1987. Subsequent events caused the TFW caucuses to again come together at the policy level to address a new round of issues. Under the U.S. Endangered Species Act, several salmonid populations have been listed or considered for listing. In addition, over 660 Washington streams have been included on a 303(d) list identifying stream segments with water quality problems under the Clean Water Act. In November 1996, the caucuses – now expanded from the original four to six with the addition of federal and local governments – decided to work together to develop joint solutions to these problems. The Forest and Fish Report was presented to the Forest Practices Board of the state Department of Natural Resources and the Governor's Salmon Recovery Office in February 1999 (www.wa.gov/dnr/htdocs/fp/fpb/forests&fish.html). The goals of the forestry module of the Forest and Fish Report are fourfold:
1. Provide compliance with the Endangered Species Act for aquatic and riparian-dependent species on non-federal forest lands.
2. Restore and maintain riparian habitat on non-federal forest lands to support a harvestable supply of fish.
3. Meet the requirements of the Clean Water Act for water quality on non-federal forest lands.
4. Keep the timber industry economically viable in the State of Washington. To achieve the overall objectives of the Forest and Fish Initiative, significant changes in current riparian forest management policy are prescribed. The goal of riparian management and conservation as recommended in the Forest and Fish Report is to achieve restoration of high levels of riparian function and maintenance of these levels once achieved. Desired future conditions are the stand conditions of a mature riparian forest, agreed to be 140 years of age (the midpoint between 80 and 200 years) and the attainment of resource objectives. For forests in eastern Washington, such as the forest land in the Wenatchee River watershed, riparian management is intended to provide stand conditions that vary over time within a range that meets functional conditions and maintains general forest health. These desired future conditions are a reference point on the pathway to restoration of riparian functions, not an endpoint of riparian stand development.
Page 22
The riparian functions addressed by the recommendations in the Forest and Fish Report include bank stability, the recruitment of woody debris, leaf litter fall, nutrients, sediment filtering, shade, and other riparian features that are important to both riparian forest and aquatic system conditions. The diversity of riparian forests across the landscapes is addressed by tailoring riparian prescriptions to the site productivity and tree community at specific sites. Load allocations are included in a TMDL for forest lands in the Wenatchee River basin will be proposed in accordance with the section of Forest and Fish entitled “TMDLs produced prior to 2009 in mixed use watersheds”. Also consistent with the Forest and Fish Agreement, implementation of the load allocations established in this TMDL for private and state forestlands will be accomplished via implementation of the revised forest practice regulations. The effectiveness of the Forest and Fish Rules will be measured through the adaptive management process and monitoring of streams in the watershed. The state Department of Natural Resources (DNR) is encouraged to condition forest practices to prohibit any further reduction of stream shade and not waive or modify any shade requirements for timber harvesting activities on state and private lands. Ecology is committed in assisting DNR in identifying those site-specific situations where reduction of shade has the potential for or could cause material damage to public resources. New emergency rules for roads also apply. These include new road construction standards, as well as new standards and a schedule for upgrading existing roads. Under the new rules, roads must provide for better control of road-related sediments, provide better streambank stability protection, and meet current Best Management Practices. DNR is also responsible for oversight of these activities. The Department of Ecology policy for considering the Forest and Fish Report in temperature TMDLs is as follows: Load allocations in the technical report are generally established in accordance with Schedule M-2 of the Forest and Fish Report, February 1999 (www.wa.gov/dnr/htdocs/fp/fpb/forests&fish.html). Also consistent with the Forest and Fish Agreement, implementation of the load allocations for private and state forest lands are generally accomplished via implementation of the revised forest practice regulations. The effectiveness of the Forest and Fish Rules are generally measured through the adaptive management processes and monitoring of streams in the watershed. If shade is not moving on a path toward the TMDL load allocation by 2009, Ecology’s policy is to suggest changes to the Forest Practices Board. Other regulations affecting riparian land use For private land that is neither federal forest nor covered by the Forest and Fish Report (i.e., private and state-owned forest), some regulations affect land use and management along rivers and streams:
• Shorelines of rivers with annual flows greater than 1,000 cfs, and streams with average flows greater than 20 cfs, are managed under the Shoreline Management Act.
• Within municipal boundaries, land management practices next to streams may be limited if there is a local critical areas ordinance.

Page 23
• Outside municipalities, county sensitive areas ordinances may affect such practices as grading or clearing next to a stream, if the activity comes under county review as part of a permit application.
Instream flow rule for the Wenatchee River Instream flows and water withdrawals are managed through regulatory avenues separate from TMDLs. However, stream temperature is related to the amount of instream flow, and increases in flow generally result in decreases in maximum temperatures. The complete heat budget for a stream segment accounts for the amount of flow and the temperature of water flowing into and out of the stream. The primary statutes relating to flow in Washington State are as follows:
• Water Code, Chapter 90.03 RCW (1917), section 247, describes Ecology’s exclusive authority for setting flows and describes specific conditions on permits stating where flows must be met. It requires consultation with the Department of Fish and Wildlife, the Department of Community, Trade, and Economic Development, the Department of Agriculture, as well as affected Indian Tribes on the establishment of “minimum flows”.
• Construction Projects in State Waters, Chapter 77.55 RCW (formerly 75.20)(1949), section 050, requires Ecology to consult with the Department of Fish and Wildlife prior to making a decision on any water right application that may affect flows for food and game fish. Fish and Wildlife may recommend denial or conditioning of a water right permit.
• Minimum Water Flows and Levels Act, Chapter 90.22 RCW (1967), sets forth a process for protecting instream flows through adoption of rules. Among other provisions, it says Ecology must consult with the Department of Fish and Wildlife and conduct public hearings.
• Water Resources Act of 1971, Chapter 90.54 RCW, particularly section 020, includes language that says “base flows” are to be retained in streams except where there are “overriding considerations of the public interest”. Further, waters of the state are to be protected and used for the greatest benefit to the people, and water allocation is to be generally based on the securing of “maximum net benefits” to the people of the state. This Act also authorizes Ecology to reserve waters for future beneficial uses.
• In 1998, the Legislature passed Engrossed Substitute House Bill 2514, which was codified as “Watershed Planning,” Chapter 90.82 RCW. This chapter provides an avenue for local citizens and various levels of governments to be involved in collaborative water management, including the option of establishing or amending instream flow rules. The watershed planning process specifies that local watershed planning groups can recommend instream flows to Ecology for rule-making, and directs Ecology to undertake rule-making to adopt flows upon receiving such a recommendation.
Under state laws, Ecology oversees both the appropriation of water for out-of-stream uses (e.g., irrigation, municipalities, commercial and industrial uses) and the protection of instream uses (e.g., water for fish habitat and recreational use). Ecology does this by adopting and enforcing regulations, as well as by providing assistance to citizens regarding both public and private water management issues.

Page 24
Ecology is required by law to protect instream flows by adopting regulations and to manage water uses that affect streamflow. To develop an “instream flow rule” which sets for a particular stream the minimum flows needed during critical times of year, Ecology considers existing flow data, the hydrology of a stream and its natural seasonal flow variation, fish habitat needs, and other factors. Once adopted, an instream flow rule acquires a priority date similar to that associated with a water right. Water rights existing at the time an instream flow rule is adopted are unaffected by the rule, and those issued after rule adoption are subject to the requirements of the rule.

Page 25
Applicable Water Quality Criteria
Current water quality criteria This TMDL report is designed to address impairments of characteristic uses caused by high temperatures. The characteristic uses designated for protection in Wenatchee River basin streams are as follows (Chapter 173-201A WAC):
"Characteristic uses. Characteristic uses shall include, but not be limited to, the following: (i) Water supply (domestic, industrial, agricultural). (ii) Stock watering. (iii) Fish and shellfish:
Salmonid migration, rearing, spawning, and harvesting. Other fish migration, rearing, spawning, and harvesting. Clam and mussel rearing, spawning, and harvesting. Crayfish rearing, spawning, and harvesting. (iv) Wildlife habitat. (v) Recreation (primary contact recreation, sport fishing, boating, and aesthetic enjoyment). (vi) Commerce and navigation."
The characteristics uses that are of the most concern in this TMDL are salmonid and other fish migration, rearing, spawning, and harvesting. The state water quality standards describe criteria for temperature for the protection of characteristic uses. Streams in the Wenatchee River basin are designated as either Class AA or Class A. The definitions of Class AA and A are as follows:
• Class AA waters typically exhibit extraordinary water quality that markedly and uniformly exceeds the requirements for all or substantially all uses.
• Class A waters typically exhibit excellent water quality that meets or exceeds the requirements for all or substantially all uses.
The temperature criteria for Class AA waters are as follows:
"Temperature shall not exceed 16.0°C…due to human activities. When natural conditions exceed 16.0°C…, no temperature increases will be allowed which will raise the receiving water temperature by greater than 0.3°C."
The temperature criteria for Class A waters are as follows:
"Temperature shall not exceed 18.0°C…due to human activities. When natural conditions exceed 18.0°C…, no temperature increases will be allowed which will raise the receiving water temperature by greater than 0.3°C."
During critical periods, natural conditions may exceed the numeric temperature criteria mandated by the water quality standards. In these cases, the antidegradation provisions of those standards apply.
"Whenever the natural conditions of said waters are of a lower quality than the criteria assigned, the natural conditions shall constitute the water quality criteria."
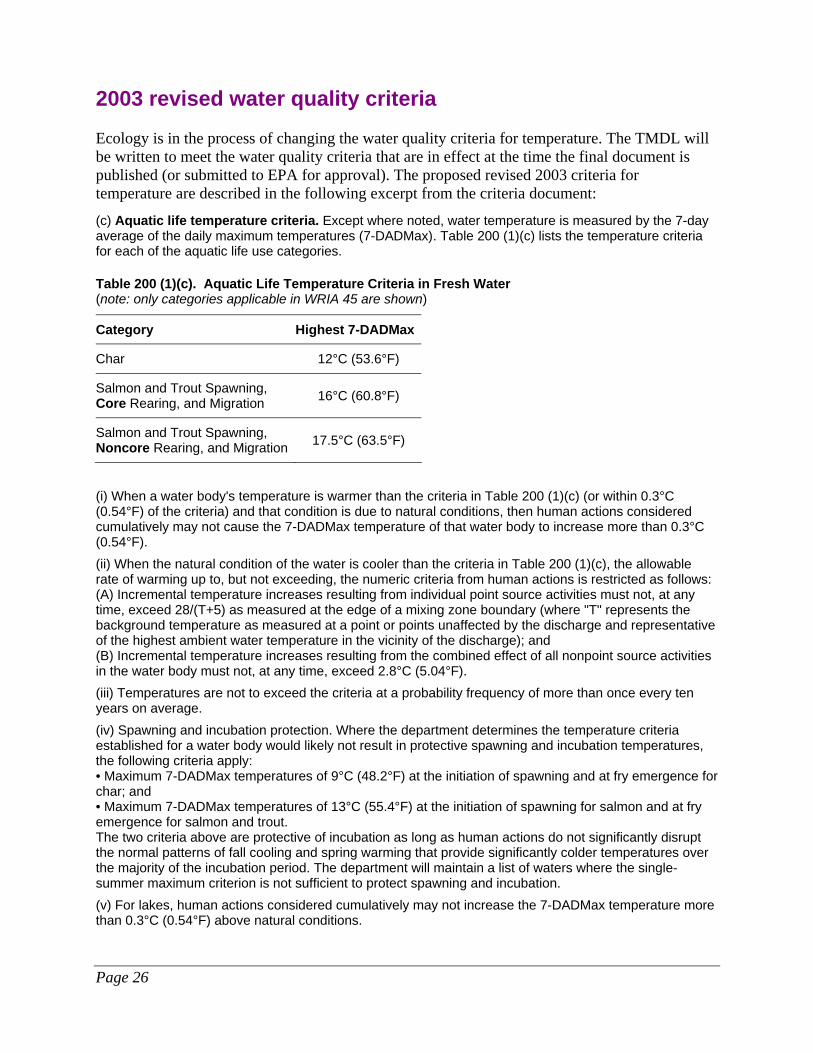
Page 26
2003 revised water quality criteria Ecology is in the process of changing the water quality criteria for temperature. The TMDL will be written to meet the water quality criteria that are in effect at the time the final document is published (or submitted to EPA for approval). The proposed revised 2003 criteria for temperature are described in the following excerpt from the criteria document:
(c) Aquatic life temperature criteria. Except where noted, water temperature is measured by the 7-day average of the daily maximum temperatures (7-DADMax). Table 200 (1)(c) lists the temperature criteria for each of the aquatic life use categories.
Table 200 (1)(c). Aquatic Life Temperature Criteria in Fresh Water (note: only categories applicable in WRIA 45 are shown)
Category Highest 7-DADMax
Char 12°C (53.6°F)
Salmon and Trout Spawning, Core Rearing, and Migration 16°C (60.8°F)
Salmon and Trout Spawning, Noncore Rearing, and Migration 17.5°C (63.5°F)
(i) When a water body's temperature is warmer than the criteria in Table 200 (1)(c) (or within 0.3°C (0.54°F) of the criteria) and that condition is due to natural conditions, then human actions considered cumulatively may not cause the 7-DADMax temperature of that water body to increase more than 0.3°C (0.54°F). (ii) When the natural condition of the water is cooler than the criteria in Table 200 (1)(c), the allowable rate of warming up to, but not exceeding, the numeric criteria from human actions is restricted as follows: (A) Incremental temperature increases resulting from individual point source activities must not, at any time, exceed 28/(T+5) as measured at the edge of a mixing zone boundary (where "T" represents the background temperature as measured at a point or points unaffected by the discharge and representative of the highest ambient water temperature in the vicinity of the discharge); and (B) Incremental temperature increases resulting from the combined effect of all nonpoint source activities in the water body must not, at any time, exceed 2.8°C (5.04°F). (iii) Temperatures are not to exceed the criteria at a probability frequency of more than once every ten years on average. (iv) Spawning and incubation protection. Where the department determines the temperature criteria established for a water body would likely not result in protective spawning and incubation temperatures, the following criteria apply: • Maximum 7-DADMax temperatures of 9°C (48.2°F) at the initiation of spawning and at fry emergence for char; and • Maximum 7-DADMax temperatures of 13°C (55.4°F) at the initiation of spawning for salmon and at fry emergence for salmon and trout. The two criteria above are protective of incubation as long as human actions do not significantly disrupt the normal patterns of fall cooling and spring warming that provide significantly colder temperatures over the majority of the incubation period. The department will maintain a list of waters where the single-summer maximum criterion is not sufficient to protect spawning and incubation. (v) For lakes, human actions considered cumulatively may not increase the 7-DADMax temperature more than 0.3°C (0.54°F) above natural conditions.

Page 27
(vi) Temperature measurements should be taken to represent the dominant aquatic habitat of the monitoring site. This typically means samples should: (A) Be taken from well mixed portions of rivers and streams; and (B) Not be taken from shallow stagnant backwater areas, within isolated thermal refuges, at the surface, or at the water's edge. (vii) The department will incorporate the following guidelines on preventing acute lethality and barriers to migration of salmonids into determinations of compliance with the narrative requirements for use protection established in this chapter (e.g., WAC 173-201A-310(1), 173-201A-400(4), and 173-201A-410 (1)(c)). The following site-level considerations do not, however, override the temperature criteria established for waters in subsection (1)(c) of this section or WAC 173-201A-602: (A) Moderately acclimated (16-20°C, or 60.8.68°F) adult and juvenile salmonids will generally be protected from acute lethality by discrete human actions maintaining the 7-DADMax temperature at or below 22°C (71.6°F) and the 1-day maximum (1-DMax) temperature at or below 23°C (73.4°F). (B) Lethality to developing fish embryos can be expected to occur at a 1-DMax temperature greater than 17.5°C (63.5°F). (C) To protect aquatic organisms, discharge plume temperatures must be maintained such that fish could not be entrained (based on plume time of travel) for more than two seconds at temperatures above 33°C (91.4°F) to avoid creating areas that will cause near instantaneous lethality. (D) Barriers to adult salmonid migration are assumed to exist any time the 1-DMax temperature is greater than 22°C (71.6°F) and the adjacent downstream water temperatures are 3°C (5.4°F) or more cooler. (viii) Nothing in this chapter shall be interpreted to prohibit the establishment of effluent limitations for the control of the thermal component of any discharge in accordance with 33 U.S.C. 1326 (commonly known as section 316 of the Clean Water Act).
All streams and rivers in the study area that are Class AA under the current criteria will be designated “core” under the 2003 revised criteria [see Table 200(1)(c) above], and Class A will be designated “non-core” except for the specific designations listed in Appendix A.
Page 28
Seasonal Variation Clean Water Act Section 303(d)(1) requires that TMDLs “be established at the level necessary to implement the applicable water quality standards with seasonal variations”. The current regulation also states that determination of “TMDLs shall take into account critical conditions for streamflow, loading, and water quality parameters” [40 CFR 130.7(c)(1)]. Finally, Section 303(d)(1)(D) suggests consideration of normal conditions, flows, and dissipative capacity. Existing conditions for stream temperatures in the Wenatchee River watershed reflect seasonal variation. Cooler temperatures occur in the winter, while warmer temperatures are observed in the summer. The highest temperatures typically occur from mid-July through mid-August. This timeframe is used as the critical period for development of the TMDL. Seasonal estimates for streamflow, solar flux, and climatic variables for the TMDL are taken into account to develop critical conditions for the TMDL model. The critical period for evaluation of solar flux and effective shade will be assumed to be August 1 because it is the mid-point of the period when water temperatures are typically at their seasonal peak. Critical streamflows for the TMDL were considered to be the lowest 7-day average flows with a 2-year recurrence interval (7Q2), and 10-year recurrence interval (7Q10) for July and August. The 7Q2 streamflow is assumed to represent conditions that would occur during a typical climatic year, and the 7Q10 streamflow is assumed to represent a reasonable worst-case climatic year.
Page 29
Technical Analysis
Stream heating processes Riparian vegetation, stream morphology, hydrology, climate, and geographic location influence stream temperature. While climate and geographic location are outside of human control, riparian condition, channel morphology, and hydrology are affected by land use activities. Specifically, the elevated summertime stream temperatures attributed to anthropogenic sources in the Wenatchee River basin result from the following:
• Riparian vegetation disturbance reduces stream surface shading via decreased riparian vegetation height, width, and/or density, thus increasing the amount of solar radiation reaching the stream surface.
• Channel widening reduces the stream depth and increases the stream surface area exposed to energy processes, namely solar radiation.
• Reduced summertime baseflows may result from instream withdrawals and hydraulically connected groundwater withdrawals. Reducing the amount of water in a stream can increase stream temperature (Brown, 1972). Baseflows could also have been reduced due to an increase in impervious surface area from changes in land cover in the watershed.
Current conditions Meteorology Regional air temperature, dewpoint temperature, and solar radiation during July-September 2002 and July-September 2003 are shown in Figures 9 and 10. Highest daily average stream temperatures occurred during the period of relatively high air temperatures in mid-August 2002 and the end of July 2003. Water temperature data – continuous dataloggers A network of continuous temperature dataloggers was installed in the Wenatchee River watershed by Ecology as described by Bilhimer et al. (2002). Data from 2002 and 2003 show that water temperatures in excess of the current Class A or AA standards and proposed core/ non-core standards are common throughout the watershed (Tables 4 and 5). Figures 11 and 12 summarize the highest daily maximum and the highest seven-day average maximum water temperatures for 2002 and 2003, respectively. Figures 13-19 present continuous daily maximum water temperatures during July-September at each of the sampling locations during 2002 and 2003.

Page 30
0
100
200
300
400
500
600
700
800
900
7/1/0212:00 AM
7/8/0212:00 AM
7/15/0212:00 AM
7/22/0212:00 AM
7/29/0212:00 AM
8/5/0212:00 AM
8/12/0212:00 AM
8/19/0212:00 AM
8/26/0212:00 AM
9/2/0212:00 AM
9/9/0212:00 AM
9/16/0212:00 AM
9/23/0212:00 AM
9/30/0212:00 AM
sola
r rad
iatio
n (W
/m^2
)solar radiation
-10
0
10
20
30
40
50
7/1/0212:00 AM
7/8/0212:00 AM
7/15/0212:00 AM
7/22/0212:00 AM
7/29/0212:00 AM
8/5/0212:00 AM
8/12/0212:00 AM
8/19/0212:00 AM
8/26/0212:00 AM
9/2/0212:00 AM
9/9/0212:00 AM
9/16/0212:00 AM
9/23/0212:00 AM
9/30/0212:00 AM
tem
pera
ture
(deg
rees
C)
air temperature
dewpoint temperature
0
100
200
300
400
500
600
700
800
900
7/1/0212:00 AM
7/8/0212:00 AM
7/15/0212:00 AM
7/22/0212:00 AM
7/29/0212:00 AM
8/5/0212:00 AM
8/12/0212:00 AM
8/19/0212:00 AM
8/26/0212:00 AM
9/2/0212:00 AM
9/9/0212:00 AM
9/16/0212:00 AM
9/23/0212:00 AM
9/30/0212:00 AM
sola
r rad
iatio
n (W
/m^2
)solar radiation
-10
0
10
20
30
40
50
7/1/0212:00 AM
7/8/0212:00 AM
7/15/0212:00 AM
7/22/0212:00 AM
7/29/0212:00 AM
8/5/0212:00 AM
8/12/0212:00 AM
8/19/0212:00 AM
8/26/0212:00 AM
9/2/0212:00 AM
9/9/0212:00 AM
9/16/0212:00 AM
9/23/0212:00 AM
9/30/0212:00 AM
tem
pera
ture
(deg
rees
C)
air temperature
dewpoint temperature
Figure 9. Regional solar radiation, air temperatures, and dewpoint temperatures (at the Wenatchee WSU TFREC station) during July-September 2002.
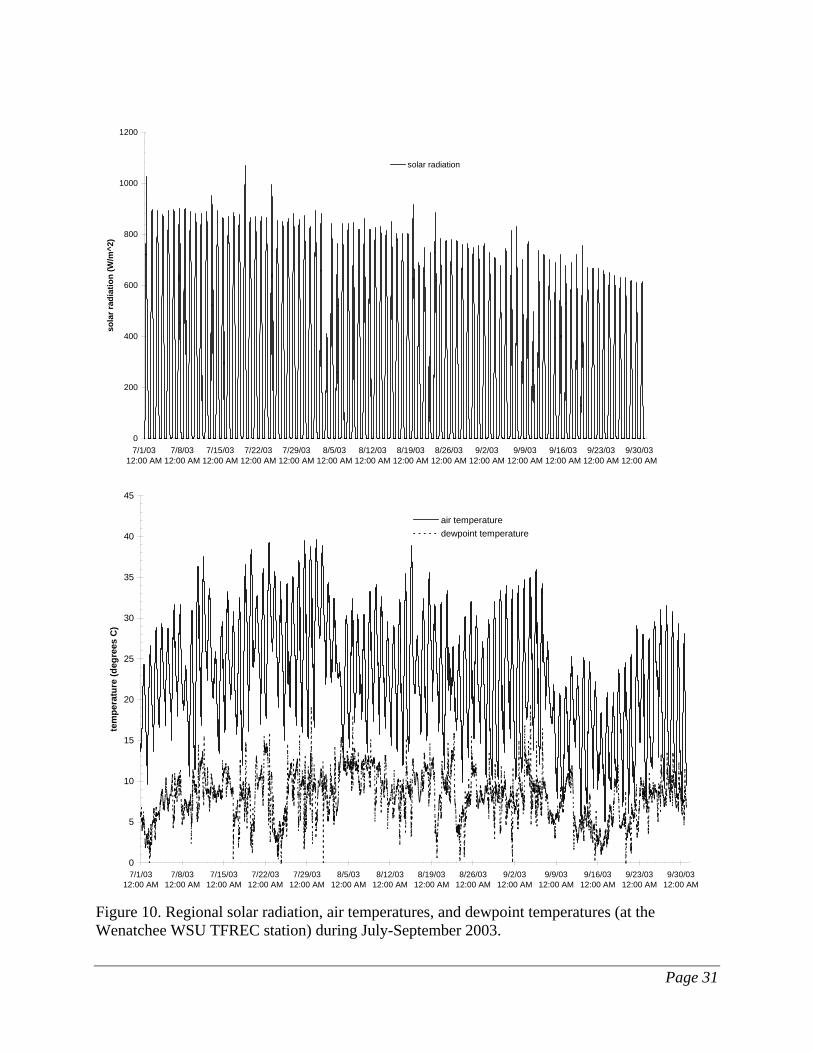
Page 31
0
200
400
600
800
1000
1200
7/1/0312:00 AM
7/8/0312:00 AM
7/15/0312:00 AM
7/22/0312:00 AM
7/29/0312:00 AM
8/5/0312:00 AM
8/12/0312:00 AM
8/19/0312:00 AM
8/26/0312:00 AM
9/2/0312:00 AM
9/9/0312:00 AM
9/16/0312:00 AM
9/23/0312:00 AM
9/30/0312:00 AM
sola
r rad
iatio
n (W
/m^2
)
solar radiation
0
5
10
15
20
25
30
35
40
45
7/1/0312:00 AM
7/8/0312:00 AM
7/15/0312:00 AM
7/22/0312:00 AM
7/29/0312:00 AM
8/5/0312:00 AM
8/12/0312:00 AM
8/19/0312:00 AM
8/26/0312:00 AM
9/2/0312:00 AM
9/9/0312:00 AM
9/16/0312:00 AM
9/23/0312:00 AM
9/30/0312:00 AM
tem
pera
ture
(deg
rees
C)
air temperaturedewpoint temperature
Figure 10. Regional solar radiation, air temperatures, and dewpoint temperatures (at the Wenatchee WSU TFREC station) during July-September 2003.
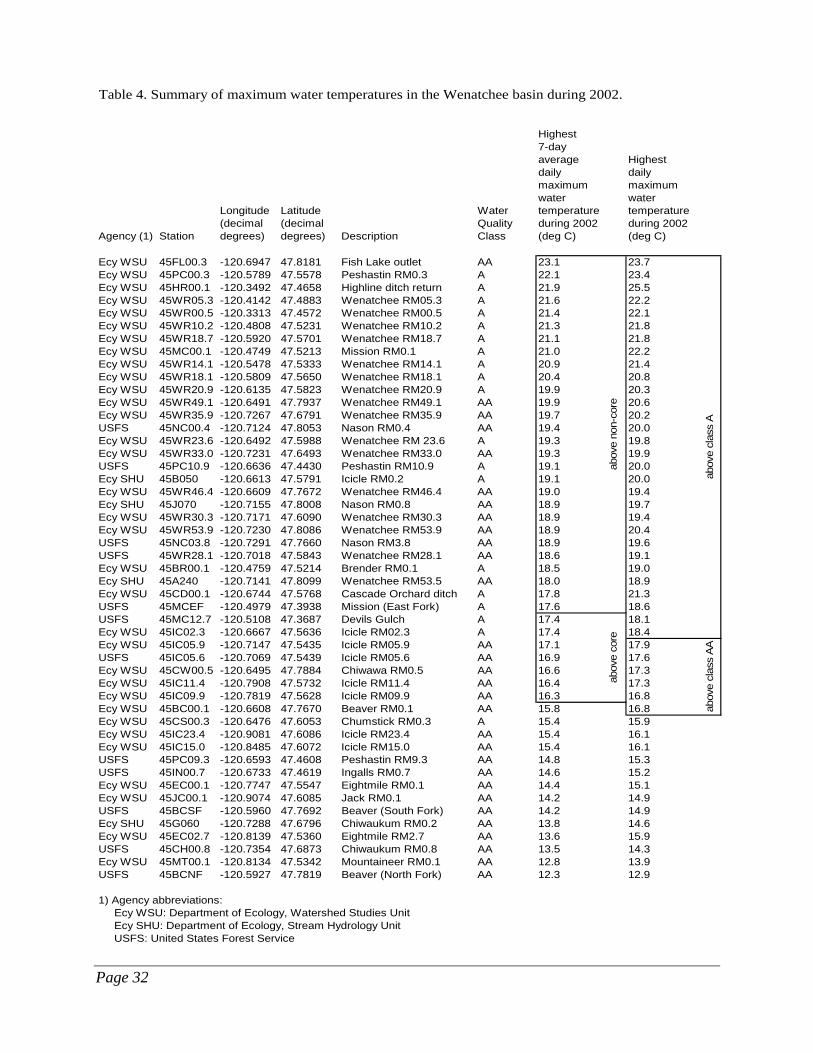
Page 32
Table 4. Summary of maximum water temperatures in the Wenatchee basin during 2002.
Agency (1) Station
Longitude (decimal degrees)
Latitude (decimal degrees) Description
Water Quality Class
Highest 7-day average daily maximum water temperature during 2002 (deg C)
Highest daily maximum water temperature during 2002 (deg C)
Ecy WSU 45FL00.3 -120.6947 47.8181 Fish Lake outlet AA 23.1 23.7Ecy WSU 45PC00.3 -120.5789 47.5578 Peshastin RM0.3 A 22.1 23.4Ecy WSU 45HR00.1 -120.3492 47.4658 Highline ditch return A 21.9 25.5Ecy WSU 45WR05.3 -120.4142 47.4883 Wenatchee RM05.3 A 21.6 22.2Ecy WSU 45WR00.5 -120.3313 47.4572 Wenatchee RM00.5 A 21.4 22.1Ecy WSU 45WR10.2 -120.4808 47.5231 Wenatchee RM10.2 A 21.3 21.8Ecy WSU 45WR18.7 -120.5920 47.5701 Wenatchee RM18.7 A 21.1 21.8Ecy WSU 45MC00.1 -120.4749 47.5213 Mission RM0.1 A 21.0 22.2Ecy WSU 45WR14.1 -120.5478 47.5333 Wenatchee RM14.1 A 20.9 21.4Ecy WSU 45WR18.1 -120.5809 47.5650 Wenatchee RM18.1 A 20.4 20.8Ecy WSU 45WR20.9 -120.6135 47.5823 Wenatchee RM20.9 A 19.9 20.3Ecy WSU 45WR49.1 -120.6491 47.7937 Wenatchee RM49.1 AA 19.9 20.6Ecy WSU 45WR35.9 -120.7267 47.6791 Wenatchee RM35.9 AA 19.7 20.2USFS 45NC00.4 -120.7124 47.8053 Nason RM0.4 AA 19.4 20.0Ecy WSU 45WR23.6 -120.6492 47.5988 Wenatchee RM 23.6 A 19.3 19.8Ecy WSU 45WR33.0 -120.7231 47.6493 Wenatchee RM33.0 AA 19.3 19.9USFS 45PC10.9 -120.6636 47.4430 Peshastin RM10.9 A 19.1 20.0Ecy SHU 45B050 -120.6613 47.5791 Icicle RM0.2 A 19.1 20.0Ecy WSU 45WR46.4 -120.6609 47.7672 Wenatchee RM46.4 AA 19.0 19.4Ecy SHU 45J070 -120.7155 47.8008 Nason RM0.8 AA 18.9 19.7Ecy WSU 45WR30.3 -120.7171 47.6090 Wenatchee RM30.3 AA 18.9 19.4Ecy WSU 45WR53.9 -120.7230 47.8086 Wenatchee RM53.9 AA 18.9 20.4USFS 45NC03.8 -120.7291 47.7660 Nason RM3.8 AA 18.9 19.6USFS 45WR28.1 -120.7018 47.5843 Wenatchee RM28.1 AA 18.6 19.1Ecy WSU 45BR00.1 -120.4759 47.5214 Brender RM0.1 A 18.5 19.0Ecy SHU 45A240 -120.7141 47.8099 Wenatchee RM53.5 AA 18.0 18.9Ecy WSU 45CD00.1 -120.6744 47.5768 Cascade Orchard ditch A 17.8 21.3USFS 45MCEF -120.4979 47.3938 Mission (East Fork) A 17.6 18.6USFS 45MC12.7 -120.5108 47.3687 Devils Gulch A 17.4 18.1Ecy WSU 45IC02.3 -120.6667 47.5636 Icicle RM02.3 A 17.4 18.4Ecy WSU 45IC05.9 -120.7147 47.5435 Icicle RM05.9 AA 17.1 17.9USFS 45IC05.6 -120.7069 47.5439 Icicle RM05.6 AA 16.9 17.6Ecy WSU 45CW00.5 -120.6495 47.7884 Chiwawa RM0.5 AA 16.6 17.3Ecy WSU 45IC11.4 -120.7908 47.5732 Icicle RM11.4 AA 16.4 17.3Ecy WSU 45IC09.9 -120.7819 47.5628 Icicle RM09.9 AA 16.3 16.8Ecy WSU 45BC00.1 -120.6608 47.7670 Beaver RM0.1 AA 15.8 16.8Ecy WSU 45CS00.3 -120.6476 47.6053 Chumstick RM0.3 A 15.4 15.9Ecy WSU 45IC23.4 -120.9081 47.6086 Icicle RM23.4 AA 15.4 16.1Ecy WSU 45IC15.0 -120.8485 47.6072 Icicle RM15.0 AA 15.4 16.1USFS 45PC09.3 -120.6593 47.4608 Peshastin RM9.3 AA 14.8 15.3USFS 45IN00.7 -120.6733 47.4619 Ingalls RM0.7 AA 14.6 15.2Ecy WSU 45EC00.1 -120.7747 47.5547 Eightmile RM0.1 AA 14.4 15.1Ecy WSU 45JC00.1 -120.9074 47.6085 Jack RM0.1 AA 14.2 14.9USFS 45BCSF -120.5960 47.7692 Beaver (South Fork) AA 14.2 14.9Ecy SHU 45G060 -120.7288 47.6796 Chiwaukum RM0.2 AA 13.8 14.6Ecy WSU 45EC02.7 -120.8139 47.5360 Eightmile RM2.7 AA 13.6 15.9USFS 45CH00.8 -120.7354 47.6873 Chiwaukum RM0.8 AA 13.5 14.3Ecy WSU 45MT00.1 -120.8134 47.5342 Mountaineer RM0.1 AA 12.8 13.9USFS 45BCNF -120.5927 47.7819 Beaver (North Fork) AA 12.3 12.9
1) Agency abbreviations: Ecy WSU: Department of Ecology, Watershed Studies Unit Ecy SHU: Department of Ecology, Stream Hydrology Unit USFS: United States Forest Service
abov
e no
n-co
reab
ove
core
abov
e cl
ass
Aab
ove
clas
s AA
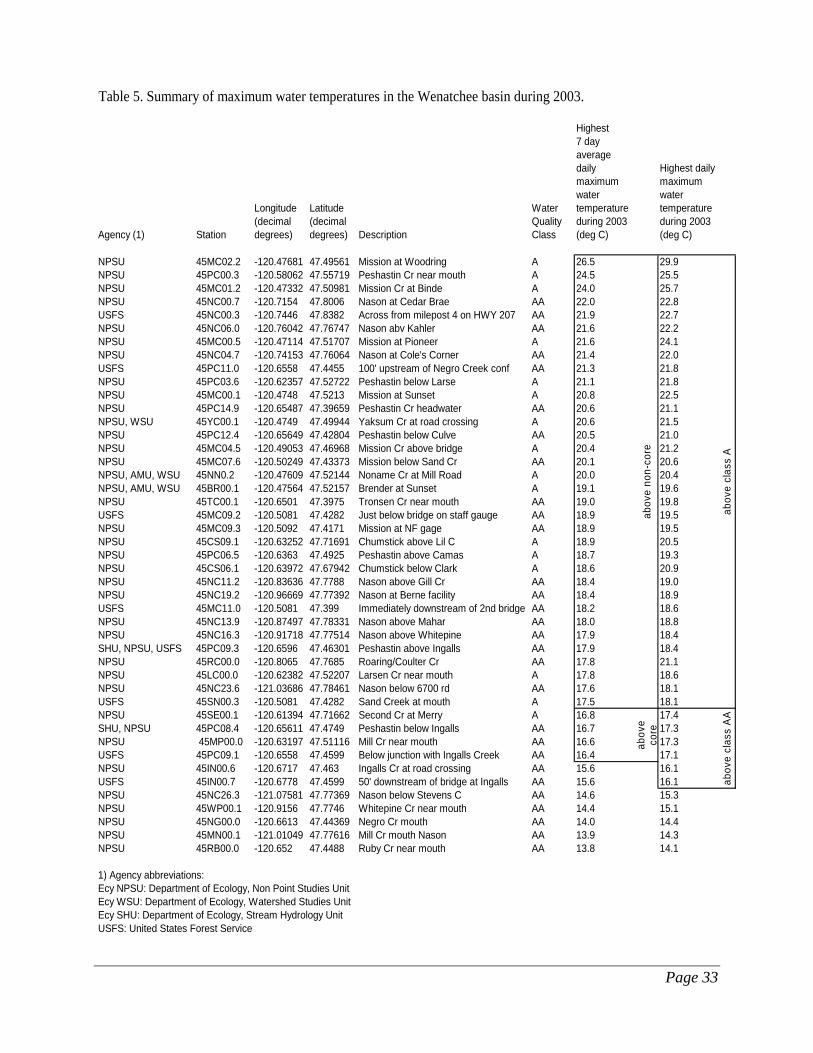
Page 33
Table 5. Summary of maximum water temperatures in the Wenatchee basin during 2003.
Agency (1) Station
Longitude (decimal degrees)
Latitude (decimal degrees) Description
Water Quality Class
Highest 7 day average daily maximum water temperature during 2003 (deg C)
Highest daily maximum water temperature during 2003 (deg C)
NPSU 45MC02.2 -120.47681 47.49561 Mission at Woodring A 26.5 29.9NPSU 45PC00.3 -120.58062 47.55719 Peshastin Cr near mouth A 24.5 25.5NPSU 45MC01.2 -120.47332 47.50981 Mission Cr at Binde A 24.0 25.7NPSU 45NC00.7 -120.7154 47.8006 Nason at Cedar Brae AA 22.0 22.8USFS 45NC00.3 -120.7446 47.8382 Across from milepost 4 on HWY 207 AA 21.9 22.7NPSU 45NC06.0 -120.76042 47.76747 Nason abv Kahler AA 21.6 22.2NPSU 45MC00.5 -120.47114 47.51707 Mission at Pioneer A 21.6 24.1NPSU 45NC04.7 -120.74153 47.76064 Nason at Cole's Corner AA 21.4 22.0USFS 45PC11.0 -120.6558 47.4455 100' upstream of Negro Creek conf AA 21.3 21.8NPSU 45PC03.6 -120.62357 47.52722 Peshastin below Larse A 21.1 21.8NPSU 45MC00.1 -120.4748 47.5213 Mission at Sunset A 20.8 22.5NPSU 45PC14.9 -120.65487 47.39659 Peshastin Cr headwater AA 20.6 21.1NPSU, WSU 45YC00.1 -120.4749 47.49944 Yaksum Cr at road crossing A 20.6 21.5NPSU 45PC12.4 -120.65649 47.42804 Peshastin below Culve AA 20.5 21.0NPSU 45MC04.5 -120.49053 47.46968 Mission Cr above bridge A 20.4 21.2NPSU 45MC07.6 -120.50249 47.43373 Mission below Sand Cr AA 20.1 20.6NPSU, AMU, WSU 45NN0.2 -120.47609 47.52144 Noname Cr at Mill Road A 20.0 20.4NPSU, AMU, WSU 45BR00.1 -120.47564 47.52157 Brender at Sunset A 19.1 19.6NPSU 45TC00.1 -120.6501 47.3975 Tronsen Cr near mouth AA 19.0 19.8USFS 45MC09.2 -120.5081 47.4282 Just below bridge on staff gauge AA 18.9 19.5NPSU 45MC09.3 -120.5092 47.4171 Mission at NF gage AA 18.9 19.5NPSU 45CS09.1 -120.63252 47.71691 Chumstick above Lil C A 18.9 20.5NPSU 45PC06.5 -120.6363 47.4925 Peshastin above Camas A 18.7 19.3NPSU 45CS06.1 -120.63972 47.67942 Chumstick below Clark A 18.6 20.9NPSU 45NC11.2 -120.83636 47.7788 Nason above Gill Cr AA 18.4 19.0NPSU 45NC19.2 -120.96669 47.77392 Nason at Berne facility AA 18.4 18.9USFS 45MC11.0 -120.5081 47.399 Immediately downstream of 2nd bridge AA 18.2 18.6NPSU 45NC13.9 -120.87497 47.78331 Nason above Mahar AA 18.0 18.8NPSU 45NC16.3 -120.91718 47.77514 Nason above Whitepine AA 17.9 18.4SHU, NPSU, USFS 45PC09.3 -120.6596 47.46301 Peshastin above Ingalls AA 17.9 18.4NPSU 45RC00.0 -120.8065 47.7685 Roaring/Coulter Cr AA 17.8 21.1NPSU 45LC00.0 -120.62382 47.52207 Larsen Cr near mouth A 17.8 18.6NPSU 45NC23.6 -121.03686 47.78461 Nason below 6700 rd AA 17.6 18.1USFS 45SN00.3 -120.5081 47.4282 Sand Creek at mouth A 17.5 18.1NPSU 45SE00.1 -120.61394 47.71662 Second Cr at Merry A 16.8 17.4SHU, NPSU 45PC08.4 -120.65611 47.4749 Peshastin below Ingalls AA 16.7 17.3NPSU 45MP00.0 -120.63197 47.51116 Mill Cr near mouth AA 16.6 17.3USFS 45PC09.1 -120.6558 47.4599 Below junction with Ingalls Creek AA 16.4 17.1NPSU 45IN00.6 -120.6717 47.463 Ingalls Cr at road crossing AA 15.6 16.1USFS 45IN00.7 -120.6778 47.4599 50' downstream of bridge at Ingalls AA 15.6 16.1NPSU 45NC26.3 -121.07581 47.77369 Nason below Stevens C AA 14.6 15.3NPSU 45WP00.1 -120.9156 47.7746 Whitepine Cr near mouth AA 14.4 15.1NPSU 45NG00.0 -120.6613 47.44369 Negro Cr mouth AA 14.0 14.4NPSU 45MN00.1 -121.01049 47.77616 Mill Cr mouth Nason AA 13.9 14.3NPSU 45RB00.0 -120.652 47.4488 Ruby Cr near mouth AA 13.8 14.1
1) Agency abbreviations:Ecy NPSU: Department of Ecology, Non Point Studies UnitEcy WSU: Department of Ecology, Watershed Studies UnitEcy SHU: Department of Ecology, Stream Hydrology UnitUSFS: United States Forest Service
abov
e no
n-co
reab
ove
core
abov
e cl
ass
Aab
ove
clas
s AA

Page 34
Figure 11. The highest daily maximum (upper map) and highest 7-day averages of daily maximum (lower map) water temperatures in the Wenatchee River and its tributaries during 2002.
#S
$T
#S
%U
%U
#S
#S
#S
%U
$T
%U
#S
$T
%U
%U
$T
#S%U
%U#S
#S
#S
#S
#S#S
#S
#S
#S
#S
%U
%U#S
$T
#S#S
$T
#S
$T
$T#S
#S
$T
#S
#S
$T$T#S
#S
#S
streamsmajor streamswaterbodies
Maximum daily max temperature (deg C) $T 12 - 14 deg C$T 14 - 16#S 16 - 18#S 18 - 21%U 21 - 23%U 23 - 30
10 0 10 Kilometers
N
#S
$T
#S
#S%U
#S
$T#S
%U
$T
%U
#S
$T
#S
%U
$T
#S#S
%U#S
#S
$T
#S
#S$T
#S
#S
#S
#S
%U
%U
#S$T
#S#S
$T
#S
$T
$T#S
#S
$T
#S
#S
$T$T#S
#S
#S
streamsmajor streamswaterbodies
Max 7-day-avg daily max temperature (deg C) $T 12 - 14 deg C$T 14 - 16#S 16 - 17.5#S 17.5 - 20%U 20 - 23%U 23 - 30
10 0 10 Kilometers
N
#S
$T
#S
%U
%U
#S
#S
#S
%U
$T
%U
#S
$T
%U
%U
$T
#S%U
%U#S
#S
#S
#S
#S#S
#S
#S
#S
#S
%U
%U#S
$T
#S#S
$T
#S
$T
$T#S
#S
$T
#S
#S
$T$T#S
#S
#S
streamsmajor streamswaterbodies
Maximum daily max temperature (deg C) $T 12 - 14 deg C$T 14 - 16#S 16 - 18#S 18 - 21%U 21 - 23%U 23 - 30
10 0 10 Kilometers
N
#S
$T
#S
#S%U
#S
$T#S
%U
$T
%U
#S
$T
#S
%U
$T
#S#S
%U#S
#S
$T
#S
#S$T
#S
#S
#S
#S
%U
%U
#S$T
#S#S
$T
#S
$T
$T#S
#S
$T
#S
#S
$T$T#S
#S
#S
streamsmajor streamswaterbodies
Max 7-day-avg daily max temperature (deg C) $T 12 - 14 deg C$T 14 - 16#S 16 - 17.5#S 17.5 - 20%U 20 - 23%U 23 - 30
10 0 10 Kilometers
N
Highest
Highest
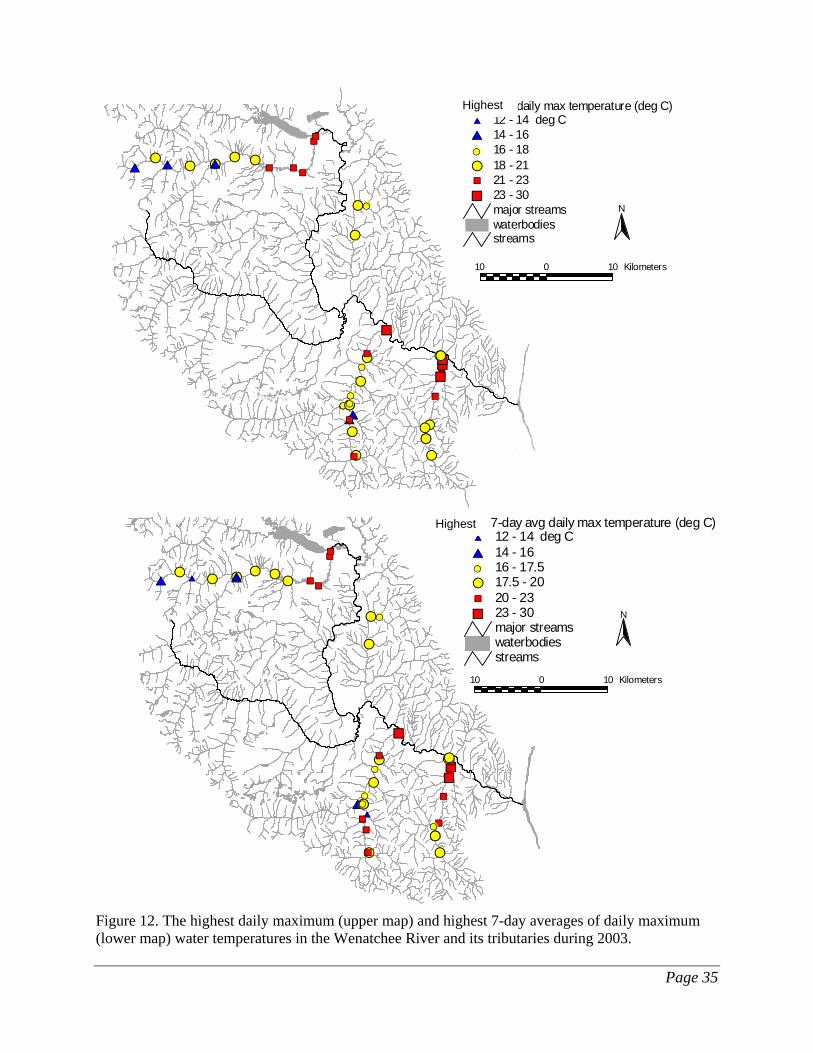
Page 35
Figure 12. The highest daily maximum (upper map) and highest 7-day averages of daily maximum (lower map) water temperatures in the Wenatchee River and its tributaries during 2003.
N
$T #S
$T$T
#S
%U
$T
%U
#S#S
#S
%U
#S#S
%U
%U
#S#S
%U %U%U%U
%U
%U
#S #S #S%U%U
#S
%U
$T #S#S
$T
#S#S
#S
%U
#S
$T
#S
#S%U
#S
#S
$T
$T %U
#S$T
#S
%U
$T
%U
#S#S
#S
%U
#S#S
%U
#S
#S
#S
%U %U%U%U
#S
%U
#S #S #S%U %U
#S
%U
$T #S#S
$T
#S#S
#S
%U
#S
#S
#S
#S%U
#S
#S
$T
N
10 0 10 Kilometers
10 0 10 Kilometers
streamswaterbodiesmajor streams
Max 7-day avg daily max temperature (deg C)$T 12 - 14 deg C$T 14 - 16#S 16 - 17.5#S 17.5 - 20%U 20 - 23%U 23 - 30
streamswaterbodiesmajor streams
Maximum daily max temperature (deg C)$T 12 - 14 deg C$T 14 - 16#S 16 - 18#S 18 - 21%U 21 - 23%U 23 - 30
Highest
Highest
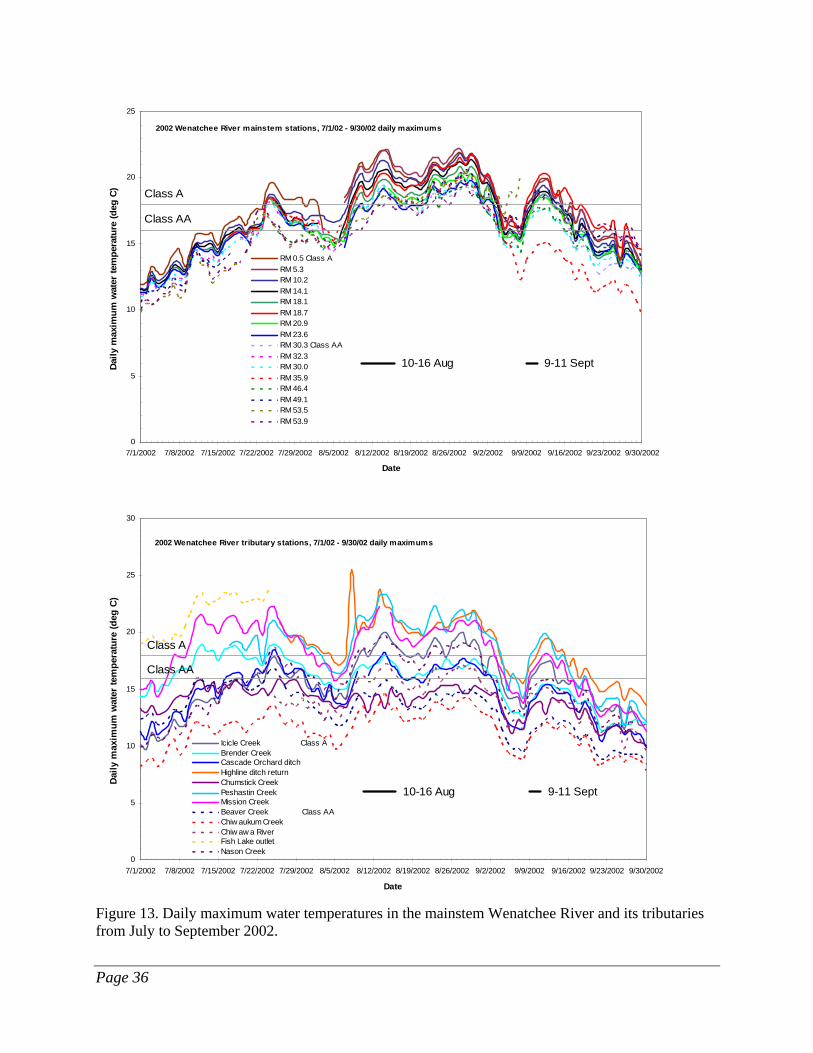
Page 36
2002 Wenatchee River mainstem stations, 7/1/02 - 9/30/02 daily maximums
Class A
Class AA
10-16 Aug 9-11 Sept
0
5
10
15
20
25
7/1/2002 7/8/2002 7/15/2002 7/22/2002 7/29/2002 8/5/2002 8/12/2002 8/19/2002 8/26/2002 9/2/2002 9/9/2002 9/16/2002 9/23/2002 9/30/2002
Date
Daily
max
imum
wat
er te
mpe
ratu
re (d
eg C
)
RM 0.5 Class ARM 5.3RM 10.2RM 14.1RM 18.1RM 18.7RM 20.9RM 23.6RM 30.3 Class AARM 32.3RM 30.0RM 35.9RM 46.4RM 49.1RM 53.5RM 53.9
2002 Wenatchee River tributary stations, 7/1/02 - 9/30/02 daily maximums
Class A
Class AA
10-16 Aug 9-11 Sept
0
5
10
15
20
25
30
7/1/2002 7/8/2002 7/15/2002 7/22/2002 7/29/2002 8/5/2002 8/12/2002 8/19/2002 8/26/2002 9/2/2002 9/9/2002 9/16/2002 9/23/2002 9/30/2002
Date
Daily
max
imum
wat
er te
mpe
ratu
re (d
eg C
)
Icicle Creek Class ABrender CreekCascade Orchard ditchHighline ditch returnChumstick CreekPeshastin CreekMission CreekBeaver Creek Class AAChiw aukum CreekChiw aw a RiverFish Lake outletNason Creek
Figure 13. Daily maximum water temperatures in the mainstem Wenatchee River and its tributaries from July to September 2002.
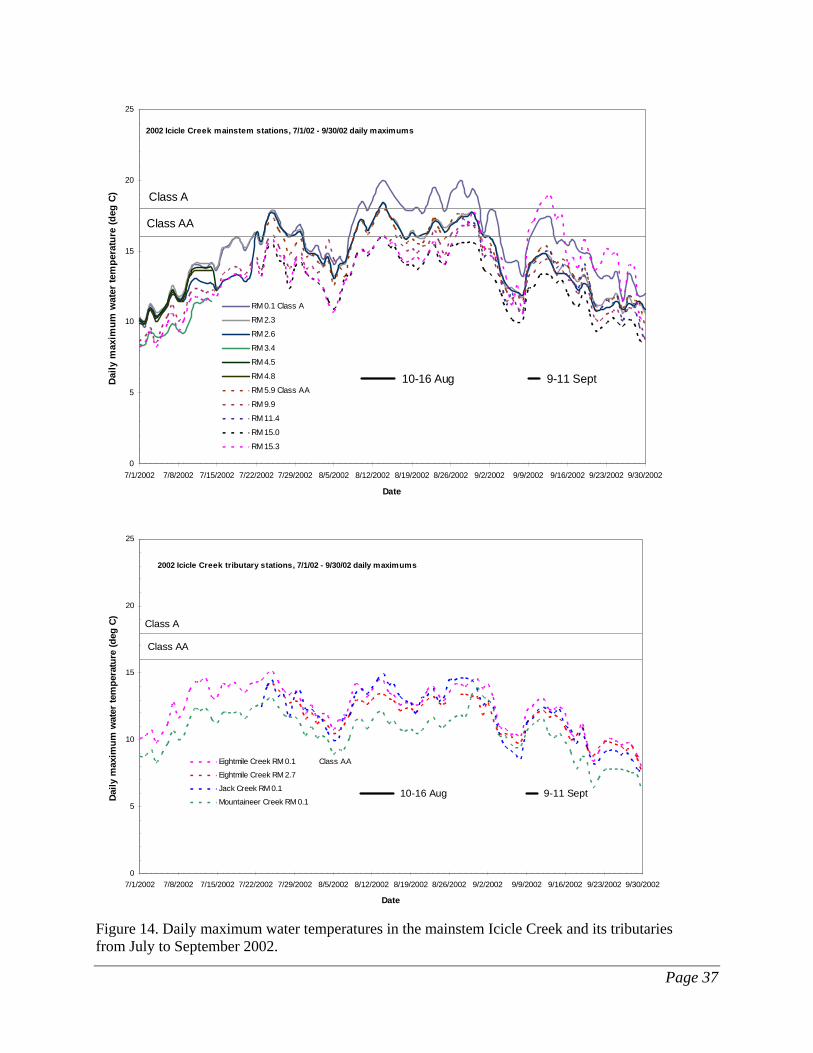
Page 37
2002 Icicle Creek mainstem stations, 7/1/02 - 9/30/02 daily maximums
10-16 Aug 9-11 Sept
Class A
Class AA
0
5
10
15
20
25
7/1/2002 7/8/2002 7/15/2002 7/22/2002 7/29/2002 8/5/2002 8/12/2002 8/19/2002 8/26/2002 9/2/2002 9/9/2002 9/16/2002 9/23/2002 9/30/2002
Date
Dai
ly m
axim
um w
ater
tem
pera
ture
(deg
C)
RM 0.1 Class A
RM 2.3
RM 2.6
RM 3.4
RM 4.5
RM 4.8
RM 5.9 Class AA
RM 9.9
RM 11.4
RM 15.0
RM 15.3
2002 Icicle Creek tributary stations, 7/1/02 - 9/30/02 daily maximums
Class A
Class AA
10-16 Aug 9-11 Sept
0
5
10
15
20
25
7/1/2002 7/8/2002 7/15/2002 7/22/2002 7/29/2002 8/5/2002 8/12/2002 8/19/2002 8/26/2002 9/2/2002 9/9/2002 9/16/2002 9/23/2002 9/30/2002
Date
Daily
max
imum
wat
er te
mpe
ratu
re (d
eg C
)
Eightmile Creek RM 0.1 Class AA
Eightmile Creek RM 2.7
Jack Creek RM 0.1
Mountaineer Creek RM 0.1
Figure 14. Daily maximum water temperatures in the mainstem Icicle Creek and its tributaries from July to September 2002.

Page 38
2003 Nason Creek mainstem stations, 7/1/03 - 9/30/03 daily maximums
Class A
Class AA
24-30 July 11-13 Aug
0
5
10
15
20
25
7/1/2003 7/8/2003 7/15/2003 7/22/2003 7/29/2003 8/5/2003 8/12/2003 8/19/2003 8/26/2003 9/2/2003 9/9/2003 9/16/2003 9/23/2003 9/30/2003
Date
Daily
max
imum
wat
er te
mpe
ratu
re (d
eg C
)
RM 0.3 Class AARM 0.7RM 4.7RM 6.0RM 7.9RM 9.5RM 11.2RM 13.9RM 16.3RM 19.2RM 23.6RM 26.3
2003 Nason Creek tributary stations, 7/1/03 - 9/30/03 daily maximums
Class A
Class AA
24-30 July 11-13 Aug
0
5
10
15
20
25
7/1/2003 7/8/2003 7/15/2003 7/22/2003 7/29/2003 8/5/2003 8/12/2003 8/19/2003 8/26/2003 9/2/2003 9/9/2003 9/16/2003 9/23/2003 9/30/2003
Date
Daily
max
imum
wat
er te
mpe
ratu
re (d
eg C
)
Mill Creek RM 0.1 Class AA
White Pine RM 0.1
Roaring and Coulter Creeks RM 0.0
Figure 15. Daily maximum water temperatures in the mainstem Nason Creek and its tributaries from July to September 2003.

Page 39
2003 Peshastin Creek mainstem stations, 7/1/03 - 9/30/03 daily maximums
Class A
Class AA
24-30 July 11-13 Aug
0
5
10
15
20
25
30
7/1/2003 7/8/2003 7/15/2003 7/22/2003 7/29/2003 8/5/2003 8/12/2003 8/19/2003 8/26/2003 9/2/2003 9/9/2003 9/16/2003 9/23/2003 9/30/2003
Date
Dai
ly m
axim
um w
ater
tem
pera
ture
(deg
C
RM 0.3 Class ARM 3.6RM 6.5RM 8.4 Class AARM 9.1RM 9.3RM 11.0RM 12.4RM 14.9
2003 Peshastin Creek tributary stations, 7/1/03 - 9/30/03 daily maximums
Class A
Class AA
24-30 July 11-13 Aug
0
5
10
15
20
25
7/1/2003 7/8/2003 7/15/2003 7/22/2003 7/29/2003 8/5/2003 8/12/2003 8/19/2003 8/26/2003 9/2/2003 9/9/2003 9/16/2003 9/23/2003 9/30/2003
Date
Daily
max
imum
wat
er te
mpe
ratu
re (d
eg C
)
Larsen Creek RM 0.0
Mill Creek RM 0.0
Camas Creek RM 0.2
Ingalls Creek RM 0.7
Ruby Creek RM 0.0
Negro Creek RM 0.0
Tronsen Creek RM 0.0
Figure 16. Daily maximum water temperatures in the mainstem Peshastin Creek and its tributaries from July to September 2003.
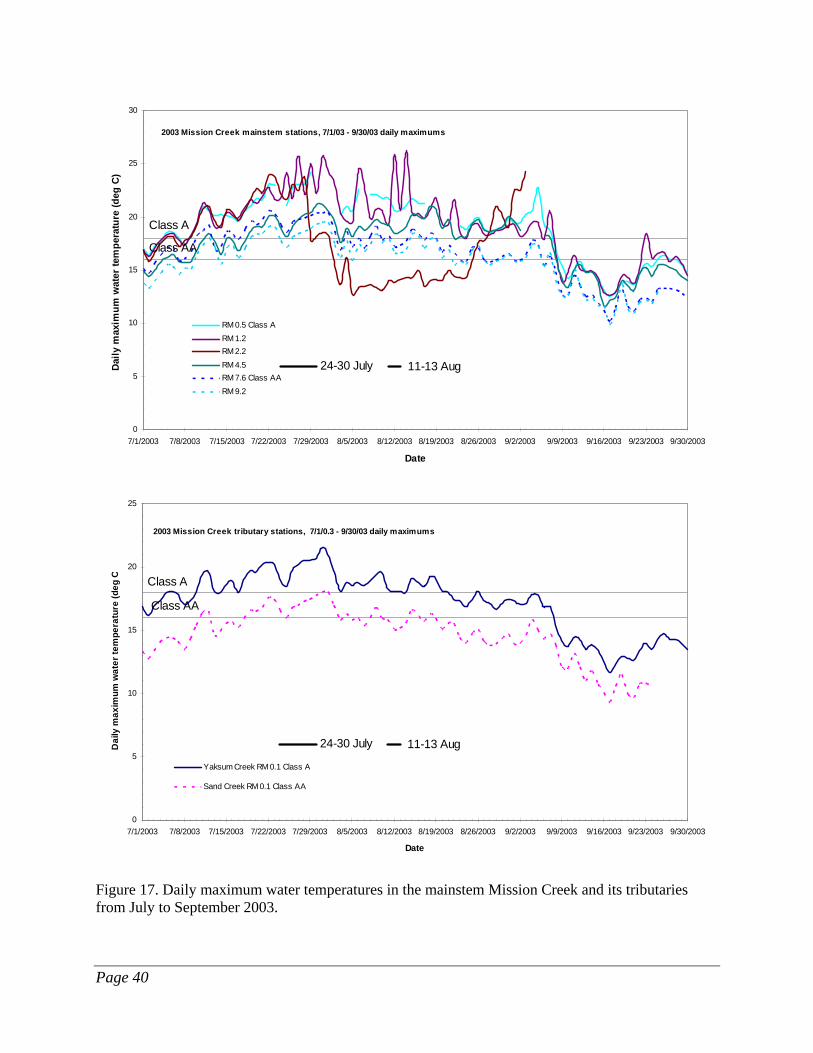
Page 40
2003 Mission Creek mainstem stations, 7/1/03 - 9/30/03 daily maximums
Class A
Class AA
24-30 July 11-13 Aug
0
5
10
15
20
25
30
7/1/2003 7/8/2003 7/15/2003 7/22/2003 7/29/2003 8/5/2003 8/12/2003 8/19/2003 8/26/2003 9/2/2003 9/9/2003 9/16/2003 9/23/2003 9/30/2003
Date
Daily
max
imum
wat
er te
mpe
ratu
re (d
eg C
)
RM 0.5 Class ARM 1.2RM 2.2RM 4.5RM 7.6 Class AARM 9.2
2003 Mission Creek tributary stations, 7/1/0.3 - 9/30/03 daily maximums
Class A
Class AA
24-30 July 11-13 Aug
0
5
10
15
20
25
7/1/2003 7/8/2003 7/15/2003 7/22/2003 7/29/2003 8/5/2003 8/12/2003 8/19/2003 8/26/2003 9/2/2003 9/9/2003 9/16/2003 9/23/2003 9/30/2003
Date
Dai
ly m
axim
um w
ater
tem
pera
ture
(deg
C
Yaksum Creek RM 0.1 Class A
Sand Creek RM 0.1 Class AA
Figure 17. Daily maximum water temperatures in the mainstem Mission Creek and its tributaries from July to September 2003.
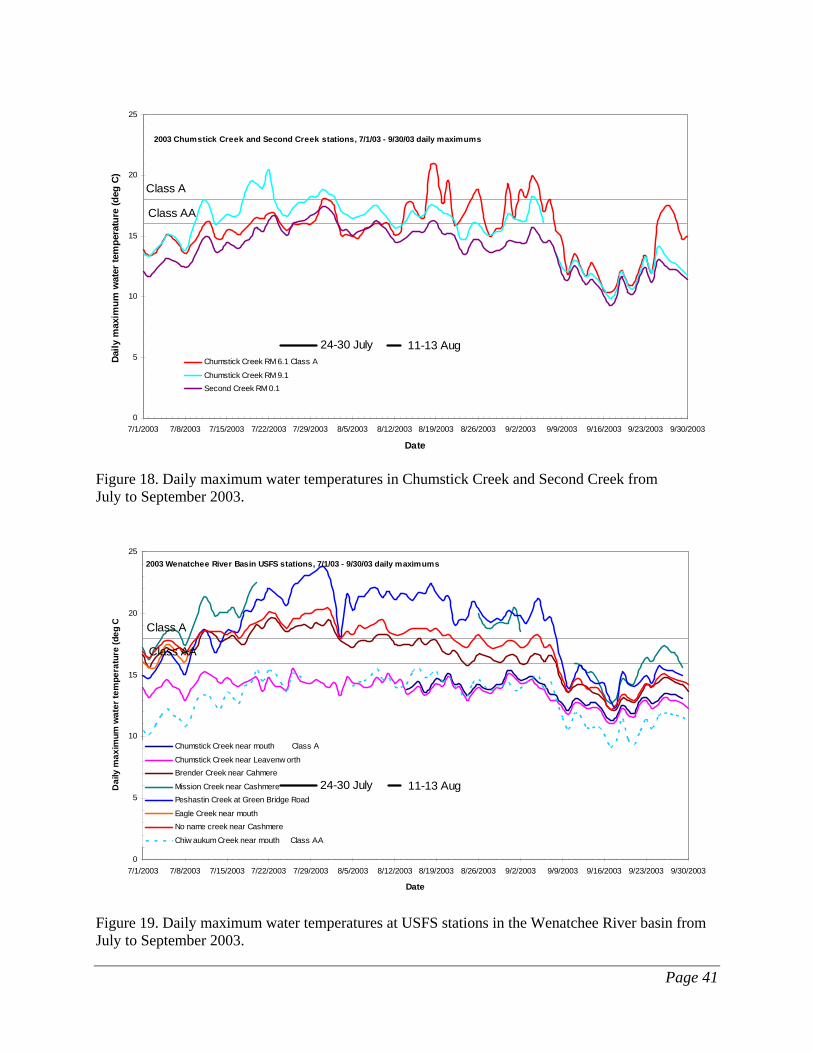
Page 41
2003 Chumstick Creek and Second Creek stations, 7/1/03 - 9/30/03 daily maximums
Class A
Class AA
24-30 July 11-13 Aug
0
5
10
15
20
25
7/1/2003 7/8/2003 7/15/2003 7/22/2003 7/29/2003 8/5/2003 8/12/2003 8/19/2003 8/26/2003 9/2/2003 9/9/2003 9/16/2003 9/23/2003 9/30/2003
Date
Daily
max
imum
wat
er te
mpe
ratu
re (d
eg C
)
Chumstick Creek RM 6.1 Class A
Chumstick Creek RM 9.1Second Creek RM 0.1
Figure 18. Daily maximum water temperatures in Chumstick Creek and Second Creek from July to September 2003.
2003 Wenatchee River Basin USFS stations, 7/1/03 - 9/30/03 daily maximums
Class A
Class AA
24-30 July 11-13 Aug
0
5
10
15
20
25
7/1/2003 7/8/2003 7/15/2003 7/22/2003 7/29/2003 8/5/2003 8/12/2003 8/19/2003 8/26/2003 9/2/2003 9/9/2003 9/16/2003 9/23/2003 9/30/2003
Date
Dai
ly m
axim
um w
ater
tem
pera
ture
(deg
C
Chumstick Creek near mouth Class A
Chumstick Creek near Leavenw orthBrender Creek near Cahmere
Mission Creek near CashmerePeshastin Creek at Green Bridge Road
Eagle Creek near mouthNo name creek near Cashmere
Chiw aukum Creek near mouth Class AA
Figure 19. Daily maximum water temperatures at USFS stations in the Wenatchee River basin from July to September 2003.

Page 42
Water temperature data – aerial surveys In addition to the network of continuously recording temperature dataloggers, a helicopter-mounted thermal infrared radiation (TIR) sensor and color video camera was used to take TIR and visible color images of selected segments of the streams and rivers in the watershed to provide a spatially continuous image of surface temperature. Surveys of the selected segments were conducted during August of 2001, 2002, and 2003 as follows:
• Aerial Surveys on August 12-14, 2001: o Chiwawa River, 12-Aug-01 o Wenatchee River, 13-Aug-01 o Little Wenatchee River, 13-Aug-01 o Nason Creek, 14-Aug-01
• Aerial Surveys on August 16, 2002: o Wenatchee River, 16-Aug-02 o Icicle Creek, 16-Aug-02
• Aerial Surveys on August 11-12, 2003: o Mission Creek, 11-Aug-03 o Brender Creek, 11-Aug-03 o Peshastin Creek, 11-Aug-03 o Chumstick Creek, 11-Aug-03 o Nason Creek, 12-Aug-03
An image browser was developed to view the TIR and color video images from 2001, 2002, and 2003. Copies of the browser software and TIR and color imagery from the aerial surveys are available on the Web at the following location: http://www.ecy.wa.gov/apps/watersheds/temperature/tir/wenatchee/ The TIR files on the Web also include Excel spreadsheets of longitudinal profiles of stream temperatures that were recorded during the TIR surveys and ArcView shapefiles of the water temperatures that were estimated from the TIR images. A TIR map for 2002 and 2003 is presented in Figure 20.

Page 43
###################################################################################################################################################################
##################################################################
#######################################################
###############################################################################################################################
##############################
##########################
#################
##########################################
###############################################################
############################
###############################################
#####################################################################################
#####################################################################################################################################################
####################################################################################################################################
###########################
###################################################################################
########################################################################################################################################################################################################################################
############################################################################################################################################################################################################################################################################################################################
#############################################################################################################################################################################
##########################################################################################################################################################################################################################################################################################################
13.711.6 13.8
15.315.5
17.217.4
18.017.8
18.4
18.6
18.6
18.8
18.7
18.418.4
19.1
19.5
19.8
19.919.7
16.9
17.6
16.3
17.1
19.9
20.6
14.4
15.6
16.216.6
16.618.1
15.2
14.8
18.7
15.4
17.1
15.9
18.2
20.3
N
10 0 10 Kilometers
streamswaterbodies
TIR surveys in the Wenatchee River Basin
2002: Wenatchee River and Icicle Creek2003: Nason Ceek, Peshastin Creek, Mission Creek
Figure 20. TIR surveys in the Wenatchee River basin in 2002 and 2003.

Page 44
Wenatchee Lake temperatures strongly influence the Wenatchee River temperature longitudinal profile in the upper watershed. As an example, Figure 21 shows two temperature profiles on two different years. The 2001 condition corresponds to a hot period and close to 7Q10 flows, while the 2002 profile is closer to a median meteorological and flow condition.
14
15
16
17
18
19
20
21
22
23
24
0 10 20 30 40 50 60 70 80 90
Downstream Km
Stre
am te
mpe
ratu
re (d
eg C
)
Temperature measured by thermal infrared method, August 16, 2002Temperature measured by thermal infrared method, August 11, 2001Temperature measured by instream instrument, August 16, 2002
Figure 21. Wenatchee River temperature longitudinal profiles on August 16, 2002 and August 11, 2001.
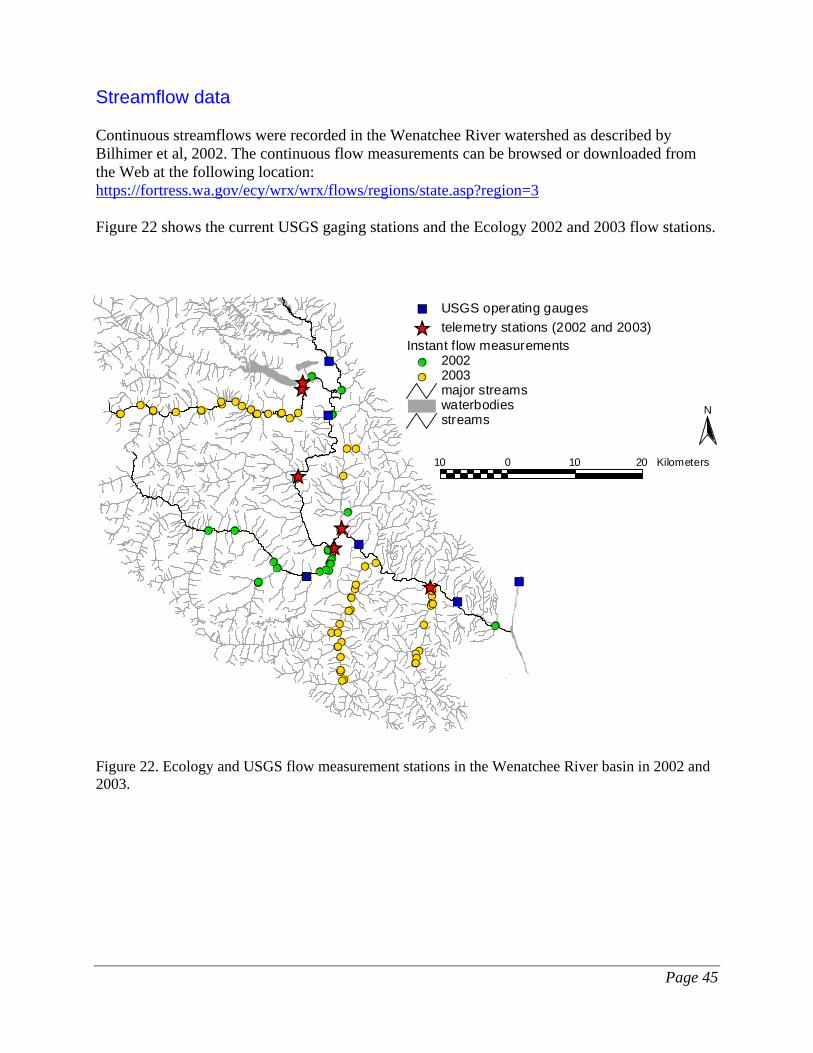
Page 45
Streamflow data Continuous streamflows were recorded in the Wenatchee River watershed as described by Bilhimer et al, 2002. The continuous flow measurements can be browsed or downloaded from the Web at the following location: https://fortress.wa.gov/ecy/wrx/wrx/flows/regions/state.asp?region=3 Figure 22 shows the current USGS gaging stations and the Ecology 2002 and 2003 flow stations.
#S
#S#S
#S
#S
#S
#S
#S
#S#S
#S
#S
#S #S
#S
#S#S
#S
#S
#S#S
#S
#S#S
#S
#S
#S#S
#S
#S
#S#S
#S #S#S#S
#S
#S
#S
#S
#S #S#S #S #S#S
#S
#S
#S #S#S
#S
#S#S#S#S#S#S
#S
#S#S
#S
#S#S#S
#S
#S
#S
#S
#S
#S#S#S#S#S#S
#S
#S#S
#S
#S#S
#S
#S#S
ÊÚÊÚ
ÊÚ
ÊÚÊÚ
ÊÚ %a
%a
%a
%a
%a
%a
10 0 10 20 Kilometers
Nstreamswaterbodiesmajor streams
Instant flow measurements#S 2002#S 2003
ÊÚ telemetry stations (2002 and 2003)%a USGS operating gauges
Figure 22. Ecology and USGS flow measurement stations in the Wenatchee River basin in 2002 and 2003.

Page 46
USGS stations with greater than 10 years of flow data were used to estimate the 7-day consecutive low flow with a 10-year return frequency (7Q10) and the 7-day consecutive low flow with a 2-year return frequency (7Q2) during July-August. Low flow statistics were estimated using a 3-parameter log normal distribution (Table 6). Table 6. Low flow statistics for July-August at USGS gaging stations in the Wenatchee River basin.
Station Station name Drainage
area (sq mi)
Period of record
7Q2 (cfs)
7Q10 (cfs)
Years of data
1911-1914 1936-1949 1954-1957
12456500 Chiwawa River near Plain 170
1991-present
169 108 33
1936-1971 12458000 Icicle Creek above Snow Creek 193
1993-present160 117 45
12461400 Mission Creek above Sand Creek 39.8 1958-1971 2.4 1.7 14
12455000 Wenatchee River below Lake Wenatchee 273 1932-1958 405 272 27
1910-1979 12457000 Wenatchee River at Plain 591
1989-present747 471 81
12459000 Wenatchee River at Peshastin 1,000 1929-present 857 556 74
12462500 Wenatchee River at Monitor 1,301 1962-present 809 479 40

Page 47
Climate data Meteorological data relevant to the Wenatchee River basin water temperature assessment were obtained from various weather data sources (Figure 23):
• The state Department of Transportation (DOT) operates and maintains weather stations at four locations in WRIA 45: Dryden Road, Cashmere, Stevens Pass, and Blewett Pass.
• At Pangborn Airport in Wenatchee, surface weather data are recorded by the National Weather Service in METAR format (the international code to report routine, hourly weather conditions at air terminals).
• NOAA’s National Climate Data Center (NCDC) operates several weather stations in the Wenatchee watershed.
• Washington State University operates a Public Agricultural Weather System (PAWS) weather station at the Tree Forest Research and Extension Center (TFREC) in Wenatchee.
• Ecology recorded relative humidity and air temperature measurements at several instream datalogger locations during the monitoring period.
8 0 8 16 Kilometers
N
streamswaterbodiesmajor streams
Ecology air temperature stations#S 2002#S 2003
Ecology relative humidity stations%U 2002%U 2003
Meteorological stationsx{ DOT'] ECY&\ METAR#0 NCDC#³ PAWS
#S
#S
#S
#S
#S#S
#S
#S #S
#S
#S
#S
#S
#S
#S
#S
#S
#S#S
#S
#S
#S#S
#S#S
#S
#S
#S
#S
#S
#S
#S
#S#S
#S #S
#S
#S#S
#S
#S
#S
#S
#S#S
#S
#S#S
#S
#S#S
#S#S#S
#S
#S
#S
#S
#S #S#S #S#S
#S
#S #S#S
#S
%U
%U
%U
%U
%U
#0
#0
#0
#0
#0
#0#³
&\
x{x{
x{
x{
']
Figure 23. Meteorological stations relevant for the Wenatchee River basin. Ecology relative humidity and air temperature stations in 2002 and 2003.

Page 48
The NOAA-COOP (National Oceanic and Atmospheric Administration - Cooperative Observer Program) meteorological station at Leavenworth was investigated for long-term statistics due to the availability of historical meteorological data and to the representative position in the basin of this station for the studied area. The highest daily mean air temperature and the highest 7-day average of daily mean air temperature were selected for each year and were used to determine the median and the 90th percentile conditions. Forty-nine years of data were used for this statistical analysis summarized in Table 7. Table 7. Estimated daily maximum and minimum air temperatures on weeks and days with the highest daily mean air temperatures for a median year and 90th percentile year at the NOAA-COOP station in Leavenworth (ºC; 49 years of data).
Median year 90th percentile year Daily
temperature Hottest week,
8/8-14/2001
Hottest day,
7/22/2000
Hottest week,
8/11-17/2001
Hottest day,
7/23/1994
Mean 24.8 27.2 26.2 28.9
Maximum 36.6 36.7 37.8 41.1
Minimum 13.2 17.8 14.5 16.7

Page 49
A regression of average daily maximum and minimum air temperatures during July – August versus elevation along the streams in the Wenatchee River basin is presented in Figure 24 with data from www.daymet.org. Daymet data is a model that uses a digital elevation model and daily observations of minimum and maximum temperatures to generate an 18-year daily data set (1980-1997) of temperatures as a continuous surface at a 1 Km resolution.
Daily maximum air temperatures:y = -0.0104x + 32.01
R2 = 0.807
Daily minimum air temperatures:y = -0.0088x + 14.675
R2 = 0.8571
0
5
10
15
20
25
30
35
150 200 250 300 350 400 450 500 550 600Elevation above sea level (m)
Ave
rage
dai
ly m
in/m
ax te
mpe
ratu
res
durin
g Ju
ly-A
ugus
t (de
g C
)
Figure 24. Regression of average daily maximum and minimum air temperatures versus elevation along the streams in the Wenatchee River basin.

Page 50
Riparian vegetation and effective shade Mapping the near-stream vegetation cover at current conditions Near-stream vegetation cover, along with channel morphology and stream hydrology, represent the most important factors that influence stream temperature. To obtain a detailed description of the existing riparian conditions in the Wenatchee River basin, a combination of GIS analysis and aerial photography interpretation was used. A 300-foot buffer from each bank of the Wenatchee River (Figure 25) was defined along both sides of the river in a GIS environment. Vegetation polygons were mapped at a 1:2500 scale within the stream buffer. A vegetation type code that combines information about the average tree height and canopy density was assigned to each delineated polygon using full-color digital orthophoto quadrangles (DOQs) 1:24000, as represented in Figure 25. To increase the accuracy of the image interpretation (riparian vegetation type, height, and density), an additional set of aerial photographs was used: digital photographs acquired during the TIR survey. These photos (about 1800 images with about 40% overlap) were taken from low altitude (approximately 300 m) and provided a higher level of detail than the orthophotos. The images are more accurate, and specific details such as tree shadows helped in deciphering the species composition and height. Field observations of vegetation type, height, and density were also compared against the digitized GIS data. The near-stream vegetation cover for the Wenatchee River tributaries was mapped using the ArcView GIS dynamic segmentation method which proved to be more cost-effective and sufficiently accurate compared to the polygon delineation method (Cristea, 2004).
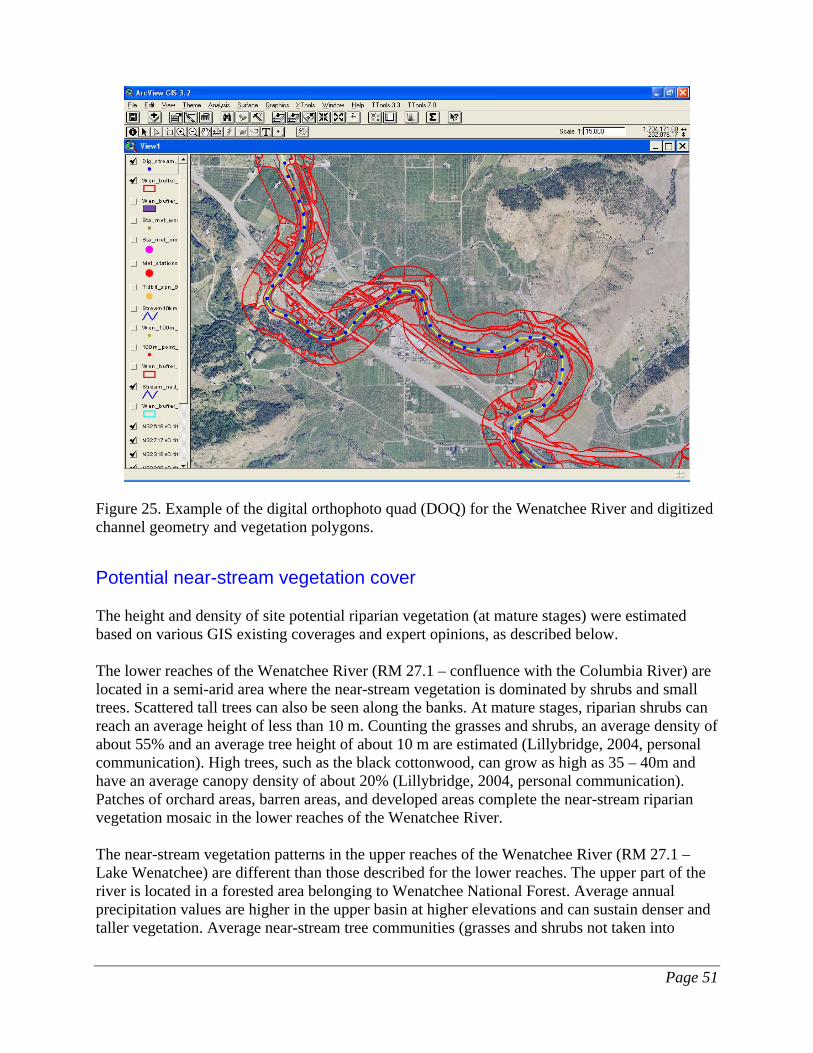
Page 51
Figure 25. Example of the digital orthophoto quad (DOQ) for the Wenatchee River and digitized channel geometry and vegetation polygons.
Potential near-stream vegetation cover The height and density of site potential riparian vegetation (at mature stages) were estimated based on various GIS existing coverages and expert opinions, as described below. The lower reaches of the Wenatchee River (RM 27.1 – confluence with the Columbia River) are located in a semi-arid area where the near-stream vegetation is dominated by shrubs and small trees. Scattered tall trees can also be seen along the banks. At mature stages, riparian shrubs can reach an average height of less than 10 m. Counting the grasses and shrubs, an average density of about 55% and an average tree height of about 10 m are estimated (Lillybridge, 2004, personal communication). High trees, such as the black cottonwood, can grow as high as 35 – 40m and have an average canopy density of about 20% (Lillybridge, 2004, personal communication). Patches of orchard areas, barren areas, and developed areas complete the near-stream riparian vegetation mosaic in the lower reaches of the Wenatchee River. The near-stream vegetation patterns in the upper reaches of the Wenatchee River (RM 27.1 – Lake Wenatchee) are different than those described for the lower reaches. The upper part of the river is located in a forested area belonging to Wenatchee National Forest. Average annual precipitation values are higher in the upper basin at higher elevations and can sustain denser and taller vegetation. Average near-stream tree communities (grasses and shrubs not taken into
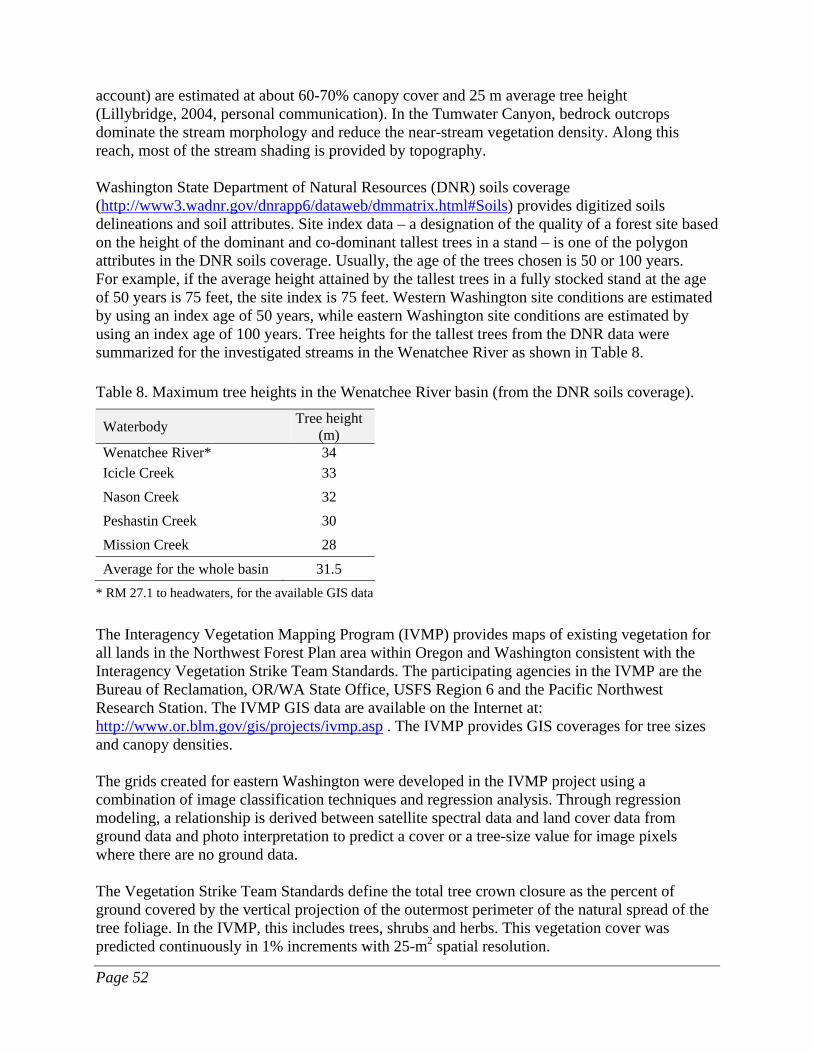
Page 52
account) are estimated at about 60-70% canopy cover and 25 m average tree height (Lillybridge, 2004, personal communication). In the Tumwater Canyon, bedrock outcrops dominate the stream morphology and reduce the near-stream vegetation density. Along this reach, most of the stream shading is provided by topography. Washington State Department of Natural Resources (DNR) soils coverage (http://www3.wadnr.gov/dnrapp6/dataweb/dmmatrix.html#Soils) provides digitized soils delineations and soil attributes. Site index data – a designation of the quality of a forest site based on the height of the dominant and co-dominant tallest trees in a stand – is one of the polygon attributes in the DNR soils coverage. Usually, the age of the trees chosen is 50 or 100 years. For example, if the average height attained by the tallest trees in a fully stocked stand at the age of 50 years is 75 feet, the site index is 75 feet. Western Washington site conditions are estimated by using an index age of 50 years, while eastern Washington site conditions are estimated by using an index age of 100 years. Tree heights for the tallest trees from the DNR data were summarized for the investigated streams in the Wenatchee River as shown in Table 8. Table 8. Maximum tree heights in the Wenatchee River basin (from the DNR soils coverage).
Waterbody Tree height (m)
Wenatchee River* 34 Icicle Creek 33 Nason Creek 32 Peshastin Creek 30 Mission Creek 28
Average for the whole basin 31.5 * RM 27.1 to headwaters, for the available GIS data
The Interagency Vegetation Mapping Program (IVMP) provides maps of existing vegetation for all lands in the Northwest Forest Plan area within Oregon and Washington consistent with the Interagency Vegetation Strike Team Standards. The participating agencies in the IVMP are the Bureau of Reclamation, OR/WA State Office, USFS Region 6 and the Pacific Northwest Research Station. The IVMP GIS data are available on the Internet at: http://www.or.blm.gov/gis/projects/ivmp.asp . The IVMP provides GIS coverages for tree sizes and canopy densities. The grids created for eastern Washington were developed in the IVMP project using a combination of image classification techniques and regression analysis. Through regression modeling, a relationship is derived between satellite spectral data and land cover data from ground data and photo interpretation to predict a cover or a tree-size value for image pixels where there are no ground data. The Vegetation Strike Team Standards define the total tree crown closure as the percent of ground covered by the vertical projection of the outermost perimeter of the natural spread of the tree foliage. In the IVMP, this includes trees, shrubs and herbs. This vegetation cover was predicted continuously in 1% increments with 25-m2 spatial resolution.

Page 53
Tree sizes were estimated in the IVMP project using the quadratic mean diameter (QMD) defined as the diameter at the breast height (DBH) of a tree of average basal area for the stand. Due to the nature of the land cover and the lack of the field data, supervised and unsupervised classifications were used for the tree size coverage. In an unsupervised classification, the pixels are sorted into clusters based on similar numbers in all spectral bands where the land cover type is represented by each spectral group. In a supervised technique, training samples are built for each cover type followed by an automatic classification procedure. The following QMD classes were mapped: 0-4.9”, 5-9.9”, 10-19.9” and 20”+. The species likely to dominate the Wenatchee Forest area, which includes the Wenatchee River basin, following an extended disturbance-free period were identified in Lillybridge et al. (1995) and summarized in Whiley and Cleland (2003): ponderosa pine/shrub-steppe, Douglas-fir, Douglas-fir/grand fir, grand fir/western hemlock, western hemlock, Pacific silver fir/ mountain hemlock, and sub-alpine fir. Potential near-stream vegetation cover characteristics (tree height and optimal canopy cover) were determined summarizing the IVMP GIS data in 100m (each side or 200 m total) buffers created along the stream polylines. Tree height was estimated using the power function developed by Whiley and Cleland (2003) in the Wenatchee Forest temperature TMDL study for all the above vegetation species:
0.59iDBH*65.17height n inchfeetin =
The DBH in this equation is estimated as a weighted average. The proportions of each of the QMD classes were estimated individually for each of the investigated stream buffers. For example, the representation of QMD classes in the 100-m riparian buffer along Icicle Creek is illustrated in Table 9. Table 9. QMD classes in the Icicle Creek riparian buffer.
QMD class
% of riparian area corresponding to each QMD class
0 – 4.9” 0.14 5 – 9.9” 0.18
10 – 19.9” 0.58 20” + 0.10
To estimate an average tree size at mature stages for the whole corridor, a weighted average for the DBH value was calculated as following:
DBHIcicle Creek = 0.14*4.9 + 0.18*9.9 + 0.58*19.9 +25*25 = 16.51” The maximum value of each class (e.g., for the 0-4.9” class, 4.9” was chosen) was used to estimate mature vegetation. The same method was used to estimate the optimal canopy density using four density classes: 0-10%, 10-40%, 40-70%, and 70-100%.
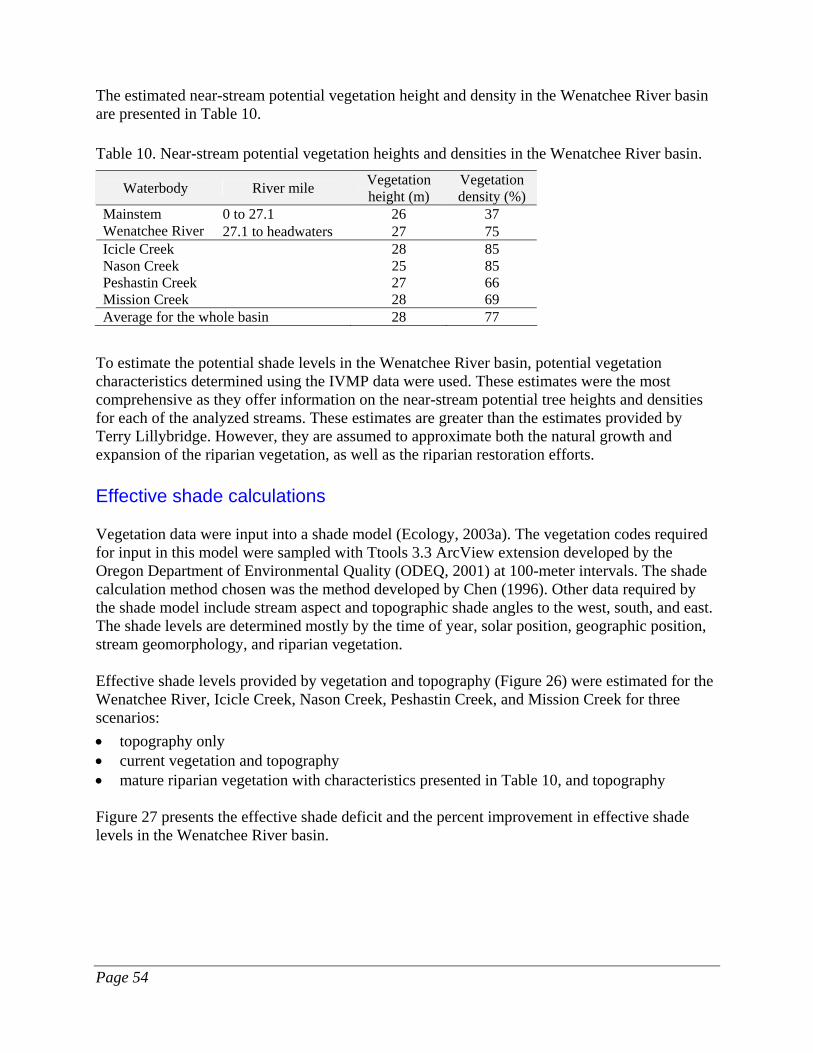
Page 54
The estimated near-stream potential vegetation height and density in the Wenatchee River basin are presented in Table 10. Table 10. Near-stream potential vegetation heights and densities in the Wenatchee River basin.
Waterbody River mile Vegetation height (m)
Vegetation density (%)
0 to 27.1 26 37 Mainstem Wenatchee River 27.1 to headwaters 27 75 Icicle Creek 28 85 Nason Creek 25 85 Peshastin Creek 27 66 Mission Creek 28 69 Average for the whole basin 28 77
To estimate the potential shade levels in the Wenatchee River basin, potential vegetation characteristics determined using the IVMP data were used. These estimates were the most comprehensive as they offer information on the near-stream potential tree heights and densities for each of the analyzed streams. These estimates are greater than the estimates provided by Terry Lillybridge. However, they are assumed to approximate both the natural growth and expansion of the riparian vegetation, as well as the riparian restoration efforts. Effective shade calculations Vegetation data were input into a shade model (Ecology, 2003a). The vegetation codes required for input in this model were sampled with Ttools 3.3 ArcView extension developed by the Oregon Department of Environmental Quality (ODEQ, 2001) at 100-meter intervals. The shade calculation method chosen was the method developed by Chen (1996). Other data required by the shade model include stream aspect and topographic shade angles to the west, south, and east. The shade levels are determined mostly by the time of year, solar position, geographic position, stream geomorphology, and riparian vegetation.
Effective shade levels provided by vegetation and topography (Figure 26) were estimated for the Wenatchee River, Icicle Creek, Nason Creek, Peshastin Creek, and Mission Creek for three scenarios: • topography only • current vegetation and topography • mature riparian vegetation with characteristics presented in Table 10, and topography Figure 27 presents the effective shade deficit and the percent improvement in effective shade levels in the Wenatchee River basin.
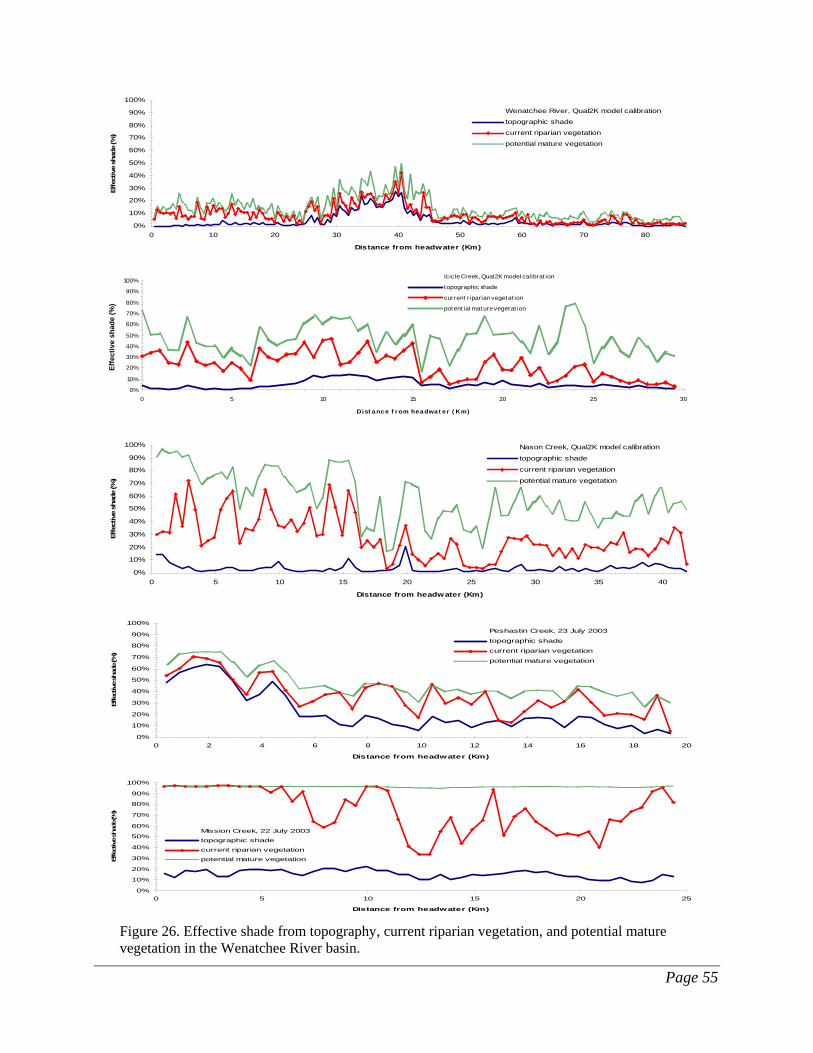
Page 55
0%
10%
20%
30%
40%
50%
60%
70%
80%
90%
100%
0 10 20 30 40 50 60 70 80
Distance from headwater (Km)
Effe
ctiv
e sh
ade
(%)
Wenatchee River, Qual2K model calibration
topographic shade
current riparian vegetation
potential mature vegetation
0%
10%
20%
30%
40%
50%
60%
70%
80%
90%
100%
0 5 10 15 20 25 30
Dist a nc e f r om hea dwa t e r ( Km)
Icicle Creek, Qual2K model calibrat ion
topographic shade
current riparian vegetat ion
potent ial mat ure veget at ion
0%
10%
20%
30%
40%
50%
60%
70%
80%
90%
100%
0 5 10 15 20 25 30 35 40
Distance from headwater (Km)
Effe
ctiv
e sh
ade
(%)
Nason Creek, Qual2K model calibration
topographic shade
current riparian vegetation
potential mature vegetation
0%
10%
20%
30%
40%
50%
60%
70%
80%
90%
100%
0 2 4 6 8 10 12 14 16 18 20
Distance from headwater (Km)
Effe
ctive sh
ade (%
)
Peshastin Creek, 23 July 2003
topographic shade
current riparian vegetation
potential mature vegetation
0%
10%
20%
30%
40%
50%
60%
70%
80%
90%
100%
0 5 10 15 20 25
Distance from headwater (Km)
Effective sh
ade (%
)
Mission Creek, 22 July 2003
topographic shade
current riparian vegetation
potential mature vegetation
Figure 26. Effective shade from topography, current riparian vegetation, and potential mature vegetation in the Wenatchee River basin.
Effe
ctiv
e sh
ade
(%)
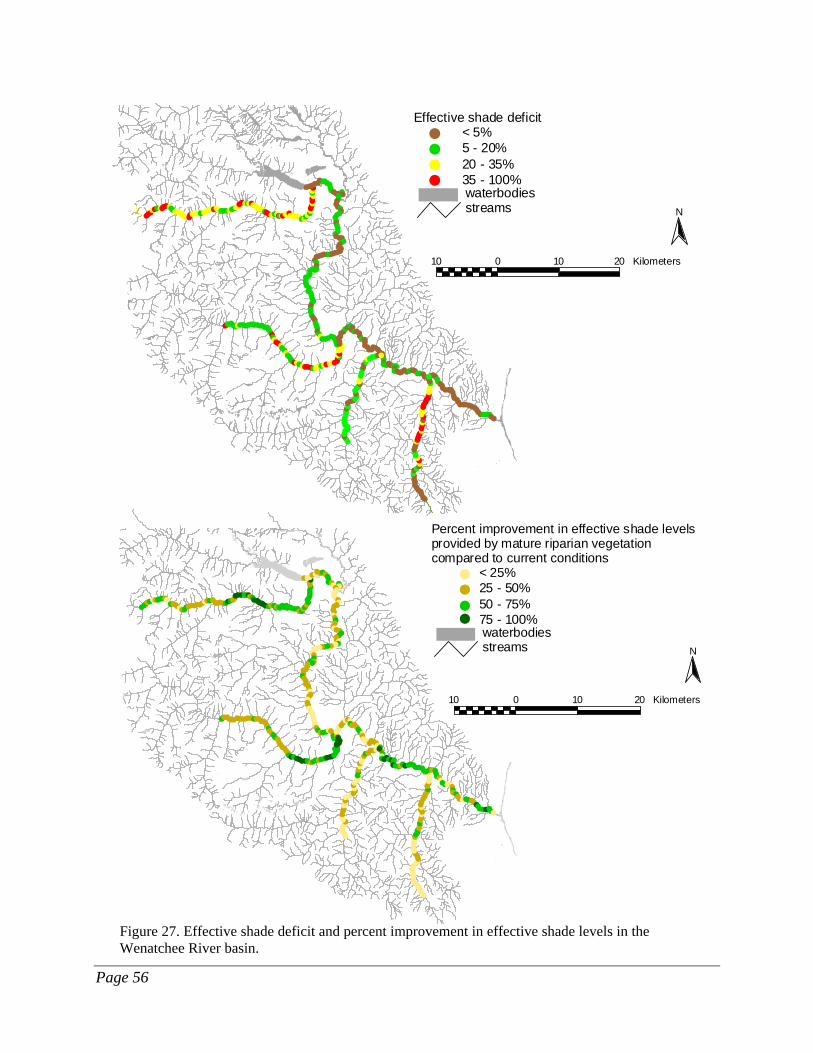
Page 56
#########
#####################
###########################################
###########
############################################################
##############################################################################################
###############################################################################
#################################################
#######################################
10 0 10 20 Kilometers
Nstreamswaterbodies
Effective shade deficit# < 5%# 5 - 20%# 20 - 35%# 35 - 100%
######################
#################
#############################################
#################################################
##############################################################################################
###############################################################################
###################
##################
##
#################################################
###########
10 0 10 20 Kilometers
Nstreamswaterbodies
Percent improvement in effective shade levelsprovided by mature riparian vegetation compared to current conditions
< 25%25 - 50%50 - 75%75 - 100%
####
Figure 27. Effective shade deficit and percent improvement in effective shade levels in the Wenatchee River basin.
Page 57
Analytical framework Data collected during this TMDL study allow the development of a temperature simulation model that is both spatially continuous and which spans full-day lengths (steady flow, dynamic heat budget, and water temperature). The GIS and modeling analyses use three specialized software tools:
1. ODEQ’s Ttools extension for ArcView (ODEQ, 2001) was used to sample and process GIS data for input to the Shade and QUAL2Kw models.
2. Ecology’s Shade model (Ecology, 2003a) was used to estimate effective shade along the mainstems of the major tributaries in the Wenatchee River basin. Effective shade was calculated at 100-meter intervals along the streams and then averaged over 500-meter intervals for input to the QUAL2Kw model.
3. The QUAL2Kw model (Pelletier and Chapra, 2003; Chapra and Pelletier, 2003) was used to calculate the components of the heat budget and to simulate water temperatures. QUAL2Kw simulates diurnal variations in stream temperature for a steady flow condition. QUAL2Kw was applied by assuming that flow remains constant for a given condition such as a 7-day or 1-day period, but key variables are allowed to vary with time over the course of a day. For temperature simulation, the solar radiation, air temperature, relative humidity, headwater temperature, and tributary water temperatures were specified or simulated as diurnally varying functions. QUAL2Kw uses the kinetic formulations for the components of the surface water heat budget that are shown in Figure 4 and described in Chapra (1997). Diurnally varying water temperatures at 500-meter intervals along the streams in the Wenatchee River basin were simulated using a finite difference numerical method.
All input data for the Shade and QUAL2Kw models are longitudinally referenced, allowing spatial and/or continuous inputs to apply to certain zones or specific river segments. Model input data were determined from available GIS coverages using the Ttools extension for ArcView, or from data collected by Ecology or other data sources. Detailed spatial data sets were developed for the following parameters for model calibration and verification:
• The Wenatchee River, Icicle Creek, Nason Creek, Peshastin Creek, and Mission Creek were mapped at 1:3,000 scale from 1-meter-resolution Digital Orthophoto Quads (DOQ).
• Near-stream disturbance zone (NSDZ) widths were digitized at 1:3000 scale.
• West, east, and south topographic shade angle calculations were made from the 10-meter DEM grid using ODEQ’s Ttools extension for ArcView.
• Stream elevation and gradient were sampled from the 10-meter DEM grid with the ArcView Ttools extension. Gradient was calculated from the longitudinal profiles of elevation from the 10-meter DEM.
• Aspect (streamflow direction in decimal degrees from north) was calculated by the Ttools extension for ArcView.

Page 58
• The daily minimum and maximum observed temperatures for the boundary conditions at the headwaters and tributaries were used as input to the QUAL2Kw model for the calibration and verification periods.
• Flow balances for the preliminary calibration and verification periods were estimated from field measurements and gage data of flows made by Ecology and the USGS. A flow balance spreadsheet of the stream networks for the Wenatchee River, Icicle Creek, and Nason Creek was constructed to estimate surface water and groundwater inflows by interpolating between the gaging stations.
• Hydraulic geometry (wetted width, depth, and velocity as a function of flow) was estimated using wetted widths that were digitized from DOQs and scaled to different river flows using the average power functions from the USGS gaging stations. Velocities were estimated from dye study data and scaled to different river flows using the average power functions from the USGS gaging stations.
• The temperature of groundwater is often assumed to be similar to the mean annual air temperature (Theurer et al, 1984). Calibration of the QUAL2Kw model involved selection of the temperature of diffuse inflows, ranging from the estimated temperature of groundwater temperature to observed temperatures of surface water tributaries.
Calibration and confirmation of the QUAL2Kw model The August 10-16, 2002 period (the hottest 7-day period of 2002) was used to calibrate the QUAL2Kw water quality model for the Wenatchee River and Icicle Creek. The TIR survey for both streams took place on August 16, 2002; therefore, the TIR-derived temperature data could be compared to the model results. The calibration, however, was performed using the 7-day averages of the instream data logger values. A cool period of September 9-11, 2002 was used to confirm the stream temperature model. Due to the construction of the Leavenworth National Fish Hatchery (LNFH) in 1939-1940, the flow of Icicle Creek was split into two distinctive channels: a man-made canal and the historic stream channel (Figure 28). Two temperature models were set up for Icicle Creek: a reach that stretches from the river mouth to RM 19.3, including the historic stream segment, and the canal itself.

Page 59
Figure 28. Icicle Creek historic channel and the Leavenworth National Fish Hatchery canal. The model calibration and confirmation periods for Nason Creek are July 24-30, 2003 and August 11-13, 2003, respectively. A TIR survey of the creek was performed on August 12, 2003. During the stream temperature monitoring period, data-loggers installed throughout the Wenatchee River watershed continuously recorded air temperature, and few data-loggers recorded relative humidity (Figure 23). Air temperatures were interpolated between reaches based on elevation using the air temperature data recorded at the tidbit data logger locations for model input. The dew point temperatures and wind were estimated as a function of elevation, using the weather data from the relevant meteorological stations located in the vicinity of the streams (e.g., Wenatchee TFREC, DOT Cashmere, DOT Dryden Road, and RAWS (Remote Automated Weather Stations) Dry Creek, or DOT Stevens Pass).
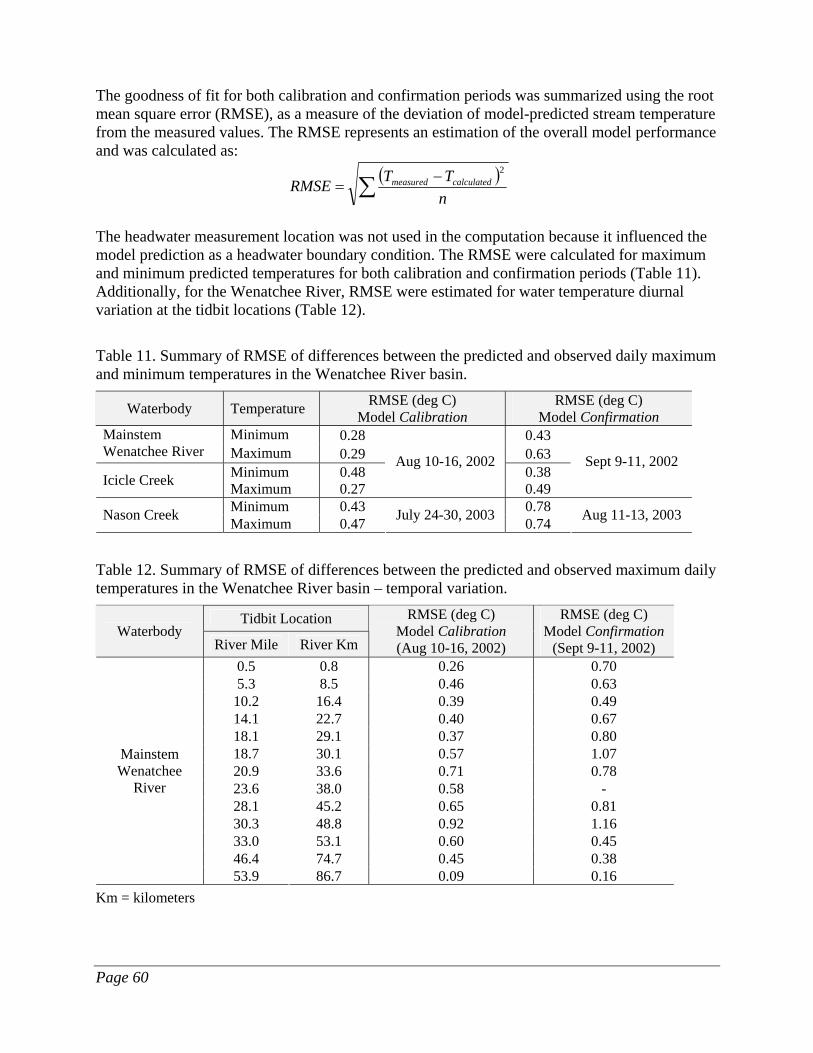
Page 60
The goodness of fit for both calibration and confirmation periods was summarized using the root mean square error (RMSE), as a measure of the deviation of model-predicted stream temperature from the measured values. The RMSE represents an estimation of the overall model performance and was calculated as:
( )∑ −=
nTTRMSE calculatedmeasured
2
The headwater measurement location was not used in the computation because it influenced the model prediction as a headwater boundary condition. The RMSE were calculated for maximum and minimum predicted temperatures for both calibration and confirmation periods (Table 11). Additionally, for the Wenatchee River, RMSE were estimated for water temperature diurnal variation at the tidbit locations (Table 12). Table 11. Summary of RMSE of differences between the predicted and observed daily maximum and minimum temperatures in the Wenatchee River basin.
Waterbody Temperature RMSE (deg C) Model Calibration
RMSE (deg C) Model Confirmation
Minimum 0.28 0.43 Mainstem Wenatchee River Maximum 0.29 0.63
Minimum 0.48 0.38 Icicle Creek Maximum 0.27
Aug 10-16, 2002
0.49
Sept 9-11, 2002
Minimum 0.43 0.78 Nason Creek Maximum 0.47 July 24-30, 2003 0.74 Aug 11-13, 2003
Table 12. Summary of RMSE of differences between the predicted and observed maximum daily temperatures in the Wenatchee River basin – temporal variation.
Tidbit Location Waterbody
River Mile River Km
RMSE (deg C) Model Calibration (Aug 10-16, 2002)
RMSE (deg C) Model Confirmation
(Sept 9-11, 2002) 0.5 0.8 0.26 0.70 5.3 8.5 0.46 0.63
10.2 16.4 0.39 0.49 14.1 22.7 0.40 0.67 18.1 29.1 0.37 0.80 18.7 30.1 0.57 1.07 20.9 33.6 0.71 0.78 23.6 38.0 0.58 - 28.1 45.2 0.65 0.81 30.3 48.8 0.92 1.16 33.0 53.1 0.60 0.45 46.4 74.7 0.45 0.38
Mainstem Wenatchee
River
53.9 86.7 0.09 0.16 Km = kilometers

Page 61
The predicted and measured maximum, mean, and minimum stream water temperature longitudinal profiles for the calibration and confirmation periods for the Wenatchee River are presented in Figure 29. Stream temperature temporal variations at several locations along the mainstem Wenatchee River are shown in Figure 30 and Figure 31. Model calibration and confirmation results for Icicle Creek and Nason Creek are shown in Figures 32 and 33, respectively.
0
5
10
15
20
25
0 10 20 30 40 50 60 70 80
Distance from headwater (Km)
Stre
am w
ater
tem
pera
ture
(deg
C)
Daily maximum predicted water temperatureDaily maximum measured water temperatureDaily minimum predicted water temperatureDaily average predicted water temperatureDaily minimum measured water temperatureTIR derived water temperature 16 Aug 200210 - 16 August 2002
Mainstem Wenatchee River
0
5
10
15
20
25
0 10 20 30 40 50 60 70 80
Distance from headwater (Km)
Stre
am w
ater
tem
pera
ture
(deg
C)
Daily maximum predicted water temperatureDaily maximum measured water temperatureDaily minimum predicted water temperatureDaily average predicted water temperatureDaily minimum measured water temperature9 - 11 September 2002
Mainstem Wenatchee River
Figure 29. Predicted and observed water temperatures in the Wenatchee River at model calibration (10-16 August 2002) and model confirmation (9-11 September 2002).

Page 62
13
15
17
19
21
23
12:00 AM 2:24 AM 4:48 AM 7:12 AM 9:36 AM 12:00 PM 2:24 PM 4:48 PM 7:12 PM 9:36 PM 12:00 AM
Day / Time
Qual 2K
M easurements 10-16 Aug 2002
RM 0.5RMSE = 0.26 deg C
13
15
17
19
21
23
12:00 AM 2:24 AM 4:48 AM 7:12 AM 9:36 AM 12:00 PM 2:24 PM 4:48 PM 7:12 PM 9:36 PM 12:00 AM
Day / Time
Qual 2K
M easurements 10-16 Aug 2002
RM 10.2RMSE = 0.39 deg C
13
15
17
19
21
23
12:00 AM 2:24 AM 4:48 AM 7:12 AM 9:36 AM 12:00 PM 2:24 PM 4:48 PM 7:12 PM 9:36 PM 12:00 AM
Day / Time
Qual 2K
M easurements 10-16 Aug 2002
RM 18.7RMSE = 0.57
13
15
17
19
21
23
12:00 AM 2:24 AM 4:48 AM 7:12 AM 9:36 AM 12:00 PM 2:24 PM 4:48 PM 7:12 PM 9:36 PM 12:00 AM
Day / Time
Qual 2K
M easurements 10-16 Aug2002
RM 46.4RMSE = 0.45 deg C
Figure 30. QUAL2Kw model calibration for the Wenatchee River temperature temporal variations (10 – 16 August 2002).
13
14
15
16
17
18
19
12:00 AM 2:24 AM 4:48 AM 7:12 AM 9:36 AM 12:00 PM 2:24 PM 4:48 PM 7:12 PM 9:36 PM 12:00 AM
Day / Time
Qual 2K
Measurements 9-11Sept 2002
RM 5.3RMSE = 0.63 deg C
13
14
15
16
17
18
19
12:00 AM 2:24 AM 4:48 AM 7:12 AM 9:36 AM 12:00 PM 2:24 PM 4:48 PM 7:12 PM 9:36 PM 12:00 AM
Day / Time
Qual 2K
Measurements 9-11Sept2002
RM 33.0RMSE = 0.45 deg C
Figure 31. QUAL2Kw model confirmation for the Wenatchee River temperature temporal variations (9 – 11 September 2002).
Stre
am te
mpe
ratu
re (d
eg C
)
Stre
am te
mpe
ratu
re (d
eg C
)
Stre
am te
mpe
ratu
re (d
eg C
)
Stre
amte
mpe
ratu
re(d
egC
)
Stre
am te
mpe
ratu
re (d
eg C
)
Stre
am te
mpe
ratu
re (d
eg C
)
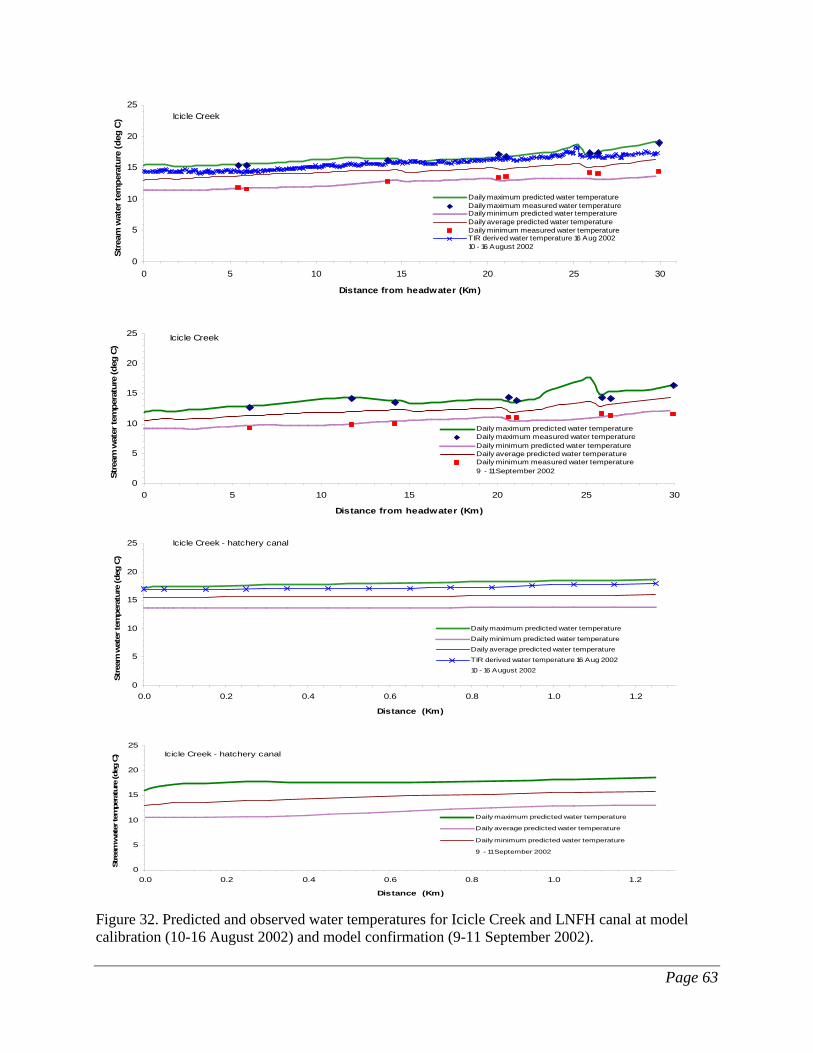
Page 63
0
5
10
15
20
25
0 5 10 15 20 25 30
Distance from headwater (Km)
Stre
am w
ater
tem
pera
ture
(deg
C)
Daily maximum predicted water temperatureDaily maximum measured water temperatureDaily minimum predicted water temperatureDaily average predicted water temperatureDaily minimum measured water temperatureTIR derived water temperature 16 Aug 200210 - 16 August 2002
Icicle Creek
0
5
10
15
20
25
0 5 10 15 20 25 30
Distance from headwater (Km)
Stre
am w
ater
tem
pera
ture
(deg
C)
Daily maximum predicted water temperatureDaily maximum measured water temperatureDaily minimum predicted water temperatureDaily average predicted water temperatureDaily minimum measured water temperature9 - 11 September 2002
Icicle Creek
0
5
10
15
20
25
0.0 0.2 0.4 0.6 0.8 1.0 1.2
Distance (Km)
Stre
am w
ater
tem
pera
ture
(deg
C)
Daily maximum predicted water temperature
Daily minimum predicted water temperatureDaily average predicted water temperature
TIR derived water temperature 16 Aug 200210 - 16 August 2002
Icicle Creek - hatchery canal
0
5
10
15
20
25
0.0 0.2 0.4 0.6 0.8 1.0 1.2
Distance (Km)
Stre
am w
ater
tem
pera
ture
(deg
C)
Daily maximum predicted water temperature
Daily average predicted water temperature
Daily minimum predicted water temperature
9 - 11 September 2002
Icicle Creek - hatchery canal
Figure 32. Predicted and observed water temperatures for Icicle Creek and LNFH canal at model calibration (10-16 August 2002) and model confirmation (9-11 September 2002).

Page 64
0
5
10
15
20
25
0 5 10 15 20 25 30 35 40
Distance from headwater (Km)
Stre
am w
ater
tem
pera
ture
(deg
C)
Daily maximum predicted water temperatureDaily maximum measured water temperatureDaily average predicted water temperatureDaily minimum predicted water temperatureDaily minimum measured water temperature24 - 30 July 2003
Nason Creek
0
5
10
15
20
25
0 5 10 15 20 25 30 35 40
Distance from headwater (Km)
Stre
am w
ater
tem
pera
ture
(deg
C)
Daily maximum predicted water temperatureDaily maximum measured water temperatureDaily average predicted water temperatureDaily minimum predicted water temperatureDaily minimum measured water temperatureTIR derived water temperature - August 12th 200311 - 13 August 2003
Nason Creek
Figure 33. Predicted and observed water temperatures for Nason Creek at model calibration (24-30 July 2003) and model confirmation (11-13 August 2003).
Page 65
Loading capacity The loading capacity provides a reference for calculating the amount of pollutant reduction needed to bring water into compliance with standards. EPA’s current regulation defines loading capacity as “the greatest amount of loading that a waterbody can receive without violating water quality standards” (40 CFR § 130.2(f)). The system potential temperature is considered to be an approximation of the temperatures that would occur under natural conditions. In areas where the system potential temperature is greater than the numeric criterion of 18ºC in Class A or 16ºC in Class AA waters, then the natural conditions provision of the water quality standard is the basis of the loading capacity, load allocations, and wasteload allocations in this TMDL. The calibrated QUAL2Kw model was used to determine the loading capacity for the studied streams in the Wenatchee River basin. Loading capacity was determined based on prediction of water temperatures under typical and extreme flow and climate conditions combined with a range of effective shade conditions. The lowest 7-day average flow with a 2-year recurrence interval (7Q2) was selected to represent a typical climatic year, and the lowest 7-day average flow with a 10-year recurrence interval (7Q10) was selected to represent a worst-case condition for the July-August period. The recommended load allocations and wasteload allocations in later sections of this report are based on the 7Q10 condition. Air temperatures for the 7Q2 flow conditions were assumed to be represented by the August 8-14, 2001 week corresponding to the median condition at the NOAA-COOP Leavenworth meteorological station. Air temperatures for the 7Q10 flow conditions were represented by the August 11-17, 2001 week corresponding to the 90th percentile condition at the same station. The current thermal behavior of the river was estimated for the 7Q2 and 7Q10 flows associated with the historic median air temperature and historic 90th percentile air temperature, respectively. A series of scenarios that would help reduce the Wenatchee River water temperature were evaluated as follows:
• Maximum potential shade. This would be provided by mature riparian vegetation with tree heights and densities evaluated for each stream (Table 10).
• Microclimate improvements. The presence of mature riparian vegetation would induce changes in microclimate conditions along the river. The air temperature and the wind speed would decrease, and the relative humidity would increase. Bartholow (2000) indicated that mature riparian vegetation would reduce the air temperature by 2oC and would increase the relative humidity by 10%. The wind speed was decreased to 0.2 m/s.
• Reduced channel widths. A 10% reduction in channel widths was assumed for this simulation.
• Conversion of consumptive withdrawals to instream flow. The surface withdrawals were converted to increased streamflow.

Page 66
For the Wenatchee River, an additional scenario that assumes tributary inputs at water quality standards (WQS) was also considered. The results of the model runs for the critical 7Q2 and 7Q10 conditions are presented in Table 13 and Figures 34 through 36. The current condition in the Wenatchee watershed is expected to result in daily maximum temperatures that are greater than 18oC in most of the evaluated reaches. Portions of the studied streams are greater than the approximate threshold for lethality of 23oC under current conditions. A climate change scenario was also investigated to evaluate the stream temperatures in the Wenatchee River basin for the July – August period. Climate change research (Jones and Mann, 2004) reveals that the late unprecedented 20th Century anomalous warming may be due to the anthropogenic impact on the environment. Climate change could affect the availability and the dynamics of water resources in the Pacific Northwest. The instream flows in the dry season depend on the snowpack stored in the wet season. Increases in air temperature will affect the amount of water stored in the snowpack, as more precipitation will fall as rain rather than snow during the wet season. Climate simulation models predict increases in air temperatures in the Pacific Northwest by 1.7 – 3.5ºC, with an average of 2.8ºC from 2000 to 2050. Under such scenarios, precipitation is anticipated to increase by about 10% on average in the wet season, but the average change in precipitation in the dry season is close to zero (Mote et al., 2001). Hamlet (2004) showed that water availability in the Columbia River basin (which includes the Wenatchee River basin) is affected by climate change especially during the summer months. The reduced area and depth of the snowpack and elevated spring and summer air temperatures melt the snow sooner, increasing the summer evapotranspiration and decreasing the summer and fall streamflow by an average of 25% by 2050. The stream temperature models were run considering a climate change scenario: an increase in air temperatures by 2.8ºC and a decrease in 7Q10 by 25%. The other scenarios discussed previously were tested sequentially on the climate change setting of the model. The results of these model runs are presented in Table 13 and Figures 34 through 36. The “lethality” limit in Figures 33 through 35 is referring to the following excerpt from an Ecology study (Hicks, 2002) that evaluates lethal temperatures for coldwater fish: “For evaluating the effects of discrete human actions, a 7-day average of the daily maximum temperatures greater than 22°C or a 1-day maximum greater than 23°C should be considered lethal to cold water fish species such as salmonids. Discharge plume temperatures should be maintained such that fish could not be entrained (based on plume time of travel) for more than 2 seconds at temperatures above 33°C to avoid creating areas that will cause near instantaneous lethality. Barriers to migration should be assumed to exist anytime daily maximum water temperatures are greater than 22°C and the adjacent down-stream water temperatures are 3°C or more cooler.”

Page 67
Table 13. Summary of average predicted daily mean/maximum water temperatures (deg C) at critical conditions in the Wenatchee River basin. Wenatchee River Icicle Creek Nason Creek Scenario
7Q2 Tmean Tmax Tmax of all reaches Tmean Tmax Tmax of all reaches Tmean Tmax Tmax of all reaches
current condition 19.1 21.4 25.0 15.8 18.3 21.8 16.5 19.9 22.7
mature riparian vegetation 18.9 21.1 24.5 15.1 17.1 19.7 14.6 17.0 19.1
plus microclimate improvement 18.6 20.8 24.0 14.9 16.8 19.0 14.1 16.3 18.8
plus reduced channel widths 18.3 20.4 23.3 14.7 16.5 18.8 14.1 16.0 18.4
plus convert surface withdrawals to instream flow 18.3 20.3 22.7 14.9 16.4 18.3 14.1 16.0 18.3
plus tributary inputs at WQS 18.2 20.2 22.7
7Q10 Tmean Tmax Tmax of all reaches Tmean Tmax Tmax of all reaches Tmean Tmax Tmax of all reaches
current condition 21.8 24.4 29.0 16.1 19.0 22.3 17.6 22.1 25.5
mature riparian vegetation 21.5 24.1 28.6 15.3 17.6 20.1 15.2 18.3 21.1
plus microclimate improvement 21.0 23.5 27.1 15.2 17.4 19.6 14.6 17.4 21.1
plus reduced channel widths 20.8 23.1 26.4 15.0 17.0 19.6 14.6 17.1 20.4
plus convert surface withdrawals to instream flow 20.7 23.0 25.6 15.0 17.2 19.0 14.6 17.1 20.4
plus tributary inputs at WQS 20.5 22.7 25.3
Climate Change Scenario
7Q2 Tmean Tmax Tmax of all reaches Tmean Tmax Tmax of all reaches Tmean Tmax Tmax of all reaches
current condition 19.1 21.4 25.0 15.8 18.3 21.8 16.5 19.9 22.7
climate change 20.8 23.2 28.5 16.6 19.4 23.3 17.9 21.8 25.1
mature riparian vegetation 20.5 22.8 28.1 15.8 18.1 21.1 15.8 18.5 21.3
plus microclimate improvement 20.0 22.4 26.9 15.5 17.6 20.1 14.8 17.1 20.5
plus reduced channel widths 19.7 21.8 26.1 15.3 17.3 20.1 14.8 17.0 20.4
plus convert surface withdrawals to instream flow 19.6 21.7 25.4 15.8 17.5 19..8 14.8 16.9 20.3
plus tributary inputs at WQS 19.6 21.7 25.3
7Q10 Tmean Tmax Tmax of all reaches Tmean Tmax Tmax of all reaches Tmean Tmax Tmax of all reaches
current condition 21.8 24.4 29.0 16.1 19.0 22.3 17.6 22.1 25.5
climate change 23.4 26.3 32.0 17.5 20.7 28.3 19.3 24.2 28.5
mature riparian vegetation 23.1 26.0 31.5 16.4 19.1 25.0 16.8 20.2 23.7
plus microclimate improvement 22.4 25.3 29.7 16.1 18.6 24.0 15.5 18.6 23.3
plus reduced channel widths 22.1 24.7 28.9 16.0 18.4 24.0 15.4 18.2 22.1
plus convert surface withdrawals to instream flow 22.0 24.5 27.8 16.7 18.6 20.8 15.4 18.2 22.0
plus tributary inputs at WQS 21.9 22.4 27.7 Note: The maximum temperatures of all reaches usually occur in the lower reaches (close to the mouth) for the Wenatchee River and Nason Creek. For Icicle Creek, the maximum simulated temperatures occur in the old channel.

Page 68
This page is purposely left blank for duplex printing.
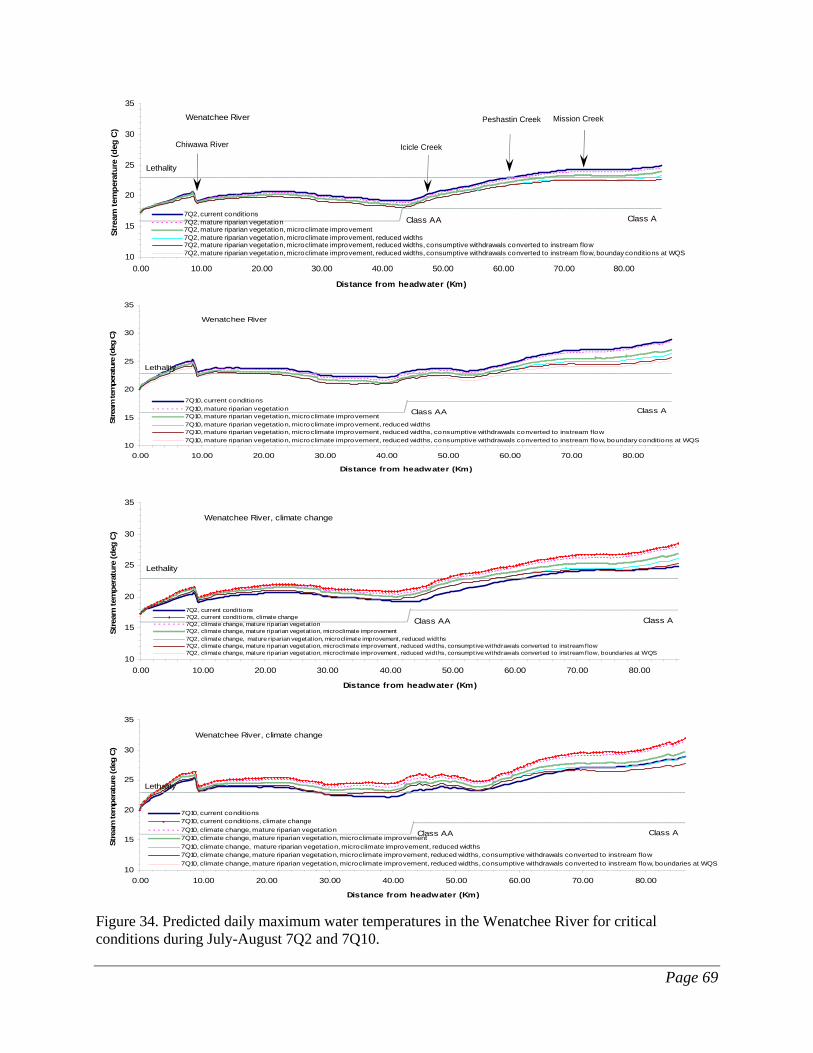
Page 69
Lethality
Class AA Class A
10
15
20
25
30
35
0.00 10.00 20.00 30.00 40.00 50.00 60.00 70.00 80.00
Distance from headwater (Km)
Stre
am te
mpe
ratu
re (d
eg C
)
7Q10, current conditions7Q10, mature riparian vegetation7Q10, mature riparian vegetation, microclimate improvement7Q10, mature riparian vegetation, microclimate improvement, reduced w idths 7Q10, mature riparian vegetation, microclimate improvement, reduced w idths, consumptive w ithdraw als converted to instream flow
Wenatchee River
Lethality
Class AA Class A
10
15
20
25
30
35
0.00 10.00 20.00 30.00 40.00 50.00 60.00 70.00 80.00
Distance from headwater (Km)
Stre
am te
mpe
ratu
re (d
eg C
)
7Q10, current conditions7Q10, mature riparian vegetation7Q10, mature riparian vegetation, microclimate improvement7Q10, mature riparian vegetation, microclimate improvement, reduced widths 7Q10, mature riparian vegetation, microclimate improvement, reduced widths, consumptive withdrawals converted to instream flow7Q10, mature riparian vegetation, microclimate improvement, reduced widths, consumptive withdrawals converted to instream flow, boundary conditions at WQS
Wenatchee River
Lethality
Class AA Class A
10
15
20
25
30
35
0.00 10.00 20.00 30.00 40.00 50.00 60.00 70.00 80.00
Distance from headwater (Km)
Stre
am te
mpe
ratu
re (d
eg C
)
7Q2, current condit ions7Q2, current condit ions, climate change7Q2, climate change, mature riparian vegetation7Q2, climate change, mature riparian vegetation, microclimate improvement7Q2, climate change, mature riparian vegetation, microclimate improvement, reduced widths7Q2, climate change, mature riparian vegetation, microclimate improvement, reduced widths, consumptive withdrawals converted to instream f low7Q2, climate change, mature riparian vegetation, microclimate improvement, reduced widths, consumptive withdrawals converted to instream f low, boundaries at WQS
Wenatchee River, climate change
Lethality
Class AA Class A
10
15
20
25
30
35
0.00 10.00 20.00 30.00 40.00 50.00 60.00 70.00 80.00
Distance from headwater (Km)
Stre
am te
mpe
ratu
re (d
eg C
)
7Q10, current conditions7Q10, current conditions, climate change7Q10, climate change, mature riparian vegetation7Q10, climate change, mature riparian vegetation, microclimate improvement7Q10, climate change, mature riparian vegetation, microclimate improvement, reduced widths 7Q10, climate change, mature riparian vegetation, microclimate improvement, reduced widths, consumptive withdrawals converted to instream flow7Q10, climate change, mature riparian vegetation, microclimate improvement, reduced widths, consumptive withdrawals converted to instream flow, boundaries at WQS
Wenatchee River, climate change
Figure 34. Predicted daily maximum water temperatures in the Wenatchee River for critical conditions during July-August 7Q2 and 7Q10.
Lethality
Class AA Class A
10
15
20
25
30
35
0.00 10.00 20.00 30.00 40.00 50.00 60.00 70.00 80.00
Distance from headwater (Km)
Stre
am te
mpe
ratu
re (d
eg C
)
7Q2, current conditions7Q2, mature riparian vegetation7Q2, mature riparian vegetation, microclimate improvement7Q2, mature riparian vegetation, microclimate improvement, reduced widths7Q2, mature riparian vegetation, microclimate improvement, reduced widths, consumptive withdrawals converted to instream flow7Q2, mature riparian vegetation, microclimate improvement, reduced widths, consumptive withdrawals converted to instream flow, bounday conditions at WQS
Wenatchee River
Chiwawa River Icicle Creek
Peshastin Creek Mission Creek
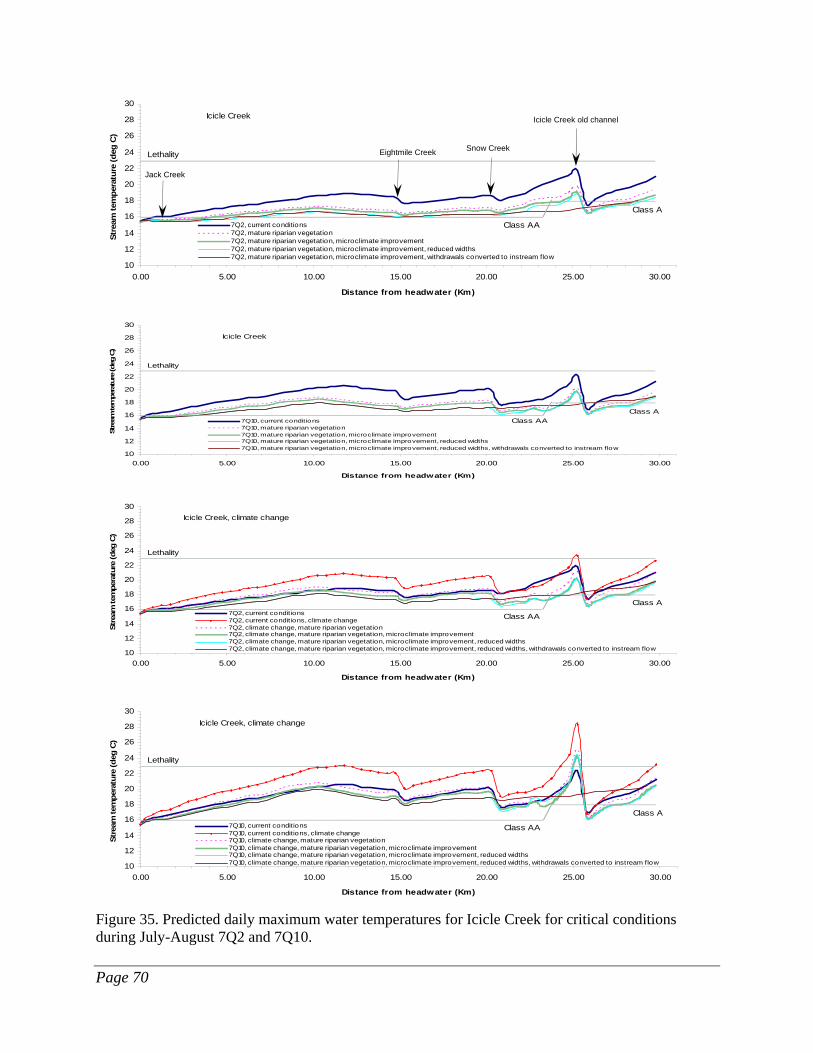
Page 70
Lethality
Class AA
Class A
10
12
14
16
18
20
22
24
26
28
30
0.00 5.00 10.00 15.00 20.00 25.00 30.00
Distance from headwater (Km)
Stre
am te
mpe
ratu
re (d
eg C
)
7Q2, current conditions7Q2, mature riparian vegetation7Q2, mature riparian vegetation, microclimate improvement7Q2, mature riparian vegetation, microclimate improvement, reduced widths7Q2, mature riparian vegetation, microclimate improvement, withdrawals converted to instream flow
Icicle Creek
Lethality
Class AAClass A
10
12
14
16
18
20
22
24
26
28
30
0.00 5.00 10.00 15.00 20.00 25.00 30.00
Distance from headwater (Km)
Stre
am te
mpe
ratu
re (d
eg C
)
7Q10, current conditions7Q10, mature riparian vegetation7Q10, mature riparian vegetation, microclimate improvement7Q10, mature riparian vegetation, microclimate improvement, reduced widths7Q10, mature riparian vegetation, microclimate improvement, reduced widths, withdrawals converted to instream flow
Icicle Creek
Lethality
Class AA
Class A
10
12
14
16
18
20
22
24
26
28
30
0.00 5.00 10.00 15.00 20.00 25.00 30.00
Distance from headwater (Km)
Stre
am te
mpe
ratu
re (d
eg C
)
7Q2, current conditions7Q2, current conditions, climate change7Q2, climate change, mature riparian vegetation7Q2, climate change, mature riparian vegetation, microclimate improvement7Q2, climate change, mature riparian vegetation, microclimate improvement, reduced widths7Q2, climate change, mature riparian vegetation, microclimate improvement, reduced widths, withdrawals converted to instream flow
Icicle Creek, climate change
Lethality
Class AA
Class A
10
12
14
16
18
20
22
24
26
28
30
0.00 5.00 10.00 15.00 20.00 25.00 30.00
Distance from headwater (Km)
Stre
am te
mpe
ratu
re (d
eg C
)
7Q10, current conditions7Q10, current conditions, climate change7Q10, climate change, mature riparian vegetation7Q10, climate change, mature riparian vegetation, microclimate improvement7Q10, climate change, mature riparian vegetation, microclimate improvement, reduced widths7Q10, climate change, mature riparian vegetation, microclimate improvement, reduced widths, withdrawals converted to instream flow
Icicle Creek, climate change
Figure 35. Predicted daily maximum water temperatures for Icicle Creek for critical conditions during July-August 7Q2 and 7Q10.
Jack Creek
Eightmile Creek Snow Creek
Icicle Creek old channel

Page 71
Lethality
Class AA
10
12
14
16
18
20
22
24
26
28
30
0.00 5.00 10.00 15.00 20.00 25.00 30.00 35.00 40.00
Distance from headwater (Km)
Stre
am te
mpe
ratu
re (d
eg C
)7Q2, current conditions7Q2, mature riparian vegetation7Q2, mature riparian vegetation, microclimate improvement7Q2, mature riparian vegetation. microclimate improvement, reduced widths7Q2, mature riparian vegetation. microclimate improvement, reduced widths, withdrawals converted to instream flowCl AA
Nason Creek
Lethality
Class AA
10
12
14
16
18
20
22
24
26
28
30
0.00 5.00 10.00 15.00 20.00 25.00 30.00 35.00 40.00
Distance from headwater (Km)
Stre
am te
mpe
ratu
re (d
eg C
)
7Q10, current conditions7Q10, mature riparian vegetation7Q10, mature riparian vegetation, microclimate improvement7Q10, mature riparian vegetation, microclimate improvement, reduced widths7Q10, mature riparian vegetation, microclimate improvement, reduced widths, withdrawals converted to instream flowCl AA
Nason Creek
Lethality
Class AA
10
12
14
16
18
20
22
24
26
28
30
0.00 5.00 10.00 15.00 20.00 25.00 30.00 35.00 40.00
Distance from headwater (Km)
Stre
am te
mpe
ratu
re (d
eg C
)
7Q2, current conditions7Q2, current conditions, climate change7Q2, climate change, mature riparian vegetation7Q2, climate change, mature riparian vegetation, microclimate improvement7Q2, climate change, mature riparian vegetation, microclimate improvement, reduced widths7Q2, climate change, mature riparian vegetation, microclimate improvement, reduced widths, withdrawals converted to instream flow
Nason Creek, climate change
Lethality
Class AA
10
12
14
16
18
20
22
24
26
28
30
0.00 5.00 10.00 15.00 20.00 25.00 30.00 35.00 40.00
Distance from headwater (Km)
Stre
am te
mpe
ratu
re (d
eg C
)
7Q10, current condit ions7Q10, current condit ion, climate change7Q10, climate change, mature riparian vegetation7Q10, climate change, mature riparian vegetation, microclimate improvement7Q10, climate change, mature riparian vegetation, microclimate improvement, reduced widths7Q10, climate change, mature riparian vegetation, microclimate improvement, reduced widths, withdrwals converted to instream f low
Nason Creek, climate change
Figure 36. Predicted daily maximum water temperatures for Nason Creek for critical conditions during July-August 7Q2 and 7Q10.
Whitepine Creek
Roaring and Coulter Creeks
Mill Creek
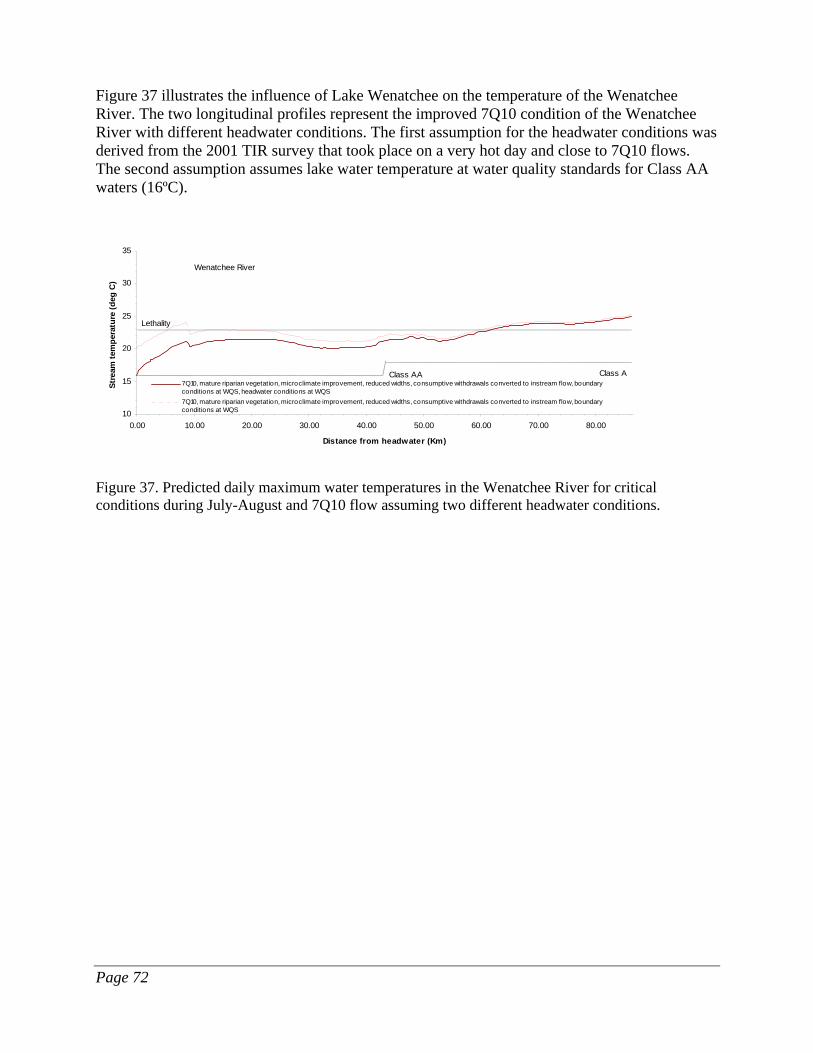
Page 72
Figure 37 illustrates the influence of Lake Wenatchee on the temperature of the Wenatchee River. The two longitudinal profiles represent the improved 7Q10 condition of the Wenatchee River with different headwater conditions. The first assumption for the headwater conditions was derived from the 2001 TIR survey that took place on a very hot day and close to 7Q10 flows. The second assumption assumes lake water temperature at water quality standards for Class AA waters (16ºC).
Lethality
Class AA Class A
10
15
20
25
30
35
0.00 10.00 20.00 30.00 40.00 50.00 60.00 70.00 80.00
Distance from headwater (Km)
Stre
am te
mpe
ratu
re (d
eg C
)
7Q10, mature riparian vegetation, microclimate improvement, reduced widths, consumptive withdrawals converted to instream flow, boundaryconditions at WQS, headwater conditions at WQS7Q10, mature riparian vegetation, microclimate improvement, reduced widths, consumptive withdrawals converted to instream flow, boundaryconditions at WQS
Wenatchee River
Figure 37. Predicted daily maximum water temperatures in the Wenatchee River for critical conditions during July-August and 7Q10 flow assuming two different headwater conditions.
Page 73
The QUAL2Kw model simulations indicated that:
1. A buffer of mature riparian vegetation along the banks of the rivers is expected to decrease the average daily maximum temperatures. At 7Q10 flow conditions, the lowest reduction of only 0.3ºC is expected for the Wenatchee River. Significant reductions of 3.8ºC and 1.4ºC are expected for Nason Creek and Icicle Creek, respectively. On average, a 1.8ºC reduction in the average daily maximum temperatures is expected for the studied streams.
2. The changes in microclimate conditions associated with mature riparian vegetation could further lower the daily average maximum water temperature by about 0.6ºC.
3. Lake Wenatchee is the source of the Wenatchee River; therefore, the headwater boundary conditions were imposed by the thermal behavior of Lake Wenatchee, which is currently classified as oligotrophic with no major water quality problems.
4. A 10% reduction in channel width could decrease the daily average maximum water temperature by about 0.4ºC.
5. The conversion of withdrawals into instream flow had little effect on the reach-average stream maximum temperature of the Wenatchee River, diminishing it by 0.1ºC. The withdrawal locations are in the lower half of the river; therefore, the influence of increased streamflows only had a noticeable effect on the stream water temperature in the lower reaches. The increased streamflows led to a decrease in the maximum (across all reaches) simulated water temperature by 0.8ºC. The scenario assuming the boundary conditions at water quality standards shows an average reduction of about 0.3ºC at 7Q10 flow conditions.
6. For Icicle Creek, the conversion of withdrawals into instream flow scenarios indicates an increase in the average daily maximum temperatures by about 0.2ºC at 7Q10 flow conditions. The lower Icicle Creek flow regimes are impacted mostly by the water withdrawals necessary for irrigation and the fish hatchery. Currently, water returns from these water uses usually have a lower temperature than the mainstem and can slightly cool down the lower reaches of Icicle Creek.
7. Water withdrawals for Nason Creek are not significant, and their conversion to instream flow did not impact the reach-average stream temperature.
8. The overall decrease in the average maximum simulated temperature from the current conditions at 7Q10 was 2.7ºC. The improvements considered in the simulation scenarios can lower the maximum simulated water temperature by as much as 3.4 to 5.1ºC, with major changes in stream water temperature occurring mostly in the lower reaches of the rivers.
9. Model simulations performed under the 7-day average with 10-year return period flow conditions and climate change influences show that the average maximum temperature across all reaches can increase by as much as 2.0ºC compared to the current conditions.

Page 74
Load allocations The natural conditions provision of the water quality standard is the basis of the load allocations in this TMDL (WAC 173-201A-070(2)): “Whenever the natural conditions of said waters are of a lower quality than the criteria assigned, the natural conditions shall constitute the water quality criteria.” The natural condition of temperature was approximated by the system potential temperature, which was an evaluation of the combined effect of hypothetical conditions with mature riparian vegetation, microclimate improvements. The load allocations are expected to result in water temperatures that are equivalent to the temperatures that would occur under natural conditions. Therefore, the load allocations are expected to result in water temperatures that meet the water quality standard. The load allocation for effective shade for all perennial streams in the Wenatchee River watershed is the maximum potential shade that would occur from mature riparian vegetation. Establishment of mature riparian vegetation is expected to also have a secondary benefit of reducing channel widths and improving microclimate conditions to address those influences on the loading capacity. An adaptive management strategy is recommended to address other influences on stream temperature such as sediment loading, groundwater inflows, and hyporheic exchange. Load allocations for effective shade are quantified in Appendix B for the Wenatchee River, Icicle Creek, and Nason Creek. For other perennial streams in the watershed, the load allocations for effective shade are represented in Figure 38 and Appendix C, based on the estimated relationship between shade, channel width, and stream aspect at the assumed maximum riparian vegetation condition: 77% density and 28 m tree height. Figure 38 shows that the importance of shade decreases as the width of the channel increases.

Page 75
0%
20%
40%
60%
80%
100%
120%
0.0 20.0 40.0 60.0 80.0 100.0 120.0 140.0 160.0 180.0 200.0
Bankfull width (m)
Effe
ctiv
e sh
ade
from
veg
etat
ion
(%)
aspect = 0 and 180 deg
aspect = 45, 135, 225, and 315 deg
aspect = 90 and 270 deg
Figure 38. Load allocations for effective shade for various bankfull width and aspect of streams in the Wenatchee River basin assuming a riparian vegetation height of 28 m and a canopy density of 77%.
Wasteload allocations The provisions in the water quality standard for natural conditions (WAC 173-201A-070(2)) and the allowable increase in temperature over natural conditions (WAC 173-201A-030(1)(c)(iv) for Class AA and WAC 173-201A-030(2)(c)(iv) for Class A) are the basis of the wasteload allocations in this TMDL: “Whenever the natural conditions of said waters are of a lower quality than the criteria assigned, the natural conditions shall constitute the water quality criteria.” “…When natural conditions exceed 16ºC (in Class AA waters)…, no temperature increases will be allowed which will raise the receiving water temperature by greater than 0.3ºC.” “…When natural conditions exceed 18ºC (in Class A waters)…, no temperature increases will be allowed which will raise the receiving water temperature by greater than 0.3ºC.” The load allocations for the nonpoint sources are considered to be sufficient to attain the water quality standards by resulting in water temperatures that are equivalent to natural conditions. Therefore, the water quality standards allow an increase over natural conditions for the point sources for establishment of the wasteload allocations. Wasteload allocations for the National Pollution Discharge Elimination System (NPDES) discharges were evaluated for the Wenatchee River basin. Maximum temperatures for NPDES

Page 76
effluent discharges (TNPDES) were calculated from the following mass balance equation for system potential upstream temperatures greater than or equal to 16ºC (all point sources in this TMDL study discharge to waters that are designated as Class AA) or 18ºC (all point sources discharge to waters that are designated as Class A). Class AA: TNPDES = [16ºC] + [chronic dilution factor] * 0.3ºC Class A: TNPDES = [18ºC] + [chronic dilution factor] * 0.3ºC Maximum effluent temperatures should also be no greater than 33ºC to avoid creating areas in the mixing zone that would cause instantaneous lethality. Table 14 presents the maximum effluent temperatures that would cause an increase of 0.3ºC for various upstream receiving water temperatures for the reported dilution factors. The system potential temperatures upstream from the NPDES dischargers may be greater than 16ºC for Class AA waters or 18ºC for Class A waters and vary depending on the river flow and weather conditions. In Table 15 the maximum effluent temperatures were re-evaluated using the revised standard. Table 14. Wasteload allocation (WLA) for effluent temperatures for selected NPDES dischargers in the Wenatchee River basin for the current standard.
NPDES Facility Chronic dilution factor
Water quality standard for temperature
(deg C)
Allowable increase in
temperature at the mixing zone
boundary (deg C)
TNPDES = Maximum
allowable effluent temperature WLA
(deg C) Lake Wenatchee 214 16 0.3 33.0 Stevens Pass 1 16 0.3 16.3 Cashmere 100 18 0.3 33.0 Leavenworth 37.1 18 0.3 29.1 Peshastin 331.7 18 0.3 33.0 National Fish Hatchery 1 18 0.3 18.3
Table 15. Wasteload allocation (WLA) for effluent temperatures for selected NPDES dischargers in the Wenatchee River basin for the revised standard.
NPDES Facility Chronic dilution factor
Water quality standard for temperature
(deg C)
Allowable increase in
temperature at the mixing zone
boundary (deg C)
TNPDES = Maximum
allowable effluent temperature WLA
(deg C) Lake Wenatchee 214 16 0.3 33.0 Stevens Pass 1 16 0.3 16.3 Cashmere 100 17.5 0.3 33.0 Leavenworth 37.1 17.5 0.3 28.6 Peshastin 331.7 17.5 0.3 33.0 National Fish Hatchery 1 17.5 0.3 17.8

Page 77
Margin of safety The margin of safety accounts for uncertainty about pollutant loading and waterbody response. In this TMDL, the margin of safety is addressed by using critical conditions in the modeling analysis. The margin of safety in this TMDL is implicit because of the following:
• The 90th percentile of the highest 7-day averages of daily mean air temperatures for the NOAA-COOP Leavenworth meteorological station was used as a worst-case condition for model simulations. Typical meteorological conditions were represented by the median condition at the same station.
• The lowest 7-day average flows during July-August with 10-year recurrence intervals (7Q10) were used for the worst-case scenario. Typical flow conditions were represented by the lowest 7-day average flows during July-August with recurrence intervals of 2 years (7Q2).
• Model uncertainty for prediction of water temperature was assessed by estimating the root mean square error (RMSE) of model predictions compared with observed temperatures. The average RMSE for model calibration and confirmation of maximum was 0.47ºC.
• The load allocations are set to the effective shade provided by full mature riparian shade which are the maximum values achievable in the Wenatchee River basin.

Page 78
This page is purposely left blank for duplex printing.

Page 79
Conclusions and Recommendations
1. The observed stream temperatures in the Wenatchee River watershed during 2002 and 2003
showed that current conditions at many locations are warmer than the current and proposed revised water quality criteria. In addition, many sites were found to be cooler than the temperature criteria. In general, warmer temperatures were found at downstream locations in the Wenatchee River, Icicle Creek, and Nason Creek, and cooler temperatures were found in headwater locations or relatively small tributaries. Stream temperature is increased in the historic channel of Icicle Creek due to the low streamflow and modified hydraulic conditions.
2. Thermal infrared radiation (TIR) surveys and instream temperature data indicate that
Wenatchee River, Icicle Creek, and Nason Creek experience a downstream heating pattern (Figure 20). This tendency is more noticeable in the lower reaches of the Wenatchee River where riparian vegetation and precipitation are scarce. The river is more exposed to direct solar radiation over a larger air-water interface as the river widens towards its confluence with the Columbia River.
3. In addition to load allocations for effective shade in the study area, the following
management activities are recommended for implementation to attain temperatures that comply with the water quality standards provision for natural conditions:
• For U.S. Forest Service land, the riparian reserves in the Northwest Forest Plan are recommended for establishment of mature riparian vegetation.
• For privately owned forest land, the riparian vegetation prescriptions in the Forest and Fish Report are recommended for all perennial streams. Load allocations are included in this TMDL for forest lands in accordance with the section of the Forest and Fish Report entitled, TMDLs produced prior to 2009 in mixed use watersheds.
• For areas that are not managed in accordance with either the Northwest Forest Plan or the Forest and Fish Report, such as private non-forest areas, voluntary programs to increase riparian vegetation should be developed (e.g., riparian buffers or conservation easements sponsored under the U.S. Department of Agriculture Natural Resources Conservation Service’s Conservation Reserve Enhancement Program).
• Instream flows and water withdrawals are managed through regulatory avenues separate from TMDLs. However, stream temperature is related to the amount of instream flow, and increases in flow generally result in decreases in maximum temperatures. Future projects that have the potential to increase groundwater inflows to streams in the watershed should be encouraged. Retirement or purchase of existing water rights for conservation to instream flow also should be encouraged.
• Management activities should control potential channel widening processes. Reductions in channel width are expected as mature riparian vegetation is established. Management activities that would reduce the loading of sediment to the surface waters from upland and channel erosion also are recommended.
Page 80
• Hyporheic exchange flows and groundwater discharges are important to maintain the current temperature regime and reduce maximum daily instream temperatures. Factors that influence hyporheic exchange flow include the vertical hydraulic gradient between surface and subsurface waters as well as the hydraulic conductivity of streambed sediments. Activities that reduce the hydraulic conductivity of streambed sediments could increase stream temperatures. Management activities should reduce upland and channel erosion and avoid sedimentation of fine materials in the stream substrate.
4. To determine the effects of management strategies within the Wenatchee River basin, regular
monitoring is recommended. Continuously-recording water temperature monitors should be deployed from July through August to capture the critical conditions. It is suggested that a minimal sampling program include sampling near the mouths of the following waterbodies: Wenatchee River, Icicle Creek, Nason Creek, Peshastin Creek, and Mission Creek.
5. Shade management practices involve the development of mature riparian vegetation, which
requires many years to become established. Figure 27 can be used to prioritize reaches that need riparian restoration efforts. Data on spawning area locations can be compared to the shade deficit map to further prioritize reaches that need riparian restoration. Also, TIR images can be useful for describing spatial distribution patterns of water temperature in the surveyed streams. The TIR and visible band images are effective tools to map coldwater refugia for fish and to detect regions that can be improved for fish survival.
6. Interim monitoring of water temperatures during the summer is recommended, perhaps at
five-year intervals. Interim monitoring of the composition and extent of riparian vegetation also is recommended (e.g., by using photogrammetry or remote sensing methods, hemispherical photography, angular canopy densiometers, or solar pathfinder instruments).

Page 81
Adaptive Management Process The Wenatchee River Basin TMDL study is the result of a partnership between the Department of Ecology and the Water Resource Inventory Area (WRIA) 45 Water Quality Technical Subcommittee (WQTS). The WQTS consists of Ecology TMDL staff and the WRIA 45 Watershed Planning Unit’s Water Quality Subcommittee. Ecology authored this TMDL technical report for temperature, and the WQTS reviewed, discussed, and commented on the report. The data collection and literature review conducted for and presented in this technical report for the Wenatchee River basin represent the current state of knowledge for temperature in the watershed. It is the understanding of the WQTS that additional studies will be performed to fill data gaps and address unanswered questions, as determined by the WQTS. Conclusions and recommendations currently presented in this technical report may be revised based on new data as they become available. It is also the understanding of the WQTS that any new data gathered from further study can be incorporated in the TMDL process in the Summary Implementation Strategy (SIS) or Detailed Implementation Plan (DIP) wherein recommendations and management strategies may be refined. This adaptive management approach is acceptable to both Ecology staff and the WQTS. Ecology will partner with stakeholders (interested parties) in the watershed to conduct studies addressing information gaps (e.g., monitoring). Further monitoring for purposes of TMDL assessment will be addressed in the TMDL SIS and DIP. Any new science available as a result of these studies will be integrated into the SIS and DIP as new conclusions and management recommendations. Management strategies addressing both point (discrete) and nonpoint (diffuse) pollution sources are subject to this adaptive management approach.

Page 82
This page is purposely left blank for duplex printing.
Page 83
References Cited Adams, T.N. and K Sullivan, 1989. The physics of forest stream heating: a simple model. Timber, Fish, and Wildlife, Report No TFW-WQ3-90-007. Washington State Department of Natural Resources, Olympia, WA.
Andonaegui, C., 2001. Salmon, steelhead, and bull trout habitat limiting factors for the Wenatchee Subbasin (Water Resource Inventory Area 45) and portions of WRIA 40 within Chelan County (squilchuck, stemilt and colockum drainages). Final report, November 2001. Washington State Conservation Commission, Olympia, WA.
Bartholow, J.M., 2000. Estimating cumulative effects of clearcutting on stream temperatures, Rivers, 7(4), 284-297.
Belt, G.H., J. O'Laughlin, and W.T. Merrill, 1992. Design of Forest Riparian Buffer Strips for the Protection of Water Quality: Analysis of Scientific Literature. Report No. 8. Idaho Forest, Wildlife, and Range Policy Analysis Group, University of Idaho, Moscow, ID.
Beschta, R.L., R.E. Bilby, G.W. Brown, L.B. Holtby, and T.D. Hofstra, 1987. Stream temperature and aquatic habitat: fisheries and forestry interactions. In: Streamside management: forestry and fisher interactions, E.O. Salo and T.W. Cundy, editors, pp 192-232. Proceedings of a conference sponsored by the College of Forest Resources, University of Washington, Seattle WA, Contribution No. 57 – 1987.
Bilhimer, D., J. Carroll, S. O'Neal, G. Pelletier, 2002. Quality Assurance Project Plan: Wenatchee River Temperature, Dissolved Oxygen, and pH Total Maximum Daily Load, Year 1 Technical Study. Publication Number 02-03-069. Washington State Department of Ecology. Olympia, WA. http://www.ecy.wa.gov/biblio/0203069.html
Bolton, S. and C. Monohan, 2001. A review of the literature and assessment of research needs in agricultural streams in the Pacific Northwest as it pertains to freshwater habitat for salmonids. Prepared for: Snohomish County, King County, Skagit County, and Whatcom County. Prepared by: Center for Streamside Studies, University of Washington. Seattle, WA.
Boyd, M.S., 1996. Heat source: stream, river, and open channel temperature prediction. Oregon State University. M.S. Thesis. October 1996.
Boyd, M. and C. Park, 1998. Sucker-Grayback Total Daily Maximum Load. Oregon Department of Environmental Quality and U.S. Forest Service.
Brady, D.K., W.L. Graves, and J.C. Geyer, 1969. Surface heat exchange at power plant cooling lakes. Cooling water discharge project report No. 5, Edison Electric Institute Publication Number 69-901, New York.
Brazier, J.R. and G.W. Brown, 1973. Buffer strips for stream temperature control. Res. Pap. 15. Forest Research Laboratory, Oregon State University. 9 pp.
Page 84
Broderson, J.M., 1973. Sizing buffer strips to maintain water quality. M.S. Thesis, University of Washington, Seattle, WA.
Brosofske, K.D., J. Chen, R.J. Naiman, and J.F. Franklin, 1997. Harvesting effects on microclimate gradients from small streams to uplands in western Washington. Ecol. Appl. 7(4):1188-1200.
Brown, G.W., 1972. An improved temperature prediction model for small streams. Water Resources Research. 6(4):1133-1139.
Brown, G.W. and J.T. Krygier, 1970. Effects of clear-cutting on stream temperature. Water Resources Research. 6(4):1133-1139.
Brown, G.W., G.W. Swank, and J. Rothacher, 1971. Water temperature in the Steamboat drainage. USDA Forest Service Research Paper PNW-119, Portland, OR. 17 pp.
Castelle, A.J. and A.W. Johnson, 2000. Riparian vegetation effectiveness. Technical Bulletin No. 799. National Council for Air and Stream Improvement, Research Triangle Park, NC. February 2000.
CH2MHill, 2000. Review of the scientific foundations of the forests and fish plan. Prepared for the Washington Forest Protection Association. http://www.wfpa.org/
Chapra, S.C., 1997. Surface Water Quality Modeling. McGraw-Hill Companies, Inc.
Chapra, S.C. and G.J. Pelletier, 2003. QUAL2K: A Modeling Framework for Simulating River and Stream Water Quality: Documentation and Users Manual. Civil and Environmental Engineering Dept., Tufts University, Medford, MA., [email protected]
Chen, J., 1991. Edge effects: microclimate pattern and biological responses in old-growth Douglas-fir forests. Ph.D. dissertation. College of Forest Resources, University of Washington, Seattle, WA.
Chen, J., J.F. Franklin, and T.A. Spies, 1993. Contrasting microclimates among clearcut, edge, and interior of old-growth Douglas-fir forest. Agricultural and Forest Meteorology, 63, 219-237.
Chen, Y.D., 1996. Hydrologic and water quality modeling for aquatic ecosystem protection and restoration in forest watersheds: a case study of stream temperature in the Upper Grande Ronde River, Oregon. PhD dissertation. University of Georgia. Athens, GA.
Chen, Y.D., R.F. Carsel, S.C. McCutcheon, and W.L. Nutter, 1998a. Stream temperature simulation of forested riparian areas: I. watershed-scale model development. Journal of Environmental Engineering. April 1998. pp 304-315.
Chen, Y.D., R.F. Carsel, S.C. McCutcheon, and W.L. Nutter, 1998b. Stream temperature simulation of forested riparian areas: II. model application. Journal of Environmental Engineering. April 1998. pp 316-328.
Childs, S.W. and L.E. Flint, 1987. Effect of shadecards, shelterwoods, and clearcuts on temperature and moisture environments. Forest Ecology and Management, 18, 205-217.

Page 85
Corbett, E.S. and J.A. Lynch, 1985. Management of streamside zones on municipal watersheds. P. 187-190 In: R.R. Johnson, C.D. Ziebell, D.R. Patton, P.F. Folliott, and R.H. Hamre (eds.). Riparian ecosystems and their management: reconciling conflicting uses. First North American Riparian Conference, April 16-18, 1985. Tucson, AZ.
Cristea, N.C., 2004. Wenatchee River, WA, stream temperature modeling and assessment using remotely sensed thermal infrared and instream recorded data, University of Washington Master’s Thesis.
Ecology, 2003a. Shade.xls - a tool for estimating shade from riparian vegetation. Washington State Department of Ecology, Olympia, WA. http://www.ecy.wa.gov/programs/eap/models/
Edgerton, P.J. and B.R. McConnell, 1976. Diurnal temperature regimes of logged and unlogged mixed conifer stands on elk summer range. Station Research Note PNW-277. Portland, OR. U.S. Department of Agriculture, Forest Service, Pacific Northwest Research Station. 6 pp.
Edinger, J.E., D.W. Duttweiler, and J.C. Geyer, 1968. The response of water temperatures to meteorological conditions. Water Resources Research, Vol. 4, No. 5.
Edinger, J.E., D.K. Brady, and J.C. Geyer, 1974. Heat exchange and transport in the environment. EPRI publication no. 74-049-00-3, Electric Power Research Institute, Palo Alto, CA.
EPA, 1998. Report of the Federal Advisory Committee on the Total Maximum Daily Load (TMDL) Program. The National Advisory Council For Environmental Policy and Technology (NACEPT). U.S. Environmental Protection Agency, Office of The Administrator. EPA 100-R-98-006.
FEMAT, 1993. Northwest Forest Plan Documents, Forest Ecosystem Management: An Ecological, Economic, and Social Assessment. Report of the Forest Ecosystem Management Assessment Team. U.S. Department of Agriculture, U.S. Department of Commerce, U.S. Department of Interior, U.S. Environmental Protection Agency. U.S. Government Printing Agency, report number 1993-793-071. (pnwin.nbii.gov/nwfp/FEMAT/)
Fowler, W.B. and T.D. Anderson, 1987. Illustrating harvest effects on site microclimate in a high-elevation forest stand. Research Note PNW-RN-466. Portland, OR. U.S. Department of Agriculture, Forest Service, Pacific Northwest Research Station. 10 pp.
Fowler, W.B., J.D. Helvey, and E.N. Felix, 1987. Hydrologic and climatic changes in three small watersheds after timber harvest. Res. Pap. PNW-RP-379. Portland, OR: U.S. Department of Agriculture, Forest Service, Pacific Northwest Research Station. 13 pp.
GEI, 2002. Efficacy and economics of riparian buffers on agricultural lands, State of Washington. Prepared for the Washington Hop Growers Association. Prepared by GEI Consultants, Englewood, CO.
Hamlet, A.F., 2004. Climate Change in the Columbia River Basin, JISAO Climate Impacts Group, University of Washington. http://www.ce.washington.edu/~hamleaf/Hyd_and_Wat_Res_Climate_Change.html
Page 86
Hicks, M., 2002. Evaluating Standards for Protecting Aquatic Life in Washington's Surface Water Quality Standards - Temperature Criteria - Draft Discussion Paper and Literature Summary. Washington State Department of Ecology, Olympia, WA. Publication Number 00-10-070. http://www.ecy.wa.gov/biblio/0010070.html
Holtby, L.B., 1988. Effects of logging on stream temperatures in Carnation Creek, B.C., and associated impacts on the coho salmon. Canadian Journal of Fisheries and Aquatic Sciences 45:502-515.
Ice, G., 2001. How direct solar radiation and shade influences temperatures in forest streams and relaxation of changes in stream temperature. In: Cooperative Monitoring, Evaluation, and Research (CMER) workshop: heat transfer processes in forested watershed and their effects on surface water temperature, Lacey, WA, February 2001.
Jones, P.D. and M.E. Mann, 2004. Climate over past millennia, Reviews of Geophysics, 42 RG2002, 42 pp.
Levno, A. and J. Rothacher, 1967. Increases in maximum stream temperatures after logging in old growth Douglas-fir watersheds. USDA Forest Service PNW-65, Portland, OR. 12 pp.
Lillybridge, T., B. Kovalchik, C. Williams, B. Smith, 1995. Field Guide for Forested Plant Associations of the Wenatchee National Forest. General Tech. Rpt. PNW-GTR-359.
Lynch, J.A., G.B. Rishel, and E.S. Corbett, 1984. Thermal alterations of streams draining clearcut watersheds: quantification and biological implications. Hydrobiologia 111:161-169.
Mote, P., A. Hamlet, N. Mantua, and Lara Whitley-Binder, 2001. Scientific Assessment of Climate Change: Global and Regional Scales. JISAO Climate Impacts Group, University of Washington.
ODEQ, 2001. Ttools 3.0 User Manual. Oregon Department of Environmental Quality, Portland OR. http://www.deq.state.or.us/wq/TMDLs/WQAnalTools.htm
OWEB, 1999. Water quality monitoring technical guidebook: chapter 14, stream shade and canopy cover monitoring methods. Oregon Watershed Enhancement Board.
Patric, J.H., 1980. Effects of wood products harvest on forest soil and water relations. Journal of Environmental Quality 9(1):73-79.
Pelletier, G. and S. Chapra, 2003. QUAL2Kw: Documentation and User Manual for a Modeling Framework to Simulate River and Stream Water Quality. Draft Publication. Washington State Department of Ecology, Olympia, WA.
Rishel, G.B., J.A. Lynch, and E.S. Corbett, 1982. Seasonal stream temperature changes following forest harvesting. Journal of Environmental Quality 11(1):112-116.
Rosgen, D., 1996. Applied River Morphology. Wildland Hydrology publishers. Pagosa Springs, CO.

Page 87
Spence, B.C, G.A. Lomnicky, R.M. Hughes, and R.P. Novitski, 1996. An ecosystem approach to salmonid conservation. TR-4501-96-6057. ManTech Corp, Corvallis, OR. Funded by National Marine Fisheries Service, U.S. Fish and Wildlife Service and the U.S. Environmental Protection Agency. Available from NMFS, Portland, OR.
Steinblums, I., H. Froehlich, and J. Lyons, 1984. Designing stable buffer strips for stream protection. Journal of Forestry 821(1): 49-52.
Swift, L.W. and J.B. Messer, 1971. Forest cuttings raise water temperatures of a small stream in the southern Appalachians. Journal of Soil and Water Conservation 26:11-15.
Teti, P., 2001. A new instrument for measuring shade provided by overhead vegetation. Cariboo Forest Region Research Section, British Columbia Ministry of Forests, Extension note No. 34, http://www.for.gov.bc.ca/cariboo/research/extnotes/extnot34.htm
Theurer, F.D., K.A. Voos, and W.J. Miller, 1984. Instream water temperature model, instream flow information paper 16. Western Energy and Land Use Team, Division of Biological Services, Research and Development, U.S. Fish and Wildlife Services. FWS/OBS-84/15.
Thomann, R.V. and J.A. Mueller, 1987. Principles of surface water quality modeling and control. Harper and Row, Publishers, Inc., New York, NY.
USDA Forest Service, 1999. Mainstem Wenatchee River Watershed Assessment. Leavenworth and Lake Wenatchee Ranger Districts, Wenatchee National Forest.
USGS, 1999. Washington Land Cover Data Set. http://edcwww.cr.usgs.gov/programs/lccp/nationallandcover.html
Wenger, S., 1999. A review of the scientific literature on riparian buffer width, extent, and vegetation. Office of Public Service and Outreach, Institute of Ecology, University of Georgia, Athens, GA. Whiley, A.J. and B. Cleland, 2003. Wenatchee National Forest water temperature Total Maximum Daily Load technical report. Washington State Department of Ecology. Publication Number 03-10-063. Olympia, WA. http://www.ecy.wa.gov/biblio/0310063.html

Page 88
This page is purposely left blank for duplex printing.

Page 89
Appendices

Page 90
This page is purposely left blank for duplex printing.

Page 91
Appendix A. Use designations for the revised WAC 173-201a for WRIA 45 (Wenatchee)

Page 92
This page is purposely left blank for duplex printing.
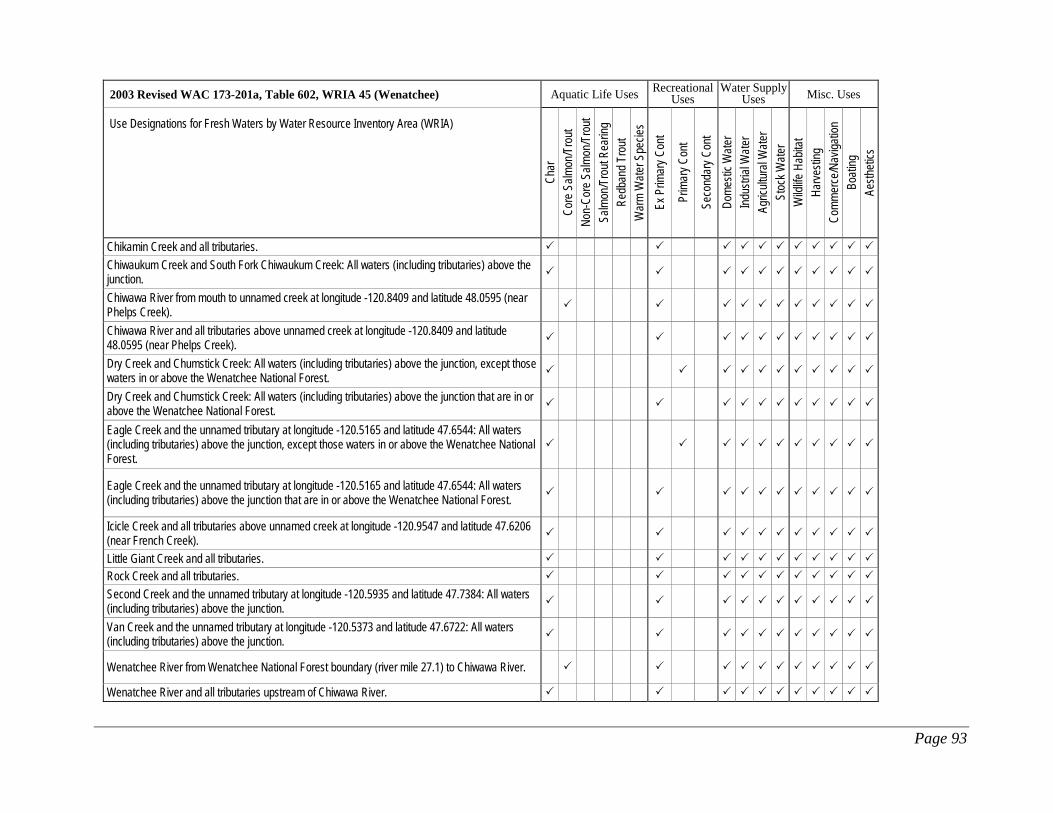
Page 93
2003 Revised WAC 173-201a, Table 602, WRIA 45 (Wenatchee) Aquatic Life Uses Recreational Uses
Water Supply Uses Misc. Uses
Use Designations for Fresh Waters by Water Resource Inventory Area (WRIA)
Char
Co
re S
almon
/Tro
ut No
n-Co
re S
almon
/Tro
ut Sa
lmon
/Tro
ut Re
aring
Re
dban
d Tro
ut W
arm
Wate
r Spe
cies
Ex P
rimar
y Con
t
Prim
ary C
ont
Seco
ndar
y Con
t Do
mesti
c Wate
r Ind
ustria
l Wate
r Ag
ricult
ural
Wate
r St
ock W
ater
Wild
life H
abita
t Ha
rvesti
ng
Comm
erce
/Nav
igatio
n Bo
ating
Ae
stheti
cs
Chikamin Creek and all tributaries.
Chiwaukum Creek and South Fork Chiwaukum Creek: All waters (including tributaries) above the junction.
Chiwawa River from mouth to unnamed creek at longitude -120.8409 and latitude 48.0595 (near Phelps Creek).
Chiwawa River and all tributaries above unnamed creek at longitude -120.8409 and latitude 48.0595 (near Phelps Creek).
Dry Creek and Chumstick Creek: All waters (including tributaries) above the junction, except those waters in or above the Wenatchee National Forest.
Dry Creek and Chumstick Creek: All waters (including tributaries) above the junction that are in or above the Wenatchee National Forest.
Eagle Creek and the unnamed tributary at longitude -120.5165 and latitude 47.6544: All waters (including tributaries) above the junction, except those waters in or above the Wenatchee National Forest.
Eagle Creek and the unnamed tributary at longitude -120.5165 and latitude 47.6544: All waters (including tributaries) above the junction that are in or above the Wenatchee National Forest.
Icicle Creek and all tributaries above unnamed creek at longitude -120.9547 and latitude 47.6206 (near French Creek).
Little Giant Creek and all tributaries.
Rock Creek and all tributaries.
Second Creek and the unnamed tributary at longitude -120.5935 and latitude 47.7384: All waters (including tributaries) above the junction.
Van Creek and the unnamed tributary at longitude -120.5373 and latitude 47.6722: All waters (including tributaries) above the junction.
Wenatchee River from Wenatchee National Forest boundary (river mile 27.1) to Chiwawa River.
Wenatchee River and all tributaries upstream of Chiwawa River.

Page 94
This page is purposely left blank for duplex printing.

Page 95
Appendix B. Load allocations for effective shade for the Wenatchee River, Icicle Creek, and Nason Creek

Page 96
This page is purposely left blank for duplex printing.

Page 97
Table B1. Load allocations for effective shade in the Wenatchee River for the condition of mature riparian vegetation.
Distance from mouth to upstream
segment boundary (Km)
Distance from mouth to
downstream segment boundary
(Km)
Load allocation for daily average
shortwave solar radiation on August 1
(W/m2)
Load allocation for
effective shade on August 1
(percent)
86.5 86 300 4%
86 85.5 276 11%
85.5 85 282 9%
85 84.5 276 11%
84.5 84 283 9%
84 83.5 278 11%
83.5 83 274 12%
83 82.5 280 10%
82.5 82 250 19%
82 81.5 264 15%
81.5 81 271 13%
81 80.5 280 10%
80.5 80 285 8%
80 79.5 289 7%
79.5 79 257 17%
79 78.5 280 10%
78.5 78 289 7%
78 77.5 266 14%
77.5 77 269 13%
77 76.5 260 16%
76.5 76 274 12%
76 75.5 270 13%
75.5 75 270 13%
75 74.5 280 10%
74.5 74 276 11%
74 73.5 246 21%
73.5 73 270 13%
73 72.5 261 16%
72.5 72 265 15%
72 71.5 278 10%
71.5 71 269 13%
71 70.5 273 12%
70.5 70 258 17%
70 69.5 279 10%
69.5 69 279 10%
69 68.5 276 11%
68.5 68 286 8%
68 67.5 282 9%
67.5 67 270 13%
67 66.5 296 4%
66.5 66 275 11%
66 65.5 286 8%
65.5 65 292 6%
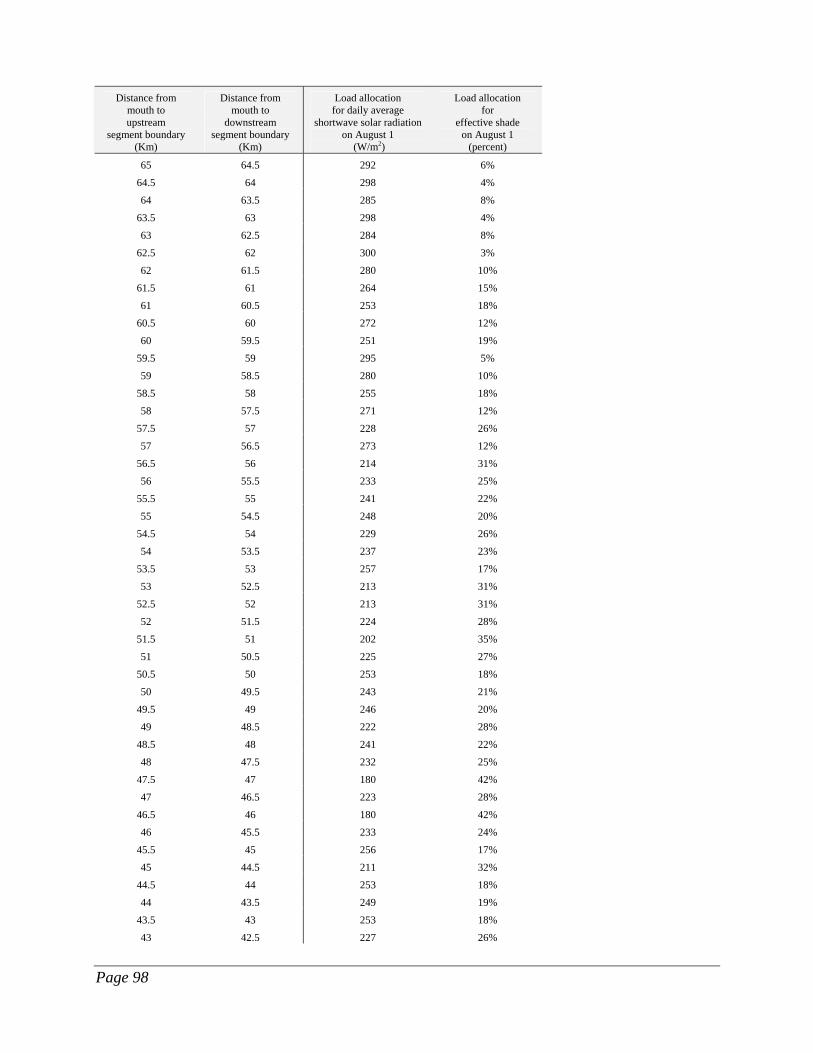
Page 98
Distance from mouth to upstream
segment boundary (Km)
Distance from mouth to
downstream segment boundary
(Km)
Load allocation for daily average
shortwave solar radiation on August 1
(W/m2)
Load allocation for
effective shade on August 1
(percent)
65 64.5 292 6%
64.5 64 298 4%
64 63.5 285 8%
63.5 63 298 4%
63 62.5 284 8%
62.5 62 300 3%
62 61.5 280 10%
61.5 61 264 15%
61 60.5 253 18%
60.5 60 272 12%
60 59.5 251 19%
59.5 59 295 5%
59 58.5 280 10%
58.5 58 255 18%
58 57.5 271 12%
57.5 57 228 26%
57 56.5 273 12%
56.5 56 214 31%
56 55.5 233 25%
55.5 55 241 22%
55 54.5 248 20%
54.5 54 229 26%
54 53.5 237 23%
53.5 53 257 17%
53 52.5 213 31%
52.5 52 213 31%
52 51.5 224 28%
51.5 51 202 35%
51 50.5 225 27%
50.5 50 253 18%
50 49.5 243 21%
49.5 49 246 20%
49 48.5 222 28%
48.5 48 241 22%
48 47.5 232 25%
47.5 47 180 42%
47 46.5 223 28%
46.5 46 180 42%
46 45.5 233 24%
45.5 45 256 17%
45 44.5 211 32%
44.5 44 253 18%
44 43.5 249 19%
43.5 43 253 18%
43 42.5 227 26%

Page 99
Distance from mouth to upstream
segment boundary (Km)
Distance from mouth to
downstream segment boundary
(Km)
Load allocation for daily average
shortwave solar radiation on August 1
(W/m2)
Load allocation for
effective shade on August 1
(percent)
42.5 42 245 20%
42 41.5 242 21%
41.5 41 285 7%
41 40.5 280 9%
40.5 40 291 5%
40 39.5 292 5%
39.5 39 291 5%
39 38.5 295 4%
38.5 38 288 6%
38 37.5 277 10%
37.5 37 280 9%
37 36.5 288 6%
36.5 36 276 10%
36 35.5 283 8%
35.5 35 293 5%
35 34.5 282 8%
34.5 34 282 8%
34 33.5 288 6%
33.5 33 292 5%
33 32.5 283 8%
32.5 32 288 6%
32 31.5 286 7%
31.5 31 289 6%
31 30.5 294 4%
30.5 30 288 6%
30 29.5 289 6%
29.5 29 279 9%
29 28.5 278 9%
28.5 28 282 8%
28 27.5 271 12%
27.5 27 287 6%
27 26.5 280 9%
26.5 26 287 7%
26 25.5 291 5%
25.5 25 291 5%
25 24.5 287 7%
24.5 24 298 3%
24 23.5 284 8%
23.5 23 291 5%
23 22.5 284 7%
22.5 22 293 4%
22 21.5 293 4%
21.5 21 292 5%
21 20.5 294 4%
20.5 20 295 4%

Page 100
Distance from mouth to upstream
segment boundary (Km)
Distance from mouth to
downstream segment boundary
(Km)
Load allocation for daily average
shortwave solar radiation on August 1
(W/m2)
Load allocation for
effective shade on August 1
(percent)
20 19.5 295 4%
19.5 19 295 4%
19 18.5 288 6%
18.5 18 292 5%
18 17.5 293 4%
17.5 17 288 6%
17 16.5 280 9%
16.5 16 293 5%
16 15.5 298 3%
15.5 15 296 3%
15 14.5 297 3%
14.5 14 293 4%
14 13.5 290 5%
13.5 13 282 8%
13 12.5 289 6%
12.5 12 280 8%
12 11.5 287 6%
11.5 11 287 6%
11 10.5 295 4%
10.5 10 281 8%
10 9.5 280 9%
9.5 9 285 7%
9 8.5 295 3%
8.5 8 291 5%
8 7.5 293 4%
7.5 7 297 3%
7 6.5 300 2%
6.5 6 299 2%
6 5.5 299 2%
5.5 5 295 3%
5 4.5 296 3%
4.5 4 295 4%
4 3.5 295 4%
3.5 3 295 4%
3 2.5 296 3%
2.5 2 290 5%
2 1.5 288 6%
1.5 1 289 6%
1 0.5 298 2%
0.5 0 300 2%

Page 101
Table B2. Load allocations for effective shade in Icicle Creek for the condition of mature riparian vegetation.
Distance from mouth to upstream
segment boundary (Km)
Distance from mouth to
downstream segment boundary
(Km)
Load allocation for daily average
shortwave solar radiation on August 1
(W/m2)
Load allocation for
effective shade on August 1
(percent)
30.1 29.6 102 67%
29.6 29.1 191 39%
29.1 28.6 175 44%
28.6 28.1 218 30%
28.1 27.6 222 29%
27.6 27.1 126 60%
27.1 26.6 197 37%
26.6 26.1 214 32%
26.1 25.6 219 30%
25.6 25.1 239 24%
25.1 24.6 226 28%
24.6 24.1 241 23%
24.1 23.6 258 18%
23.6 23.1 158 49%
23.1 22.6 181 42%
22.6 22.1 214 32%
22.1 21.6 187 40%
21.6 21.1 178 43%
21.1 20.6 142 55%
20.6 20.1 115 63%
20.1 19.6 138 56%
19.6 19.1 114 64%
19.1 18.6 124 60%
18.6 18.1 120 62%
18.1 17.6 156 50%
17.6 17.1 136 57%
17.1 16.6 215 31%
16.6 16.1 162 48%
16.1 15.6 191 39%
15.6 15.1 174 44%
15.1 14.6 146 53%
14.6 14.1 268 14%
14.1 13.6 177 43%
13.6 13.1 189 39%
13.1 12.6 253 19%
12.6 12.1 215 31%
12.1 11.6 177 43%
11.6 11.1 173 44%
11.1 10.6 123 60%
10.6 10.1 182 41%
10.1 9.6 177 43%
9.6 9.1 183 41%
9.1 8.6 198 36%
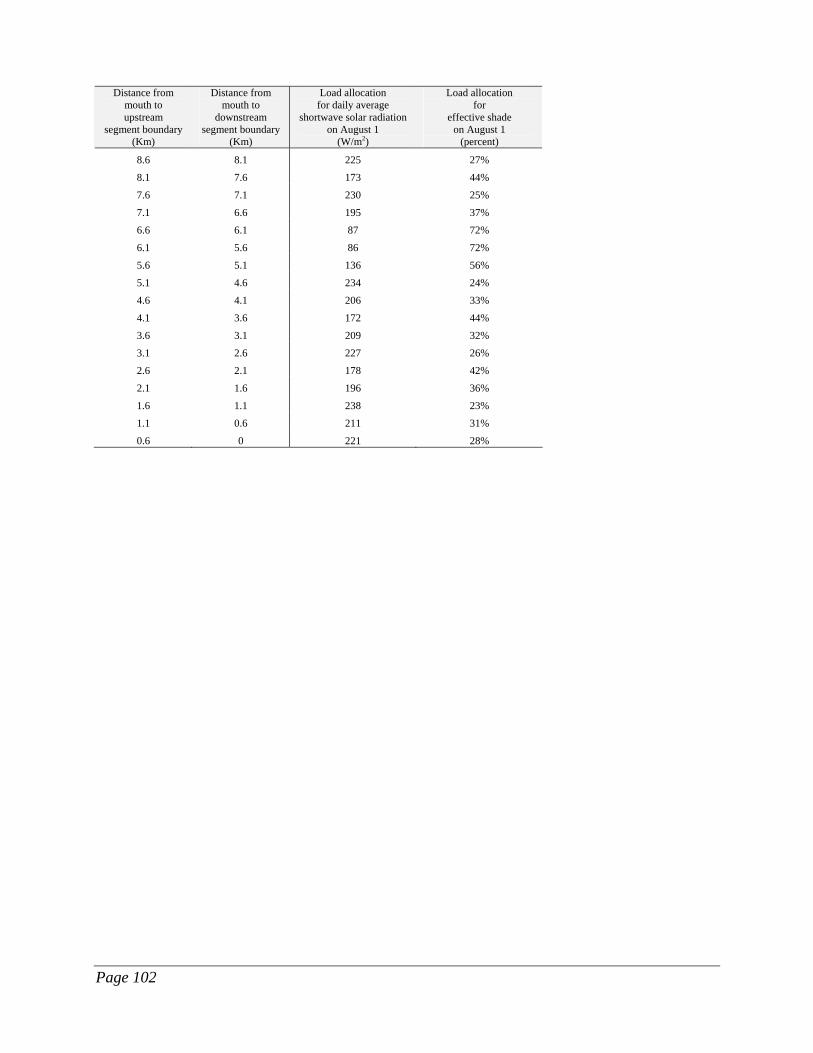
Page 102
Distance from mouth to upstream
segment boundary (Km)
Distance from mouth to
downstream segment boundary
(Km)
Load allocation for daily average
shortwave solar radiation on August 1
(W/m2)
Load allocation for
effective shade on August 1
(percent)
8.6 8.1 225 27%
8.1 7.6 173 44%
7.6 7.1 230 25%
7.1 6.6 195 37%
6.6 6.1 87 72%
6.1 5.6 86 72%
5.6 5.1 136 56%
5.1 4.6 234 24%
4.6 4.1 206 33%
4.1 3.6 172 44%
3.6 3.1 209 32%
3.1 2.6 227 26%
2.6 2.1 178 42%
2.1 1.6 196 36%
1.6 1.1 238 23%
1.1 0.6 211 31%
0.6 0 221 28%
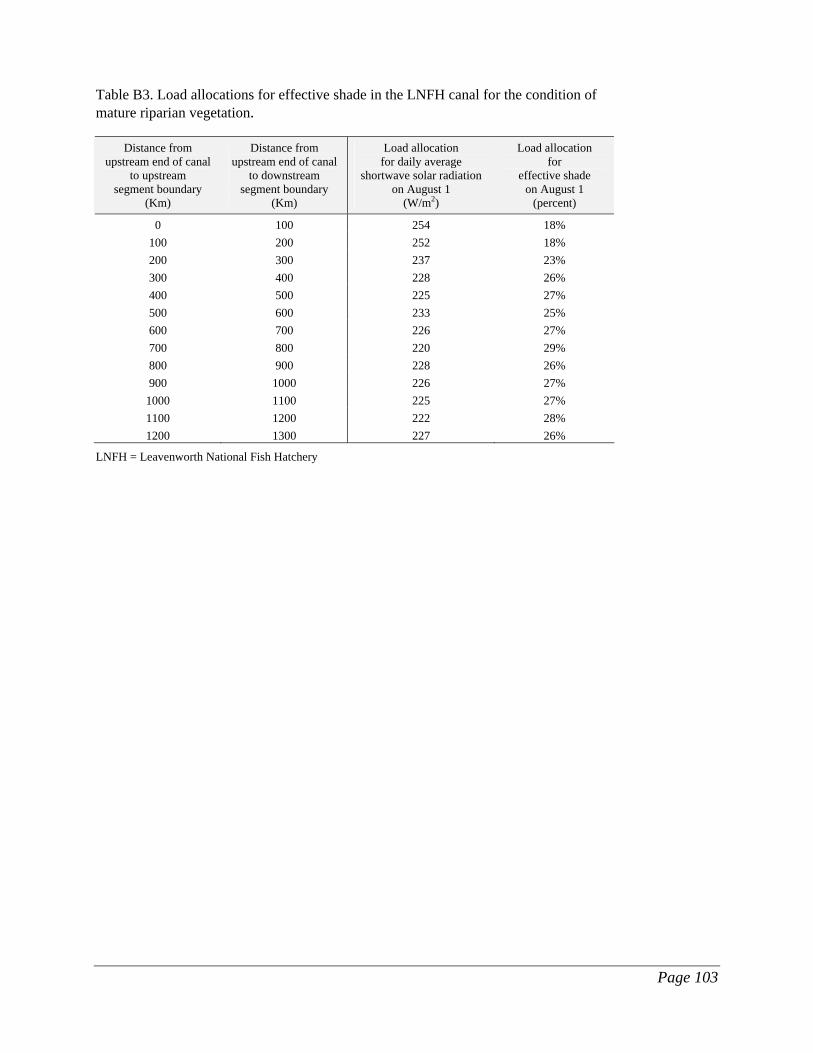
Page 103
Table B3. Load allocations for effective shade in the LNFH canal for the condition of mature riparian vegetation.
Distance from upstream end of canal
to upstream segment boundary
(Km)
Distance from upstream end of canal
to downstream segment boundary
(Km)
Load allocation for daily average
shortwave solar radiation on August 1
(W/m2)
Load allocation for
effective shade on August 1
(percent)
0 100 254 18% 100 200 252 18% 200 300 237 23% 300 400 228 26% 400 500 225 27% 500 600 233 25% 600 700 226 27% 700 800 220 29% 800 900 228 26% 900 1000 226 27%
1000 1100 225 27% 1100 1200 222 28% 1200 1300 227 26%
LNFH = Leavenworth National Fish Hatchery

Page 104
This page is purposely left blank for duplex printing.

Page 105
Table B4. Load allocations for effective shade in Nason Creek for the condition of mature riparian vegetation.
Distance from mouth to upstream
segment boundary (Km)
Distance from mouth to
downstream segment boundary
(Km)
Load allocation for daily average
shortwave solar radiation on August 1
(W/m2)
Load allocation for
effective shade on August 1
(percent)
41.9 41.4 28 91%
41.4 40.9 11 97%
40.9 40.4 21 93%
40.4 39.9 18 94%
39.9 39.4 30 90%
39.4 38.9 26 92%
38.9 38.4 67 79%
38.4 37.9 97 69%
37.9 37.4 84 73%
37.4 36.9 76 76%
36.9 36.4 71 77%
36.4 35.9 85 73%
35.9 35.4 57 82%
35.4 34.9 156 50%
34.9 34.4 107 66%
34.4 33.9 123 61%
33.9 33.4 82 74%
33.4 32.9 49 84%
32.9 32.4 53 83%
32.4 31.9 54 83%
31.9 31.4 80 74%
31.4 30.9 101 68%
30.9 30.4 115 63%
30.4 29.9 107 66%
29.9 29.4 95 70%
29.4 28.9 156 50%
28.9 28.4 132 58%
28.4 27.9 37 88%
27.9 27.4 42 87%
27.4 26.9 41 87%
26.9 26.4 40 87%
26.4 25.9 89 72%
25.9 25.4 223 29%
25.4 24.9 201 36%
24.9 24.4 210 33%
24.4 23.9 129 59%
23.9 23.4 259 17%
23.4 22.9 253 19%
22.9 22.4 178 43%
22.4 21.9 91 71%
21.9 21.4 98 69%
21.4 20.9 105 66%
20.9 20.4 212 32%
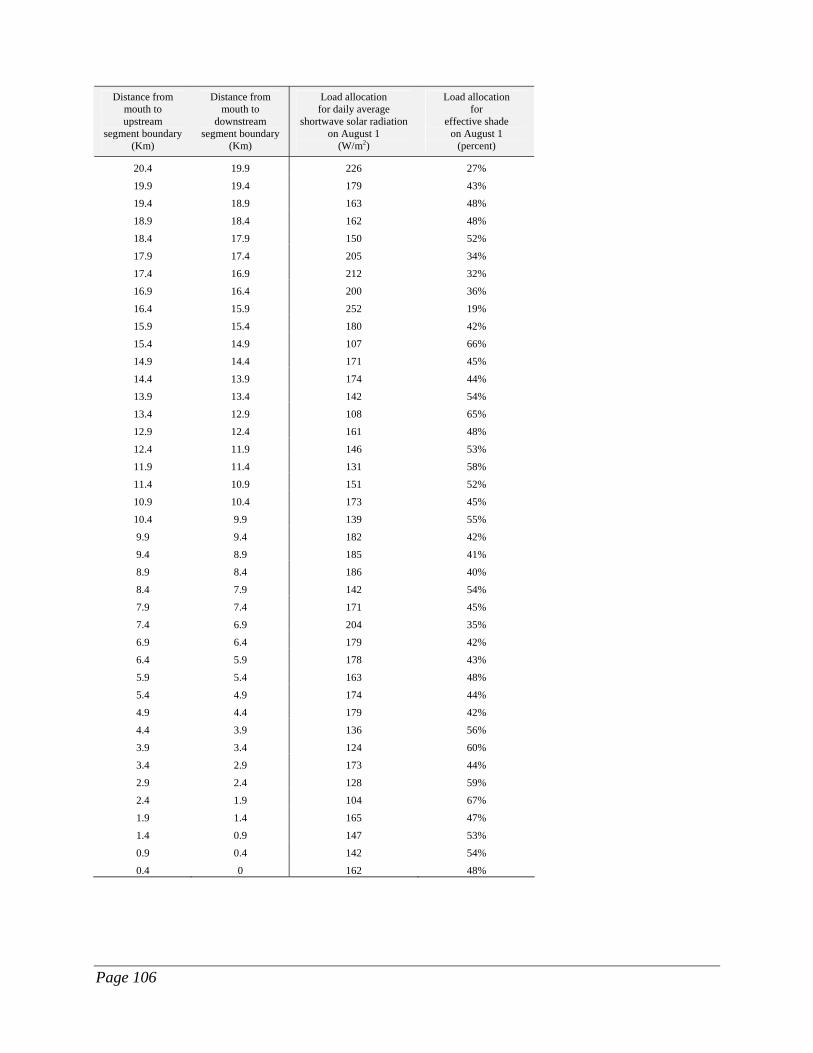
Page 106
Distance from mouth to upstream
segment boundary (Km)
Distance from mouth to
downstream segment boundary
(Km)
Load allocation for daily average
shortwave solar radiation on August 1
(W/m2)
Load allocation for
effective shade on August 1
(percent)
20.4 19.9 226 27%
19.9 19.4 179 43%
19.4 18.9 163 48%
18.9 18.4 162 48%
18.4 17.9 150 52%
17.9 17.4 205 34%
17.4 16.9 212 32%
16.9 16.4 200 36%
16.4 15.9 252 19%
15.9 15.4 180 42%
15.4 14.9 107 66%
14.9 14.4 171 45%
14.4 13.9 174 44%
13.9 13.4 142 54%
13.4 12.9 108 65%
12.9 12.4 161 48%
12.4 11.9 146 53%
11.9 11.4 131 58%
11.4 10.9 151 52%
10.9 10.4 173 45%
10.4 9.9 139 55%
9.9 9.4 182 42%
9.4 8.9 185 41%
8.9 8.4 186 40%
8.4 7.9 142 54%
7.9 7.4 171 45%
7.4 6.9 204 35%
6.9 6.4 179 42%
6.4 5.9 178 43%
5.9 5.4 163 48%
5.4 4.9 174 44%
4.9 4.4 179 42%
4.4 3.9 136 56%
3.9 3.4 124 60%
3.4 2.9 173 44%
2.9 2.4 128 59%
2.4 1.9 104 67%
1.9 1.4 165 47%
1.4 0.9 147 53%
0.9 0.4 142 54%
0.4 0 162 48%

Page 107
Appendix C. Load allocations for effective shade for miscellaneous perennial streams in the Wenatchee River basin based on bankfull width and stream aspect

Page 108
This page is purposely left blank for duplex printing.
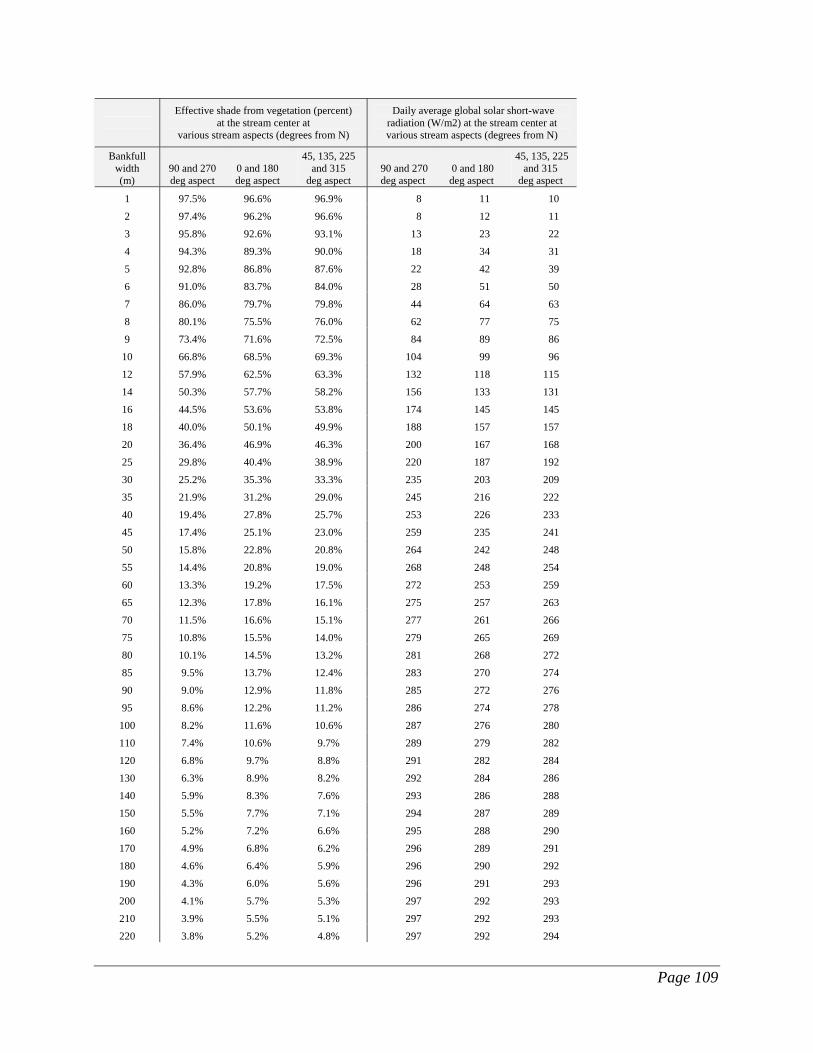
Page 109
Effective shade from vegetation (percent)
at the stream center at various stream aspects (degrees from N)
Daily average global solar short-wave radiation (W/m2) at the stream center at various stream aspects (degrees from N)
Bankfull width (m)
90 and 270 deg aspect
0 and 180 deg aspect
45, 135, 225 and 315
deg aspect 90 and 270 deg aspect
0 and 180 deg aspect
45, 135, 225 and 315
deg aspect
1 97.5% 96.6% 96.9% 8 11 10
2 97.4% 96.2% 96.6% 8 12 11
3 95.8% 92.6% 93.1% 13 23 22
4 94.3% 89.3% 90.0% 18 34 31
5 92.8% 86.8% 87.6% 22 42 39
6 91.0% 83.7% 84.0% 28 51 50
7 86.0% 79.7% 79.8% 44 64 63
8 80.1% 75.5% 76.0% 62 77 75
9 73.4% 71.6% 72.5% 84 89 86
10 66.8% 68.5% 69.3% 104 99 96
12 57.9% 62.5% 63.3% 132 118 115
14 50.3% 57.7% 58.2% 156 133 131
16 44.5% 53.6% 53.8% 174 145 145
18 40.0% 50.1% 49.9% 188 157 157
20 36.4% 46.9% 46.3% 200 167 168
25 29.8% 40.4% 38.9% 220 187 192
30 25.2% 35.3% 33.3% 235 203 209
35 21.9% 31.2% 29.0% 245 216 222
40 19.4% 27.8% 25.7% 253 226 233
45 17.4% 25.1% 23.0% 259 235 241
50 15.8% 22.8% 20.8% 264 242 248
55 14.4% 20.8% 19.0% 268 248 254
60 13.3% 19.2% 17.5% 272 253 259
65 12.3% 17.8% 16.1% 275 257 263
70 11.5% 16.6% 15.1% 277 261 266
75 10.8% 15.5% 14.0% 279 265 269
80 10.1% 14.5% 13.2% 281 268 272
85 9.5% 13.7% 12.4% 283 270 274
90 9.0% 12.9% 11.8% 285 272 276
95 8.6% 12.2% 11.2% 286 274 278
100 8.2% 11.6% 10.6% 287 276 280
110 7.4% 10.6% 9.7% 289 279 282
120 6.8% 9.7% 8.8% 291 282 284
130 6.3% 8.9% 8.2% 292 284 286
140 5.9% 8.3% 7.6% 293 286 288
150 5.5% 7.7% 7.1% 294 287 289
160 5.2% 7.2% 6.6% 295 288 290
170 4.9% 6.8% 6.2% 296 289 291
180 4.6% 6.4% 5.9% 296 290 292
190 4.3% 6.0% 5.6% 296 291 293
200 4.1% 5.7% 5.3% 297 292 293
210 3.9% 5.5% 5.1% 297 292 293
220 3.8% 5.2% 4.8% 297 292 294
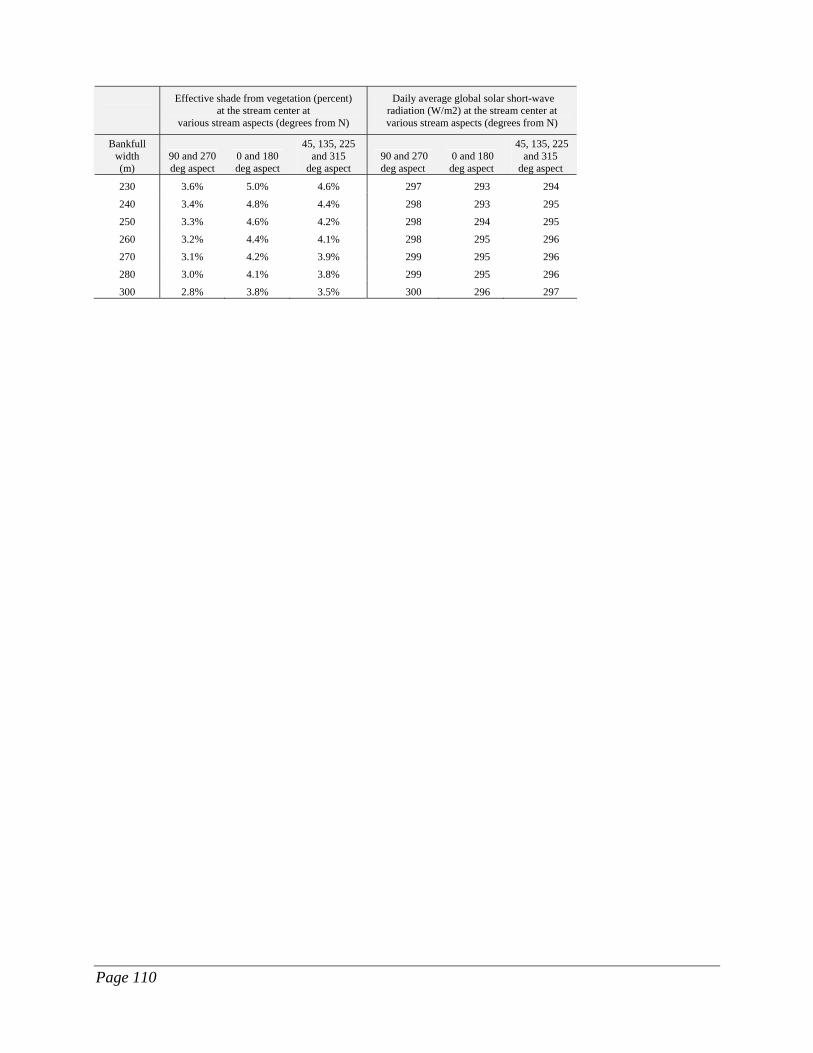
Page 110
Effective shade from vegetation (percent)
at the stream center at various stream aspects (degrees from N)
Daily average global solar short-wave radiation (W/m2) at the stream center at various stream aspects (degrees from N)
Bankfull width (m)
90 and 270 deg aspect
0 and 180 deg aspect
45, 135, 225 and 315
deg aspect 90 and 270 deg aspect
0 and 180 deg aspect
45, 135, 225 and 315
deg aspect
230 3.6% 5.0% 4.6% 297 293 294
240 3.4% 4.8% 4.4% 298 293 295
250 3.3% 4.6% 4.2% 298 294 295
260 3.2% 4.4% 4.1% 298 295 296
270 3.1% 4.2% 3.9% 299 295 296
280 3.0% 4.1% 3.8% 299 295 296
300 2.8% 3.8% 3.5% 300 296 297

Page 111
Appendix D. Year 1: Monitoring stations and data quality descriptions
This appendix describes activities at stream temperature monitoring stations for the first year (2002) of the Wenatchee Temperature TMDL study. The stations were in the Wenatchee River, Icicle Creek, and the mouths of their major tributaries. Any data qualifications are noted for each station. Data summaries of time-series data (daily maximum, minimum, and average temperature) recorded at each station are available in the Department of Ecology’s Environmental Information Management (EIM) database. This is online at www.ecy.wa.gov/eim/index.htm under the user study ID, WENRTMDL. For the stations listed below, all dates are for the year 2002. The study period referenced below is from January 1 through December 31, 2002. 45WR 53.9 - Wenatchee River at outlet of Lake Wenatchee This station was located on the left bank of the Wenatchee above the mouth of Nason Creek. The site was accessed through the maintenance road at the North Lake campground campsite #187. The relative humidity sensor was attached to a snag, and the water tidbit was on a concrete block approximately 30 feet away from the left bank. No problems were encountered with the water tidbit, but the air temperature and relative humidity sensor was having problems launching correctly from the laptop. A tidbit was placed in the solar radiation shield on 8/28 to replace the RH sensor. The air temperature data were lost from 7/18 till 8/28, and relative humidity was lost from 7/18 till the end of the study period. 45WR49.1 - Wenatchee River above Chiwawa Creek This station was located next to the west side of the metal bulkhead at the Chiwawa community water station. The water tidbit was attached to a concrete block and was pulled out several times during the summer by vandals. This tidbit began logging on 6/29. It was found out of water on 7/25, and the data were clipped for the dry period from 7/19 at 10:00 to the last data point on 7/25. The same tidbit was then redeployed. It was checked again on 8/16 when it was pulled out of the water but was not downloading correctly; the field tech did not replace the logger at this time. The tidbit was checked again on 8/20 when it was found to have a crack in the sensor casing. The sensor was replaced with a new tidbit on 8/20; this one worked fine and was not vandalized. The tidbit was removed on 10/16 at 16:00. 45FL00.3 - Fish Lake Creek This station was located above the culvert at the Sno-Park parking lot on Chiwawa Loop Road. The stream went dry sometime between 7/25 and 8/5, but it is difficult to determine the exact time when the air and the water tidbits are compared. The tidbit was still dry when the station
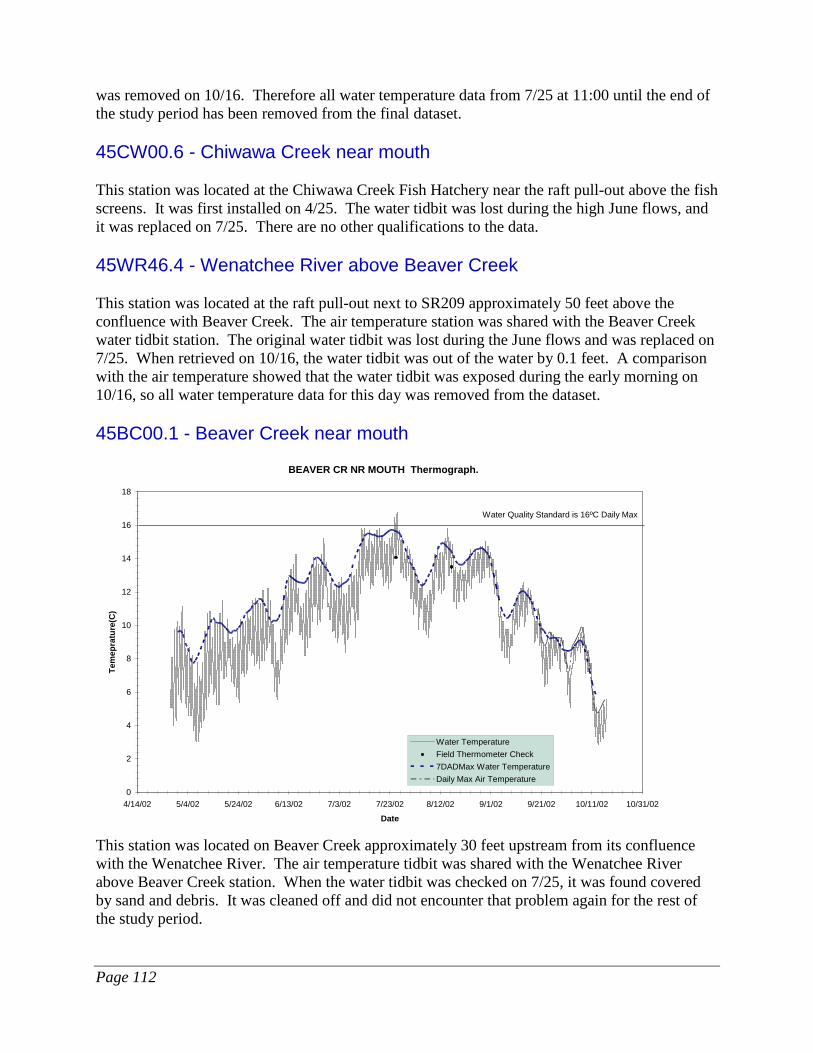
Page 112
was removed on 10/16. Therefore all water temperature data from 7/25 at 11:00 until the end of the study period has been removed from the final dataset. 45CW00.6 - Chiwawa Creek near mouth This station was located at the Chiwawa Creek Fish Hatchery near the raft pull-out above the fish screens. It was first installed on 4/25. The water tidbit was lost during the high June flows, and it was replaced on 7/25. There are no other qualifications to the data. 45WR46.4 - Wenatchee River above Beaver Creek This station was located at the raft pull-out next to SR209 approximately 50 feet above the confluence with Beaver Creek. The air temperature station was shared with the Beaver Creek water tidbit station. The original water tidbit was lost during the June flows and was replaced on 7/25. When retrieved on 10/16, the water tidbit was out of the water by 0.1 feet. A comparison with the air temperature showed that the water tidbit was exposed during the early morning on 10/16, so all water temperature data for this day was removed from the dataset. 45BC00.1 - Beaver Creek near mouth
BEAVER CR NR MOUTH Thermograph.
0
2
4
6
8
10
12
14
16
18
4/14/02 5/4/02 5/24/02 6/13/02 7/3/02 7/23/02 8/12/02 9/1/02 9/21/02 10/11/02 10/31/02
Date
Tem
epra
ture
(C)
Water TemperatureField Thermometer Check7DADMax Water TemperatureDaily Max Air Temperature
Water Quality Standard is 16ºC Daily Max
This station was located on Beaver Creek approximately 30 feet upstream from its confluence with the Wenatchee River. The air temperature tidbit was shared with the Wenatchee River above Beaver Creek station. When the water tidbit was checked on 7/25, it was found covered by sand and debris. It was cleaned off and did not encounter that problem again for the rest of the study period.

Page 113
45WR35.9 - Wenatchee River above Chiwaukum Creek This station was located on the right bank of the Wenatchee River approximately 20 feet upstream of the confluence with Chiwaukum Creek. The air temperature and relative humidity sensor encountered problems with the field laptop when downloading the data. Apparently the power conservation feature of the laptop turned off communication to the COM port. This did not allow the datalogger to launch properly so it did not collect any data after the download on 7/25. There is only air temperature and RH data for the period from 4/27 to 7/25. The first water tidbit deployed on 4/27 was lost during the June high flows, and a replacement was installed on 7/25. The water tidbit was also vandalized and left on the streambank sometime between 14:30 and 15:00 hours on 8/10. During a field check on 8/16, a replacement tidbit was installed. The original tidbit wasn’t discovered until 8/21 during the stream channel survey. A dry period (8/10 at 15:00 through 8/16 at 14:30) was removed from the final data set, and one temperature data point was removed due to the tidbit being affected by the air temperatures on 8/21 at 18:30. The time period after 10/26 was adjusted for Pacific Standard Time. 45WR33.0 - Wenatchee River at River Mile 33.0 This station was located along Hwy 2 in Tumwater Canyon at the scenic pullout with the Adopt-A-Highway sign for the Sleeping Lady Resort. This was one of the few stations that was not lost in the June flows. Upon comparison with the air tidbit, a dry period was determined from 8/2 – 8/6, and all data from 8/2 at 00:00 to 8/7 at 00:00 were removed from the final data set. 45WR32.3 - Wenatchee River above Lake Jolanda This station was located on the Wenatchee River in Tumwater Canyon at the second pullout (heading north on Highway 2) past the candy and gift shop upstream from the Tumwater dam. The water tidbit was determined to have gone dry, and data for the following time periods were cut from the final data set: 7/4 at 16:30 – 7/8 at 06:30, 8/4 at 06:52 – 8/5 at 22:52, and 8/8 at 07:52. The water tidbit was vandalized and not recovered after the last field check on 8/13. 45WR30.3 - Wenatchee River below Tumwater Dam This station was located on the Wenatchee River approximately 0.63 miles downstream of the Tumwater Dam. It was accessed through a car pullout off Highway 2. Icicle Creek and tributaries 45IC23.4 - Icicle Creek above Jack Creek This station was located at the end of Forest Service Road 615 approximately 160 feet above the mouth of the main channel of Jack Creek on the right bank of Icicle Creek. There were no problems encountered at this station, and the water tidbit stayed wet all summer long. No data needs qualifying.

Page 114
45JC00.1 - Jack Creek near mouth This station was located at the end of Forest Service Road 615 on the channel that flows under the bridge at the end of this road. U.S. Geological Survey (USGS) maps and other existing coverages show the main channel of flow moving east from a point several hundred feet above this bridge. However, we investigated this and found the stream channel has changed dramatically from when it was mapped (or it was mapped incorrectly). The channel flowing under the bridge is the main channel. The incorrectly mapped segment is a high-flow channel that may receive water only during the high-flow period in June. From mid-July to the end of the study period, all of the water in the system was flowing through the channel with the tidbit. It is unclear (due to the lack of a specific observation during July) exactly when in July waters receded below the bank flowing into the high-flow channel. The first water tidbit installed in May was lost during the high June flows, and a replacement was installed on 7/23. The water station was located in the thalweg about 30 feet downstream from the bridge. The air station was attached to the underside of the bridge. No other problems were encountered with this station during the study period. 45IC15.0 - Icicle Creek at Ida Creek Campground This station was located on Icicle Creek at the Ida Creek campground. It was approximately in the thalweg of the channel just upstream of the braided segment of Icicle Creek and downstream from the mouth of Ida Creek. The original water tidbit was lost during June high flows, and a replacement was reinstalled on 7/23. No other problems were encountered with this station during the study period. 45IC11.4 - Icicle Creek below 4th of July Creek This station was located near the left bank of Icicle Creek at river mile 10.8, approximately 600 feet downstream of a partially blocking log jam. The main channel of flow is nearer the right bank, and this segment changed dramatically during the study period. During the installation and through most of July, the streamflow was too high to be able to place the tidbit further into the middle of the stream. Therefore, it was positioned as close to the thalweg as was wadeable. The tidbit download check on 7/23 discovered the tidbit had been lost during the high spring/ early summer flows, and a replacement water tidbit was installed. The field check on 8/16 found the instream tidbit out of water, so it was reinstalled further out towards the main channel of flow. This tidbit was checked again on 8/27 but was not downloading properly, so another replacement was installed. No good data were retrieved from the first replacement tidbit, so the temperature dataset for this station is only from 8/27 through 10/15. 45IC09.9 - Icicle Creek at Bridge Creek Campground This station was located near the right bank of Icicle Creek approximately 100 feet downstream of the bridge crossing the creek. It was moved twice during the study to keep it in the main area

Page 115
of streamflow. The instream tidbit was found dry on the 8/15 tidbit check, and the total dry period determined from the air and water thermograph (8/7 at 00:00 - 8/15 at 08:50) was cut from the final dataset. No other data needs qualifying. 45MT00.1 - Mountaineer Creek near mouth This station was located approximately 100 feet downstream of the Forest Road 7601 bridge crossing of Mountaineer Creek. The instream tidbit was in the thalweg and did not go dry at any point during the study period. No data needs qualifying. 45EC02.7 - Eightmile Creek above Mountaineer This station was located approximately 10 feet upstream of the Forest Road 7601 bridge crossing of Eightmile Creek. Due to high June streamflows and the 6-foot falls and cascades, this station was not installed until 7/24. There were no problems with the instream tidbit; however, the air tidbit was “lost” for half a month in August and a replacement was installed. Fortunately the original sensor was still there, and the replacement remained in the field for the rest of the study period. 45EC00.1 - Eightmile Creek near mouth This station was located (with landowner permission) approximately 50 feet upstream of the house, near the right bank. The water was well mixed due to small waterfalls and cascades throughout the reach and the tidbit never went dry until near the beginning of October. When the tidbit was removed on 10/16, it was found 0.1 feet above the water surface, but the temperature data from the tidbit were consistent with the thermometer reading of the water temperature at the same spot (determined from a comparison of air and stream temperature data). The likely time when the instream tidbit was exposed to the air was around 10/10, so data were cut off at the end of 10/9. 45IC05.9 - Icicle Creek at Icicle/Peshastin Irrigation District This station was located on Icicle Creek adjacent to the diversion canal for the Icicle/Peshastin Irrigation District. The location was accessed by the vehicle pull-out on Icicle Road near the information kiosks. The station was installed late (7/24) and was not originally planned in the Quality Assurance Project Plan, but was added to provide more temperature data in the stream reach influenced by the diversions. There were no problems with either air or water tidbits. The instream tidbit did not go dry during the study period. However, the creek water level dropped dramatically from September until the station was removed in October at which point the instream tidbit was only 0.25 feet below the water surface. The drop in streamflow is attributed to no precipitation locally or in the headwaters, and continued water withdrawal by the irrigation district. Our visual estimate of water withdrawal from Icicle Creek was more than 50 percent of total streamflow diverted into the canal.

Page 116
45SN00.1 - Snow Creek near mouth The instream tidbit was lost during the early part of July and there was supposed to be another thermistor operated by the Mid-Columbia River Fisheries Research Office (MCFRO). The following stations had thermistors operated by the MCFRO: 45IC02.6, 45IC03.4, 45IC04.8, and 45IC15.3. The data steward is Maleena Cappellini, phone number (509) 548-7573, email [email protected]. 45IC04.1 - Icicle Creek above old channel This station has a continuous flow gage. 45IC02.3 - Icicle Creek at East Leavenworth Road bridge crossing This station was located on the right bank of Icicle Creek immediately downstream of the East Leavenworth Road bridge crossing. On this reach, the creek goes from wadeable depths approximately 300 feet upstream, to depths up to 10 feet at the tidbit, and then wadeable again approximately 200 feet downstream. The instream tidbit was anchored on the creek bottom with a concrete block in about 7-8 feet of water. Comparisons of instream tidbit data with reference thermometer readings from near the water surface are very similar, suggesting that this small pool was well mixed. Cascade Orchard Irrigation ditch return This station was located approximately 15 feet from the screen at the irrigation ditch return on Icicle Road. There was a staff gage at this site, and a discharge rating curve was developed. The ditch was closed and empty on 10/1. There were no problems with either the air or instream tidbits. There were some periodic temperature spikes in the instream thermograph that could not be explained with only a stage correlation at this site. The temperature spikes in question occurred on the following dates and times: 5/24 at 14:30 - 10.29 °C, 6/14 at 10:30 - 14.65 °C, and 8/10 at 12:11 - 20.6 °C. There was another temperature spike on 8/12 from 12:00 – 18:30 hours; however, this was due to a ditch cleaning and was noted in the stage log by the watermaster. It is possible that the volume of water in the ditch changes dramatically during each day and that exchange wasn’t captured by daily stage readings but could be apparent in the thermograph as a temperature spike when the stage drops below the water tidbit. The temperature spikes have been left in the final dataset as water temperatures.

Page 117
Wenatchee River above Chumstick Creek This station was located approximately 200 feet downstream of the Highway 2 bridge entering Leavenworth. Access was gained through a trail down to the river behind the Alpine Inn. The river flows through a steep valley and is constrained by the bridge upstream to create a very deep channel. There is rip-rap armoring both riverbanks, and the water tidbit was attached to a cement block and dropped among the rip-rap. The river dropped quite a bit over the course of the study period, exposing the instream tidbit to air and vandals. During one site visit, the instream tidbit and the cement block were found pulled out of the water and sitting on the edge of the rip-rap. Also, the solar radiation shield for the RH probe had been tampered with and had two of the bottom plates missing. The following time periods were removed from the final dataset because they represented times when the instream tidbit was dry: 7/21 at 08:00 through 7/26 at 09:30, 8/1 at 00:00 through 8/7 at 07:30, and 9/5 at 00:06 through 9/18 at 04:36. Problems launching the RH probes with the field laptop resulted in missing air temperature and RH data from 6/29 at 00:00 through 7/26 at 09:00. Chumstick Creek at North Road culvert This station was located approximately 7 feet upstream of the culvert on North Road just north of Leavenworth. The permanent flow gage on Chumstick Creek was upstream by more than 300 yards. The creek is at the bottom of a steep ravine. There was an irrigation return 10 feet upstream of the instream tidbit so the water temperatures reflect the mix of the Chumstick and irrigation return. The mouth of Chumstick was another 600 yards downstream, and there were no other surface water inputs downstream of the tidbit. Wenatchee River below Chumstick Creek This station was located on the Wenatchee River at a common pullout for rafters; unfortunately, this was not identified until the instream tidbit was vandalized. After the vandalism was discovered, the tidbit was moved downstream of the area in which rafters portaged their rafts out of the river. The stream channel appeared to have a fairly uniform bottom (observation made at low water) but was still not wadeable across a cross-section. The instream tidbit was found missing and was replaced on 8/15 (the day before the FLIR flight). After the instream tidbit was moved, no other problems were encountered with it. Wenatchee River above Derby Creek This station was located on the Wenatchee River above the Derby Canyon Road. Access was gained by parking next to the railroad tracks on the left bank and walking down a steep access road to the river. This station was originally installed in April, but the instream tidbit was lost during the high June flows. The instream tidbit was replaced on 7/17 at 16:37 hours. The instream tidbit was found dry on 8/7 and was subsequently moved into deeper water during that same visit. After looking at the thermograph, the total dry period data (8/1 at 00:00 to 8/7 at 16:00 hours) were removed. The air temperature record begins on 4/27, and the water temperature record begins on 7/17.

Page 118
Wenatchee River above Peshastin Creek Access to this station was approximately 300 feet downstream of a power line crossing through private property that changed landowners during the study period. The land adjacent to the stream station was growing only grass during this study period. The station was installed on 6/27. The tidbit was kept in the main channel of flow for the duration of the study period, except on 10/11 it was disturbed by someone who pulled it out of the water. The tidbit was found on the bank on 10/17 when it was removed. All data from 10/11 at 00:00 hours through 10/17 was removed from the final dataset. Peshastin Creek near mouth This station was located on Peshastin Creek approximately 300 feet downstream of the last bridge crossing of the road that goes into the Department of Transportation Pit Slide gravel area and the right bank access for the Dryden dam. The instream tidbit was in the main channel of flow for the entire study period. The original instream tidbit was lost in the high June flows and was replaced on 7/17. No other problems were encountered during the study period. Wenatchee River above Olalla This station was located next to a rafting pullout along Stines Road approximately 0.18 river miles downstream of the Highway 2/97 bridge crossing. It was attached to a concrete block and was moved several times as the water stage receded. On 8/6 at 17:15 hours, it was found dry and was moved as far out as possible until the water was too deep to wade. The thermograph shows the instream tidbit going dry sometime after 17:00 hours on 8/2 so the water temperature data were cut from 8/2 17:00 till 8/6 18:00. Wenatchee River above Mission Creek This station was located approximately 0.37 miles above the mouth of Mission Creek next to the railroad. Immediately above the tidbit station is a sandstone formation that has lots of shelves and pockets that have a very high roughness factor. The tidbit was anchored with a concrete block and thrown in from the right bank side. There were no periods where the tidbit went dry, and no data qualifications are necessary. Mission Creek This station was located approximately 30 feet downstream of the Sunset Avenue bridge crossing (above Brender Creek). The instream tidbit was 0.07 feet from the water surface during the 8/15 download check. There was a water temperature spike on 8/14 that may have been influenced by the instream tidbit being directly exposed to air temperatures. Yet a comparison with the air temperatures shows that the recorded instream temperatures were much different: maximum instream temperature was 26.85ºC, and the corresponding air temperature was 32.47ºC.

Page 119
A comparison with the flow record from the continuous gage (45MC00.1g) showed a drop in stage (stage heights less than 0.65) that correlated with the same time as the high temperatures recorded from approximately 16:00 to 19:00. However, the gage had a much lower instream temperature for this time period (16.4-17.6ºC, with the high reading occurring at 17:30, the same time as the maximum temperature recorded by the tidbit). This gage is also influenced by Brender Creek. The low stage combined with debris that piled up around the instream tidbit likely produced slightly higher temperatures than the average stream temperature for this reach. Since the stage recordings show that the creek was at or below 0.65 for most of 8/14, the entire temperature set for 8/14 was cut from the final record. Brender Creek (45BR00.1)
BRENDER CREEK (RIVER MILE 0.1) Thermograph.
0
5
10
15
20
25
30
35
40
45
50
4/4/02 5/24/02 7/13/02 9/1/02 10/21/02 12/10/02
Date
Tem
epra
ture
(C)
Water TemperatureField Thermometer Check7DADMax Water TemperatureDaily Max Air Temperature
This station was located on the upstream side of the Sunset Avenue culvert crossing Brender Creek. These tidbits were well-placed and had no problems during the summer. The ambient monitoring station (45D070) is located on the downstream side of the culvert. Wenatchee River at Monitor This station was located on the right bank of the Wenatchee River approximately 400 feet upstream of the boat launch in Monitor. The first instream tidbit installed was lost during high June flows, and the second instream tidbit was lost due to vandalism. A third tidbit was installed on 8/7, and no problems were encountered with the instream tidbit for the remainder of the study period. The air tidbit had no problems, and the data record began on 4/27. There was a period of several days from 6/14-6/20 when the air tidbit was under water (it was originally installed 4.2 feet

Page 120
above the wet edge). Also, there were physical signs of debris in the shrubs in which the air tidbit was installed. This data period was cut from the air temperature record but kept as an addendum of water temperatures since the original water tidbit was lost during this time. Highline Irrigation Ditch return at mouth This station was located approximately 20 feet downstream of the end of the concrete channel (the return flow channel coming from the Wenatchee Reclamation District office) and approximately 30 feet upstream of the confluence with the Wenatchee River. The first installed instream tidbit was not recovered during the 7/25 download check. Vandalism is assumed since stream velocities at this site should not have been fast enough to tear off the shade device and tidbit during the high June flows. A second tidbit was installed, and no problems were encountered for the rest of the study period. Dry periods were determined to be 9/4 at 10:06 through 9/5 at 9:36, 9/18 at 10:06 through 9/19 at 9:36, and 10/9 at 10:06 through 10/10 at 9:36. Instream temperature spikes for 8/08 and 8/13 need to be double checked to determine if they represent real instream temperatures or dry periods. The irrigation ditch was closed on 10/16. Wenatchee River near mouth This station was located on the Wenatchee River approximately 30 feet downstream of the pedestrian bridge at the Confluence State Park. During the study period, it was observed that the river was influenced by the Columbia River at this site due to the dam downstream of the city of Wenatchee. This impoundment changed the river stage of the Wenatchee River at this station independent of the Wenatchee’s instream flow. It is unclear how much that affected the tidbit data at this site. There was no tidbit located on the Columbia River upstream of the confluence with the Wenatchee River. From 8/3 at 8:00 through 8/7 at 8:30 the instream tidbit was dry. It was found on 8/7 and moved into deeper water. No other problems were encountered with the instream tidbit during the study period. There was a problem re-launching the air temperature and relative humidity sensor in the field, so that dataset is only for the period from 6/29 through 8/29. There are no data past 8/29.
Page 121
Appendix E. Year 2: Monitoring stations and data quality descriptions
This appendix describes activities at stream temperature monitoring stations for the second year (2003) of the Wenatchee TMDL study. The stations are in the sub-basins of Peshastin Creek, Mission Creek, Nason Creek, and Chumstick Creek. Any data qualifications are noted for each station. Data summaries of time-series data (daily maximum, minimum, and average temperature) recorded at each station are available in the Department of Ecology’s Environmental Information Management (EIM) database. This is online at www.ecy.wa.gov/eim/index.htm under the user study ID, WENRTMDL. Department of Ecology Stations All dates listed below are for the year 2003. The study period referenced below is from January 1 through December 31, 2003. Chumstick Creek Subbasin 45C070 - Chumstick Creek near Leavenworth This continuous temperature monitoring station was located at the ambient monitoring station upstream from the North Road culvert. This station is also a flow gaging station. Temperature data were compiled and quality assured by Ecology’s Ambient Monitoring Unit. 45Q060 - Eagle Creek near mouth This continuous temperature monitoring station was located at the ambient monitoring station near Eagle Creek Road. This station was operated by the Ambient Monitoring Unit who also compiled and QA’d the final temperature data. 45CS06.1 - Chumstick below Clark Canyon Road This station was located adjacent to a roadside pull out approximately a quarter of a mile south of the Clark Canyon Road. The instream temperature and air temperature station was installed on 5/29 at 11:54 hours. The immediate area surrounding the station was well-shaded from both riparian vegetation and topographic shading from the road grade on the left bank and the railroad grade on the left bank which was approximately 10 feet above the water edge. From late August to early October, there is a greater frequency for the daily instream temperature fluctuations. These fluctuations seemed to be real when compared with the air temperature for those times, and not related to the tidbit being completely exposed to the air.

Page 122
However the air tidbit (serial number 452905) did not pass the post-season accuracy check, with an average difference of .55ºC cooler than the NIST1 certified reference thermometer. A correction factor of +.55ºC was applied to the entire data set for 2003. This should not have a great effect on the air data since .55ºC is likely to be within the normal variability of the air microclimate at that location. The station was removed on 10/21 at 14:00 hours. 45CS09.1 - Chumstick Creek above Little Chumstick Creek confluence This station was located on the upstream side of the stream culvert on Chumstick Hwy, next to Merry Canyon Road. The instream temperature and air temperature station was installed on 5/29 at 10:33 hours. The immediate area around the station was well shaded but downstream of the culvert opened up into a sparsely shaded pasture. A field check on 9/8 found the water tidbit .5 inch above water surface. A comparison of the air and water thermographs showed that the water tidbit was still recording temperatures lower than the air tidbit, so it was difficult to determine exactly when the water tidbit was exposed to the air. The data for 9/8 prior to the field check were cut. The 24-hour period for 9/7 was removed also as a precaution in case the tidbit was affected by lowering water during that day. The maximum stream temperature recorded for 9/7 was 16.5°C occurring at 15:30. The air temperature at that time was 23.2°C, one hour after the maximum air temperature for that day. No other water temperature data appear to correspond to the instrument going dry, and no other data are qualified. The station was removed on 10/21 at 13:35. 45SE00.1 - Second Creek at Merry Canyon Road crossing This station was located on the downstream side of the stream culvert on Merry Canyon Road. The instream temperature and air temperature station was installed on 5/29 at 10:54 hours. Comparison of air and instream temperatures did not indicate any time when the instream tidbit came out of the water, so all instream data were acceptable. Mission Creek Subbasin 45D070 - Brender Creek near Cashmere This continuous temperature monitoring station was located on the downstream side of the culvert on Sunset Hwy. The station was operated by the Ambient Monitoring Unit who also compiled and QA’d the final temperature dataset for this station. 45R050 - No Name Creek tributary to Brender Creek This continuous temperature monitoring station was located at the ambient monitoring station on an unnamed tributary to Brender Creek near their confluence with Mission Creek. The station was operated by the Ambient Monitoring Unit who also compiled and QA’d the final temperature dataset for this station.
1 National Institute of Standards & Technology
Page 123
45YC00.3 - Yaksum Creek at Mission Creek Road crossing This station was located on the upstream side of the stream culvert approximately 3 feet in the culvert so it was completely shaded from direct sunlight. The instream temperature station was installed on 5/30 at 09:22 hours. There was no air temperature tidbit installed at this station since security was low. The next closest air temperature station was Mission Creek at Woodring Canyon Road. The Yaksum Creek station was removed on 10/21 at 14:55 hours. 45E070 - Mission Creek near Cashmere (also known as 45MC00.1) This continuous temperature monitoring station was located near the staff gage for the telemetry flow gaging station on Mission Creek at Sunset Hwy. The station was operated by the Ambient Monitoring Unit who also compiled and QA’d the final temperature dataset for this station. The streamflow gage was operated by Ecology’s Stream Hydrology Unit. 45MC00.5 - Mission Creek at Pioneer Road This station was located approximately 15 feet downstream of the Pioneer Hwy bridge near the left bank in the main channel of flow. The cobble and course gravel streambed material had the effect of ponding the streamflow underneath the bridge during low flow. There is also a culvert approximately 10 feet upstream of the bridge on the left bank side that had a significant flow of water whose source is unknown. Another small culvert on the downstream side of the bridge on the right bank, just below the instream tidbit, had a small flow (estimated at <1 cfs) during every station visit. When the instream thermograph is compared with the stage height data from the Binder Road gage, there is not a consistent rise in stream temperature with the corresponding drops in stream stage. This may occur because the culvert, upstream of the tidbit, had water flowing out of it every time the station was visited and was likely flowing all summer long until orchard irrigation ended for the season. There were several temperature spikes that approached the air temperatures from the Binder Road station (the next closest air tidbit) because the spikes were during most of the daytime hours. To simplify the data quality assurance, the following 24-hour periods were cut: 7/24, 7/30 through 8/2, 8/7, 8/18-8/22, and 10/2-10/10. The station was removed on 10/21 at 14:35. 45MC01.2 - Mission Creek at Binder Road The instream temperature and air temperature tidbits were installed on 6/10 at 15:33 hours. This station is located near the Cashmere city limits but still within the developed land. Orchard land dominates the upstream reach. This reach is well shaded and affected by small water diversions for irrigation upstream and a siphon spill from an irrigation pipe that crosses Mission Creek. There was also a piezometer at this site, well tag #AGJ 797. The streamflow station showed repeated water stage drops (presumably from water withdrawals of some type) from 7/23 through 8/22 on a daily basis. The stream stage dropped dramatically each night, sometimes as early as 18:45 and as late as 3:30 in the morning. The maximum stage drops occurred on 8/14 at 15:45 (from 0.54 to .2 feet in stage height) and on 8/17 at 4:15 (from

Page 124
0.52 to 0 feet in stage height) and on 8/19 at 19:45 (from 0.58 to 0 feet in stage height). Each draw-down period lasted from around 7-12 hours (time from maximum to maximum stage height) and varied quite a bit from start to end time. Since the low water periods occurred at night, the stream did not heat as rapidly as it could have during the daytime heat. However, the stream was still exceeding water quality standards often during the time where the stream stage was at its daily maximum height. All instream temperature data points that occurred when the stage height was less than 0.4 feet (the height of the tidbit off the stream bottom which was nearly the same elevation as the stage height recorder) were removed from the final data set, assuming they represent time periods where the instream tidbit was exposed to the air. The instream tidbit was definitely affected by low water (caused by reduced stream depth and flow) during other times in July and August, but those other records represent instream temperatures and not an exposed tidbit. The station was removed on 10/21 at 16:05. 45MC02.2 - Mission Creek at Woodring Canyon Road This station was located about 10 feet downstream of the private bridge crossing Mission Creek at Woodring Canyon Road. The instream temperature, air temperature, hyporheic temperature, and piezometer instruments was installed at this site on 6/10 at 16:20. This site was well covered with riparian vegetation and did not receive much direct solar radiation. The upstream and downstream reaches of this site were dewatered during late August. The field check on 8/26 found that there was little to no flow and much of the upstream reach was dewatered. There was a pool of water surrounding the site, with very little surface water flow moving downstream. The thermograph showed the instream tidbit tracking the air temperature closely for the remainder of the study period until 10/10. The tidbit was in the water on 8/26 and near the bottom of the stream during the rest of the study period. Since the tidbit represented the head of a pool without any instream flow from upstream, it should be assumed that the recorded instream temperatures from 8/26 through October 31 represent real water temperatures (albeit, the result of slack water). This period from 8/26 to 10/10 should be used with caution, however, since it is impossible to confirm with 100% certainty that the tidbit was in the water all that time. The period from 7/29 through 8/25 showed a muted instream temperature signal. This corresponds to groundwater entering the stream due to nearby orchard irrigation. It also confirmed by the piezometer results and visual observations of the seep face throughout the summer when visiting the site, as well as the pool never dewatering through the driest part of the summer. The station was removed on 10/21 at 15:04 when streamflow was back to a stage similar to the July flows. 45MC04.5 - Mission Creek at Shelton’s Tree Farm The instream temperature, air temperature, hyporheic temperature, and piezometer instruments were installed on 6/10 at 18:46 hours. The thermal reach was well shaded with deciduous vegetation. The instream tidbit matched the air temperatures from 9/3- 9/5, so it is assumed that

Page 125
the tidbit was dewatered. The records for those 3 days were removed from the final dataset. No other data needs qualifying. The station was removed on 10/21 at 15:15. 45MC07.6 - Mission Creek downstream of confluence with Sand Creek The instream temperature, air/RH temperature, soil temperature, hyporheic temperature, and piezometer instruments were installed on 6/10 at 17:34. The only data cut from the final dataset is a download artifact on 8/25 at 16:42. All other data were acceptable. This reach was densely shaded with deciduous vegetation. The station was removed on 10/21 at 15:33. 45MC08.6 - Mission Creek at the National Forest boundary This station was located about 100 feet south of the large pullout at the Wenatchee National Forest boundary, on the section of Mission Creek that flows right up against the road. This station was used only for collecting streamflow data during the August seepage flow run. 45MC09.2 - Mission Creek headwater boundary This station was located at the first road crossing with Mission Creek near the Wenatchee National Forest boundary. There was a piezometer here, and this was a streamflow measurement site. Approximately 200 feet downstream of the bridge was an aquarod and data logger recording stage height and water temperature (daily max, min, avg) on Mission Creek. This station was operated by the Lake Wenatchee and Leavenworth Ranger Districts. This station was called East Fork Mission in reports by the U.S. Forest Service (USFS). These data are located in their own spreadsheet with the other USFS data titled “USFSTemperature2003.xls”. Nason Creek Subbasin 45NC00.3 - Nason Creek near Wenatchee River confluence This continuous temperature monitoring station was operated by the USFS, and the data were compiled and QA’d by the USFS. 45NC00.7 - Nason Creek at Cedar Brae Road This station consisted of a telemetry continuous streamflow gage operated by Ecology’s Stream Hydrology Unit that also recorded instream temperature. A weather station was installed on the left bank near the stream gage on 5/28 at 18:51. The parameters included air temperature, soil temperature, relative humidity, total solar radiation, wind speed, and wind direction. The soil temperature instrument was buried in the ground at a depth of 1.5 feet. A hemispherical photograph was taken above the solar pyranometer. The station was removed on 11/5 at 16:45. 45NC04.4 - Nason near Cole’s Corner (USFS station) This continuous temperature monitoring station was operated by the USFS, and the data were compiled and QA’d by the USFS.

Page 126
45NC04.7 - Nason Creek near Cole’s Corner This station is also recorded as “Nason at 59er diner” in some of the field notes. The instream temperature, air temperature, and piezometer instruments were installed on 6/12 at 09:45. No data need qualification, except three download artifacts on 8/21 at 15:35, 8/21 at 16:05, and 8/21 at 16:35 that were cut. The station was removed on 11/5 at 10:30. 45NC06.0 - Nason Creek above confluence with Kahler Creek The instream temperature and air temperature tidbits were installed on 6/11 at 18:00. A piezometer was not successfully installed at this location. The station was on Nason Creek before the channel split into two flow channels. The station was always submerged during the season. No data needs qualification, except three download artifacts on 8/21 at 14:45, 8/21 at 15:00, and 8/21 at 15:30 that were cut. The station was removed on 11/4 at 15:40. 45NC07.9 - Nason Creek below the bridge on Forest Road 6910 The instream temperature and air temperature tidbits were installed on 6/11 at 17:21. A piezometer was not successfully installed at this site. At some time on 7/2 the instream tidbit was exposed to the air. It was found out of water by Mary Jo Sanborn with Chelan County who replaced it back into Nason Creek on 8/5 at 12:30. The data were cut from 7/2 at 00:00 through 8/5 at 12:30. The temperature record is valid from then until the first download on 8/21 at 14:30. The instream tidbit was not recovered in November. It is assumed to have either been taken or, most likely, washed downstream during the mid-October flood event. The tidbit was not found after a reasonable search of the downstream reach. The air tidbit was removed on 11/4 at 15:55. 45NC09.4 - Nason Creek below confluence with Roaring and Coulter Creeks This was a streamflow measurement site that is paired with site 45NC09.5 to derive a discharge to Roaring and Coulter Creek via mass balance. It was located in a good flow cross-section approximately 500 feet downstream of the culvert outlets and across from a log reinforcing a private river access site. 45NC10.2 - Nason Creek below Gill Creek This was a streamflow measurement site used during the August seepage flow run. No other parameters were measured at this station. 45NC09.5 - Nason Creek above confluence with Roaring and Coulter Creeks The instream temperature and piezometer station was installed on 6/11 at 16:09. The air temperature station is shared with 45RC00.0 since the two stations were less than 100 feet apart. The instream temperature data file for the time period from 6/11 to 8/28 was not recovered correctly from the tidbit; this was not found until the data post-processing occurred. The second half of the thermograph from 8/28 to 11/13 was ok except that the sample interval was set to

Page 127
5 minutes. This station was processed in Excel© instead of tidbit Ttools© because Ttools wouldn’t calculate properly with that interval. The station was removed on 11/5 at 10:00. 45NC11.2 - Nason Creek above confluence of Gill Creek The instream temperature tidbit, air temp/RH tidbit, and piezometer were installed on 6/11 at 15:01. The station was located near the head of a long glide, nearer the right bank. 45NC12.2 - Nason Creek east of knife shop This was a streamflow measurement site used during the August seepage flow run. It was located on Nason Creek near the Rayrock Springs knife shop at a good flow cross-section site. 45NC13.9 - Nason Creek above Mahar Creek The instream and air temperature station was installed on 6/25 at 16:10. The station was located approximately 30 feet downstream of the bridge crossing on Whitepine Creek Road. The stream channel in this reach was heavily armored with rip-rap to protect the road and railroad from erosion. It was not possible to install a piezometer at this location. The instream tidbit was lost during the late October flood event. The instream temperature record ends on 8/21 at 13:00. The air tidbit was removed on 11/4 at 14:43. No instream temperature data need to be qualified, and all records were retained. 45NC16.3 - Nason Creek above Whitepine Creek The instream temperature station was installed on 6/11/03 and removed on 11/4/03. The stream temperature station was as close to the thalweg of Nason Creek as was wadeable, but nearer the right bank side from the center of the stream and approximately 65 feet upstream of the confluence with Whitepine Creek. Access to this station was next to a primitive campsite that is found from a small trail to the right of the bridge over Whitepine Creek. There was also a mini-instream piezometer installed at this location. No instream temperature data need to be qualified and all records were retained. 45NC19.2 - Nason Creek near the Department of Transportation Berne Facility The instream and air temperature station was installed on 6/25 at 14:10. A piezometer and hyporheic tidbit was also installed near the left bank on the same transect as the instream temperature instrument. The station was located approximately 200 feet upstream of the Hwy 2 bridge crossing at the DOT’s Berne Maintenance Facility. During field checks the instream tidbit was always in the water, and a comparison with the air tidbit showed no apparent time that the instream tidbit was dewatered. The instream tidbit was lost during the high-flow event in late October, so the data record ends on 8/21 at 11:00. The air tidbit was removed on 11/4 at 12:45. 45NC21.9 - Nason Creek above Mill Creek This station was located approximately 40 feet upstream of the confluence with Mill Creek. This was a streamflow measurement station only and was used during the August seepage flow run.

Page 128
45NC23.6 - Nason Creek below Forest Road 6700 The instream temperature, air temperature, and piezometer instruments were installed on 6/11 at 10:27. The instruments were located in a riffle downstream of a deep pool. There was a culvert on the right bank about 30 feet upstream from the stations that entered the riffle. There was a small flow exiting the culvert upon installation, but there was no water in the culvert after the spring floods were finished. The instream tidbit appeared to have been in the water during the entire study period when compared to the air thermograph, so no data were cut other than three download artifacts on 8/21 at 8:44, 8/21 at 9:14, and 8/21 at 9:30. The temperature tidbits were removed on 11/4 at 09:20. 45NC26.3 - Nason Creek downstream from confluence with Stevens Creek A continuous stage height recorder was installed at this location. Instream temperature was also recorded. The station was installed on 5/28 and maintained through the summer with multiple discharge measurements to develop a discharge rating curve relative to stage height. The station was removed on 11/4 at 09:50. There was ice and debris built up around the staff gage and stilling pipe before it was removed, and there was ice in the logger housing. All temperature data appeared to be valid, and no further qualification is necessary. 45RC00.1 - Mouth of Roaring and Coulter Creek The instream temperature and air temperature station was installed on 5/22 at 15:30, suspended in the water column on the beaver pond side of the middle culvert. The mouths of Roaring and Coulter Creeks are blocked from naturally entering Nason Creek by the railroad grade which parallels Nason Creek for this reach. Streamflow on these two creeks is impeded by a series of beaver ponds and wetlands. The most downstream beaver pond passes through the railroad grade via three culverts spilling directly into the creek. A field check on 6/11 found the tidbit had been washed out during the high flood event in early June. The instream tidbit was replaced on 6/26 with station 492346 and reinstalled in the same original location. The first tidbit, serial number 383580, was found at the end of the culvert in Nason Creek during an August field check and removed. Serial number 492346 was left to monitor the beaver pond. An air tidbit was installed at this station. It represents the air temperature for Nason Creek, 45NC09.5, which was located on the other side of the railroad grade about 10 feet west. The tidbits were removed on 11/4 at 9:55 hours so the temperature data were cut off at the end of 11/3. Only the water temperature data beginning 6/26 with the new tidbit was included in the final database. Since there was no definitive stream cross-section for measuring streamflow because of the pond, streamflow was measured on Nason Creek both above the culverts and at a cross-section approximately 360 feet downstream from the culverts. Streamflow contribution of Roaring and Coulter Creeks is estimated to be the difference in discharge between the two cross-sections.

Page 129
45ST00.1 - Stevens Creek near mouth The instream temperature and air temperature station was installed on 5/28 at 11:32 hours. The tidbit was lost sometime during early October, and no temperature data were recovered for this site. However, the temperature data for the closest downstream site for Nason Creek did not record any instream temperatures greater than 15.2°C, below the instream temperature standard. An air temperature data set was recovered. The air station was removed on 11/4 at 11:30 hours. The air temperature dataset can be used with the water temperature data recorded with the stream gage on Nason Creek (45NC26.3), because they are spatially very close. 45MN00.1 - Mill Creek near confluence with Nason Creek The instream and air temperature station was installed on 6/25 at 10:48. Comparison of air and water temperatures shows that there was no apparent time that the instream tidbit was exposed directly to the air during the study period. No data needs qualification. The station was removed on 11/4 at 12:10. Peshastin Creek Subbasin 45PC00.3 - Peshastin Creek at mouth This station had a continuous stage height recorder that was at the same location as in 2002. The flow station and air tidbit was installed on 5/27 and started at 17:00. A water tidbit was installed on 7/15 at 16:00 in approximately the same location as in 2002. During a field check on 7/15, the end of the stilling pipe was found to be just above the water surface. The staff reading was 15.36, and the pressure transducer was reading 15.406 feet. The stilling pipe was readjusted and the stage recorder was reset to 15.360, the actual staff reading height. Any water temperature record from the pressure transducer before the 7/15 field check should be considered invalid data at any time the stage was 15.41 feet or less due to the instrument measuring only the air/water interface. A field check on 8/22 found the end of the stilling pipe was approximately half-out of water. The height of the pipe was not adjusted because it could not go any further down. Since there was no mention of the stilling pipe out of the water on 7/23 during a flow measurement and the staff reading was 15.1, all records after 7/15 with a stage record of less than 15.1, before any other corrections, was deemed “out of water” and thus the discharge can only be considered as less than 29.86 cfs. The average difference of the staff gage readings and corresponding stage recordings was .03 which is negligible. Therefore, no stage corrections were made other than deleting invalid data as described above. 45PC01.5 - Peshastin Creek at telemetry streamflow gage This station (also known as 45F070) was located at the continuous streamflow gage operated by Ecology’s Stream Hydrology Unit. The instream temperature was recorded by the pressure transducer on the gage. A piezometer was also located near the stilling well pipe. Temperature and streamflow data were compiled and QA’d by the Stream Hydrology Unit.

Page 130
45PC03.6 - Peshastin Creek downstream of Larsen Creek The instream temperature and air temperature tidbits were installed on 6/9 at 17:18 hours. During the piezometer field check on 7/15, the water tidbit was found to be nearly out of the water so it was moved into deeper water. A check of the water thermograph shows an unusual shift towards high maximum daily temperatures above what the water was previously measured at, so it is assumed that the air temperatures were influencing the tidbit beginning 7/9. Data was cut for the period 7/9 at 00:00 to 7/15 at 13:30 hours. The station was removed on 10/20 at 15:50. The air tidbit would not download in the field or back in the office, the apparent result of a dead battery. The instrument will be sent back to the manufacturer to see if any data can be retrieved. No other data need to be qualified. 45PC05.1 - Peshastin Creek above Mill Creek This streamflow measurement cross-section was located approximately 40 feet upstream of the confluence with Mill Creek. This station was only used during the August seepage flow run. 45PC06.5 - Peshastin Creek above Camas Creek The instream and air temperature station was installed on 6/26 at 11:15. The station was located at the head of a riffle immediately downstream of a very large pool. We were not able to install a piezometer at this station because the streambed material was too large. The instream station encountered no problems during the study period, and no data needs qualification except for a download artifact on 8/22 at 11:38 that was cut from the final dataset. The station was removed on 10/20 at 15:15. 45PC08.4 - Peshastin Creek downstream of Ingalls Creek This station was located approximately 20 feet downstream of the Ingalls Creek road bridge crossing of Peshastin Creek. Installation of instream and air temperature tidbits occurred on 6/9 at 15:54 hours. The water tidbit was downloaded once on 8/22 at 12:25 hours. The air tidbit was removed on 10/20 at 15:05, but the water tidbit was not retrieved because of a flood event that occurred that day. The water tidbit was later retrieved on 11/3 at 14:32. A download artifact on 8/22 12:25 was cut, and the rest of the dataset was acceptable without any other qualifications. 45PC09.1 - Peshastin Creek below Ingalls Creek This continuous temperature monitoring station was operated by the USFS, and the data were compiled and QA’d by the USFS. 45PC09.3 - Peshastin Creek above the Ingalls Creek confluence This continuous temperature monitoring station was operated by the USFS, and the data were compiled and QA’d by the USFS. This station measured streamflow during all seepage flow runs. It also was a staff gage and discharge rating operated by the Stream Hydrology Unit. In addition, it was a time-of-travel study station for collecting water samples for fluorometry.

Page 131
45PC11.0 - Peshastin Creek above the Negro Creek confluence This continuous temperature monitoring station was operated by the USFS, and the data were compiled and QA’d by the USFS. This station measured streamflow during all seepage flow. A relative humidity and air temperature sensor was installed on a tree (approximately 4 feet above the water surface) on the right bank of Peshastin Creek near the Negro Creek confluence on 16 July 2003 and was not removed until 21 April 2004. 45PC12.4 - Peshastin Creek at Culver Gulch This station was located below Culver Gulch on Peshastin Creek. Bedrock was apparent in some places along this reach. Instream temperature, air temperature, and hyporheic temperature tidbits were installed on 6/9 at 14:58 hours. The instream and hyporheic tidbits were within 2 feet of each other. The hyporheic tidbit was buried in a hand-dug hole 0.8 feet deep. There was a small pool about 2 feet deep just upstream of this location. A piezometer could not be installed because of the close proximity of bedrock formations to the streambed surface. The station was removed on 10/20 at 13:52. The record for 8/26 at 14:21 was a download artifact and not a real temperature so it was cut from the final dataset. No other data need qualification. The instream tidbit remained in the water all summer long. 45PC14.9 - Peshastin Creek headwater boundary This station was located approximately 200 feet upstream of the bridge crossing at Forest Road 7320. This station was the headwater boundary for the Peshastin Creek studies. There was a piezometer located here as well as a continuous streamflow gage that was operated by the Stream Hydrology Unit. 45IN00.6 - Ingalls Creek at trailhead The instream temperature and air temperature station was installed on 5/23 at 09:45 hours on Ingalls Creek just beneath the bridge over the creek at the Ingalls Creek trailhead. The water tidbit was checked on 8/22 and was not found. The station was installed in a location that was fairly secure from being blown out, and there were no significant high flows, so we assume the station was vandalized. This location is a well-used trailhead for the Alpine Lakes Wilderness Area so there was a high risk of vandalism. The air tidbit was in close proximity to the water tidbit, but was left untouched. The period of record for air temperatures is good from the installation time to when it was removed on 10/20 at 14:52 hours. However, the air tidbit (serial number 453793) did not pass the post-season accuracy check, with an average difference of .53ºC cooler than the NIST-certified reference thermometer. A correction factor of +.53ºC was applied to the entire data set for 2003. This should not have a great affect on the air data since 0.53ºC is likely to be within the normal variability of the air microclimate at that location. Stream temperature data received from the USFS station above the bridge and the period of record runs through 5/22/03 – 9/25/03.

Page 132
45RB00.0 - Ruby Creek near mouth The instream temperature and air temperature station was installed on 5/23 at 10:30 hours in the thalweg of the small stream on the upstream side of the culvert crossing a forest road at the creek mouth. There was dense shading from riparian vegetation along this reach, and the stream flowed through a steep V-canyon stream valley. The instream tidbit was never exposed to the air. There was no data cut except for one record from 8/26 at 15:17 that was an artifact from the tidbit download. The station was removed on 10/20 at 14:33. The records from 10/20 at 14:17 to the end of the records were cut from the final dataset. 45TC00.1 - Tronsen Creek near mouth The instream temperature and air temperature station was installed on 5/23 at 11:00 hours. At some time on 8/7, the instream tidbit was pulled out of the water and left on the bankside where it was found during a field check and put back into the stream. Data was cut from 8/7 at 00:00 hrs to 8/12 at 11:30 hrs when the tidbit was out of water. The record on 8/26 at 13:55 hours was cut because it was a download artifact. The station was removed on 11/3 at 14:10, so the data from 11/3 at 00:00 to the end of the records were cut from the final dataset. 45LC00.0 - Larsen Creek near mouth This station was located upstream of the last culvert before the confluence with Peshastin Creek. The riparian vegetation at this location was primarily elephant grass which grew densely on both banks. Streamflow was reduced to a trickle and was not measurable during the July seepage run, but the water tidbit remained barely covered with water. By 8/16 streamflow was even more reduced. The amplitude of the diel (24-hour) water temperature oscillations increased but did not match the air temperatures, suggesting the tidbit was not completely covered with water and was affected by air temperatures. However, it could be that those temperatures are real water temperatures. Those data were left in the main dataset but were qualified as questionable. The station was removed on 11/3 at 15:05. 45MP00.0 - Mill Creek near mouth, Peshastin tributary This station was located approximately 10 feet downstream of the road crossing near the mouth of Mill Creek. No problems were encountered with this station during the study period. The air temperature and water temperature tidbits were installed on 5/30 at 10:26. There were two water temperature instruments in this reach because one was dropped and lost at the time of installation and a second one was installed. The dropped tidbit was later found in a debris pile 10 feet downstream submerged in water. It was reinstalled at the flow cross-section which was about 20 feet downstream of the original tidbit. A comparison of the two showed no difference between the two water tidbits. Only one temperature data set was used in the database, but both are included with the original data. No data need to be qualified. The station was removed on 11/3 at 14:50.

Page 133
45CA00.2 - Camas Creek at Hwy 97 The instream temperature and air temperature station was installed on 5/23 at 09:00 hours when the stream wet width was 7.6 feet. Camas Creek was found to be dry during a field check in early July. A comparison of instream temperature and the paired air temperature station found the creek to have dropped below the instream tidbit sometime between 7/3 and 7/7. The last reliable measurements were on 7/3 so the data were cut after that date. The air temperature instrument was removed on 11/3 at 14:45, and all of the data are good. The dataset was cut to end at 11/2 at 23:30. The air tidbit was installed in a shade device and located in dense deciduous and shrubby vegetation near the streambed. 45NG00.0 - Negro Creek at mouth The instream and air temperature station was installed on 6/26 at 11:45. The station was located near the rock gabions approximately 20 feet from the confluence with Peshastin and was unaffected by water from Peshastin Creek. During the seepage run on 8/12, the instream tidbit was found pulled out and lying on the bank. A comparison of the air and stream temperatures determined it was pulled out of the water at some point on 8/10 after 16:00. The data from 8/10 at 16:00 to 8/12 at 10:30 were cut from the final dataset. A download artifact on 8/26 at 14:48 was also cut. No other data needs qualification. The station was removed on 10/20 at 14:15. USFS Data Continuous temperature data from the Lake Wenatchee/Leavenworth Ranger District for Mission, Peshastin, and Nason sub-basins was included for the following stations:
• Ingalls Creek (aka2 45IN00.6) • Peshastin Creek above Ingalls Creek confluence (aka 45IN9.3) • Peshastin Creek below Ingalls Creek confluence (aka 45PC09.1) • Peshastin Creek above Negro Creek confluence (aka 45PC11.0) • Nason Creek near mouth (aka 45NC00.3) • Nason Creek (aka 45NC04.4) • Sand Creek near Mission Creek confluence (aka 45SN00.3) • Whitepine Creek near mouth (aka 45WP00.0) There was also daily max, min, and average temperature data from an aquarod operated by the USFS on Mission Creek (aka 45MC09.2). Detailed information about the stations operated by the U.S. Forest Service is reported in: “Karrer, Matt, 2003. Temperature Monitoring Wenatchee National Forest Leavenworth and Lake Wenatchee Ranger Districts. USFS.” All temperature data were compiled and qualified by the USFS. 2 also known as