
An Energy Conservation Presentation - Valhalla Union Free School
Upload
trinhkhanhCategory
view
216download
3
“Well Results at Valhalla, Wembley and Progress Confirm A Significant & Growing Liquids Rich Drill Inventory. First Wembley Well with Liquids Yield up to 277 bbls/mmcf & Condensate Yields up to 211 bbls/mmcf”
TSX / NYSE: AAVInvestor Presentation March 2018

ADVANTAGE AT A GLANCE
2
TSX 52-week trading range $3.48 - $9.29
Shares Outstanding (basic) 186 million
Market Capitalization $0.7 billion
2017 Production (16% Growth) 236 mmcfe/d (39,315 boe/d)Operating Costs (7% Reduction) $0.25/mcfe ($1.50/boe)Total Cash Costs (8% Reduction) $0.88/mcfe ($5.28/boe)
2018 Guidance (10% Growth) 255 to 265 mmcfe/d (42,500 to 44,170 boe/d)Total Cash Costs $1.10/mcfe ($6.60/boe)
As of December 31, 2017:
Bank Debt (52% drawn on $400 million Credit Facility) $209 million
Total Debt (including working capital deficit) $223 million
Total Debt/Trailing 12 Month Cash Flow 1.2x

MONTNEY LANDS PROVIDE NATURAL GAS AND LIQUIDS DEVELOPMENT FOR DECADES - TOTAL 200 NET SECTIONS (128,000 ACRES)
Glacier
90 net
sections
Wembley/
Pipestone
Valhalla
100% owned
Glacier Gas
Plant
Progress (39 sections)
(40 sections)
(31 sections)
Alb
ert
a
B.C
.
3
Only 4% of our liquids rich lands have been drilled
Total 110 net sections at Valhalla, Wembley& Progress acquired for a total of $19 million since 2013
Up to 5 layers of dry and liquids rich gas across AAV land blocks
Future drilling inventory >1,200 locations and growing
4 well pad success 6,410 boe/d (32 mmcf/d gas + 1,075 bbls/d liquids) with certain yields >100 bbls/mmcf, 90% C5+/oil)
6 miles
First Montney well 624 boe/d with 172 bbls/d liquids including 75 bbls/d wellhead C5+/oil
First Montney well 1,312 boe/d with 819 bbls/d liquids including 624 bbls/d wellhead C5+/Oil
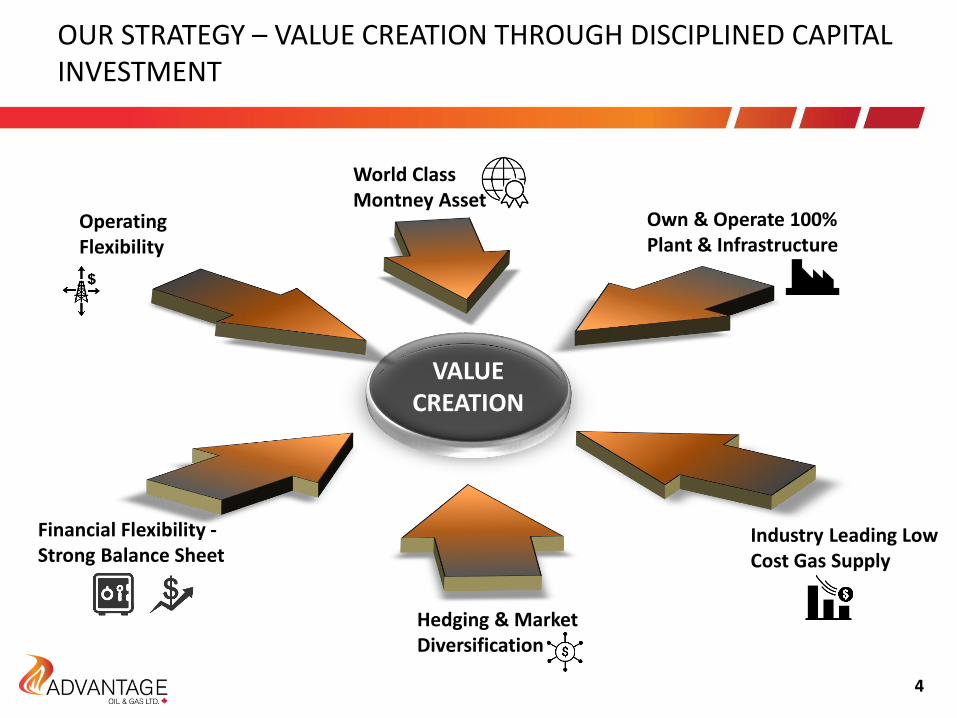
Hedging & Market Diversification
World Class Montney Asset
Own & Operate 100% Plant & Infrastructure
Industry Leading Low Cost Gas Supply
Financial Flexibility -Strong Balance Sheet
Operating Flexibility
VALUECREATION
OUR STRATEGY – VALUE CREATION THROUGH DISCIPLINED CAPITAL INVESTMENT
4

SIGNIFICANT OPTIONALITY FOR 2018 AND BEYOND THROUGH FINANCIAL & OPERATIONAL FLEXIBILITY
5
28% % of 2018 Revenue exposed to AECO prices
37% % of 2018 Production Hedged at average Cdn $3.21/mcf
$1.10 Cdn/mcfe Total Corporate cash costs (includes transportation)
$1.20 Cdn/mcf AECO price to maintain production at YE 2018
1.2x to 1.4x YE 2018 Total Debt to Trailing Cash Flow(AECO Cdn $1.50/mcf to $1.75/mcf)
5/18/50% # current completed / uncompleted wells / % liquids rich
<4% Liquids rich acreage drilled to date
>1,200 Current drill inventory (Glacier & Valhalla only)
100% Ownership of Glacier gas plant & pipeline Infrastructure (significant process capacity to accommodate years of growth)
<26% Decline rate/annum
Gas Gathering System Connected to Valhalla, extendable to Wembley / Progress areas
TCPL/Alliance Connected to both sales pipes (Q4 2018 Alliance)
Notes: (1) Management estimates or illustrated in following presentation pages
FIN
AN
CIA
L
(1)
OP
ERA
TIN
G
(1)

Other $10
Plant & Value Add Facilities
$85
Well Operations
$80
2018 Cash Flow2018 Capital Estimate
(1) Midpoint of 2018 Guidance Range. (2) Based on an average AECO Cdn $1.75/mcf to $2.25/mcf ($1.66/GJ to $2.13/GJ) and average Dawn US $2.85/mmbtu natural gas
price for 2018 and Advantage’s current hedge positions
$175-$200
($ million)
2018 BUDGET FOCUSES ON LIQUIDS GROWTH & RETAINS FLEXIBLITY
$175
2018 Highlights (1) (2)
• $175 to $200 Million Cash Flow & Positive Income
• 1.0 to 1.3x Year-end 2018 Total Debt/Cash Flow
• 260 MMcfe/d (43,330 boe/d) Average Production
• 255 to 265 mmcfe/d Annual Range
• 10% Annual Production Growth
• 50% Annual Liquids Production Growth to 1,900 bbls/d (73% C5+)
• $30 Million to Advance Liquids Development at Valhalla, Wembley and Progress
• Complete Glacier Gas Plant Expansion to 400 mmcf/d & 6,800 bbls/d of liquids extraction
• $1.10/mcfe Total Cash Costs
• $11,400/boe/d All-In Capital Efficiency
6
$145
$30
Glacier Valhalla, Wembley, Progress

$128
$249
$175
2016 2017 2018E
Capital Expenditures
203236
260
2016 2017 2018E
Annual Average Production(mmcfe/d)
2016 2017 2018E
Operating costs Royalties incl. GCA adjustments
Transportation G&A and interest
$0.93 $0.88
$1.10
Total Cash Costs ($/Mcfe)(1)(2)
$7,330
$17,000
$11,400
2016 2017 2018E
ALL-IN Capital Efficiency($/boe/d)(3)
915 1,218
1,900
2,400
2016 2017 2018E 2018Exit
Liquids Production
2018 BUDGET AT A GLANCE
(1)Transportation costs shown includes natural gas transportation for all years. Prior to November 2016, our financial reports included gas transportation as a deduction to revenue.
(2) Includes Dawn transportation costs effective November 2017 for direct sales to the Dawn, Ontario hub realizing higher revenue.(3) Capital Efficiency calculated using 29% per annum decline and includes all annual capital.(4) Includes an average 2018 Dawn natural gas price of US$2.85/mmbtu.
33%
7
($ million)
16%
10%
-33%
-30%
56%
NOTES:
(bbls/d)
(3)
25% 3yr average $11,9101.2
1.4
1.21.1
1.2
0.8
2017 2018E
Total Debt to Trailing Cash Flow Sensitivity to AECO(4)
AECO $1.50/mcf
AECO $2.00/mcf
AECO $2.50/mcf

56% @$3.08
25% @$2.99 15% @
$2.71
5% @$4.42
12% @$3.67
2% @$4.01
2018 Q1 2018 Calendar 2019 Calendar
AECO Fixed Dawn Fixed
8
Advantage has exposure to commodity price risk at various market hubs and has fixed prices at multiple markets. Theseprices represent average Cdn prices based on fixed price hedges secured to date converted at an average Fx of $0.78.
61% @ $3.18
37% @ $3.21
17% @ $2.89
% of estimated natural gas production , net of royalties
$/Mcf Cdn
STRONG NATURAL GAS FIXED PRICE HEDGES
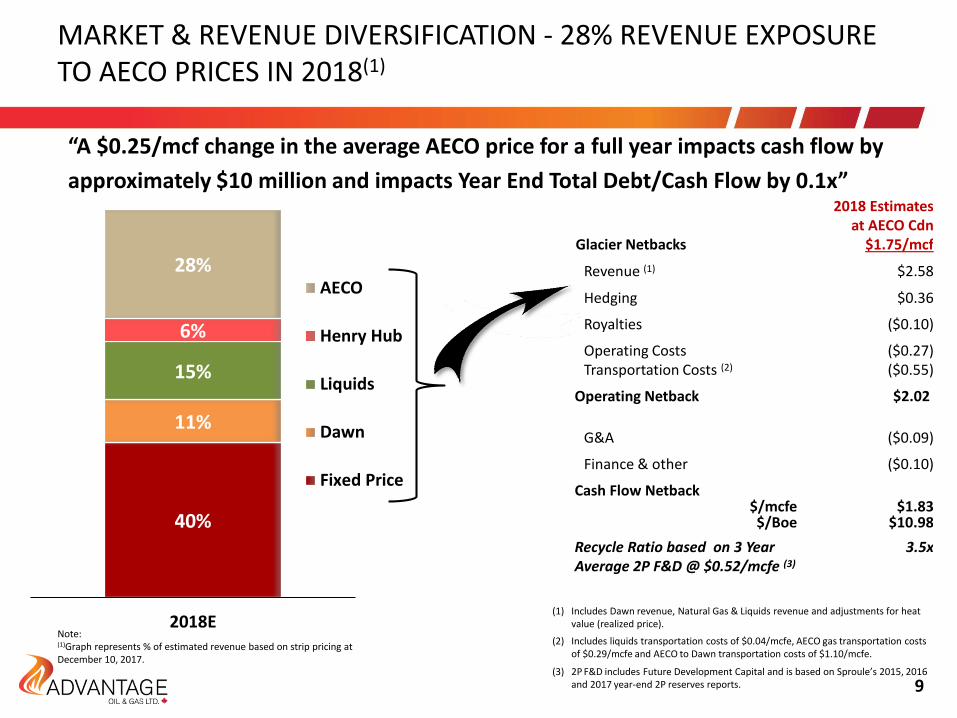
40%
11%
15%
6%
28%
2018E
AECO
Henry Hub
Liquids
Dawn
Fixed Price
9
Note:(1)Graph represents % of estimated revenue based on strip pricing at December 10, 2017.
MARKET & REVENUE DIVERSIFICATION - 28% REVENUE EXPOSURE TO AECO PRICES IN 2018(1)
“A $0.25/mcf change in the average AECO price for a full year impacts cash flow by
approximately $10 million and impacts Year End Total Debt/Cash Flow by 0.1x”
Glacier Netbacks
2018 Estimates at AECO Cdn
$1.75/mcf
Revenue (1) $2.58
Hedging $0.36
Royalties ($0.10)
Operating Costs Transportation Costs (2)
($0.27)($0.55)
Operating Netback $2.02
G&A ($0.09)
Finance & other ($0.10)
Cash Flow Netback$/mcfe$/Boe
$1.83 $10.98
Recycle Ratio based on 3 Year Average 2P F&D @ $0.52/mcfe (3)
3.5x
(1) Includes Dawn revenue, Natural Gas & Liquids revenue and adjustments for heat value (realized price).
(3) 2P F&D includes Future Development Capital and is based on Sproule’s 2015, 2016 and 2017 year-end 2P reserves reports.
(2) Includes liquids transportation costs of $0.04/mcfe, AECO gas transportation costs of $0.29/mcfe and AECO to Dawn transportation costs of $1.10/mcfe.

NATURAL GAS TRANSPORTATION SERVICE & ADDITIONAL MARKET DIVERSIFICATION IN PLACE
2018 2019 2020 2021Sales Gas Target Firm Contracted Service
TCPL Transportation Service 393 mmcf/d as of April,
2021
Alliance Pipeline Connection Proceeding
Glacier gas plant
Proceeding with Alliance meter station connection for 2018
Alliance
TCPL
TCPL Meter Station
Alliance Meter Station
• Increasing firm service secured to 2021
• Ability to reduce future total service commitments through evergreen contract renewals
• New Alliance meter station planned for 2018
• Chicago/Ventura physical contracts:
November 2018 20,000 mmbtu/d2019 35,000 mmbtu/d 2020 62,500 mmbtu/d
• 19 mmcf/d 2018 and 25 mmcf/d 2019 Henry Hub at basis of US$0.95/mmbtu and US$0.90/mmbtu
10
Market Diversification

INDUSTRY LEADING LOW COSTS GENERATES STRONG NETBACK MARGINS AMONGST DRY OR LIQUIDS RICH GAS PRODUCERS
11
ARX KEL NVA CR TOU BIR AAV PEY
$0.00
$1.00
$2.00
$3.00
$4.00
$5.00
$6.00
$/m
cfe
2017 Total Cash Costs Including PDP FD&A
2017 PDP FD&A 2017E Cash Costs (Excludes Hedging Gains)
48%44%
51%
45%
58%
52%
66%
73%
ARX KEL NVA CR TOU BIR AAV PEY
2017 Netbacks Percentage of Revenue
Source: TD Securities data based on company’s 2017 actuals reported as of March 1, 2018.

$95million
$115 million
280 mmcfe/d Q42018
AECO $1.20/Mcf Cash Flow at AECO $2.50/Mcf
$215 Million
MAINTENANCE CAPITAL AND SURPLUS CASH FLOW SENSITIVITY ILLUSTRATIVE AT 280 MMCFE/D (Q4 2018)
Notes (1) Assumes 7.5 mmcf/d /7.5 Bcf for Upper/Lower Montney wells and 5.0 mmcf/d /5.0 Bcf for Middle Montney wells(2) Assumes 9 mmcf/d /9 Bcf for Upper/Lower Montney wells and 6 mmcf/d /6 Bcf for Middle Montney wells(3) Assumes Dawn at $3.30/mcf and a WTI price of $55 US/bbl.
Based on average well type curve (1)
Basedon top quartile
type well (2)
Cash Surplus
$100 millionper Year
3 Year Cumulative
Surplus
$300 million
(NO HEDGING INCLUDED)
$115 Million
“Surplus Cash Flow Above
$1.20/mcf”
12
(3)
CASH FLOWMAINTENANCE CAPITAL

13
ONGOING VALUE CREATION FROM OUR HIGH QUALITY ASSETS THROUGH OPERATIONAL EXCELLENCE

ADVANTAGE’S LAND BLOCKS ARE IN A LIQUIDS RICH MONTNEYFAIRWAY – CONFIRMATION THROUGH RECENT DRILLING SUCCESSES
14
Source: Canadian Discovery Digest/Advantage
Progress
Wembley
Valhalla
Glacier
ProgressGlacier Valhalla Wembley
Upper Montney(Dry at Glacier to C3+ 40 bbls/mmcf at Valhalla)
Middle Montney(C3+ 20 to >250 bbls/mmcf. 50% to 90% C5+/Oil)
Lower Montney(C3+ 0 to 60 bbls/mmcf)
Source: Canadian Discovery Digest/Advantage
Recent Advantage Evaluation/Delineation wells
Wells drilled within last 18 months
15
Glacier
Pipestone
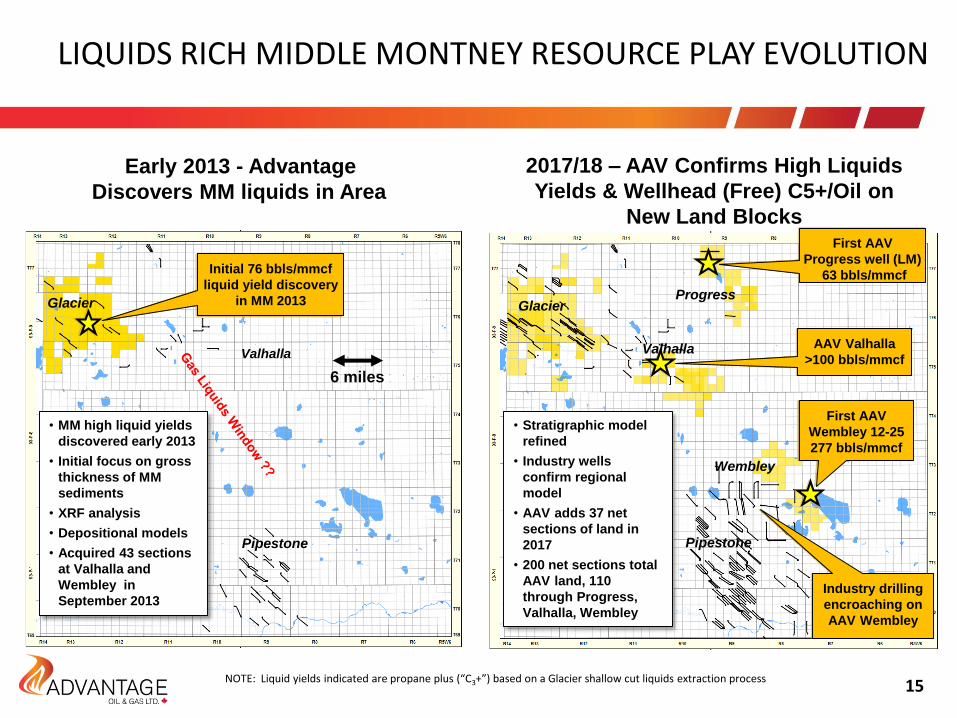
2017/18 – AAV Confirms High Liquids
Yields & Wellhead (Free) C5+/Oil on
New Land Blocks
ProgressGlacier
Valhalla
Wembley
Pipestone
Early 2013 - Advantage
Discovers MM liquids in Area
Initial 76 bbls/mmcf
liquid yield discovery
in MM 2013
• MM high liquid yields
discovered early 2013
• Initial focus on gross
thickness of MM
sediments
• XRF analysis
• Depositional models
• Acquired 43 sections
at Valhalla and
Wembley in
September 2013
Valhalla
First AAV
Progress well (LM)
63 bbls/mmcf
AAV Valhalla
>100 bbls/mmcf
First AAV
Wembley 12-25
277 bbls/mmcf
Industry drilling
encroaching on
AAV Wembley
• Stratigraphic model
refined
• Industry wells
confirm regional
model
• AAV adds 37 net
sections of land in
2017
• 200 net sections total
AAV land, 110
through Progress,
Valhalla, Wembley
LIQUIDS RICH MIDDLE MONTNEY RESOURCE PLAY EVOLUTION
6 miles
NOTE: Liquid yields indicated are propane plus (“C3+”) based on a Glacier shallow cut liquids extraction process

WEMBLEY FIRST DELINEATION WELL – C3+ LIQUIDS YIELD OF 277 BBLS/MMCF
16
CNQ:
On 2016/05
Cum Oil:
130,000 bbls to
2017/11
(19 months)
CNQ:
On 2016/09
Cum Oil:
102,000 bbls to
2017/11
(15 months)
T72
R8
T73
R9
T71
R7
CNQ:
On 2017/06
Cum Oil:
67,000 bbls to
2017/11
(5 months)
Kelt
On 2017/08
Cum Oil:
30,000 bbls to
2017/11
(4 months)
BlackbirdKeltECACNRL Cenovus Pipestone
AAV First Wembley
Well 12-25
Mid Montney
“Pipestone Member”
Liquids Target
Advantage’s First Delineation Well 12-25-72-8w6
• Lateral Length 2,254 meters
• 38 frac stages
• 1,312 boe/d average rate (2.9 mmcf/d gas)
• 624 bbls/d free condensate/oil (47 deg API)
• 819 bbls/d C3+ liquids (shallow cut)
• Wellhead (free) C5+ 211 bbls/mmcf
• C3+ 277 bbls/mmcf
• Liquids yield increasing over test period with load fluid recovery
• Only 34% load fluid recovered
• Only 20% reservoir pressure drawdown during flow up production casing
• Limited testing time due to lack of area process capacity
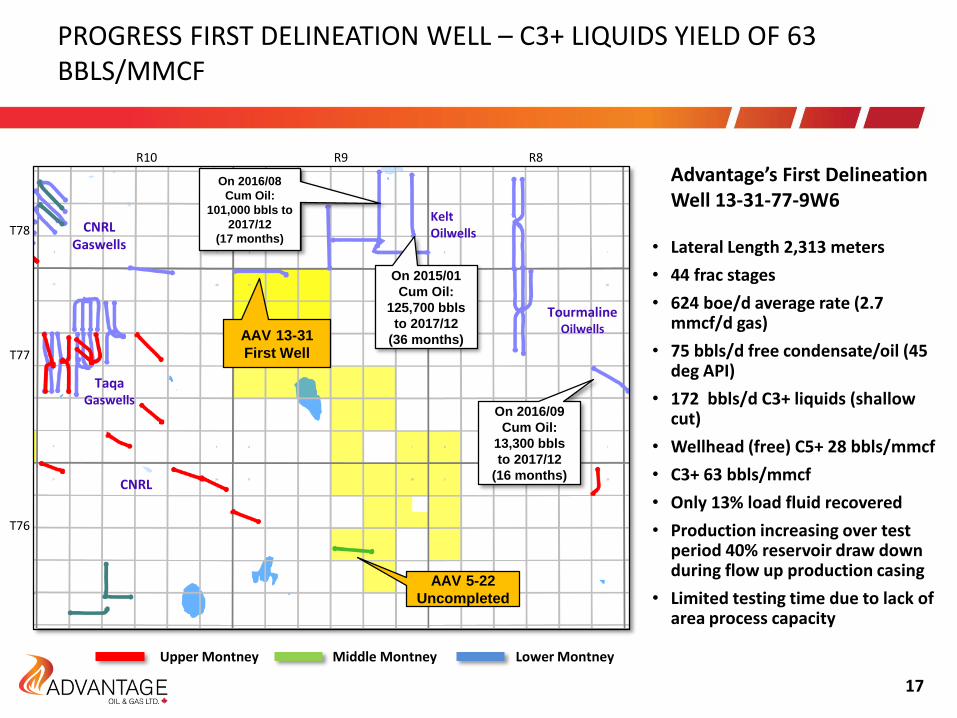
Upper Montney Middle Montney Lower Montney
TaqaGaswells
CNRL Gaswells
KeltOilwells
AAV 13-31
First Well
TourmalineOilwells
T77
T76
T78
R8R10 R9
CNRL
On 2015/01
Cum Oil:
125,700 bbls
to 2017/12
(36 months)
On 2016/08
Cum Oil:
101,000 bbls to
2017/12
(17 months)
On 2016/09
Cum Oil:
13,300 bbls
to 2017/12
(16 months)
AAV 5-22
Uncompleted
Advantage’s First Delineation Well 13-31-77-9W6
• Lateral Length 2,313 meters
• 44 frac stages
• 624 boe/d average rate (2.7 mmcf/d gas)
• 75 bbls/d free condensate/oil (45 deg API)
• 172 bbls/d C3+ liquids (shallow cut)
• Wellhead (free) C5+ 28 bbls/mmcf
• C3+ 63 bbls/mmcf
• Only 13% load fluid recovered
• Production increasing over test period 40% reservoir draw down during flow up production casing
• Limited testing time due to lack of area process capacity
PROGRESS FIRST DELINEATION WELL – C3+ LIQUIDS YIELD OF 63 BBLS/MMCF
17

AREA INFRASTRUCTURE PLANNING
18
Glacier
Wembley/
Pipestone
Valhalla
100% owned Glacier
Gas Plant, 400 mmcf/d
& 6,800 bbls/d liquids
Progress
Alb
ert
a
B.C
.
~16km (10 MILES)
New Compressor and
Liquids Handling
Facility (Q4 2018)
Evaluating options to transport and process production from our land blocks to Advantage’s 100% owned Glacier gas plant to access spare capacity, low cost structure & economies of scale
AAV 100% owned
existing gathering
pipeline

SIGNIFICANT AND GROWING LIQUIDS & DRY GAS DRILLING INVENTORY
(1) Management Estimates(2) Based on Sproule December 31, 2017 Reserves Report(3) As of December 31, 2017, gross Hz wells (includes producing and standing
developed wells)
*Interval 6 not assigned reserves or resourceLiquids Rich intervals Ranges from C3+ yields of 20 to >250 bbls/mmcf (45% to 90% C5+)
19
Multi-Layer Montney Development Potential across Advantage Land Blocks
Upper115
Lower51
Middle31
>900Glacier & Valhalla
Undrilled
3372P Reserves
Undeveloped Locations Booked(2)
>1,200 Future Drilling Locations(1)
Proved Developed Wells by Layer(3)
TOTAL 197
# of locations are expected to grow as delineation drilling continues at Valhalla, Wembley & Progress
20
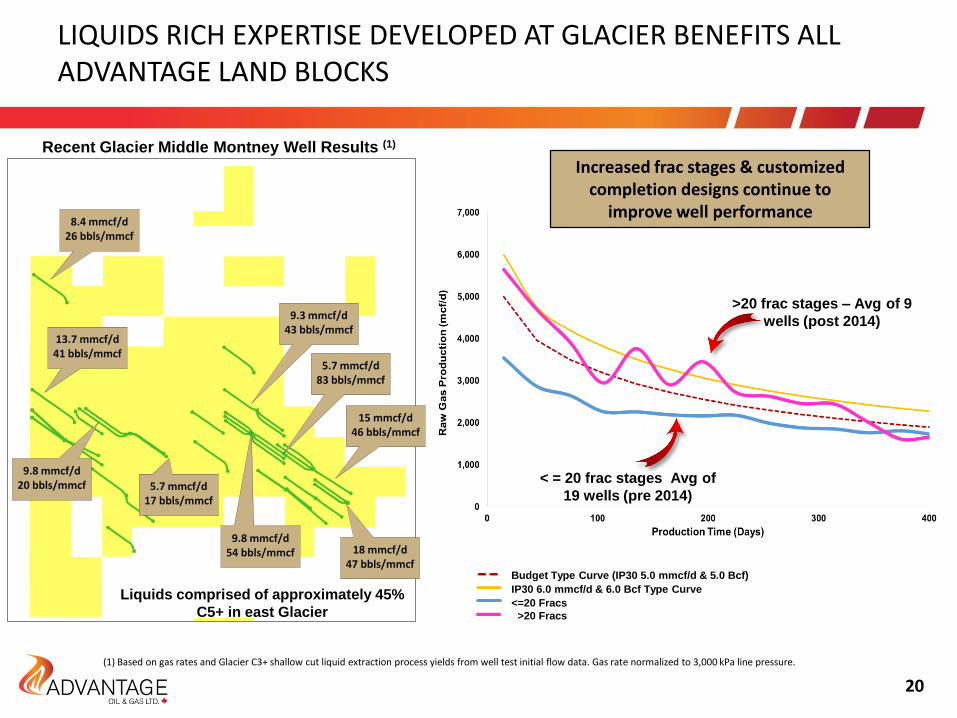
9.3 mmcf/d43 bbls/mmcf
9.8 mmcf/d54 bbls/mmcf
5.7 mmcf/d83 bbls/mmcf
18 mmcf/d47 bbls/mmcf
15 mmcf/d46 bbls/mmcf
5.7 mmcf/d17 bbls/mmcf
9.8 mmcf/d20 bbls/mmcf
13.7 mmcf/d41 bbls/mmcf
8.4 mmcf/d26 bbls/mmcf
(1) Based on gas rates and Glacier C3+ shallow cut liquid extraction process yields from well test initial flow data. Gas rate normalized to 3,000 kPa line pressure.
LIQUIDS RICH EXPERTISE DEVELOPED AT GLACIER BENEFITS ALL ADVANTAGE LAND BLOCKS
Budget Type Curve (IP30 5.0 mmcf/d & 5.0 Bcf)
IP30 6.0 mmcf/d & 6.0 Bcf Type Curve
<=20 Fracs
>20 Fracs
Recent Glacier Middle Montney Well Results (1)
Liquids comprised of approximately 45%
C5+ in east Glacier
Increased frac stages & customized completion designs continue to
improve well performance
>20 frac stages – Avg of 9
wells (post 2014)
< = 20 frac stages Avg of
19 wells (pre 2014)

Budget Type Curve (IP30 7.5 mmcf/d &
7.5 Bcf)
Longer Laterals, More Frac Stages
3 LM wells average 2,583 meters (longest 2,880 meters)
28 frac stages, 60 tonnes/stage
Avg cost DCE&T $4.3 million/well
1 MM well 2,502 meters, 26 frac stages
11.3 mmcf/d, 30 bbls/mmcf C3+, $5.1 million DCE+T
5-168 Well Pad
Lower Montney
Middle Montney
Upper Montney
DRY GAS EXPERTISE CONTINUES TO IMPROVE WELL ECONOMIC THRESHOLDS AT GLACIER – 8 WELL PILOT PAD ON-PROD 2016
Shorter Laterals Evaluating Spacing & Recovery3 LM wells average 1,656 meters
Avg cost $3.7 million/well DCE&T
Budget Type Curve (IP30 7.5 mmcf/d
& 7.5 Bcf)
21
Wells producing at ~10 mmcf/d after 365
days – exceeding type curve
Production updated to December, 2017
1.3 year payout at Cdn
$2.00/mcf gas price
Top Tier LM wells

LIQUIDS RICH – EAST GLACIER MIDDLE MONTNEY WELL ECONOMIC SENSITIVITY
(1)
Middle Montney at 50 bbls/mmcf C3+ (2)
(1) Management estimates. NPV 10% pre-tax. (2) Capital of $4.8 million per well based on management’s estimate of DCE+T capital cost and includes a 4 month drill to on-production timeframe(3) Natural gas and NGL prices and costs escalated at 1.5%. Average C3+ Cdn NGL price of $37/bbl based on U.S.$55/bbl WTI. C3+ NGL yields of 50 bbls/mmcf raw gas
(3)
Break-even below $1.50 Cdn gas price
at U.S. $55/bbl WTI
22

DRY GAS – GLACIER UPPER & LOWER MONTNEY WELL ECONOMIC SENSITIVITY(1)
(1) Management estimates. NPV 10% pre-tax. (2) Capital of $4.8 million per well based on management’s estimate of DCE+T capital cost and includes a 4 month drill to on-production timeframe(3) Natural gas and NGL prices and costs escalated at 1.5%. Average C3+ Cdn NGL price of $37/bbl based on $55 U.S./bbl WTI
Upper & Lower Montney Dry Gas (2)
Break-even approximately
$1.50/mcf Cdn with top tier
Glacier dry gas wells
(3)
23

GLACIER DRY GAS VS LIQUIDS RICH WELL ECONOMIC COMPARISON(1)
24
At <$2.25/mcf Cdn price and $55 U.S/bbl WTI, Glacier’s
average liquids rich type curve (5/5) generates stronger well
economics than dry gas wells <= 9 mmcfd IP30 & 9 Bcfe EUR
(1) Management estimates. NPV 10% pre-tax. (2) Capital of $4.8 million per well based on management’s estimate of DCE+T capital cost and includes a 4 month drill to on-production timeframe(3) Natural gas and NGL prices and costs escalated at 1.5%. Average C3+ Cdn NGL price of $37/bbl based on $55 U.S./bbl WTI
Dry Gas vs Liquids Rich (2)
(3)

100% Owned Glacier Gas Plant – Positioned for Production Ramp-up
Glacier Gas Plant Site near Major Natural Gas & Liquids Pipelines & Rail Access
Sales Pipeline Loop capacity of 400 mmcf/d (Glacier plant to NW TCPL Mainline)
Total TCPL Natural Gas Firm Transportation Service of 393 mmcf/d by 2021 Secured
GROWTH BEYOND 400 MMCF/D CAN BE ACCOMMODATED ON EXISTING PLANT SITE
TCPL Sales Meter Stations
Advantage Gas Plant
Company LandCompany Gas PlantTransCanada PipelinePembina PipelineAdvantage PipelineAlliance Pipeline
400 mmcf/d take away
capacity to TCPL NW main sales
gas pipeline
Pembina NGL Line
Alliance Sales Gas Line
Room for Additional Expansion Beyond 400 mmcf/d Expanding from 250
to 400 mmcf/d & 6,800 bbls/d
processing capacity
TCPL NW ALBERTA Main Sales Gas Line
New Alliance Meter Station to be Installed 2018
25

Clear Vision for GrowthFinancial StrengthProven Expertise

APPENDIX

2018 BUDGET & GUIDANCE RANGE
Average Annual Production 255 to 265 mmcfe/d(42,500 to 44, 170 boe/d)
Liquids Annual 1,900 bbls/d
Liquids Exit 2,400 bbls/d
Royalty Rate 3% to 5%
Operating Costs ($/mcfe) $0.25 to $0.29
Transportation Costs ($/mcfe) $0.52 to $0.58
Total Corporate Cash Costs ($/mcfe) $1.00 to $1.20
Capital Expenditures $175 million
28

GLACIER – LOCATED IN THE HEART OF THE MONTNEY RESOURCE PLAY
Montney Siltstone Comparison:
• 700 times more permeability
• 4x more formation thickness
• Very low clay content
• Liquids & Improved well efficiencies strong economics
Up to 83 bbls/MMcf
29
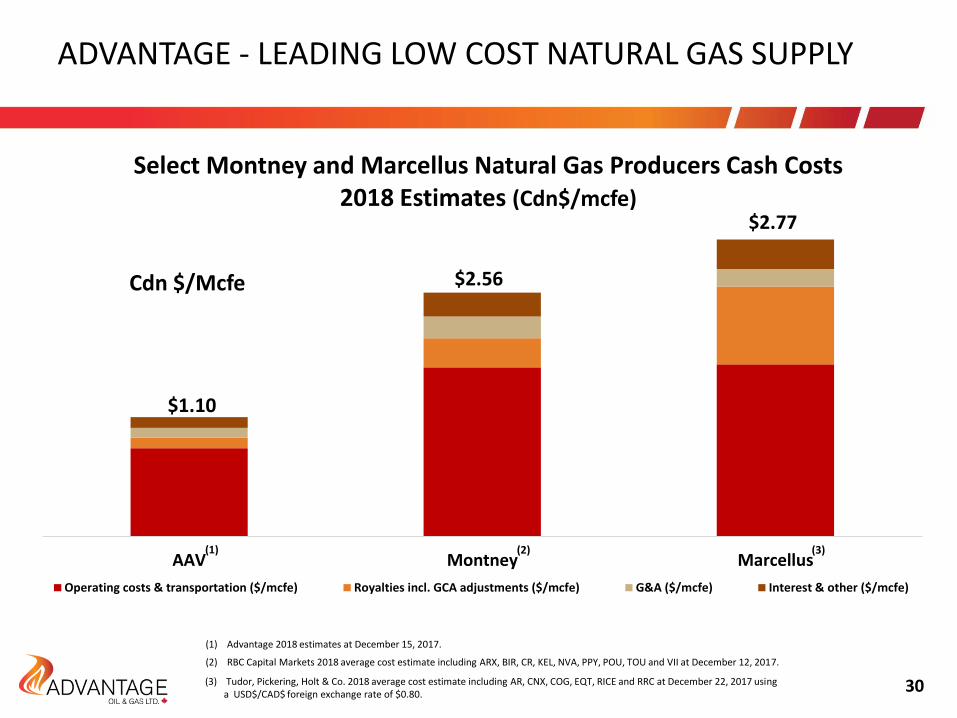
AAV Montney Marcellus
Select Montney and Marcellus Natural Gas Producers Cash Costs 2018 Estimates (Cdn$/mcfe)
Operating costs & transportation ($/mcfe) Royalties incl. GCA adjustments ($/mcfe) G&A ($/mcfe) Interest & other ($/mcfe)
$1.10
$2.56
$2.77
(3)
ADVANTAGE - LEADING LOW COST NATURAL GAS SUPPLY
(1) Advantage 2018 estimates at December 15, 2017.
(2) RBC Capital Markets 2018 average cost estimate including ARX, BIR, CR, KEL, NVA, PPY, POU, TOU and VII at December 12, 2017.
(3) Tudor, Pickering, Holt & Co. 2018 average cost estimate including AR, CNX, COG, EQT, RICE and RRC at December 22, 2017 using a USD$/CAD$ foreign exchange rate of $0.80.
Cdn $/Mcfe
(1) (2)
30

RETURN ON AVERAGE CAPITAL EMPLOYED COMPARISON5-YEAR AVERAGE (2013 TO 2017 ESTIMATE)
31
Notes:1. Advantage return on average capital employed (ROACE) is calculated by Management for the development of Glacier, Valhalla, Progress and Wembley
since inception (legacy property disposition impacts have been excluded).
2. Comparative data is based on Macquarie Research September 11, 2017 and Peers Average includes ARX, BIR, BNP, CR, KEL, NVA, PEY, POU and VII.
3. ROACE as defined by Macquarie Research includes revenue and realized hedging gains/losses less royalty expense, operating expense, transportation expense, G&A expense, depreciation expense and income taxes (excludes unrealized hedging gains/losses and financing expense after taxes) divided by average capital employed.
Before tax 7.9%
3.9%
3.9%
3.5%
0.8%
5.2%
1.4%
After tax 5.6%
US Small/Mid Caps Average
US Large Caps Average
Cdn Yields Average
Cdn Small/Mid Caps Average
Cdn Large Caps Average
Peers Average
Advantage Montney Development
Comparative data is shown on an after-tax basis. Advantage was not taxable in the last 5 years and is not expected to be taxable for the next 5 years or more due to its significant tax pools.

CONTINUOUS IMPROVEMENT HAS CREATED INDUSTRY LEADING EFFICIENCIES
32
Production restrictions
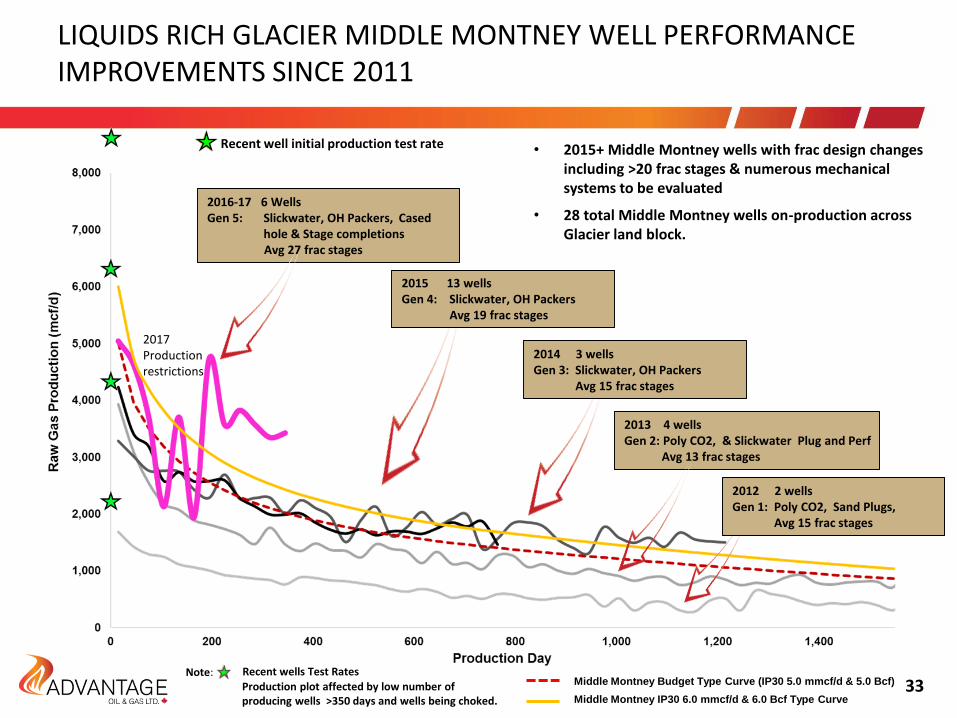
LIQUIDS RICH GLACIER MIDDLE MONTNEY WELL PERFORMANCE IMPROVEMENTS SINCE 2011
• 2015+ Middle Montney wells with frac design changes including >20 frac stages & numerous mechanical systems to be evaluated
• 28 total Middle Montney wells on-production across Glacier land block.
2013 4 wellsGen 2: Poly CO2, & Slickwater Plug and Perf
Avg 13 frac stages
Note: Production plot affected by low number of producing wells >350 days and wells being choked.
2012 2 wellsGen 1: Poly CO2, Sand Plugs,
Avg 15 frac stages
2014 3 wellsGen 3: Slickwater, OH Packers
Avg 15 frac stages
2015 13 wellsGen 4: Slickwater, OH Packers
Avg 19 frac stages
Middle Montney Budget Type Curve (IP30 5.0 mmcf/d & 5.0 Bcf)
Middle Montney IP30 6.0 mmcf/d & 6.0 Bcf Type Curve
2016-17 6 WellsGen 5: Slickwater, OH Packers, Cased
hole & Stage completionsAvg 27 frac stages
33
2017Production restrictions
Recent wells Test Rates
Recent well initial production test rate
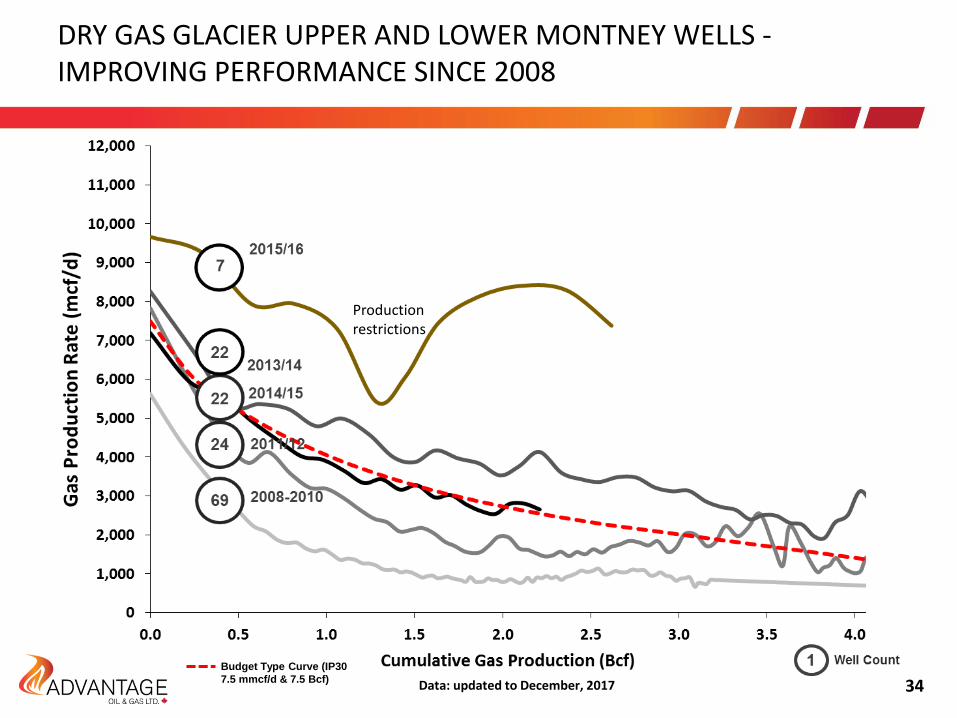
DRY GAS GLACIER UPPER AND LOWER MONTNEY WELLS -IMPROVING PERFORMANCE SINCE 2008
Data: updated to December, 2017
Budget Type Curve (IP30
7.5 mmcf/d & 7.5 Bcf)
Production restrictions
34

GLACIER MONTNEY ASSIGNED 2P EUR PER WELL & INTERVAL
(1) Based on Sproule 2017 year-end reserve reports. Indicated raw gas volumes per well. 35
Glacier - 2P Recoveries per Interval(1)
Interval
# of Gross HZ Wells 2P Recovery [bcf/well]
Developed Undeveloped Total Developed Undeveloped Total
YE 2015
YE 2016
YE 2017
YE 2015
YE 2016
YE 2017
YE 2015
YE 2016
YE 2017
YE 2015
YE 2016
YE 2017
YE 2015
YE 2016
YE 2017
YE 2015
YE 2016
YE 2017
1 UM 100 103 111 148 141 133 248 244 244 4.7 4.9 5.1 5.5 5.9 5.8 5.2 5.4 5.5
2 MM 10 12 15 43 52 65 53 64 80 4.7 5.8 5.6 4.8 5.2 5.6 4.8 5.3 5.6
3 MM 7 8 10 23 25 35 30 33 45 4.6 4.5 4.4 4.2 4.1 4.4 4.3 4.2 4.4
4 MM 2 2 3 0 5 11 2 7 14 3.7 6.1 7.4 0.0 5.9 6.6 3.7 6.0 6.7
5 LM 34 43 51 83 84 81 117 127 132 5.6 7.1 7.7 5.9 6.4 6.5 5.8 6.6 6.9
Total 153 168 190 297 307 325 450 475 515
Interval
# of Gross HZ Wells 2P Recovery [bcf/well]
Developed Undeveloped Total Developed Undeveloped Total
YE
2015
YE
2016
YE
2017
YE
2015
YE
2016
YE
2017
YE
2015
YE
2016
YE
2017
YE
2015
YE
2016
YE
2017
YE
2015
YE
2016
YE
2017
YE
2015
YE
2016
YE
2017
1 UM 2 4 5 0 2 9 2.9 6.6 7.9 2.9 7.3
2 MM 1 2 5 0 1 7 4.4 4.3 4.1 4.4 4.2
3 MM 1 2 0 0 3 2.1 2.1 2.1
Total 0 3 7 0 0 12 0 3 19
Valhalla - 2P Recoveries per Interval(1)

Certain statements contained in this presentation constitute forward-looking information, which relate to future events or our future performance. All statements other than statements of historical fact maybe forward-looking statements. Forward-looking statements are often, but not always, identified by the use of words such as "anticipate", "plan", "continue", "estimate", "expect", "may", "will", "project","predict", "potential", "targeting", "intend", "could", "might", "should", "believe" and similar expressions. In particular, this presentation contains forward-looking statements pertaining to, but not limited to,the following: details of Advantage's 2017 to 2019 development program; expected number of wells required to be drilled to achieve certain levels of production; expected well economics associated withcertain type curves; expected sensitivities in cash flow per share and debt to cash flow levels to changes in commodity prices; projections of market prices and costs; anticipated number of future drillinglocations and inventory and Advantage's focus on developing such locations including the timing thereof; the proposed expansion of Advantage's Glacier gas plant processing capacity, including the amount ofsuch expansion, the anticipated timing of completion of the proposed expansion and the expected benefits to Advantage from such expansion; Advantage's 2018 capital program, including the amountthereof, the amount to be allocated to increase annual production, to drilling and completions, to land and to facilities and infrastructure; Advantage's drilling plans for 2017, 2018 and 2019, including thenumber of wells to be drilled and the timing of completion of certain wells; estimated three year annual return on capital; Advantage's anticipated capital expenditures, annual production, royalty rates,operating costs, liquids transportation costs, netbacks, annual cash flow, cash flow per share, funds from operations, total debt to trailing cash flow ratio, total debt to cash flow, cumulative cash surplus, wellcosts, bank debt and total corporate cash costs for 2017 and 2018; Advantage's anticipated capital expenditures, annual production, annual cash flow per share, funds from operations, all-in capital efficiency,netbacks, cumulative cash surplus, bank debt and total debt to trailing cash flow ratio for each of 2018 and 2019; expected increases in production in 2017, 2018 and 2019 resulting from Advantage’sdevelopment plan; Advantage's future hedging positions; and other matters.
These statements involve substantial known and unknown risks and uncertainties, certain of which are beyond Advantage’s control, including, but not limited to: changes in general economic, market, industryand business conditions; impact of significant declines in market prices for oil and natural gas; actions by governmental or regulatory authorities including increasing taxes or royalties and changes ininvestment, or other regulations; changes in tax laws, environmental laws, royalty regimes and incentive programs relating to the oil and gas industry; the effect of acquisitions; Advantage's success atacquisition, exploitation and development of reserves; unexpected drilling results; changes in commodity prices, currency exchange rates, capital expenditures, reserves or reserves estimates and debt servicerequirements; the occurrence of unexpected events involved in the exploration for, and the operation and development of, oil and gas properties; changes or fluctuations in production levels; delays inanticipated timing of drilling and completion of wells; delays in completion of the expansion of the Glacier gas plant; lack of available capacity on pipelines; individual well productivity; the lack of availability ofqualified personnel or management; liabilities inherent in oil and natural gas operations; uncertainties associated with estimating oil and natural gas reserves; competition for, among other things, capital,acquisitions of reserves, undeveloped lands and skilled personnel; geological, technical, drilling and processing problems and other difficulties in producing petroleum reserves; ability to obtain requiredapprovals of regulatory authorities; ability to access sufficient capital from internal and external sources; and certain other risks and uncertainties described in Advantage's Annual Information Form which isavailable at www.sedar.com and www.advantageog.com. Readers are cautioned that the foregoing lists of factors are not exhaustive.
With respect to forward-looking statements contained in this presentation, Advantage has made assumptions regarding, but not limited to: conditions in general economic and financial markets; effects ofregulation by governmental agencies; current and future commodity prices, royalty regimes, exchange rates, royalty rates, operating costs, cash costs, well costs and liquids transportation costs; frac stagesand lateral lengths per well; estimated EURs; availability of skilled labor and drilling and related equipment; timing and amount of capital expenditures; the impact of increasing competition; that Advantagewill have sufficient cash flow, debt or equity sources or other financial resources required to fund its capital and operating expenditures and requirements as needed; that Advantage's conduct and results ofoperations will be consistent with its expectations; that Advantage will have the ability to develop its properties in the manner currently contemplated; available pipeline capacity; that Advantage will be ableto complete the expansion and increase capacity at the Glacier gas plant; that Advantage's production will increase; current or, where applicable, proposed assumed industry conditions, laws and regulationswill continue in effect or as anticipated; and that the estimates of Advantage's production and reserves volumes and the assumptions related thereto (including commodity prices and development costs) areaccurate in all material respects. Production estimates contained herein for the years ended December 31, 2017, 2018 and 2019 are expressed as anticipated average production over the calendar year. Indetermining anticipated production for the years ended December 31, 2017, 2018 and 2019 Advantage considered historical drilling, completion and production results for prior years and took into account theestimated impact on production of Advantage's 2017, 2018 and 2019 expected drilling and completion activities.
Management has included the above summary of assumptions and risks related to forward-looking information in order to provide shareholders with a more complete perspective on Advantage's futureoperations and such information may not be appropriate for other purposes. Advantage’s actual decisions, activities, results, performance or achievement could differ materially from those expressed in, orimplied by, these forward-looking statements and, accordingly, no assurance can be given that any of the events anticipated by the forward-looking statements will transpire or occur, or if any of them do so,what benefits that Advantage will derive there from. These forward-looking statements are made as of the date of this presentation and Advantage disclaims any intent or obligation to update publicly anyforward-looking statements, whether as a result of new information, future events or results or otherwise, other than as required by applicable securities laws.
.
ADVISORY
36

Advantage discloses several financial measures that do not have any standardized meaning prescribed under International Financial Reporting Standards ("IFRS"). These financial measures include total debt totrailing cash flow ratio, total cash costs, funds from operations and operating netbacks. Total debt to trailing cash flow ratio is calculated as bank indebtedness under Advantage's credit facilities plus workingcapital deficit divided by funds from operations for the prior twelve month period. Total cash costs includes royalties, operating costs, liquids transportation, cash G&A, interest & other cash expenses. Fundsfrom operations is based on cash provided by operating activities, before expenditures on decommissioning liability and changes in non-cash working capital, reduced for finance expense excluding accretion.Operating netbacks are calculated by deducting royalties and operating costs from revenue on a unit (boe or mcfe) basis. Management believes that these financial measures are useful supplementalinformation to analyze operating performance and provide an indication of the results generated by Advantage’s principal business activities. Investors should be cautioned that these measures should not beconstrued as an alternative to net income, cash provided by operating activities or other measures of financial performance as determined in accordance with IFRS. Advantage’s method of calculating thesemeasures may differ from other companies, and accordingly, they may not be comparable to similar measures used by other companies. Please see Advantage’s most recent Management’s Discussion andAnalysis, which is available at www.sedar.com and www.advantageog.com for additional information about these financial measures, including a reconciliation of funds from operations to cash provided byoperating activities.
This presentation and, in particular the information in respect of Advantage's prospective cash flow debt to trailing cash flow ratio, total cash costs and cash costs per share, operating costs, capitalexpenditures, annual cash flow and funds from operations may contain future oriented financial information ("FOFI") within the meaning of applicable securities laws. The FOFI has been prepared bymanagement to provide an outlook of Advantage's activities and results and may not be appropriate for other purposes. The FOFI has been prepared based on a number of assumptions, including theassumptions discussed above, and assumptions with respect to the costs and expenditures to be incurred by Advantage, capital equipment and operating costs, foreign exchange rates, taxation rates forAdvantage, general and administrative expenses and the prices to be paid for Advantage's production. Management does not have firm commitments for all of the costs, expenditures, prices or other financialassumptions used to prepare the FOFI or assurance that such operating results will be achieved and, accordingly, the complete financial effects of all of those costs, expenditures, prices and operating resultsare not objectively determinable. The actual results of operations of Advantage and the resulting financial results may vary from the amounts set forth herein, and such variations may be material.Management believes that the FOFI has been prepared on a reasonable basis, reflecting management’s best estimates and judgments. However, because this information is highly subjective and subject tonumerous risks including the risks discussed above, it should not be relied on as necessarily indicative of future results. FOFI contained in this presentation was made as of the date of this presentation andAdvantage disclaims any intention or obligations to update or revise any FOFI contained in this presentation, whether as a result of new information, future events or otherwise, unless required pursuant toapplicable law.
References in this presentation to initial test production rates, production type curves, initial "productivity", initial "flow" rates, final gas flow rates, average gas flow rates, average type curves, "flush"production rates and "30 day IP rates" and other short-term production rates are useful in confirming the presence of hydrocarbons, however such rates are not determinative of the rates at which such wellswill commence production and decline thereafter and are not indicative of long term performance or of ultimate recovery. Additionally, such rates may also include recovered "load oil" fluids used in wellcompletion stimulation. While encouraging, readers are cautioned not to place reliance on such rates in calculating the aggregate production for Advantage. A pressure transient analysis or well-testinterpretation has not been carried out in respect of all wells. Accordingly, Advantage cautions that the test results should be considered to be preliminary.
Certain type curves presented herein represent estimates of the production decline and ultimate volumes expected to be recovered from wells over the life of the well. The 7.5 mmcf/d IP (which represents theaverage 30 day initial production rate) and 7.5 Bcfe (which represents the ultimate volumes expected to be recovered from the wells over the life of the well based on the type curve) Upper and Lower Montneytype curve and the 5 mmcf/d IP and 5 Bcfe Middle Montney type curve are management generated type curves based on a combination of historical performance of older wells and management's expectationof what might be achieved from future wells. The type curves represent what management thinks an average well will achieve. Individual wells may be higher or lower but over a larger number of wellsmanagement expects the average to come out to the type curve. Over time type curves can and will change based on achieving more production history on older wells or more recent completion information onnewer wells. Other type curves presented herein, including the 9 mmcf/d IP and 9 Bcf Upper and LowerMontney type curve and the 6 mmcf/d IP and 6 Bcf Middle Montney type curve have been provided todemonstrate the economics associated with wells that could potentially have that type of productivity and recovery but do not represent management estimates of how such wells will actually perform.
This presentation discloses over 1,100 undeveloped future drilling locations at Glacier in the following categories: (i) proved (247 locations); (ii) proved + probable (307 locations); and (iii) unbooked (over 793additional locations). Proved locations and probable locations are derived from Advantage’s most recent independent reserves evaluation as prepared by Sproule Associates Limited as of December 31, 2016and account for drilling locations that have associated proved and/or probable reserves, as applicable. Unbooked locations are internal estimates based on Advantage’s prospective acreage and an assumptionas to the number of wells that can be drilled per section based on industry practice and internal review. Unbooked locations do not have attributed reserves or resources. Unbooked locations have beenidentified by management as an estimation of our multi-year drilling activities based on evaluation of applicable geologic, seismic, engineering, production and reserves information. There is no certainty thatAdvantage
ADVISORY
37
will drill all unbooked drilling locations and if drilled there is no certainty that such locations will result in additional oil and gas reserves, resources or production. The drilling locations on which we actually drillwells will ultimately depend upon the availability of capital, regulatory approvals, seasonal restrictions, oil and natural gas prices, costs, actual drilling results, additional reservoir information that is obtainedand other factors. While certain of the unbooked drilling locations have been derisked by drilling existing wells in relative close proximity to such unbooked drilling locations, other unbooked drilling locationsare farther away from existing wells where management has less information about the characteristics of the reservoir and therefore there is more uncertainty whether wells will be drilled in such locations andif drilled there is more uncertainty that such wells will result in additional oil and gas reserves, resources or production.
This presentation also contains projections of production growth based on drilling and recompletion opportunities identified by management of Advantage. Certain of the drilling opportunities identified haveno associated reserves or resources which can presently be classified as recoverable. As such the initial rates of production and reserves per well identified herein do not represent estimates of future productionor reserves associated with the drilling opportunities. The initial rates of production, reserves per well and the capital costs associated with drilling and recompletion identified below are based on Advantage'shistorical results and analogous public information received from other producers using similar technologies as Advantage intends to use in the same or similar areas and formations. The initial rates ofproduction, reserves per well and capital costs associated with the wells have been provided herein to give an indication of management's assumptions used for budgeting, planning and forecasting purposes.The initial rates of production, reserves and capital costs will most likely be different than projected.
Throughout this presentation the terms boe, mcfe (thousand of cubic feet of gas equivalent), mmcfe, bcfe and tcfe are used. Such terms may be misleading, particularly if used in isolation. The conversion ratioused herein of six thousand cubic feet per barrel (6 mcf: 1 bbl) of natural gas to barrels of oil equivalent and the conversion ratio used herein of 1 barrel per six thousand cubic feet (1 bbl: 6 mcf) of barrels of oilto natural gas equivalent is based on an energy equivalency conversion method primarily applicable at the burner tip and does not represent a value equivalency at the wellhead. Given that the value ratiobased on the current price of crude oil as compared to natural gas is significantly different from the energy equivalency of 6:1, utilizing a conversion on a 6:1 basis may be misleading as an indication of value.
This presentation contains certain oil and gas metrics, including EUR, PDP F&D, 2P F&D, 1P F&D, operating netbacks, cash flow netbacks, all-in netbacks, recycle ratio and CAGR which do not have standardizedmeanings or standard methods of calculation and therefore such measures may not be comparable to similar measures used by other companies and should not be used to make comparisons. Such metricshave been included herein to provide readers with additional measures to evaluate Advantage's performance; however, such measures are not reliable indicators of the future performance of Advantage andfuture performance may not compare to the performance in previous periods and therefore such metrics should not be unduly relied upon. EUR represents the 2P estimated ultimate recoverable conventionalnatural gas volumes per well assigned by Advantage's internal non-independent qualified reserves evaluator in accordance with the Canadian Oil & Gas Evaluation Handbook. PDP F&D is calculated by addingtogether all capital expenditures including exploration and development costs and dividing the sum by PDP reserves additions. 2P F&D is calculated by adding together all capital expenditures includingexploration and development costs and the change in future development costs and dividing the sum by 2P reserve additions. 1P F&D is calculated by adding together all capital expenditures includingexploration and development costs and the change in future development costs and dividing the sum by 1P reserve additions. The aggregate of the exploration and development costs incurred in the mostrecent financial year generally will not reflect total finding and development costs related to reserve additions for that year. Operating netbacks are calculated by deducting royalties, operating costs andtransportation costs from revenue on a unit (mcfe) basis. Cash flow netbacks are calculated by deducting royalties, operating costs, transportation costs, cash G&A and cash finance expenses from revenue on aunit (mcfe) basis. All-in netbacks are calculated by deducting royalties, operating costs, transportation costs, cash G&A, cash finance expenses and PDP F&D from revenue on a unit (mcfe) basis. Recycle ratio iscalculated as Cash flow netbacks divided by 2P F&D. CAGR is the Compound Annual Growth Rate representing the measure of average annual growth over multiple time periods. In this presentation certainfinancial and operating metrics of other issuers are also presented to compare such metrics to Advantage's results. Such other issuers were included to show how Advantage's performance compares to someof its peers. The financial and operating metrics of such issuers have been obtained from public sources and have not been independently verified by Advantage. Readers should not base an investment decisionfor the securities of such issuers based on the information available herein. Advantage disclaims any responsibility or liability for the accuracy of the information relating to such other issuers presented herein.
Where any disclosure of reserves data and resources is made in this presentation that does not reflect all reserves of Advantage, the reader should note that the estimates of reserves, future net revenue andresources for individual properties or groups of properties may not reflect the same confidence level as estimates of reserves and future net revenue for all properties, due to the effects of aggregation.
ADVISORY
38
ADVANTAGE CONTACT INFORMATION
Investor [email protected]
Listed on NYSE and TSX: AAV
Advantage Oil & Gas Ltd.Suite 300, 440 – 2nd Avenue SWCalgary, Alberta T2P 5E9
Main: 403.718.8000Facsimile: 403.718.8332
Andy Mah, P.Eng. Director, President & Chief Executive Officer
Craig Blackwood, C.A. VP Finance & Chief Financial Officer
Neil Bokenfohr, P.Eng. Senior Vice President
Advantage 100% W.I. Glacier Gas Plant