Welcome To Mentorship! Abhijan Khosla (Director of Mentorship)
Upload
dorthy-dennisCategory
view
214download
0
Welcome to Finance and Accounting
Abhijan Khosla (Director of Mentorship)
GTSF Investments Committee2
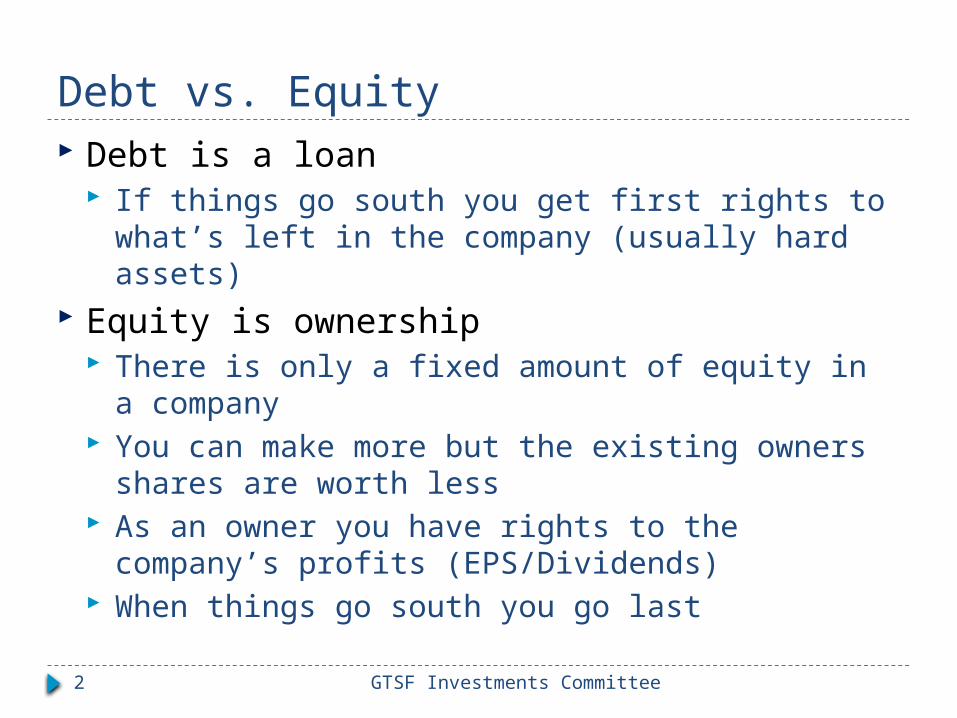
Debt vs. Equity Debt is a loan
If things go south you get first rights to what’s left in the company (usually hard assets)
Equity is ownership There is only a fixed amount of equity in a
company You can make more but the existing owners
shares are worth less As an owner you have rights to the company’s
profits (EPS/Dividends) When things go south you go last
GTSF Investments Committee3
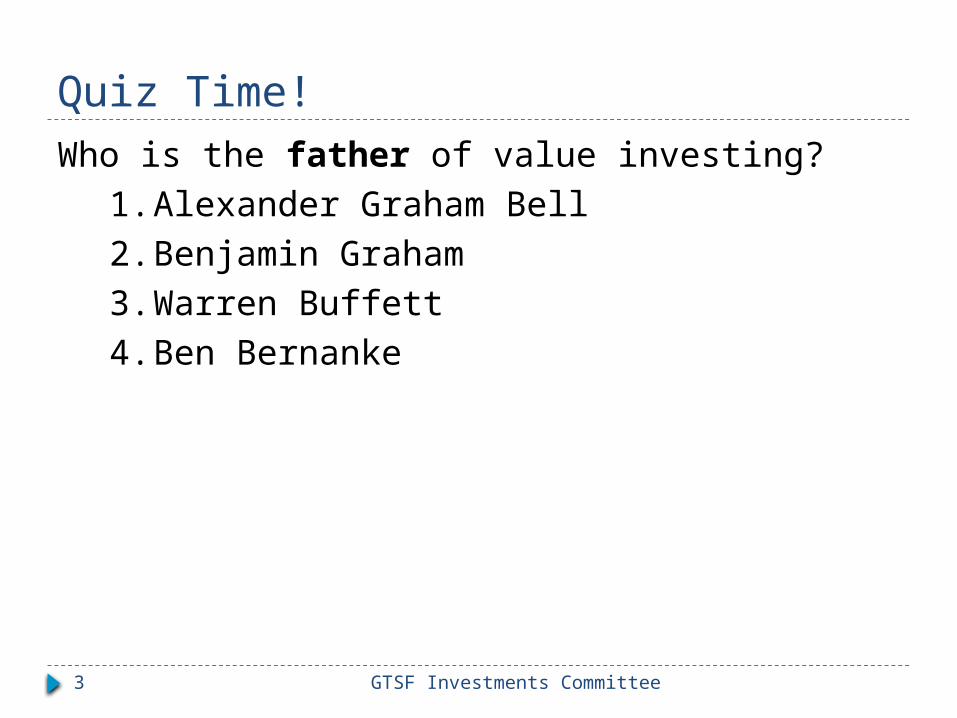
Quiz Time!Who is the father of value investing?
1. Alexander Graham Bell 2. Benjamin Graham 3. Warren Buffett4. Ben Bernanke
GTSF Investments Committee4
Quiz Time!Who is the father of value investing?
1. Alexander Graham Bell 2. Benjamin Graham 3. Warren Buffett4. Ben Bernanke
GTSF Investments Committee5
Quiz Time!You shorted AAPL at $750 and covered at $250
(assuming $10 in fees) how much do you make on this trade?
1. 2002. 4903. -2004. -190
GTSF Investments Committee6
Quiz Time!You shorted AAPL at $750 and covered at $250
(assuming $10 in fees) how much do you make on this trade?
1. 2002. 4903. -2004. -190
GTSF Investments Committee7
Quiz Time!Which is not true of an OTC Market?
1. The prices are not listed in any central location
2. Buyers assume all the risk 3. Market makers help to determine prices4. Fixed income is an example of an OTC
security
GTSF Investments Committee8
Quiz Time!Which is not true of an OTC Market?
1. The prices are not listed in any central location
2. Buyers assume all the risk 3. Market makers help to determine prices4. Fixed income is an example of an OTC
security
GTSF Investments Committee9
Who Am I?
GTSF Investments Committee10
The 1 thing you need to know
A dollar today is worth MORE than a dollar tomorrow
Today > Tomorrow
GTSF Investments Committee11
Time Value of Money Interest has an impact on the value of an
investment If compound interest is used then the growth
of an investment in different time periods reflects all previous interest earned
If I earned 10% a day on $100 how much would I have tomorrow? In 4 days? In 10 days?
GTSF Investments Committee12
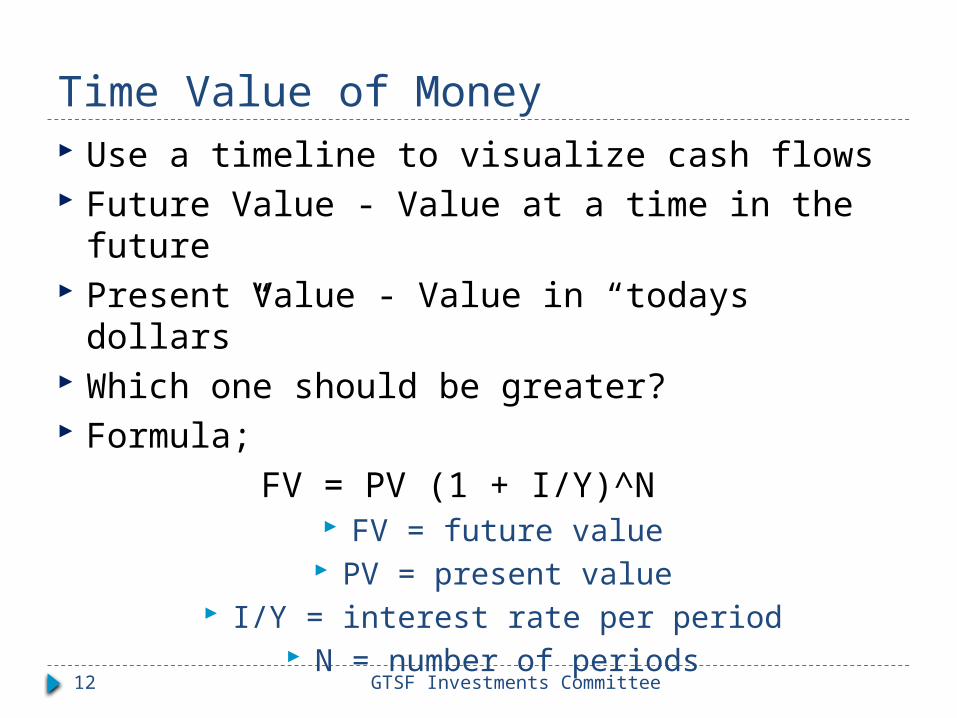
Time Value of Money Use a timeline to visualize cash flows Future Value - Value at a time in the future Present Value - Value in “todays dollars” Which one should be greater? Formula;
FV = PV (1 + I/Y)^N FV = future value
PV = present value I/Y = interest rate per period
N = number of periods
GTSF Investments Committee13
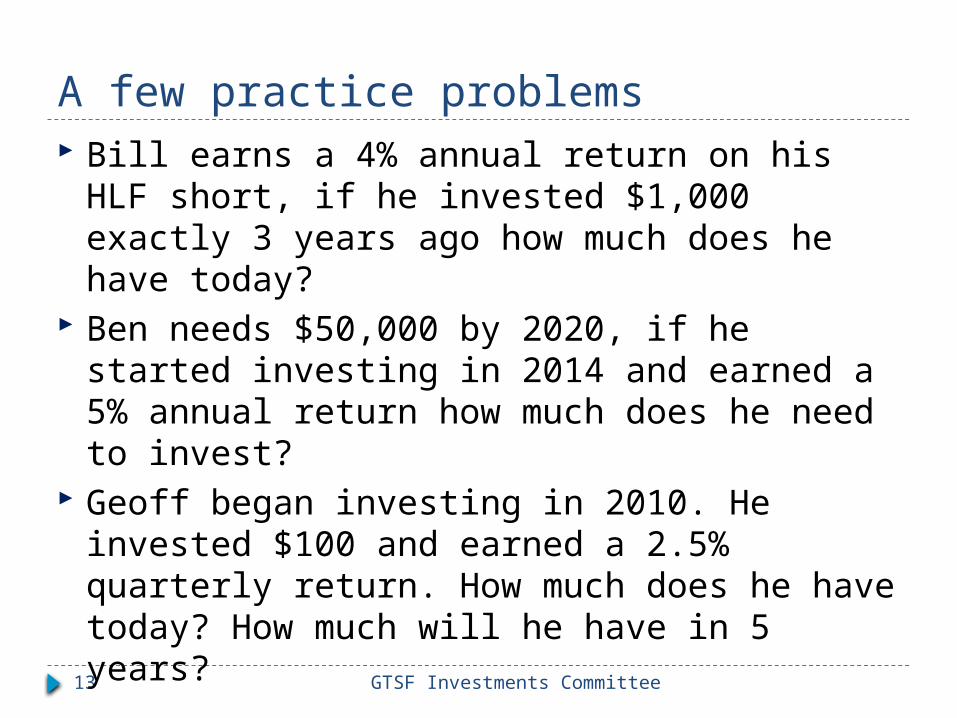
A few practice problems Bill earns a 4% annual return on his HLF
short, if he invested $1,000 exactly 3 years ago how much does he have today?
Ben needs $50,000 by 2020, if he started investing in 2014 and earned a 5% annual return how much does he need to invest?
Geoff began investing in 2010. He invested $100 and earned a 2.5% quarterly return. How much does he have today? How much will he have in 5 years?
GTSF Investments Committee14
But.....Why? As in investor you must be compensated for
giving up your money Compensation depends on risk What are some main risks?
Counterparty (Default) Risk Reinvestment Risk Maturity or Duration Risk
GTSF Investments Committee15
The 3 Financial Statements What are the 3 Financial Statements?
Income Statement
Statement Of Cash Flows
Balance Sheet
GTSF Investments Committee16
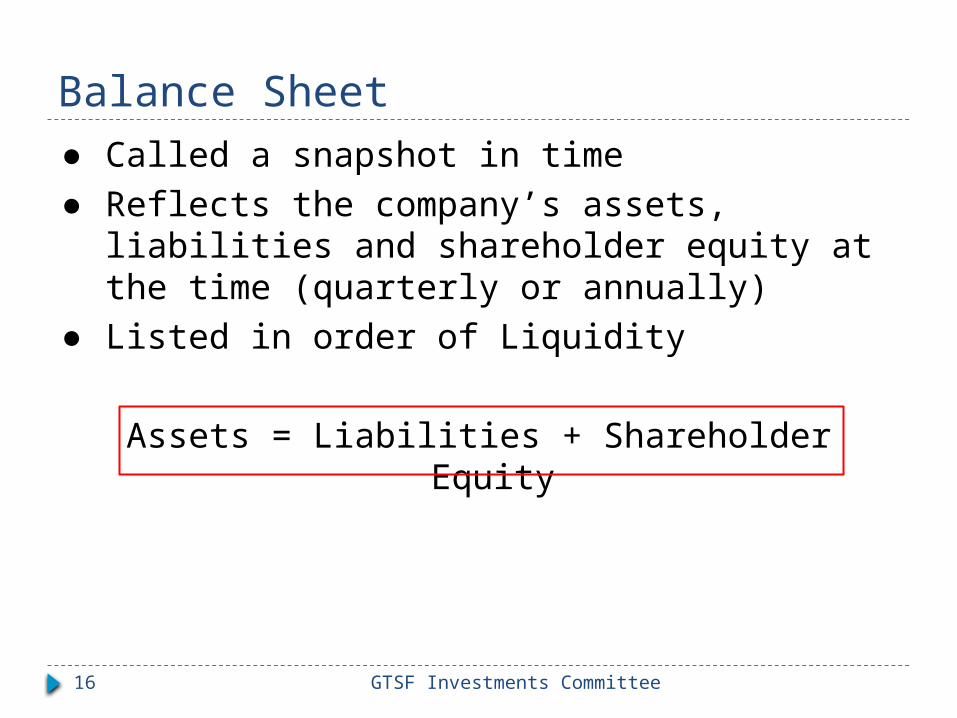
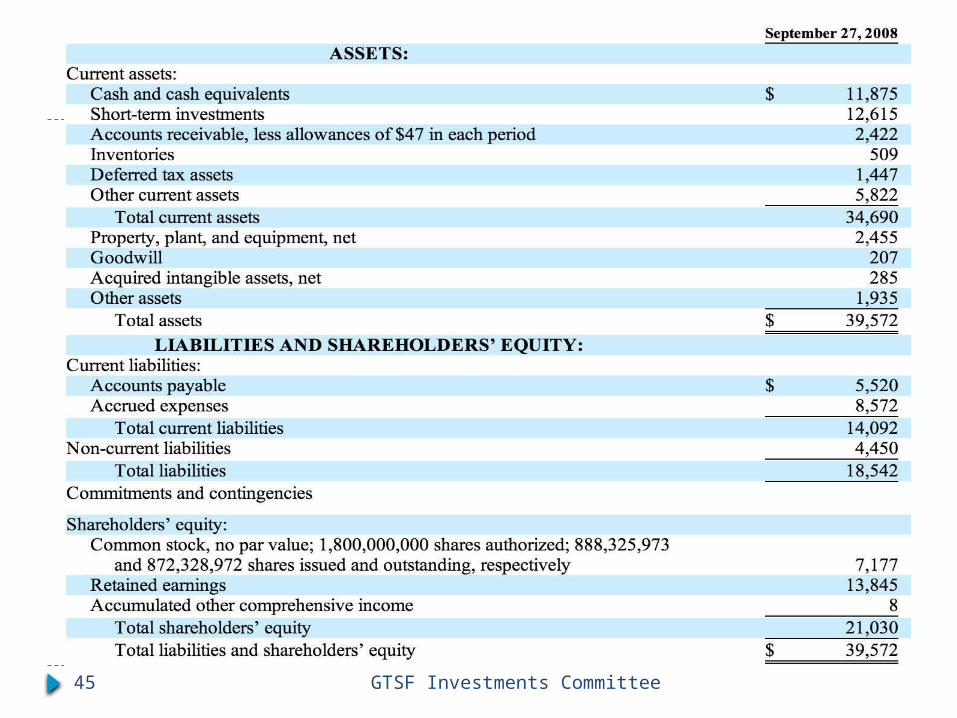
● Called a snapshot in time● Reflects the company’s assets, liabilities and
shareholder equity at the time (quarterly or annually)
● Listed in order of Liquidity
Assets = Liabilities + Shareholder Equity
Balance Sheet
GTSF Investments Committee17
GTSF Investments Committee18
GTSF Investments Committee19
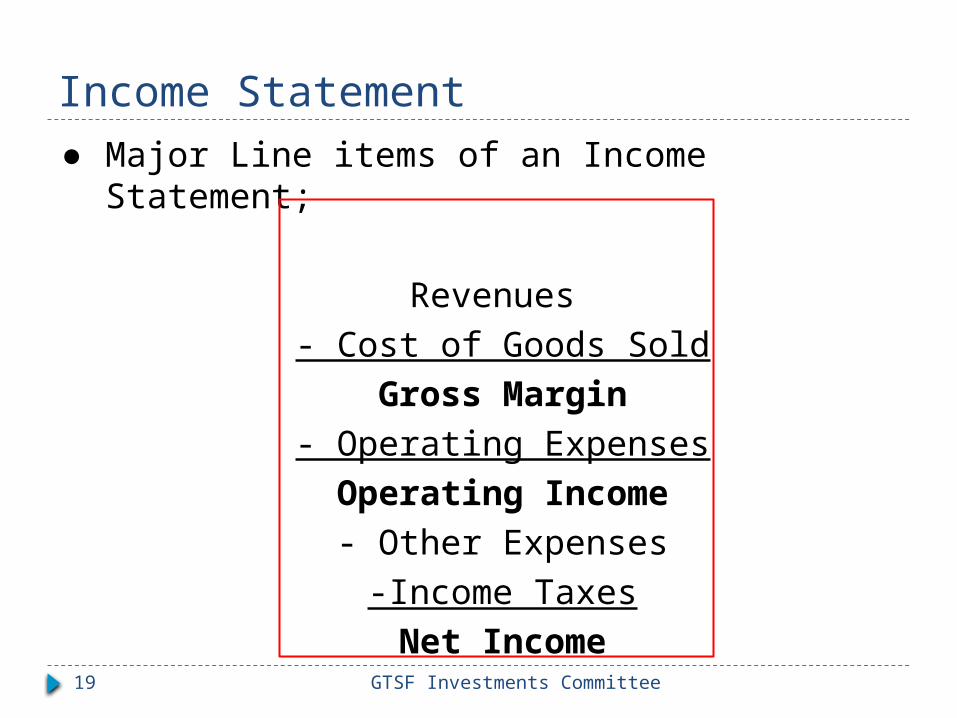
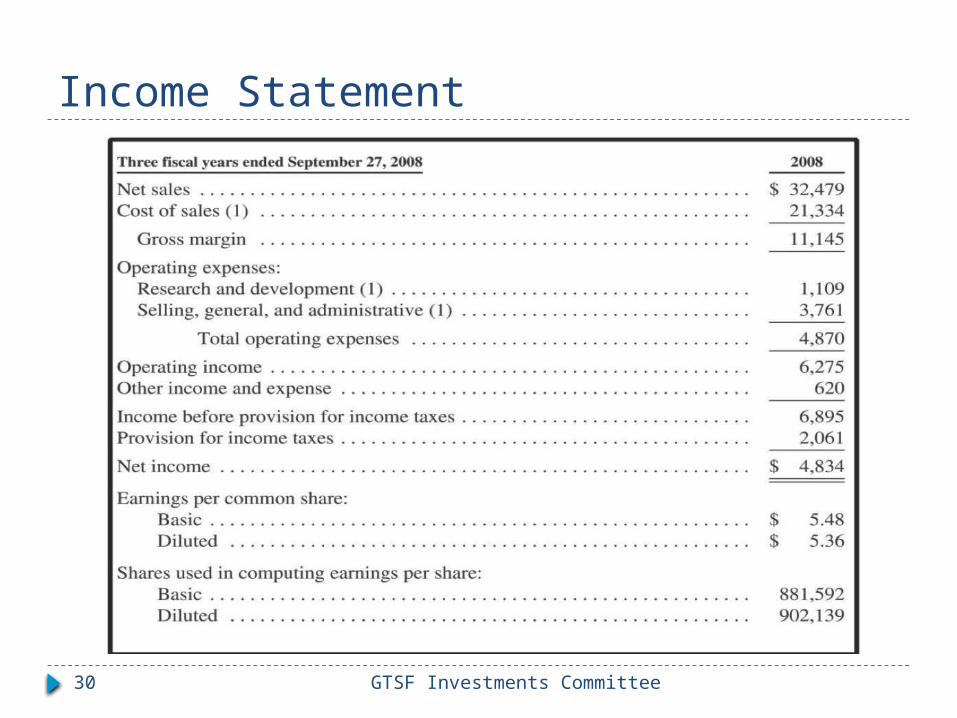
Income Statement● Major Line items of an Income Statement;
Revenues - Cost of Goods Sold
Gross Margin- Operating ExpensesOperating Income
- Other Expenses-Income TaxesNet Income

GTSF Investments Committee20
Income Statement
GTSF Investments Committee21
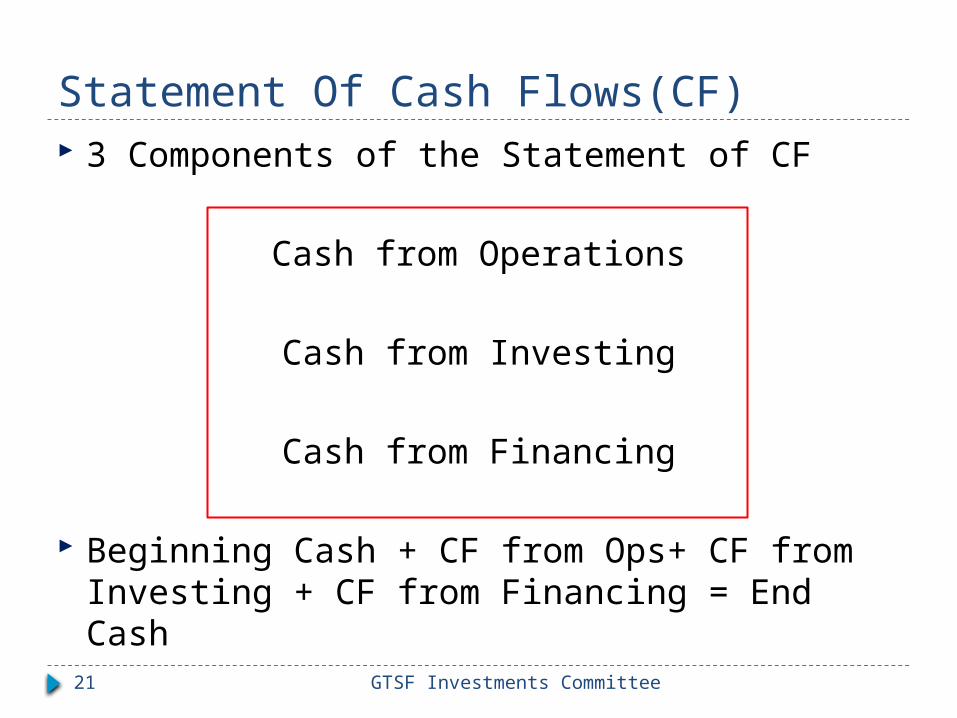
Statement Of Cash Flows(CF) 3 Components of the Statement of CF
Cash from Operations
Cash from Investing
Cash from Financing
Beginning Cash + CF from Ops+ CF from Investing + CF from Financing = End Cash
GTSF Investments Committee22
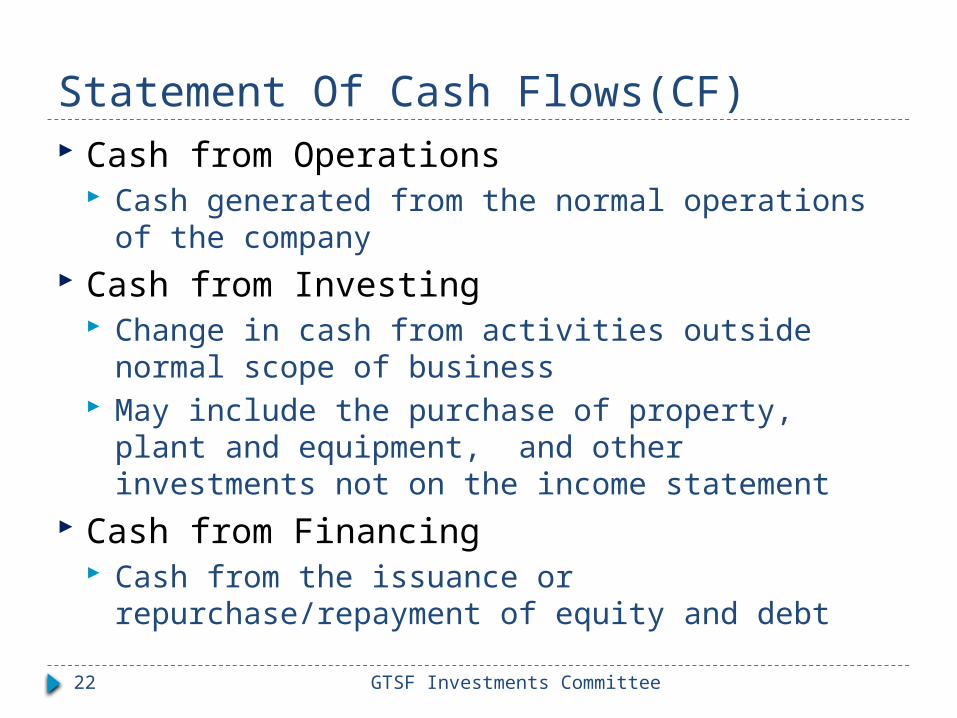
Statement Of Cash Flows(CF) Cash from Operations
Cash generated from the normal operations of the company
Cash from Investing Change in cash from activities outside normal
scope of business May include the purchase of property, plant and
equipment, and other investments not on the income statement
Cash from Financing Cash from the issuance or repurchase/repayment
of equity and debt
GTSF Investments Committee23
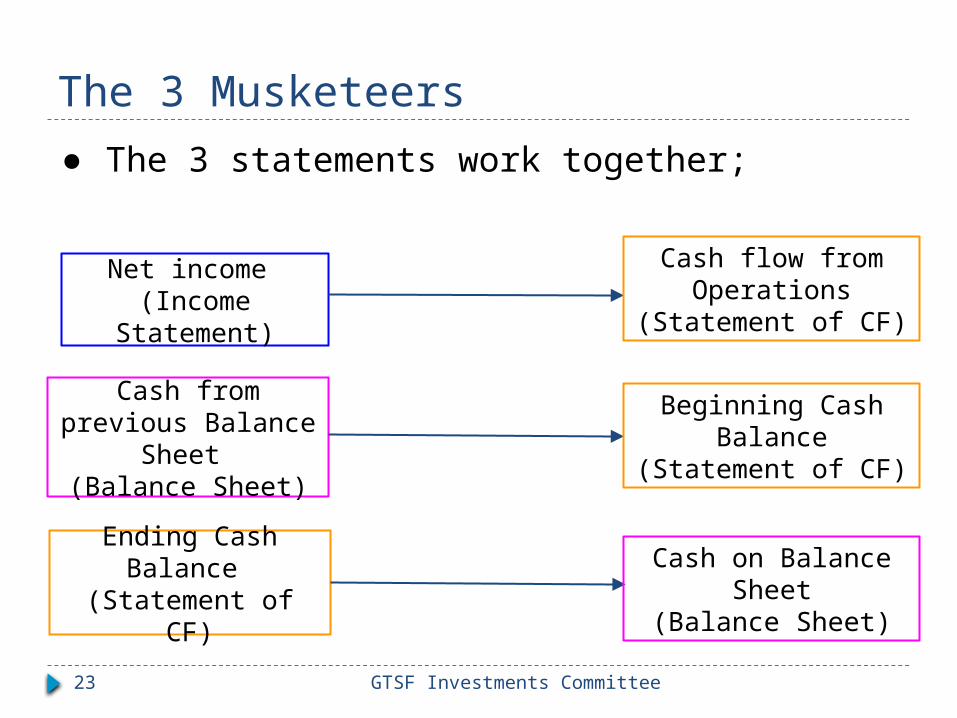
The 3 Musketeers
● The 3 statements work together;
Net income (Income
Statement)
Cash flow from Operations
(Statement of CF)
Cash from previous Balance
Sheet (Balance Sheet)
Beginning Cash Balance
(Statement of CF)
Ending Cash Balance
(Statement of CF)
Cash on Balance Sheet
(Balance Sheet)
GTSF Investments Committee24
Company Reporting Any publicly traded US company is required
to report comprehensive financials Quarterly reports - 10Q Annual Reports - 10K Foreign companies with stock trading in the
US must also file annual and quarterly financial reports
sec.gov Footnotes –can often house interesting
information about the company that must be disclosed but is not part of the 3 financial statements
GTSF Investments Committee25
Valuation What is valuation? Who uses valuation? What are some of the most common metrics
used when valuing a company? What are some of the different ways to value
a company?
GTSF Investments Committee26
Valuation Basics Valuation is the procedure of calculating the
worth of an asset, security, company, etc... Valuation is one of the primary tasks done by
investment banks Being good at providing valuations for
companies is an invaluable skill set used in all facets of finance
There are 4 main ways to value companies Comparable Companies Precedent Transaction
Discounted Cash Flow Modeling Leverage Buyout Modeling
GTSF Investments Committee27
Commonly Used Metrics One way to value a company is to compare it
to its peers (Comparable Multiples Method) There are a multitude of multiples used The most common are
Enterprise Value (EV) /EBITDA Price/ Book Value Price/Earnings PEG EV/Sales Price/Sales
GTSF Investments Committee28
Enterprise Value (EV) EV- Enterprise Value
Value of the entire firm including both debt and equity
EV = Market Value of Equity + Debt + Preferred Stock + Minority Interest - Cash
Why take out cash? Cash is already counted in market value in equity
(in theory) You can use cash to pay down debt or pay a
dividend - you would not buy a company for its cash

GTSF Investments Committee29
EBITDA EBITDA - earnings before interest, taxes,
depreciation and amortization Good way to evaluate a company’s
profitability EBITDA = Revenues - Expenses (excluding
taxes, interest, depreciation and amortization)
Represents the earnings that can effectively service debt, rose to prominence during the leverage buyout boom of the 80’s
GTSF Investments Committee30
Income Statement
GTSF Investments Committee31
Free Cash Flow (FCF) Simply the amount of free cash a company
has Formula: EBIT (1-tax rate)+Depreciation &
Amortization - Change in Net Working Capital - Capital Expenditures
NWC = current assets - current liabilities Why do we use 1-tax rate? Why subtract Change in NWC and Capital
Expenditures?

GTSF Investments Committee32
EV/EBITDA Essentially “at what multiple of earnings is
the entire company valued at” EV/EBITDA is the most common metric used
when doing comparable multiple analysis Varies greatly with industry If the industry average EV/EBITDA multiple is
6X and your company has an EBITDA of $100MM what is your company’s EV?

GTSF Investments Committee33
Price/Book The current share price / book value of the firm Book value = total assets - intangible assets -
liabilities Book value is the theoretical value of assets that
would be recovered in the event of a total firm liquidation
Assume ; Total assets; 10MM Intangible assets; 1MM Liabilities; 6MM Market Value; 21 MM Price/Book?
GTSF Investments Committee34
Price/Earnings (P/E) The PE ratio of a firm is the multiple at which
the stock price is trading as compared to earnings per share (EPS)
P/E - Current stock price / EPS Stock Price - 502.20 EPS - 40.44 P/E - ? What do you do if you have negative EPS?
GTSF Investments Committee35
PEG The PEG ratio of a firm is the Price/Earnings
to Growth ratio P/E ratio divided by the growth of the
earnings over a specified period of time Can be in the past or the future (trailing vs
forward) PEG takes into account the growth of
earnings and helps to give a more complete picture of relative price
If our firm’s P/E was 40 and our annual EPS growth rate was 20% what is our PEG?
For what kind of firms would PEG be a good metric?
GTSF Investments Committee36
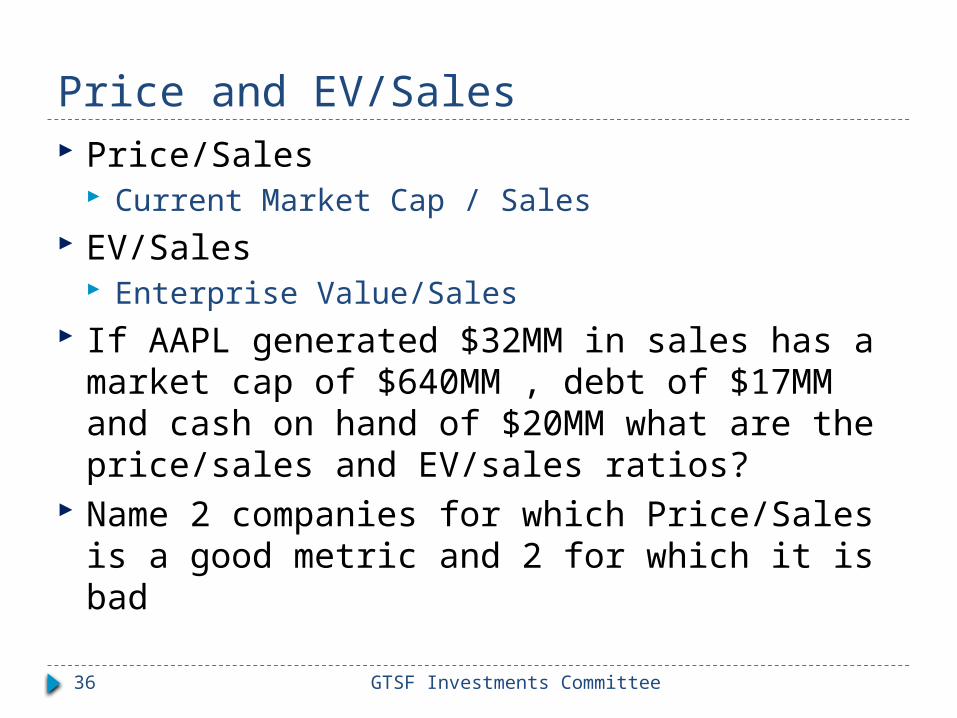
Price and EV/Sales Price/Sales
Current Market Cap / Sales EV/Sales
Enterprise Value/Sales If AAPL generated $32MM in sales has a
market cap of $640MM , debt of $17MM and cash on hand of $20MM what are the price/sales and EV/sales ratios?
Name 2 companies for which Price/Sales is a good metric and 2 for which it is bad
GTSF Investments Committee37
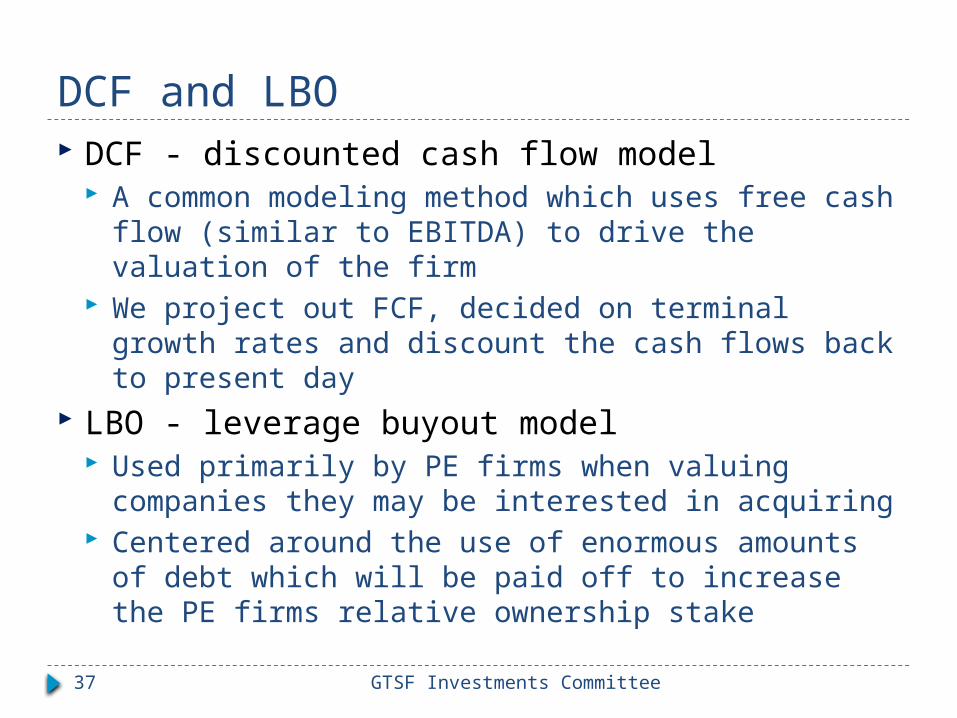
DCF and LBO DCF - discounted cash flow model
A common modeling method which uses free cash flow (similar to EBITDA) to drive the valuation of the firm
We project out FCF, decided on terminal growth rates and discount the cash flows back to present day
LBO - leverage buyout model Used primarily by PE firms when valuing
companies they may be interested in acquiring Centered around the use of enormous amounts of
debt which will be paid off to increase the PE firms relative ownership stake
GTSF Investments Committee38
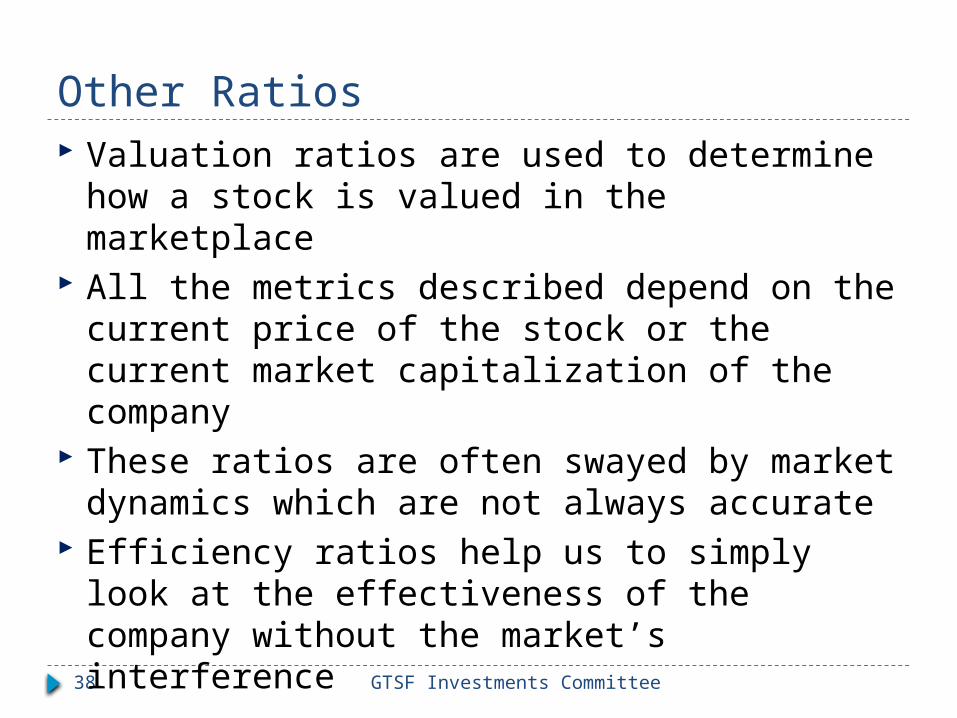
Other Ratios Valuation ratios are used to determine how a
stock is valued in the marketplace All the metrics described depend on the
current price of the stock or the current market capitalization of the company
These ratios are often swayed by market dynamics which are not always accurate
Efficiency ratios help us to simply look at the effectiveness of the company without the market’s interference
GTSF Investments Committee39
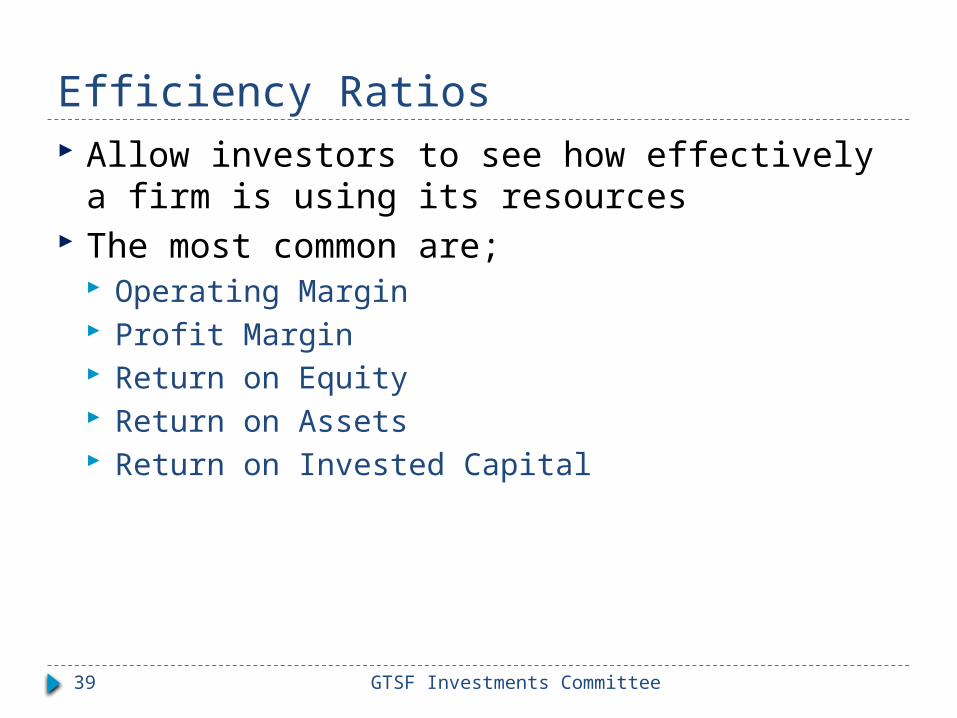
Efficiency Ratios Allow investors to see how effectively a firm
is using its resources The most common are;
Operating Margin Profit Margin Return on Equity Return on Assets Return on Invested Capital
GTSF Investments Committee40
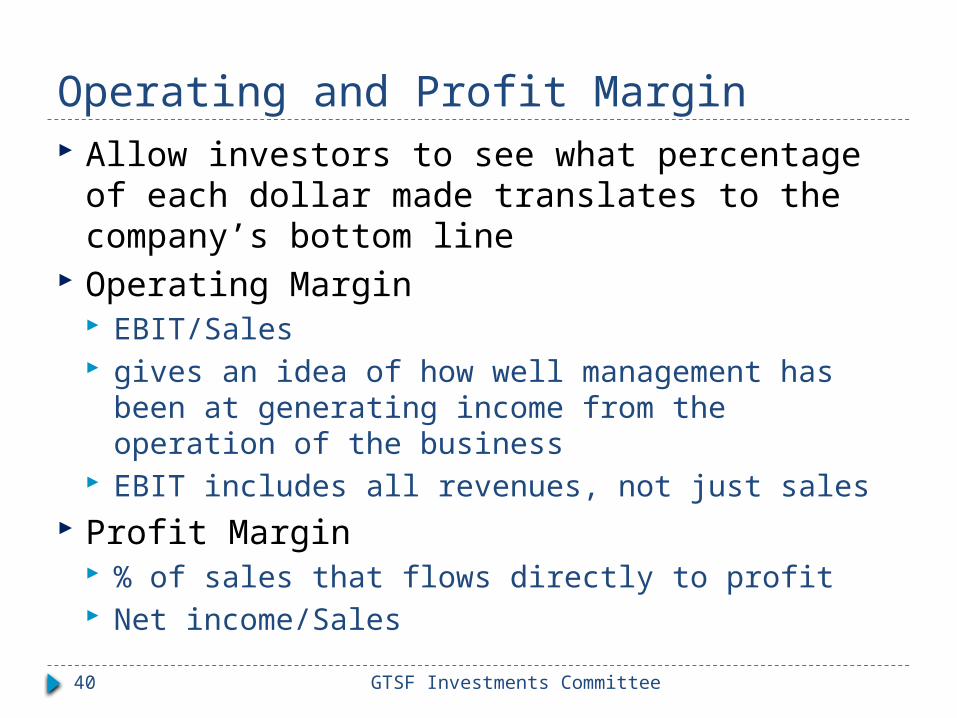
Operating and Profit Margin Allow investors to see what percentage of
each dollar made translates to the company’s bottom line
Operating Margin EBIT/Sales gives an idea of how well management has been
at generating income from the operation of the business
EBIT includes all revenues, not just sales Profit Margin
% of sales that flows directly to profit Net income/Sales
GTSF Investments Committee41
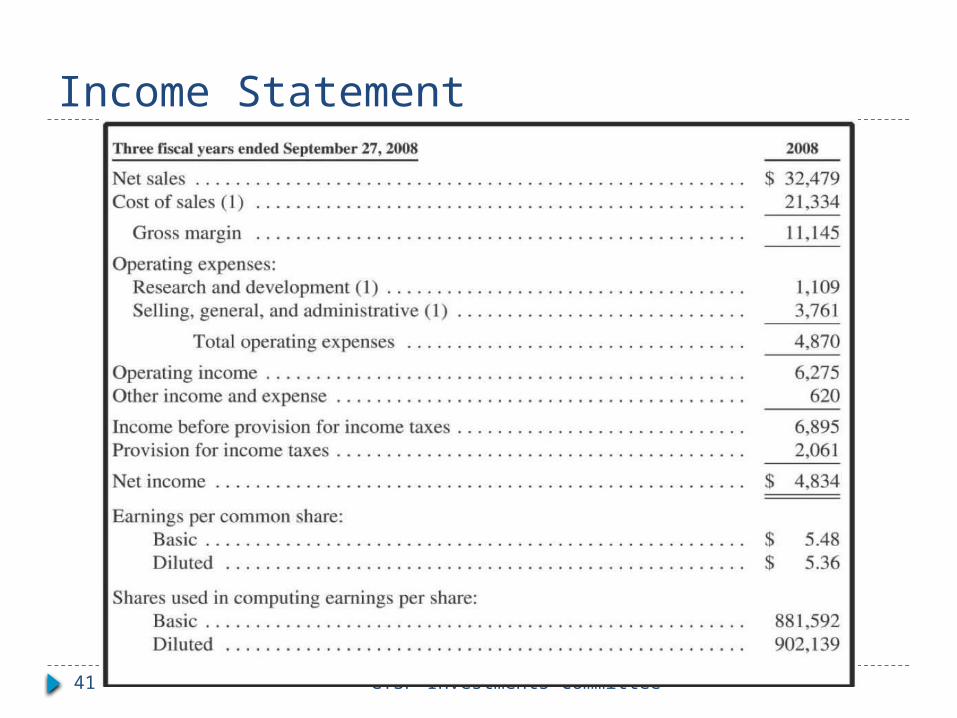
Income Statement
GTSF Investments Committee42
Return on Equity and Assets Return on equity represents the amount of
profit generated on each dollar of equity funding in the company Net Income/ Shareholders Equity
Return on Capital represents the amount of profit generated on each dollar of assets held by the company Net Income/Total Assets Helps to measure how good management is at
using assets on hand
GTSF Investments Committee43
Return on Invested Capital Return on invested capital is a measure of
how well capital is being used to generate profits, essentially with all the funding being given to the company how much are they using to make money?
Net income - Dividends / Total Capital Use the balance sheet and income statements
on the next slides to calculate Return on Equity, Assets and Invested Capital
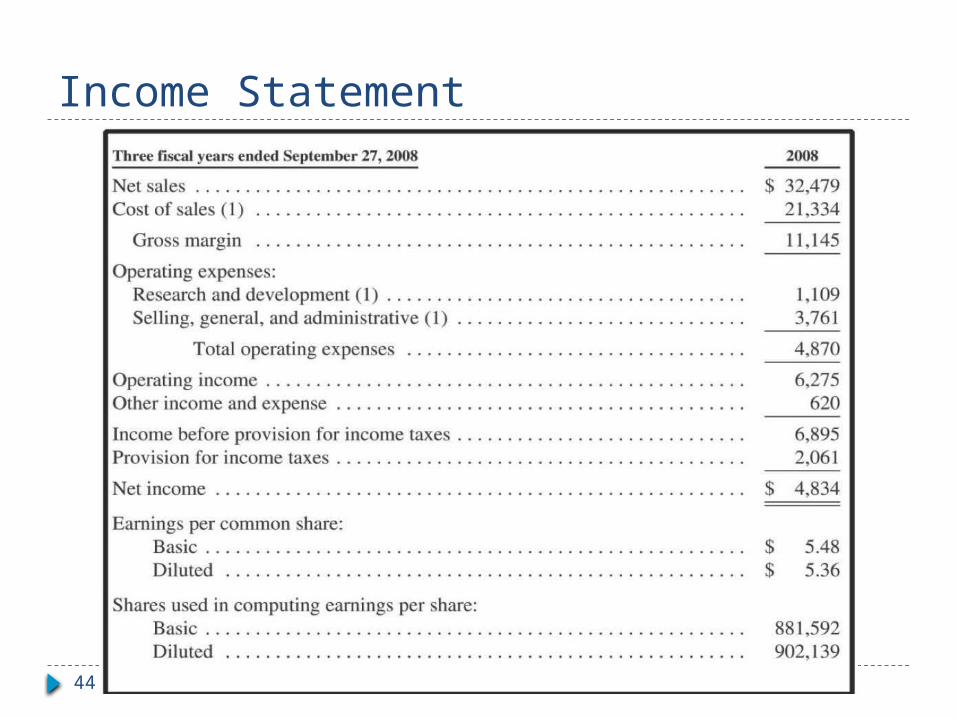
GTSF Investments Committee44
Income Statement
GTSF Investments Committee45
GTSF Investments Committee46
Ratios in Perspective Ratios help to clarify investing theses It is important to use ratios and number to
backup your thoughts about a company There is no “magic ratio” Learning which ratios work the best takes
time and experience The one thing you NEVER use to decide on an
investmentPRICE