WEEKLY REPORT Soybean - Portal - MarketIntelligence · WEEKLY REPORT FCStone do Brasil ......
6
Soybean WEEKLY REPORT FCStone do Brasil Consultoria em Futuros e Commodities Commodities trading involves risks and FCStone is not to be held responsible for the use of any information herein for such purpose. All information contained herein was obtained from sources deemed reliable, but there is no guarantee of accuracy. The information and opinions expressed herein do not constitute a solicitation to buy or sell futures or options on futures, or any derivative. The partial or full reproduction of this report without FCStone's written permission is forbidden. by Rafael Morais [email protected] Even with soybean and corn exported in the same period, ports should not have problems Looking Brazilian soybean and corn exports exhibited reverse seasonality While most soy- beans are shipped in the first half of the year, corn is mostly exported in the second half, after the safrinha harvest. In 2017, there are expectations of record soybean, around 60 million tonnes, according to INTL FCStone estimates. From the beginning of January to May 18, 30.7 million tonnes of soybean were shipped, according to official data from SECEX ( Foreign Trade Secretariat). Considering available line-up data, there are more than 5 million tonnes scheduled to de- part, and with the USD up against the BRL since last week, trades are getting a boost, which tends to increase shipments. Within this context, soybean exports should total around 43 million tonnes by the end of June, with 17 million tonnes departing in the second half of 2017, especially since exports could increase even more. Therefore, soybean exports could compete with other commodities for export at ports. As May 29, 2017 Edition No. 392 Even with soybean and corn exported in the same period, ports should not have problems Harvest exceeds 79% of planted area in Argentina Soybean declines with US planting and lower oil prices Chart 1: Monthly soybean exports – 2017 Source: SECEX and INTL FCStone.
Transcript of WEEKLY REPORT Soybean - Portal - MarketIntelligence · WEEKLY REPORT FCStone do Brasil ......
Soybean WEEKLY REPORT
FCStone do Brasil
Consultoria em Futuros e Commodities
Commodities trading involves risks and FCStone is not to be held responsible for the use of any information herein for such purpose. All information contained herein was obtained from sources deemed reliable, but there is no guarantee of
accuracy. The information and opinions expressed herein do not constitute a solicitation to buy or sell futures or options on futures, or any derivative. The partial or full reproduction of this report without FCStone's written permission is
forbidden.
by Rafael Morais
Even with soybean and corn exported in the same period, ports should
not have problems
Looking Brazilian soybean and corn exports exhibited reverse seasonality While most soy-
beans are shipped in the first half of the year, corn is mostly exported in the second half,
after the safrinha harvest.
In 2017, there are expectations of record soybean, around 60 million tonnes, according to
INTL FCStone estimates. From the beginning of January to May 18, 30.7 million tonnes of
soybean were shipped, according to official data from SECEX ( Foreign Trade Secretariat).
Considering available line-up data, there are more than 5 million tonnes scheduled to de-
part, and with the USD up against the BRL since last week, trades are getting a boost, which
tends to increase shipments. Within this context, soybean exports should total around 43
million tonnes by the end of June, with 17 million tonnes departing in the second half of
2017, especially since exports could increase even more.
Therefore, soybean exports could compete with other commodities for export at ports. As
May 29, 2017
Edition No. 392
Even with soybean and
corn exported in the
same period, ports
should not have
problems
Harvest exceeds 79% of
planted area in
Argentina
Soybean declines with
US planting and lower
oil prices
Chart 1: Monthly soybean exports – 2017
Source: SECEX and INTL FCStone.
Commodities trading involves risks and FCStone is not to be held responsible for the use of any information herein for such purpose. All information contained herein was obtained from sources deemed reliable, but there is no guarantee of
accuracy. The information and opinions expressed herein do not constitute a solicitation to buy or sell futures or options on futures, or any derivative. The partial or full reproduction of this report without FCStone's written permission is
forbidden.
SOYBEAN WEEKLY REPORT
for corn, there are many doubts regarding
how much will be sold abroad, with abun-
dant global supply and the current foreign
exchange conditions. Last week, with the
USD strengthening against the BRL amid
political chaos involving President Michel
Temer's administration, there was an incen-
tive to sell corn. As of now, INTL FCStone's
estimate is 28 million tonnes of corn exports,
most of which would be exported starting in
August.
Note that sugar export are highly concen-
trated in the port of Santos, which is also the
top grains exporter. Sugar tends to have
larger export volumes between July and
September, which overlaps with large soy-
bean and corn shipments leaving Brazil.
Another important export is soymeal, with
perspectives of exports at around 15 million
tonnes in 2017.
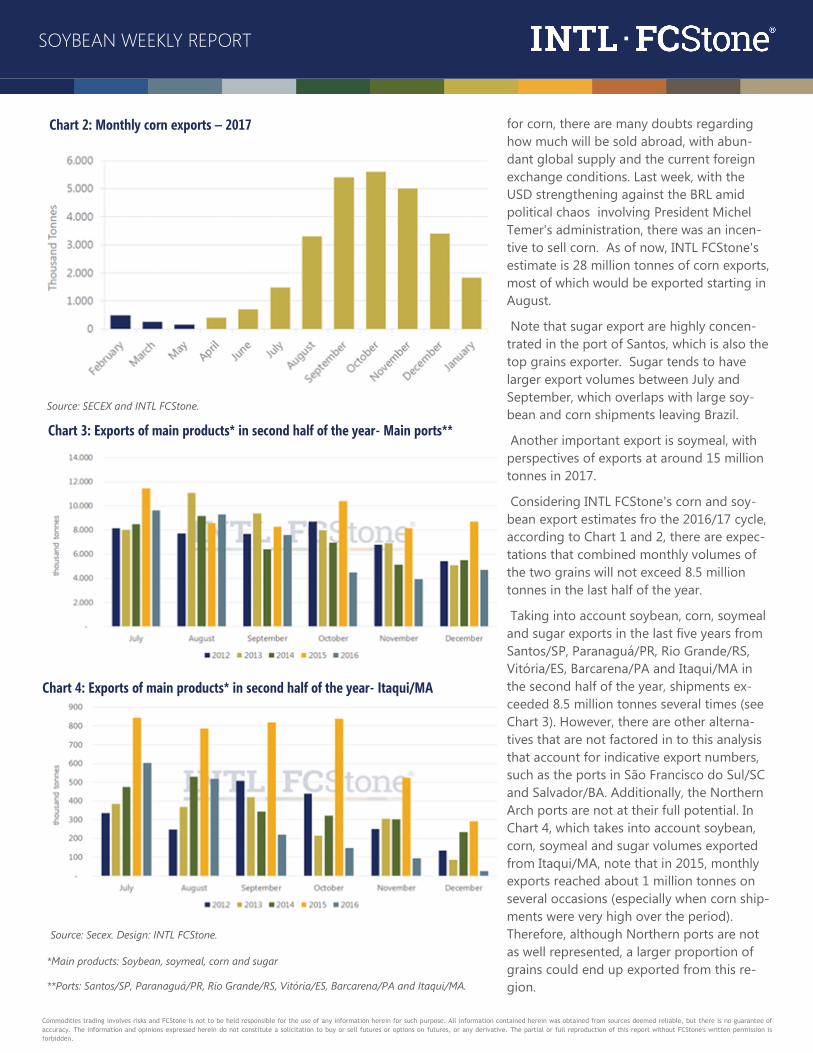
Considering INTL FCStone's corn and soy-
bean export estimates fro the 2016/17 cycle,
according to Chart 1 and 2, there are expec-
tations that combined monthly volumes of
the two grains will not exceed 8.5 million
tonnes in the last half of the year.
Taking into account soybean, corn, soymeal
and sugar exports in the last five years from
Santos/SP, Paranaguá/PR, Rio Grande/RS,
Vitória/ES, Barcarena/PA and Itaqui/MA in
the second half of the year, shipments ex-
ceeded 8.5 million tonnes several times (see
Chart 3). However, there are other alterna-
tives that are not factored in to this analysis
that account for indicative export numbers,
such as the ports in São Francisco do Sul/SC
and Salvador/BA. Additionally, the Northern
Arch ports are not at their full potential. In
Chart 4, which takes into account soybean,
corn, soymeal and sugar volumes exported
from Itaqui/MA, note that in 2015, monthly
exports reached about 1 million tonnes on
several occasions (especially when corn ship-
ments were very high over the period).
Therefore, although Northern ports are not
as well represented, a larger proportion of
grains could end up exported from this re-
gion.
Chart 2: Monthly corn exports – 2017
Source: SECEX and INTL FCStone.
Chart 3: Exports of main products* in second half of the year- Main ports**
Chart 4: Exports of main products* in second half of the year- Itaqui/MA
Source: Secex. Design: INTL FCStone.
*Main products: Soybean, soymeal, corn and sugar
**Ports: Santos/SP, Paranaguá/PR, Rio Grande/RS, Vitória/ES, Barcarena/PA and Itaqui/MA.
Commodities trading involves risks and FCStone is not to be held responsible for the use of any information herein for such purpose. All information contained herein was obtained from sources deemed reliable, but there is no guarantee of
accuracy. The information and opinions expressed herein do not constitute a solicitation to buy or sell futures or options on futures, or any derivative. The partial or full reproduction of this report without FCStone's written permission is
forbidden.
SOYBEAN WEEKLY REPORT
Therefore, the more soybean exports ex-
tend into the second half of the year, poten-
tially exceeding 60 million tonnes in total,
the risk of overcrowding at ports is very low.
Harvest exceeds 79% of planted area in
Argentina
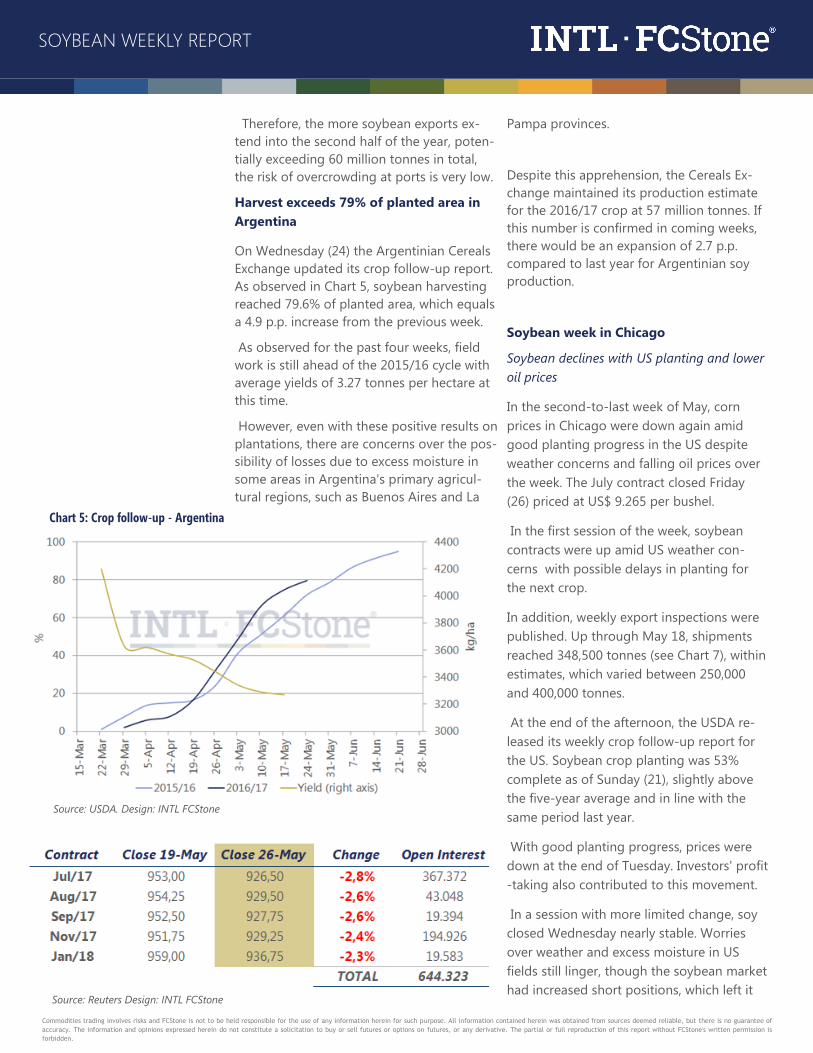
On Wednesday (24) the Argentinian Cereals
Exchange updated its crop follow-up report.
As observed in Chart 5, soybean harvesting
reached 79.6% of planted area, which equals
a 4.9 p.p. increase from the previous week.
As observed for the past four weeks, field
work is still ahead of the 2015/16 cycle with
average yields of 3.27 tonnes per hectare at
this time.
However, even with these positive results on
plantations, there are concerns over the pos-
sibility of losses due to excess moisture in
some areas in Argentina's primary agricul-
tural regions, such as Buenos Aires and La
Pampa provinces.
Despite this apprehension, the Cereals Ex-
change maintained its production estimate
for the 2016/17 crop at 57 million tonnes. If
this number is confirmed in coming weeks,
there would be an expansion of 2.7 p.p.
compared to last year for Argentinian soy
production.
Soybean week in Chicago
Soybean declines with US planting and lower
oil prices
In the second-to-last week of May, corn
prices in Chicago were down again amid
good planting progress in the US despite
weather concerns and falling oil prices over
the week. The July contract closed Friday
(26) priced at US$ 9.265 per bushel.
In the first session of the week, soybean
contracts were up amid US weather con-
cerns with possible delays in planting for
the next crop.
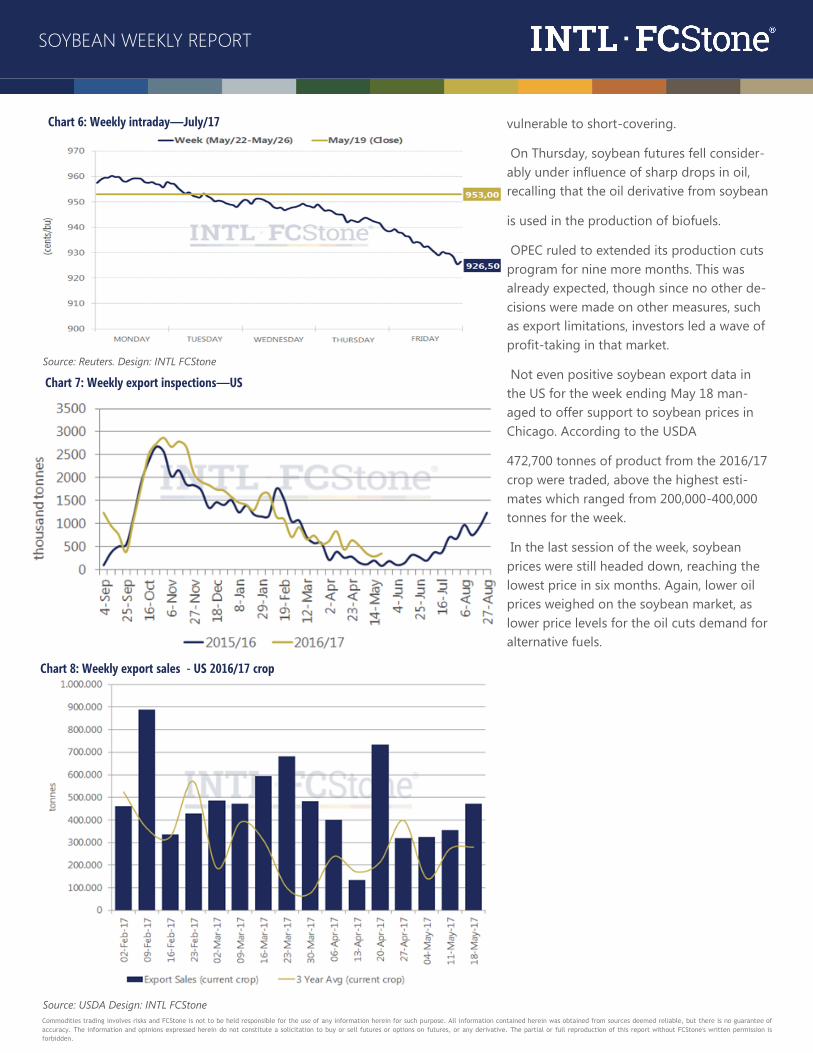
In addition, weekly export inspections were
published. Up through May 18, shipments
reached 348,500 tonnes (see Chart 7), within
estimates, which varied between 250,000
and 400,000 tonnes.
At the end of the afternoon, the USDA re-
leased its weekly crop follow-up report for
the US. Soybean crop planting was 53%
complete as of Sunday (21), slightly above
the five-year average and in line with the
same period last year.
With good planting progress, prices were
down at the end of Tuesday. Investors' profit
-taking also contributed to this movement.
In a session with more limited change, soy
closed Wednesday nearly stable. Worries
over weather and excess moisture in US
fields still linger, though the soybean market
had increased short positions, which left it
Chart 5: Crop follow-up - Argentina
Source: USDA. Design: INTL FCStone
Source: Reuters Design: INTL FCStone
Commodities trading involves risks and FCStone is not to be held responsible for the use of any information herein for such purpose. All information contained herein was obtained from sources deemed reliable, but there is no guarantee of
accuracy. The information and opinions expressed herein do not constitute a solicitation to buy or sell futures or options on futures, or any derivative. The partial or full reproduction of this report without FCStone's written permission is
forbidden.
SOYBEAN WEEKLY REPORT
vulnerable to short-covering.
On Thursday, soybean futures fell consider-
ably under influence of sharp drops in oil,
recalling that the oil derivative from soybean
is used in the production of biofuels.
OPEC ruled to extended its production cuts
program for nine more months. This was
already expected, though since no other de-
cisions were made on other measures, such
as export limitations, investors led a wave of
profit-taking in that market.
Not even positive soybean export data in
the US for the week ending May 18 man-
aged to offer support to soybean prices in
Chicago. According to the USDA
472,700 tonnes of product from the 2016/17
crop were traded, above the highest esti-
mates which ranged from 200,000-400,000
tonnes for the week.
In the last session of the week, soybean
prices were still headed down, reaching the
lowest price in six months. Again, lower oil
prices weighed on the soybean market, as
lower price levels for the oil cuts demand for
alternative fuels.
Chart 6: Weekly intraday—July/17
Source: Reuters. Design: INTL FCStone
Chart 7: Weekly export inspections—US
Chart 8: Weekly export sales - US 2016/17 crop
Source: USDA Design: INTL FCStone
Commodities trading involves risks and FCStone is not to be held responsible for the use of any information herein for such purpose. All information contained herein was obtained from sources deemed reliable, but there is no guarantee of
accuracy. The information and opinions expressed herein do not constitute a solicitation to buy or sell futures or options on futures, or any derivative. The partial or full reproduction of this report without FCStone's written permission is
forbidden.
SOYBEAN WEEKLY REPORT
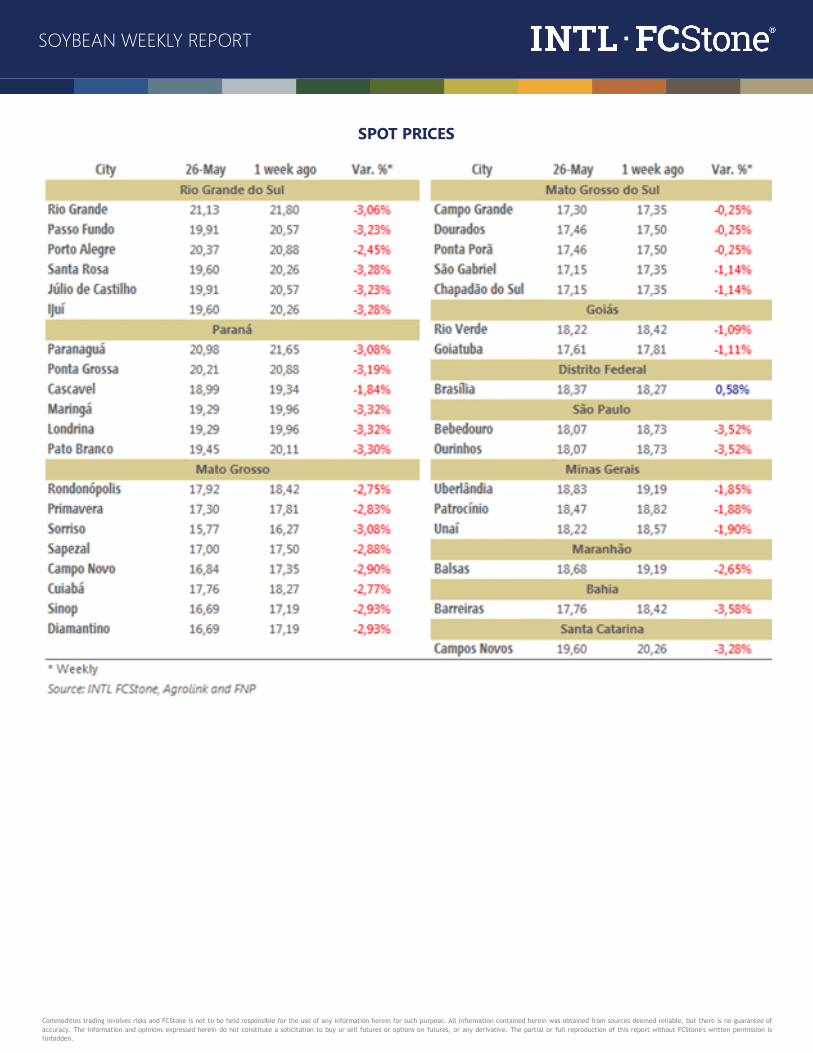
SPOT PRICES
Commodities trading involves risks and FCStone is not to be held responsible for the use of any information herein for such purpose. All information contained herein was obtained from sources deemed reliable, but there is no guarantee of
accuracy. The information and opinions expressed herein do not constitute a solicitation to buy or sell futures or options on futures, or any derivative. The partial or full reproduction of this report without FCStone's written permission is
forbidden.
SOYBEAN WEEKLY REPORT
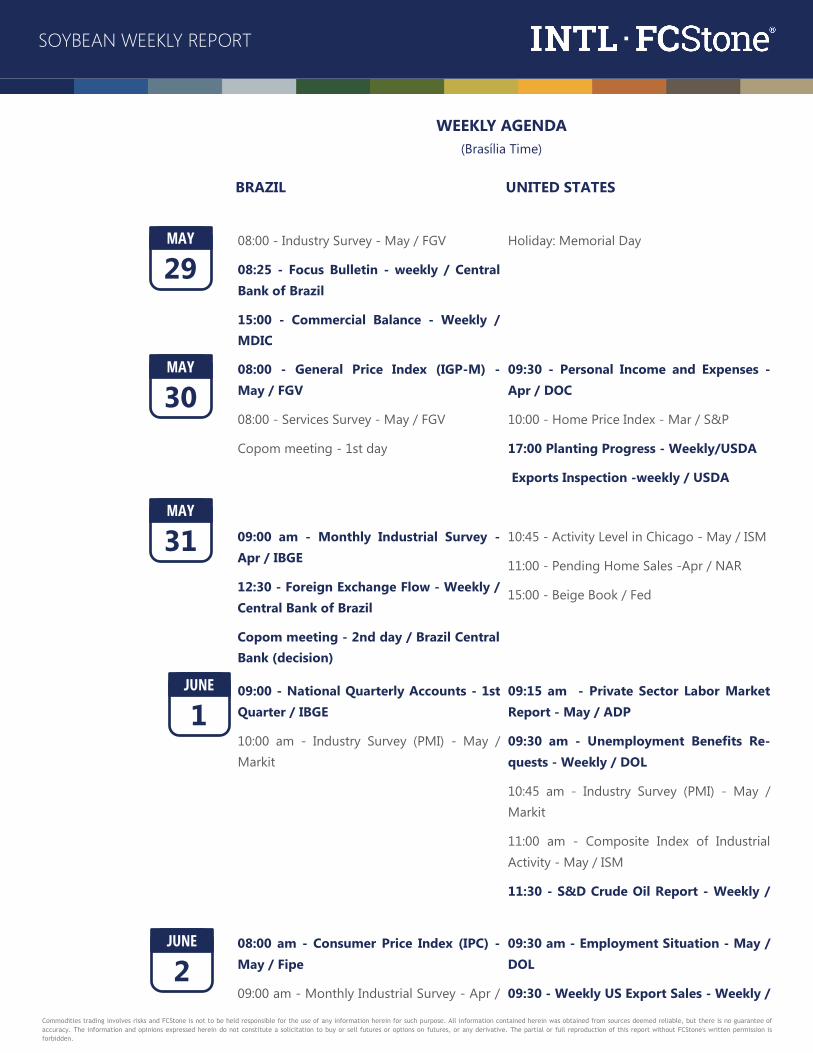
MAY
29
MAY
30
MAY
31
JUNE
1
JUNE
2 09:30 am - Employment Situation - May /
DOL
09:30 - Weekly US Export Sales - Weekly /
08:00 am - Consumer Price Index (IPC) -
May / Fipe
09:00 am - Monthly Industrial Survey - Apr /
08:00 - Industry Survey - May / FGV
08:25 - Focus Bulletin - weekly / Central
Bank of Brazil
15:00 - Commercial Balance - Weekly /
MDIC
Holiday: Memorial Day
08:00 - General Price Index (IGP-M) -
May / FGV
08:00 - Services Survey - May / FGV
Copom meeting - 1st day
09:30 - Personal Income and Expenses -
Apr / DOC
10:00 - Home Price Index - Mar / S&P
17:00 Planting Progress - Weekly/USDA
Exports Inspection -weekly / USDA
09:00 am - Monthly Industrial Survey -
Apr / IBGE
12:30 - Foreign Exchange Flow - Weekly /
Central Bank of Brazil
Copom meeting - 2nd day / Brazil Central
Bank (decision)
10:45 - Activity Level in Chicago - May / ISM
11:00 - Pending Home Sales -Apr / NAR
15:00 - Beige Book / Fed
09:00 - National Quarterly Accounts - 1st
Quarter / IBGE
10:00 am - Industry Survey (PMI) - May /
Markit
09:15 am - Private Sector Labor Market
Report - May / ADP
09:30 am - Unemployment Benefits Re-
quests - Weekly / DOL
10:45 am - Industry Survey (PMI) - May /
Markit
11:00 am - Composite Index of Industrial
Activity - May / ISM
11:30 - S&D Crude Oil Report - Weekly /
WEEKLY AGENDA
(Brasília Time)
UNITED STATES BRAZIL