Web Tables—First-Time Postsecondary Students in … education in 2011–12. This particular set of...
98
WEB TABLES U.S. DEPARTMENT OF EDUCATION SEPTEMBER 2016 NCES 2016-136 First-Time Postsecondary Students in 2011–12: A Profile This report was prepared for the National Center for Education Statistics under Contract No. ED-IES-09-C-0039 with RTI International. Mention of trade names, commercial products, or organizations does not imply endorsement by the U.S. Government. These Web Tables were authored by Alexandria Walton Radford, Erin Dunlop Velez, Alexander Bentz, Terry Lew, and Nicole Ifill of RTI International. The NCES Project Officer was David A. Richards. For questions about content or to view this report online, go to http://nces.ed.gov/pubsearch/pubsinfo.asp?pubid=2016136. During the 2011–12 academic year, approximately 4 million undergrad- uates began postsecondary education for the first time. These students enrolled in an array of institutions, including 4-year colleges and universities, public 2-year community colleges, and for-profit institutions offering career-oriented and voca- tional programs. This set of Web Tables is the first in a series of four that together provide key information about first-time postsec- ondary students’ characteristics and their 3-year retention, persistence, attainment, withdrawal, stopout, and transfer rates. The series draws upon data collected as part of the first follow-up of the 2012/14 Beginning Postsecondary Students Longitudinal Study (BPS:12/14), which followed a nationally representative cohort of first-time beginning students for the first 3 years after they began their post- secondary education in 2011–12. This particular set of Web Tables pro- vides a profile of America’s first-time postsecondary students. 1 The first section of tables presents distributions of first-time postsecondary students by personal and enrollment characteristics within the institutions that they first attended (table 1.1) and within the degree programs that they first pur- sued (table 1.2). The second section of tables focuses on 2011–12 college costs and finan- cial aid receipt. It provides estimates for all first-time postsecondary stu- dents (tables 2.1 and 2.2) as well as the 56 percent of all first-time post- secondary students who attended full time, full year only (tables 2.3 and 2.4). For each of these populations of students, the first of the two tables shown includes information on their average tuition and fees; their average total price of attendance; the percentage who received financial aid, grants, and loans; and the aver- age amounts recipients were given in these forms of aid. The second of the two tables concentrates on grant receipt, displaying the percentage who received Pell, state, institutional, and merit-only grants and the aver- age amounts recipients received for each of these types of grants. To help users locate estimates, each of the four publications in this series of Web Tables presents two versions of each table, an “A” version and a “B” version. In “A” tables, users can find information on first-time post- secondary students’ backgrounds, including their: Demographics and health • Sex • Race/ethnicity
Transcript of Web Tables—First-Time Postsecondary Students in … education in 2011–12. This particular set of...

WEB TABLES U.S. DEPARTMENT OF EDUCATION SEPTEMBER 2016 NCES 2016-136
First-Time Postsecondary Students in 2011–12:
A Profile
This report was prepared for the National Center for Education Statistics under Contract No. ED-IES-09-C-0039 with RTI International. Mention of trade names, commercial products, or organizations does not imply endorsement by the U.S. Government. These Web Tables were authored by Alexandria Walton Radford, Erin Dunlop Velez, Alexander Bentz, Terry Lew, and Nicole Ifill of RTI International. The NCES Project Officer was David A. Richards. For questions about content or to view this report online, go to http://nces.ed.gov/pubsearch/pubsinfo.asp?pubid=2016136.
During the 2011–12 academic year,
approximately 4 million undergrad-
uates began postsecondary education
for the first time. These students
enrolled in an array of institutions,
including 4-year colleges and
universities, public 2-year community
colleges, and for-profit institutions
offering career-oriented and voca-
tional programs.
This set of Web Tables is the first in a
series of four that together provide key
information about first-time postsec-
ondary students’ characteristics and
their 3-year retention, persistence,
attainment, withdrawal, stopout, and
transfer rates. The series draws upon
data collected as part of the first
follow-up of the 2012/14 Beginning
Postsecondary Students Longitudinal
Study (BPS:12/14), which followed a
nationally representative cohort of
first-time beginning students for the
first 3 years after they began their post-
secondary education in 2011–12.
This particular set of Web Tables pro-
vides a profile of America’s first-time
postsecondary students.1 The first
section of tables presents distributions
of first-time postsecondary students by
personal and enrollment characteristics
within the institutions that they first
attended (table 1.1) and within the
degree programs that they first pur-
sued (table 1.2).
The second section of tables focuses
on 2011–12 college costs and finan-
cial aid receipt. It provides estimates
for all first-time postsecondary stu-
dents (tables 2.1 and 2.2) as well as
the 56 percent of all first-time post-
secondary students who attended
full time, full year only (tables 2.3 and
2.4). For each of these populations of
students, the first of the two tables
shown includes information on
their average tuition and fees; their
average total price of attendance; the
percentage who received financial
aid, grants, and loans; and the aver-
age amounts recipients were given in
these forms of aid. The second of the
two tables concentrates on grant
receipt, displaying the percentage
who received Pell, state, institutional,
and merit-only grants and the aver-
age amounts recipients received for
each of these types of grants.
To help users locate estimates, each
of the four publications in this series
of Web Tables presents two versions
of each table, an “A” version and a
“B” version. In “A” tables, users can
find information on first-time post-
secondary students’ backgrounds,
including their:
Demographics and health
• Sex
• Race/ethnicity

2
• Immigrant generation
• Dependency status and family
responsibilities
• Age
• Military status
• Disability status
• Changes in physical health
• Changes in mental health
Family socioeconomic status
• First person in immediate family to
go to college
• Highest education attained by
parents
• Parents’ income
• Dependency status and federal
Pell Grant receipt
Support for their postsecondary
education
• Parents provide financial help
• Parents encourage student to stay
in college
• Friends from college encourage
student to stay in college
• Friends from home encourage
student to stay in college
Academic preparation
• Number of months between high
school completion and
postsecondary entry
• Recent high school graduate
• Highest high school math course
• High school grade point average
• College-level coursetaking during
high school
• Admissions test scores
“B” tables focus on students’ post-
secondary characteristics, beliefs,
and experiences during the first year
they were enrolled (2011–12) and
their postsecondary characteristics
and experiences through 2013–14,
including their:
First-year institution and degree
program characteristics
• Control and level of first institution
• Control and doctorate-degree
status of first institution
• Selectivity of first institution
• Degree program
• Bachelor’s degree program plans
First-year postsecondary beliefs and
experiences
• Knowledge of degree requirements
• Sense of belonging at institution
• Sense of ability to succeed at
institution
• Use of academic support services
• Minutes spent commuting to
campus
• Hours worked while enrolled
• Whether job(s) while enrolled were
on campus
• Highest degree expected to complete
First- through third-year enrollment
characteristics and experiences
• Attendance intensity
• Ever transfer and attempts to
transfer credits
• Direction of first transfer
• Ever stop out
• Number of degrees and certificates
pursued
• Number of changes in major
• Field of study when last enrolled
• Grade point average when last
enrolled
The specific characteristics included in
each table vary slightly, depending on
the specific population of students
represented in the table. Row labels
and footnotes on row labels will indi-
cate if the rows are specific to a given
subpopulation.
OTHER WEB TABLES IN THIS SERIES The second set of Web Tables, entitled
First-Time Postsecondary Students in
2011–12: Three-Year Retention and
Attainment at First Institution
(https://nces.ed.gov/pubsearch/
pubsinfo.asp?pubid=2016137),
presents 3-year retention and attainment
rates at the first institution students attend-
ed. These tables indicate the percentages
of 2011–12 first-time postsecondary stu-
dents who attained a certificate, an
associate’s degree, or a bachelor’s degree
by spring 2014 at the institution where
they first enrolled. If they had not attained
a credential at the first institution, the
tables specify whether they were still
enrolled at the first institution, had en-
rolled at a different institution, or had not
enrolled at any institution after leaving
the first institution. Estimates are provided
for all first-time postsecondary students as
well as for first-time postsecondary stu-
dents attending institutions of varying
control and level.
The third set of Web Tables, entitled
First-Time Postsecondary Students in
2011–12: Three-Year Persistence and
Attainment at Any Institution
(https://nces.ed.gov/pubsearch/
pubsinfo.asp?pubid=2016138),
highlights 3-year persistence and attain-
ment rates at any institution attended.
Unlike the attainment rates provided in
the second set of Web Tables, the

3
attainment rates in this set include stu-
dents who left the first institution without
a credential but later earned a degree or
certificate elsewhere. These tables indi-
cate the percentage of 2011–12 first-time
postsecondary students who attained a
certificate, an associate’s degree, or a
bachelor’s degree at any institution by
spring 2014. They also show whether
those who had not yet attained a creden-
tial were enrolled at a 4-year institution,
enrolled at a less-than-4-year institution,
or not enrolled in spring 2014. Estimates
are provided for all first-time postsecond-
ary students as well as for first-time
postsecondary students attending
institutions of varying control and
level and pursuing specific types of
degree programs.
The final set of Web Tables, entitled
First-Time Postsecondary Students in
2011–12: Three-Year Withdrawal,
Stopout, and Transfer Rates
(https://nces.ed.gov/pubsearch/
pubsinfo.asp?pubid=2016139), first
presents the year-by-year cumulative
rates at which first-time students
withdrew from postsecondary educa-
tion without a degree. Estimates are
provided for all first-time postsec-
ondary students as well as for first-
time postsecondary students attend-
ing institutions of varying control and
level. These Web Tables then turn to
stopout and transfer. Stopout is
defined as a break in enrollment of
5 or more consecutive months. The
publication reports the percentage of
first-time postsecondary students
who never stopped out as well as the
percentage of stopouts whose first
stopout period began in a particular
academic year. Transfer is defined as
leaving one institution and enrolling
in another for 4 or more consecutive
months, including both those
students who did and those who did
not attain a credential before trans-
ferring. This definition does not take
into account whether transfer credits
were granted by the subsequent
institution. The tables report the
percentage of students who never
transferred, the percentage of trans-
fers who were last enrolled at their
first institution before transferring in
a given academic year, and the per-
centage of transfers attending
institutions of varying control and
level as their first transfer destination.
OTHER RELATED NCES REPORTS Persistence and Attainment of 2011–12
First-Time Postsecondary Students
After 3 Years (NCES 2016-401).
https://nces.ed.gov/pubsearch/
pubsinfo.asp?pubid=2016401
Web Tables—Six-Year Attainment,
Persistence, Transfer, Retention, and
Withdrawal Rates of Students Who
Began Postsecondary Education
in 2003–04 (NCES 2011-152).
https://nces.ed.gov/pubsearch/
pubsinfo.asp?pubid=2011152
Persistence and Attainment of 2003–04
Beginning Postsecondary Students:
After Six Years (NCES 2011-151).
http://nces.ed.gov/pubsearch/
pubsinfo.asp?pubid=2011151
Descriptive Summary of 2003–04
Beginning Postsecondary Students:
Three Years Later (NCES 2008-174).
http://nces.ed.gov/pubsearch/
pubsinfo.asp?pubid=2008174
Persistence and Attainment of 2003–04
Beginning Postsecondary Students:
After Three Years (NCES 2007-169).
http://nces.ed.gov/pubsearch/
pubsinfo.asp?pubid=2007169
DATA The estimates presented in these tables
were generated from the first follow-up
of the 2012/14 Beginning Postsecondary
Students Longitudinal Study (BPS:12/14),
a nationally representative study of the
approximately 4 million first-time begin-
ning students who were first enrolled in
postsecondary education between July
1, 2011, and June 30, 2012. It was con-
ducted as part of a suite of studies
sponsored by the National Center for
Education Statistics (NCES) that explore
how students finance their education,
their postsecondary outcomes, and their
early labor market experiences.
The BPS cohort was originally identified
from respondents to the 2011–12
National Postsecondary Student Aid
Study (NPSAS:12). NPSAS:12 used a two-
stage sampling design. First, eligible
institutions were sampled from among
the larger universe of Title IV participating
schools in the 50 states and the District of
Columbia. Approximately 1,690 institu-
tions were sampled for NPSAS:12. Then
eligible students were sampled from
enrollment lists provided by those institu-
tions, which detailed all enrollees
between July 1, 2011, and June 30, 2012.
At the conclusion of NPSAS:12, a prelimi-
nary BPS cohort was identified. Eligibility
was further refined via responses to
subsequent student interviews and ad-
ministrative data collections.

4
Approximately 35,540 students were
eligible for BPS:12/14 and the weighted
student-level response rate was
67.6 percent.
The estimates in these tables reflect
data from approximately 24,800 stu-
dents who participated in the NPSAS:12
data collection and the first BPS follow-
up (conducted in 2013–14, some
3 years after entry into postsecondary
education). This sample represents the
approximately 4 million students who
were first-time entrants to postsecond-
ary education in the 2011–12 academic
year. Like other NCES studies, BPS:12/14
collected data from a variety of sources,
including web- or phone-based student
interviews conducted as part of
NPSAS:12 and in 2013–14; institutional
records; federal financial aid applica-
tions and records of federal financial
aid awards; and the National Student
Clearinghouse. Detailed information
about NCES data collections and an
overview of survey methodology are
available in the following data file
documentation reports:
• 2012/14 Beginning Postsecondary
Students Longitudinal Study
(BPS:12/14) Data File Documentation
(NCES 2016-062).
https://nces.ed.gov/pubsearch/
pubsinfo.asp?pubid=2016062
• 2011–12 National Postsecondary
Student Aid Study (NPSAS:12) Data
File Documentation (NCES 2014-182).
https://nces.ed.gov/pubsearch/
pubsinfo.asp?pubid=2014182
VARIABLES USED
The variables used in these Web Tables are listed below. Visit the NCES
DataLab website http://nces.ed.gov/datalab to view detailed information
on question wording for variables coming directly from an interview,
how variables were constructed, and their sources. The program files that
generated the statistics presented in these Web Tables can be found at
http://nces.ed.gov/pubsearch/pubsinfo.asp?pubid=2016136.
Label Name
Age as of December 31, 2011 AGE
Attendance intensity through June 2014 ENINPT3Y
Control and doctorate-granting status of first institution SECTOR10
Control and level of first institution FSECTOR
Degree program, 2011–12 UGDEG
Dependency status and family responsibilities, 2011–12 DEPEND5B
Dependency status and federal Pell Grant receipt, 2011–12 PELLDEP
Dependent students: parents’ income, 2010 DEPINC
Dependent students: parents provided financial help for housing, tuition, or other expenses, 2011–12 PARHELP
Direction of first transfer by institution level through June 2014 TFINLV3Y
Ever stopped out through June 2014 STNUM3Y
Ever transferred through June 2014 TFNUM3Y
Ever transferred through June 2014: attempted to transfer credits TFNPATT
Federal Pell grants, 2011–12 PELL12
Field of study when last enrolled through June 2014 MAJ4Y14
First person in immediate family to go to college FIRSTCOL
Full time/full year ATTNSTAT
Grade point average estimate when last enrolled through June 2014 GPALAST14
Has some type of disability, 2011–12 DISABLE
Highest degree ever expected to complete, 2011–12 HIGHLVEX
Highest education attained by either parent, 2011–12 PAREDUC
Hours worked per week while enrolled, 2011–12 HRSWK12
Immigrant generation IMMIGEN
Institutional grants, 2011–12 INGRTAMT
Location of job(s) while enrolled, 2011–12 LOCJOB12
Merit-only grants, 2011–12 MERITAID
Number of changes in major at any institution through June 2014 MAJCHG14
Number of degrees and certificates pursued through June 2014 DEGNUM3Y
Number of minutes to commute to campus, 2011–12 TRLNPAVT
Number of months between high school completion and postsecondary entry ELAPSE
Plan to continue to a bachelor’s degree program within 5 years, 2011–12 EXPBA
Variables continued on next page.

5
VARIABLES USED—continued
Label Name
Race/ethnicity RACE
Recent high school graduate RCNTGRAD
Selectivity of first institution SELECTV2
Self-perception of change in mental health between 2012 and 2014 MENTHDIF
Self-perception of change in physical health between 2012 and 2014 PHYSHDIF
Self-reported remedial coursetaking, 2011–12 REMSTAT
Sex GENDER
State grants, 2011–12 STGTAMT
Strongly agree friends from college encourage me to stay in college, 2011–12 FSSUPP
Strongly agree friends from home encourage me to stay in college, 2011–12 FHSUPP
Strongly agree have ability to succeed as a student at first institution, 2011–12 CURCONF
Strongly agree know requirements needed to complete degree program, 2011–12 KNOWCLAS
Strongly agree that “I feel that I am a part of my first institution,” 2011–12 BELONG
Student loans, 2011–12 TOTLOAN2
Students under age 24: strongly agree parents encourage me to stay in college, 2011–12 PARSUPP
Students under age 30: admissions test scores (ACT/SAT) TESATDER
Students under age 30: high school grade point average HSGPA
Students under age 30: highest level of high school mathematics completed or planned HCMATHHI
Students under age 30: took any college-level courses while in high school HSTKANY
Total aid, 2011–12 TOTAID
Total grants, 2011–12 TOTGRT
Total price of attendance, 2011–12 BUDGETAJ
Tuition and fees, 2011–12 TUITION2
Used academic support services, 2011–12 USEACSP
Veterans and military service members on active duty, in the reserves, or in the National Guard, 2011–12 MILTYP14
ANALYSIS The estimates presented in these
Web Tables were produced using
PowerStats, a web-based software
application that enables users to gen-
erate tables for most of the surveys
conducted by NCES. Samples drawn for
such NCES studies as BPS are not sim-
ple random samples; therefore, simple
random sample techniques for estimat-
ing sampling errors cannot be applied
to these data. PowerStats takes into
account the complexity of the sam-
pling procedures and calculates
standard errors appropriate for such
samples. The method for computing
sampling errors used by PowerStats
involves approximating the estimator
by replication of the sampled popula-
tion using a bootstrap technique.
With PowerStats, users can replicate or
expand upon the tables presented here.
The output from PowerStats includes
the table estimates (e.g., percentages
or means), the design-adjusted stand-
ard errors, and weighted sample sizes
for the estimates. If the number of
valid cases is too small to produce a
reliable estimate (fewer than 30 cases),
PowerStats prints the double dagger
symbol (‡) instead of the estimate.
In addition to producing tables,
PowerStats users may conduct linear
or logistic regressions. Many options
are available for output with the
regression results. For a description
of all the options available, users
should access the PowerStats
website at http://nces.ed.gov/
datalab/index.aspx.
For more information, contact
(800) 677-6987
For readers with disabilities, a
Section 508-compliant version of
these Web Tables is available at
http://nces.ed.gov/pubsearch/
pubsinfo.asp?pubid=2016136.
ENDNOTES
1 Descriptions of the other sets of Web Tables in this series can be found under “Other Web Tables in This Series.”

National Center for Education Statistics
Personal characteristics TotalPublic 2-year
Public 4-year
Private nonprofit
4-year For-profit
Total 100.0 100.0 100.0 100.0 100.0
SexMale 44.2 47.2 45.4 40.9 36.9Female 55.8 52.8 54.6 59.1 63.1
Race/ethnicity1
White 55.7 53.1 61.0 63.9 42.5Black 14.0 13.4 12.6 11.8 20.6Hispanic 19.7 23.9 14.4 11.4 29.5Asian 5.5 4.8 7.1 8.2 1.4Other or Two or more races 5.1 4.8 5.0 4.7 6.0
Immigrant generation2
Immigrant 7.5 10.3 5.6 5.8 6.0Second-generation American 18.9 20.1 17.7 17.7 20.1Third-generation or higher American 73.6 69.6 76.7 76.5 73.9
Dependency status and family responsibilities, 2011–123
Dependent 76.0 70.5 91.1 93.5 40.5Independent 24.0 29.5 8.9 6.5 ! 59.5 Unmarried, no dependent(s) 8.5 11.2 4.2 3.1 16.1 Unmarried, with dependent(s) 8.9 9.2 2.8 ‡ 27.7 Married 6.7 9.1 1.8 ‡ 15.8
Age as of December 31, 201118 years or younger 48.0 42.4 59.8 64.4 21.319 years 26.6 25.7 31.6 28.9 15.520–23 years 10.5 13.3 4.8 3.5 23.424–29 years 6.7 8.6 1.5 ‡ 18.630 years or older 8.1 10.1 2.3 ‡ 21.2
Veterans and military service members on active duty, in the reserves, or in the National Guard, 2011–12
Yes 2.7 3.0 1.8 0.6 ! 6.4No 97.3 97.0 98.2 99.4 93.6
Has some type of disability, 2011–12Yes 11.6 12.7 9.8 9.5 14.8No 88.4 87.3 90.2 90.5 85.2
Table 1.1-A.Percentage distribution of 2011–12 first-time postsecondary students’ personal characteristics, by control and level of first institution: 2012–14
Control and level of first institution
See notes at end of table.
– 6 –

National Center for Education Statistics
Personal characteristics TotalPublic 2-year
Public 4-year
Private nonprofit
4-year For-profit
Self-perception of change in physical health between 2012 and 2014
Declined 21.3 22.8 20.1 19.3 21.9Constant 48.2 47.3 49.0 51.6 45.2Improved 30.5 30.0 30.9 29.1 32.9
Self-perception of change in mental health between 2012 and 2014
Declined 22.9 25.1 20.4 22.3 23.3Constant 45.5 44.2 48.3 45.2 42.7Improved 31.6 30.7 31.3 32.5 34.0
First person in immediate family to go to collegeDo not know 2.2 2.8 1.2 0.6 4.1Yes 18.4 22.3 12.0 8.5 32.2No 79.4 74.8 86.8 90.9 63.7
Highest education attained by either parent, 2011–12Do not know 4.0 5.1 2.2 1.6 6.7High school diploma or less 31.2 37.2 21.0 14.3 55.3Some postsecondary education 26.5 31.0 24.3 20.6 24.8Bachelor’s degree or higher 38.4 26.7 52.5 63.5 13.2
Dependent students: parents’ income, 20104
Less than $30,000 27.2 32.2 20.9 16.4 60.7$30,000–59,999 21.9 25.7 19.6 18.2 24.8$60,000–89,999 18.5 21.1 18.9 16.9 8.2$90,000 or more 32.4 21.1 40.6 48.5 6.2
Dependency status and federal Pell Grant receipt, 2011–12Dependent, received 31.7 30.2 33.7 30.9 32.9Independent, received 17.3 17.5 6.3 5.3 ! 52.5Did not receive 51.0 52.4 60.0 63.8 14.6
Dependent students: parents provided financial help for housing, tuition, or other expenses, 2011–12
Yes 78.6 71.3 82.3 89.1 67.6No 21.4 28.7 17.7 10.9 32.4
Students under age 24: strongly agree parents encourage me to stay in college, 2011–12
Yes 84.8 80.1 88.9 90.0 79.3No 15.2 19.9 11.1 10.0 20.7
Strongly agree friends from college encourage me to stay in college, 2011–12
Yes 56.7 44.6 66.3 72.1 51.6No 43.3 55.4 33.7 27.9 48.4
Table 1.1-A.Percentage distribution of 2011–12 first-time postsecondary students’ personal characteristics, by control and level of first institution: 2012–14—Continued
Control and level of first institution
See notes at end of table.
– 7 –

National Center for Education Statistics
Personal characteristics TotalPublic 2-year
Public 4-year
Private nonprofit
4-year For-profit
Strongly agree friends from home encourage me to stay in college, 2011–12
Yes 62.8 56.7 67.2 70.9 60.9No 37.2 43.3 32.8 29.1 39.1
Number of months between high school completion and postsecondary entry5
0–12 73.6 68.3 87.8 91.3 37.713 or more 26.4 31.7 12.2 8.7 62.3
Recent high school graduate6
Yes 68.4 61.6 85.7 87.9 29.4No 31.6 38.4 14.3 12.1 70.6
Students under age 30: highest level of high school mathematics completed or planned7
Less than algebra 2 15.9 23.9 6.5 6.0 30.3Algebra 2 29.0 37.4 20.0 15.3 43.3Trigonometry 9.0 6.4 12.3 12.4 4.4Precalculus 22.0 20.9 26.0 23.2 13.8Calculus, math beyond calculus, or statistics 24.0 11.5 35.1 43.2 8.2
Students under age 30: high school grade point averageLess than 2.50 23.8 34.4 13.3 8.9 38.02.50–2.99 14.3 16.0 14.3 9.8 15.33.00–3.49 37.9 34.7 42.5 40.9 31.93.50 or higher 24.0 14.9 30.0 40.5 14.8
Students under age 30: took any college-level courses while in high school8
Yes 58.2 44.5 73.7 78.5 32.6No 41.8 55.5 26.3 21.5 67.4
See notes at end of table.
Table 1.1-A.Percentage distribution of 2011–12 first-time postsecondary students’ personal characteristics, by control and level of first institution: 2012–14—Continued
Control and level of first institution
– 8 –

National Center for Education Statistics
Personal characteristics TotalPublic 2-year
Public 4-year
Private nonprofit
4-year For-profit
Students under age 30: admissions test scores (ACT/SAT)9
400–860 25.9 38.9 16.4 12.9 46.5861–1000 25.2 27.8 26.0 19.7 24.11001–1150 25.1 21.6 30.1 25.4 17.21151–1600 23.7 11.7 27.5 42.0 12.1
2 First-time foreign students with visas are excluded here. Immigrants include foreign-born first-time students who were U.S. citizens with one or both parent(s) born outside of the United States, resident aliens, or noncitizens eligible for citizenship. Second-generation Americans include U.S.-born first-time students with one or both parent(s) foreign born. Third-generation or higher Americans include U.S.- and foreign-born first-time students with both parents born in the United States.
‡ Reporting standards not met.1 Black includes African American, Hispanic includes Latino, and Other or Two or more races includes American Indian or Alaska Native, Pacific Islander or Native Hawaiian, and first-time students having origins in more than one race. Race categories exclude Hispanic origin.
Table 1.1-A.Percentage distribution of 2011–12 first-time postsecondary students’ personal characteristics, by control and level of first institution: 2012–14—Continued
Control and level of first institution
! Interpret data with caution. Estimate is unstable because the standard error represents more than 30 percent but less than 51 percent of the estimate.
9 First-time students who did not take the SAT or ACT are excluded here. Admissions test scores reflect first-time students’ combined SAT verbal and math score. If SAT scores were not available, ACT scores were converted into an estimated combined SAT verbal and math score.
SOURCE: U.S. Department of Education, National Center for Education Statistics, 2012/14 Beginning Postsecondary Students Longitudinal Study (BPS:12/14).
8 Includes college courses for credit, Advanced Placement (AP), and International Baccalaureate (IB) courses.
NOTE: Estimates include individuals who were first-time postsecondary students in 2011–12 at Title IV eligible postsecondary institutions in the 50 states and the District of Columbia. Detail may not sum to totals because of rounding.
6 Recent high school graduates only include first-time students who graduated from high school with a regular high school diploma in 2011 or 2012. 7 Math coursetaking data come from two sources: surveys first-time students completed when they took the ACT or SAT I in high school and BPS interviews first-time students completed in the base year or first follow-up. First-time students who reported this information on an entrance examination survey may not have completed all courses at the time they took the survey.
5 First-time students who did not complete a high school diploma, certificate, or equivalency are excluded here.
3 First-time students classified as independent include those age 24 or over and those under 24 who are married, have dependents, are veterans or on active duty, are orphans or wards of the courts, are homeless or at risk of homelessness, or were determined to be independent by a financial aid officer using professional judgment. Other first-time students under age 24 are considered to be dependent. Within marital status, the unmarried category includes first-time students who are divorced, separated, or widowed. First-time students are considered to have a dependent if they have a child or any others for whom they are the caretaker or have financial responsibility. A spouse is not considered to be a dependent.4 Income in 2010 is used because it was reported on the federal financial aid application and used for federal need analysis for 2011–12.
– 9 –

National Center for Education Statistics
Personal characteristics TotalPublic 2-year
Public 4-year
Private nonprofit
4-year For-profit
Total † † † † †
SexMale 0.60 0.92 1.12 1.31 1.79Female 0.60 0.92 1.12 1.31 1.79
Race/ethnicityWhite 0.82 1.18 1.30 1.13 2.30Black 0.59 0.80 1.22 1.07 1.69Hispanic 0.58 0.93 0.82 0.61 2.12Asian 0.28 0.45 0.63 0.67 0.32Other or Two or more races 0.27 0.46 0.60 0.43 0.91
Immigrant generationImmigrant 0.37 0.71 0.44 0.56 0.61Second-generation American 0.48 1.03 0.90 0.84 1.29Third-generation or higher American 0.57 1.23 1.07 0.93 1.44
Dependency status and family responsibilities, 2011–12Dependent 0.63 1.72 1.28 2.36 1.91Independent 0.63 1.72 1.28 2.36 1.91 Unmarried, no dependent(s) 0.36 0.93 0.97 0.86 1.39 Unmarried, with dependent(s) 0.38 0.65 0.53 † 1.22 Married 0.47 0.94 0.35 † 1.19
Age as of December 31, 201118 years or younger 0.68 1.60 1.31 1.79 1.3819 years 0.55 1.00 0.93 1.10 1.0520–23 years 0.43 0.86 0.52 0.61 1.3824–29 years 0.41 0.91 0.36 † 1.2730 years or older 0.34 0.78 0.51 † 1.41
Veterans and military service members on active duty, in the reserves, or in the National Guard, 2011–12
Yes 0.32 0.49 0.53 0.25 1.69No 0.32 0.49 0.53 0.25 1.69
Has some type of disability, 2011–12Yes 0.36 0.73 0.63 1.19 0.92No 0.36 0.73 0.63 1.19 0.92
Table S1.1-A.Standard errors for table 1.1-A: Percentage distribution of 2011–12 first-time postsecondary students’ personal characteristics, by control and level of first institution: 2012–14
Control and level of first institution
See notes at end of table.
– 10 –

National Center for Education Statistics
Personal characteristics TotalPublic 2-year
Public 4-year
Private nonprofit
4-year For-profit
Self-perception of change in physical health between 2012 and 2014
Declined 0.49 0.87 0.83 0.82 1.06Constant 0.89 1.06 1.29 1.37 1.63Improved 0.69 0.90 1.22 1.12 1.35
Self-perception of change in mental health between 2012 and 2014
Declined 0.58 0.79 0.89 1.69 1.53Constant 0.58 0.97 1.15 1.22 1.66Improved 0.77 1.00 1.53 1.15 1.69
First person in immediate family to go to collegeDo not know 0.19 0.39 0.23 0.12 0.56Yes 0.44 0.89 0.79 0.80 1.27No 0.47 0.92 0.83 0.80 1.39
Highest education attained by either parent, 2011–12Do not know 0.27 0.49 0.33 0.29 0.95High school diploma or less 0.54 1.06 0.99 1.04 1.40Some postsecondary education 0.49 0.93 1.00 0.87 1.18Bachelor’s degree or higher 0.62 0.91 1.00 1.29 1.04
Dependent students: parents’ income, 2010Less than $30,000 0.53 1.10 0.78 0.82 2.59$30,000–59,999 0.66 0.91 0.90 1.72 2.44$60,000–89,999 0.51 1.09 0.85 0.85 0.91$90,000 or more 0.82 1.19 0.95 2.40 0.90
Dependency status and federal Pell Grant receipt, 2011–12Dependent, received 0.60 1.18 1.47 3.15 1.73Independent, received 0.74 0.83 1.35 2.24 1.29Did not receive 0.56 1.10 0.79 1.42 1.71
Dependent students: parents provided financial help for housing, tuition, or other expenses, 2011–12
Yes 0.62 1.09 1.09 0.81 2.10No 0.62 1.09 1.09 0.81 2.10
Students under age 24: strongly agree parents encourage me to stay in college, 2011–12
Yes 0.44 1.01 0.68 0.79 1.63No 0.44 1.01 0.68 0.79 1.63
Strongly agree friends from college encourage me to stay in college, 2011–12
Yes 1.09 1.16 1.31 0.90 1.37No 1.09 1.16 1.31 0.90 1.37
Table S1.1-A.Standard errors for table 1.1-A: Percentage distribution of 2011–12 first-time postsecondary students’ personal characteristics, by control and level of first institution: 2012–14—Continued
See notes at end of table.
Control and level of first institution
– 11 –

National Center for Education Statistics
Personal characteristics TotalPublic 2-year
Public 4-year
Private nonprofit
4-year For-profit
Strongly agree friends from home encourage me to stay in college, 2011–12
Yes 0.62 0.98 1.16 1.26 1.29No 0.62 0.98 1.16 1.26 1.29
Number of months between high school completion and postsecondary entry
0–12 0.68 1.74 0.98 2.19 1.8013 or more 0.68 1.74 0.98 2.19 1.80
Recent high school graduateYes 0.78 1.88 0.88 2.30 1.51No 0.78 1.88 0.88 2.30 1.51
Students under age 30: highest level of high school mathematics completed or planned
Less than algebra 2 0.65 1.30 0.56 0.49 1.51Algebra 2 0.54 1.09 0.87 1.03 1.22Trigonometry 0.34 0.51 0.82 0.72 0.56Precalculus 0.62 1.21 0.89 0.81 1.06Calculus, math beyond calculus, or statistics 0.43 0.63 1.15 1.15 0.67
Students under age 30: high school grade point averageLess than 2.50 0.53 1.04 0.67 0.71 1.522.50–2.99 0.40 0.70 0.75 0.66 1.053.00–3.49 0.59 0.92 0.99 1.76 1.613.50 or higher 0.47 0.86 0.76 1.45 0.89
Students under age 30: took any college-level courses while in high school
Yes 0.62 1.28 1.40 0.95 1.64No 0.62 1.28 1.40 0.95 1.64
Students under age 30: admissions test scores (ACT/SAT)400–860 0.66 1.10 1.05 0.97 2.14861–1000 0.56 1.07 0.95 1.01 1.701001–1150 0.57 1.05 1.14 0.93 1.561151–1600 0.59 1.01 0.97 1.16 1.32
† Not applicable.SOURCE: U.S. Department of Education, National Center for Education Statistics, 2012/14 Beginning Postsecondary Students Longitudinal Study (BPS:12/14).
Control and level of first institution
Table S1.1-A.Standard errors for table 1.1-A: Percentage distribution of 2011–12 first-time postsecondary students’ personal characteristics, by control and level of first institution: 2012–14—Continued
– 12 –

National Center for Education Statistics
Enrollment characteristics TotalPublic 2-year
Public 4-year
Private nonprofit
4-year For-profit
Total 100.0 100.0 100.0 100.0 100.0
Control and doctorate-granting status of first institution1
Public 4-year non-doctorate-granting 20.6 † 31.0 † †Public 4-year doctorate-granting 45.9 † 69.0 † †Private nonprofit 4-year non-doctorate-granting 13.6 † † 40.5 †Private nonprofit 4-year doctorate-granting 20.0 † † 59.5 †
Selectivity of first institution2
Very selective 27.1 † 25.5 41.1 #Moderately selective 40.9 † 48.7 41.3 ‡Minimally selective 13.1 † 7.9 12.3 ‡Open admission 18.9 † 18.0 5.3 ! 58.2
Degree program, 2011–12No certificate or degree 1.8 3.5 ‡ ‡ 0.4 !Undergraduate certificate 10.2 6.4 ‡ ‡ 47.3Associate’s degree 42.3 90.1 7.3 3.1 ! 32.7Bachelor’s degree 45.8 † 91.2 95.7 19.7
Plan to continue to a bachelor’s degree program within 5 years, 2011–123
Yes 77.3 78.2 83.6 ‡ 66.5No 22.7 21.8 16.4 ‡ 33.5
Strongly agree know requirements needed to complete degree program, 2011–124
Yes 58.7 53.8 56.2 64.3 71.3No 41.3 46.2 43.8 35.7 28.7
Strongly agree that “I feel that I am a part of my first institution.”
Yes 46.0 37.4 45.7 55.0 58.8No 54.0 62.6 54.3 45.0 41.2
Strongly agree have ability to succeed as a student at first institution, 2011–12
Yes 60.4 60.6 56.7 61.7 66.0No 39.6 39.4 43.3 38.3 34.0
Used academic support services, 2011–12Yes 32.8 22.5 41.8 49.1 24.3No 67.2 77.5 58.2 50.9 75.7
Table 1.1-B.Percentage distribution of 2011–12 first-time postsecondary students’ enrollment characteristics, by control and level of first institution: 2012–14
Control and level of first institution
See notes at end of table.
– 13 –

National Center for Education Statistics
Enrollment characteristics TotalPublic 2-year
Public 4-year
Private nonprofit
4-year For-profit
Self-reported remedial coursetaking, 2011–12Yes 22.0 34.6 17.8 9.3 11.3No 78.0 65.4 82.2 90.7 88.7
Number of minutes to commute to campus, 2011–12Did not commute to campus 39.9 12.8 58.8 78.8 31.21–15 19.9 29.3 15.7 5.6 18.416–30 24.4 38.0 15.4 7.9 24.6More than 30 15.8 19.9 10.1 7.6 25.8
Hours worked per week while enrolled, 2011–12Did not hold a job 63.1 56.0 66.9 66.3 69.81–15 8.8 5.4 10.7 18.9 3.216–34 16.1 20.5 15.7 10.8 11.235 or more 11.9 18.1 6.6 4.0 15.8
Location of job(s) while enrolled, 2011–12Did not hold a job 63.1 56.0 66.9 66.3 69.8Worked on campus 5.9 1.6 7.2 18.5 0.5Worked off campus only 31.0 42.4 25.9 15.2 29.7
Highest degree ever expected to complete, 2011–125
Undergraduate certificate 4.6 2.8 ‡ ‡ 22.2Associate’s degree 11.6 20.1 ‡ ‡ 21.0Bachelor’s degree 36.8 42.2 35.5 28.9 34.6Advanced degree 47.0 34.9 63.0 69.4 22.3
Attendance intensity through June 20146
Always full time 59.5 37.4 71.3 82.5 67.5Mixed 30.0 40.7 25.4 17.0 26.4Always part time 10.5 21.9 3.3 0.5 ! 6.1
Ever transferred through June 20147
Yes 17.9 20.2 17.7 17.2 12.2 Attempted to transfer credits 10.9 12.3 11.9 11.8 3.9 Did not attempt to transfer credits 6.9 7.9 5.9 5.4 8.3No 82.1 79.8 82.3 82.8 87.8
See notes at end of table.
Table 1.1-B.Percentage distribution of 2011–12 first-time postsecondary students’ enrollment characteristics, by control and level of first institution: 2012–14—Continued
Control and level of first institution
– 14 –

National Center for Education Statistics
Enrollment characteristics TotalPublic 2-year
Public 4-year
Private nonprofit
4-year For-profit
Direction of first transfer by institution level through June 20147
Did not transfer 82.1 79.8 82.3 82.8 87.84-year to 4-year 5.2 † 10.3 10.8 2.94-year to 2-year 3.6 † 7.2 6.1 3.12-year to 4-year 4.7 11.6 # # 0.92-year to 2-year 3.2 7.6 # # 1.5Transfers to and from less-than-2-year institutions 1.2 1.0 0.3 ! 0.3 ! 3.9
Ever stopped out through June 20148
Yes 17.2 22.8 13.0 11.3 17.4No 82.8 77.2 87.0 88.7 82.6
Number of degrees and certificates pursued through June 20149
One 73.1 66.3 76.7 78.9 77.6More than one 26.9 33.7 23.3 21.1 22.4
Number of changes in major at any institution through June 201410
Zero 70.1 69.0 61.1 70.2 90.4One 20.4 20.0 27.0 21.8 6.7More than one 9.5 10.9 11.9 8.0 2.9
Field of study when last enrolled through June 201411
Computer and information sciences 3.9 3.9 4.0 3.0 4.8Engineering and engineering technology 6.4 6.5 7.7 6.5 3.6Biology and physical science, science technology, math, agriculture 8.5 5.4 13.1 13.2 1.0General studies and other 5.4 11.0 2.8 2.0 1.0Social sciences 9.5 6.4 12.9 15.8 2.9Humanities 7.3 5.3 8.4 13.5 2.4Health care fields 17.6 18.8 13.2 9.5 32.6Business 14.6 14.4 15.3 14.5 14.0Education 5.6 5.9 6.4 6.3 2.3 !Other applied 21.3 22.5 16.1 15.6 35.4
Control and level of first institution
See notes at end of table.
Table 1.1-B.Percentage distribution of 2011–12 first-time postsecondary students’ enrollment characteristics, by control and level of first institution: 2012–14—Continued
– 15 –

National Center for Education Statistics
Enrollment characteristics TotalPublic 2-year
Public 4-year
Private nonprofit
4-year For-profit
Grade point average estimate when last enrolled through June 2014
Less than 2.25 10.6 15.3 8.7 4.4 9.12.25–2.74 17.4 20.0 18.5 10.6 15.42.75–3.24 21.9 21.2 24.5 23.0 17.73.25–3.74 32.6 28.1 33.2 41.1 33.33.75 or higher 17.6 15.4 15.0 20.9 24.5
10 First-time students who never enrolled in an associate’s or bachelor’s degree program or who never declared a major are excluded here.
9 First-time students who did not pursue any certificates or degrees through June 2014 are excluded here.
6 Full-time status for the purposes of financial aid eligibility is based on 12 credit hours unless the awarding institution employed a different standard. 7 A transfer is defined as leaving one institution and enrolling in another institution for 4 or more consecutive months.
4 First-time students who were not enrolled in a degree or certificate program or who attained a degree or certificate during the 2011–12 academic year are excluded here.5 First-time students who did not expect to complete a certificate or degree are excluded here. Advanced degree includes post-BA or post-master certificates, master’s degrees, professional practice doctor’s degrees, and research/scholarship and other doctor’s degrees.
8 A stopout is defined as a break in enrollment of 5 or more consecutive months.
11 First-time students who were not in a degree or certificate program when last enrolled are excluded here. General studies and other includes general studies, basic skills, and citizenship activities; leisure and recreational activities; personal awareness and self-improvement; high school/secondary diplomas and certificate programs; and interpersonal and social skills. Other applied includes personal and consumer services; manufacturing, construction, repair, and transportation; military technology and protective services; architecture; communications; public administration and human services; design and applied arts; law and legal studies; library sciences; and theology and religious vocations.
† Not applicable.
3 First-time students who were enrolled in a certificate or bachelor’s degree program are excluded here because information on their bachelor’s degree plans was not collected.
2 First-time students who were enrolled in a less-than-4-year institution are excluded here. Selectivity is based on institutional data from the Integrated Postsecondary Education Data System (IPEDS). Non-open admission institutions’ selectivity is determined by an index that uses the centile distribution of the percentage of applicants who were admitted and the centile distribution of the midpoint between the 25th and 75th percentile SAT/ACT combined scores.
! Interpret data with caution. Estimate is unstable because the standard error represents more than 30 percent but less than 51 percent of the estimate.‡ Reporting standards not met.
# Rounds to zero.
Table 1.1-B.Percentage distribution of 2011–12 first-time postsecondary students’ enrollment characteristics, by control and level of first institution: 2012–14—Continued
Control and level of first institution
NOTE: Estimates include individuals who were first-time postsecondary students in 2011–12 at Title IV eligible postsecondary institutions in the 50 states and the District of Columbia. Detail may not sum to totals because of rounding.
1 First-time students who were enrolled in a for-profit institution or a less-than-4-year public or private institution are excluded here.
SOURCE: U.S. Department of Education, National Center for Education Statistics, 2012/14 Beginning Postsecondary Students Longitudinal Study (BPS:12/14).
– 16 –

National Center for Education Statistics
Enrollment characteristics TotalPublic 2-year
Public 4-year
Private nonprofit
4-year For-profit
Total † † † † †
Control and doctorate-granting status of first institutionPublic 4-year non-doctorate-granting 0.92 † 1.57 † †Public 4-year doctorate-granting 1.47 † 1.57 † †Private nonprofit 4-year non-doctorate-granting 0.49 † † 1.06 †Private nonprofit 4-year doctorate-granting 0.70 † † 1.06 †
Selectivity of first institutionVery selective 1.15 † 1.82 1.96 †Moderately selective 1.29 † 1.74 2.45 †Minimally selective 0.66 † 0.68 1.31 †Open admission 0.77 † 1.22 2.32 4.34
Degree program, 2011–12No certificate or degree 0.23 0.50 † † 0.16Undergraduate certificate 0.39 1.07 † † 3.05Associate’s degree 0.81 1.19 0.70 1.47 1.79Bachelor’s degree 0.58 † 0.87 2.20 2.13
Plan to continue to a bachelor’s degree program within 5 years, 2011–12
Yes 0.89 0.98 3.04 † 2.21No 0.89 0.98 3.04 † 2.21
Strongly agree know requirements needed to complete degree program, 2011–12
Yes 0.59 1.12 1.04 1.05 1.39No 0.59 1.12 1.04 1.05 1.39
Strongly agree that “I feel that I am a part of my first institution.”
Yes 0.67 0.89 1.10 1.81 1.23No 0.67 0.89 1.10 1.81 1.23
Strongly agree have ability to succeed as a student at first institution, 2011–12
Yes 0.74 0.97 1.50 1.08 1.21No 0.74 0.97 1.50 1.08 1.21
Used academic support services, 2011–12Yes 0.51 0.83 0.99 1.04 1.26No 0.51 0.83 0.99 1.04 1.26
See notes at end of table.
Table S1.1-B.Standard errors for table 1.1-B: Percentage distribution of 2011–12 first-time postsecondary students’ enrollment characteristics, by control and level of first institution: 2012–14
Control and level of first institution
– 17 –

National Center for Education Statistics
Enrollment characteristics TotalPublic 2-year
Public 4-year
Private nonprofit
4-year For-profit
Self-reported remedial coursetaking, 2011–12Yes 0.71 1.28 0.95 1.06 1.17No 0.71 1.28 0.95 1.06 1.17
Number of minutes to commute to campus, 2011–12Did not commute to campus 0.53 0.91 1.20 2.47 1.551–15 0.48 0.92 0.83 0.60 1.2616–30 0.51 1.04 1.01 0.69 1.02More than 30 0.44 0.83 0.58 1.62 1.28
Hours worked per week while enrolled, 2011–12Did not hold a job 0.68 1.01 0.95 1.05 1.851–15 0.31 0.44 0.63 0.98 0.4916–34 0.47 0.73 0.81 0.70 0.8035 or more 0.54 0.79 0.65 0.63 1.88
Location of job(s) while enrolled, 2011–12Did not hold a job 0.68 1.01 0.95 1.05 1.85Worked on campus 0.21 0.22 0.51 1.01 0.10Worked off campus only 0.64 1.01 0.92 0.83 1.87
Highest degree ever expected to complete, 2011–12Undergraduate certificate 0.26 0.53 † † 1.35Associate’s degree 0.48 1.08 † † 1.22Bachelor’s degree 0.62 1.03 1.18 1.11 1.28Advanced degree 0.75 1.21 1.27 1.72 1.02
Attendance intensity through June 2014Always full time 0.83 1.02 1.16 0.85 1.31Mixed 0.54 0.95 1.09 0.86 1.18Always part time 0.65 1.13 0.66 0.20 0.76
Ever transferred through June 2014Yes 0.66 1.21 0.90 0.72 0.90 Attempted to transfer credits 0.57 0.97 0.79 0.68 0.49 Did not attempt to transfer credits 0.31 0.56 0.47 0.47 0.92No 0.66 1.21 0.90 0.72 0.90
See notes at end of table.
Table S1.1-B.Standard errors for table 1.1-B: Percentage distribution of 2011–12 first-time postsecondary students’ enrollment characteristics, by control and level of first institution: 2012–14—Continued
Control and level of first institution
– 18 –

National Center for Education Statistics
Enrollment characteristics TotalPublic 2-year
Public 4-year
Private nonprofit
4-year For-profit
Direction of first transfer by institution level through June 2014
Did not transfer 0.66 1.21 0.90 0.72 0.904-year to 4-year 0.31 † 0.70 0.75 0.484-year to 2-year 0.19 † 0.51 0.60 0.492-year to 4-year 0.28 0.95 † † 0.272-year to 2-year 0.22 0.54 † † 0.22Transfers to and from less-than-2-year institutions 0.13 0.21 0.14 0.10 0.59
Ever stopped out through June 2014Yes 0.44 0.79 0.84 0.80 0.98No 0.44 0.79 0.84 0.80 0.98
Number of degrees and certificates pursued through June 2014
One 0.66 1.37 0.97 0.91 1.08More than one 0.66 1.37 0.97 0.91 1.08
Number of changes in major at any institution through June 2014
Zero 0.53 1.16 1.05 1.01 1.07One 0.45 0.93 0.95 0.78 0.47More than one 0.36 0.57 0.61 0.67 0.79
Field of study when last enrolled through June 2014 Computer and information sciences 0.23 0.43 0.44 0.39 0.34Engineering and engineering technology 0.29 0.56 0.59 0.63 0.55Biology and physical science, science technology, math, agriculture 0.32 0.50 0.65 0.64 0.25General studies and other 0.40 0.82 0.37 0.29 0.30Social sciences 0.43 0.56 0.94 0.88 0.35Humanities 0.30 0.43 0.62 0.84 0.35Health care fields 0.67 0.99 0.79 1.03 3.40Business 0.47 0.76 0.89 0.89 1.15Education 0.31 0.48 0.55 0.59 0.75Other applied 0.57 0.90 0.77 0.89 3.10
Table S1.1-B.Standard errors for table 1.1-B: Percentage distribution of 2011–12 first-time postsecondary students’ enrollment characteristics, by control and level of first institution: 2012–14—Continued
Control and level of first institution
See notes at end of table.
– 19 –

National Center for Education Statistics
Enrollment characteristics TotalPublic 2-year
Public 4-year
Private nonprofit
4-year For-profit
Grade point average estimate when last enrolled through June 2014
Less than 2.25 0.31 0.63 0.66 0.43 0.772.25–2.74 0.44 0.93 0.77 0.79 1.052.75–3.24 0.61 0.88 1.02 0.95 1.583.25–3.74 0.53 0.92 0.97 0.98 1.463.75 or higher 0.42 0.92 0.71 0.89 1.34
SOURCE: U.S. Department of Education, National Center for Education Statistics, 2012/14 Beginning Postsecondary Students Longitudinal Study (BPS:12/14).
† Not applicable.
Table S1.1-B.Standard errors for table 1.1-B: Percentage distribution of 2011–12 first-time postsecondary students’ enrollment characteristics, by control and level of first institution: 2012–14—Continued
Control and level of first institution
– 20 –

National Center for Education Statistics
Personal characteristics Total NoneUndergraduate
certificateAssociate’s
degreeBachelor’s
degree
Total 100.0 100.0 100.0 100.0 100.0
SexMale 44.2 43.9 34.9 46.8 43.9Female 55.8 56.1 65.1 53.2 56.1
Race/ethnicity1
White 55.7 50.1 46.6 51.9 61.5Black 14.0 ‡ 16.2 15.1 12.4Hispanic 19.7 22.5 30.7 23.5 13.7Asian 5.5 9.4 ! ‡ 4.4 7.4Other or Two or more races 5.1 ‡ ‡ 5.1 5.0
Immigrant generation2
Immigrant 7.5 6.5 ! 6.5 9.8 5.6Second-generation American 18.9 23.5 20.1 19.4 18.1Third-generation or higher American 73.6 70.0 73.3 70.8 76.3
Dependency status and family responsibilities, 2011–123
Dependent 76.0 69.4 43.0 67.6 91.3Independent 24.0 30.6 57.0 32.4 8.7 Unmarried, no dependent(s) 8.5 15.1 ! 14.0 11.9 3.9 Unmarried, with dependent(s) 8.9 4.8 ! 25.5 11.4 3.0 Married 6.7 10.7 ! 17.5 9.1 1.8
Age as of December 31, 201118 years or younger 48.0 44.9 21.9 39.9 61.419 years 26.6 29.1 ! 17.9 25.3 29.720–23 years 10.5 11.7 ! 21.9 14.2 4.624–29 years 6.7 ‡ 16.9 9.7 1.730 years or older 8.1 ‡ 21.4 10.9 2.6
Veterans and military service members on active duty, in the reserves, or in the National Guard, 2011–12
Yes 2.7 ‡ 4.6 3.6 1.5No 97.3 ‡ 95.4 96.4 98.5
Has some type of disability, 2011–12Yes 11.6 5.9 ! 12.8 13.5 9.8No 88.4 94.1 87.2 86.5 90.2
Degree program, 2011–12
Table 1.2-A.Percentage distribution of 2011–12 first-time postsecondary students’ personal characteristics, by first degree program: 2012–14
See notes at end of table.
– 21 –

National Center for Education Statistics
Personal characteristics Total NoneUndergraduate
certificateAssociate’s
degreeBachelor’s
degree
Self-perception of change in physical health between 2012 and 2014
Declined 21.3 17.4 ! 20.7 23.3 19.8Constant 48.2 55.1 47.6 46.9 49.3Improved 30.5 27.6 31.6 29.8 30.9
Self-perception of change in mental health between 2012 and 2014
Declined 22.9 33.4 25.0 24.6 20.5Constant 45.5 46.3 42.1 44.3 47.3Improved 31.6 20.4 32.8 31.1 32.2
First person in immediate family to go to collegeDo not know 2.2 ‡ 4.0 3.1 1.1Yes 18.4 ‡ 31.2 23.1 11.2No 79.4 79.9 64.7 73.8 87.8
Highest education attained by either parent, 2011–12Do not know 4.0 3.9 ! 7.0 5.2 2.1High school diploma or less 31.2 30.7 53.0 38.9 19.2Some postsecondary education 26.5 26.3 25.4 30.9 22.7Bachelor’s degree or higher 38.4 39.1 14.6 25.0 56.0
Dependent students: parents’ income, 20104
Less than $30,000 27.2 18.1 ! 56.3 34.5 19.4$30,000–59,999 21.9 16.0 ! 26.2 25.9 19.0$60,000–89,999 18.5 19.2 8.6 20.1 18.3$90,000 or more 32.4 46.7 8.9 19.5 43.3
Dependency status and federal Pell Grant receipt, 2011–12Dependent, received 31.7 7.8 ! 31.4 31.7 32.7Independent, received 17.3 15.8 ! 46.4 22.3 6.2Did not receive 51.0 76.3 22.2 46.0 61.1
Dependent students: parents provided financial help for housing, tuition, or other expenses, 2011–12
Yes 78.6 82.3 71.2 70.8 84.6No 21.4 17.7 28.8 29.2 15.4
Students under age 24: strongly agree parents encourage me to stay in college, 2011–12
Yes 84.8 67.4 81.5 79.6 89.9No 15.2 32.6 ! 18.5 20.4 10.1
Strongly agree friends from college encourage me to stay in college, 2011–12
Yes 56.7 46.1 54.8 45.4 68.1No 43.3 53.9 45.2 54.6 31.9
Table 1.2-A.Percentage distribution of 2011–12 first-time postsecondary students’ personal characteristics, by first degree program: 2012–14—Continued
Degree program, 2011–12
See notes at end of table.
– 22 –

National Center for Education Statistics
Personal characteristics Total NoneUndergraduate
certificateAssociate’s
degreeBachelor’s
degree
Strongly agree friends from home encourage me to stay in college, 2011–12
Yes 62.8 55.0 61.7 56.8 68.9No 37.2 45.0 38.3 43.2 31.1
Number of months between high school completion and postsecondary entry5
0–12 73.6 67.6 43.2 65.5 87.813 or more 26.4 32.4 56.8 34.5 12.2
Recent high school graduate6
Yes 68.4 65.4 32.1 58.8 85.5No 31.6 34.6 67.9 41.2 14.5
Students under age 30: highest level of high school mathematics completed or planned7
Less than algebra 2 15.9 ‡ 31.7 23.7 6.7Algebra 2 29.0 38.0 45.1 37.6 18.4Trigonometry 9.0 ‡ 3.3 6.7 12.0Precalculus 22.0 15.6 12.5 20.9 25.0Calculus, math beyond calculus, or statistics 24.0 24.3 7.4 11.1 37.9
Students under age 30: high school grade point averageLess than 2.50 23.8 18.6 ! 38.0 35.0 11.92.50–2.99 14.3 27.5 ! 15.3 15.8 12.43.00–3.49 37.9 38.6 31.4 34.2 42.13.50 or higher 24.0 15.3 15.3 15.0 33.6
Students under age 30: took any college-level courses while in high school8
Yes 58.2 45.0 33.7 44.0 75.1No 41.8 55.0 66.3 56.0 24.9
See notes at end of table.
Table 1.2-A.Percentage distribution of 2011–12 first-time postsecondary students’ personal characteristics, by first degree program: 2012–14—Continued
Degree program, 2011–12
– 23 –

National Center for Education Statistics
Personal characteristics Total NoneUndergraduate
certificateAssociate’s
degreeBachelor’s
degree
Students under age 30: admissions test scores (ACT/SAT)9
400–860 25.9 37.2 48.0 39.8 14.6861–1000 25.2 ‡ 25.7 27.1 23.91001–1150 25.1 31.4 15.5 20.6 28.81151–1600 23.7 ‡ 10.7 12.4 32.7
4 Income in 2010 is used because it was reported on the federal financial aid application and used for federal need analysis for 2011–12.5 First-time students who did not complete a high school diploma, certificate, or equivalency are excluded here.
8 Includes college courses for credit, Advanced Placement (AP), and International Baccalaureate (IB) courses.
SOURCE: U.S. Department of Education, National Center for Education Statistics, 2012/14 Beginning Postsecondary Students Longitudinal Study (BPS:12/14).
NOTE: Estimates include individuals who were first-time postsecondary students in 2011–12 at Title IV eligible postsecondary institutions in the 50 states and the District of Columbia. Detail may not sum to totals because of rounding.
Table 1.2-A.Percentage distribution of 2011–12 first-time postsecondary students’ personal characteristics, by first degree program: 2012–14—Continued
1 Black includes African American, Hispanic includes Latino, and Other or Two or more races includes American Indian or Alaska Native, Pacific Islander or Native Hawaiian, and first-time students having origins in more than one race. Race categories exclude Hispanic origin.
Degree program, 2011–12
9 First-time students who did not take the SAT or ACT are excluded here. Admissions test scores reflect first-time students’ combined SAT verbal and math score. If SAT scores were not available, ACT scores were converted into an estimated combined SAT verbal and math score.
2 First-time foreign students with visas are excluded here. Immigrants include foreign-born first-time students who were U.S. citizens with one or both parent(s) born outside of the United States, resident aliens, or noncitizens eligible for citizenship. Second-generation Americans include U.S.-born first-time students with one or both parent(s) foreign born. Third-generation or higher Americans include U.S.- and foreign-born first-time students with both parents born in the United States. 3 First-time students classified as independent include those age 24 or over and those under 24 who are married, have dependents, are veterans or on active duty, are orphans or wards of the courts, are homeless or at risk of homelessness, or were determined to be independent by a financial aid officer using professional judgment. Other first-time students under age 24 are considered to be dependent. Within marital status, the unmarried category includes first-time students who are divorced, separated, or widowed. First-time students are considered to have a dependent if they have a child or any others for whom they are the caretaker or have financial responsibility. A spouse is not considered to be a dependent.
6 Recent high school graduates only include first-time students who graduated from high school with a regular high school diploma in 2011 or 2012.
! Interpret data with caution. Estimate is unstable because the standard error represents more than 30 percent but less than 51 percent of the estimate.‡ Reporting standards not met.
7 Math coursetaking data come from two sources: surveys first-time students completed when they took the ACT or SAT I in high school and BPS interviews first-time students completed in the base year or first follow-up. First-time students who reported this information on an entrance examination survey may not have completed all courses at the time they took the survey.
– 24 –

National Center for Education Statistics
Personal characteristics Total NoneUndergraduate
certificateAssociate’s
degreeBachelor’s
degree
Total † † † † †
SexMale 0.60 7.06 2.42 0.92 0.78Female 0.60 7.06 2.42 0.92 0.78
Race/ethnicityWhite 0.82 7.83 3.39 1.08 0.89Black 0.59 † 2.08 0.85 0.69Hispanic 0.58 5.08 3.18 0.99 0.65Asian 0.28 3.31 † 0.40 0.44Other or Two or more races 0.27 † † 0.50 0.39
Immigrant generationImmigrant 0.37 2.55 0.97 0.67 0.35Second-generation American 0.48 6.77 2.20 0.82 0.56Third-generation or higher American 0.57 6.74 2.69 1.09 0.63
Dependency status and family responsibilities, 2011–12Dependent 0.63 5.84 2.28 1.30 0.57Independent 0.63 5.84 2.28 1.30 0.57 Unmarried, no dependent(s) 0.36 6.74 1.40 0.81 0.32 Unmarried, with dependent(s) 0.38 2.20 1.81 0.65 0.33 Married 0.47 5.06 1.48 0.80 0.30
Age as of December 31, 201118 years or younger 0.68 7.14 1.60 1.28 0.6419 years 0.55 9.79 1.49 0.87 0.6220–23 years 0.43 4.64 1.99 0.73 0.4124–29 years 0.41 † 1.27 0.90 0.2130 years or older 0.34 † 1.72 0.58 0.32
Veterans and military service members on active duty, in the reserves, or in the National Guard, 2011–12
Yes 0.32 † 1.01 0.48 0.30No 0.32 † 1.01 0.48 0.30
Has some type of disability, 2011–12Yes 0.36 2.59 1.44 0.69 0.44No 0.36 2.59 1.44 0.69 0.44
Table S1.2-A.Standard errors for table 1.2-A: Percentage distribution of 2011–12 first-time postsecondary students’ personal characteristics, by first degree program: 2012–14
Degree program, 2011–12
See notes at end of table.
– 25 –

National Center for Education Statistics
Personal characteristics Total NoneUndergraduate
certificateAssociate’s
degreeBachelor’s
degree
Self-perception of change in physical health between 2012 and 2014
Declined 0.49 5.47 1.65 0.78 0.64Constant 0.89 10.21 2.57 0.98 0.93Improved 0.69 7.57 2.34 0.85 0.81
Self-perception of change in mental health between 2012 and 2014
Declined 0.58 6.51 2.08 0.80 0.62Constant 0.58 5.47 2.37 0.95 0.80Improved 0.77 5.17 2.44 0.93 0.92
First person in immediate family to go to collegeDo not know 0.19 † 0.74 0.40 0.20Yes 0.44 † 1.82 0.85 0.47No 0.47 7.26 2.17 0.92 0.51
Highest education attained by either parent, 2011–12Do not know 0.27 1.83 1.20 0.43 0.26High school diploma or less 0.54 7.13 2.16 1.01 0.60Some postsecondary education 0.49 5.73 1.67 0.87 0.67Bachelor’s degree or higher 0.62 6.59 1.81 0.83 0.78
Dependent students: parents’ income, 2010Less than $30,000 0.53 6.67 3.02 1.05 0.60$30,000–59,999 0.66 5.54 2.92 0.90 0.88$60,000–89,999 0.51 5.33 2.22 1.01 0.56$90,000 or more 0.82 7.84 2.60 1.06 0.98
Dependency status and federal Pell Grant receipt, 2011–12Dependent, received 0.60 3.89 1.48 0.96 1.47Independent, received 0.74 7.09 3.66 0.85 0.53Did not receive 0.56 10.44 4.19 1.04 1.13
Dependent students: parents provided financial help for housing, tuition, or other expenses, 2011–12
Yes 0.62 5.28 2.55 1.07 0.65No 0.62 5.28 2.55 1.07 0.65
Students under age 24: strongly agree parents encourage me to stay in college, 2011–12
Yes 0.44 10.66 1.87 0.81 0.52No 0.44 10.66 1.87 0.81 0.52
Strongly agree friends from college encourage me to stay in college, 2011–12
Yes 1.09 6.57 2.12 1.05 1.14No 1.09 6.57 2.12 1.05 1.14
See notes at end of table.
Table S1.2-A.Standard errors for table 1.2-A: Percentage distribution of 2011–12 first-time postsecondary students’ personal characteristics, by first degree program: 2012–14—Continued
Degree program, 2011–12
– 26 –

National Center for Education Statistics
Personal characteristics Total NoneUndergraduate
certificateAssociate’s
degreeBachelor’s
degree
Strongly agree friends from home encourage me to stay in college, 2011–12
Yes 0.62 6.19 1.94 0.90 0.91No 0.62 6.19 1.94 0.90 0.91
Number of months between high school completion and postsecondary entry
0–12 0.68 8.24 2.13 1.31 0.5613 or more 0.68 8.24 2.13 1.31 0.56
Recent high school graduateYes 0.78 8.55 1.68 1.37 0.61No 0.78 8.55 1.68 1.37 0.61
Students under age 30: highest level of high school mathematics completed or planned
Less than algebra 2 0.65 † 2.27 1.14 0.34Algebra 2 0.54 9.11 1.99 0.98 0.61Trigonometry 0.34 † 0.72 0.50 0.57Precalculus 0.62 4.21 1.18 0.92 0.81Calculus, math beyond calculus, or statistics 0.43 6.10 1.16 0.54 0.91
Students under age 30: high school grade point averageLess than 2.50 0.53 5.97 2.03 1.04 0.472.50–2.99 0.40 10.06 1.72 0.61 0.653.00–3.49 0.59 7.80 1.91 0.87 0.923.50 or higher 0.47 4.36 1.52 0.74 0.69
Students under age 30: took any college-level courses while in high school
Yes 0.62 11.15 2.00 1.19 0.73No 0.62 11.15 2.00 1.19 0.73
Students under age 30: admissions test scores (ACT/SAT)400–860 0.66 7.73 2.74 1.09 0.75861–1000 0.56 † 2.32 1.02 0.711001–1150 0.57 7.20 1.92 0.95 0.761151–1600 0.59 † 1.51 0.96 0.79
SOURCE: U.S. Department of Education, National Center for Education Statistics, 2012/14 Beginning Postsecondary Students Longitudinal Study (BPS:12/14).
† Not applicable.
Table S1.2-A.Standard errors for table 1.2-A: Percentage distribution of 2011–12 first-time postsecondary students’ personal characteristics, by first degree program: 2012–14—Continued
Degree program, 2011–12
– 27 –

National Center for Education Statistics
Enrollment characteristics Total NoneUndergraduate
certificateAssociate’s
degreeBachelor’s
degree
Total 100.0 100.0 100.0 100.0 100.0
Control and level of first institution4-year 52.5 21.9 ! 5.4 ! 13.8 100.0
Public 30.8 ‡ ‡ 5.3 61.5Private nonprofit 15.6 ‡ ‡ 1.2 ! 32.5For-profit 6.1 ‡ 2.8 7.3 6.0
2-year 42.9 75.6 50.4 86.2 †Public 38.4 75.3 24.2 81.7 †Private nonprofit 0.6 ‡ 1.7 ! 1.1 ! †For-profit 3.9 ‡ 24.5 3.4 †
Less-than-2-year 4.5 2.5 ! 44.2 † †Public ‡ ‡ ‡ † †Private nonprofit ‡ # ‡ † †For-profit 3.8 ‡ 37.2 † †
Control and doctorate-granting status of first institution1
Public 4-year non-doctorate-granting 20.6 ‡ ‡ 78.4 16.8Public 4-year doctorate-granting 45.9 ‡ ‡ 3.7 ! 48.6Private nonprofit 4-year non-doctorate-granting 13.6 ‡ ‡ ‡ 13.3Private nonprofit 4-year doctorate-granting 20.0 ‡ ‡ ‡ 21.3
Selectivity of first institution2
Very selective 27.1 ‡ ‡ ‡ 30.9Moderately selective 40.9 45.3 ! ‡ ‡ 46.1Minimally selective 13.1 ‡ 28.3 ! 21.9 11.8Open admission 18.9 ‡ 69.4 74.3 11.3
Plan to continue to a bachelor’s degree program within 5 years, 2011–123
Yes 77.3 82.9 † 77.1 †No 22.7 17.1 ! † 22.9 †
Strongly agree know requirements needed to complete degree program, 2011–124
Yes 58.74 † 72.83 55.69 59.12No 41.26 † 27.17 44.31 40.88
Strongly agree that “I feel that I am a part of my first institution.”
Yes 46.0 34.1 57.5 40.0 49.4No 54.0 65.9 42.5 60.0 50.6
Degree program, 2011–12
See notes at end of table.
Table 1.2-B.Percentage distribution of 2011–12 first-time postsecondary students’ enrollment characteristics, by first degree program: 2012–14
– 28 –

National Center for Education Statistics
Enrollment characteristics Total NoneUndergraduate
certificateAssociate’s
degreeBachelor’s
degree
Strongly agree have ability to succeed as a student at first institution, 2011–12
Yes 60.4 61.2 69.4 60.8 58.1No 39.6 38.8 30.6 39.2 41.9
Used academic support services, 2011–12Yes 32.8 30.6 16.4 24.4 44.3No 67.2 69.4 83.6 75.6 55.7
Self-reported remedial coursetaking, 2011–12Yes 22.0 26.1 8.4 33.6 14.2No 78.0 73.9 91.6 66.4 85.8
Number of minutes to commute to campus, 2011–12Did not commute to campus 39.9 35.2 11.2 16.6 68.11–15 19.9 31.1 27.3 26.9 11.416–30 24.4 24.2 33.4 36.1 11.6More than 30 15.8 9.5 28.1 20.5 8.9
Hours worked per week while enrolled, 2011–12Did not hold a job 63.1 64.8 71.5 57.2 66.71–15 8.8 ‡ 4.1 5.3 13.516–30 16.1 18.7 11.0 19.8 13.735 or more 11.9 ‡ 13.4 17.7 6.2
Location of job(s) while enrolled, 2011–12Did not hold a job 63.1 64.8 71.5 57.2 66.7Worked on campus 5.9 ‡ 0.9 ! 1.7 11.2Worked off campus only 31.0 ‡ 27.6 41.1 22.2
Highest degree ever expected to complete, 2011–125
Undergraduate certificate 4.6 ‡ 44.8 # #Associate’s degree 11.6 ‡ 19.8 22.0 #Bachelor’s degree 36.8 36.0 21.5 42.9 34.6Advanced degree 47.0 48.6 13.9 35.1 65.4
Attendance intensity through June 20146
Always full time 59.5 34.5 ! 60.6 42.9 75.7Mixed 30.0 37.7 25.2 39.4 22.1Always part time 10.5 27.8 14.2 17.8 2.2
See notes at end of table.
Table 1.2-B.Percentage distribution of 2011–12 first-time postsecondary students’ enrollment characteristics, by first degree program: 2012–14—Continued
Degree program, 2011–12
– 29 –

National Center for Education Statistics
Enrollment characteristics Total NoneUndergraduate
certificateAssociate’s
degreeBachelor’s
degree
Ever transferred through June 20147
Yes 17.9 31.7 10.3 20.4 16.7 Attempted to transfer credits 10.9 18.8 ! 2.5 12.7 10.9 Did not attempt to transfer credits 6.9 13.0 ! 7.7 7.7 5.8No 82.1 68.3 89.7 79.6 83.3
Direction of first transfer by institution level through June 20147
Did not transfer 82.1 68.3 89.7 79.6 83.34-year to 4-year 5.2 ‡ 0.3 ! 1.8 9.44-year to 2-year 3.6 ‡ 0.1 0.7 7.02-year to 4-year 4.7 13.6 1.4 10.1 †2-year to 2-year 3.2 ‡ 2.9 6.7 †Transfers to and from less-than-2-year institutions 1.2 ‡ 5.6 1.0 0.3 !
Ever stopped out through June 20148
Yes 17.2 27.6 17.6 22.1 12.1No 82.8 72.4 82.4 77.9 87.9
Number of degrees and certificates pursued through June 20149
One 73.1 ‡ 80.4 65.8 77.8More than one 26.9 ‡ 19.6 34.2 22.2
Number of changes in major at any institution through June 201410
Zero 70.1 81.8 98.7 68.8 64.6One 20.4 ‡ 1.1 20.1 25.1More than one 9.5 ‡ 0.2 ! 11.1 10.3
Field of study when last enrolled through June 201411
Computer and information sciences 3.9 ‡ 1.1 4.6 3.9Engineering and engineering technology 6.4 ‡ 5.0 6.0 7.3Biology and physical science, science technology, math, agriculture 8.5 ‡ 1.1 5.3 12.8General studies and other 5.4 ‡ 0.6 ! 10.3 2.2Social sciences 9.5 10.0 ! 0.7 6.2 14.1Humanities 7.3 4.8 ! 1.0 ! 5.2 10.4Health care fields 17.6 13.6 ! 43.0 18.9 11.0Business 14.6 13.2 4.6 15.7 15.8Education 5.6 ‡ 2.2 ! 5.3 6.4Other applied 21.3 31.5 ! 40.6 22.4 16.0
Table 1.2-B.Percentage distribution of 2011–12 first-time postsecondary students’ enrollment characteristics, by first degree program: 2012–14—Continued
Degree program, 2011–12
See notes at end of table.
– 30 –

National Center for Education Statistics
Enrollment characteristics Total NoneUndergraduate
certificateAssociate’s
degreeBachelor’s
degree
Grade point average estimate when last enrolled through June 2014
Less than 2.25 10.6 5.2 ! 7.4 15.1 7.52.25–2.74 17.4 28.4 ! 13.1 20.2 15.32.75–3.24 21.9 17.6 ! 17.7 20.8 24.03.25–3.74 32.6 32.4 33.0 28.5 36.13.75 or higher 17.6 16.4 ! 28.7 15.4 17.1
SOURCE: U.S. Department of Education, National Center for Education Statistics, 2012/14 Beginning Postsecondary Students Longitudinal Study (BPS:12/14).
10 First-time students who never enrolled in an associate’s or bachelor’s degree program or who never declared a major are excluded here.11 First-time students who were not in a degree or certificate program when last enrolled are excluded here. General studies and other includes general studies, basic skills, and citizenship activities; leisure and recreational activities; personal awareness and self-improvement; high school/secondary diplomas and certificate programs; and interpersonal and social skills. Other applied includes personal and consumer services; manufacturing, construction, repair, and transportation; military technology and protective services; architecture; communications; public administration and human services; design and applied arts; law and legal studies; library sciences; and theology and religious vocations.
! Interpret data with caution. Estimate is unstable because the standard error represents more than 30 percent but less than 51 percent of the estimate.
9 First-time students who did not pursue any certificates or degrees through June 2014 are excluded here.
Table 1.2-B.Percentage distribution of 2011–12 first-time postsecondary students’ enrollment characteristics, by first degree program: 2012–14—Continued
1 First-time students who were enrolled in a for-profit institution or a less-than-4-year public or private institution are excluded here.
# Rounds to zero.
NOTE: Estimates include individuals who were first-time postsecondary students in 2011–12 at Title IV eligible postsecondary institutions in the 50 states and the District of Columbia. Detail may not sum to totals because of rounding.
8 A stopout is defined as a break in enrollment of 5 or more consecutive months.
6 Full-time status for the purposes of financial aid eligibility was based on 12 credit hours unless the awarding institution employed a different standard. 7 A transfer is defined as leaving one institution and enrolling in another institution for 4 or more consecutive months.
3 First-time students who were enrolled in a certificate or bachelor’s degree program are excluded here because information on their bachelor’s degree plans was not collected.4 First-time students who were not enrolled in a degree or certificate program or who attained a degree or certificate during the 2011–12 academic year are excluded here.
2 First-time students who were enrolled in a less-than-4-year institution are excluded here. Selectivity is based on institutional data from the Integrated Postsecondary Education Data System (IPEDS). Non-open admission institutions’ selectivity is determined by an index that uses the centile distribution of the percentage of applicants who were admitted and the centile distribution of the midpoint between the 25th and 75th percentile SAT/ACT combined scores.
‡ Reporting standards not met.
† Not applicable.
5 First-time students who did not expect to complete a certificate or degree are excluded here. Advanced degree includes post-BA or post-master certificates, master’s degrees, professional practice doctor’s degrees, and research/scholarship and other doctor’s degrees.
Degree program, 2011–12
– 31 –

National Center for Education Statistics
Enrollment characteristics Total NoneUndergraduate
certificateAssociate’s
degreeBachelor’s
degree
Total † † † † †
Control and level of first institution4-year 1.18 10.88 1.76 1.26 †
Public 1.12 † † 0.49 1.53Private nonprofit 0.29 † † 0.55 1.07For-profit 0.17 † 0.67 0.55 0.62
2-year 1.36 11.23 3.34 1.26 †Public 1.41 10.59 4.94 1.05 †Private nonprofit 0.13 † 0.56 0.33 †For-profit 0.16 † 2.44 0.60 †
Less-than-2-year 0.28 1.12 2.27 † †Public † † † † †Private nonprofit † † † † †For-profit 0.26 † 2.16 † †
Control and doctorate-granting status of first institutionPublic 4-year non-doctorate-granting 0.92 † † 7.33 0.78Public 4-year doctorate-granting 1.47 † † 1.47 1.59Private nonprofit 4-year non-doctorate-granting 0.49 † † † 1.02Private nonprofit 4-year doctorate-granting 0.70 † † † 0.58
Selectivity of first institutionVery selective 1.15 † † † 1.39Moderately selective 1.29 22.34 † † 1.28Minimally selective 0.66 † 9.22 2.40 0.68Open admission 0.77 † 10.13 2.82 0.79
Plan to continue to a bachelor’s degree program within 5 years, 2011–12
Yes 0.89 6.26 † 0.83 †No 0.89 6.26 † 0.83 †
Strongly agree know requirements needed to complete degree program, 2011–12
Yes 0.59 † 2.04 0.98 0.69No 0.59 † 2.04 0.98 0.69
Strongly agree that “I feel that I am a part of my first institution.”
Yes 0.67 6.25 1.93 0.91 0.82No 0.67 6.25 1.93 0.91 0.82
Table S1.2-B.Standard errors for table 1.2-B: Percentage distribution of 2011–12 first-time postsecondary students’ enrollment characteristics, by first degree program: 2012–14
Degree program, 2011–12
See notes at end of table.
– 32 –

National Center for Education Statistics
Enrollment characteristics Total NoneUndergraduate
certificateAssociate’s
degreeBachelor’s
degree
Strongly agree have ability to succeed as a student at first institution, 2011–12
Yes 0.74 5.52 1.88 0.87 1.05No 0.74 5.52 1.88 0.87 1.05
Used academic support services, 2011–12Yes 0.51 6.83 2.07 0.82 0.76No 0.51 6.83 2.07 0.82 0.76
Self-reported remedial coursetaking, 2011–12Yes 0.71 4.53 1.03 1.04 1.07No 0.71 4.53 1.03 1.04 1.07
Number of minutes to commute to campus, 2011–12Did not commute to campus 0.53 8.48 1.35 0.84 1.101–15 0.48 6.55 2.15 0.83 0.4116–30 0.51 6.03 1.68 0.88 0.84More than 30 0.44 2.86 2.08 0.78 0.45
Hours worked per week while enrolled, 2011–12Did not hold a job 0.68 8.53 2.03 0.90 0.721–15 0.31 † 0.69 0.44 0.5016–34 0.47 5.03 1.53 0.70 0.5535 or more 0.54 † 1.43 0.65 0.65
Location of job(s) while enrolled, 2011–12Did not hold a job 0.68 8.53 2.03 0.90 0.72Worked on campus 0.21 † 0.31 0.19 0.46Worked off campus only 0.64 † 2.00 0.92 0.63
Highest degree ever expected to complete, 2011–12Undergraduate certificate 0.26 † 2.02 † †Associate’s degree 0.48 † 1.41 0.88 †Bachelor’s degree 0.62 8.89 1.50 1.08 0.93Advanced degree 0.75 11.67 1.16 1.03 0.93
Attendance intensity through June 2014Always full time 0.83 10.38 2.56 1.35 0.70Mixed 0.54 6.98 2.58 0.96 0.64Always part time 0.65 6.83 1.75 1.05 0.40
See notes at end of table.
Table S1.2-B.Standard errors for table 1.2-B: Percentage distribution of 2011–12 first-time postsecondary students’ enrollment characteristics, by first degree program: 2012–14—Continued
Degree program, 2011–12
– 33 –

National Center for Education Statistics
Enrollment characteristics Total NoneUndergraduate
certificateAssociate’s
degreeBachelor’s
degree
Ever transferred through June 2014Yes 0.66 6.04 0.95 1.29 0.61 Attempted to transfer credits 0.57 6.21 0.53 1.00 0.49 Did not attempt to transfer credits 0.31 4.06 0.89 0.56 0.37No 0.66 6.04 0.95 1.29 0.61
Direction of first transfer by institution level through June 2014
Did not transfer 0.66 6.04 0.95 1.29 0.614-year to 4-year 0.31 † 0.11 0.37 0.474-year to 2-year 0.19 † 0.04 0.15 0.362-year to 4-year 0.28 3.86 0.40 0.72 †2-year to 2-year 0.22 † 0.48 0.47 †Transfers to and from less-than-2-year institutions 0.13 † 0.75 0.18 0.10
Ever stopped out through June 2014Yes 0.44 4.99 1.38 0.80 0.52No 0.44 4.99 1.38 0.80 0.52
Number of degrees and certificates pursued through June 2014
One 0.66 † 1.30 1.31 0.68More than one 0.66 † 1.30 1.31 0.68
Number of changes in major at any institution through June 2014
Zero 0.53 7.36 0.28 0.83 0.70One 0.45 † 0.26 0.73 0.69More than one 0.36 † 0.09 0.54 0.46
Field of study when last enrolled through June 2014 Computer and information sciences 0.23 † 0.22 0.39 0.32Engineering and engineering technology 0.29 † 0.97 0.50 0.40Biology and physical science, science technology, math, agriculture 0.32 † 0.26 0.46 0.51General studies and other 0.40 † 0.26 0.75 0.22Social sciences 0.43 4.53 0.21 0.52 0.69Humanities 0.30 2.09 0.51 0.44 0.44Health care fields 0.67 5.81 4.41 0.86 0.63Business 0.47 3.88 0.70 0.72 0.77Education 0.31 † 0.78 0.41 0.41Other applied 0.57 11.83 4.09 0.77 0.57
Table S1.2-B.Standard errors for table 1.2-B: Percentage distribution of 2011–12 first-time postsecondary students’ enrollment characteristics, by first degree program: 2012–14—Continued
Degree program, 2011–12
See notes at end of table.
– 34 –

National Center for Education Statistics
Enrollment characteristics Total NoneUndergraduate
certificateAssociate’s
degreeBachelor’s
degree
Grade point average estimate when last enrolled through June 2014
Less than 2.25 0.31 1.87 0.82 0.56 0.452.25–2.74 0.44 12.22 1.22 0.70 0.482.75–3.24 0.61 6.37 2.10 0.75 0.663.25–3.74 0.53 8.28 1.65 0.81 0.703.75 or higher 0.42 5.25 1.96 0.80 0.52
SOURCE: U.S. Department of Education, National Center for Education Statistics, 2012/14 Beginning Postsecondary Students Longitudinal Study (BPS:12/14).
† Not applicable.
Table S1.2-B.Standard errors for table 1.2-B: Percentage distribution of 2011–12 first-time postsecondary students’ enrollment characteristics, by first degree program: 2012–14—Continued
Degree program, 2011–12
– 35 –

National Center for Education Statistics
Personal characteristics
Average tuition
and fees
Average total
price of attendance Percent
Average amount
received Percent
Average amount
received Percent
Average amount
received
Total $9,400 $20,000 81.2 $12,600 73.3 $7,800 46.2 $8,800
SexMale 9,100 19,400 78.5 12,200 69.5 7,600 42.1 8,700Female 9,600 20,400 83.4 12,900 76.3 8,000 49.5 8,800
Race/ethnicity2
White 10,000 20,800 78.9 12,900 69.4 7,900 47.0 9,100Black 8,000 18,700 91.0 12,600 84.5 7,200 60.1 8,100Hispanic 7,400 17,200 82.6 11,000 77.8 7,100 38.2 8,200Asian 13,300 24,800 75.4 14,500 69.1 11,200 32.3 8,800Other or Two or more races 9,500 20,300 81.2 13,700 73.0 8,600 45.6 9,400
Immigrant generation3
Immigrant 7,800 17,500 75.1 10,600 70.8 7,400 31.6 7,600Second-generation American 9,400 20,000 82.6 12,600 76.3 8,500 40.1 8,500Third-generation or higher American 9,400 20,100 82.4 12,800 73.5 7,600 50.2 8,900
Dependency status and family responsibilities, 2011–124
Dependent 10,600 21,600 80.0 13,800 71.8 9,000 45.5 9,400Independent 5,700 14,900 85.1 9,000 78.3 4,500 48.7 6,800 Unmarried, no dependent(s) 5,600 14,800 84.3 9,200 76.2 4,800 48.7 6,500 Unmarried, with dependent(s) 6,100 15,500 87.2 9,300 85.9 4,600 53.6 6,800 Married 5,100 14,300 83.2 8,100 70.7 4,000 42.2 7,000
Age as of December 31, 201118 years or younger 11,200 22,600 81.1 14,400 72.5 9,400 46.3 9,70019 years 9,700 20,500 78.7 13,300 72.2 8,500 43.8 9,00020–23 years 6,100 14,700 79.2 8,800 72.0 5,000 42.8 6,50024–29 years 5,800 15,000 89.3 8,800 79.8 3,800 53.5 6,80030 years or older 5,200 14,600 86.2 8,500 78.0 4,000 52.0 7,000
Veterans and military service members on active duty, in the reserves, or in the National Guard, 2011–12
Yes 6,400 15,700 83.1 10,700 54.1 4,200 25.4 5,900No 9,500 20,100 81.2 12,700 73.9 7,900 46.8 8,800
Has some type of disability, 2011–12Yes 7,700 17,700 79.7 11,400 72.4 6,600 46.8 8,100No 9,600 20,300 81.4 12,800 73.4 8,000 46.2 8,800
Table 2.1-A.Among 2011–12 first-time postsecondary students, average tuition and fees; average total price of attendance; percentage who received various types of financial aid; and among those who received each type of aid, average amount received in 2011–12, by selected personal characteristics: 2012–14
See notes at end of table.
Tuition, price of attendance, and financial aid, 2011–12Total aid1 Total grants Student loans
– 36 –

National Center for Education Statistics
Personal characteristics
Average tuition
and fees
Average total
price of attendance Percent
Average amount
received Percent
Average amount
received Percent
Average amount
received
Self-perception of change in physical health between 2012 and 2014
Declined 8,700 19,200 80.4 12,100 72.4 7,400 45.1 8,600Constant 9,700 20,400 81.4 12,800 74.1 8,100 45.5 8,900Improved 9,300 19,900 81.5 12,700 72.7 7,700 48.2 8,600
Self-perception of change in mental health between 2012 and 2014
Declined 8,700 19,100 80.4 12,400 73.7 7,200 46.1 9,100Constant 9,400 19,900 81.6 12,400 73.9 7,900 45.0 8,500Improved 9,800 20,700 81.4 13,100 72.2 8,200 48.1 8,800
First person in immediate family to go to college
Do not know 6,100 14,800 83.5 9,300 79.7 5,300 42.6 7,200Yes 6,600 16,100 86.1 10,600 80.3 6,200 48.2 7,600No 10,100 21,000 80.1 13,200 71.5 8,300 45.9 9,100
Highest education attained by either parent, 2011–12
Do not know 6,400 15,300 81.9 9,200 77.2 5,500 40.4 7,100High school diploma or less 6,800 16,300 86.1 10,600 80.6 6,300 47.6 7,700Some postsecondary education 7,500 17,800 82.1 12,000 74.6 7,200 48.2 8,400Bachelor’s degree or higher 13,100 25,100 76.6 15,300 66.1 10,200 44.4 10,100
Dependent students: parents’ income, 20105
Less than $30,000 8,200 18,400 92.4 12,800 92.3 8,600 46.7 7,500$30,000–59,999 9,000 19,200 85.1 13,200 81.8 8,600 46.2 8,400$60,000–89,999 9,600 20,400 75.4 13,700 61.3 8,500 48.3 9,800$90,000 or more 14,300 26,800 68.9 15,600 53.7 10,100 42.3 11,700
Dependency status and federal Pell Grant receipt, 2011–12
Dependent, received 9,300 20,100 100.0 13,600 100.0 8,800 55.1 8,000Independent, received 6,700 16,900 100.0 9,500 100.0 4,700 61.3 6,900Did not receive 10,300 21,000 63.2 13,300 47.7 8,800 35.6 10,600
Dependent students: parents provided financial help for housing, tuition, or other expenses, 2011–12
Yes 11,600 23,000 78.4 14,500 69.6 9,400 45.3 10,000No 6,800 16,700 86.0 11,500 79.6 7,600 46.1 7,500
Table 2.1-A.Among 2011–12 first-time postsecondary students, average tuition and fees; average total price of attendance; percentage who received various types of financial aid; and among those who received each type of aid, average amount received in 2011–12, by selected personal characteristics: 2012–14—Continued
Tuition, price of attendance, and financial aid, 2011–12Total aid1 Total grants Student loans
See notes at end of table.
– 37 –

National Center for Education Statistics
Personal characteristics
Average tuition
and fees
Average total
price of attendance Percent
Average amount
received Percent
Average amount
received Percent
Average amount
received
Students under age 24: strongly agree parents encourage me to stay in college, 2011–12
Yes 10,600 21,700 80.5 13,800 72.5 8,900 45.8 9,300No 7,200 16,700 78.0 11,000 71.4 6,900 41.2 8,000
Strongly agree friends from college encourage me to stay in college, 2011–12
Yes 11,100 22,400 83.3 14,100 75.5 8,800 50.3 9,200No 7,200 16,800 78.6 10,600 70.5 6,500 40.9 8,100
Strongly agree friends from home encourage me to stay in college, 2011–12
Yes 10,300 21,200 81.8 13,400 74.1 8,300 48.0 9,000No 7,800 17,900 80.3 11,200 72.0 6,900 43.2 8,300
Number of months between high school completion and postsecondary entry6
0–12 10,600 21,700 81 13,700 73 8,900 46 9,30013 or more 6,200 15,400 82 9,500 73 4,800 48 7,400
Recent high school graduate7
Yes 10,800 22,100 80.9 14,000 73.0 9,200 45.8 9,400No 6,400 15,600 82.0 9,500 74.1 5,000 47.2 7,400
Students under age 30: highest level of high school mathematics completed or planned8
Less than algebra 2 6,200 15,200 79.0 9,600 72.6 5,600 40.0 7,600Algebra 2 6,900 16,600 80.1 10,400 72.5 6,100 43.0 8,200Trigonometry 11,900 23,800 83.2 16,100 75.1 10,200 51.3 10,500Precalculus 9,400 20,400 80.3 13,300 71.7 8,300 47.5 9,100Calculus, math beyond calculus, or statistics 15,200 27,800 82.4 16,800 73.8 11,600 49.2 9,700
Students under age 30: high school grade point average
Less than 2.50 6,100 15,300 78.4 9,800 70.4 5,400 41.3 8,1002.50–2.99 8,100 18,500 79.5 11,600 70.2 7,100 45.8 8,6003.00–3.49 10,100 21,100 81.0 13,500 72.5 8,300 48.3 9,3003.50 or higher 13,900 26,000 83.7 15,900 77.6 11,100 46.1 9,100
Tuition, price of attendance, and financial aid, 2011–12
See notes at end of table.
Total aid1 Total grants Student loans
Table 2.1-A.Among 2011–12 first-time postsecondary students, average tuition and fees; average total price of attendance; percentage who received various types of financial aid; and among those who received each type of aid, average amount received in 2011–12, by selected personal characteristics: 2012–14—Continued
– 38 –

National Center for Education Statistics
Personal characteristics
Average tuition
and fees
Average total
price of attendance Percent
Average amount
received Percent
Average amount
received Percent
Average amount
received
Students under age 30: took any college-level courses while in high school9
Yes 11,800 23,400 81.0 14,900 73.1 9,900 46.9 9,500No 6,900 16,500 80.5 10,300 72.6 5,800 44.1 8,100
4 First-time students classified as independent include those age 24 or over and those under 24 who are married, have dependents, are veterans or on active duty, are orphans or wards of the courts, are homeless or at risk of homelessness, or were determined to be independent by a financial aid officer using professional judgment. Other first-time students under age 24 are considered to be dependent. Within marital status, the unmarried category includes first-time students who are divorced, separated, or widowed. First-time students are considered to have a dependent if they have a child or any others for whom they are the caretaker or have financial responsibility. A spouse is not considered to be a dependent.
1 Total aid includes grants, loans, work-study, job training benefits, veterans benefits, and Direct PLUS Loans to parents of dependent undergraduates.
3 First-time foreign students with visas are included in the total but excluded here. Immigrants include foreign-born first-time students who were U.S. citizens with one or both parent(s) born outside of the United States, resident aliens, or noncitizens eligible for citizenship. Second-generation Americans include U.S.-born first-time students with one or both parent(s) foreign born. Third-generation or higher Americans include U.S.- and foreign-born first-time students with both parents born in the United States.
SOURCE: U.S. Department of Education, National Center for Education Statistics, 2012/14 Beginning Postsecondary Students Longitudinal Study (BPS:12/14).
5 Income in 2010 is used because it was reported on the federal financial aid application and used for federal need analysis for 2011–12.
9 Includes college courses for credit, Advanced Placement (AP), and International Baccalaureate (IB) courses.
6 First-time students who did not complete a high school diploma, certificate, or equivalency are included in the total but excluded here.7 Recent high school graduates only include first-time students who graduated from high school with a regular high school diploma in 2011 or 2012.
NOTE: Average aid amounts are calculated only for first-time postsecondary students receiving that type of aid. Those not receiving that type of aid (i.e., zero values) are not included in that column’s average. Estimates include individuals who were first-time postsecondary students in 2011–12 at Title IV eligible postsecondary institutions in the 50 states and the District of Columbia.
Tuition, price of attendance, and financial aid, 2011–12
Table 2.1-A.Among 2011–12 first-time postsecondary students, average tuition and fees; average total price of attendance; percentage who received various types of financial aid; and among those who received each type of aid, average amount received in 2011–12, by selected personal characteristics: 2012–14—Continued
2 Black includes African American, Hispanic includes Latino, and Other or Two or more races includes American Indian or Alaska Native, Pacific Islander or Native Hawaiian, and first-time students having origins in more than one race. Race categories exclude Hispanic origin.
Total aid1 Total grants Student loans
8 Math coursetaking data come from two sources: surveys first-time students completed when they took the ACT or SAT I in high school and BPS interviews first-time students completed in the base year or first follow-up. First-time students who reported this information on an entrance examination survey may not have completed all courses at the time they took the survey.
– 39 –

National Center for Education Statistics
Personal characteristics
Average tuition
and fees
Average total
price of attendance Percent
Average amount
received Percent
Average amount
received Percent
Average amount
received
Total $120 $170 0.56 $130 0.87 $110 0.55 $150
SexMale 180 270 0.79 200 1.07 160 0.91 170Female 170 210 0.68 180 0.95 170 0.69 180
Race/ethnicityWhite 180 230 0.69 170 0.97 170 0.78 210Black 280 410 1.06 390 1.27 290 1.67 220Hispanic 220 370 1.34 290 1.69 210 1.48 210Asian 680 850 2.54 660 2.75 580 1.84 520Other or Two or more races 470 610 2.11 630 2.36 520 2.52 460
Immigrant generationImmigrant 360 610 2.12 440 2.32 360 2.06 400Second-generation American 290 400 1.13 340 1.26 270 1.17 210Third-generation or higher American 140 190 0.60 160 1.06 120 0.66 170
Dependency status and family responsibilities, 2011–12
Dependent 190 220 0.60 170 0.65 170 0.62 140Independent 290 570 1.38 460 2.89 250 1.53 290 Unmarried, no dependent(s) 400 600 2.10 600 4.21 310 2.27 330 Unmarried, with dependent(s) 280 680 2.42 420 2.81 250 2.16 290 Married 380 710 1.95 530 2.86 300 2.74 360
Age as of December 31, 201118 years or younger 240 280 0.70 240 0.77 200 0.75 14019 years 230 320 1.29 270 1.49 270 0.99 22020–23 years 330 600 1.63 450 2.39 310 1.91 30024–29 years 440 630 1.93 410 3.78 170 2.79 29030 years or older 270 540 1.98 570 2.90 250 2.33 300
Veterans and military service members on active duty, in the reserves, or in the National Guard, 2011–12
Yes 810 1,090 4.51 780 6.43 260 3.47 580No 130 170 0.57 120 0.75 110 0.57 160
Has some type of disability, 2011–12Yes 340 600 1.93 430 2.30 270 1.95 460No 140 170 0.57 130 0.80 120 0.57 130
Table S2.1-A.Standard errors for table 2.1-A: Among 2011–12 first-time postsecondary students, average tuition and fees; average total price of attendance; percentage who received various types of financial aid; and among those who received each type of aid, average amount received in 2011–12, by selected personal characteristics: 2012–14
Tuition, price of attendance, and financial aid, 2011–12Total aid Total grants Student loans
See notes at end of table.
– 40 –

National Center for Education Statistics
Personal characteristics
Average tuition
and fees
Average total
price of attendance Percent
Average amount
received Percent
Average amount
received Percent
Average amount
received
Self-perception of change in physical health between 2012 and 2014
Declined 250 360 1.06 290 1.53 230 1.34 240Constant 190 240 0.77 200 0.93 160 0.87 200Improved 210 300 0.98 230 1.17 190 1.00 170
Self-perception of change in mental health between 2012 and 2014
Declined 240 360 1.47 310 1.98 240 1.22 310Constant 170 240 0.82 180 1.18 130 0.80 150Improved 220 300 1.01 220 0.96 180 1.10 200
First person in immediate family to go to college
Do not know 500 850 3.99 680 4.43 370 4.26 560Yes 190 430 1.56 360 2.06 180 1.80 290No 140 180 0.61 150 0.76 140 0.72 150
Highest education attained by either parent, 2011–12
Do not know 440 640 2.67 420 3.50 260 3.35 370High school diploma or less 190 380 1.13 260 1.75 160 0.99 250Some postsecondary education 180 310 0.96 260 1.21 170 0.98 190Bachelor’s degree or higher 310 390 0.92 270 0.94 300 0.85 200
Dependent students: parents’ income, 2010Less than $30,000 200 340 0.92 290 0.94 180 1.15 210$30,000–59,999 320 440 1.27 440 1.26 310 1.77 230$60,000–89,999 370 470 1.45 450 1.63 350 1.53 260$90,000 or more 390 510 1.20 330 1.28 420 0.96 260
Dependency status and federal Pell Grant receipt, 2011–12
Dependent, received 260 300 † 240 † 190 0.92 140Independent, received 320 560 † 430 † 240 1.56 300Did not receive 200 290 0.87 240 1.32 220 0.78 240
Dependent students: parents provided financial help for housing, tuition, or other expenses, 2011–12
Yes 260 300 0.68 250 0.72 230 0.72 150No 200 350 1.23 350 1.32 250 1.19 220
Table S2.1-A.Standard errors for table 2.1-A: Among 2011–12 first-time postsecondary students, average tuition and fees; average total price of attendance; percentage who received various types of financial aid; and among those who received each type of aid, average amount received in 2011–12, by selected personal characteristics: 2012–14—Continued
Tuition, price of attendance, and financial aid, 2011–12
See notes at end of table.
Total aid Total grants Student loans
– 41 –

National Center for Education Statistics
Personal characteristics
Average tuition
and fees
Average total
price of attendance Percent
Average amount
received Percent
Average amount
received Percent
Average amount
received
Students under age 24: strongly agree parents encourage me to stay in college, 2011–12
Yes 180 210 0.64 180 0.69 180 0.62 140No 280 450 1.72 460 1.98 310 1.60 320
Strongly agree friends from college encourage me to stay in college, 2011–12
Yes 230 270 0.72 200 0.88 200 0.71 140No 140 270 0.88 230 1.19 130 0.85 220
Strongly agree friends from home encourage me to stay in college, 2011–12
Yes 170 210 0.70 160 0.88 160 0.73 170No 170 260 0.87 220 1.26 140 0.83 180
Number of months between high school completion and postsecondary entry
0–12 180 210 0.6 170 0.7 180 0.6 13013 or more 250 480 1.0 400 2.0 230 1.3 260
Recent high school graduateYes 200 240 0.62 200 0.67 200 0.55 130No 250 460 0.89 380 1.99 210 1.20 270
Students under age 30: highest level of high school mathematics completed or planned
Less than algebra 2 300 520 1.48 410 1.86 280 1.68 310Algebra 2 210 360 1.08 250 1.53 160 1.44 220Trigonometry 460 600 1.72 600 1.84 550 2.38 320Precalculus 310 350 1.09 300 1.18 260 1.08 220Calculus, math beyond calculus, or statistics 380 520 0.98 370 1.13 370 1.10 190
Students under age 30: high school grade point average
Less than 2.50 240 420 0.99 320 1.19 230 1.25 2702.50–2.99 300 470 1.43 400 2.08 250 1.49 2703.00–3.49 220 280 0.92 220 1.16 190 0.82 1803.50 or higher 450 620 1.21 520 1.16 450 1.35 230
Table S2.1-A.Standard errors for table 2.1-A: Among 2011–12 first-time postsecondary students, average tuition and fees; average total price of attendance; percentage who received various types of financial aid; and among those who received each type of aid, average amount received in 2011–12, by selected personal characteristics: 2012–14—Continued
Tuition, price of attendance, and financial aid, 2011–12
See notes at end of table.
Total aid Total grants Student loans
– 42 –

National Center for Education Statistics
Personal characteristics
Average tuition
and fees
Average total
price of attendance Percent
Average amount
received Percent
Average amount
received Percent
Average amount
received
Students under age 30: took any college-level courses while in high school
Yes 250 310 0.69 270 0.76 230 0.91 160No 200 380 0.84 310 1.36 140 1.04 230
SOURCE: U.S. Department of Education, National Center for Education Statistics, 2012/14 Beginning Postsecondary Students Longitudinal Study (BPS:12/14).
† Not applicable.
Table S2.1-A.Standard errors for table 2.1-A: Among 2011–12 first-time postsecondary students, average tuition and fees; average total price of attendance; percentage who received various types of financial aid; and among those who received each type of aid, average amount received in 2011–12, by selected personal characteristics: 2012–14—Continued
Tuition, price of attendance, and financial aid, 2011–12Total aid Total grants Student loans
– 43 –

National Center for Education Statistics
Enrollment characteristics
Average tuition
and fees
Average total
price of attendance Percent
Average amount
received Percent
Average amount
received Percent
Average amount
received
Total $9,400 $20,000 81.2 $12,600 73.3 $7,800 46.2 $8,800
Control and level of first institution4-year 14,400 27,200 87.3 17,200 77.5 10,900 60.8 9,800
Public 8,300 20,600 84.5 12,600 72.6 7,400 54.8 9,000Private nonprofit 28,100 42,900 90.6 27,500 86.0 18,900 64.8 11,900For-profit 9,900 20,500 93.0 12,500 80.6 4,700 81.0 8,600
2-year 3,100 11,200 72.7 6,100 66.5 3,900 25.7 5,900Public 1,900 9,700 69.8 4,800 63.2 3,600 19.6 4,400Private nonprofit 13,300 24,700 94.7 16,400 90.0 7,900 70.2 10,200For-profit 13,600 24,100 97.7 13,300 94.8 5,000 77.4 9,000
Less-than-2-year 12,400 22,100 92.1 11,400 89.6 5,100 72.1 7,600Public 4,100 13,000 64.9 6,700 61.0 4,500 23.3 ! 5,700Private nonprofit 9,500 14,600 88.9 7,700 ! 88.3 3,700 ‡ ‡For-profit 13,800 23,800 96.6 12,000 94.3 5,200 81.0 7,800
Degree program, 2011–12No certificate or degree 2,700 9,800 45.6 ‡ 44.9 4,200 ! ‡ 8,100 !Undergraduate certificate 10,000 19,100 86.8 10,600 83.3 4,700 59.1 8,000Associate’s degree 3,000 11,400 74.7 6,300 67.7 4,000 28.6 5,900Bachelor’s degree 15,500 28,800 87.5 18,100 77.4 11,800 60.8 10,200
Strongly agree know requirements needed to complete degree program, 2011–122
Yes 10,300 21,200 82.9 13,400 75.2 8,300 49.1 9,000No 8,400 18,700 80.3 11,600 71.6 7,400 42.5 8,400
Strongly agree that “I feel that I am a part of my first institution.”
Yes 10,900 22,100 83.7 13,800 75.9 8,500 51.2 9,000No 8,100 18,200 79.1 11,500 71.1 7,200 42.0 8,500
Strongly agree have ability to succeed as a student at first institution, 2011–12
Yes 9,600 20,400 81.7 12,900 74.0 7,900 46.5 8,900No 9,000 19,400 80.6 12,200 72.3 7,600 45.8 8,500
Used academic support services, 2011–12Yes 11,900 23,800 85.0 15,400 77.1 10,000 53.0 9,300No 8,100 18,200 79.4 11,100 71.5 6,700 42.9 8,400
Tuition, price of attendance, and financial aid, 2011–12Total aid1 Total grants Student loans
Table 2.1-B.Among 2011–12 first-time postsecondary students, average tuition and fees; average total price of attendance; percentage who received various types of financial aid; and among those who received each type of aid, average amounts received in 2011–12, by selected enrollment characteristics: 2012–14
See notes at end of table.
– 44 –

National Center for Education Statistics
Enrollment characteristics
Average tuition
and fees
Average total
price of attendance Percent
Average amount
received Percent
Average amount
received Percent
Average amount
received
Self-reported remedial coursetaking, 2011–12
Yes 5,100 14,700 79.9 9,300 72.4 5,900 38.5 7,300No 10,600 21,500 81.6 13,500 73.6 8,400 48.4 9,100
Number of minutes to commute to campus, 2011–12
Did not commute to campus 15,000 27,800 86.3 17,900 76.9 11,200 59.3 10,5001–15 5,200 14,500 74.6 8,700 67.3 5,400 35.9 6,90016–30 5,300 14,200 78.0 8,200 70.8 5,100 36.2 6,700More than 30 6,600 16,100 82.0 9,600 75.7 5,700 41.9 7,400
Hours worked per week while enrolled, 2011–12
Did not hold a job 10,100 20,900 82.0 12,900 74.6 7,900 47.3 9,0001–15 14,400 26,800 84.8 18,200 77.2 12,200 52.5 10,00016–34 7,200 17,300 79.1 11,300 70.6 7,100 43.2 8,10035 or more 4,900 13,500 77.2 8,200 67.2 4,600 39.9 7,200
Location of job(s) while enrolled, 2011–12Did not hold a job 10,100 20,900 82.0 12,900 74.6 7,900 47.3 9,000Worked on campus 19,400 33,200 93.0 22,600 85.7 15,400 65.3 10,200Worked off campus only 6,000 15,500 77.4 9,700 68.3 5,800 40.4 7,800
Highest degree ever expected to complete, 2011–123
Undergraduate certificate 10,900 20,200 87.3 10,800 84.5 4,700 62.5 8,000Associate’s degree 4,700 13,100 79.6 7,500 73.6 4,000 39.3 6,700Bachelor’s degree 7,600 17,800 79.8 11,300 70.2 6,600 44.7 8,700Advanced degree 11,900 23,600 82.3 15,000 74.7 10,000 47.7 9,300
Attendance intensity through June 20144
Always full time 12,400 24,700 88.4 15,000 80.5 9,300 56.1 9,300Mixed 5,900 15,100 76.1 9,400 68.1 5,800 36.9 7,900Always part time 1,600 6,800 55.1 3,800 47.6 2,300 16.6 4,400
See notes at end of table.
Table 2.1-B.Among 2011–12 first-time postsecondary students, average tuition and fees; average total price of attendance; percentage who received various types of financial aid; and among those who received each type of aid, average amounts received in 2011–12, by selected enrollment characteristics: 2012–14—Continued
Tuition, price of attendance, and financial aid, 2011–12Total aid1 Total grants Student loans
– 45 –

National Center for Education Statistics
Enrollment characteristics
Average tuition
and fees
Average total
price of attendance Percent
Average amount
received Percent
Average amount
received Percent
Average amount
received
Ever transferred through June 20145
Yes 8,000 18,700 78.9 12,100 71.9 7,200 44.4 9,000 Attempted to transfer credits 8,400 19,500 81.4 12,600 74.7 7,600 43.2 9,500 Did not attempt to transfer credits 7,400 17,400 74.9 11,400 67.5 6,500 46.4 8,200No 9,600 20,200 81.8 12,700 73.6 8,000 46.6 8,700
Direction of first transfer by institution level through June 20145
Did not transfer 9,600 20,200 81.8 12,700 73.6 8,000 46.6 8,7004-year to 4-year 13,200 25,900 86.8 16,600 79.3 9,900 56.1 10,7004-year to 2-year 11,800 24,200 87.8 16,200 76.2 9,000 70.7 9,9002-year to 4-year 3,000 12,400 67.9 6,500 61.6 4,500 23.0 5,8002-year to 2-year 3,100 11,200 70.8 6,200 67.6 4,100 24.6 5,400Transfers to and from less-than-2-year institutions 8,200 17,400 81.9 10,300 79.0 5,400 51.4 6,900
Ever stopped out through June 20146
Yes 6,300 15,200 74.7 9,600 67.4 5,700 38.5 7,600No 10,000 21,000 82.6 13,200 74.5 8,200 47.8 8,900
Number of degrees and certificates pursued through June 20147
One 10,100 21,000 82.3 13,200 74.0 8,200 48.5 8,800More than one 7,300 17,500 79.4 11,100 72.3 6,800 40.9 8,500
Number of changes in major at any institution through June 20148
Zero 9,700 20,300 81.5 12,700 73.9 7,700 47.3 8,800One 9,500 20,700 83.7 13,100 74.4 8,500 46.4 9,100More than one 8,200 18,800 80.4 11,800 72.3 7,700 44.7 7,900
Field of study when last enrolled through June 20149
Computer and information sciences 9,000 20,100 82.4 12,200 70.8 7,800 47.4 8,000Engineering and engineering technology 10,800 21,900 76.5 13,500 69.0 8,800 39.7 9,500Biology and physical science, science technology, math, agriculture 12,800 24,700 79.3 15,900 71.8 11,200 43.7 9,100General studies and other 4,300 12,900 71.5 8,400 62.6 5,300 33.9 6,300Social sciences 13,600 25,700 80.9 16,400 73.8 11,000 49.8 9,300Humanities 14,000 26,100 82.3 16,200 73.2 10,600 48.0 10,600Health care fields 7,700 17,700 87.6 10,900 81.4 6,200 52.1 7,900Business 9,800 20,800 80.4 13,100 71.9 8,000 46.4 9,600Education 8,600 19,700 84.5 12,900 77.1 8,200 49.6 8,800Other applied 9,100 19,400 84.5 12,100 75.7 6,700 50.6 9,000
Table 2.1-B.Among 2011–12 first-time postsecondary students, average tuition and fees; average total price of attendance; percentage who received various types of financial aid; and among those who received each type of aid, average amounts received in 2011–12, by selected enrollment characteristics: 2012–14—Continued
Tuition, price of attendance, and financial aid, 2011–12Total aid1 Total grants Student loans
See notes at end of table.
– 46 –

National Center for Education Statistics
Enrollment characteristics
Average tuition
and fees
Average total
price of attendance Percent
Average amount
received Percent
Average amount
received Percent
Average amount
received
Grade point average estimate when last enrolled through June 2014
Less than 2.25 5,600 14,800 80.6 9,500 72.6 5,500 45.0 7,3002.25–2.74 7,500 18,000 83.0 11,800 75.3 7,000 47.8 8,6002.75–3.24 9,800 20,600 79.2 13,500 70.3 8,300 47.4 9,3003.25–3.74 11,300 22,500 82.0 13,900 73.8 8,800 47.7 9,2003.75 or higher 11,000 22,000 83.0 13,300 76.3 8,600 44.5 8,800
NOTE: Average aid amounts are calculated only for first-time postsecondary students receiving that type of aid. Those not receiving that type of aid (i.e., zero values) are not included in that column’s average. Estimates include individuals who were first-time postsecondary students in 2011–12 at Title IV eligible postsecondary institutions in the 50 states and the District of Columbia. SOURCE: U.S. Department of Education, National Center for Education Statistics, 2012/14 Beginning Postsecondary Students Longitudinal Study (BPS:12/14).
1 Total aid includes grants, loans, work-study, job training benefits, veterans benefits, and Direct PLUS Loans to parents of dependent undergraduates.
9 First-time students who were not in a degree or certificate program when last enrolled are included in the total but excluded here. General studies and other includes general studies, basic skills, and citizenship activities; leisure and recreational activities; personal awareness and self-improvement; high school/secondary diplomas and certificate programs; and interpersonal and social skills. Other applied includes personal and consumer services; manufacturing, construction, repair, and transportation; military technology and protective services; architecture; communications; public administration and human services; design and applied arts; law and legal studies; library sciences; and theology and religious vocations.
3 First-time students who did not expect to complete a certificate or degree are included in the total but excluded here. Advanced degree includes post-BA or post-master certificates, master’s degrees, professional practice doctor’s degrees, and research/scholarship and other doctor’s degrees.
7 First-time students who did not pursue any certificates or degrees through June 2014 are included in the total but excluded here.
! Interpret data with caution. Estimate is unstable because the standard error represents more than 30 percent but less than 51 percent of the estimate.‡ Reporting standards not met.
2 First-time students who were not enrolled in a degree or certificate program or who attained a degree or certificate during the 2011–12 academic year are included in the total but excluded here.
5 A transfer is defined as leaving one institution and enrolling in another institution for 4 or more consecutive months.
8 First-time students who never enrolled in an associate’s or bachelor’s degree program or who never declared a major are included in the total but excluded here.
4 Full-time status for the purposes of financial aid eligibility was based on 12 credit hours unless the awarding institution employed a different standard.
6 A stopout is defined as a break in enrollment of 5 or more consecutive months.
Table 2.1-B.Among 2011–12 first-time postsecondary students, average tuition and fees; average total price of attendance; percentage who received various types of financial aid; and among those who received each type of aid, average amounts received in 2011–12, by selected enrollment characteristics: 2012–14—Continued
Tuition, price of attendance, and financial aid, 2011–12Total aid1 Total grants Student loans
– 47 –

National Center for Education Statistics
Enrollment characteristics
Average tuition
and fees
Average total
price of attendance Percent
Average amount
received Percent
Average amount
received Percent
Average amount
received
Total $120 $170 0.56 $130 0.87 $110 0.55 $150
Control and level of first institution4-year 400 490 0.55 330 0.69 330 0.71 110
Public 200 340 0.98 250 1.16 180 0.91 200Private nonprofit 890 1,000 0.87 630 1.07 620 1.35 250For-profit 590 860 1.40 480 2.02 220 1.43 420
2-year 120 290 0.99 220 1.52 170 1.31 190Public 50 200 1.13 120 1.27 160 1.54 170Private nonprofit 2,160 3,250 7.58 2,320 10.34 1,460 10.18 1,860For-profit 730 980 1.26 590 4.24 140 3.26 560
Less-than-2-year 1,020 970 1.84 370 1.88 210 5.79 440Public 720 1,480 9.19 850 9.10 440 9.29 1,600Private nonprofit 1,790 3,360 14.79 3,330 14.11 860 † †For-profit 1,240 1,110 1.27 410 1.47 230 5.73 440
Degree program, 2011–12No certificate or degree 780 1,390 8.69 † 8.85 1,940 † 3,030Undergraduate certificate 570 660 1.67 380 3.71 150 3.02 310Associate’s degree 110 330 1.00 270 1.08 200 1.08 240Bachelor’s degree 380 490 0.57 360 0.72 340 0.74 130
Strongly agree know requirements needed to complete degree program, 2011–12
Yes 180 230 0.64 160 0.82 160 0.96 200No 180 260 0.97 200 1.08 160 0.80 130
Strongly agree that “I feel that I am a part of my first institution.”
Yes 210 260 0.78 190 1.12 210 0.81 170No 130 230 0.75 200 0.89 120 0.76 180
Strongly agree have ability to succeed as a student at first institution, 2011–12
Yes 160 200 0.70 150 1.14 160 0.72 150No 190 290 0.81 230 0.93 160 0.85 200
Used academic support services, 2011–12Yes 290 330 0.79 260 0.98 220 0.91 160No 150 250 0.72 190 1.03 120 0.67 230
See notes at end of table.
Table S2.1-B.Standard errors for table 2.1-B: Among 2011–12 first-time postsecondary students, average tuition and fees; average total price of attendance; percentage who received various types of financial aid; and among those who received each type of aid, average amounts received in 2011–12, by selected enrollment characteristics: 2012–14
Tuition, price of attendance, and financial aid, 2011–12Total aid Total grants Student loans
– 48 –

National Center for Education Statistics
Enrollment characteristics
Average tuition
and fees
Average total
price of attendance Percent
Average amount
received Percent
Average amount
received Percent
Average amount
received
Self-reported remedial coursetaking, 2011–12
Yes 170 330 1.05 290 1.20 170 1.15 270No 150 210 0.61 140 0.97 130 0.65 160
Number of minutes to commute to campus, 2011–12
Did not commute to campus 280 350 0.70 250 0.77 290 0.96 1601–15 190 400 1.47 280 1.63 200 1.51 17016–30 170 280 1.10 260 1.54 160 1.11 220More than 30 210 410 1.12 330 1.62 210 1.83 310
Hours worked per week while enrolled, 2011–12
Did not hold a job 170 250 0.75 170 0.95 130 0.67 1901–15 840 1,080 1.40 730 1.37 760 1.92 35016–34 240 320 1.15 260 1.42 210 1.67 21035 or more 190 350 1.78 270 1.92 190 1.73 260
Location of job(s) while enrolled, 2011–12Did not hold a job 170 250 0.75 170 0.95 130 0.67 190Worked on campus 870 1,070 0.97 790 1.31 760 2.09 320Worked off campus only 140 210 0.94 190 1.35 130 1.21 180
Highest degree ever expected to complete, 2011–12
Undergraduate certificate 820 980 2.32 420 3.36 160 3.69 300Associate’s degree 200 460 1.68 470 2.75 280 1.72 330Bachelor’s degree 160 270 0.81 200 1.05 130 0.97 230Advanced degree 280 330 0.72 250 0.78 230 0.81 140
Attendance intensity through June 2014Always full time 250 280 0.50 190 0.72 220 0.68 120Mixed 150 290 1.04 260 1.36 160 1.10 260Always part time 130 260 2.18 310 2.08 220 1.88 250
Table S2.1-B.Standard errors for table 2.1-B: Among 2011–12 first-time postsecondary students, average tuition and fees; average total price of attendance; percentage who received various types of financial aid; and among those who received each type of aid, average amounts received in 2011–12, by selected enrollment characteristics: 2012–14—Continued
Tuition, price of attendance, and financial aid, 2011–12
See notes at end of table.
Total aid Total grants Student loans
– 49 –

National Center for Education Statistics
Enrollment characteristics
Average tuition
and fees
Average total
price of attendance Percent
Average amount
received Percent
Average amount
received Percent
Average amount
received
Ever transferred through June 2014Yes 230 340 1.28 290 1.32 210 1.38 230 Attempted to transfer credits 330 470 1.73 400 1.99 310 2.14 300 Did not attempt to transfer credits 350 560 2.06 450 2.17 300 1.97 370No 140 200 0.59 140 0.95 120 0.69 160
Direction of first transfer by institution level through June 2014
Did not transfer 140 200 0.59 140 0.95 120 0.69 1604-year to 4-year 670 900 2.61 700 2.70 550 2.72 3704-year to 2-year 520 710 2.05 550 2.38 450 2.79 4302-year to 4-year 210 470 2.69 450 2.77 270 2.07 5102-year to 2-year 310 590 3.65 480 3.58 310 2.59 460Transfers to and from less-than-2-year institutions 870 1,260 4.67 880 4.55 530 6.39 400
Ever stopped out through June 2014Yes 270 450 1.35 370 1.36 220 1.28 360No 160 190 0.62 130 0.93 130 0.61 140
Number of degrees and certificates pursued through June 2014
One 160 200 1 140 1 150 1 160More than one 170 320 1 230 1 150 1 190
Number of changes in major at any institution through June 2014
Zero 160 210 0.59 150 0.92 140 0.72 150One 240 330 1.13 250 1.35 200 1.13 250More than one 320 470 1.63 370 1.72 270 1.83 300
Field of study when last enrolled through June 2014
Computer and information sciences 610 810 2.64 650 2.99 530 3.24 330Engineering and engineering technology 550 760 2.11 610 2.13 500 2.01 450Biology and physical science, science technology, math, agriculture 520 700 1.81 650 1.93 530 1.59 350General studies and other 320 570 2.70 630 2.56 430 2.44 440Social sciences 800 1,040 1.85 740 1.80 610 1.88 380Humanities 590 730 2.04 590 2.20 510 2.13 590Health care fields 230 430 1.14 330 1.95 190 1.58 240Business 310 500 1.38 390 1.67 300 1.42 340Education 480 680 2.15 580 2.33 420 2.41 370Other applied 290 380 1.00 260 1.30 200 1.73 240
Table S2.1-B.Standard errors for table 2.1-B: Among 2011–12 first-time postsecondary students, average tuition and fees; average total price of attendance; percentage who received various types of financial aid; and among those who received each type of aid, average amounts received in 2011–12, by selected enrollment characteristics: 2012–14—Continued
Tuition, price of attendance, and financial aid, 2011–12
See notes at end of table.
Total aid Total grants Student loans
– 50 –

National Center for Education Statistics
Enrollment characteristics
Average tuition
and fees
Average total
price of attendance Percent
Average amount
received Percent
Average amount
received Percent
Average amount
received
Grade point average estimate when last enrolled through June 2014
Less than 2.25 190 330 1.61 310 1.70 210 1.51 2302.25–2.74 200 300 1.20 280 1.31 200 1.42 2602.75–3.24 250 360 1.08 310 1.60 220 1.18 2803.25–3.74 240 310 1.00 220 1.08 200 0.97 1603.75 or higher 340 420 1.22 340 1.57 340 1.35 350
SOURCE: U.S. Department of Education, National Center for Education Statistics, 2012/14 Beginning Postsecondary Students Longitudinal Study (BPS:12/14).
† Not applicable.
Table S2.1-B.Standard errors for table 2.1-B: Among 2011–12 first-time postsecondary students, average tuition and fees; average total price of attendance; percentage who received various types of financial aid; and among those who received each type of aid, average amounts received in 2011–12, by selected enrollment characteristics: 2012–14—Continued
Tuition, price of attendance, and financial aid, 2011–12Total aid Total grants Student loans
– 51 –

National Center for Education Statistics
Personal characteristics Percent
Average amount
received Percent
Average amount
received Percent
Average amount
received Percent
Average amount
received
Total 49.0 $3,700 21.3 $3,000 28.1 $8,000 19.3 $6,700
SexMale 44.5 3,500 20.1 2,800 27.3 7,700 17.8 6,800Female 52.5 3,800 22.3 3,100 28.7 8,200 20.5 6,700
Race/ethnicity1
White 38.5 3,500 20.2 2,900 28.6 8,600 23.0 7,000Black 74.1 3,700 23.8 2,800 21.4 8,300 16.3 6,400Hispanic 62.2 3,800 21.2 3,200 30.3 5,500 11.9 5,300Asian 41.4 4,400 27.5 4,100 32.4 10,100 17.3 6,800Other or Two or more races 51.5 3,800 19.7 2,800 27.2 9,200 17.9 7,100
Immigrant generation2
Immigrant 54.1 3,800 23.9 3,200 23.8 6,800 12.2 6,300Second-generation American 58.2 3,900 24.7 3,500 33.2 7,200 15.8 6,200Third-generation or higher American 47.1 3,600 20.6 2,800 27.3 8,300 21.0 6,800
Dependency status and family responsibilities, 2011–123
Dependent 41.7 3,800 24.2 3,100 34.1 8,400 23.7 7,000Independent 71.9 3,500 12.1 2,100 9.0 3,200 5.5 3,300 Unmarried, no dependent(s) 67.8 3,400 15.7 2,400 13.1 3,900 8.4 4,000 Unmarried, with dependent(s) 81.9 3,700 11.5 2,000 7.7 3,000 ! 4.4 2,600 Married 63.7 3,400 8.3 1,700 5.7 1,400 3.1 2,300
Age as of December 31, 201118 years or younger 41.3 3,900 25.5 3,200 36.6 8,500 24.7 7,00019 years 44.0 3,800 23.4 3,100 32.2 7,900 23.3 6,70020–23 years 62.9 3,400 13.4 2,100 8.6 6,300 5.8 4,90024–29 years 74.6 3,300 10.0 1,700 6.6 1,400 3.5 2,60030 years or older 71.3 3,400 9.1 1,800 7.6 1,800 4.7 2,500
Veterans and military service members on active duty, in the reserves, or in the National Guard, 2011–12
Yes 46.0 3,500 11.8 ! 2,100 4.6 ! 3,300 ! 4.6 ‡No 49.1 3,700 21.6 3,000 28.8 8,000 19.7 6,800
Has some type of disability, 2011–12Yes 55.3 3,500 19.5 2,600 22.8 6,600 15.2 6,200No 48.1 3,700 21.5 3,100 28.8 8,200 19.8 6,800
Table 2.2-A.Percentage of 2011–12 first-time postsecondary students who received federal Pell, state, institutional, or merit-only grants and among those who received each type of aid, the average amounts received in 2011–12, by selected personal characteristics: 2012–14
Federal Pell Grants State grantsFinancial aid, 2011–12
Institutional grants Merit-only grants
See notes at end of table.
– 52 –

National Center for Education Statistics
Personal characteristics Percent
Average amount
received Percent
Average amount
received Percent
Average amount
received Percent
Average amount
received
Self-perception of change in physical health between 2012 and 2014
Declined 49.7 3,600 20.6 3,100 25.5 7,600 17.0 6,700Constant 48.0 3,700 21.3 3,100 29.0 8,500 20.4 7,000Improved 50.0 3,700 21.7 2,800 28.5 7,500 19.2 6,200
Self-perception of change in mental health between 2012 and 2014
Declined 50.7 3,600 20.5 2,900 25.8 7,600 16.8 6,700Constant 48.4 3,700 22.3 3,000 28.7 8,000 20.5 6,800Improved 48.6 3,700 20.4 3,100 29.0 8,300 19.4 6,600
First person in immediate family to go to college
Do not know 70.9 3,600 16.1 3,300 18.8 3,500 6.5 4,500Yes 69.2 3,700 20.8 2,800 21.3 5,400 11.6 4,900No 43.7 3,700 21.5 3,000 29.9 8,500 21.5 7,000
Highest education attained by either parent, 2011–12
Do not know 69.2 3,600 15.2 3,300 17.8 4,000 7.9 4,200High school diploma or less 69.6 3,700 22.2 2,900 20.2 5,400 11.7 5,000Some postsecondary education 53.7 3,700 22.8 2,900 27.4 6,600 17.6 6,300Bachelor’s degree or higher 26.8 3,600 20.2 3,200 36.1 10,100 27.8 7,600
Dependent students: parents’ income, 20104
Less than $30,000 87.7 4,400 32.3 3,200 30.7 6,500 15.5 5,900$30,000–59,999 68.1 3,100 31.3 3,200 35.2 7,900 22.5 6,700$60,000–89,999 14.7 1,800 23.0 3,000 36.1 8,300 25.6 6,700$90,000 or more 0.7 3,200 13.2 3,100 35.2 10,200 30.3 7,700
Dependency status and federal Pell Grant receipt, 2011–12
Dependent, received 100.0 3,800 37.1 3,200 35.9 7,400 20.7 6,300Independent, received 100.0 3,500 14.3 2,100 10.0 3,300 5.7 3,300Did not receive † † 13.8 2,900 29.4 9,000 23.0 7,300
Dependent students: parents provided financial help for housing, tuition, or other expenses, 2011–12
Yes 35.6 3,800 23.2 3,200 35.5 8,900 25.5 7,200No 64.2 3,800 27.7 2,800 29.3 6,200 16.9 6,000
See notes at end of table.
Table 2.2-A.Percentage of 2011–12 first-time postsecondary students who received federal Pell, state, institutional, or merit-only grants and among those who received each type of aid, the average amounts received in 2011–12, by selected personal characteristics: 2012–14—Continued
Financial aid, 2011–12Federal Pell Grants State grants Institutional grants Merit-only grants
– 53 –

National Center for Education Statistics
Personal characteristics Percent
Average amount
received Percent
Average amount
received Percent
Average amount
received Percent
Average amount
received
Students under age 24: strongly agree parents encourage me to stay in college, 2011–12
Yes 43.5 3,800 23.8 3,100 33.0 8,600 23.5 7,000No 52.2 3,700 20.8 2,900 24.9 6,000 13.3 5,800
Strongly agree friends from college encourage me to stay in college, 2011–12
Yes 47.6 3,800 23.4 3,200 32.2 8,900 23.1 7,100No 50.8 3,500 18.6 2,700 22.8 6,500 14.3 6,000
Strongly agree friends from home encourage me to stay in college, 2011–12
Yes 48.1 3,800 21.8 3,100 30.0 8,500 21.2 7,000No 50.5 3,500 20.5 2,800 24.9 7,000 16.0 6,000
Number of months between high school completion and postsecondary entry5
0–12 43.6 3,800 25.1 3,100 34.6 8,400 24.3 6,90013 or more 63.6 3,400 11.3 2,200 10.4 4,800 5.8 5,100
Recent high school graduate6
Yes 42.3 3,900 25.6 3,200 35.7 8,400 25.1 6,900No 63.4 3,400 11.9 2,200 11.6 5,700 6.8 5,600
Students under age 30: highest level of high school mathematics completed or planned7
Less than algebra 2 58.6 3,500 15.2 2,500 18.6 4,400 8.2 5,400Algebra 2 54.5 3,600 19.9 2,600 21.5 5,600 12.6 5,600Trigonometry 44.6 4,100 27.0 3,600 35.8 9,400 26.1 7,000Precalculus 42.8 3,900 26.0 2,800 31.9 7,900 25.1 6,200Calculus, math beyond calculus, or statistics 35.1 3,900 25.1 3,700 43.6 10,500 32.3 7,900
Students under age 30: high school grade point average
Less than 2.50 58.0 3,600 17.0 2,100 18.5 4,200 7.0 5,4002.50–2.99 50.9 3,700 20.3 3,100 22.9 6,800 13.8 5,7003.00–3.49 44.2 3,800 23.8 3,100 31.9 7,900 23.1 6,5003.50 or higher 38.2 3,700 26.6 3,600 42.2 10,600 34.2 7,700
Federal Pell Grants State grants Institutional grants Merit-only grants
See notes at end of table.
Table 2.2-A.Percentage of 2011–12 first-time postsecondary students who received federal Pell, state, institutional, or merit-only grants and among those who received each type of aid, the average amounts received in 2011–12, by selected personal characteristics: 2012–14—Continued
Financial aid, 2011–12
– 54 –

National Center for Education Statistics
Personal characteristics Percent
Average amount
received Percent
Average amount
received Percent
Average amount
received Percent
Average amount
received
Students under age 30: took any college-level courses while in high school8
Yes 40.4 3,800 25.3 3,300 36.7 9,300 27.2 7,200No 56.2 3,600 18.3 2,500 20.5 5,300 11.5 5,600
7 Math coursetaking data come from two sources: surveys first-time students completed when they took the ACT or SAT I in high school and BPS interviews first-time students completed in the base year or first follow-up. First-time students who reported this information on an entrance examination survey may not have completed all courses at the time they took the survey.
Table 2.2-A.Percentage of 2011–12 first-time postsecondary students who received federal Pell, state, institutional, or merit-only grants and among those who received each type of aid, the average amounts received in 2011–12, by selected personal characteristics: 2012–14—Continued
Financial aid, 2011–12Federal Pell Grants State grants Institutional grants Merit-only grants
SOURCE: U.S. Department of Education, National Center for Education Statistics, 2012/14 Beginning Postsecondary Students Longitudinal Study (BPS:12/14).
! Interpret data with caution. Estimate is unstable because the standard error represents more than 30 percent but less than 51 percent of the estimate.
5 First-time students who did not complete a high school diploma, certificate, or equivalency are included in the total but excluded here.6 Recent high school graduates only include first-time students who graduated from high school with a regular high school diploma in 2011 or 2012.
8 Includes college courses for credit, Advanced Placement (AP), and International Baccalaureate (IB) courses.
3 First-time students classified as independent include those age 24 or over and those under 24 who are married, have dependents, are veterans or on active duty, are orphans or wards of the courts, are homeless or at risk of homelessness, or were determined to be independent by a financial aid officer using professional judgment. Other first-time students under age 24 are considered to be dependent. Within marital status, the unmarried category includes first-time students who are divorced, separated, or widowed. First-time students are considered to have a dependent if they have a child or any others for whom they are the caretaker or have financial responsibility. A spouse is not considered to be a dependent.
NOTE: Average aid amounts are calculated only for first-time postsecondary students receiving that type of aid. Those not receiving that type of aid (i.e., zero values) are not included in that column’s average. Estimates include individuals who were first-time postsecondary students in 2011–12 at Title IV eligible postsecondary institutions in the 50 states and the District of Columbia.
4 Income in 2010 is used because it was reported on the federal financial aid application and used for federal need analysis for 2011–12.
1 Black includes African American, Hispanic includes Latino, and Other or Two or more races includes American Indian or Alaska Native, Pacific Islander or Native Hawaiian, and first-time students having origins in more than one race. Race categories exclude Hispanic origin.2 First-time foreign students with visas are included in the total but excluded here. Immigrants include foreign-born first-time students who were U.S. citizens with one or both parent(s) born outside of the United States, resident aliens, or noncitizens eligible for citizenship. Second-generation Americans include U.S.-born first-time students with one or both parent(s) foreign born. Third-generation or higher Americans include U.S.- and foreign-born first-time students with both parents born in the United States.
† Not applicable.
‡ Reporting standards not met.
– 55 –

National Center for Education Statistics
Personal characteristics Percent
Average amount
received Percent
Average amount
received Percent
Average amount
received Percent
Average amount
received
Total 0.56 $90 0.81 $60 0.58 $260 0.53 $220
SexMale 0.90 120 0.96 110 0.86 300 0.68 250Female 0.67 80 0.85 80 0.63 320 0.61 270
Race/ethnicityWhite 0.71 90 0.79 80 0.71 260 0.69 220Black 1.49 110 1.33 140 1.73 540 1.40 420Hispanic 1.59 120 1.52 180 1.50 470 1.04 600Asian 2.81 150 2.71 380 2.14 710 1.72 600Other or Two or more races 2.54 170 1.95 240 2.38 810 1.87 750
Immigrant generationImmigrant 2.21 180 1.75 210 1.74 700 1.12 550Second-generation American 1.23 90 1.17 130 1.46 490 0.94 380Third-generation or higher American 0.77 90 0.90 70 0.61 280 0.61 240
Dependency status and family responsibilities, 2011–12
Dependent 0.75 90 0.71 70 0.67 280 0.58 210Independent 3.30 120 1.60 140 0.95 440 0.80 400 Unmarried, no dependent(s) 4.51 200 2.38 210 2.14 640 1.84 770 Unmarried, with dependent(s) 2.96 80 1.47 230 0.98 1,120 0.79 410 Married 3.51 150 1.69 290 1.15 420 0.74 360
Age as of December 31, 201118 years or younger 0.91 90 0.73 70 0.88 280 0.69 23019 years 1.21 120 1.44 100 0.94 470 1.01 32020–23 years 2.31 140 2.21 210 0.87 780 0.65 68024–29 years 3.70 130 1.66 210 1.27 420 0.61 44030 years or older 3.51 120 1.27 250 1.19 460 0.83 420
Veterans and military service members on active duty, in the reserves, or in the National Guard, 2011–12
Yes 7.46 220 3.69 550 1.61 1,130 1.36 †No 0.50 100 0.75 60 0.58 270 0.54 230
Has some type of disability, 2011–12Yes 2.10 140 2.83 170 1.82 640 1.66 890No 0.54 90 0.65 70 0.60 250 0.51 190
Table S2.2-A.Standard errors for table 2.2-A: Percentage of 2011–12 first-time postsecondary students who received federal Pell, state, institutional, or merit-only grants and among those who received each type of aid, the average amounts received in 2011–12, by selected personal characteristics: 2012–14
Financial aid, 2011–12Federal Pell Grants State grants Institutional grants Merit-only grants
See notes at end of table.
– 56 –

National Center for Education Statistics
Personal characteristics Percent
Average amount
received Percent
Average amount
received Percent
Average amount
received Percent
Average amount
received
Self-perception of change in physical health between 2012 and 2014
Declined 1.21 100 1.00 170 1.03 360 0.91 310Constant 0.84 100 0.87 100 0.76 320 0.65 260Improved 0.97 110 1.18 90 0.97 400 0.98 360
Self-perception of change in mental health between 2012 and 2014
Declined 1.87 110 1.12 120 1.04 390 0.95 320Constant 0.89 110 1.06 90 0.98 330 0.98 280Improved 1.16 90 0.84 110 0.91 320 0.74 290
First person in immediate family to go to college
Do not know 4.41 180 2.57 530 3.56 750 1.37 630Yes 2.51 100 1.18 120 1.17 410 0.76 450No 0.56 90 0.84 70 0.62 310 0.64 230
Highest education attained by either parent, 2011–12
Do not know 3.57 140 1.63 400 2.14 550 1.36 770High school diploma or less 1.92 110 1.53 120 0.92 360 0.67 390Some postsecondary education 0.98 90 0.91 110 1.10 260 0.87 260Bachelor’s degree or higher 1.03 110 0.85 100 0.74 400 0.81 280
Dependent students: parents’ income, 2010Less than $30,000 1.10 70 1.72 90 1.26 370 0.81 270$30,000–59,999 1.55 80 1.43 120 1.37 420 1.21 310$60,000–89,999 1.26 150 1.47 140 1.37 460 1.29 370$90,000 or more 0.15 500 0.95 230 1.03 380 1.16 280
Dependency status and federal Pell Grant receipt, 2011–12
Dependent, received † 90 1.12 90 1.03 430 0.83 310Independent, received † 120 1.77 150 1.09 520 1.01 500Did not receive † † 0.92 150 0.83 260 1.01 210
Dependent students: parents provided financial help for housing, tuition, or other expenses, 2011–12
Yes 0.78 80 0.74 80 0.75 300 0.65 210No 1.33 120 1.29 100 1.34 410 0.89 410
Table S2.2-A.Standard errors for table 2.2-A: Percentage of 2011–12 first-time postsecondary students who received federal Pell, state, institutional, or merit-only grants and among those who received each type of aid, the average amounts received in 2011–12, by selected personal characteristics: 2012–14—Continued
Financial aid, 2011–12Federal Pell Grants State grants Institutional grants Merit-only grants
See notes at end of table.
– 57 –

National Center for Education Statistics
Personal characteristics Percent
Average amount
received Percent
Average amount
received Percent
Average amount
received Percent
Average amount
received
Students under age 24: strongly agree parents encourage me to stay in college, 2011–12
Yes 0.65 90 0.82 70 0.66 290 0.63 240No 2.07 160 1.48 140 1.35 420 0.95 380
Strongly agree friends from college encourage me to stay in college, 2011–12
Yes 0.70 80 0.93 80 0.83 310 0.64 280No 0.92 110 0.80 100 0.83 270 0.62 260
Strongly agree friends from home encourage me to stay in college, 2011–12
Yes 0.64 90 0.77 90 0.72 290 0.61 220No 0.99 110 1.14 90 0.73 320 0.67 340
Number of months between high school completion and postsecondary entry
0–12 0.59 100 0.78 70 0.66 300 0.63 24013 or more 2.25 100 1.21 160 0.81 630 0.48 570
Recent high school graduateYes 0.62 100 0.79 70 0.70 320 0.64 250No 2.14 100 1.06 140 0.81 580 0.49 480
Students under age 30: highest level of high school mathematics completed or planned
Less than algebra 2 1.57 150 1.10 170 1.41 460 0.80 370Algebra 2 1.41 90 1.32 110 0.94 300 0.65 280Trigonometry 1.86 150 1.70 190 2.40 440 1.84 370Precalculus 1.09 100 1.38 110 0.95 390 1.28 410Calculus, math beyond calculus, or statistics 1.05 100 1.22 120 1.12 530 1.04 300
Students under age 30: high school grade point average
Less than 2.50 1.26 110 1.00 120 1.03 330 0.53 4602.50–2.99 1.89 160 1.21 220 1.20 460 0.98 3403.00–3.49 0.85 90 1.23 100 1.01 370 0.86 3103.50 or higher 1.11 90 1.14 90 1.34 390 1.09 300
Students under age 30: took any college-level courses while in high school
Yes 0.88 100 0.80 70 0.70 350 0.78 270No 1.37 100 1.24 100 0.84 270 0.57 270
SOURCE: U.S. Department of Education, National Center for Education Statistics, 2012/14 Beginning Postsecondary Students Longitudinal Study (BPS:12/14).
† Not applicable.
Table S2.2-A.Standard errors for table 2.2-A: Percentage of 2011–12 first-time postsecondary students who received federal Pell, state, institutional, or merit-only grants and among those who received each type of aid, the average amounts received in 2011–12, by selected personal characteristics: 2012–14—Continued
Financial aid, 2011–12Federal Pell Grants State grants Institutional grants Merit-only grants
– 58 –

National Center for Education Statistics
Enrollment characteristics Percent
Average amount
received Percent
Average amount
received Percent
Average amount
received Percent
Average amount
received
Total 49.0 $3,700 21.3 $3,000 28.1 $8,000 19.3 $6,700
Control and level of first institution4-year 43.0 3,900 27.8 3,600 40.7 10,100 31.5 7,400
Public 40.0 4,000 33.3 3,600 31.2 4,600 26.8 4,400Private nonprofit 36.2 4,100 24.9 3,600 73.8 14,900 52.2 10,500For-profit 75.1 3,500 7.7 3,300 4.0 3,800 2.4 ! 3,500
2-year 52.2 3,300 15.1 1,800 15.4 1,300 6.3 2,700Public 47.6 3,200 16.0 1,700 15.9 1,100 6.5 2,700Private nonprofit 73.6 4,200 27.9 ! 2,900 44.9 ! 4,700 ! 16.2 ! 3,700 !For-profit 93.5 4,000 4.8 2,400 5.5 1,900 2.3 ! ‡
Less-than-2-year 87.8 4,300 ‡ ‡ ‡ ‡ ‡ ‡Public 53.7 3,800 ‡ ‡ ‡ ‡ ‡ ‡Private nonprofit 78.2 3,700 # ‡ # ‡ # ‡For-profit 93.6 4,400 ‡ ‡ ‡ ‡ ‡ ‡
Degree program, 2011–12No certificate or degree 23.7 ! 4,400 ! 10.6 ! ‡ 19.1 1,600 ! ‡ ‡Undergraduate certificate 77.8 4,000 8.1 2,200 4.2 1,900 5.0 3,300Associate’s degree 54.0 3,300 15.7 1,700 15.7 1,600 6.2 2,600Bachelor’s degree 38.9 4,000 29.8 3,700 45.2 10,300 35.1 7,500
Strongly agree know requirements needed to complete degree program, 2011–121
Yes 50.1 3,700 22.1 3,100 28.5 8,900 20.6 7,000No 46.9 3,500 21.7 2,800 29.6 7,100 19.3 6,400
Strongly agree that “I feel that I am a part of my first institution.”
Yes 50.4 3,800 20.4 3,100 29.4 9,000 20.8 7,200No 47.8 3,600 22.1 3,000 27.0 7,200 18.1 6,200
Strongly agree have ability to succeed as a student at first institution, 2011–12
Yes 49.3 3,800 20.7 3,000 28.0 8,200 20.1 6,900No 48.4 3,500 22.2 3,000 28.3 7,700 18.1 6,400
Used academic support services, 2011–12Yes 47.2 3,900 25.2 3,400 37.0 9,600 25.8 7,400No 49.8 3,600 19.4 2,800 23.8 6,800 16.1 6,200
Table 2.2-B.Percentage of 2011–12 first-time postsecondary students who received federal Pell, state, institutional, or merit-only grants and among those who received each type of aid, the average amounts received in 2011–12, by selected enrollment characteristics: 2012–14
Federal Pell Grants State grants Institutional grants Merit-only grantsFinancial aid, 2011–12
See notes at end of table.
– 59 –

National Center for Education Statistics
Enrollment characteristics Percent
Average amount
received Percent
Average amount
received Percent
Average amount
received Percent
Average amount
received
Self-reported remedial coursetaking, 2011–12Yes 56.1 3,700 22.5 2,600 20.1 4,300 10.3 4,700No 47.0 3,700 20.9 3,100 30.4 8,700 21.8 7,000
Number of minutes to commute to campus, 2011–12
Did not commute to campus 39.7 3,800 24.3 3,600 43.1 10,500 31.3 8,0001–15 51.3 3,700 18.6 2,400 17.7 4,000 12.2 4,40016–30 54.6 3,500 18.8 2,500 18.7 3,700 11.1 4,300More than 30 60.7 3,700 21.0 2,600 17.9 4,800 10.7 4,500
Hours worked per week while enrolled, 2011–12Did not hold a job 49.7 3,700 21.3 3,100 29.1 7,900 19.6 7,0001–15 41.0 3,800 24.2 3,600 46.9 11,100 31.8 7,90016–34 49.6 3,700 24.7 2,600 24.4 7,000 17.9 5,50035 or more 50.3 3,300 14.2 2,300 14.0 4,100 10.3 4,100
Location of job(s) while enrolled, 2011–12Did not hold a job 49.7 3,700 21.3 3,100 29.1 7,900 19.6 7,000Worked on campus 45.1 4,100 29.1 3,400 61.0 12,900 40.4 8,700Worked off campus only 48.3 3,500 19.7 2,700 19.8 5,600 14.7 4,900
Highest degree ever expected to complete, 2011–122
Undergraduate certificate 79.0 4,100 7.2 2,300 ! 3.1 ! 2,400 4.3 3,500Associate’s degree 63.8 3,300 12.6 1,800 12.0 1,600 5.8 2,300Bachelor’s degree 47.7 3,600 20.2 2,700 25.2 6,200 15.7 6,000Advanced degree 43.6 3,800 25.8 3,300 36.9 9,500 27.0 7,400
Attendance intensity through June 20143
Always full time 53.0 4,200 24.9 3,200 34.0 9,100 24.4 7,100Mixed 45.7 3,100 18.7 2,600 22.8 5,900 14.4 5,800Always part time 35.3 1,600 8.2 1,700 9.5 900 4.2 2,100
See notes at end of table.
Table 2.2-B.Percentage of 2011–12 first-time postsecondary students who received federal Pell, state, institutional, or merit-only grants and among those who received each type of aid, the average amounts received in 2011–12, by selected enrollment characteristics: 2012–14—Continued
Financial aid, 2011–12Federal Pell Grants State grants Institutional grants Merit-only grants
– 60 –

National Center for Education Statistics
Enrollment characteristics Percent
Average amount
received Percent
Average amount
received Percent
Average amount
received Percent
Average amount
received
Ever transferred through June 20144
Yes 46.8 3,900 24.1 2,700 27.8 6,700 20.8 5,500 Attempted to transfer credits 45.6 4,100 26.8 2,700 31.4 6,800 24.6 5,500 Did not attempt to transfer credits 48.5 3,600 19.9 2,700 22.2 6,500 14.9 5,300No 49.5 3,600 20.7 3,100 28.2 8,300 19.0 7,000
Direction of first transfer by institution level through June 20144
Did not transfer 49.5 3,600 20.7 3,100 28.2 8,300 19.0 7,0004-year to 4-year 44.5 4,200 32.2 3,000 40.0 9,200 35.1 6,4004-year to 2-year 48.3 3,700 32.1 3,000 38.7 7,700 29.7 5,5002-year to 4-year 36.9 4,000 18.0 2,200 17.9 2,100 11.2 2,8002-year to 2-year 53.9 3,400 15.5 1,800 16.2 1,900 6.7 3,600Transfers to and from less-than-2-year institutions 72.4 3,900 11.6 2,600 11.2 ! 5,100 ! 6.3 ! ‡
Ever stopped out through June 20145
Yes 47.6 3,200 17.1 2,500 21.1 5,400 13.2 5,300No 49.3 3,800 22.1 3,100 29.6 8,400 20.6 6,900
Number of degrees and certificates pursued through June 20146
One 48.8 3,700 20.9 3,100 29.1 8,700 19.8 7,200More than one 50.4 3,700 22.5 2,700 25.5 6,200 18.6 5,500
Number of changes in major at any institution through June 20147
Zero 51.4 3,600 19.7 2,900 25.8 8,600 17.7 6,900One 44.7 3,900 25.6 3,300 34.7 7,500 24.0 6,500More than one 43.9 3,700 25.2 3,100 32.8 6,600 24.8 6,300
Field of study when last enrolled through June 20148
Computer and information sciences 49.7 3,600 20.0 3,200 25.5 7,900 16.5 6,000Engineering and engineering technology 41.4 3,600 18.9 3,000 27.6 9,200 19.6 6,400Biology and physical science, science technology, math, agriculture 36.6 4,000 28.6 3,700 41.2 10,000 32.0 7,800General studies and other 43.5 3,500 20.5 2,200 17.8 4,800 12.9 5,100Social sciences 41.8 4,000 23.4 3,600 38.6 10,800 27.2 8,000Humanities 38.8 3,600 23.8 3,200 40.5 10,100 27.5 7,900Health care fields 62.8 3,700 20.6 2,800 20.4 6,300 15.9 5,900Business 43.6 3,600 20.4 3,000 31.4 8,000 19.9 6,700Education 48.2 3,500 24.3 2,900 34.4 7,700 25.7 7,000Other applied 56.1 3,800 19.4 2,800 23.6 6,600 15.4 5,900
Table 2.2-B.Percentage of 2011–12 first-time postsecondary students who received federal Pell, state, institutional, or merit-only grants and among those who received each type of aid, the average amounts received in 2011–12, by selected enrollment characteristics: 2012–14—Continued
Financial aid, 2011–12Federal Pell Grants State grants Institutional grants Merit-only grants
See notes at end of table.
– 61 –

National Center for Education Statistics
Enrollment characteristics Percent
Average amount
received Percent
Average amount
received Percent
Average amount
received Percent
Average amount
received
Grade point average estimate when last enrolled through June 2014
Less than 2.25 58.2 3,500 19.4 2,200 20.4 5,200 10.7 5,0002.25–2.74 57.5 3,800 23.9 3,000 26.8 5,500 15.6 5,3002.75–3.24 45.0 3,700 23.2 3,100 29.9 7,900 20.2 6,5003.25–3.74 44.4 3,800 21.6 3,200 30.9 9,300 23.0 7,1003.75 or higher 46.1 3,700 19.1 3,100 30.0 9,800 23.7 7,900
# Rounds to zero.! Interpret data with caution. Estimate is unstable because the standard error represents more than 30 percent but less than 51 percent of the estimate.
NOTE: Average aid amounts are calculated only for first-time postsecondary students receiving that type of aid. Those not receiving that type of aid (i.e., zero values) are not included in that column’s average. Estimates include individuals who were first-time postsecondary students in 2011–12 at Title IV eligible postsecondary institutions in the 50 states and the District of Columbia.
3 Full-time status for the purposes of financial aid eligibility was based on 12 credit hours unless the awarding institution employed a different standard.
5 A stopout is defined as a break in enrollment of 5 or more consecutive months.
2 First-time students who did not expect to complete a certificate or degree are included in the total but excluded here. Advanced degree includes post-BA or post-master certificates, master’s degrees, professional practice doctor’s degrees, and research/scholarship and other doctor’s degrees.
6 First-time students who did not pursue any certificates or degrees through June 2014 are included in the total but excluded here.
SOURCE: U.S. Department of Education, National Center for Education Statistics, 2012/14 Beginning Postsecondary Students Longitudinal Study (BPS:12/14).
1 First-time students who were not enrolled in a degree or certificate program or who attained a degree or certificate during the 2011–12 academic year are included in the total but excluded here.
4 A transfer is defined as leaving one institution and enrolling in another institution for 4 or more consecutive months.
7 First-time students who never enrolled in an associate’s or bachelor’s degree program or who never declared a major are included in the total but excluded here.8 First-time students who were not in a degree or certificate program when last enrolled are included in the total but excluded here. General studies and other includes general studies, basic skills, and citizenship activities; leisure and recreational activities; personal awareness and self-improvement; high school/secondary diplomas and certificate programs; and interpersonal and social skills. Other applied includes personal and consumer services; manufacturing, construction, repair, and transportation; military technology and protective services; architecture; communications; public administration and human services; design and applied arts; law and legal studies; library sciences; and theology and religious vocations.
‡ Reporting standards not met.
Federal Pell Grants State grants Merit-only grants
Table 2.2-B.Percentage of 2011–12 first-time postsecondary students who received federal Pell, state, institutional, or merit-only grants and among those who received each type of aid, the average amounts received in 2011–12, by selected enrollment characteristics: 2012–14—Continued
Financial aid, 2011–12Institutional grants
– 62 –

National Center for Education Statistics
Enrollment characteristics Percent
Average amount
received Percent
Average amount
received Percent
Average amount
received Percent
Average amount
received
Total 0.56 $90 0.81 $60 0.58 $260 0.53 $220
Control and level of first institution4-year 0.69 80 0.97 70 1.06 320 0.75 260
Public 0.79 70 1.39 90 1.03 190 1.21 160Private nonprofit 1.42 150 1.18 190 1.76 380 1.96 280For-profit 1.68 90 1.57 280 0.87 620 0.75 450
2-year 1.42 120 0.87 120 1.14 120 0.66 210Public 1.10 130 0.88 120 1.19 80 0.71 220Private nonprofit 8.84 210 12.79 600 13.65 1,610 5.50 1,140For-profit 5.14 30 0.88 400 1.46 320 1.01 †
Less-than-2-year 2.08 90 † † † † † †Public 9.32 270 † † † † † †Private nonprofit 15.11 600 † † † † † †For-profit 1.57 100 † † † † † †
Degree program, 2011–12No certificate or degree 10.44 1,320 3.92 † 5.45 540 † †Undergraduate certificate 4.19 80 1.33 400 0.89 350 0.91 630Associate’s degree 1.04 110 0.97 90 1.04 270 0.59 170Bachelor’s degree 1.13 80 1.00 70 0.93 340 0.89 270
Strongly agree know requirements needed to complete degree program, 2011–12
Yes 0.65 80 0.91 80 0.61 290 0.60 220No 0.80 100 1.01 90 0.98 310 0.91 330
Strongly agree that “I feel that I am a part of my first institution.”
Yes 1.00 90 0.96 90 0.77 350 0.73 320No 0.73 100 0.90 80 0.73 270 0.60 210
Strongly agree have ability to succeed as a student at first institution, 2011–12
Yes 0.94 90 0.99 80 0.69 290 0.65 230No 0.85 100 0.80 100 0.87 330 0.65 290
Used academic support services, 2011–12Yes 0.82 90 0.91 100 0.79 300 0.87 230No 0.79 100 0.92 90 0.72 340 0.54 290
Table S2.2-B.Standard errors for table 2.2-B: Percentage of 2011–12 first-time postsecondary students who received federal Pell, state, institutional, or merit-only grants and among those who received each type of aid, the average amounts received in 2011–12, by selected enrollment characteristics: 2012–14
Financial aid, 2011–12Federal Pell Grants State grants Institutional grants Merit-only grants
See notes at end of table.
– 63 –

National Center for Education Statistics
Enrollment characteristics Percent
Average amount
received Percent
Average amount
received Percent
Average amount
received Percent
Average amount
received
Self-reported remedial coursetaking, 2011–12Yes 1.13 90 1.33 150 0.98 300 0.59 370No 0.57 100 0.74 80 0.62 270 0.68 230
Number of minutes to commute to campus, 2011–12
Did not commute to campus 0.91 90 0.87 90 0.87 350 0.83 2601–15 1.39 130 1.13 110 1.00 320 0.85 24016–30 1.51 110 1.10 130 1.02 340 0.77 400More than 30 1.83 100 1.57 130 1.29 420 0.80 250
Hours worked per week while enrolled, 2011–12Did not hold a job 0.68 100 0.98 70 0.66 280 0.76 2901–15 1.68 110 1.35 180 3.13 550 2.07 44016–34 1.42 90 1.25 130 1.13 390 1.04 31035 or more 1.86 150 0.97 150 1.22 410 0.89 320
Location of job(s) while enrolled, 2011–12Did not hold a job 0.68 100 0.98 70 0.66 280 0.76 290Worked on campus 1.80 110 1.71 240 2.33 690 2.30 400Worked off campus only 1.14 100 0.81 120 0.79 240 0.68 190
Highest degree ever expected to complete, 2011–12
Undergraduate certificate 3.75 120 1.55 750 1.09 660 1.09 1,000Associate’s degree 2.88 160 1.20 150 1.40 390 0.97 260Bachelor’s degree 0.87 80 0.95 80 0.85 240 0.67 240Advanced degree 0.81 100 0.91 80 0.78 380 0.71 270
Attendance intensity through June 2014Always full time 0.60 70 0.87 80 0.72 320 0.66 250Mixed 1.08 130 0.91 120 1.07 300 0.73 290Always part time 2.03 150 0.93 230 1.18 170 0.59 300
Table S2.2-B.Standard errors for table 2.2-B: Percentage of 2011–12 first-time postsecondary students who received federal Pell, state, institutional, or merit-only grants and among those who received each type of aid, the average amounts received in 2011–12, by selected enrollment characteristics: 2012–14—Continued
Financial aid, 2011–12
See notes at end of table.
Federal Pell Grants State grants Institutional grants Merit-only grants
– 64 –

National Center for Education Statistics
Enrollment characteristics Percent
Average amount
received Percent
Average amount
received Percent
Average amount
received Percent
Average amount
received
Ever transferred through June 2014Yes 1.46 100 1.14 110 1.16 320 1.04 300 Attempted to transfer credits 2.55 100 1.50 140 1.48 430 1.46 390 Did not attempt to transfer credits 2.31 120 1.44 220 1.62 490 1.23 370No 0.60 90 0.85 70 0.64 280 0.57 230
Direction of first transfer by institution level through June 2014
Did not transfer 0.60 90 0.85 70 0.64 280 0.57 2304-year to 4-year 2.49 190 2.21 170 2.90 540 2.43 4304-year to 2-year 2.51 130 2.18 180 2.77 480 2.21 4602-year to 4-year 2.49 140 1.90 250 2.28 310 1.73 3202-year to 2-year 3.95 140 2.24 240 2.31 380 1.21 690Transfers to and from less-than-2-year institutions 4.97 170 2.71 630 3.50 1,730 1.98 †
Ever stopped out through June 2014Yes 1.22 110 1.09 150 1.19 440 0.91 350No 0.65 90 0.87 60 0.58 280 0.55 240
Number of degrees and certificates pursued through June 2014
One 0.62 100 0.75 80 0.60 280 0.55 250More than one 1.18 90 1.23 100 1.02 290 0.93 240
Number of changes in major at any institution through June 2014
Zero 0.77 90 0.72 80 0.62 310 0.48 250One 1.16 100 1.10 100 1.20 330 1.11 340More than one 2.00 140 2.12 180 1.68 370 1.51 360
Field of study when last enrolled through June 2014
Computer and information sciences 2.87 190 2.11 310 2.44 1,050 1.57 670Engineering and engineering technology 2.39 170 1.70 240 1.78 950 1.56 690Biology and physical science, science technology, math, agriculture 1.89 120 1.79 210 1.84 660 1.82 510General studies and other 2.63 240 2.15 180 2.18 640 1.74 730Social sciences 1.95 90 1.27 200 1.94 590 1.83 470Humanities 2.77 140 1.84 190 1.95 670 1.70 480Health care fields 2.60 110 1.32 160 1.22 460 1.01 430Business 1.34 110 1.23 130 1.22 440 1.02 390Education 2.64 110 1.67 190 2.34 560 1.92 510Other applied 1.33 130 1.47 140 1.17 360 0.86 290
See notes at end of table.
Federal Pell Grants State grants Institutional grants Merit-only grants
Table S2.2-B.Standard errors for table 2.2-B: Percentage of 2011–12 first-time postsecondary students who received federal Pell, state, institutional, or merit-only grants and among those who received each type of aid, the average amounts received in 2011–12, by selected enrollment characteristics: 2012–14—Continued
Financial aid, 2011–12
– 65 –

National Center for Education Statistics
Enrollment characteristics Percent
Average amount
received Percent
Average amount
received Percent
Average amount
received Percent
Average amount
received
Grade point average estimate when last enrolled through June 2014
Less than 2.25 1.93 100 1.31 120 1.35 560 0.91 7102.25–2.74 1.22 130 1.61 150 1.26 420 0.87 3402.75–3.24 1.12 110 1.23 130 1.30 400 1.12 3603.25–3.74 0.89 110 1.16 90 0.90 310 0.86 2403.75 or higher 1.63 90 1.14 150 1.22 440 1.24 290
Federal Pell Grants State grants Institutional grants Merit-only grants
Table S2.2-B.Standard errors for table 2.2-B: Percentage of 2011–12 first-time postsecondary students who received federal Pell, state, institutional, or merit-only grants and among those who received each type of aid, the average amounts received in 2011–12, by selected enrollment characteristics: 2012–14—Continued
SOURCE: U.S. Department of Education, National Center for Education Statistics, 2012/14 Beginning Postsecondary Students Longitudinal Study (BPS:12/14).
† Not applicable.
Financial aid, 2011–12
– 66 –

National Center for Education Statistics
Personal characteristics
Average tuition
and fees
Average total
price of attendance Percent
Average amount
received Percent
Average amount
received Percent
Average amount
received
Total $13,600 $26,900 89.2 $16,200 81.0 $10,300 56.4 $9,900
SexMale 13,600 26,900 87.1 16,000 78.1 10,200 53.1 10,000Female 13,600 26,900 90.7 16,400 83.1 10,400 58.9 9,900
Race/ethnicity3
White 14,200 27,600 86.9 16,100 77.1 10,000 56.7 10,200Black 11,300 24,700 97.6 16,800 92.1 9,800 70.9 9,400Hispanic 11,500 24,300 93.2 15,300 88.5 10,200 50.4 9,300Asian 17,800 31,900 83.3 17,900 75.9 14,000 40.8 9,500Other or Two or more races 13,800 27,300 88.3 18,000 79.3 11,600 56.9 10,600
Immigrant generation4
Immigrant 12,700 25,800 90.3 14,300 85.1 10,300 43.0 8,700Second-generation American 13,600 27,000 90.1 16,500 83.4 11,600 49.7 9,400Third-generation or higher American 13,500 26,800 89.4 16,300 80.4 9,900 60.1 10,100
Dependency status and family responsibilities, 2011–125
Dependent 14,300 27,700 88.0 16,900 79.1 11,000 55.5 10,200Independent 9,000 22,100 96.5 12,400 92.7 6,500 62.4 8,100 Unmarried, no dependent(s) 8,900 21,900 96.7 13,200 91.6 7,500 59.3 8,100 Unmarried, with dependent(s) 9,000 21,900 97.4 12,300 96.7 6,000 67.4 8,100 Married 9,400 22,800 94.8 11,500 88.0 5,500 58.9 8,200
Age as of December 31, 201118 years or younger 14,600 28,100 88.0 17,200 78.8 11,300 55.8 10,50019 years 13,600 26,900 88.1 16,400 80.6 10,600 55.4 9,70020–23 years 10,500 22,900 94.1 12,500 88.5 7,400 52.3 8,20024–29 years 8,900 21,700 99.0 12,000 93.6 5,200 69.9 8,40030 years or older 8,700 21,800 96.8 11,700 91.6 5,600 65.8 8,200
Veterans and military service members on active duty, in the reserves, or in the National Guard, 2011–12
Yes 12,400 25,600 98.2 14,300 78.7 5,300 27.3 8,700No 13,600 26,900 89.1 16,300 81.0 10,400 56.8 9,900
Has some type of disability, 2011–12Yes 12,100 25,500 88.8 15,600 80.9 9,400 59.2 9,300No 13,700 27,100 89.2 16,300 81.0 10,400 56.1 10,000
See notes at end of table.
Table 2.3-A.Among full-time/full-year 2011–12 first-time postsecondary students, average tuition and fees; average total price of attendance; percentage who received various types of financial aid; and, among those who received each type of aid, average amounts received in 2011–12, by selected personal characteristics: 2012–14
Full-time/full-year first-time postsecondary students, 2011–122
Total aid1 Total grants Student loansTuition, price of attendance, and financial aid, 2011–12
– 67 –

National Center for Education Statistics
Personal characteristics
Average tuition
and fees
Average total
price of attendance Percent
Average amount
received Percent
Average amount
received Percent
Average amount
received
Self-perception of change in physical health between 2012 and 2014
Declined 12,900 26,400 90.2 15,600 81.9 9,700 57.4 9,700Constant 14,100 27,400 88.6 16,600 80.7 10,700 55.5 10,100Improved 13,200 26,600 89.4 16,100 80.7 10,200 57.2 9,800
Self-perception of change in mental health between 2012 and 2014
Declined 13,000 26,400 90.4 16,100 83.3 9,600 59.0 10,200Constant 13,600 26,800 88.8 16,000 81.2 10,300 54.7 9,600Improved 14,000 27,500 88.9 16,700 79.0 10,800 57.1 10,100
First person in immediate family to go to college
Do not know 9,600 21,700 92.9 13,900 87.4 8,200 51.3 9,800Yes 10,100 22,700 95.4 14,400 90.2 8,900 58.6 8,900No 14,300 27,800 88.0 16,600 79.2 10,700 56.1 10,100
Highest education attained by either parent, 2011–12
Do not know 10,000 22,400 92.8 12,900 86.1 8,100 48.9 8,900High school diploma or less 10,300 22,900 95.0 14,500 89.9 8,900 58.5 9,000Some postsecondary education 11,100 24,000 92.5 15,800 85.7 9,400 61.7 9,700Bachelor’s degree or higher 17,100 31,200 83.8 17,800 73.0 12,000 52.9 10,700
Dependent students: parents’ income, 20106
Less than $30,000 10,800 23,200 97.4 16,000 97.2 11,000 54.9 8,200$30,000–59,999 13,100 26,100 93.2 17,600 90.2 11,600 59.0 9,300$60,000–89,999 13,600 27,000 87.5 17,000 73.6 10,200 62.3 11,000$90,000 or more 18,100 32,600 78.2 17,200 61.7 11,100 50.7 12,200
Dependency status and federal Pell Grant receipt, 2011–12
Dependent, received 11,900 24,500 100.0 17,200 100.0 11,300 61.2 8,700Independent, received 9,100 22,000 100.0 12,700 100.0 6,500 66.7 8,100Did not receive 16,100 30,100 78.2 16,500 61.7 10,600 50.3 11,600
Dependent students: parents provided financial help for housing, tuition, or other expenses, 2011–12
Yes 15,300 28,900 86.4 17,300 76.8 11,300 54.9 10,600No 10,000 22,500 95.2 15,300 89.6 10,100 58.1 8,700
Total aid1 Total grants Student loans
See notes at end of table.
Table 2.3-A.Among full-time/full-year 2011–12 first-time postsecondary students, average tuition and fees; average total price of attendance; percentage who received various types of financial aid; and, among those who received each type of aid, average amounts received in 2011–12, by selected personal characteristics: 2012–14—Continued
Tuition, price of attendance, and financial aid, 2011–12
Full-time/full-year first-time postsecondary students, 2011–122
– 68 –

National Center for Education Statistics
Personal characteristics
Average tuition
and fees
Average total
price of attendance Percent
Average amount
received Percent
Average amount
received Percent
Average amount
received
Students under age 24: strongly agree parents encourage me to stay in college, 2011–12
Yes 14,300 27,800 88.1 16,800 79.4 10,900 55.3 10,200No 11,800 24,600 90.6 15,500 84.1 9,700 56.6 9,300
Strongly agree friends from college encourage me to stay in college, 2011–12
Yes 14,900 28,600 89.2 17,300 80.9 11,100 58.0 10,200No 11,400 24,100 89.1 14,500 81.0 9,000 53.7 9,400
Strongly agree friends from home encourage me to stay in college, 2011–12
Yes 14,300 27,800 88.9 16,800 80.5 10,700 57.0 10,100No 12,100 25,200 89.8 15,100 81.9 9,500 55.2 9,500
Number of months between high school completion and postsecondary entry7
0–12 14,100 27,500 88.3 16,700 79.6 11,000 55.3 10,00013 or more 10,600 23,700 93.9 13,800 87.9 7,000 62.2 9,400
Recent high school graduate8
Yes 14,200 27,600 88.2 16,800 79.5 11,100 55.4 10,100No 10,900 24,000 93.1 13,800 87.4 7,400 61.0 9,200
Students under age 30: highest level of high school mathematics completed or planned9
Less than algebra 2 10,100 22,500 90.5 13,400 84.7 8,100 51.8 9,300Algebra 2 10,500 23,100 90.0 14,200 81.5 8,300 56.6 9,600Trigonometry 15,100 29,000 89.7 18,900 82.0 11,900 61.5 11,000Precalculus 12,600 25,800 89.3 15,800 80.1 10,100 56.6 9,800Calculus, math beyond calculus, or statistics 18,100 32,400 86.7 19,000 78.0 13,100 54.7 10,300
Students under age 30: high school grade point average
Less than 2.50 9,500 21,700 90.9 13,400 82.1 7,500 55.3 9,7002.50–2.99 11,700 24,700 87.9 14,900 77.6 9,200 58.1 9,5003.00–3.49 13,700 27,100 88.1 16,700 79.3 10,400 57.9 10,3003.50 or higher 17,700 31,800 89.0 18,800 82.6 13,200 52.8 10,000
Full-time/full-year first-time postsecondary students, 2011–122
See notes at end of table.
Total aid1 Total grants Student loans
Table 2.3-A.Among full-time/full-year 2011–12 first-time postsecondary students, average tuition and fees; average total price of attendance; percentage who received various types of financial aid; and, among those who received each type of aid, average amounts received in 2011–12, by selected personal characteristics: 2012–14—Continued
Tuition, price of attendance, and financial aid, 2011–12
– 69 –

National Center for Education Statistics
Personal characteristics
Average tuition
and fees
Average total
price of attendance Percent
Average amount
received Percent
Average amount
received Percent
Average amount
received
Students under age 30: took any college-level courses while in high school10
Yes 15,400 29,200 87.9 17,800 79.4 11,900 55.7 10,200No 10,700 23,200 90.7 13,900 82.6 8,000 56.6 9,600
Table 2.3-A.Among full-time/full-year 2011–12 first-time postsecondary students, average tuition and fees; average total price of attendance; percentage who received various types of financial aid; and, among those who received each type of aid, average amounts received in 2011–12, by selected personal characteristics: 2012–14—Continued
7 First-time students who did not complete a high school diploma, certificate, or equivalency are included in the total but excluded here.
Total aid1 Total grants Student loans
9 Math coursetaking data come from two sources: surveys first-time students completed when they took the ACT or SAT I in high school and BPS interviews first-time students completed in the base year or first follow-up. First-time students who reported this information on an entrance examination survey may not have completed all courses at the time they took the survey.
NOTE: Average aid amounts are calculated only for first-time postsecondary students receiving that type of aid. Those not receiving that type of aid (i.e., zero values) are not included in that column’s average. Estimates include individuals who were first-time postsecondary students in 2011–12 at Title IV eligible postsecondary institutions in the 50 states and the District of Columbia. SOURCE: U.S. Department of Education, National Center for Education Statistics, 2012/14 Beginning Postsecondary Students Longitudinal Study (BPS:12/14).
1 Total aid includes grants, loans, work-study, job training benefits, veterans benefits, and Direct PLUS Loans to parents of dependent undergraduates.2 Students who are enrolled as full-time students typically carry at least 12 semester or quarter hours per term at the undergraduate level or 9 credit hours per term at the graduate level; 24 semester hours or 36 quarter hours per academic year for an educational program using credit hours for a program of less than one academic year; or 24 clock hours per week for an educational program using clock hours. Students enrolled full year are enrolled 9 or more months.3 Black includes African American, Hispanic includes Latino, and Other or Two or more races includes American Indian or Alaska Native, Pacific Islander or Native Hawaiian, and first-time students having origins in more than one race. Race categories exclude Hispanic origin.4 First-time foreign students with visas are included in the total but excluded here. Immigrants include foreign-born first-time students who were U.S. citizens with one or both parent(s) born outside of the United States, resident aliens, or noncitizens eligible for citizenship. Second-generation Americans include U.S.-born first-time students with one or both parent(s) foreign born. Third-generation or higher Americans include U.S.- and foreign-born first-time students with both parents born in the United States. 5 First-time students classified as independent include those age 24 or over and those under 24 who are married, have dependents, are veterans or on active duty, are orphans or wards of the courts, are homeless or at risk of homelessness, or were determined to be independent by a financial aid officer using professional judgment. Other first-time students under age 24 are considered to be dependent. Within marital status, the unmarried category includes first-time students who are divorced, separated, or widowed. First-time students are considered to have a dependent if they have a child or any others for whom they are the caretaker or have financial responsibility. A spouse is not considered to be a dependent.
Tuition, price of attendance, and financial aid, 2011–12
Full-time/full-year first-time postsecondary students, 2011–122
10 Includes college courses for credit, Advanced Placement (AP), and International Baccalaureate (IB) courses.
6 Income in 2010 is used because it was reported on the federal financial aid application and used for federal need analysis for 2011–12.
8 Recent high school graduates only include first-time students who graduated from high school with a regular high school diploma in 2011 or 2012.
– 70 –

National Center for Education Statistics
Personal characteristics
Average tuition
and fees
Average total
price of attendance Percent
Average amount
received Percent
Average amount
received Percent
Average amount
received
Total 360 $420 0.40 $250 0.57 $300 0.59 $110
SexMale 390 460 0.71 250 1.08 310 0.94 180Female 400 450 0.45 340 0.57 350 0.78 160
Race/ethnicityWhite 400 460 0.55 280 0.69 320 0.80 160Black 360 490 0.50 420 1.06 370 2.03 270Hispanic 490 580 0.71 520 1.18 490 1.56 250Asian 860 970 2.21 710 2.31 670 2.33 530Other or Two or more races 680 780 1.73 810 2.49 740 2.90 640
Immigrant generationImmigrant 670 750 1.42 650 1.94 590 2.32 440Second-generation American 450 580 0.81 470 1.03 470 1.44 270Third-generation or higher American 370 410 0.46 250 0.60 300 0.65 130
Dependency status and family responsibilities, 2011–12
Dependent 390 470 0.45 290 0.57 300 0.58 130Independent 350 390 0.71 340 2.39 170 2.40 250 Unmarried, no dependent(s) 540 620 0.89 600 3.44 380 4.18 360 Unmarried, with dependent(s) 400 520 1.02 390 1.45 190 2.84 310 Married 840 930 1.75 580 4.03 230 4.17 310
Age as of December 31, 201118 years or younger 400 470 0.51 320 0.66 310 0.70 15019 years 430 530 0.85 360 1.01 400 1.21 20020–23 years 610 680 1.10 460 1.59 400 2.95 33024–29 years 580 680 0.90 520 4.60 150 3.17 28030 years or older 650 660 1.16 380 2.50 170 3.11 230
Veterans and military service members on active duty, in the reserves, or in the National Guard, 2011–12
Yes 1,650 1,730 1.18 1,110 8.18 370 4.77 750No 370 430 0.41 260 0.53 310 0.57 110
Has some type of disability, 2011–12Yes 500 640 1.17 600 1.50 470 1.89 340No 380 440 0.43 250 0.58 300 0.64 120
See notes at end of table.
Table S2.3-A.Standard errors for table 2.3-A: Among full-time/full-year 2011–12 first-time postsecondary students, average tuition and fees; average total price of attendance; percentage who received various types of financial aid; and, among those who received each type of aid, average amounts received in 2011–12, by selected personal characteristics: 2012–14
Tuition, price of attendance, and financial aid, 2011–12Total aid Total grants Student loans
Full-time/full-year first-time postsecondary students, 2011–12
– 71 –

National Center for Education Statistics
Personal characteristics
Average tuition
and fees
Average total
price of attendance Percent
Average amount
received Percent
Average amount
received Percent
Average amount
received
Self-perception of change in physical health between 2012 and 2014
Declined 450 530 0.83 410 1.08 400 1.25 230Constant 440 520 0.52 320 0.71 360 0.93 180Improved 360 410 0.67 310 0.91 330 1.02 190
Self-perception of change in mental health between 2012 and 2014
Declined 460 560 0.81 470 1.04 440 1.15 280Constant 380 430 0.54 270 0.74 290 0.84 150Improved 410 470 0.67 310 0.90 360 1.10 210
First person in immediate family to go to college
Do not know 810 990 2.69 1,010 4.43 670 4.88 760Yes 400 450 0.67 340 1.21 400 1.61 210No 370 430 0.45 260 0.57 290 0.65 130
Highest education attained by either parent, 2011–12
Do not know 680 780 1.90 630 2.92 450 3.64 510High school diploma or less 330 390 0.46 290 0.90 350 1.20 180Some postsecondary education 330 420 0.60 360 0.81 300 1.01 220Bachelor’s degree or higher 410 470 0.74 310 0.85 340 0.96 210
Dependent students: parents’ income, 2010Less than $30,000 310 380 0.44 270 0.45 270 1.15 220$30,000–59,999 600 700 0.75 640 0.84 500 1.57 250$60,000–89,999 610 720 1.05 560 1.45 440 1.49 300$90,000 or more 430 500 0.85 320 1.12 410 1.24 260
Dependency status and federal Pell Grant receipt, 2011–12
Dependent, received 460 550 † 410 † 360 0.82 150Independent, received 450 520 † 340 † 160 2.32 290Did not receive 400 460 0.77 270 0.89 320 0.89 200
Dependent students: parents provided financial help for housing, tuition, or other expenses, 2011–12
Yes 410 480 0.53 300 0.67 310 0.67 150No 400 500 0.64 450 0.83 390 1.26 240
Full-time/full-year first-time postsecondary students, 2011–12
Total aid Total grants Student loans
See notes at end of table.
Tuition, price of attendance, and financial aid, 2011–12
Table S2.3-A.Standard errors for table 2.3-A: Among full-time/full-year 2011–12 first-time postsecondary students, average tuition and fees; average total price of attendance; percentage who received various types of financial aid; and, among those who received each type of aid, average amounts received in 2011–12, by selected personal characteristics: 2012–14—Continued
– 72 –

National Center for Education Statistics
Personal characteristics
Average tuition
and fees
Average total
price of attendance Percent
Average amount
received Percent
Average amount
received Percent
Average amount
received
Students under age 24: strongly agree parents encourage me to stay in college, 2011–12
Yes 380 460 0.46 290 0.57 310 0.61 130No 430 500 1.19 500 1.46 370 2.38 330
Strongly agree friends from college encourage me to stay in college, 2011–12
Yes 380 430 0.49 280 0.64 320 0.76 150No 380 470 0.55 290 0.90 320 0.92 160
Strongly agree friends from home encourage me to stay in college, 2011–12
Yes 380 440 0.47 290 0.65 340 0.72 150No 390 450 0.60 270 0.85 290 0.96 180
Number of months between high school completion and postsecondary entry
0–12 390 460 0.46 300 0.57 310 0.60 13013 or more 440 470 0.89 380 2.32 360 1.73 250
Recent high school graduateYes 390 470 0.47 310 0.59 310 0.62 140No 430 470 0.83 350 2.11 350 1.55 240
Students under age 30: highest level of high school mathematics completed or planned
Less than algebra 2 510 620 0.93 460 1.90 430 1.79 270Algebra 2 290 380 0.71 350 0.99 250 1.23 250Trigonometry 610 710 1.23 750 1.69 770 2.20 360Precalculus 500 560 0.76 400 0.92 390 1.20 230Calculus, math beyond calculus, or statistics 410 470 0.91 320 1.09 350 1.24 210
Students under age 30: high school grade point average
Less than 2.50 300 370 0.81 310 1.11 240 1.40 2602.50–2.99 490 580 1.05 390 1.88 370 1.64 2903.00–3.49 410 470 0.69 340 0.82 300 0.94 2003.50 or higher 410 480 0.78 400 0.88 440 1.12 290
Total aid Total grants Student loans
Full-time/full-year first-time postsecondary students, 2011–12
Table S2.3-A.Standard errors for table 2.3-A: Among full-time/full-year 2011–12 first-time postsecondary students, average tuition and fees; average total price of attendance; percentage who received various types of financial aid; and, among those who received each type of aid, average amounts received in 2011–12, by selected personal characteristics: 2012–14—Continued
Tuition, price of attendance, and financial aid, 2011–12
See notes at end of table.
– 73 –

National Center for Education Statistics
Personal characteristics
Average tuition
and fees
Average total
price of attendance Percent
Average amount
received Percent
Average amount
received Percent
Average amount
received
Students under age 30: took any college-level courses while in high school
Yes 380 440 0.55 290 0.68 300 0.73 170No 310 380 0.65 240 1.07 240 1.30 210
Total grants Student loans
Full-time/full-year first-time postsecondary students, 2011–12
Total aid
SOURCE: U.S. Department of Education, National Center for Education Statistics, 2012/14 Beginning Postsecondary Students Longitudinal Study (BPS:12/14).
† Not applicable.
Table S2.3-A.Standard errors for table 2.3-A: Among full-time/full-year 2011–12 first-time postsecondary students, average tuition and fees; average total price of attendance; percentage who received various types of financial aid; and, among those who received each type of aid, average amounts received in 2011–12, by selected personal characteristics: 2012–14—Continued
Tuition, price of attendance, and financial aid, 2011–12
– 74 –

National Center for Education Statistics
Enrollment characteristics
Average tuition
and fees
Average total
price of attendance Percent
Average amount
received Percent
Average amount
received Percent
Average amount
received
Total $13,600 $26,900 89.2 $16,200 81.0 $10,300 56.4 $9,900
Control and level of first institution4-year 17,300 31,600 89.8 19,500 80.3 12,600 63.7 10,700
Public 9,500 23,200 88.3 13,900 75.8 8,100 60.3 9,500Private nonprofit 30,600 46,000 91.1 29,300 86.9 20,400 65.7 12,300For-profit 16,200 30,800 98.6 18,000 89.4 6,800 92.3 11,800
2-year 4,900 16,200 86.9 8,500 80.9 5,500 36.1 7,100Public 2,800 13,800 84.9 6,800 78.5 5,200 27.9 5,100Private nonprofit 16,800 30,700 97.7 21,000 93.2 9,900 87.2 11,200For-profit 17,100 30,000 99.0 16,600 95.3 6,100 84.8 10,900
Less-than-2-year 15,500 27,600 96.1 13,500 94.4 5,800 81.1 8,600Public 6,600 19,300 77.4 8,700 73.8 5,700 33.7 ! ‡Private nonprofit ‡ ‡ ‡ ‡ ‡ ‡ ‡ ‡For-profit 16,900 28,900 98.9 14,100 97.5 5,900 88.4 8,800
Degree program, 2011–12No certificate or degree 6,200 ! 19,700 68.7 ! 14,800 ! 68.6 ! 7,300 ! ‡ ‡Undergraduate certificate 14,700 27,000 96.3 13,700 93.4 5,700 76.5 9,200Associate’s degree 4,500 15,800 87.3 8,400 81.2 5,500 35.9 7,100Bachelor’s degree 17,800 32,200 89.6 20,000 79.7 13,100 63.7 10,700
Strongly agree know requirements needed to complete degree program, 2011–123
Yes 14,400 28,000 90.1 16,900 81.9 10,800 58.0 10,100No 12,500 25,700 87.8 15,400 79.2 10,000 53.1 9,700
Strongly agree that “I feel that I am a part of my first institution.”
Yes 15,100 28,800 89.9 17,400 81.7 11,000 59.6 10,200No 12,200 25,100 88.5 15,100 80.3 9,700 53.4 9,600
Strongly agree have ability to succeed as a student at first institution, 2011–12
Yes 13,600 26,800 89.5 16,100 81.3 10,200 56.2 9,900No 13,600 27,100 88.5 16,500 80.4 10,500 56.8 9,900
Used academic support services, 2011–12Yes 15,400 29,100 90.4 18,200 82.5 11,900 58.8 10,300No 12,400 25,500 88.4 15,000 79.9 9,300 54.9 9,700
Full-time/full-year first-time postsecondary students, 2011–122
Total aid1 Total grants
Table 2.3-B.Among full-time/full-year 2011–12 first-time postsecondary students, average tuition and fees; average total price of attendance; percentage who received various types of financial aid; and among those who received each type of aid, average amounts received in 2011–12, by selected enrollment characteristics: 2012–14
Tuition, price of attendance, and financial aid, 2011–12Student loans
See notes at end of table.
– 75 –

National Center for Education Statistics
Enrollment characteristics
Average tuition
and fees
Average total
price of attendance Percent
Average amount
received Percent
Average amount
received Percent
Average amount
received
Self-reported remedial coursetaking, 2011–12Yes 7,600 19,800 90.2 12,100 82.6 7,800 49.9 8,300No 15,100 28,700 88.9 17,300 80.6 11,000 58.0 10,300
Number of minutes to commute to campus, 2011–12
Did not commute to campus 18,400 33,000 89.5 20,900 79.8 13,300 66.1 11,2001–15 7,700 19,800 87.3 10,800 80.1 6,900 45.3 7,70016–30 8,100 19,900 88.1 11,000 81.6 7,100 44.6 7,800More than 30 9,600 21,700 91.7 12,600 85.9 7,900 50.0 8,400
Hours worked per week while enrolled, 2011–12
Did not hold a job 14,200 27,700 88.5 16,500 80.5 10,400 56.6 10,1001–15 18,000 32,100 90.4 20,900 82.3 14,200 59.7 10,60016–34 10,400 22,900 89.5 14,200 81.1 9,100 54.0 9,00035 or more 8,700 21,000 92.4 11,700 82.4 6,600 55.1 8,900
Location of job(s) while enrolled, 2011–12Did not hold a job 14,200 27,700 88.5 16,500 80.5 10,400 56.6 10,100Worked on campus 21,300 36,000 94.3 24,300 87.6 16,700 68.4 10,600Worked off campus only 9,500 21,900 89.1 12,800 79.8 7,800 51.9 9,100
Highest degree ever expected to complete, 2011–124
Undergraduate certificate 15,000 27,600 96.4 13,500 93.6 5,500 75.1 9,400Associate’s degree 7,500 19,400 93.3 10,500 88.4 5,600 53.6 8,100Bachelor’s degree 11,200 24,200 88.3 14,700 78.8 8,700 55.5 10,100Advanced degree 15,700 29,600 88.7 18,100 80.6 12,200 56.2 10,100
Attendance intensity through June 20145
Always full time 14,200 27,700 90.1 16,700 82.2 10,600 58.4 9,900Mixed 10,600 23,400 85.2 14,100 75.9 9,100 48.4 9,800Always part time † † † † † † † †
Total aid1 Total grants Student loans
Table 2.3-B.Among full-time/full-year 2011–12 first-time postsecondary students, average tuition and fees; average total price of attendance; percentage who received various types of financial aid; and among those who received each type of aid, average amounts received in 2011–12, by selected enrollment characteristics: 2012–14—Continued
Tuition, price of attendance, and financial aid, 2011–12
Full-time/full-year first-time postsecondary students, 2011–122
See notes at end of table.
– 76 –

National Center for Education Statistics
Enrollment characteristics
Average tuition
and fees
Average total
price of attendance Percent
Average amount
received Percent
Average amount
received Percent
Average amount
received
Ever transferred through June 20146
Yes 10,900 24,000 87.7 14,800 79.6 9,000 54.0 9,900 Attempted to transfer credits 10,500 23,300 87.3 14,700 80.2 9,000 51.2 10,000 Did not attempt to transfer credits 11,900 25,600 88.4 15,200 78.3 9,000 60.9 9,800No 14,100 27,500 89.5 16,600 81.3 10,600 57.0 9,900
Direction of first transfer by institution level through June 20146
Did not transfer 14,100 27,500 89.5 16,600 81.3 10,600 57.0 9,9004-year to 4-year 15,900 30,200 90.3 18,600 83.1 11,200 62.5 11,0004-year to 2-year 14,600 28,800 91.2 19,100 78.1 10,900 74.9 11,2002-year to 4-year 4,000 15,200 79.6 7,800 72.8 5,400 29.2 6,3002-year to 2-year 4,800 16,300 88.5 8,600 83.5 6,100 37.6 6,500Transfers to and from less-than-2-year institutions 12,700 25,300 93.4 14,600 91.3 7,500 69.9 7,700
Ever stopped out through June 20147
Yes 10,600 23,500 87.8 13,700 79.2 8,500 52.8 9,000No 14,000 27,400 89.3 16,600 81.2 10,500 56.9 10,000
Number of degrees and certificates pursued through June 20148
One 14,600 28,200 89.5 17,000 81.0 10,800 58.3 10,000More than one 10,500 23,200 88.5 14,200 81.1 8,800 51.2 9,600
Number of changes in major at any institution through June 20149
Zero 14,400 27,800 89.0 16,800 81.5 10,500 57.2 10,200One 12,600 25,900 90.3 15,600 80.5 10,200 55.7 9,700More than one 11,200 24,200 88.8 14,500 80.1 9,500 54.4 8,900
Full-time/full-year first-time postsecondary students, 2011–122
See notes at end of table.
Table 2.3-B.Among full-time/full-year 2011–12 first-time postsecondary students, average tuition and fees; average total price of attendance; percentage who received various types of financial aid; and among those who received each type of aid, average amounts received in 2011–12, by selected enrollment characteristics: 2012–14—Continued
Tuition, price of attendance, and financial aid, 2011–12Total aid1 Total grants Student loans
– 77 –

National Center for Education Statistics
Enrollment characteristics
Average tuition
and fees
Average total
price of attendance Percent
Average amount
received Percent
Average amount
received Percent
Average amount
received
Field of study when last enrolled through June 201410
Computer and information sciences 13,200 26,500 88.4 15,400 81.0 10,100 52.9 9,200Engineering and engineering technology 15,600 29,600 82.7 17,300 74.2 11,400 49.4 10,600Biology and physical science, science technology, math, agriculture 16,000 29,900 88.1 18,200 79.7 12,900 53.1 9,500General studies and other 7,500 19,300 85.5 12,000 78.5 7,800 47.0 7,700Social sciences 17,500 31,600 87.2 19,200 79.3 13,000 55.2 10,200Humanities 18,300 32,400 86.6 19,300 78.0 13,100 55.5 10,800Health care fields 10,900 23,600 93.2 14,300 86.8 8,400 61.2 9,100Business 13,700 27,300 88.2 16,600 79.6 10,200 55.8 10,800Education 11,500 24,400 92.8 15,400 85.5 9,700 59.2 9,500Other applied 12,800 26,000 92.4 15,700 82.6 8,900 63.0 10,300
Grade point average estimate when last enrolled through June 2014
Less than 2.25 8,600 21,000 90.0 13,400 82.2 8,200 54.2 9,1002.25–2.74 10,300 23,200 89.3 15,000 80.3 9,000 57.9 9,7002.75–3.24 13,800 27,300 88.0 16,800 78.1 10,500 59.4 10,2003.25–3.74 15,500 29,100 89.1 17,100 81.2 11,000 56.5 10,2003.75 or higher 15,900 29,600 90.0 16,900 84.0 11,300 53.0 9,700
Table 2.3-B.Among full-time/full-year 2011–12 first-time postsecondary students, average tuition and fees; average total price of attendance; percentage who received various types of financial aid; and among those who received each type of aid, average amounts received in 2011–12, by selected enrollment characteristics: 2012–14—Continued
Tuition, price of attendance, and financial aid, 2011–12
Full-time/full-year first-time postsecondary students, 2011–122
Total aid1 Total grants Student loans
See notes at end of table.
– 78 –
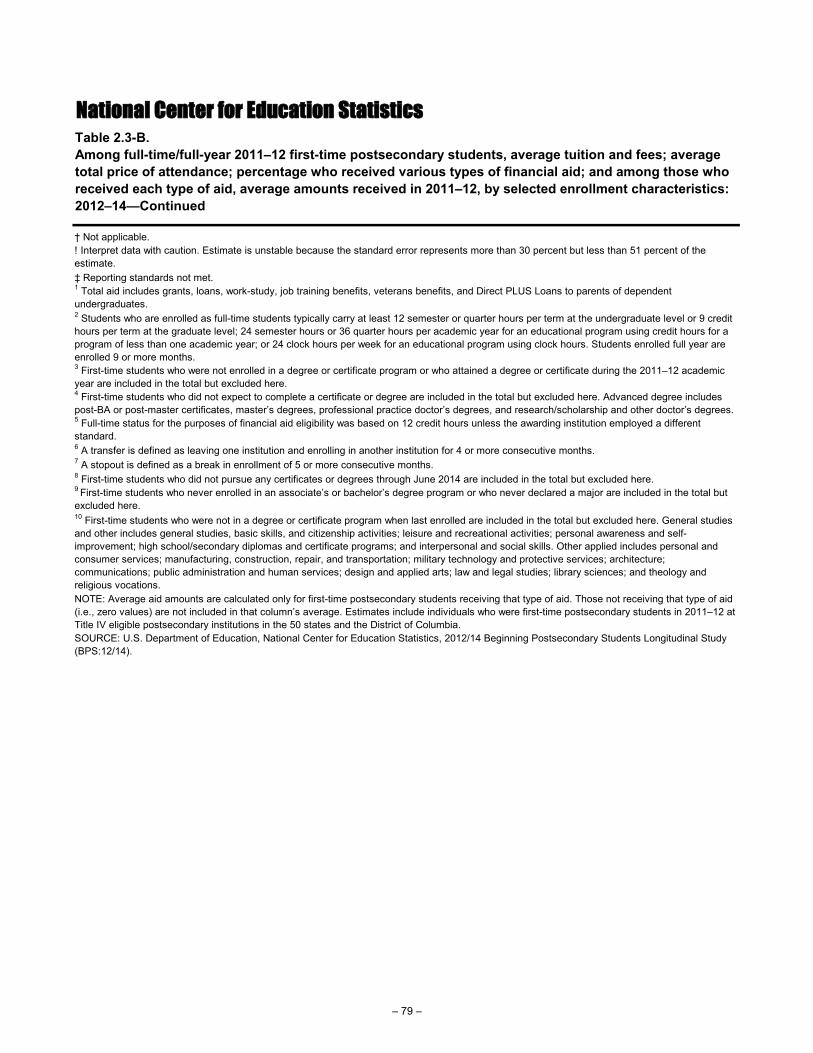
National Center for Education Statistics
2 Students who are enrolled as full-time students typically carry at least 12 semester or quarter hours per term at the undergraduate level or 9 credit hours per term at the graduate level; 24 semester hours or 36 quarter hours per academic year for an educational program using credit hours for a program of less than one academic year; or 24 clock hours per week for an educational program using clock hours. Students enrolled full year are enrolled 9 or more months.
4 First-time students who did not expect to complete a certificate or degree are included in the total but excluded here. Advanced degree includes post-BA or post-master certificates, master’s degrees, professional practice doctor’s degrees, and research/scholarship and other doctor’s degrees.
8 First-time students who did not pursue any certificates or degrees through June 2014 are included in the total but excluded here.9 First-time students who never enrolled in an associate’s or bachelor’s degree program or who never declared a major are included in the total but excluded here.
SOURCE: U.S. Department of Education, National Center for Education Statistics, 2012/14 Beginning Postsecondary Students Longitudinal Study (BPS:12/14).
Table 2.3-B.Among full-time/full-year 2011–12 first-time postsecondary students, average tuition and fees; average total price of attendance; percentage who received various types of financial aid; and among those who received each type of aid, average amounts received in 2011–12, by selected enrollment characteristics: 2012–14—Continued
NOTE: Average aid amounts are calculated only for first-time postsecondary students receiving that type of aid. Those not receiving that type of aid (i.e., zero values) are not included in that column’s average. Estimates include individuals who were first-time postsecondary students in 2011–12 at Title IV eligible postsecondary institutions in the 50 states and the District of Columbia.
6 A transfer is defined as leaving one institution and enrolling in another institution for 4 or more consecutive months.
† Not applicable.
‡ Reporting standards not met.
! Interpret data with caution. Estimate is unstable because the standard error represents more than 30 percent but less than 51 percent of the estimate.
5 Full-time status for the purposes of financial aid eligibility was based on 12 credit hours unless the awarding institution employed a different standard.
10 First-time students who were not in a degree or certificate program when last enrolled are included in the total but excluded here. General studies and other includes general studies, basic skills, and citizenship activities; leisure and recreational activities; personal awareness and self-improvement; high school/secondary diplomas and certificate programs; and interpersonal and social skills. Other applied includes personal and consumer services; manufacturing, construction, repair, and transportation; military technology and protective services; architecture; communications; public administration and human services; design and applied arts; law and legal studies; library sciences; and theology and religious vocations.
3 First-time students who were not enrolled in a degree or certificate program or who attained a degree or certificate during the 2011–12 academic year are included in the total but excluded here.
7 A stopout is defined as a break in enrollment of 5 or more consecutive months.
1 Total aid includes grants, loans, work-study, job training benefits, veterans benefits, and Direct PLUS Loans to parents of dependent undergraduates.
– 79 –

National Center for Education Statistics
Enrollment characteristics
Average tuition
and fees
Average total
price of attendance Percent
Average amount
received Percent
Average amount
received Percent
Average amount
received
Total $360 $420 0.40 $250 0.57 $300 0.59 $110
Control and level of first institution4-year 280 320 0.50 260 0.63 320 1.33 130
Public 210 290 0.73 210 0.85 200 1.48 180Private nonprofit 420 490 0.89 420 1.03 360 1.33 290For-profit 670 1,110 1.29 650 4.95 310 6.19 470
2-year 190 270 0.75 220 1.33 100 0.72 200Public 100 170 0.87 90 0.95 80 0.70 200Private nonprofit 2,180 2,990 13.60 3,140 14.24 1,820 21.93 2,360For-profit 1,150 1,430 0.84 730 4.98 250 3.54 550
Less-than-2-year 1,180 1,210 1.18 480 1.64 210 4.66 570Public 610 1,740 5.77 1,010 7.14 780 14.78 †Private nonprofit † † † † † † † †For-profit 1,260 1,260 0.81 480 1.39 220 4.38 530
Degree program, 2011–12No certificate or degree 2,130 2,460 22.90 6,820 22.91 3,240 † †Undergraduate certificate 830 940 0.78 410 2.30 140 3.32 400Associate’s degree 160 220 0.75 260 0.99 110 1.10 250Bachelor’s degree 270 310 0.51 250 0.68 280 1.08 140
Strongly agree know requirements needed to complete degree program, 2011–12
Yes 390 440 0.49 280 0.65 330 0.78 160No 420 490 0.66 360 0.80 350 0.87 160
Strongly agree that “I feel that I am a part of my first institution.”
Yes 400 470 0.57 320 0.80 380 0.97 160No 370 420 0.53 260 0.70 270 0.68 160
Strongly agree have ability to succeed as a student at first institution, 2011–12
Yes 390 450 0.45 260 0.69 340 0.81 140No 400 450 0.61 320 0.76 310 0.84 170
Used academic support services, 2011–12Yes 420 470 0.64 370 0.86 390 1.05 200No 340 410 0.46 240 0.65 280 0.68 140
Table S2.3-B.Standard errors for table 2.3-B: Among full-time/full-year 2011–12 first-time postsecondary students, average tuition and fees; average total price of attendance; percentage who received various types of financial aid; and among those who received each type of aid, average amounts received in 2011–12, by selected enrollment characteristics: 2012–14
Tuition, price of attendance, and financial aid, 2011–12Total aid Total grants Student loans
Full-time/full-year first-time postsecondary students, 2011–12
See notes at end of table.
– 80 –

National Center for Education Statistics
Enrollment characteristics
Average tuition
and fees
Average total
price of attendance Percent
Average amount
received Percent
Average amount
received Percent
Average amount
received
Self-reported remedial coursetaking, 2011–12Yes 290 350 0.93 310 1.11 250 1.29 260No 340 390 0.44 240 0.66 310 0.79 130
Number of minutes to commute to campus, 2011–12
Did not commute to campus 330 360 0.56 260 0.69 370 1.27 1601–15 300 380 0.89 240 1.16 180 1.36 21016–30 420 460 0.94 280 1.11 250 1.38 260More than 30 370 460 0.84 330 1.39 290 1.82 260
Hours worked per week while enrolled, 2011–12
Did not hold a job 330 380 0.58 220 0.76 290 0.95 1601–15 650 710 1.18 600 1.38 570 1.69 33016–34 470 560 0.86 390 1.03 330 1.65 21035 or more 500 550 1.09 530 2.06 360 1.96 370
Location of job(s) while enrolled, 2011–12Did not hold a job 330 380 0.58 220 0.76 290 0.95 160Worked on campus 660 680 1.00 600 1.26 580 2.04 330Worked off campus only 370 440 0.74 350 0.94 260 1.22 210
Highest degree ever expected to complete, 2011–12
Undergraduate certificate 1,070 1,280 1.24 530 1.85 170 4.99 570Associate’s degree 460 510 1.32 370 2.08 170 1.96 340Bachelor’s degree 350 420 0.58 300 0.86 290 0.86 170Advanced degree 390 440 0.57 290 0.69 350 1.01 140
Attendance intensity through June 2014Always full time 370 430 0.46 280 0.65 320 0.74 120Mixed 450 500 0.87 330 1.08 330 1.21 310Always part time † † † † † † † †
Total aid Total grants Student loans
Table S2.3-B.Standard errors for table 2.3-B: Among full-time/full-year 2011–12 first-time postsecondary students, average tuition and fees; average total price of attendance; percentage who received various types of financial aid; and among those who received each type of aid, average amounts received in 2011–12, by selected enrollment characteristics: 2012–14—Continued
Tuition, price of attendance, and financial aid, 2011–12
Full-time/full-year first-time postsecondary students, 2011–12
See notes at end of table.
– 81 –

National Center for Education Statistics
Enrollment characteristics
Average tuition
and fees
Average total
price of attendance Percent
Average amount
received Percent
Average amount
received Percent
Average amount
received
Ever transferred through June 2014Yes 400 470 0.88 430 1.09 360 1.48 280 Attempted to transfer credits 490 580 1.12 530 1.31 430 1.95 390 Did not attempt to transfer credits 570 680 1.41 590 1.95 470 2.12 420No 380 430 0.44 240 0.65 300 0.65 120
Direction of first transfer by institution level through June 2014
Did not transfer 380 430 0.44 240 0.65 300 0.65 1204-year to 4-year 610 700 1.49 720 1.70 630 3.07 4804-year to 2-year 570 670 1.49 710 2.54 570 2.36 5202-year to 4-year 290 460 2.04 520 2.28 300 2.62 5602-year to 2-year 450 640 2.52 590 2.75 420 3.63 480Transfers to and from less-than-2-year institutions 1,050 1,180 3.52 1,300 3.66 750 6.85 670
Ever stopped out through June 2014Yes 460 550 1.05 470 1.37 370 1.72 350No 370 430 0.43 260 0.62 320 0.66 120
Number of degrees and certificates pursued through June 2014
One 380 430 0.47 270 0.68 340 0.72 130More than one 350 420 0.72 330 0.90 280 1.07 210
Number of changes in major at any institution through June 2014
Zero 410 450 0.51 300 0.65 370 0.73 140One 410 500 0.70 330 0.99 310 1.02 240More than one 520 650 1.15 470 1.40 390 1.84 340
Tuition, price of attendance, and financial aid, 2011–12Total aid Total grants Student loans
See notes at end of table.
Full-time/full-year first-time postsecondary students, 2011–12
Table S2.3-B.Standard errors for table 2.3-B: Among full-time/full-year 2011–12 first-time postsecondary students, average tuition and fees; average total price of attendance; percentage who received various types of financial aid; and among those who received each type of aid, average amounts received in 2011–12, by selected enrollment characteristics: 2012–14—Continued
– 82 –

National Center for Education Statistics
Enrollment characteristics
Average tuition
and fees
Average total
price of attendance Percent
Average amount
received Percent
Average amount
received Percent
Average amount
received
Field of study when last enrolled through June 2014
Computer and information sciences 880 1,000 2.50 770 2.65 770 3.41 430Engineering and engineering technology 730 870 1.80 740 2.12 690 2.14 530Biology and physical science, science technology, math, agriculture 570 630 1.20 530 1.50 490 1.82 350General studies and other 550 670 2.26 630 2.67 450 2.80 530Social sciences 710 800 1.28 630 1.45 560 1.87 370Humanities 710 830 1.49 750 1.72 670 2.16 390Health care fields 350 400 0.82 340 1.11 340 1.58 240Business 450 520 1.04 480 1.33 440 1.42 330Education 660 750 1.31 680 1.79 540 2.48 420Other applied 460 530 0.69 390 1.36 420 1.40 290
Grade point average estimate when last enrolled through June 2014
Less than 2.25 380 460 1.33 460 1.57 360 2.01 3402.25–2.74 320 400 0.88 370 1.29 340 1.67 2902.75–3.24 440 530 0.92 310 1.18 280 1.26 2703.25–3.74 480 530 0.68 380 0.83 420 0.97 1903.75 or higher 520 590 0.85 450 1.00 530 1.57 300
Total aid Total grants Student loans
SOURCE: U.S. Department of Education, National Center for Education Statistics, 2012/14 Beginning Postsecondary Students Longitudinal Study (BPS:12/14).
† Not applicable.
Table S2.3-B.Standard errors for table 2.3-B: Among full-time/full-year 2011–12 first-time postsecondary students, average tuition and fees; average total price of attendance; percentage who received various types of financial aid; and among those who received each type of aid, average amounts received in 2011–12, by selected enrollment characteristics: 2012–14—Continued
Tuition, price of attendance, and financial aid, 2011–12
Full-time/full-year first-time postsecondary students, 2011–12
– 83 –

National Center for Education Statistics
Personal characteristics Percent
Average amount
received Percent
Average amount
received Percent
Average amount
received Percent
Average amount
received
Total 50.3 $4,600 27.6 $3,300 38.4 $9,500 27.4 $7,300
SexMale 46.6 4,500 25.9 3,200 38.0 9,300 26.0 7,300Female 53.1 4,600 28.8 3,400 38.7 9,700 28.5 7,300
Race/ethnicity2
White 38.1 4,300 25.1 3,100 39.9 9,500 31.6 7,600Black 78.6 4,800 32.1 3,200 31.8 9,300 23.5 6,600Hispanic 71.9 4,700 30.7 3,800 38.3 8,200 19.3 5,900Asian 48.5 4,900 32.6 4,500 39.1 12,200 20.4 7,400Other or Two or more races 50.2 4,800 27.6 2,900 37.6 11,300 24.6 8,300
Immigrant generation3
Immigrant 65.5 4,800 35.7 3,800 33.7 9,200 21.0 6,500Second-generation American 63.8 4,700 33.1 3,900 41.1 9,600 22.5 6,800Third-generation or higher American 46.2 4,500 25.8 3,100 38.2 9,400 29.4 7,400
Dependency status and family responsibilities, 2011–124
Dependent 44.3 4,500 29.4 3,400 42.6 9,700 30.5 7,400Independent 89.0 4,800 16.1 2,700 11.9 5,100 7.6 4,600 Unmarried, no dependent(s) 84.4 4,800 21.1 3,200 18.2 6,800 12.4 5,600 Unmarried, with dependent(s) 95.3 4,900 14.9 2,400 9.7 3,000 5.6 3,000 Married 86.3 4,800 9.6 1,200 ! 4.9 1,600 ! 2.8 ! ‡
Age as of December 31, 201118 years or younger 44.2 4,500 29.7 3,500 44.2 9,700 30.7 7,50019 years 46.4 4,500 29.9 3,400 40.4 9,400 30.9 7,10020–23 years 77.8 4,700 17.4 2,600 14.3 8,400 8.8 7,30024–29 years 89.7 4,800 10.0 1,800 5.5 2,100 ! 3.1 ! 3,00030 years or older 89.3 4,700 12.1 1,700 7.9 2,400 ! 5.9 2,700 !
Veterans and military service members on active duty, in the reserves, or in the National Guard, 2011–12
Yes 70.0 4,700 16.1 ! ‡ 7.8 ! ‡ 6.8 ! ‡No 50.1 4,600 27.7 3,400 38.8 9,500 27.7 7,300
Has some type of disability, 2011–12Yes 58.0 4,600 24.7 3,100 33.2 8,500 22.3 7,500No 49.5 4,600 27.9 3,400 39.0 9,600 27.9 7,300
Table 2.4-A.Among full-time/full-year 2011–12 first-time postsecondary students, the percentage who received Pell, state, institutional, or merit-only grants and among those who received each type of aid, the average amount received in 2011–12, by selected personal characteristics: 2012–14
Full-time/full-year first-time postsecondary students, 2011–121
Financial aid, 2011–12Federal Pell Grants State grants Institutional grants Merit-only grants
See notes at end of table.
– 84 –

National Center for Education Statistics
Personal characteristics Percent
Average amount
received Percent
Average amount
received Percent
Average amount
received Percent
Average amount
received
Self-perception of change in physical health between 2012 and 2014
Declined 53.3 4,500 26.4 3,400 35.2 9,100 24.4 7,300Constant 48.0 4,600 27.3 3,400 39.8 9,900 28.9 7,500Improved 52.0 4,600 28.8 3,200 38.4 9,100 27.1 6,900
Self-perception of change in mental health between 2012 and 2014
Declined 54.4 4,500 27.4 3,200 36.2 9,200 25.3 7,200Constant 48.6 4,600 28.1 3,400 38.9 9,300 28.8 7,300Improved 50.1 4,500 27.0 3,500 39.2 10,000 26.9 7,400
First person in immediate family to go to college
Do not know 77.9 4,900 26.1 4,300 23.9 6,300 13.8 4,800Yes 79.1 4,800 30.8 3,200 30.7 7,000 19.2 5,400No 44.7 4,500 27.0 3,400 40.1 9,900 29.1 7,600
Highest education attained by either parent, 2011–12
Do not know 76.6 4,900 24.4 4,100 21.8 6,500 12.3 4,800High school diploma or less 79.0 4,700 32.0 3,300 29.9 7,000 18.4 5,600Some postsecondary education 59.3 4,500 32.5 3,200 37.5 8,100 26.2 6,700Bachelor’s degree or higher 27.7 4,200 22.6 3,400 44.8 11,200 34.1 8,200
Dependent students: parents’ income, 20105
Less than $30,000 95.0 5,200 41.9 3,600 37.6 7,700 21.3 6,000$30,000–59,999 76.6 3,700 41.8 3,600 45.6 9,700 31.9 7,100$60,000–89,999 16.4 1,900 28.2 3,100 46.7 9,800 34.6 7,200$90,000 or more 0.7 3,700 13.4 3,000 42.8 11,000 34.8 8,300
Dependency status and federal Pell Grant receipt, 2011–12
Dependent, received 100.0 4,500 44.7 3,600 42.6 8,700 26.2 6,600Independent, received 100.0 4,800 16.3 2,600 11.9 4,700 7.1 4,200Did not receive † † 17.2 2,900 41.7 10,500 33.3 7,900
Dependent students: parents provided financial help for housing, tuition, or other expenses, 2011–12
Yes 38.1 4,400 27.4 3,400 43.6 10,100 31.6 7,600No 72.3 4,700 38.2 3,300 38.0 7,900 25.5 6,600
Full-time/full-year first-time postsecondary students, 2011–121
See notes at end of table.
Table 2.4-A.Among full-time/full-year 2011–12 first-time postsecondary students, the percentage who received Pell, state, institutional, or merit-only grants and among those who received each type of aid, the average amount received in 2011–12, by selected personal characteristics: 2012–14—Continued
Financial aid, 2011–12Federal Pell Grants State grants Institutional grants Merit-only grants
– 85 –

National Center for Education Statistics
Personal characteristics Percent
Average amount
received Percent
Average amount
received Percent
Average amount
received Percent
Average amount
received
Students under age 24: strongly agree parents encourage me to stay in college, 2011–12
Yes 44.9 4,500 28.8 3,400 41.9 9,800 30.4 7,400No 62.8 4,700 30.5 3,600 35.5 7,900 21.4 6,700
Strongly agree friends from college encourage me to stay in college, 2011–12
Yes 46.8 4,500 28.0 3,500 41.6 10,100 30.2 7,600No 56.5 4,600 26.9 3,100 32.9 8,200 22.6 6,700
Strongly agree friends from home encourage me to stay in college, 2011–12
Yes 48.1 4,600 27.0 3,400 39.7 9,900 28.9 7,500No 54.9 4,600 28.7 3,300 35.9 8,600 24.5 6,800
Number of months between high school completion and postsecondary entry6
0–12 45.4 4,500 29.8 3,400 42.7 9,600 30.6 7,40013 or more 76.9 4,700 16.2 2,800 14.9 7,700 9.9 6,400
Recent high school graduate7
Yes 44.6 4,500 30.3 3,400 43.3 9,600 31.1 7,300No 74.8 4,700 16.1 2,700 17.3 9,000 11.8 7,000
Students under age 30: highest level of high school mathematics completed or planned8
Less than algebra 2 67.5 4,700 21.7 3,100 26.2 6,700 13.4 6,500Algebra 2 59.8 4,700 27.8 3,000 29.8 7,200 19.5 6,000Trigonometry 48.3 4,600 32.0 3,700 44.8 10,100 30.8 7,500Precalculus 46.8 4,500 31.4 3,100 39.7 9,000 31.5 6,900Calculus, math beyond calculus, or statistics 35.2 4,400 27.2 3,800 50.3 11,300 37.0 8,200
Students under age 30: high school grade point average
Less than 2.50 68.5 4,700 24.4 2,500 24.0 6,000 12.1 5,4002.50–2.99 53.3 4,600 26.8 3,600 32.8 7,900 19.8 6,4003.00–3.49 46.5 4,500 29.0 3,400 40.3 9,200 29.4 7,0003.50 or higher 37.0 4,300 30.4 3,700 52.1 11,500 41.1 8,300
Students under age 30: took any college-level courses while in high school9
Yes 41.7 4,500 29.6 3,600 45.6 10,400 33.4 7,700No 62.1 4,700 25.7 2,900 28.4 7,100 18.5 6,200
See notes at end of table.
Full-time/full-year first-time postsecondary students, 2011–121
Table 2.4-A.Among full-time/full-year 2011–12 first-time postsecondary students, the percentage who received Pell, state, institutional, or merit-only grants and among those who received each type of aid, the average amount received in 2011–12, by selected personal characteristics: 2012–14—Continued
Financial aid, 2011–12Federal Pell Grants State grants Institutional grants Merit-only grants
– 86 –

National Center for Education Statistics
9 Includes college courses for credit, Advanced Placement (AP), and International Baccalaureate (IB) courses.NOTE: Average aid amounts are calculated only for first-time postsecondary students receiving that type of aid. Those not receiving that type of aid (i.e., zero values) are not included in that column’s average. Estimates include individuals who were first-time postsecondary students in 2011–12 at Title IV eligible postsecondary institutions in the 50 states and the District of Columbia. SOURCE: U.S. Department of Education, National Center for Education Statistics, 2012/14 Beginning Postsecondary Students Longitudinal Study (BPS:12/14).
‡ Reporting standards not met.
Table 2.4-A.Among full-time/full-year 2011–12 first-time postsecondary students, the percentage who received Pell, state, institutional, or merit-only grants and among those who received each type of aid, the average amount received in 2011–12, by selected personal characteristics: 2012–14—Continued
1 Students who are enrolled as full-time students typically carry at least 12 semester or quarter hours per term at the undergraduate level or 9 credit hours per term at the graduate level; 24 semester hours or 36 quarter hours per academic year for an educational program using credit hours for a program of less than one academic year; or 24 clock hours per week for an educational program using clock hours. Students enrolled full year are enrolled 9 or more months.2 Black includes African American, Hispanic includes Latino, and Other or Two or more races includes American Indian or Alaska Native, Pacific Islander or Native Hawaiian, and first-time students having origins in more than one race. Race categories exclude Hispanic origin.
† Not applicable.! Interpret data with caution. Estimate is unstable because the standard error represents more than 30 percent but less than 51 percent of the estimate.
8 Math coursetaking data come from two sources: surveys first-time students completed when they took the ACT or SAT I in high school and BPS interviews first-time students completed in the base year or first follow-up. First-time students who reported this information on an entrance examination survey may not have completed all courses at the time they took the survey.
3 First-time foreign students with visas are included in the total but excluded here. Immigrants include foreign-born first-time students who were U.S. citizens with one or both parent(s) born outside of the United States, resident aliens, or noncitizens eligible for citizenship. Second-generation Americans include U.S.-born first-time students with one or both parent(s) foreign born. Third-generation or higher Americans include U.S.- and foreign-born first-time students with both parents born in the United States. 4 First-time students classified as independent include those age 24 or over and those under 24 who are married, have dependents, are veterans or on active duty, are orphans or wards of the courts, are homeless or at risk of homelessness, or were determined to be independent by a financial aid officer using professional judgment. Other first-time students under age 24 are considered to be dependent. Within marital status, the unmarried category includes first-time students who are divorced, separated, or widowed. First-time students are considered to have a dependent if they have a child or any others for whom they are the caretaker or have financial responsibility. A spouse is not considered to be a dependent.5 Income in 2010 is used because it was reported on the federal financial aid application and used for federal need analysis for 2011–12.6 First-time students who did not complete a high school diploma, certificate, or equivalency are included in the total but excluded here.7 Recent high school graduates only include first-time students who graduated from high school with a regular high school diploma in 2011 or 2012.
– 87 –

National Center for Education Statistics
Personal characteristics Percent
Average amount
received Percent
Average amount
received Percent
Average amount
received Percent
Average amount
received
Total 0.78 $80 0.70 $60 1.18 $310 1.11 $210
SexMale 1.47 100 1.01 100 1.20 390 1.24 280Female 0.71 70 0.82 80 1.49 320 1.20 240
Race/ethnicityWhite 0.78 90 0.90 70 1.39 290 1.37 220Black 1.69 90 1.82 130 2.09 590 1.68 480Hispanic 1.42 60 1.39 200 1.75 700 1.23 490Asian 2.76 120 2.51 440 2.35 810 1.82 630Other or Two or more races 2.75 140 2.60 250 2.39 940 2.53 890
Immigrant generationImmigrant 2.44 80 2.31 270 2.27 850 2.05 640Second-generation American 1.25 70 1.31 150 1.50 580 1.20 330Third-generation or higher American 0.87 90 0.81 60 1.34 300 1.28 220
Dependency status and family responsibilities, 2011–12
Dependent 0.60 80 0.76 70 1.14 300 1.07 210Independent 2.68 80 1.19 210 1.01 570 0.95 550 Unmarried, no dependent(s) 4.33 110 2.25 310 1.89 760 2.00 740 Unmarried, with dependent(s) 1.57 80 1.83 270 1.57 680 1.22 660 Married 4.11 120 2.62 390 1.46 760 1.02 †
Age as of December 31, 201118 years or younger 0.74 80 0.96 80 1.31 280 1.18 22019 years 1.31 110 1.18 120 1.43 460 1.41 32020–23 years 2.52 100 2.11 280 1.52 1,140 1.37 1,03024–29 years 5.20 70 1.84 250 1.40 920 1.04 75030 years or older 2.66 90 2.31 260 1.72 850 1.59 1,180
Veterans and military service members on active duty, in the reserves, or in the National Guard, 2011–12
Yes 8.60 330 5.01 † 2.94 † 3.16 †No 0.74 80 0.72 60 1.22 310 1.13 210
Has some type of disability, 2011–12Yes 2.05 70 1.75 160 2.17 620 2.06 620No 0.76 80 0.71 70 1.17 310 1.09 210
See notes at end of table.
Table S2.4-A.Standard errors for table 2.4-A: Among full-time/full-year 2011–12 first-time postsecondary students, the percentage who received Pell, state, institutional, or merit-only grants and among those who received each type of aid, the average amount received in 2011–12, by selected personal characteristics: 2012–14
Financial aid, 2011–12Federal Pell Grants State grants Institutional grants Merit-only grants
Full-time/full-year first-time postsecondary students, 2011–12
– 88 –

National Center for Education Statistics
Personal characteristics Percent
Average amount
received Percent
Average amount
received Percent
Average amount
received Percent
Average amount
received
Self-perception of change in physical health between 2012 and 2014
Declined 1.63 70 1.39 210 1.76 380 1.60 340Constant 0.99 100 0.90 90 1.41 410 1.37 300Improved 1.06 80 0.96 90 1.19 360 1.17 280
Self-perception of change in mental health between 2012 and 2014
Declined 1.65 100 1.28 140 2.13 440 1.75 360Constant 0.86 90 0.88 90 1.08 360 1.04 250Improved 1.07 70 1.01 130 1.42 370 1.41 310
First person in immediate family to go to college
Do not know 4.81 100 3.99 680 3.74 1,070 2.93 740Yes 1.74 80 1.37 160 1.95 650 1.62 630No 0.66 80 0.76 60 1.09 290 1.08 190
Highest education attained by either parent, 2011–12
Do not know 3.23 100 2.47 500 3.03 820 2.29 830High school diploma or less 1.32 60 1.23 130 1.64 530 1.38 500Some postsecondary education 1.02 60 1.31 120 1.60 340 1.40 290Bachelor’s degree or higher 0.97 130 0.78 90 0.99 310 1.18 210
Dependent students: parents’ income, 2010Less than $30,000 0.57 20 1.39 100 1.40 450 1.26 310$30,000–59,999 1.19 70 1.52 120 2.22 470 2.00 390$60,000–89,999 1.98 110 1.42 160 1.69 470 1.64 360$90,000 or more 0.18 490 0.80 150 1.16 350 1.14 240
Dependency status and federal Pell Grant receipt, 2011–12
Dependent, received † 80 1.15 80 1.82 480 1.61 350Independent, received † 80 1.41 210 1.11 540 1.03 520Did not receive † † 0.77 100 0.91 290 0.98 220
Dependent students: parents provided financial help for housing, tuition, or other expenses, 2011–12
Yes 0.67 80 0.76 80 1.10 310 1.11 210No 1.12 70 1.55 120 1.97 490 1.46 390
Table S2.4-A.Standard errors for table 2.4-A: Among full-time/full-year 2011–12 first-time postsecondary students, the percentage who received Pell, state, institutional, or merit-only grants and among those who received each type of aid, the average amount received in 2011–12, by selected personal characteristics: 2012–14—Continued
Financial aid, 2011–12
Full-time/full-year first-time postsecondary students, 2011–12
Federal Pell Grants State grants Institutional grants Merit-only grants
See notes at end of table.
– 89 –

National Center for Education Statistics
Personal characteristics Percent
Average amount
received Percent
Average amount
received Percent
Average amount
received Percent
Average amount
received
Students under age 24: strongly agree parents encourage me to stay in college, 2011–12
Yes 0.60 80 0.74 70 1.21 290 1.03 220No 2.16 120 1.53 240 1.67 580 2.09 430
Strongly agree friends from college encourage me to stay in college, 2011–12
Yes 0.79 100 0.92 80 1.53 280 1.29 210No 1.22 60 1.01 90 1.00 490 1.14 350
Strongly agree friends from home encourage me to stay in college, 2011–12
Yes 0.90 90 0.84 90 1.38 290 1.20 210No 1.06 70 1.02 110 1.17 440 1.22 320
Number of months between high school completion and postsecondary entry
0–12 0.61 80 0.81 70 1.27 300 1.20 21013 or more 3.20 70 1.35 220 1.24 1,020 1.03 870
Recent high school graduateYes 0.62 90 0.83 70 1.27 300 1.19 210No 2.95 70 1.14 190 1.36 850 1.13 680
Students under age 30: highest level of high school mathematics completed or planned
Less than algebra 2 2.30 70 1.57 180 1.81 620 1.30 430Algebra 2 1.23 60 1.23 130 1.51 370 1.13 350Trigonometry 2.21 160 2.01 220 2.92 500 2.24 400Precalculus 1.08 80 1.26 100 2.06 360 1.86 350Calculus, math beyond calculus, or statistics 1.14 120 1.07 120 1.23 410 1.27 270
Students under age 30: high school grade point average
Less than 2.50 1.44 60 1.47 120 1.42 530 1.14 5302.50–2.99 2.49 110 1.42 210 1.74 510 1.82 4003.00–3.49 0.88 70 0.88 100 1.29 330 1.13 2903.50 or higher 1.20 120 1.20 90 1.31 370 1.28 240
Students under age 30: took any college-level courses while in high school
Yes 0.79 90 0.81 80 1.07 280 1.03 210No 1.68 60 1.11 120 1.36 430 1.29 360
Federal Pell Grants State grants Institutional grants Merit-only grants
SOURCE: U.S. Department of Education, National Center for Education Statistics, 2012/14 Beginning Postsecondary Students Longitudinal Study (BPS:12/14).
† Not applicable.
Table S2.4-A.Standard errors for table 2.4-A: Among full-time/full-year 2011–12 first-time postsecondary students, the percentage who received Pell, state, institutional, or merit-only grants and among those who received each type of aid, the average amount received in 2011–12, by selected personal characteristics: 2012–14—Continued
Financial aid, 2011–12
Full-time/full-year first-time postsecondary students, 2011–12
– 90 –

National Center for Education Statistics
Enrollment characteristics Percent
Average amount
received Percent
Average amount
received Percent
Average amount
received Percent
Average amount
received
Total 50.3 $4,600 27.6 $3,300 38.4 $9,500 27.4 $7,300
Control and level of first institution4-year 41.4 4,500 31.3 3,800 48.8 10,700 36.4 7,800
Public 41.3 4,500 36.4 3,700 36.1 4,600 28.9 4,400Private nonprofit 35.4 4,300 24.9 4,000 76.7 15,800 54.1 11,000For-profit 84.4 5,000 14.4 4,500 7.4 4,800 4.6 4,200
2-year 66.7 4,600 21.5 1,900 18.2 1,900 9.3 2,800Public 62.6 4,500 23.1 1,900 18.3 1,600 9.7 2,800Private nonprofit 77.1 4,900 33.1 ! 2,700 58.4 5,300 ! 20.0 ! 4,500For-profit 93.9 4,800 7.3 2,400 8.4 ! 2,100 ‡ ‡
Less-than-2-year 92.0 5,000 ‡ ‡ ‡ ‡ ‡ ‡Public 58.8 ‡ # ‡ ‡ ‡ # ‡Private nonprofit ‡ ‡ ‡ ‡ ‡ ‡ ‡ ‡For-profit 97.0 5,000 ‡ ‡ ‡ ‡ ‡ ‡
Degree program, 2011–12No certificate or degree ‡ ‡ 20.9 ! ‡ ‡ ‡ ‡ ‡Undergraduate certificate 90.0 4,800 7.0 1,500 3.5 ! 2,200 ! 3.3 2,700Associate’s degree 66.6 4,600 22.9 1,900 18.8 2,000 10.2 2,800Bachelor’s degree 38.7 4,400 31.9 3,800 51.2 10,900 38.1 7,900
Strongly agree know requirements needed to complete degree program, 2011–122
Yes 50.1 4,500 28.0 3,500 39.6 10,100 28.9 7,500No 48.3 4,500 28.5 3,100 39.3 8,800 27.6 7,000
Strongly agree that “I feel that I am a part of my first institution.”
Yes 49.5 4,600 25.6 3,300 39.2 10,300 28.1 7,900No 51.1 4,500 29.4 3,400 37.7 8,700 26.7 6,800
Strongly agree have ability to succeed as a student at first institution, 2011–12
Yes 50.2 4,600 26.2 3,300 37.8 9,500 27.8 7,400No 50.6 4,500 29.9 3,500 39.5 9,500 26.8 7,200
Used academic support services, 2011–12Yes 47.3 4,600 30.0 3,700 45.3 10,500 31.8 7,800No 52.3 4,600 26.0 3,100 33.9 8,600 24.5 6,900
Table 2.4-B.Among full-time/full-year 2011–12 first-time postsecondary students, the percentage who received Pell, state, institutional, or merit-only grants and among those who received each type of aid, the average amount received in 2011–12, by selected enrollment characteristics
Full-time/full-year first-time postsecondary students, 2011–121
Financial aid, 2011–12Federal Pell Grants State grants Institutional grants Merit-only grants
See notes at end of table.
– 91 –

National Center for Education Statistics
Enrollment characteristics Percent
Average amount
received Percent
Average amount
received Percent
Average amount
received Percent
Average amount
received
Self-reported remedial coursetaking, 2011–12Yes 64.3 4,700 30.8 3,000 26.2 5,700 15.5 5,100No 46.9 4,500 26.8 3,500 41.4 10,100 30.3 7,600
Number of minutes to commute to campus, 2011–12
Did not commute to campus 37.8 4,500 28.1 3,800 52.0 11,300 36.7 8,4001–15 61.0 4,600 25.8 2,600 23.0 5,100 18.8 4,60016–30 62.2 4,600 26.6 2,900 24.7 5,400 17.0 4,900More than 30 68.7 4,700 29.2 3,300 25.0 6,500 17.1 5,200
Hours worked per week while enrolled, 2011–12Did not hold a job 49.4 4,600 26.7 3,500 38.5 9,400 27.0 7,7001–15 40.5 4,400 28.3 3,900 55.9 12,000 38.8 8,20016–34 54.1 4,500 32.5 2,900 33.1 8,100 25.7 5,60035 or more 64.6 4,500 22.8 2,600 23.3 5,700 17.7 5,200
Location of job(s) while enrolled, 2011–12Did not hold a job 49.4 4,600 26.7 3,500 38.5 9,400 27.0 7,700Worked on campus 45.2 4,400 29.8 3,700 64.8 13,500 43.6 8,900Worked off campus only 54.3 4,500 28.8 3,000 29.3 6,700 23.0 5,300
Highest degree ever expected to complete, 2011–123
Undergraduate certificate 89.2 4,900 5.4 ! ‡ ‡ ‡ 2.9 ! ‡Associate’s degree 78.2 4,600 19.5 2,000 14.5 2,000 7.8 2,800Bachelor’s degree 50.6 4,500 27.3 3,100 34.9 7,300 23.5 6,300Advanced degree 44.5 4,500 30.1 3,600 45.7 10,900 33.8 7,900
Attendance intensity through June 20144
Always full time 52.1 4,600 27.6 3,400 39.6 9,700 27.9 7,400Mixed 43.0 4,300 27.3 3,200 33.5 8,800 25.5 6,900Always part time † † † † † † † †
Table 2.4-B.Among full-time/full-year 2011–12 first-time postsecondary students, the percentage who received Pell, state, institutional, or merit-only grants and among those who received each type of aid, the average amount received in 2011–12, by selected enrollment characteristics—Continued
Financial aid, 2011–12Federal Pell Grants State grants Institutional grants
Full-time/full-year first-time postsecondary students, 2011–121
See notes at end of table.
Merit-only grants
– 92 –

National Center for Education Statistics
Enrollment characteristics Percent
Average amount
received Percent
Average amount
received Percent
Average amount
received Percent
Average amount
received
Ever transferred through June 20145
Yes 50.3 4,600 29.1 3,000 36.5 7,600 28.0 5,800 Attempted to transfer credits 49.1 4,600 29.8 2,900 37.6 7,600 29.5 5,900 Did not attempt to transfer credits 53.3 4,600 27.4 3,100 33.9 7,600 24.3 5,600No 50.3 4,500 27.2 3,400 38.9 9,900 27.3 7,700
Direction of first transfer by institution level through June 20145
Did not transfer 50.3 4,500 27.2 3,400 38.9 9,900 27.3 7,7004-year to 4-year 45.5 4,700 33.4 3,200 47.9 9,600 39.4 6,7004-year to 2-year 47.0 4,400 34.0 3,500 44.6 8,400 34.1 6,1002-year to 4-year 45.9 4,600 22.0 2,200 23.8 2,400 15.4 2,7002-year to 2-year 71.2 4,700 25.4 2,100 20.1 3,100 12.8 3,900Transfers to and from less-than-2-year institutions 83.4 4,900 19.0 ‡ 15.8 ‡ 14.2 ! ‡
Ever stopped out through June 20146
Yes 55.5 4,500 26.1 3,000 30.4 7,300 20.5 6,300No 49.7 4,600 27.8 3,400 39.4 9,700 28.3 7,400
Number of degrees and certificates pursued through June 20147
One 48.9 4,500 27.0 3,500 40.2 10,100 28.2 7,800More than one 54.5 4,600 28.9 2,900 33.3 7,600 25.5 5,900
Number of changes in major at any institution through June 20148
Zero 52.2 4,600 25.8 3,300 36.6 10,300 26.1 7,600One 46.4 4,600 30.4 3,600 42.3 8,600 30.1 7,000More than one 46.9 4,500 31.7 3,100 41.8 7,600 32.5 6,500
Field of study when last enrolled through June 20149
Computer and information sciences 51.5 4,600 28.9 3,400 36.4 9,500 25.6 6,100Engineering and engineering technology 40.1 4,500 22.3 3,600 38.9 10,300 26.8 7,200Biology and physical science, science technology, math, agriculture 40.4 4,500 31.8 3,900 48.3 11,200 36.3 8,600General studies and other 59.9 4,600 29.3 2,700 27.3 6,200 19.1 6,000Social sciences 42.9 4,500 28.2 3,700 47.4 11,700 31.8 8,400Humanities 40.2 4,300 28.2 3,500 47.3 11,800 33.5 8,300Health care fields 63.2 4,600 26.6 3,100 30.2 7,700 24.2 6,800Business 42.4 4,500 28.3 3,200 41.9 9,100 29.4 7,100Education 48.9 4,200 31.1 3,100 41.6 8,900 34.0 7,200Other applied 58.7 4,700 24.5 3,200 32.6 7,900 22.2 6,300
Institutional grants Merit-only grants
Full-time/full-year first-time postsecondary students, 2011–121
See notes at end of table.
Federal Pell Grants State grants
Table 2.4-B.Among full-time/full-year 2011–12 first-time postsecondary students, the percentage who received Pell, state, institutional, or merit-only grants and among those who received each type of aid, the average amount received in 2011–12, by selected enrollment characteristics—Continued
Financial aid, 2011–12
– 93 –

National Center for Education Statistics
Enrollment characteristics Percent
Average amount
received Percent
Average amount
received Percent
Average amount
received Percent
Average amount
received
Grade point average estimate when last enrolled through June 2014
Less than 2.25 66.7 4,500 26.2 2,500 30.0 7,300 15.3 6,3002.25–2.74 59.7 4,700 30.6 3,400 32.5 6,900 20.1 6,0002.75–3.24 47.6 4,600 29.4 3,500 39.2 9,200 27.2 7,0003.25–3.74 45.3 4,500 26.1 3,500 41.1 10,400 31.0 7,5003.75 or higher 44.9 4,400 26.1 3,300 43.4 11,200 35.2 8,500
Full-time/full-year first-time postsecondary students, 2011–121
5 A transfer is defined as leaving one institution and enrolling in another institution for 4 or more consecutive months.
4 Full-time status for the purposes of financial aid eligibility was based on 12 credit hours unless the awarding institution employed a different standard.
6 A stopout is defined as a break in enrollment of 5 or more consecutive months.
9 First-time students who were not in a degree or certificate program when last enrolled are included in the total but excluded here. General studies and other includes general studies, basic skills, and citizenship activities; leisure and recreational activities; personal awareness and self-improvement; high school/secondary diplomas and certificate programs; and interpersonal and social skills. Other applied includes personal and consumer services; manufacturing, construction, repair, and transportation; military technology and protective services; architecture; communications; public administration and human services; design and applied arts; law and legal studies; library sciences; and theology and religious vocations.
8 First-time students who never enrolled in an associate’s or bachelor’s degree program or who never declared a major are included in the total but excluded here.
3 First-time students who did not expect to complete a certificate or degree are included in the total but excluded here. Advanced degree includes post-BA or post-master certificates, master’s degrees, professional practice doctor’s degrees, and research/scholarship and other doctor’s degrees.
7 First-time students who did not pursue any certificates or degrees through June 2014 are included in the total but excluded here.
# Rounds to zero.! Interpret data with caution. Estimate is unstable because the standard error represents more than 30 percent but less than 51 percent of the estimate.‡ Reporting standards not met.
Federal Pell Grants State grants Institutional grants Merit-only grants
Table 2.4-B.Among full-time/full-year 2011–12 first-time postsecondary students, the percentage who received Pell, state, institutional, or merit-only grants and among those who received each type of aid, the average amount received in 2011–12, by selected enrollment characteristics—Continued
Financial aid, 2011–12
NOTE: Average aid amounts are calculated only for first-time postsecondary students receiving that type of aid. Those not receiving that type of aid (i.e., zero values) are not included in that column’s average. Estimates include individuals who were first-time postsecondary students in 2011–12 at Title IV eligible postsecondary institutions in the 50 states and the District of Columbia. SOURCE: U.S. Department of Education, National Center for Education Statistics, 2012/14 Beginning Postsecondary Students Longitudinal Study (BPS:12/14).
1 Students who are enrolled as full-time students typically carry at least 12 semester or quarter hours per term at the undergraduate level or 9 credit hours per term at the graduate level; 24 semester hours or 36 quarter hours per academic year for an educational program using credit hours for a program of less than one academic year; or 24 clock hours per week for an educational program using clock hours. Students enrolled full year are enrolled 9 or more months.2 First-time students who were not enrolled in a degree or certificate program or who attained a degree or certificate during the 2011–12 academic year are included in the total but excluded here.
† Not applicable.
– 94 –

National Center for Education Statistics
Enrollment characteristics Percent
Average amount
received Percent
Average amount
received Percent
Average amount
received Percent
Average amount
received
Total 0.78 $80 0.70 $60 1.18 $310 1.11 $210
Control and level of first institution4-year 0.68 120 0.80 80 1.30 260 1.14 210
Public 0.82 90 1.08 100 1.27 220 1.07 180Private nonprofit 2.05 150 1.35 120 1.22 280 1.65 230For-profit 7.30 170 3.18 300 1.09 530 0.88 320
2-year 1.38 20 1.29 140 1.22 180 1.11 230Public 0.70 20 1.44 150 1.23 110 1.25 250Private nonprofit 13.43 380 15.73 690 15.76 1,880 7.26 1,080For-profit 5.99 80 1.75 460 2.69 420 † †
Less-than-2-year 2.19 120 † † † † † †Public 10.13 † † † † † † †Private nonprofit † † † † † † † †For-profit 1.58 140 † † † † † †
Degree program, 2011–12No certificate or degree † † 9.75 † † † † †Undergraduate certificate 2.81 90 1.48 330 1.15 740 0.84 670Associate’s degree 0.99 30 1.23 130 1.17 180 1.08 250Bachelor’s degree 1.00 110 0.82 70 1.08 240 0.96 210
Strongly agree know requirements needed to complete degree program, 2011–12
Yes 0.88 80 0.87 80 1.24 320 1.06 230No 0.83 70 0.84 110 1.42 350 1.24 300
Strongly agree that “I feel that I am a part of my first institution.”
Yes 1.08 90 0.91 100 1.41 360 1.28 280No 0.91 80 0.85 80 1.24 310 1.21 220
Strongly agree have ability to succeed as a student at first institution, 2011–12
Yes 1.00 80 0.80 80 1.39 330 1.12 240No 0.96 90 0.95 120 1.15 360 1.33 270
Used academic support services, 2011–12Yes 1.02 90 0.94 90 1.53 340 1.32 260No 0.92 80 0.80 80 1.09 370 1.10 250
See notes at end of table.
Table S2.4-B.Standard errors for table 2.4-B: Among full-time/full-year 2011–12 first-time postsecondary students, the percentage who received Pell, state, institutional, or merit-only grants and among those who received each type of aid, the average amount received in 2011–12, by selected enrollment characteristics
Financial aid, 2011–12Federal Pell Grants State grants Institutional grants Merit-only grants
Full-time/full-year first-time postsecondary students, 2011–12
– 95 –

National Center for Education Statistics
Enrollment characteristics Percent
Average amount
received Percent
Average amount
received Percent
Average amount
received Percent
Average amount
received
Self-reported remedial coursetaking, 2011–12Yes 1.14 40 1.27 160 1.65 430 1.33 470No 0.86 100 0.72 60 1.08 300 1.07 200
Number of minutes to commute to campus, 2011–12
Did not commute to campus 0.84 140 0.88 80 1.25 310 1.30 2201–15 1.40 60 1.36 100 1.59 310 1.25 30016–30 1.22 50 1.16 150 1.29 510 1.30 350More than 30 1.73 70 1.78 160 1.43 530 1.40 320
Hours worked per week while enrolled, 2011–12Did not hold a job 1.03 90 0.76 80 1.15 320 1.10 2401–15 1.52 120 1.47 190 2.29 560 1.99 40016–34 1.35 80 1.41 130 1.67 440 1.69 30035 or more 2.39 90 1.82 150 1.79 660 1.74 460
Location of job(s) while enrolled, 2011–12Did not hold a job 1.03 90 0.76 80 1.15 320 1.10 240Worked on campus 1.86 150 1.70 220 2.11 570 2.00 410Worked off campus only 1.17 60 1.17 100 1.28 330 1.33 250
Highest degree ever expected to complete, 2011–12
Undergraduate certificate 2.61 160 2.24 † † † 1.07 †Associate’s degree 2.54 60 1.86 200 1.71 250 1.54 450Bachelor’s degree 1.10 70 1.07 100 1.54 320 1.36 280Advanced degree 0.83 100 0.78 80 1.11 330 1.20 230
Attendance intensity through June 2014Always full time 0.98 80 0.76 70 1.25 320 1.14 230Mixed 1.32 100 1.20 140 1.55 420 1.53 310Always part time † † † † † † † †
Full-time/full-year first-time postsecondary students, 2011–12
Table S2.4-B.Standard errors for table 2.4-B: Among full-time/full-year 2011–12 first-time postsecondary students, the percentage who received Pell, state, institutional, or merit-only grants and among those who received each type of aid, the average amount received in 2011–12, by selected enrollment characteristics —Continued
Financial aid, 2011–12Federal Pell Grants State grants Institutional grants Merit-only grants
See notes at end of table.
– 96 –

National Center for Education Statistics
Enrollment characteristics Percent
Average amount
received Percent
Average amount
received Percent
Average amount
received Percent
Average amount
received
Ever transferred through June 2014Yes 1.32 90 1.46 120 1.83 380 1.69 330 Attempted to transfer credits 1.82 100 1.69 130 2.40 420 2.23 390 Did not attempt to transfer credits 2.35 120 2.28 230 2.14 670 1.95 460No 0.87 80 0.74 70 1.16 320 1.11 210
Direction of first transfer by institution level through June 2014
Did not transfer 0.87 80 0.74 70 1.16 320 1.11 2104-year to 4-year 2.24 210 2.39 150 3.54 550 3.10 4604-year to 2-year 2.67 130 2.65 220 3.09 560 2.47 4402-year to 4-year 2.29 90 2.42 300 2.88 360 2.40 3502-year to 2-year 3.31 100 3.94 310 2.84 710 2.80 1,000Transfers to and from less-than-2-year institutions 4.63 160 5.31 † 3.93 † 4.27 †
Ever stopped out through June 2014Yes 1.79 100 1.59 190 1.94 620 1.97 460No 0.83 80 0.73 70 1.15 310 1.06 220
Number of degrees and certificates pursued through June 2014
One 0.85 90 0.80 90 1.26 300 1.02 230More than one 1.17 60 1.24 100 1.62 370 1.60 280
Number of changes in major at any institution through June 2014
Zero 0.95 80 0.79 80 1.41 350 1.13 250One 1.15 80 1.21 120 1.35 340 1.32 320More than one 1.67 100 1.57 150 2.30 420 1.97 390
Field of study when last enrolled through June 2014
Computer and information sciences 3.11 110 2.98 350 3.07 1,170 2.86 760Engineering and engineering technology 2.41 140 2.26 240 2.24 820 2.04 680Biology and physical science, science technology, math, agriculture 1.89 110 1.93 220 2.10 510 2.18 340General studies and other 3.02 180 2.70 250 2.79 690 2.47 660Social sciences 1.76 110 1.47 190 1.94 610 1.84 480Humanities 2.30 160 1.98 200 2.39 680 2.12 480Health care fields 1.90 80 1.61 200 2.03 500 1.92 480Business 1.65 90 1.44 130 1.51 490 1.39 370Education 2.46 120 2.13 200 2.66 600 2.68 550Other applied 2.02 90 1.35 140 1.87 430 1.47 340
See notes at end of table.
Full-time/full-year first-time postsecondary students, 2011–12
Table S2.4-B.Standard errors for table 2.4-B: Among full-time/full-year 2011–12 first-time postsecondary students, the percentage who received Pell, state, institutional, or merit-only grants and among those who received each type of aid, the average amount received in 2011–12, by selected enrollment characteristics —Continued
Financial aid, 2011–12Federal Pell Grants State grants Institutional grants Merit-only grants
– 97 –

National Center for Education Statistics
Enrollment characteristics Percent
Average amount
received Percent
Average amount
received Percent
Average amount
received Percent
Average amount
received
Grade point average estimate when last enrolled through June 2014
Less than 2.25 2.11 90 1.86 140 1.84 750 1.84 8802.25–2.74 1.74 80 1.38 190 1.69 480 1.63 3202.75–3.24 1.38 100 1.15 150 1.33 360 1.27 3203.25–3.74 0.96 100 1.10 100 1.63 380 1.40 2503.75 or higher 1.41 110 1.45 160 1.77 470 1.67 340
Full-time/full-year first-time postsecondary students, 2011–12
Table S2.4-B.Standard errors for table 2.4-B: Among full-time/full-year 2011–12 first-time postsecondary students, the percentage who received Pell, state, institutional, or merit-only grants and among those who received each type of aid, the average amount received in 2011–12, by selected enrollment characteristics —Continued
Financial aid, 2011–12Federal Pell Grants State grants Institutional grants Merit-only grants
SOURCE: U.S. Department of Education, National Center for Education Statistics, 2012/14 Beginning Postsecondary Students Longitudinal Study (BPS:12/14).
† Not applicable.
– 98 –