Web Application for Calculating Total Roof Top Area and ...
56
Sagar Aryal Web Application for Calculating Total Roof Top Area and Solar Energy. Helsinki Metropolia University of Applied Sciences Bachelor’s Degree Information Technology Bachelor Thesis Project 29 November 2019
Transcript of Web Application for Calculating Total Roof Top Area and ...
Sagar Aryal
Web Application for Calculating Total Roof Top Area and Solar Energy.
Helsinki Metropolia University of Applied Sciences
Bachelor’s Degree
Information Technology
Bachelor Thesis Project
29 November 2019

Acknowledgement
Firstly, I would like to thank all my senior professors and teachers of the
Information Technology department at Helsinki Metropolia University of Applied
Sciences for their motivation, encouragement, comments, patience and support.
Their continuous guidance helps me to do this project. Also, I would like to thank
the campus management who provide fully well-equipped modern learning
facilities and equipment with a cozy learning environment that always helps me
to focus on my study.
I thank my class friends with whom I was working together for the last four years
sharing all the ideas and knowledge with one another. Many thanks to my cousin
Mr. Sachin Aryal who helps me to collect all the metrological and radiational data
of Kathmandu city so that I could start a project for my thesis.
Lastly, I would like to thank my whole family members, especially my dad Mr.
Ram Prasad Aryal and mom Mrs. Shardha Aryal who always support me
spiritually throughout my whole life for my hard work and success. I would not like
to forget my only sister Ms. Sajana Aryal for her help and support towards me.
Sagar Aryal
Helsinki, Finland
November 29, 2019
Abstract
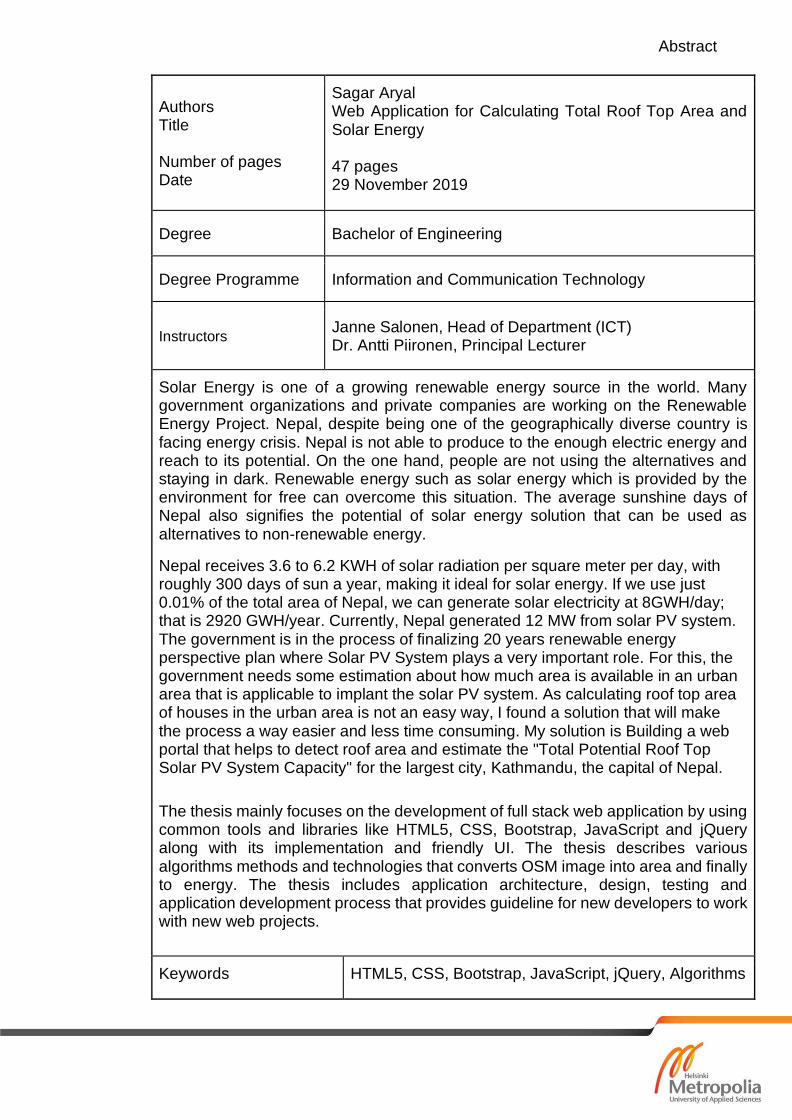
Authors Title Number of pages Date
Sagar Aryal Web Application for Calculating Total Roof Top Area and Solar Energy 47 pages 29 November 2019
Degree Bachelor of Engineering
Degree Programme Information and Communication Technology
Instructors Janne Salonen, Head of Department (ICT) Dr. Antti Piironen, Principal Lecturer
Solar Energy is one of a growing renewable energy source in the world. Many government organizations and private companies are working on the Renewable Energy Project. Nepal, despite being one of the geographically diverse country is facing energy crisis. Nepal is not able to produce to the enough electric energy and reach to its potential. On the one hand, people are not using the alternatives and staying in dark. Renewable energy such as solar energy which is provided by the environment for free can overcome this situation. The average sunshine days of Nepal also signifies the potential of solar energy solution that can be used as alternatives to non-renewable energy.
Nepal receives 3.6 to 6.2 KWH of solar radiation per square meter per day, with roughly 300 days of sun a year, making it ideal for solar energy. If we use just 0.01% of the total area of Nepal, we can generate solar electricity at 8GWH/day; that is 2920 GWH/year. Currently, Nepal generated 12 MW from solar PV system. The government is in the process of finalizing 20 years renewable energy perspective plan where Solar PV System plays a very important role. For this, the government needs some estimation about how much area is available in an urban area that is applicable to implant the solar PV system. As calculating roof top area of houses in the urban area is not an easy way, I found a solution that will make the process a way easier and less time consuming. My solution is Building a web portal that helps to detect roof area and estimate the "Total Potential Roof Top Solar PV System Capacity" for the largest city, Kathmandu, the capital of Nepal.
The thesis mainly focuses on the development of full stack web application by using common tools and libraries like HTML5, CSS, Bootstrap, JavaScript and jQuery along with its implementation and friendly UI. The thesis describes various algorithms methods and technologies that converts OSM image into area and finally to energy. The thesis includes application architecture, design, testing and application development process that provides guideline for new developers to work with new web projects.
Keywords HTML5, CSS, Bootstrap, JavaScript, jQuery, Algorithms

Table of Contents
1 Introduction 1
2 Web Development 3
3 Tools and Libraries 5
3.1 HTML5 5
3.2 CSS 6
3.3 JavaScript 8
3.4 Bootstrap 11
3.5 jQuery 12
4 Third party plugins and tools 15
4.1 OpenStreetMap 15
4.2 Algorithms 16
4.3 Working Environment 17
4.4 Version Control 18
5 Methodology 19
5.1 Requirements 20
5.2 Design 21
5.3 Development 22
5.4 Testing 23
5.4.1 Unit Testing 23
5.4.2 System Testing 25
5.5 Deployment 25
5.6 Maintenance 25
5.6.1 Adaptive Maintenance 26
5.6.2 Corrective Maintenance 26
6 Application Workflow 27

7 Implementation and Results 29
7.1 Fetch the rooftop image 29
7.2 Start the Process 30
7.3 Reset the Process 32
7.4 Process the image 32
7.4.1 Linear Regression 33
7.4.2 Thresholding 34
7.4.3 8-Connectivity 34
7.5 Result 38
8 User Friendly Interface 40
9 Discussion 45
10 Conclusion 47
References 48
List of Figures
Figure 1:Creating a HTML5 file. 6
Figure 2: CSS with the external style sheet. 7
Figure 3: jQuery, JavaScript library for sliding effects. 9
Figure 4: Stack Overflow survey, most used programming language in 2019. [9]
10
Figure 5: Bootstrap with HTML file. 12
Figure 6: Function for finding right datatype using ajax response. 14
Figure 7: Function for displaying the map and zoom level. 15
Figure 8: Waterfall Model. 20
Figure 9: Block diagram for calculating the net rooftop area from the proceed
image. 22
Figure 10: Workflow of an application. 27
Figure 11: Street view of the buildings. 29
Figure 12: Polygon drawing in the selected building on the map. 30
Figure 13: Result table with total rooftop area and monthly energy generation.38
Figure 14: The home page of the application. 40
Figure 15: View of instruction button when the user clicks the button. 41
Figure 16: Instruction button explaining the function of Process button. 42
Figure 17:The result page of the application. 43
Figure 18: Application showing Mobile Compatibility with iOS and Android. 44

List of Abbreviations
AEPC Alternative Energy Promotion Centre
API Application Programming Interface
CDN Content Delivery Network
CLD Context Level Diagram
CSS Cascading Styles Sheet
DBMS Database Management System
DFD Data Flow Diagram
DOM Document Object Model
ENIAC Electronic Numerical Integrator and Computer
GEF Global Environment Facility
GWH Gigawatt Hours
HTML Hypertext Mark-up Language
IE Internet Explorer
IMBY In My Backyard
IOT Internet Of Things
IT Information Technology
JS Java Script
KWH Kilowatt Hours
LAMP Linux Apache MySQL PHP/Perl/Python
LAN Local Area Network
MEAN MongoDB Express Angular and Node.JS
MERN MongoDB Express React and Node.JS
NASA National Aeronautics and Space Administration
OSM Open Street Map
PHP Personal Home Page
PV Photovoltaics
RGB Red Green Blue
SQL Structured Query Language
WAN Wide Area Network
UI User Interface
UNDP United Nations Development Programme
UX User Experience

1
1 Introduction
Human beings are creative creatures seeking endlessly better ways of doing
things. Their innate curiosity and efforts have always created new technical
innovations years and years. Information Technology was evolved during the
Second World War. Much of the inventions and technological improvements
developed after the second world war completely shape the world. Without the
access of wide range of technologies that are used on a daily basis the way of
living would not be easier as it is now. The term, Information Technology (IT)
came widely into use after late 1970s. Computers and telecommunication
technologies were regarded as different technology before 1970s. Increasing
integration of telecommunications and the incredible technological change in
microelectronics, software, hardware, optical fibers with computer technology
made this difference meaningful. Advance development of computer starts after
the development of first functional digital computer, ENIAC, built in 1946 to
modern computers which perform extremely wide range of tasks. The rapid
demands for communications between microcomputers had led the development
of network computing and network computer communications. This results the
development of Local Area Network (LAN) technology. Later, inter networking of
LANs developed Wide Area Network (WAN). Thus, the rapid development of
technologies and popularization of internet technology brought the information
technology into a new era.
The web application was designed by using the radiational data and
OpenStreetMap (OSM) of Kathmandu Valley, Nepal and it is valid only for that
area. Detail studies and research was done with other similar projects which had
been performed with other Mega cities around the world to estimate solar
Photovoltaics (PV) potential to explore urban life of Kathmandu City towards
renewable based low carbon sustainable city. Studies in application like In My
Backyard (IMBY), Solar Boston Map, San Francisco Solar Map, PVWatts
Calculator and Berkeley Solar Map had been carried out.

2
Higher demand of electric energy with increased population and negligible
availability has been miserable for years in Kathmandu and still continuing
because of population growth every year. The population of Kathmandu is nearly
1.4 million and still growing higher and higher which represents a 3.94% annual
change. [2] The excessive use of fossil fuels serves environmental pollution in
the valley and the terrestrial heat trapped by them will increase regional or global
temperature changing the climate of earth. These prevailing problems urged
government for the development of renewable energy such as solar energy which
is highly significant and effective. But, because of dense population and number
of congested households it will be hard to calculate the building area and estimate
the amount of solar energy production. Kathmandu has the highest population in
Nepal which is found to be 4,416 person per square km. [1] In order to implement
this, the government needs rough estimation of rooftop building area to implant
solar Photovoltaic (PV) system. This application will help to calculate the area of
houses in the valley that makes the process a way faster, easier and effective.
Furthermore, the thesis was done with the aim of getting knowledge about all the
stages of web application development by developing a prototype application in
order to implement and demonstrate the study. Various tools and technologies
related to the project were studied in depth. Development of different frameworks
and libraries were compared and chosen to make the application user interface
effective and easier to use. The thesis idea was to build a web application that
allows users to select a roof top area of building, display the area of that building
and estimate the monthly amount of solar energy that can be generated within
that area of the building. It can calculate the area and energy instantly. The main
advantage of application is, it estimates the area and solar energy for multiple
buildings at a single time. The final result of the application was successful, and
the application was responsive and functional for use.
3
2 Web Development
The history of origin of web development is quite unclear and complicated. During
the past, developers used to develop web application on different operating
systems. Every application had its own precompiled client program that used to
be separately installed on all user computer. Moreover, client side and server
side were tightly bound to the definite operating system and computer
architecture. It was difficult to recall the web because the client received a web
page as a static document. Whenever any changes are applied to the web page
long waiting time was required to refresh the page. The year 1995 was crucial
year for developers. This year Netscape introduced a client-side scripting
language called JavaScript that enables developers to improve the user interface
by adding dynamic elements. The embedded scripts perform various tasks right
on the spot of the downloaded page so that the data was no longer send to the
server to generate entire web page. Afterwards, in 1999 web applications were
appeared with java language. Later on, Ajax was introduced in 2005, making the
client sides more and more interactive. Ajax was firstly created for internet
explorer (IE) only but very soon after IE, Mozilla, Opera, Safari and Google too
adopted it. It made users to work in web applications faster and better in an
asynchronous manner. The latest version, HTML5 was introduced in 2014 which
provides varieties of graphic and multimedia capabilities. The interactivity of web
application has become enormous and without doubt it will be more effective and
varied in future. [3]
Web development consists of two broad divisions of development. The first one
is front-end development, also called as client-side development and secondly,
back end-development which is also called the server-side development. Web
developers are those developers who work on the complete developmental way
of frontend, backend, database and even testing and debugging to make a
complete applications and websites.
Front-end development gives the content, design and layout of the page. This is
mainly done using three different tools HTML, CSS and JavaScript.HTML is
known as the backbone of the web application as it is the standard mark-up

4
language for creating web pages. CSS describes how HTML elements should be
displayed by giving them style in a web page. Finally, JavaScript is object-
orientated programming language of HTML and Web that add functionality and
interactivity to power the dynamic behaviours of web pages. In modern
development, third-party libraries like jQuery, Angular.JS, React.JS etc. are
common in front-end. Also, having the knowledge of UI /UX helps to become as
successful frontend developer.
Back end development refers to the things that users cannot see in the browser.
Back-end mainly deals with things like databases, servers, security etc. and
maintain the core functional operations of application. Several server-side
programming languages like Node.JS, Java, C++, C#, Python, Ruby, .Net etc.
are used as a development language. Back end development also deals with
various DBMS technology. MySQL, MongoDB, Oracle, SQL Server are the
common one that are used for database and cache. Beside these, Knowledge of
web servers or API, Algorithms, Security Testing and version control system are
also important for backend developers. There are different web development
stack depending upon tools, libraries and frameworks used. LAMP (Linux,
Apache, MYSQL and PHP), MEAN (MongoDB, Express, Angular and Node.JS)
and MERN (MongoDB, Express, React and Node.JS) are the common ones that
are used by many developers. [5] Popular stacks for modern web developers are
listed below.
• Frontend – HTML, HTML5, CSS3, Bootstrap, JavaScript, jQuery, Angular,
React, Express, Redux
• Backend – Node.js, Java, Python, C++, C#, PHP, Ruby on Rails.
• Databases – MongoDB, MySQL, PostgreSQL, CouchDB, Apache
Cassandra
• Version Control – Git, Subversion, Debuggers (Xdebug, Firebug), Task
Runners (Grunt, Gulp)
• Other Major Essential Technologies – Memcached, Apache Lucene,
Apache Solr, Redis
5
3 Tools and Libraries
The application was developed by using common web application tools like
HTML5, CSS, Bootstrap and JavaScript. JavaScript was used for both front end
and back end development. jQuery, the JavaScript library was used for
performing multiple image processing technique and algorithms for the
conversion of image to area and finally to energy. OpenStreetMap was used for
displaying the map in the application.
All the tools and libraries which were used during the application development
process are explained briefly with their functionality and methods.
3.1 HTML5
HTML5, the latest version of HTML (Hypertext Mark-up Language) which is
mainly used for addressing modern needs and expectations of websites,
describing all the contents and appearance of web pages. It is called Hypertext
Mark-up Language because it helps users to organize and link all the texts and
images with data in the internet. Hypertext is a method that helps users to display
the page by clicking on a special text called hyperlinks, Mark-up is the method
where the text is marked within a HTML tags so that the computer can manipulate
those texts to perform certain action and HTML is a language that consists of
codes and syntax. [4]
HTML5 is free and easy to understand, write and use. All the modern major
devices laptops, desktops, tablets and mobile phones or browsers like Chrome,
Safari, Firebox, IE and Opera support HTML5 which makes it cross browser
compatibility. The most important fact about HTML5 is, it works and implement
effectively and easily together with CSS3.It can also easily integrate with other
multiple programming languages like JavaScript, PHP, Node, Express, Angular,
React, Java and many more. Another, important advantage of using HTML5 is,
HTML5 web applications can be easily converted to mobile application which can
use the same monetization and sharing channels as native application. [6]

6
Figure 1:Creating a HTML5 file.
The above code example is all about HTML5.The first line <!DOCTYPE html>
instructs the web browser that the document is HTML5 document. Most of the
HTML elements are written with an opening tag (<>) and a closing tag (</>) where
the content is written in between them. The <head> element provides information
about the page. <title> tag defines title of the page that appears as title on the
browser page. The <body> defines the actual content of the page like
paragraphs, links, images, tables etc. which are displayed to the user. <html>,
<head> and <body> tags make the basic skeleton of every web page.
3.2 CSS
CSS refers for Cascading Style Sheets used for adding style to the HTML
page.CSS3, the latest version of CSS adding several styling features and
improvements like rounded corners, shadows, gradients, transitions or
animations, also new layouts like multi-columns, flexible box or grid layouts. [7]
All the attributes like fonts, colours, styles, background, alignments, borders,
sizes etc. had to be explicitly described within the HTML for styling the web
page. There are lot of things we can do using CSS that are too long to explain
in detail here. It can save a lot of work and time by controlling the layout of
multiple web pages all at once. It is really easy to add style and formatting
information to the web pages using CSS. We can use CSS in an HTML

7
document in three different ways which are inline styles, embedded styles and
external style sheets.
External style sheet is common and ideal where the styles are applied to control
multiple pages on the websites. An external style sheet is a separate file that is
normally saved in external CSS file with .CSS extension. This is flexible that holds
all the style rules in an external style sheet linked with the HTML file, where we
can change the style of the whole page by changing a single CSS file. We can
attach an external style sheet to an HTML document in two ways, linking and
importing. Before linking and importing, we create style sheet coding CSS
attributes and save the file as “style.css”. External style sheet is linked using
<link> tag inside the <head> section with HTML document to style the entire web
page.
Figure 2: CSS with the external style sheet.

8
The above figure shows how the external style sheet was used along with HTML5
to style the page layout of the project to provide a unique and attractive display
to the users.
3.3 JavaScript
JavaScript, the most popular, standard and widely used client-side scripting
language for web-based applications, designed to add interactivity and dynamic
effects by manipulating the content returned from the webserver. Its importance
can be determined from the fact that over 90% of current websites are using this
language. It is more complex language in comparison with HTML5 or CSS.
JavaScript is an object-oriented language where the data source is processed by
client’s own browser than on the web server. It is an essential part of web
applications and enables interactive web pages. It doesn't have any I/O itself, but
contains APIs worked with text, dates, arrays, regular expressions and the DOM.
A website is solely composed of HTML and CSS where HTML gives the content
on the page like words, buttons, images and many more, while the CSS gives the
style and add features like colour, font size and style. Then, JavaScript comes
here to govern the HTML and CSS and enables interactivity on the website and
gives them a sense of state. JavaScript comes with lots of libraries and
frameworks. The use of modern JavaScript web development frameworks like
Node.js, Angular, View.js and libraries like React.js, jQuery has completely
changed the way how people develop web application a decade ago. Using these
libraries and frameworks, developers can develop highly interactive and
professional web applications easily, quickly and efficiently. We can even
combine multiple JavaScript frameworks and libraries to enhance and extend the
project according to the requirements. As JavaScript is an interpreted
programming language it helps to simplify complex web application by creating
DOM boundaries to simplify application composition. [10]

9
As a JavaScript library, jQuery has been implemented in the project to make the
application interactive and professional. An example for creating slide motion
effect using jQuery is shown below.
Figure 3: jQuery, JavaScript library for sliding effects.
JavaScript can also be used in the back-end of web development because
browsers have engines that can process JavaScript quickly. In back-end, it has
gained popularity because it allows the scalability needed in cloud computing and
server. It is powerfully integrated with other programming languages to
communicate with the database. Node is the most popular version of server-side
JavaScript which is highly used in creating scalable web applications, messaging
platform and multiplayer games. NASA, eBay, Google Cloud, Amazon Web
Service etc. are using Node.JS for their services. [8]
Beside building web applications, JavaScript has a large presence in other
innovation technologies and cross- platform applications. JavaScript has gain
popularity in gaming and virtual reality because of its animating properties.
Popular desktop applications like Slack, GitHub, Skype and Tidal were developed
using JavaScript framework which are working across different devices
regardless of operating system. Also, the use of JavaScript libraries with IOT
makes everyday devices smarter making the living standard higher and easier.

10
Though, JavaScript is popular and widely used it lacks some of the advance
features like file I/O and multithreading capability in comparison with other
modern programming languages. They are constantly working to meet those
requirements. ECMAScript2019, was published in June 2019 is the latest version
of JavaScript that simplifies modern web application development by providing
new additional features.
During this project, JavaScript was used for processing image obtained from the
map after fetching a polygon to draw an image over the building. It is also used
for retrieving and changing the total amount of solar energy that can be generated
dynamically according to the total usable rooftop area.
Figure 4: Stack Overflow survey, most used programming language in 2019. [9]
11
3.4 Bootstrap
Bootstrap is the most powerful, popular and free HTML, CSS and JavaScript
framework created by Twitter for developing faster and easier responsive web
sites or web applications. It is an open-source front-end framework which
includes HTML mark-up and minified CSS based design templates for creating
UI components like multi-column layout with predefined classes, navigation bar,
forms, tables, buttons, dropdowns, alert, tabs, modals and other interface
components. Bootstrap 4.3 is the latest and most stable version which is
responsive by default with a mobile first projects on the web. It is supported in all
major modern major browsers. [11]
Bootstrap is completely free and easy to download from their official website.
Compiled Bootstrap and Bootstrap source files are two available versions of
Bootstrap for downloading. Compiled version contains compiled and minified
CSS version and JavaScript files, however does not contain any JavaScript
dependencies such as jQuery and Popper.JS. This version is more effective,
using the minified version of CSS and JS files will make the performance of our
website faster. Because of lesser HTTP request and download size it saves the
precious bandwidth of website. On the other hand, the Bootstrap source files
contain original source files for all CSS and JavaScript files, along with a local
copy of docs. It is always recommended adding Bootstrap in our project via CDN
(Content Delivery Network) because multiple servers are running around the
globe so that when the user requests file it will be served from the nearest server.
This makes the performance of webpage faster by reducing loading time.

12
Figure 5: Bootstrap with HTML file.
The example above shows that Bootstrap is linked with the CDN source part.
Also, it includes JavaScript files at the bottom of the page to make the
performance of website faster and more responsive which is added inside the
<body> tag in a HTML file.
3.5 jQuery
jQuery is an open source, free, fast and concise JavaScript (JS) library developed
by John Resig in 2006 with a theme - Write less, do more. jQuery is used to
simplify HTML selecting DOM elements, navigates documents, create CSS
animation, handles events and develop Ajax applications. It is the most widely
deployed JavaScript library used by over 70% of the 10 million most popular
web sites as of May 2019.jQuery library provides simple syntax for finding,
selecting and manipulating Document Object Model (DOM) elements and adding
event handlers without calling JavaScript from HTML. It separates JavaScript
code from HTML, so we do not have to apply JavaScript event call on HTML
element. [12]
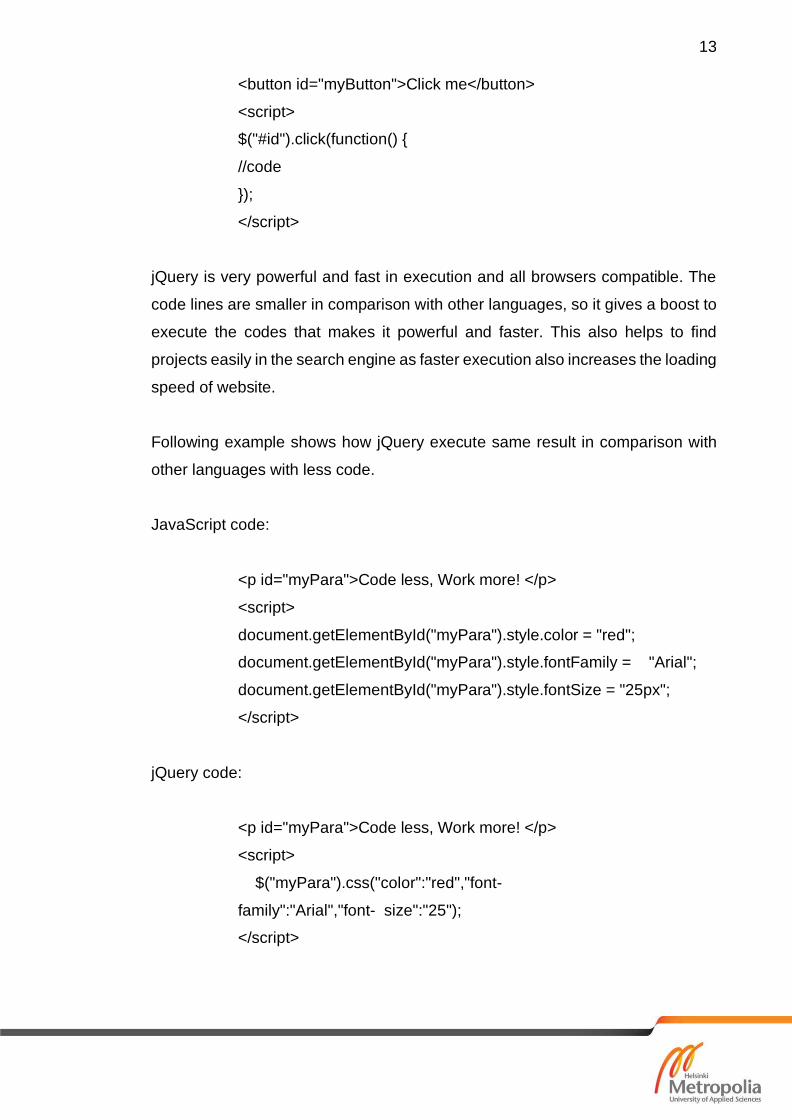
Let us take a simple example of jQuery button click function where JavaScript
onclick =”myFunction()” is not applied to display results.
13
<button id="myButton">Click me</button>
<script>
$("#id").click(function() {
//code
});
</script>
jQuery is very powerful and fast in execution and all browsers compatible. The
code lines are smaller in comparison with other languages, so it gives a boost to
execute the codes that makes it powerful and faster. This also helps to find
projects easily in the search engine as faster execution also increases the loading
speed of website.
Following example shows how jQuery execute same result in comparison with
other languages with less code.
JavaScript code:
<p id="myPara">Code less, Work more! </p>
<script>
document.getElementById("myPara").style.color = "red";
document.getElementById("myPara").style.fontFamily = "Arial";
document.getElementById("myPara").style.fontSize = "25px";
</script>
jQuery code:
<p id="myPara">Code less, Work more! </p>
<script>
$("myPara").css("color":"red","font-
family":"Arial","font- size":"25");
</script>

14
Both the above code will give the same result displaying a paragraph element red
with Arial font size of 25px.This will save developers time and reduce the cost of
project development. Being as a developer, we need to work in a team, so each
team member should know each code line, jQuery helps to make understandable
each team member with clean and simple codes.
Below example is a part of jQuery code used during the application development,
jQuery was used for dynamic rendering of data. jQuery handles data in response
to an ajax request to the server to build the application in a quick and simple way.
Figure 6: Function for finding right datatype using ajax response.

15
4 Third party plugins and tools
The following third-party plugins and tools were added to the application to
provide additional functionality and rapid development of the application.
4.1 OpenStreetMap
OpenStreetMap, also called as OSM is an editable map built by a community of
mappers that contribute and maintain data about buildings, roads, parks, stations
and many more, all over the world. It is editable map of the world which release
the map data for free use under an open license. [13] OpenStreetMap.js and
OpenLayerMap.js were used for displaying the map in the application. For now,
OSM shows only the map of Kathmandu, Nepal because the application model
was made by using the radiation data of Kathmandu only. The latitude of
Kathmandu, Nepal is 27.700769, and longitude is 85.300140. Kathmandu, Nepal
is located at Nepal country in the Cities place category with the GPS coordinates
of 27° 42' 2.7684'' N and 85° 18' 0.5040'' E. It covers total area of about 51 square
kilometres with its mean elevation of about 1350m, above sea level. The
application can be used in other locations too by changing the OSM variables
and the amount of solar radiation data that occurs in that location.
Figure 7: Function for displaying the map and zoom level.

16
4.2 Algorithms
Algorithms are mostly important in web development when we have a lot of data
that have to process or when we are performing complicated transformations on
data. The software development complexity is increasing day by day and
because every year new frameworks like Angular.js, React.js and libraries like
React.js, jQuery are released. Even a new version of JavaScript is releasing
every year, the latest one ECMAScript2019 which was just released in June
2019.This shows there is a big load for developers. Human intellectual
possibilities are impressive but limited and they cannot memorize all the new
frameworks, libraries and tools. All the programming fundamentals consist of
algorithms, data structures and programming language knowledge. The best
solution is to apply an efficient learning strategy and constantly mastering
fundamentals like algorithms and data structures.
There were three algorithms that were used in the application. Linear regression,
Thresholding and 8- Connectivity. Firstly, linear regression algorithm was used in
training the data by using manual data to find the relation between area and
image pixels (1 pixel = xm2). Secondly, thresholding algorithm was applied to find
the rooftop area of the building by drawing a polygon fetching the whole image.
The image fetched by drawing a polygon contains white and black pixels. Building
images are filled with white pixels and other non-building images like roads,
parks, lakes etc are filled with black pixels within the image. Lastly, 8-Connectivity
algorithm was used to remove unnecessary noise in an image to make result
more precious. It mainly removes the noise in boundaries. At the last step of
processing the application will count the number of white pixels in the image and
use the relation of 1 pixel = xm2 to calculate the total roof top area of buildings in
that image.

17
4.3 Working Environment
Visual Studio Code (VS Code) was used for the integration development of an
application. It is a code editor developed by Microsoft supporting wide varieties
of programming languages and set the features accordingly to the language
used. It has powerful developer tooling like IntelliSense code for debugging,
execution and completion. The source code is free and highly customizable
allowing users to change keyboard shortcuts, preferences, theme and so on that
helps developers easier to code and work. It also allows users to install
extensions and add additional functionality. It combines the simplicity of a source
editor with syntax highlighting, bracket-matching, auto-indentation, snippets, box-
selection and many more. It supports all the modern platform macOS, Linux and
Windows where we can edit, build and debug our project with ease. VS Code
supports Git, so we can control our code without leaving the editor. Also,
integrates with building and scripting tools performing common tasks to make
workflow faster and easier. VS Code includes enriched built-in support with
modern web development tools, libraries and frameworks that makes developer
build with love for the web.
18
4.4 Version Control
Git is a version control system which was created by Linus Torvalds in 2005, the
creator of Linux. It is a free and distributed open source that handles from small
to very large projects coordinating team members efficiency. GitHub is an online
platform that integrates with Git to host code online. [14] It is a web platform which
hosts code repositories. It is designed mainly for coordinating tasks among
programmers and tracking changes in the source code during application
development. It allows user to create a copy of a repository on their computer to
work on without affecting the main repository. User can modify the code and send
pull requests to tell other developers about the changes they wish to modify.
Commits are recorded during the changes in repertories which are done locally.
GitHub also helps to keep track of bugs in the code. This is the largest online
platform in the entire world where users choose to put their projects.
The application was built singly, there are no any commitment in the repository.
The application was only pushed to GitHub account after its completion.
https://github.com/sagar-aryal/rooftopsolarenergyestimator
19
5 Methodology
Estimating solar energy potential of an urban landscape of Nepal is a complex
and challenging task. Building elevation, urban densities and varying urban
morphologies combined with a lack of advanced data make the assessment
complicated. Many methodologies to overcome such complications have been
proposed and the methodology is based on complete census methodology. This
methodology relies on the computing of the entire rooftop area in the study region.
This can be performed either through existing statistical data sets that contains
building-based information such as floor area, number of floors, and the total
number of buildings, or through the use of advanced cartographic data sets that
offer a digitized model of the study region. In order to estimate rooftop PV for
urban area, an estimate of the total roof area of the study region needs to be
computed. The second step is to determine usable area from the total area that
is actually suitable for PV implementation. All of these steps mentioned above
are carried out in the software development environment using different tools and
techniques.
The application was built by using Waterfall Methodology. This model of software
development process was firstly introduced by Dr. Winston W. Royce in an article
published in 1970.The use of such phases in software development process was
done by Herbert D. Benington at Symposium on Advanced Programming
Methods for Digital Computers on 29 June 1956.It is referred as a linear
sequential life cycle model where any phase in the development process begins
only if the previous phase is complete. This methodology is very simple and easy
to use. Each phase in a life cycle is completed before the beginning of the next
phase in a life cycle and there is no any overlapping within the phases.

20
Figure 8: Waterfall Model.
5.1 Requirements
The software and system requirements phase are an important phase where all
the potential requirements of the project are captured and analysis. Basically, a
project requirements document was created from user point of view conducting
evaluations and interviews with the users. The requirements were then
analysed from different point of views, split down and detailed into functional
specifications. Since, this is the initial phase, the process is long, and the result
is typically a required document which explains what the project should do but
not how it should do.
The following requirements targets were found during the application
development.

21
• Users were expecting to have user friendly interface and responsive layout
that supports all modern devices and browsers.
• Users were interested in the visual properties of the application. The
application layout and architecture. They were expecting simple and good
looking with major functionality like the use of navigations, buttons and
tables.
• Majority of users were worried about the application performance
requirements, how big and fast is the application.
• Users would like to include maintainability, portability, security and legal
requirements in the application accordingly the change with new
environment in technology.
• Users wanted application to work manually, functioning properly and
accurately.
5.2 Design
During this second stage, technical design requirements such as project
architecture, programming languages, data layers, project layouts, services etc.
were created that outlines how the project was technically implemented.
Designing of the project was done after performing various use case testing.
Users requirements were tracked and gathered together to meet their
requirements and implement those directly during the application development.
Data was collected manually calculating the area per pixel relation from a sample
building and used in the application during training the data. Multiple image
processing tools technique and algorithms were used for the conversion of image
pixels to area. A model was made to make the application more precise with the
result to extract the actual area from the image. Net rooftop area was calculated
by using the Model which involves the process of eliminating the shading and
determining the orientation along with other major factors. Rough layout
architecture of the application was finalized and sketched. The project was done
by using a documented technique called data modelling using various diagrams
and symbols that represent the communication of data flow. The below figure
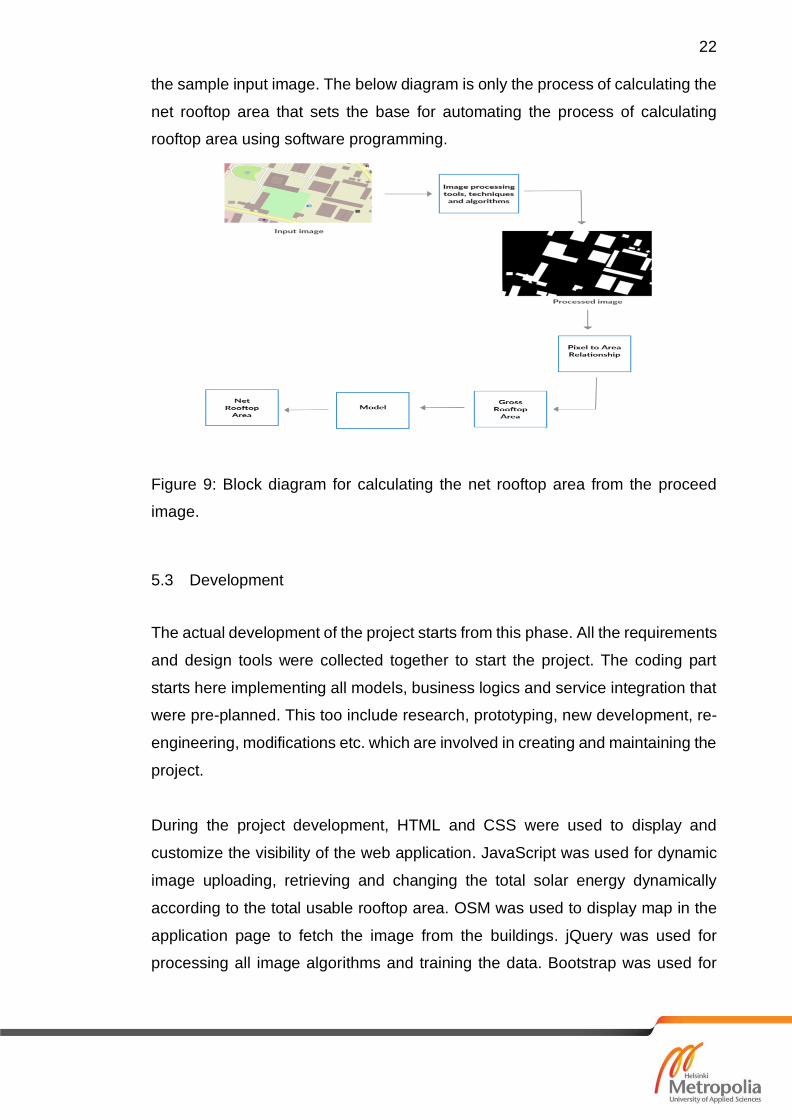
depicts the process of calculation of net rooftop area which was calculated from
22
the sample input image. The below diagram is only the process of calculating the
net rooftop area that sets the base for automating the process of calculating
rooftop area using software programming.
Figure 9: Block diagram for calculating the net rooftop area from the proceed
image.
5.3 Development
The actual development of the project starts from this phase. All the requirements
and design tools were collected together to start the project. The coding part
starts here implementing all models, business logics and service integration that
were pre-planned. This too include research, prototyping, new development, re-
engineering, modifications etc. which are involved in creating and maintaining the
project.
During the project development, HTML and CSS were used to display and
customize the visibility of the web application. JavaScript was used for dynamic
image uploading, retrieving and changing the total solar energy dynamically
according to the total usable rooftop area. OSM was used to display map in the
application page to fetch the image from the buildings. jQuery was used for
processing all image algorithms and training the data. Bootstrap was used for

23
responsive web design to make application rendering well on all devices and
operating system.
5.4 Testing
During this stage, a number of possible tests are done with the intent of finding
software bugs or errors and other faults to confirm that the product is fit to use. If
the bugs are reported, they are resolved. Interactions between the application,
web server and database server were tested to ensure the server was able to
handle all application requested queries to the database that are displayed
correctly at the client side. Compatibility testing was done to make sure that
application was functioning correctly across different browsers, operating
systems and devices. Performance testing was done to determine how the
system performs in terms of responsiveness and stability under a particular
workload. Finally, security testing was done to make sure that the application is
protected against unauthorized access and harmful actions caused by viruses or
any other malicious software.
This is mainly conducted to provide users with information about the quality of the
software product. Various testing methods were done with the users and most of
them were successful.
5.4.1 Unit Testing
Multiple unit testing was done which are as follows.
User Case 1:
• Title: Front map view.
• Precondition: Browser supports the OpenStreetMap (OSM).
• Assumption: User is using supportable browser for OSM.
Test Steps

24
• Run the application through the browser.
• The map should be displayed in the front layout with the default location
used in the application.
Expected Outcome: The map of Kathmandu City will be displayed.
User Case 2:
• Title: Display the map of desired building.
• Precondition: Browser supports the OpenStreetMap.
• Assumption: User typed the valid address of the selected building.
Test Steps:
• Enter the valid address in “Enter address here” field.
• Click Search.
Expected Outcome: The map will be redirected to entered address.
User Case 3:
• Title: Use the instructions button to see information about the use of
application.
• Precondition: Browser supports the OpenStreetMap.
• Assumption: User enter next, skip and done buttons to get information and
function of each buttons.
Test Steps:
• Click Next
• Click Back.
• Click Done.
• Click Skip.

25
Expected Output: Next will redirected to another button next to instruction button.
Back will load back to the recently button. Done and Skip will close the instruction
button. Each button will display with the information and instruction about its use.
5.4.2 System Testing
• Title: Deploying application with IOS and Android devices.
• Precondition: User enters same address in both devices.
• Assumption: Both devices calculate same result value.
Test Steps:
• Click Start.
• Draw a polygon over the building roof top.
• Click Process to display the result.
Expected Output: Application will be successfully deploying in both devices
displaying same result.
5.5 Deployment
All the tests were passed, errors and bugs were resolved, and the project was
ready for use to a live environment. The deployed application can be accessed
by browsing
https://sagar-aryal.github.io/rooftopsolarenergyestimator/App/
5.6 Maintenance
Users may find errors with the change in software environment and during
implementing new or changed user requirements which concern functional
enhancements to the software. So, continuous support and maintenance is

26
required to keep the application functional and up to date to prevent problems in
the future. The following two points were concerned about the application
maintenance for future use.
5.6.1 Adaptive Maintenance
• The solar radiation and duration of sunlight may be changed over time to
time, so admin need to update those values.
• Adding mark pinpoints feature in map and high zoom level have to be done
to make users easier to find search location in the map.
5.6.2 Corrective Maintenance
The application could be sold or deployed in future for public use and there
could be some unresolved issues that user might complains about it. The
application requires further maintenance to fix those raising issues and
problems.

27
6 Application Workflow
The application accuracy is based on the training data. There are some manual
processes that allows only developers to train the application. Linear regression
algorithm was implemented to train and find the area per pixel, relation. The user
can select the address of the building and map will be redirected to that area.
User can snip the area by drawing a polygon from the map by selecting start
button. The resulting polygon is then directed for processing the various image
algorithms. If the user enters the wrong address of the building or if the area is
sniped in wrong order, user can reset the map using reset button. Then, image
processing techniques, tools and algorithms were used to preserve rooftop image
of buildings and eliminate the other image components to give the total roof top
area.
Figure 10: Workflow of an application.
28
Meteorological data for Kathmandu City such as solar radiation and duration of
sunlight were collected from the Department of Hydrology and Meteorology
(DHM), Ministry of Environment, Science and Technology, Government of Nepal.
The total solar energy generation was calculated on the basis of solar radiation
and duration over Kathmandu Valley.
Following implementation was done to calculate the energy by using solar
radiation data for Kathmandu, Nepal.
var energy = actualArea*0.1;
var monthWise = [4.26,5.15,6.18,6.76,6.68,5.75,4.79,4.80,4.56,5.13,4.72,4.15];
for(var i=0;i<monthWise.length;i++){
$("input[id='"+i+"'").val((monthWise[i]*energy).toFixed(2))
}
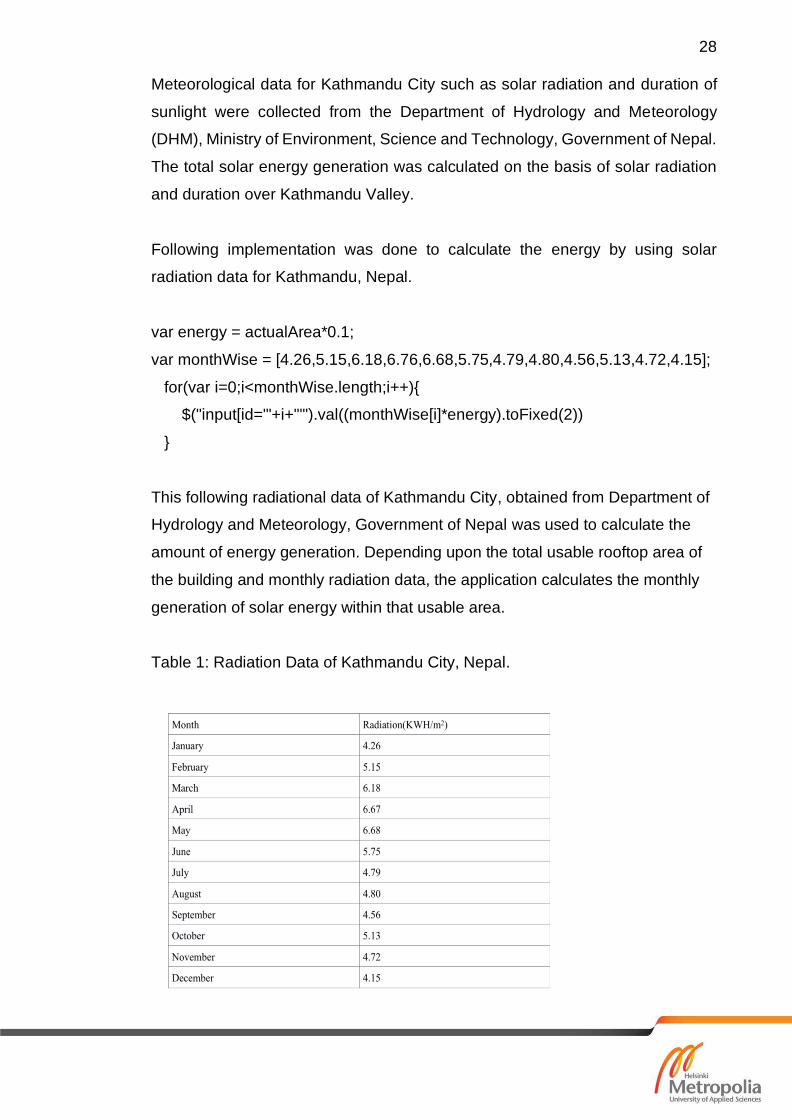
This following radiational data of Kathmandu City, obtained from Department of
Hydrology and Meteorology, Government of Nepal was used to calculate the
amount of energy generation. Depending upon the total usable rooftop area of
the building and monthly radiation data, the application calculates the monthly
generation of solar energy within that usable area.
Table 1: Radiation Data of Kathmandu City, Nepal.

29
7 Implementation and Results
The following steps were implemented to test the usability of the application which
are described below.
7.1 Fetch the rooftop image
OpenStreetMap was used to fetch the images of building as it provides the
rooftop view of the building and our algorithm also works according to the rooftop
image of the building. Users can use the search button to find the street view of
the desired building by typing the address of that building. The zoom level of the
map was made 18 because the top view of building is clearly visible within that
level. Users can set the zoom level by their choice, using + and - buttons on the
right side of the map. The image used is the top view image provided by
OpenStreetMap.
Figure 11: Street view of the buildings.

30
7.2 Start the Process
Once the rooftop view of the building is displayed, users can use the start button
to fetch the image of that selected building. The image is fetched by drawing a
polygon over the building images. The user is unable to draw a polygon before
clicking Start button. A polygon is drawn by collecting all X and Y co-ordinates of
the building. During image processing technique and algorithm, real image of the
building represents the image which is collected inside the collection of X and Y
coordinates only. Those images are called white pixels with RGB value of 255
that represents roof colour in OpenStreetMap. Everything else out of X and Y
coordinates are called as black pixels whose RGB values are set as 0.
Figure 12: Polygon drawing in the selected building on the map.

31
The following code lines shows how a polygon is drawn to fetch the roof image.
var usedLabel = [],polygonPoints = [];
var parentChild = {},matrix = {};
function startProcess(polyXPoints,polyYPoints){
for(var k=0;k<polyXPoints.length;k++){
var poly =[];
poly.push(polyXPoints[k]);
poly.push(polyYPoints[k]);
polygonPoints.push(poly);
}
var canvas = document.getElementById("destinationCanvas");
var canvasContext = canvas.getContext('2d');
var imgPixels = canvasContext.getImageData(0, 0, canvas.width,
canvas.height);
var neighBorPixels = [[-1,-1],[0,-1],[1,-1],[-1,1],[1,0],[-
1,1],[0,1],[1,1]];
for(var y = 0; y < imgPixels.height; y++){
for(var x = 0; x < imgPixels.width; x++){
var point = [x,y];
if(inside(point,polygonPoints)){
var i = (y * 4) * imgPixels.width + x * 4;
var avg = Math.round((imgPixels.data[i] + imgPixels.data[i
+ 1] + imgPixels.data[i + 2]) / 3);
if(avg==239){
var goodNeighbor = true;
for(var n=0;n<neighBorPixels.length;n++){
var newX = x+neighBorPixels[n][0];
var newY = y+neighBorPixels[n][1];
var j = (newY * 4) * imgPixels.width + newX * 4;

32
avg = Math.round((imgPixels.data[j] + imgPix
els.data[j + 1] + imgPixels.data[j + 2]) / 3);
if(avg!=239){
goodNeighbor = false;
break;
}
}
if(goodNeighbor){
matrix[x + "," + y] = 1;
}else{
matrix[x + "," + y] = 0;
}
}
}else{
matrix[x + "," + y] = 0;
}
}
}
7.3 Reset the Process
Reset button was used to redraw the polygon if the user does not get the
appropriate selection of an image in the map. Clicking the reset button, map
returns back to its original position.
7.4 Process the image
After a polygon is drawn over the building, polygon is converted to image which
is later converted to area. Linear regression is used to calculate the number of
pixels within the images. Then the image is processed to filter other unnecessary
component and extract only the rooftop view using the image processing
technique, tools and algorithms. Threshold algorithms help to determine the total
rooftop area of that image which calculates the total rooftop area of the selected

33
building. 8-neighbouring pixels connectivity was to remove unnecessary noise
within the image after thresholding process. It removes black pixels in the image
so that building counting and area calculation are more precise.
Three major algorithms that were used for image processing are described as
follows.
7.4.1 Linear Regression
Linear regression algorithm was used in training the data to find the relation
between area in meter square per pixel. Firstly, the sample data of building was
taken manually by measuring the total roof top area of the building and drawing
the polygon over it to find the total number of pixels.
The detail process for finding pixel to area relationship is shown below.
• Collect area of number of houses.
• Calculate number of pixels of above houses using open street map.
Relation:
y = theta (1) + theta (2) * x;
where x denotes the number of pixels and y is the area in meter
square.
Finding theta (1) and theta (2) using training data, we got the Pixel Area relation.
Training Process:
m = length(x)
theta_zero = 0
theta_one = 1
for iter = 1:num_iters
h = theta_zero+ theta_one*x);
34
theta_zero = theta(1) - alpha * (1/m) * sum(h-y);
theta_one = theta(2) - alpha * (1/m) * sum((h - y) .* x);
end
7.4.2 Thresholding
Threshold algorithm was used to detect the rooftop area of the building from the
fetched image. Each building rooftop area contains some fixed pixel intensity
value. The intensity value of image was compared with the fixed values. If both
of the values were matched, the pixel intensity was set to be 255 otherwise to 0.
The resulting image will be the image that contains only the white and black
pixels. White pixel helps to indicate the rooftop of buildings and the black pixel
indicates the rest of the components.
Pseudo Code:
If(intensityOfImage[i][j]==fixedValue)
set intensity[i][j]=255;
else
set intensity[i][j]=0;
where I and J gives the row and column position of the image.
7.4.3 8-Connectivity
8-Connectivity image processing algorithm was implemented to identify the
number of buildings inside the polygon. Since, the 8-Connectivity algorithm treats
two buildings as one building when they are attached in the map, erosion and
dilation algorithm was applied to increase the accuracy.
Application implementation assumption for erosion and dilation:
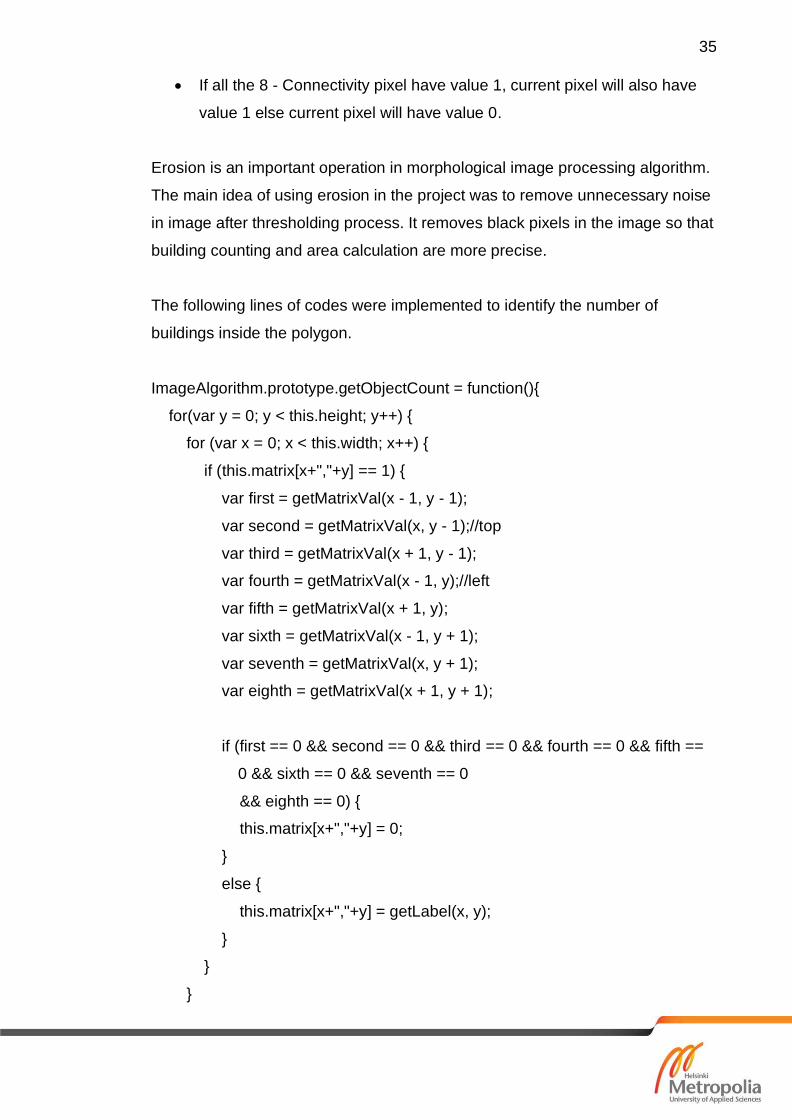
35
• If all the 8 - Connectivity pixel have value 1, current pixel will also have
value 1 else current pixel will have value 0.
Erosion is an important operation in morphological image processing algorithm.
The main idea of using erosion in the project was to remove unnecessary noise
in image after thresholding process. It removes black pixels in the image so that
building counting and area calculation are more precise.
The following lines of codes were implemented to identify the number of
buildings inside the polygon.
ImageAlgorithm.prototype.getObjectCount = function(){
for(var y = 0; y < this.height; y++) {
for (var x = 0; x < this.width; x++) {
if (this.matrix[x+","+y] == 1) {
var first = getMatrixVal(x - 1, y - 1);
var second = getMatrixVal(x, y - 1);//top
var third = getMatrixVal(x + 1, y - 1);
var fourth = getMatrixVal(x - 1, y);//left
var fifth = getMatrixVal(x + 1, y);
var sixth = getMatrixVal(x - 1, y + 1);
var seventh = getMatrixVal(x, y + 1);
var eighth = getMatrixVal(x + 1, y + 1);
if (first == 0 && second == 0 && third == 0 && fourth == 0 && fifth ==
0 && sixth == 0 && seventh == 0
&& eighth == 0) {
this.matrix[x+","+y] = 0;
}
else {
this.matrix[x+","+y] = getLabel(x, y);
}
}
}

36
}
Object.keys(this.parentChild).forEach(function (key) {
var childList = this.parentChild[key];
var otherKeys = Object.keys(this.parentChild);
otherKeys.forEach(function (k) {
if(key!=k){
if(itemExist(k, childList))
delete this.parentChild[k];
}
});
});
return Object.keys(this.parentChild).length
};
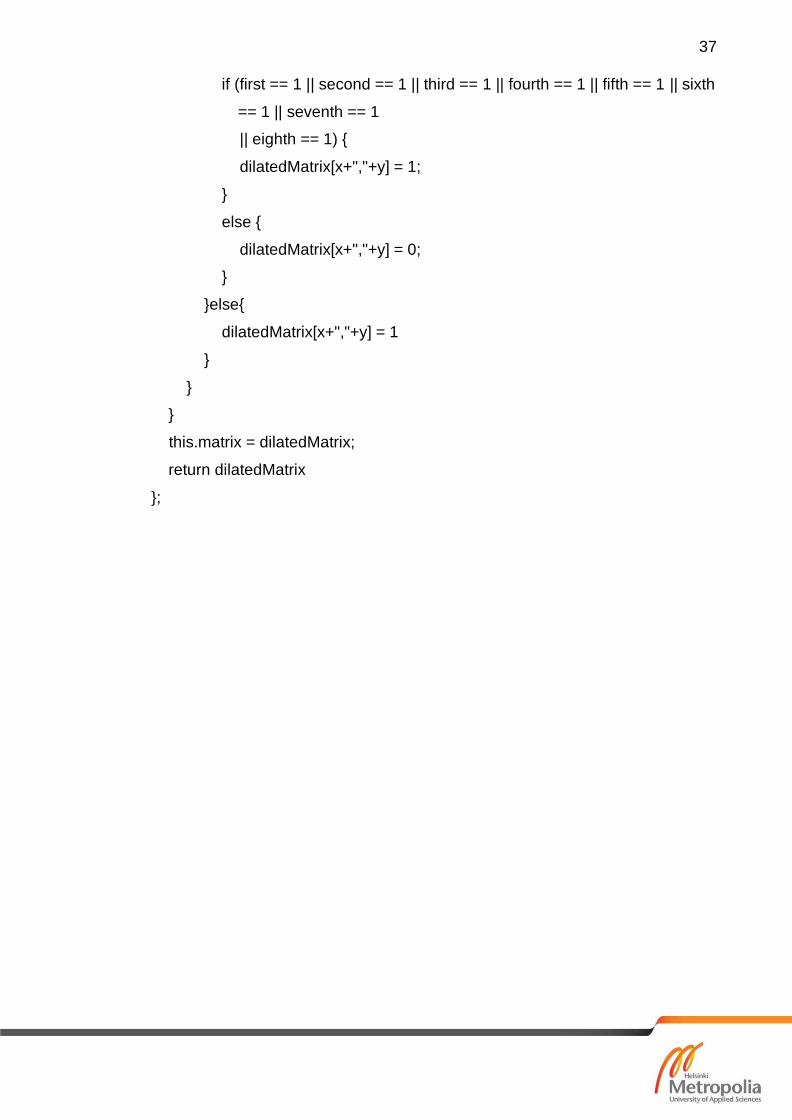
The erosion process set the entire boundary pixel to value 0 as they surely have
one neighbourhood pixel with value 0. So, we have to restore those boundary
points. The dilation process will restore those points as shown below.
ImageAlgorithm.prototype.dilation = function(){
var dilatedMatrix = {};
for(var y = 0; y < this.height; y++) {
for (var x = 0; x < this.width; x++) {
if (this.matrix[x+","+y] == 0) {
var first = getMatrixVal(x - 1, y - 1);
var second = getMatrixVal(x, y - 1);//top
var third = getMatrixVal(x + 1, y - 1);
var fourth = getMatrixVal(x - 1, y);//left
var fifth = getMatrixVal(x + 1, y);
var sixth = getMatrixVal(x - 1, y + 1);
var seventh = getMatrixVal(x, y + 1);
var eighth = getMatrixVal(x + 1, y + 1);
37
if (first == 1 || second == 1 || third == 1 || fourth == 1 || fifth == 1 || sixth
== 1 || seventh == 1
|| eighth == 1) {
dilatedMatrix[x+","+y] = 1;
}
else {
dilatedMatrix[x+","+y] = 0;
}
}else{
dilatedMatrix[x+","+y] = 1
}
}
}
this.matrix = dilatedMatrix;
return dilatedMatrix
};
38
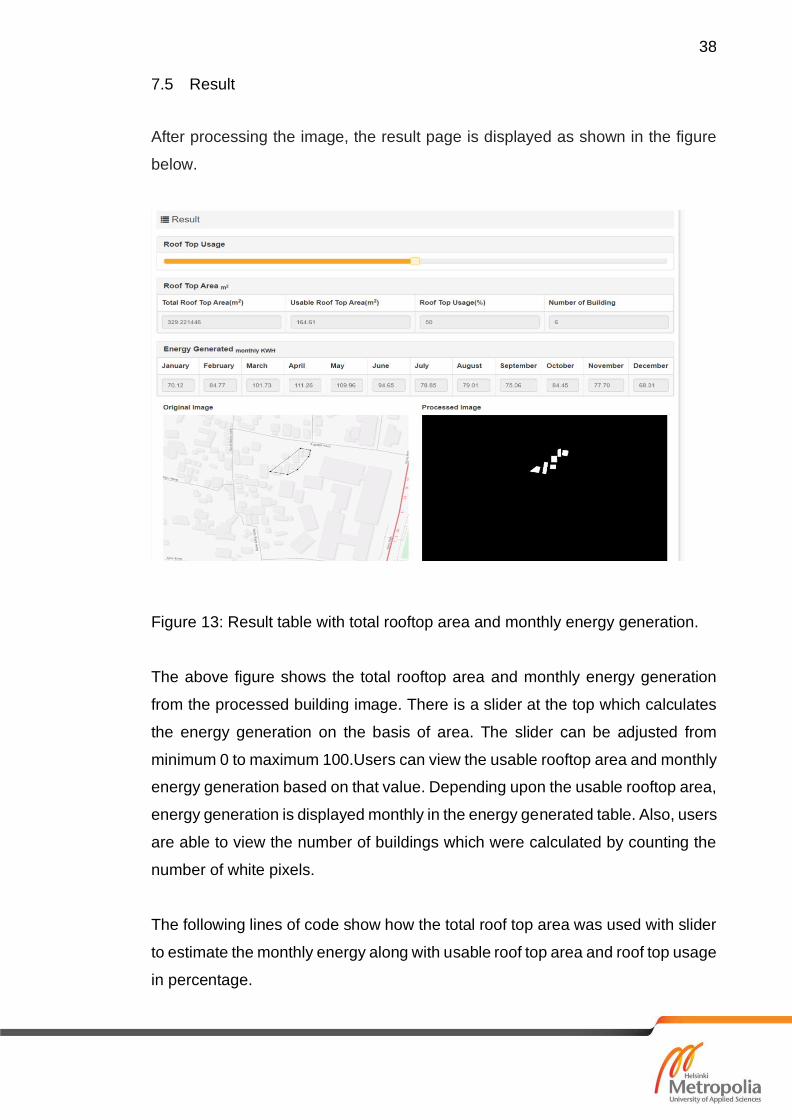
7.5 Result
After processing the image, the result page is displayed as shown in the figure
below.
Figure 13: Result table with total rooftop area and monthly energy generation.
The above figure shows the total rooftop area and monthly energy generation
from the processed building image. There is a slider at the top which calculates
the energy generation on the basis of area. The slider can be adjusted from
minimum 0 to maximum 100.Users can view the usable rooftop area and monthly
energy generation based on that value. Depending upon the usable rooftop area,
energy generation is displayed monthly in the energy generated table. Also, users
are able to view the number of buildings which were calculated by counting the
number of white pixels.
The following lines of code show how the total roof top area was used with slider
to estimate the monthly energy along with usable roof top area and roof top usage
in percentage.

39
function displayResult(area){
$("#totalArea").val(area);
$("#slider-3").slider({
range:"min",value:0,
min: 0,
max: 100,
slide: function( event, ui ) {
// $( "#usage" ).val(ui.values[1]);
$( "#usage" ).val(ui.value);
changeVals(area);
}
});
}
function changeVals(area){
var area = area
var use = $("#usage").val();
var actualArea = area*(use/100);
$("#usageAreaIs").val(actualArea.toFixed(2));
var energy = actualArea*0.1;
var monthWise =
[4.26,5.15,6.18,6.76,6.68,5.75,4.79,4.80,4.56,5.13,4.72,4.15];
for(var i=0;i<monthWise.length;i++){
$("input[id='"+i+"'").val((monthWise[i]*energy).toFixed(2))
}
}
function disposeAllVariable(){
usedLabel = [];
polygonPoints = [];
parentChild = {};
matrix = {};
console.log("Cleared all used resources.")
}

40
8 User Friendly Interface
The application has two interfaces, one for the homepage and the other for
results. When the implementation is done the result is displayed below the home
page.
Figure 14: The home page of the application.
Logos of AEPC, UNDP and GEF are added to the header to attract user attention
and curiosity with the application. This will help users to increase application
brand recognition and idea what the application is all about. The instruction button
is added to the main page that provides information about the application,
explaining briefly all other buttons and their functions for getting an idea of using
the application.
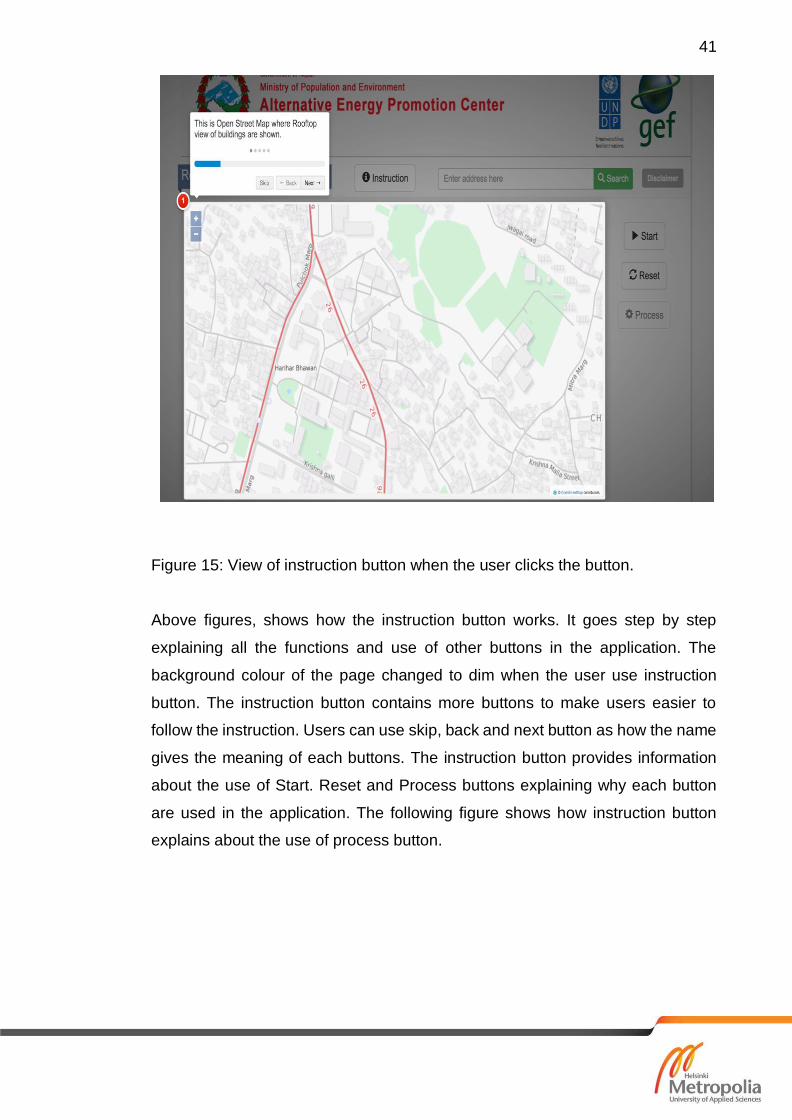
41
Figure 15: View of instruction button when the user clicks the button.
Above figures, shows how the instruction button works. It goes step by step
explaining all the functions and use of other buttons in the application. The
background colour of the page changed to dim when the user use instruction
button. The instruction button contains more buttons to make users easier to
follow the instruction. Users can use skip, back and next button as how the name
gives the meaning of each buttons. The instruction button provides information
about the use of Start. Reset and Process buttons explaining why each button
are used in the application. The following figure shows how instruction button
explains about the use of process button.

42
Figure 16: Instruction button explaining the function of Process button.
Users can navigate to the desired location on the map. In-order to navigate to the
desired location users need to type the address of the location and click the
search button. The OpenStreetMap will display with the desire location. Start
button allows the user to draw the polygon over the required roof as per the user’s
choice. In order to draw the polygon, users first need to click the start button.
Reset button is used to reset the polygon if the user is unable to draw the
appropriate selection of the buildings. The map returns back to its original state
after clicking reset. After the user draws the polygon, process button is clicked to
get the desired result that gives the total roof area of the selected building.

43
Figure 17:The result page of the application.
The above result was taken from the OpenStreetMap which represents building
9 located in Kantipath Ratnapark, Kathmandu Nepal. The exact area calculated
by using drone was 109.32-meter square. The result shows that the deviation
was found to be only 3.24%. This proves that the application is functional and
accurate. Also, the original image and process image were shown down at the
bottom of the result page that helps users to count the number of buildings which
are called white pixels straight from the processed image.

44
The result layout contains slider and tables which makes the application more
user friendly. The application supports all the modern devices and browsers.
They can install in any devices and use from desire locations as their wish.
Figure 18: Application showing Mobile Compatibility with iOS and Android.

45
9 Discussion
The thesis was done in two parts. Firstly, the meteorological data for Kathmandu
City such as solar radiation and duration of the sunshine were studied and
collected. Secondly, various tools, libraries, frameworks, algorithms and
technologies related to the project were studied in depth to sharpen knowledge
and ideas and finally implement to develop a suitable functional web application.
It took around three months to go deep learning with tools and technologies and
two months to complete the application.
There are couple of limitations in the application. The zoom level of
OpenStreetMap cannot go above 19 and below 17. The location can only be
searched through the Kathmandu city only. When the user searched the location,
the exact location of the building does not get marked with pin point in the map
that might makes user hard to find the right building. While drawing polygon over
the building in the OSM, if the building is halved drawn it would be considered as
one.
Finally, the project was able to calculate the rooftop area of the building from
searched locations that calculates the total roof top area, usable area and
monthly solar energy that can be generated from that building. The application
was estimating the total area of the roof, not the usable roof top area. The result
obtained by running the application was satisfiable and has accuracy of +8% or -
8%. The training data relation obtained after applying linear regression algorithm
shows 1 pixel equals 0.3679m2 and this relation between pixel and area was
quite precious with the data used during application development. As for now, the
application only calculates the total roof top area of the building and all the rooftop
area is not usable because of building deviation and other factors that might
change the solar radiation duration in the building. If sampling is done by applying
deviation algorithms for buildings about how much area is really usable, this
problem might be solved. This will help to give more accurate result to calculate
generated solar energy for all buildings. Beside these, the application could built
by applying more accurate noise removing algorithms, as 8–connectivity
algorithm works partially to remove noises from the image. If all these

46
recommendations are implemented, the application will work more accurately
and effectively.
The application was built by using old web technologies beside using modern
web stack to provide a simple and functional layout. The project could be done
more professional by adding modern stack tools, frameworks, libraries and third-
party plugins and worldwide OSM that could work for any searched area around
the world.

47
10 Conclusion
The main objective of the thesis was to build a web application for estimating the
total rooftop area of the building and the monthly solar energy that can be
generated from that building usable area. The OpenStreetMap as source for
capturing the area was working effectively to fetch the image from the map. The
project was successfully completed at the end. The thesis discusses all the
materials, contents and methodology that were applied during the application
build up and each of them are explained briefly to provide the reader clear
information about the application. The thesis provides the basic information about
web development, its methodology, tools and libraries used and also provide a
guide to new developers about application build up process. The project is
purpose to launch for Government of Nepal, Minister of Population and
Environment and Minister of Environment and Technology in the near future
adding additional features by making an application fully functional and user-
friendly.
Overall, the application is successfully completed as it was proposed. The
application is valuable and operationally feasible, as it can replace the manual
working mechanism that required numbers of manpower to visit the field and then
calculate the area of each building of houses with higher risks. For sure, this
application will reduce the cost and time that take to perform this process. The
application will motivate the users to implement the project in their home or office
building and saves environment and planet by using solar energy as a renewable
source of energy.
48
References
1 Cbs.gov.np. (2018). Central Bureau of Statistics – Central Bureau of
Statistics. [online] Available at: https://cbs.gov.np/ [Accessed 8 Aug. 2019].
2 Regmi S, Adhikary S. Solar Energy Potential in Kathmandu Valley, Nepal
[Internet].
https://www.researchgate.net/publication/307532682_Solar_Energy_Pote
ntial_in_Kathmandu_Valley_Nepal/citation/download. 2012 [cited 8 August
2019]. Available from:
https://www.researchgate.net/publication/307532682_Solar_Energy_Pote
ntial_in_Kathmandu_Valley_Nepal
3 Devsaran. (2018). From History of Web Application Development. [online]
Available at: https://www.devsaran.com/blog/history-web-application-
development [Accessed 2 Aug. 2019].
4 Shannon R. What is HTML? | Hyper Text Markup Language explained
[Internet]. Yourhtmlsource.com. 2019 [cited 3 August 2019]. Available
from: https://www.yourhtmlsource.com/starthere/whatishtml.html
5 The full stack web development [Internet]. udemy. 2019 [cited 5 October
2019]. Available from: https://www.udemy.com/course/the-full-stack-web-
development/
6 What is HTML5? | How IT Works | Features | Advantages &
Disadvantages [Internet]. EDUCBA. 2019 [cited 18 August 2019].
Available from: https://www.educba.com/what-is-html5/
7 CSS3 [Internet]. MDN Web Docs. 2019 [cited 21 August 2019]. Available
from: https://developer.mozilla.org/en-US/docs/Archive/CSS3
8 JavaScript: How Did It Get So Popular? [Internet]. Codecademy News.
2019 [cited 24 August 2019]. Available from:
https://news.codecademy.com/javascript-history-popularity/

49
9 Stack Overflow Developer Survey 2019 [Internet]. Stack Overflow. 2019
[cited 24 August 2019]. Available from:
https://insights.stackoverflow.com/survey/2019#technology
10 Toledo J. Why Millions of Developers use JavaScript for Web Application
Development? [Internet]. Torque. 2018 [cited 25 August 2019]. Available
from: https://torquemag.io/2018/06/why-millions-of-developers-use-
javascript-for-web-application-development/
11 Bootstrap 4 Tutorial - An Ultimate Guide for Beginners [Internet].
Tutorialrepublic.com. 2019 [cited 30 August 2019]. Available from:
https://www.tutorialrepublic.com/twitter-bootstrap-tutorial/
12 10 of the Most Popular JavaScript Frameworks & Libraries for Web
Development in 2019 [Internet]. Medium. 2016 [cited 3 September 2019].
Available from: https://medium.com/javarevisited/10-of-the-most-popular-
javascript-frameworks-libraries-for-web-development-in-2019-
a2c8cea68094
13 LearnOSM [Internet]. Learnosm.org. 2015 [cited 10 September 2019].
Available from: https://learnosm.org/en/beginner/start-osm/
14 Git [Internet]. Git-scm.com. 2019 [cited 25 December 2019]. Available
from: https://git-scm.com/