Web and Network - pearsoncmg.comptgmedia.pearsoncmg.com/images/9780133886443/samplepages/... · is...
32
Transcript of Web and Network - pearsoncmg.comptgmedia.pearsoncmg.com/images/9780133886443/samplepages/... · is...


Web and NetworkData Science
Modeling Techniques in Predictive Analytics
THOMAS W. MILLER

Editor-in-Chief: Amy NeidlingerExecutive Editor: Jeanne GlasserOperations Specialist: Jodi KemperCover Designer: Alan ClementsManaging Editor: Kristy HartProject Editor: Andy BeasterSenior Compositor: Gloria SchurickManufacturing Buyer: Dan Uhrig
c�2015 by Thomas W. MillerPublished by Pearson Education, Inc.Upper Saddle River, New Jersey 07458
Pearson offers excellent discounts on this book when ordered in quantity for bulkpurchases or special sales. For more information, please contact U.S. Corporate andGovernment Sales, 1-800-382-3419, [email protected]. For salesoutside the U.S., please contact International Sales at [email protected].
Company and product names mentioned herein are the trademarks or registeredtrademarks of their respective owners.
All rights reserved. No part of this book may be reproduced, in any form or by anymeans, without permission in writing from the publisher.
Printed in the United States of America
First Printing December 2014
ISBN-10: 0-13-388644-1ISBN-13: 978-0-13-388644-3
Pearson Education LTD.Pearson Education Australia PTY, Limited.Pearson Education Singapore, Pte. Ltd.Pearson Education Asia, Ltd.Pearson Education Canada, Ltd.Pearson Educacin de Mexico, S.A. de C.V.Pearson Education—JapanPearson Education Malaysia, Pte. Ltd.Library of Congress Control Number: 2014956958

Contents
Preface v
Figures ix
Tables xi
Exhibits xiii
1 Being Technically Inclined 1
2 Delivering a Message Online 13
3 Crawling and Scraping the Web 25
4 Testing Links, Look, and Feel 43
5 Watching Competitors 55
6 Visualizing Networks 69
7 Understanding Communities 95
8 Measuring Sentiment 119
9 Discovering Common Themes 171
iii

iv Web and Network Data Science
10 Making Recommendations 201
11 Playing Network Games 223
12 What’s Next for the Web? 233
A Data Science Methods 237
A.1 Databases and Data Preparation 240
A.2 Classical and Bayesian Statistics 242
A.3 Regression and Classification 245
A.4 Machine Learning 250
A.5 Data Visualization 252
A.6 Text Analytics 253
B Primary Research Online 261
C Case Studies 281
C.1 E-Mail or Spam? 281
C.2 ToutBay Begins 284
C.3 Keyword Games: Dodgers and Angels 288
C.4 Enron E-Mail Corpus and Network 291
C.5 Wikipedia Votes 292
C.6 Quake Talk 294
C.7 POTUS Speeches 295
C.8 Anonymous Microsoft Web Data 296
D Code and Utilities 297
E Glossary 313
Bibliography 321
Index 351

Preface
“Scotty, beam me up.”
—WILLIAM SHATNER AS CAPTAIN KIRK INStar Trek IV: The Voyage Home (1986)
The web is a network of linked pages. The web is a communication medium.The web is the locus of the world’s information. We spend much of our timesearching the web, extracting relevant data, and analyzing those data. Ourlives are easier when we can work efficiently on the web. This book showshow.
The book emerged from a course I teach at Northwestern University. Thecourse started as an introduction to website analytics, looking at usagestatistics and performance in search. Then I added concepts from networkscience and social media. After teaching the course for two years, I realizedthat gathering information from the web provided a unifying theme. Thereis much to learn about web and network data science. This book, like thecourse, provides a guide.
Web and network data science is data science and network science com-bined, focusing on the web as an information resource. And the best way tolearn about it is to work through examples. We include many examples inthis book. We help researchers and analysts by providing a ready resourceand reference guide for modeling techniques. We show programmers howto build on a foundation of code that works to solve real business problems.
v

vi Web and Network Data Science
The truth about what we do is in the programs we write. It is there foreveryone to see and for some to debug. To promote student learning, eachprogram includes step-by-step comments and suggestions for taking theanalysis further. Data sets and computer programs are available from thebook’s website at http://www.ftpress.com/miller/.
Python gets its name from Monty Python. We see packages with deviousnames such as Twisted and Scrapy. R has its lubridate and zoo. Good thingscome from people who work and have fun at the same time. It is fun ratherthan profit or fame that motivates contributors to open source, and I amhappy to be part of the Python and R communities. Let the fun begin.
When working on web and network problems, some things are more easilyaccomplished with Python, others with R. And there are times when it isgood to offer solutions in both languages, checking one against the other.Together, Python and R are good at gathering web and network data andanalyzing those data.
There is a long list of programming tools we mention only in passing. Webmasters, charged with the task of making things happen on the web, rely onadditional languages and technologies, including JavaScript, Apache and.Net web services, and database systems. We discuss these technologiesbut do not provide programming code.
Most of the data in the book were obtained from public domain data sources.Supporting data for the cases come from the University of California–IrvineMachine Learning Repository and the Stanford Large Network Dataset Col-lection. Movie information was obtained courtesy of The Internet MovieDatabase, used with permission. IMDb movie reviews data were organizedby Andrew L. Mass and his colleagues at Stanford University. William W.Cohen of Carnegie Mellon University maintains the data for the Enron case.Maksim Tsvetovat maintains the data for the Quake Talk case. We are mostthankful to these scholars for providing access to rich data sets for research.
Many have influenced my intellectual development over the years. Therewere those good thinkers and good people, teachers and mentors for whomI will be forever grateful. Sadly, no longer with us are Gerald Hahn Hinklein philosophy and Allan Lake Rice in languages at Ursinus College, andHerbert Feigl in philosophy at the University of Minnesota. I am also mostthankful to David J. Weiss in psychometrics at the University of Minnesota

Preface vii
and Kelly Eakin in economics, formerly at the University of Oregon. Goodteachers—yes, great teachers—are valued for a lifetime.
Thanks to Stan Narusiewcz who gave me my first job in business as a net-work engineer and to Tom Obinger who showed me how to be successfulin selling computer systems as well as networks. Along with Bill JoBushand Brian Hill, they served as able managers and colleagues across variousparts of my career as an information systems professional.
Thanks to Michael L. Rothschild, Neal M. Ford, Peter R. Dickson, and JanetChristopher who provided invaluable support during our years together atthe University of Wisconsin–Madison. I am most grateful to the studentsand executive advisory board members of the A. C. Nielsen Center for Mar-keting Research and to Jeff Walkowski and Neli Esipova who worked withme in exploring online surveys and focus groups when those methods werejust starting to be used for primary research.
I am fortunate to be involved with graduate distance education at North-western University’s School of Professional Studies. Thanks to Glen Fogerty,who offered me the opportunity to teach and take a leadership role in thepredictive analytics program at Northwestern University. Thanks to col-leagues and staff who administer this exceptional graduate program. Andthanks to the many students and fellow faculty from whom I have learned.
ToutBay is an emerging firm in the data science space. With co-founderGreg Blence, I have great hopes for growth in the coming years. Thanksto Greg for joining me in this effort and for keeping me grounded in thepractical needs of business. Academics and data science models can takeus only so far. Eventually, to make a difference, we must implement ourideas and models, sharing them with one another.
I live in California, four miles north of Dodger Stadium, teach for North-western University in Evanston, Illinois, and direct product developmentat ToutBay, a data science firm in Tampa, Florida. Such are the benefits of agood Internet connection.
Amy Hendrickson of TEXnology Inc. applied her craft, making words, ta-bles, and figures look beautiful in print—another victory for open source.Thanks to Donald Knuth and the TEX/LATEX community for their contribu-tions to this wonderful system for typesetting and publication.

viii Web and Network Data Science
The book draws on materials developed for the web and network data sci-ence course at Northwestern University. Students from that course pro-vided ideas and inspiration. Lorena Martin reviewed the book and pro-vided much needed feedback. Candice Bradley served dual roles as a re-viewer and copyeditor. I am most grateful for their help and encourage-ment. Thanks also to my editor, Jeanne Glasser Levine, and publisher, Pear-son/FT Press, for making this book possible. Any writing issues, errors, oritems of unfinished business, of course, are my responsibility alone.
My good friend Brittney and her daughter Janiya keep me company whentime permits. And my son Daniel is there for me in good times and bad, afriend for life. My greatest debt is to them because they believe in me.
Thomas W. MillerGlendale, CaliforniaNovember 2014

Figures
1.1 Worldwide Web Browser Usage 51.2 Web and Network Data Science: Online Research Process 62.1 Browsers Used by Website Visitors 152.2 Operating Systems Used by Website Visitors 152.3 Website Traffic Analysis 172.4 Sankey Diagram of Home Page Scrolling 183.1 Framework for Automated Data Acquisition 285.1 Competitive Intelligence: Spirit Airlines Flying High 626.1 A Simple Star Network 716.2 A Simple Circle Network 726.3 A Simple Line Network 726.4 A Clique or Fully Connected Network 736.5 Cannot See the Tree from the Links 746.6 Four Views of an Ego-Centric Network 766.7 An Ego-Centric Network 776.8 Four Views of the Most Active Members of a Community 786.9 Identifying the Most Active Members of a Community 796.10 Cliques and Core Members of a Community 807.1 A Random Graph 987.2 Network Resulting from Preferential Attachment 987.3 Building the Baseline for a Small World Network 997.4 A Small-World Network 1007.5 Degree Distributions for Network Models 1017.6 Alternative Measures of Centrality are Positively Correlated 1048.1 A Few Movie Reviews According to Tom 1228.2 A Few More Movie Reviews According to Tom 1238.3 Fifty Words of Sentiment 1248.4 List-Based Text Measures for Four Movie Reviews 126
ix

x Web and Network Data Science
8.5 Scatter Plot of Text Measures of Positive and Negative Sentiment 1278.6 Word Importance in Classifying Movie Reviews as Thumbs-Up or
Thumbs-Down 1318.7 A Simple Tree Classifier for Thumbs-Up or Thumbs-Down 1329.1 Mapping the Presidents from Their Own Words 1749.2 Word Cloud for John F. Kennedy Speeches 1789.3 Word Cloud for Lyndon B. Johnson Speeches 1789.4 Word Cloud for Richard M. Nixon Speeches 1799.5 Word Cloud for Gerald R. Ford Speeches 1799.6 Word Cloud for Jimmy Carter Speeches 1809.7 Word Cloud for Ronald Reagan Speeches 1809.8 Word Cloud for George Bush Speeches 1819.9 Word Cloud for William J. Clinton Speeches 1819.10 Word Cloud for George W. Bush Speeches 1829.11 Word Cloud for Barack Obama Speeches 18210.1 Most Frequently Visited Website Areas 20610.2 Association Rule Support and Confidence 20710.3 Association Rule Antecedents and Consequents 20811.1 Network Modeling Techniques 224A.1 Evaluating the Predictive Accuracy of a Binary Classifier 247A.2 Linguistic Foundations of Text Analytics 254A.3 Creating a Terms-by-Documents Matrix 257B.1 Participant and Moderator Time Lines for a Real-Time
(Synchronous) Focus Group 269B.2 Participant and Moderator Time Lines for a Bulletin Board
(Asynchronous Focus Group) 272B.3 Participant Time Lines for a Synchronous Focused Conversation 277B.4 Participant Time Lines for an Asynchronous Focused
Conversation 277

Tables
1.1 Worldwide Web Browser Usage Percentages (2008–2014) 52.1 Website Home Page Scrolling 183.1 Web Addresses for a Focused Crawl 274.1 Search Engine Ranking Factors 485.1 Competitive Intelligence Sources for Spirit Airlines 608.1 List-Based Sentiment Measures from Tom’s Reviews 1258.2 Accuracy of Text Classification for Movie Reviews (Thumbs-Up or
Thumbs-Down) 1298.3 Random Forest Text Measurement Model Applied to Tom’s Movie
Reviews 13010.1 Most Frequently Visited Website Areas and Descriptions 205C.1 Data Coding: E-mail or Spam? 283C.2 ToutBay Begins: Website Data 287C.3 Data Dictionary for Keyword Games: Dodgers versus Angels 290C.4 Top Sites on the Web, September 2014 293
xi

This page intentionally left blank

Exhibits
1.1 Analysis of Browser Usage (Python) 91.2 Analysis of Browser Usage (R) 102.1 Website Traffic Analysis (R) 203.1 Extracting and Scraping Web Site Data (Python) 303.2 Extracting and Scraping Web Site Data (R) 323.3 Simple One-Page Web Scraper (Python) 333.4 Crawling and Scraping while Napping (Python) 364.1 Identifying Keywords for Testing Performance in Search (R) 515.1 Competitive Intelligence: Spirit Airlines Financial Dossier (R) 636.1 Defining and Visualizing Simple Networks (Python) 836.2 Defining and Visualizing Simple Networks (R) 876.3 Visualizing Networks—Understanding Organizations (R) 917.1 Network Models and Measures (R) 1107.2 Methods of Sampling from Large Networks (R) 1158.1 Sentiment Analysis and Classification of Movie Ratings (Python) 1358.2 Sentiment Analysis and Classification of Movie Ratings (R) 1519.1 Discovering Common Themes: POTUS Speeches (Python) 1839.2 Making Word Clouds: POTUS Speeches (R) 1929.3 From Text Measures to Text Maps: POTUS Speeches (R) 19710.1 From Rules to Recommendations: The Microsoft Case (R) 21111.1 Analysis of Agent-Based Simulation (Python) 22911.2 Analysis of Agent-Based Simulation (R) 231D.1 Evaluating Predictive Accuracy of a Binary Classifier (Python) 300D.2 Text Measures for Sentiment Analysis (Python) 301D.3 Summative Scoring of Sentiment (Python) 303D.4 Split-plotting Utilities (R) 304D.5 Correlation Heat Map Utility (R) 307D.6 Utilities for Spatial Data Analysis (R) 308
xiii

xiv Web and Network Data Science
D.7 Word Scoring Code for Sentiment Analysis (R) 309

1Being Technically Inclined
“Why don’t you come up sometime and see me?”
—MAE WEST AS LADY LOU IN She Done Him Wrong (1933)
I began my business career working as a network engineer in Roseville,Minnesota. Just out of graduate training in statistics at the University ofMinnesota, I was well schooled in math and models but lacking businessunderstanding. It did not take long to learn that success in my job meantcoming up with meaningful answers for management.
In the dial-up and leased-line world of the late 1970s, asynchronous, bisyn-chronous, and synchronous connections ruled the day. We translated net-work protocols into polling and message bits and noted the bits per secondthat each communication line could accommodate. Queuing theory anddiscrete event simulation guided the analysis.
A bank teller would make a request, hitting the return key at a terminal. Theterminal was connected to a control unit, which in turn was connected to aremote concentrator processor. Leased lines went from remote concentratorprocessors to a front-end processor, providing a channel to the mainframecomputer. These were the nodes and links of networks at the time. Thequeuing problem involved estimating how long the bank teller would haveto wait to get a response from the mainframe.
1

2 Web and Network Data Science
Fast forward forty years. We have moved away from dial-up and leasedlines. Protocols are packet-switched and mobile. Users of networks are ev-erywhere, not just at banks, businesses, and research establishments. Mostmainframes have been replaced by clusters of microcomputers. We carrythe smallest of computers in our pockets. We wear computers if we like. Ofcourse, when making requests of remote systems, we are still waiting forresponses, although now we wait wherever we are and whatever we aredoing.
With computer hardware looking more like a commodity and software go-ing open-source, established technology firms seek out new opportunitiesin business intelligence and data science. IBM moves from hardware tosoftware to consulting. HP splits into two firms, one focused on hardware,the other on business services and utilities. Meanwhile, Apple fights bat-tles with Amazon and Google over the distribution of media, while suingSamsung for copyright violations.
The big battles of today concern information and its online distribution. In-tellectual property, special knowledge, competitive intelligence, expertise,and art—these add value in an online world that otherwise appears to offerinformation for free.
It is hard to resist the allure of the web. She is the ultimate seductress,holding the promise of unlimited information and connection to all. Theweb is a huge data repository, a path to the world’s knowledge, and theresearch medium through which we develop new knowledge.
Web and network data science is a collection of technologies and modelingtechniques, some well understood, others emerging, that help us to under-stand the web and the networks in our lives. The technologies of the webare many, with current market shares tracked by Alexa Internet (2014) andW3Techs (2014), among others.
To work efficiently in web and network data science, it helps to be techni-cally inclined, with some understanding of at least three languages: Python,R, and JavaScript. Python is the tool of choice for data preparation (or datamunging, as it is sometimes called). R provides specialized tools for mod-eling and data visualization. And JavaScript is the client-side language ofthe web, available on every major web browser. When working on weband network problems, it also helps to know HTML5, CSS3, XPath, a vari-

Chapter 1. Being Technically Inclined 3
ety of text and image file formats, Java, Linux, Apache, .Net web services,database systems, and server-side languages such as Perl and PHP. It helpsto be technically inclined, but there is a limit to what we can cover in onebook. We provide a glossary of terms as the final appendix in the book.
From its humble beginnings as a language that Brendan Eich developed inten days in 1995 at the former company Netscape, JavaScript has emergedas the client-side language of the web, a browser-based engine for manag-ing user interaction. JavaScript is dominant on the client side, with an es-timated 88 percent of websites using the technology and with 11.8 percentof websites being pure/static HTML sites with no client-side programming(W3Techs 2014).
Crockford (2008) tells us what is right and wrong with JavaScript. Oth-ers tell us how to use it in practice (Stefanov 2010; Flanagan 2011; Resigand BearBibeault 2013). Recently, with the emergence of Node.js, JavaScripthas taken on a role on the server side (Hughes-Croucher and Wilson 2012;Wanderschneider 2013; Cantelon, Harter, Holowaychuk, and Rajlich 2014).There are those who promote end-to-end JavaScript applications with client-and server-side programs and document databases (Mikowski and Pow-ell 2014). JavaScript Object Notation (JSON), a data interchange format, ismore readable than XML and easily integrated into a MongoDB documentdatabase (Chodorow 2013; Copeland 2013; Hoberman 2014), for example.JavaScript would certainly rule the web if it had sufficient capabilities as amodeling and analysis language. It does not.
Today’s world of data science brings together statisticians fluent in R andinformation technology professionals fluent in Python. These communitieshave much to learn from each other. For the practicing data scientist, thereare considerable advantages to being multilingual.
Designed by Ross Ihaka and Robert Gentleman, R first appeared in 1993.R represents an extensible, object-oriented, open-source scripting languagefor programming with data. It is well established in the statistical commu-nity and has syntax, data structures, and methods similar to its precursors,S and S-Plus. Contributors to the language have provided more than fivethousand packages, most focused on traditional statistics, machine learn-ing, and data visualization. R is the most widely used language in datascience, but it is not a general-purpose programming language.

4 Web and Network Data Science
Guido van Rossum, a fan of Monty Python, released version 1.0 of Pythonin 1994. This general-purpose language has grown in popularity in the en-suing years. Many systems programmers have moved from Perl to Python,and Python has a strong following among mathematicians and scientists.Many universities use Python as a way to introduce basic concepts of object-oriented programming. An active open-source community has contributedmore than fifteen thousand Python packages.
Sometimes referred to as a “glue language,” Python provides a rich open-source environment for scientific programming and research. For computer-intensive applications, it gives us the ability to call on compiled routinesfrom C, C++, and Fortran. We can also use Cython to convert Python codeinto optimized C. For modeling techniques or graphics not currently imple-mented in Python, we can execute R programs from Python.
Some problems are more easily solved with Python, others with R. We bene-fit from Python’s capabilities as a general-purpose programming language.We draw on R packages for traditional statistics, time series analysis, mul-tivariate methods, statistical graphics, and handling missing data. Accord-ingly, this book includes Python and R code examples and represents adual-language guide to web and network data science.
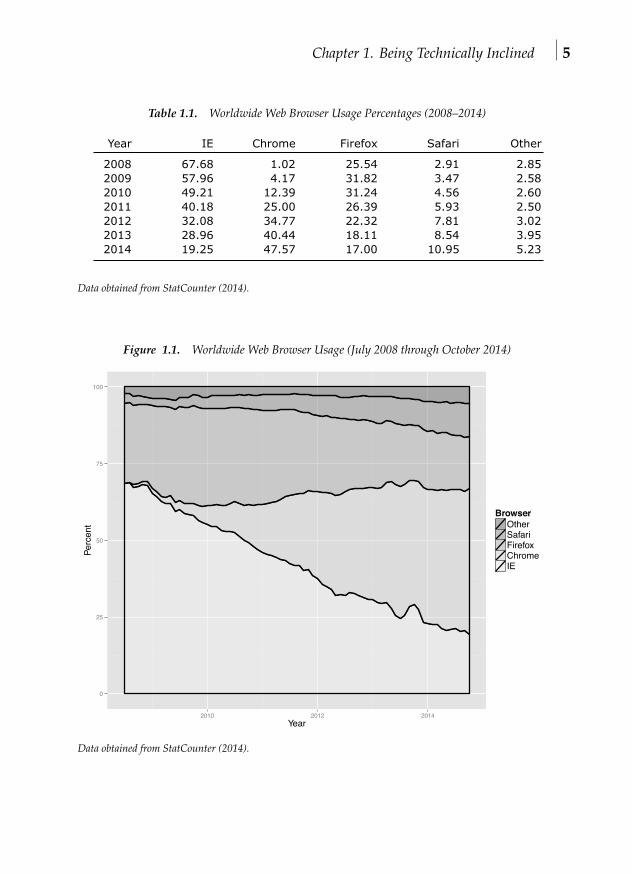
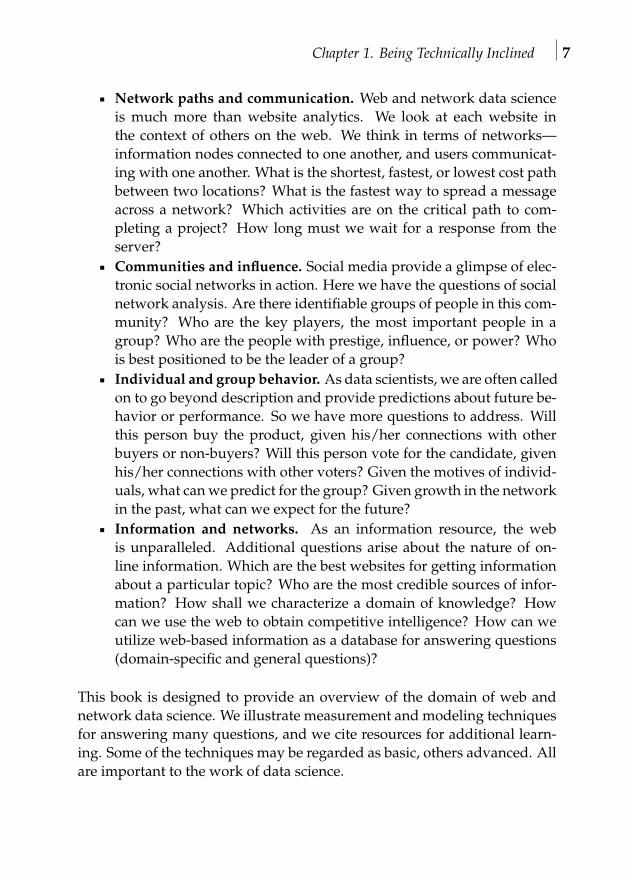
Browser usage has changed dramatically over the years, with the rise ofGoogle Chrome and the decline of Microsoft Internet Explorer (IE). Table 1.1and figure 1.1 show worldwide browser usage statistics from October 2008through October 2014. It is good to have some familiarity with browsersand the tools they provide for examining the text elements and structure ofweb pages.
The challenge of “big data,” as they are sometimes called, is not so much thevolume of data. It is that these data arise from sources poorly understood,in particular the web and social media. Data are everywhere on the web.We need to find our way to the relevant data and obtain those data in anefficient manner.
Application programming interfaces (APIs) are one way to gather data fromthe web, and Russell (2014) provides a useful review of social media APIs.Unfortunately, APIs have syntax, parameters, and authorization codes thatcan change at the whim of the data providers. We employ a different ap-
Chapter 1. Being Technically Inclined 5
Table 1.1. Worldwide Web Browser Usage Percentages (2008–2014)
Year IE Chrome Firefox Safari Other
2008 67.68 1.02 25.54 2.91 2.852009 57.96 4.17 31.82 3.47 2.582010 49.21 12.39 31.24 4.56 2.602011 40.18 25.00 26.39 5.93 2.502012 32.08 34.77 22.32 7.81 3.022013 28.96 40.44 18.11 8.54 3.952014 19.25 47.57 17.00 10.95 5.23
Data obtained from StatCounter (2014).
Figure 1.1. Worldwide Web Browser Usage (July 2008 through October 2014)
0
25
50
75
100
2010 2012 2014Year
Percent
BrowserOtherSafariFirefoxChromeIE
Data obtained from StatCounter (2014).

6 Web and Network Data Science
Figure 1.2. Web and Network Data Science: Online Research Process
Measure
Model
Predict Test
Primary Research
Secondary Research:Crawl, Scrape, and Parse
Sampling, Data Collection, and Data Preparation
Data Analysis andPredictive Modeling
proach, focusing on general purpose technologies for automated data ac-quisition from the web.
Figure 1.2 summarizes the online research process. Sampling, data col-lection, and data preparation consume much of our time, with secondaryresearch dominating primary research. Online secondary research drawsfrom existing web data. We review secondary research methods in chapterthree and use them in many subsequent chapters. Primary research onlineis facilitated by the web. We cover these methods in appendix B.
The domain of web and network data science is large. There are manyquestions to address, as shown in the list to follow.
Website design and user behavior. Web analytics, as it is understoodby many, involves collecting, storing, and analyzing data from usersof a particular website. There are many questions to be addressed.How shall we design and implement websites (for ease of use, visibil-ity, marketing communication, good performance in search, and/orconversion of visits to sales)? How can we gather information fromthe web efficiently? How can we convert semi-structured and un-structured text into data for input to analysis and modeling? Whatkinds of website and social media measures make the most sense?Who are the users of a website, and how do they use it? How welldoes a website do in serving user needs? How well does a website docompared with other websites?
Chapter 1. Being Technically Inclined 7
Network paths and communication. Web and network data scienceis much more than website analytics. We look at each website inthe context of others on the web. We think in terms of networks—information nodes connected to one another, and users communicat-ing with one another. What is the shortest, fastest, or lowest cost pathbetween two locations? What is the fastest way to spread a messageacross a network? Which activities are on the critical path to com-pleting a project? How long must we wait for a response from theserver?Communities and influence. Social media provide a glimpse of elec-tronic social networks in action. Here we have the questions of socialnetwork analysis. Are there identifiable groups of people in this com-munity? Who are the key players, the most important people in agroup? Who are the people with prestige, influence, or power? Whois best positioned to be the leader of a group?Individual and group behavior. As data scientists, we are often calledon to go beyond description and provide predictions about future be-havior or performance. So we have more questions to address. Willthis person buy the product, given his/her connections with otherbuyers or non-buyers? Will this person vote for the candidate, givenhis/her connections with other voters? Given the motives of individ-uals, what can we predict for the group? Given growth in the networkin the past, what can we expect for the future?Information and networks. As an information resource, the webis unparalleled. Additional questions arise about the nature of on-line information. Which are the best websites for getting informationabout a particular topic? Who are the most credible sources of infor-mation? How shall we characterize a domain of knowledge? Howcan we use the web to obtain competitive intelligence? How can weutilize web-based information as a database for answering questions(domain-specific and general questions)?
This book is designed to provide an overview of the domain of web andnetwork data science. We illustrate measurement and modeling techniquesfor answering many questions, and we cite resources for additional learn-ing. Some of the techniques may be regarded as basic, others advanced. Allare important to the work of data science.

8 Web and Network Data Science
Some say that data science is the new statistics. And in a world dominatedby data, data science is beginning to look like the new business and the newIT as well. Nowhere is this more apparent than when working on web andnetwork problems. With unlimited data mediated and distributed throughthe web, there is certainly enough to keep us busy for a long time.
To begin the programming portion of the book, exhibit 1.1 lists a Pythonprogram for exploring web browser usage statistics. Exhibit 1.2 shows thecorresponding R program and draws on graphics software from Wickhamand Chang (2014).

Chapter 1. Being Technically Inclined 9
Exhibit 1.1. Analysis of Browser Usage (Python)
# Analysis of Browser Usage (Python)
# prepare for Python version 3x features and functionsfrom __future__ import division, print_function
# import packages for data analysisimport pandas as pd # data structures for time series analysisimport datetime # date manipulationimport matplotlib.pyplot as plt
# browser usage data from StatCounter Global Stats# retrieved from the World Wide Web, October 21, 2014:# \url{http://gs.statcounter.com/#browser-ww-monthly-200807-201410# read in comma-delimited text filebrowser_usage = pd.read_csv(’browser_usage_2008_2014.csv’)# examine the data frame objectprint(browser_usage.shape)print(browser_usage.head())
# identify date fields as dates with apply and lambda functionbrowser_usage[’Date’] = \
browser_usage[’Date’]\.apply(lambda d: datetime.datetime.strptime(str(d), ’%Y-%m’))
# define Other categorybrowser_usage[’Other’] = 100 -\
browser_usage[’IE’] - browser_usage[’Chrome’] -\browser_usage[’Firefox’] - browser_usage[’Safari’]
# examine selected columns of the data frame objectselected_browser_usage = pd.DataFrame(browser_usage,\
columns = [’Date’, ’IE’, ’Chrome’, ’Firefox’, ’Safari’, ’Other’])print(selected_browser_usage.shape)print(selected_browser_usage.head())
# create multiple time series plotselected_browser_usage.plot(subplots = True, \
sharex = True, sharey = True, style = ’k-’)plt.legend(loc = ’best’)plt.xlabel(’’)plt.savefig(’fig_browser_mts_Python.pdf’,
bbox_inches = ’tight’, dpi=None, facecolor=’w’, edgecolor=’b’,orientation=’portrait’, papertype=None, format=None,transparent=True, pad_inches=0.25, frameon=None)
# Suggestions for the student:# Explore alternative visualizations of these data.# Try the Python package ggplot to reproduce R graphics.# Explore time series for other software and systems.

10 Web and Network Data Science
Exhibit 1.2. Analysis of Browser Usage (R)
# Analysis of Browser Usage (R)
# begin by installing necessary package ggplot2
# load package into the workspace for this programlibrary(ggplot2) # grammar of graphics plotting
# browser usage data from StatCounter Global Stats# retrieved from the World Wide Web, October 21, 2014:# \url{http://gs.statcounter.com/#browser-ww-monthly-200807-201410# read in comma-delimited text filebrowser_usage <- read.csv("browser_usage_2008_2014.csv")# examine the data frame objectprint(str(browser_usage))# define Other categorybrowser_usage$Other <- 100 -
browser_usage$IE - browser_usage$Chrome -browser_usage$Firefox - browser_usage$Safari
# define time series data objectsIE_ts <- ts(browser_usage$IE, start = c(2008, 7), frequency = 12)Chrome_ts <- ts(browser_usage$Chrome, start = c(2008, 7), frequency = 12)Firefox_ts <- ts(browser_usage$Firefox, start = c(2008, 7), frequency = 12)Safari_ts <- ts(browser_usage$Safari, start = c(2008, 7), frequency = 12)Other_ts <- ts(browser_usage$Other, start = c(2008, 7), frequency = 12)
# create a multiple time series objectbrowser_mts <- cbind(IE_ts, Chrome_ts, Firefox_ts, Safari_ts, Other_ts)dimnames(browser_mts)[[2]] <- c("IE", "Chrome", "Firefox", "Safari", "Other")# plot multiple time series object using standard R graphicspdf(file="fig_browser_mts_R.pdf",width = 11,height = 8.5)ts.plot(browser_mts, ylab = "Percent Usage", main="",
plot.type = "single", col = 1:5)legend("topright", colnames(browser_mts), col = 1:5,
lty = 1, cex = 1)dev.off()
# define Year as numeric with fractional values for monthsbrowser_usage$Year <- as.numeric(time(IE_ts))
# build data frame for plotting a stacked area graphBrowser <- rep("IE", length = nrow(browser_usage))Percent <- browser_usage$IEYear <- browser_usage$Yearplotting_data_frame <- data.frame(Browser, Percent, Year)
Browser <- rep("Chrome", length = nrow(browser_usage))Percent <- browser_usage$ChromeYear <- browser_usage$Yearplotting_data_frame <- rbind(plotting_data_frame,
data.frame(Browser, Percent, Year))

Chapter 1. Being Technically Inclined 11
Browser <- rep("Firefox", length = nrow(browser_usage))Percent <- browser_usage$FirefoxYear <- browser_usage$Yearplotting_data_frame <- rbind(plotting_data_frame,
data.frame(Browser, Percent, Year))
Browser <- rep("Safari", length = nrow(browser_usage))Percent <- browser_usage$SafariYear <- browser_usage$Yearplotting_data_frame <- rbind(plotting_data_frame,
data.frame(Browser, Percent, Year))
Browser <- rep("Other", length = nrow(browser_usage))Percent <- browser_usage$OtherYear <- browser_usage$Yearplotting_data_frame <- rbind(plotting_data_frame,
data.frame(Browser, Percent, Year))
# create ggplot plotting object and plot to external filepdf(file = "fig_browser_usage_stacked_area_R.pdf", width = 11, height = 8.5)area_plot <- ggplot(data = plotting_data_frame,
aes(x = Year, y = Percent, fill = Browser)) +geom_area(colour = "black", size = 1, alpha = 0.4) +scale_fill_brewer(palette = "Blues",
breaks = rev(levels(plotting_data_frame$Browser))) +theme(legend.text = element_text(size = 15)) +theme(legend.title = element_text(size = 15)) +theme(axis.title = element_text(size = 15))
print(area_plot)dev.off()

This page intentionally left blank

Index
Aadjacency matrix, 70, 314agent, 314Alteryx, 250, 299ARPANET, 313, 314ASP, 314association rule, 203–210
antecedent, 203confidence, 203, 204, 209consequent, 203item set, 203lift, 204, 209support, 203, 204, 209
Bbandwidth, 314bar chart, see data visualization, bar chartBayesian statistics, 243, 244
Bayes’ theorem, 243betweenness centrality, 71, 102, 314big data, 240biologically-inspired methods, 251black box model, 250bot, see crawler (web crawler)boundary (of a network), 315bps, 315browser launch, 315browser usage, 5, 6, 15, 17, 18, 28bulletin board, 264, 271–273, 314, 315
advantages, 273applications, 271
Ccase study
Anonymous Microsoft Web Data, 204, 205,211, 296E-Mail or Spam?, 281–283
Enron E-Mail Corpus and Network, 75–82,91, 108, 291Keyword Games, 47, 51, 288, 290POTUS Speeches, 172, 176, 178–183, 192,197, 295Quake Talk, 294ToutBay Begins, 14–17, 20, 284–287Wikipedia Votes, 109, 115, 292
chat room, 264, 315circle network, 71classical statistics, 242, 244
null hypothesis, 242power, 243statistical significance, 242, 243
classification, 121, 129, 238, 246, 248, 250predictive accuracy, 247, 248, 300, 303
client, 267, 315client-server application, 315closeness centrality, 102, 315cluster analysis, 107, 173, 176, 251clustering coefficient (of a network), see
transitivitycoefficient of determination, 246collaborative filtering, 202collage, 315competitive intelligence, 59complexity, of model, 249content analysis, 315Continuum Analytics, 299cookie, 315corpus, 315correlation heat map, see data visualization,
correlation heat mapcost per click (CPC), 315CPC, see cost per click (CPC)crawler (web crawler), 43, 315cross-validation, 249
351

352 Web and Network Data Science
Ddata preparation, 241
missing data, 241data science, 237, 239data visualization
bar chart, 15, 206bubble chart, 208correlation heat map, 104, 307diagnostics, 248dot chart, 131histogram, 101lattice plot, 252multidimensional scaling map, 174, 197network diagram, 71–74, 76–80, 98–100Sankey diagram, 16, 18, 20scatter plot, 207stacked area graph, 5, 10text map, 174, 197time line, 269, 272, 277time series plot, 17, 62tree diagram, 132word cloud, 176, 178–182, 259
database system, 240non-relational, 240, 241relational, 240, 241
degree, 70, 315degree centrality, 70, 315degree distribution, 70, 315density (of a network), 316discussion guide, 264, 267, 275Document Object Model (DOM), 26, 316DOM, see Document Object Model (DOM)DSL, 316dyad, 316
Ee-mail, 263, 316eigenvector centrality, 102, 316emoticons, 316Enthought, 299ethnography, 264, 265, 316
digital ethnography, 265netnography, 265virtual ethnography, 265
event duration chart, see data visualization,time line
explanatory model, 238explanatory variable, 246
Ffocused conversation, 276, 277, 316frame, 316Fruchterman-Reingold algorithm, 81
ftp, 316
Ggame theory, 316General Inquirer, 133generalized linear model, 246, 249generative grammar, 316genetic algorithms, 251grounded theory, 279, 316
Hheuristics, 251histogram, see data visualization, histogramHTML, 314, 316HTTP, 261, 316
IIBM, 250, 299ICQ, 317IMHO, 317interaction effect, 248Internet, 313, 317Internet Services Provider, 317interview, 267, 268intranet, 317IRC, 317IT, 317item analysis, psychometrics, 128
JJava, 317JavaScript, 3, 298, 317JavaScript Object Notation (JSON), 317JPEG, 317JSON, see JavaScript Object Notation (JSON)
KKamada-Kawai algorithm, 81kbps, 317keyword, 317keyword density, 46KNIME, 250
LLAMP, 317line network, 71linear model, 246, 249linear predictor, 246listserv, 263, 317log-linear models, 107logistic regression, 128, 246LOL, 317Luddite, 317

Index 353
Mmachine learning, 250, 251MEG, 317Microsoft, 299modem, 317moderator, 264, 266, 267, 270, 272, 274morphology, 317multidimensional scaling, 107, 173, 176multidimensional scaling map, see data
visualization, multidimensional scalingmap
multivariate methods, 176
Nnatural language processing, 317nearest neighbor model, 100, 106, 107, 202nearest-neighbor model, 202netiquette, 318network, 318network diagram, see data visualization, net-
work diagramnetwork visualization, 69–95
Oobserver, 270online community, 265, 318, 320online focus group, 266, 273
differences with traditional focus group,266, 269similarities with traditional focus group,266
online observation, 268optimization, 251organic search, 45, 318over-fitting, 248
Ppage view, 318PageRank, 103, 318paid search, 45, 318panel, 318parametric models, 248parser (text parser), 43, 318Perl, 261, 318PHP, 261, 318Poisson regression, 245post, 318predictive model, 238primary source (of information), 58principal component analysis, 251psychographics, 318Python, 3, 4, 297, 298, 319Python package
BeautifulSoup, 30datetime, 9fnmatch, 183lxml, 30matplotlib, 9, 83, 135, 183networkx, 83nltk, 135, 183numpy, 83, 135, 183, 229os, 33, 36, 135, 183pandas, 9, 135, 183, 229patsy, 135re, 135, 183requests, 30scipy, 183scrapy, 33, 36sklearn, 135, 183statsmodels, 135, 229
Qqualitative research, 278
RR, 3, 298R package
arules, 211arulesViz, 211car, 211caret, 151e1071, 151ggplot2, 10, 20, 63, 151, 197, 231grid, 151gridExtra, 20igraph, 87, 91, 110, 115intergraph, 91lattice, 110, 115latticeExtra, 151lubridate, 20, 63network, 91Quandl, 63quantmod, 63randomForest, 151RColorBrewer, 20, 211RCurl, 32, 63riverplot, 20RJSONIO, 51RNetLogo, 231rpart, 151rpart.plot, 151stringr, 151tm, 151wordcloud, 192XML, 32, 63xts, 63zoo, 63

354 Web and Network Data Science
R-squared, 246random forest, 129–131random network (random graph), 97, 319real-time focus group, 268, 271, 319
advantages, 270applications, 270disadvantages, 270system failures, 269
recommender systems, 201–222regression, 128, 238, 245, 249
nonlinear regression, 249robust methods, 249
regular expressions, 26, 319regularized regression, 249Reingold-Tilford algorithm, 82response, 245robot, see crawler (web crawler)root mean-squared error (RMSE), 246RStudio, 299
Ssampling
sampling variability, 243Sankey diagram, see data visualization, Sankey
diagramSAS, 250, 299scheduling, 251scraper (web scraper), 43, 319search engine optimization, see web presence
testingsecondary source (of information), 58segmentation, 210semantic web, 234, 235, 319semantics, 319semi-supervised learning, 251sentiment analysis, 119–171SEO, see web presence testingshrinkage estimators, 249simulation, 249
benchmark study, 129, 249, 250what-if analysis, 238
small-world network, 99smoothing methods, 249
splines, 249social network analysis, 95–118sparse matrix, 201spider, see crawler (web crawler)star network, 70statistic
interval estimate, 242p-value, 242point estimate, 242test statistic, 242
stemming (word stemming), 319
stop words, 172Strategic and Competitive Intelligence
Professionals, 59supervised learning, 245, 251, 258support vector machines, 129syntax, 319
TTCP/IP, 319telnet, 319term frequency-inverse document frequency,
173terms-by-documents matrix, 173testing links, 47text analysis, 267, 319text analytics, 171–200, 253–259
content analysis, 133generative grammar, 253, 254latent Dirichlet allocation, 251latent semantic analysis, 251morphology, 254natural language processing, 134, 253semantics, 254stemming, 255syntax, 254terms-by-documents matrix, 255, 257text summarization, 258thematic analysis, 133, 251
text map, see data visualization, text maptext measure, 120, 133, 175, 301text measures, 319text mining, 319TF-IDF, see term frequency-inverse document
frequencythread, of discussion, 273, 275, 316, 319time line, see data visualization, time linetime series plot, see data visualization,
time series plottraining-and-test regimen, 129, 238transcript, 319transitivity, 109, 319tree network, 73tree-structured model
classification, 130, 132triad, 109, 320triple, see triad
Uunsupervised learning, 251, 256URL, 314, 320Usenet, 320

Index 355
Vvariable transformation, 248virtual facility, 320
Wweb board, 320web browser, 267web presence, 47web presence testing, 320web server, 267, 320
web services, 320weblog, 264, 265, 320Weka, 210Wiki, 320word stemming, see stemming (word
stemming)World Wide Web, 267, 314
XXML, 320XPath, 26, 320