
A Professional’s Guide -...
59
-
Upload
duongquynh -
Category
Documents
-
view
227 -
download
0
Transcript of A Professional’s Guide -...

i
A Professional’s Guide to Decision Science and Problem Solving
00_9780132869782_FM.indd 1 11/9/11 10:50 AM

00_9780132869782_FM.indd 2 11/9/11 10:50 AM
A Professional’s Guide to Decision Science and Problem Solving
An Integrated Approach for Assessing Issues, Finding Solutions, and
Reaching Corporate Objectives
Frank A. Tillman Deandra T. Cassone
00_9780132869782_FM.indd 3 11/9/11 12:00 PM

Vice President, Publisher: Tim MooreAssociate Publisher and Director of Marketing: Amy NeidlingerExecutive Editor: Jeanne Glasser LevineEditorial Assistant: Pamela BolandDevelopment Editor: Russ HallOperations Manager: Jodi KemperSenior Marketing Manager: Julie PhiferAssistant Marketing Manager: Megan GraueCover Designer: Alan ClementsManaging Editor: Kristy HartProject Editor: Jovana San Nicolas-ShirleyCopy Editor: Apostrophe Editing ServicesProofreader: Williams Woods Publishing ServicesIndexer: Erika MillenCompositor: Nonie RatcliffManufacturing Buyer: Dan Uhrig© 2012 by Pearson Education, Inc.Publishing as FT PressUpper Saddle River, New Jersey 07458FT Press offers excellent discounts on this book when ordered in quantity for bulk purchases or special sales. For more information, please contact U.S. Corporate and Government Sales, 1-800-382-3419, [email protected]. For sales outside the U.S., please contact International Sales at [email protected] and product names mentioned herein are the trademarks or registered trademarks of their respective owners.All rights reserved. No part of this book may be reproduced, in any form or by any means, without permission in writing from the publisher.Printed in the United States of AmericaFirst Printing March 2012ISBN-10: 0-13-286978-0ISBN-13: 978-0-13-286978-2Pearson Education LTD.Pearson Education Australia PTY, Limited.Pearson Education Singapore, Pte. Ltd.Pearson Education Asia, Ltd.Pearson Education Canada, Ltd.Pearson Educación de Mexico, S.A. de C.V.Pearson Education—JapanPearson Education Malaysia, Pte. Ltd.The Library of Congress cataloging-in-publishing data is on file.
00_9780132869782_FM.indd 4 11/9/11 10:50 AM

We would like to dedicate this book to Dr. C. L. Hwang. Through the course of his academic career,
Dr. Hwang researched and assessed an exhaustive list of Multiple Attribute, Multiple Objective, and Group
Decision-Making techniques in both the crisp and fuzzy environments, which are published in six of his books. Dr. Hwang was an early pioneer in the field
of Decision Science and his contributions to this field are still realized today in academia and at the heart of
this book. He introduced this area of study to the authors who worked together with him
for a number of years.
00_9780132869782_FM.indd 5 11/9/11 10:50 AM

00_9780132869782_FM.indd 6 11/9/11 10:50 AM
Contents
Acknowledgments . . . . . . . . . . . . . . . . . . . . . . . . . . . . . . xii
About the Authors . . . . . . . . . . . . . . . . . . . . . . . . . . . . . . xiii
Preface . . . . . . . . . . . . . . . . . . . . . . . . . . . . . . . . . . . . . . . xiv
Part I: The Method . . . . . . . . . . . . . . . . . . . . . . . . . . 1
Chapter 1 Define the Objectives and Identify Metrics . . . . . . . . . . . 3
1.1 Chapter Topic . . . . . . . . . . . . . . . . . . . . . . . . . . . . . . . . . . . . 3
1.2 Key Corporate Participants . . . . . . . . . . . . . . . . . . . . . . . . . 31.3 Management Steps Required to Execute the Approach . . . . . . . . . . . . . . . . . . . . . . . . . . . . . . . . . . . . . . . . 41.4 Solving the Right Problem . . . . . . . . . . . . . . . . . . . . . . . . . . 71.5 Developing an Understanding of the Problem . . . . . . . . . . 91.6 Defining Goals and Objectives of a Company or Organization. . . . . . . . . . . . . . . . . . . . . . . . . . . . . . . . . . . . . . . . . 91.7 Defining the Framework for the Decisions Being Made . . . . . . . . . . . . . . . . . . . . . . . . . . . . . . . . . . . . . . . . 151.8 Metrics for Measuring Success. . . . . . . . . . . . . . . . . . . . . . 171.9 Definition of a Metric . . . . . . . . . . . . . . . . . . . . . . . . . . . . . 181.10 Developing Decision Criteria and Metrics. . . . . . . . . . . . . . . . . . . . . . . . . . . . . . . . . . . . . . . . . 201.11 Data Used to Support Metrics . . . . . . . . . . . . . . . . . . . . . 261.12 Structure and Definition of the Problem. . . . . . . . . . . . . 281.13 Key Concepts in Defining the Objectives . . . . . . . . . . . . 28
Chapter 2: Explore the Environment . . . . . . . . . . . . . . . . . . . . . . . . 31
2.1 Chapter Topic . . . . . . . . . . . . . . . . . . . . . . . . . . . . . . . . . . . 312.2 Key Corporate Participants . . . . . . . . . . . . . . . . . . . . . . . . 312.3 Integrated Corporate Planning . . . . . . . . . . . . . . . . . . . . . 322.4 Assess the Scope of the Problem . . . . . . . . . . . . . . . . . . . . 342.5 Develop the Activity Relationship Matrix . . . . . . . . . . . . . 352.6 Quantify Performance with Industry Benchmarks and Performance Evaluations. . . . . . . . . . . . . . . . . . . . . . . . . . . . . . 37
00_9780132869782_FM.indd 7 11/9/11 10:50 AM

viii A ProfessionAl’s Guide to deCision sCienCe And Problem solvinG
2.7 Develop the Activity Relationship Diagram . . . . . . . . . . . 402.8 Determine the Variability of the Metrics and Financial Contribution of the Individual Functions . . . . . . . . 432.9 Identify Specific Problem Areas to Improve . . . . . . . . . . . 442.10 Key Concepts in Exploring the Environment . . . . . . . . . 46
Chapter 3: Explore the Scope of the Problem and Its Importance . . . . . . . . . . . . . . . . . . . . . . . . . . . . . . . . . 47
3.1 Chapter Topic . . . . . . . . . . . . . . . . . . . . . . . . . . . . . . . . . . . 473.2 Key Corporate Participants . . . . . . . . . . . . . . . . . . . . . . . . 473.3 How Does This Fit into the Overall Processes? . . . . . . . . 483.4 Discussion of Business Process Modeling . . . . . . . . . . . . . 483.5 What Is the Panoramic View? . . . . . . . . . . . . . . . . . . . . . . 503.6 Unique Application of Techniques and Methods . . . . . . . 563.7 Key Concepts in Exploring the Scope of the Problem and Its Importance . . . . . . . . . . . . . . . . . . . . . . . . . . . 57
Chapter 4: Data Mining and Statistical Analysis . . . . . . . . . . . . . . 59
4.1 Chapter Topic . . . . . . . . . . . . . . . . . . . . . . . . . . . . . . . . . . . 594.2 Key Corporate Participants . . . . . . . . . . . . . . . . . . . . . . . . 594.3 Assess the Information and Its Availability . . . . . . . . . . . . 594.4 Data Summarization . . . . . . . . . . . . . . . . . . . . . . . . . . . . . . 624.5 Analysis and Decision Methods . . . . . . . . . . . . . . . . . . . . . 684.6 Key Concepts in Data Mining and Statistical Analysis . . . . . . . . . . . . . . . . . . . . . . . . . . . . . . . . . . . . . . . . . . . . 69
Chapter 5: Solve the Problem and Measure the Results . . . . . . . . . 71
5.1 Chapter Topic . . . . . . . . . . . . . . . . . . . . . . . . . . . . . . . . . . . 715.2 Key Corporate Participants . . . . . . . . . . . . . . . . . . . . . . . . 715.3 Select the Best Method That the Data Can Support . . . . . . . . . . . . . . . . . . . . . . . . . . . . . . . . . . . 725.4 Model to Represent the Decision Process. . . . . . . . . . . . . 735.5 Model Automation . . . . . . . . . . . . . . . . . . . . . . . . . . . . . . . 775.6 Key Concepts to Solve the Problem and Measure the Results . . . . . . . . . . . . . . . . . . . . . . . . . . . . . . . . . 79
Chapter 6: Evaluate the Results and Do Sensitivity Analysis . . . . . 81
6.1 Chapter Topic . . . . . . . . . . . . . . . . . . . . . . . . . . . . . . . . . . . 816.2 Key Corporate Participants . . . . . . . . . . . . . . . . . . . . . . . . 81
00_9780132869782_FM.indd 8 11/9/11 10:50 AM

Contents ix
6.3 Measure the Degree of Success . . . . . . . . . . . . . . . . . . . . . 816.4 Economic Analysis . . . . . . . . . . . . . . . . . . . . . . . . . . . . . . . 836.5 What-If and Sensitivity Analysis . . . . . . . . . . . . . . . . . . . . . 866.6 Key Concepts to Evaluate the Results and Do Sensitivity Analysis . . . . . . . . . . . . . . . . . . . . . . . . . . . . . . . . . . . 90
Chapter 7: Summary of Part I . . . . . . . . . . . . . . . . . . . . . . . . . . . . . . 91
7.1 Summary of Integrated Approach . . . . . . . . . . . . . . . . . . . 91
Part II: Case Studies. . . . . . . . . . . . . . . . . . . . . . . . . 95
Chapter 8: Logistics Service Provider . . . . . . . . . . . . . . . . . . . . . . . . 97
8.1 Introduction . . . . . . . . . . . . . . . . . . . . . . . . . . . . . . . . . . . . . 978.2 Define the Objectives . . . . . . . . . . . . . . . . . . . . . . . . . . . . . 988.3 Developing Decision Criteria and Metrics. . . . . . . . . . . . . 998.4 Explore the Environment . . . . . . . . . . . . . . . . . . . . . . . . . 1038.5 Explore the Scope of the Problem and Its Importance. . . . . . . . . . . . . . . . . . . . . . . . . . . . . . . . . . 109
8.6 Data Mining and Statistical Analysis . . . . . . . . . . . . . .1148.7 Solve the Problem and Measure the Results . . . . . . . . . . . . . . . . . . . . . . . . . . . . . . . . . . . . . .1158.8 Evaluate the Results and Do Sensitivity Analysis . . . .1228.9 Summary . . . . . . . . . . . . . . . . . . . . . . . . . . . . . . . . . . . .129
Chapter 9: New Product Development . . . . . . . . . . . . . . . . . . . . 131
9.1 Introduction . . . . . . . . . . . . . . . . . . . . . . . . . . . . . . . . . . . 1319.2 Define the Objectives . . . . . . . . . . . . . . . . . . . . . . . . . . . . 1319.3 Developing Decision Criteria and Metrics . . . . . . . . . . . 1329.4 Explore the Environment . . . . . . . . . . . . . . . . . . . . . . . . . 1409.5 Explore the Scope of the Problem and Its Importance . . . . . . . . . . . . . . . . . . . . . . . . . . . . . . . . . . . . . 1449.6 Data Mining and Statistical Analysis . . . . . . . . . . . . . . . . . 1479.7 Solve the Problem and Measure the Results . . . . . . . . . . . . . . . . . . . . . . . . . . . . . . . . . . . . . . . . 1489.8 Evaluate the Results and Do Sensitivity Analysis. . . . . . . 1539.9 Summary . . . . . . . . . . . . . . . . . . . . . . . . . . . . . . . . . . . . . . 157
00_9780132869782_FM.indd 9 11/9/11 10:50 AM

x A ProfessionAl’s Guide to deCision sCienCe And Problem solvinG
Chapter 10: Airline Merger. . . . . . . . . . . . . . . . . . . . . . . . . . . . . . 159
10.1 Introduction . . . . . . . . . . . . . . . . . . . . . . . . . . . . . . . . . . . 15910.2 Define the Objectives . . . . . . . . . . . . . . . . . . . . . . . . . . . 16210.3 Developing Decision Criteria and Metrics. . . . . . . . . . . . . . . . . . . . . . . . . . . . . . . . . . . . . . . . 16310.4 Explore the Environment . . . . . . . . . . . . . . . . . . . . . . . . 16810.5 Explore the Scope of the Problem and Its Importance . . . . . . . . . . . . . . . . . . . . . . . . . . . . . . . . . . . . . 18210.6 Data Mining and Statistical Analysis . . . . . . . . . . . . . . . . 18710.7 Solve the Problem and Measure the Results . . . . . . . . . . . . . . . . . . . . . . . . . . . . . . . . . . . . . . . . 19210.8 Evaluate the Results and Do Sensitivity Analysis. . . . . . 19510.9 Summary . . . . . . . . . . . . . . . . . . . . . . . . . . . . . . . . . . . . . 202
Appendix A: Overview of Methodologies . . . . . . . . . . . . . . . . . . . . 205
A.1 Decision Methodologies . . . . . . . . . . . . . . . . . . . . . . . . . 205A.2 Multiple Criteria Decision Making . . . . . . . . . . . . . . . . . 206A.3 Multiple Objective Decision Making . . . . . . . . . . . . . . . 208A.4 Artificial Intelligence . . . . . . . . . . . . . . . . . . . . . . . . . . . . 210A.5 Group Decision Making. . . . . . . . . . . . . . . . . . . . . . . . . . 213A.6 Statistical Analysis. . . . . . . . . . . . . . . . . . . . . . . . . . . . . . . 214A.7 Forecasting . . . . . . . . . . . . . . . . . . . . . . . . . . . . . . . . . . . . 216A.8 Expert Opinion. . . . . . . . . . . . . . . . . . . . . . . . . . . . . . . . . 218A.9 Fuzzy Logic . . . . . . . . . . . . . . . . . . . . . . . . . . . . . . . . . . . 219A.10 Simulation. . . . . . . . . . . . . . . . . . . . . . . . . . . . . . . . . . . . 220
Appendix B: Detailed Methodologies. . . . . . . . . . . . . . . . . . . . . . . 221
B.1 Nominal Group Technique (NGT) . . . . . . . . . . . . . . . . . 221B.2 Normalized Direct Weighting . . . . . . . . . . . . . . . . . . . . . 222B.3 Analytical Hierarchy Process (Eigenvector Method) . . . 223B.4 Simple Additive Weighting Method . . . . . . . . . . . . . . . . 224B.5 Borda’s Function . . . . . . . . . . . . . . . . . . . . . . . . . . . . . . . 225B.6 TOPSIS. . . . . . . . . . . . . . . . . . . . . . . . . . . . . . . . . . . . . . . 226B.7 SPAN. . . . . . . . . . . . . . . . . . . . . . . . . . . . . . . . . . . . . . . . . 230B.8 Brainstorming. . . . . . . . . . . . . . . . . . . . . . . . . . . . . . . . . . 232B.9 Brainwriting . . . . . . . . . . . . . . . . . . . . . . . . . . . . . . . . . . . 232
00_9780132869782_FM.indd 10 11/9/11 10:50 AM

Contents xi
B.10 Moving Averages . . . . . . . . . . . . . . . . . . . . . . . . . . . . . . 233B.11 Weighted Moving Averages . . . . . . . . . . . . . . . . . . . . . . 234B.12 Exponential Smoothing . . . . . . . . . . . . . . . . . . . . . . . . . 235B.13 Regression Analysis . . . . . . . . . . . . . . . . . . . . . . . . . . . . . 237
References . . . . . . . . . . . . . . . . . . . . . . . . . . . . . . . . . . . 239
Index . . . . . . . . . . . . . . . . . . . . . . . . . . . . . . . . . . . . . . . . 241
00_9780132869782_FM.indd 11 11/9/11 10:50 AM

Acknowledgments
We would like to thank our family members who have continually supported us in the development of this book. Barbara Tillman (my mother) has spent countless hours listening to my father (Frank A. Tillman, Ph.D.— author) and me talk about our ideas and the content of this book. She has always been our greatest supporter. We’d like to thank all our family members who have endured our discussions about this book at our family events. The family members include my sister, Michelle Hoyt, and her son, Alan Tillman, my sister and brother-in-law, Lisa Lacey, D.O. and Ron Lacey, M.D., and their two children, Ben and Nic Lacey, and my three children, Kasey, Kristina, and Victor Cassone who have all been extremely supportive in this effort.
Additionally, we would like to thank Abhik Barua and Paul Sapen-aro for their review of the content of this book. With Abhik’s back-ground and experience, he provided suggestions in the presentation and content of the material. Paul’s experience as a Fortune 100 execu-tive and his expertise in the field of leadership and project manage-ment provided insights into the application of project management concepts in the business process execution. Both Abhik and Paul are great thinkers and provided insights to help mold this book into the final product.
We would also like to thank Jeanne Glasser Levine for her belief and support of this effort. Jeanne was exceptional in her ability to see our vision for the book and position it within the industry. Her knowledge of the industry and insight into the value of material was a driving force in publishing this book.
Also, we would like to acknowledge C.L. Hwang, Ph.D., and his lifelong contribution to the field of Decision Science. The combina-tion of his research and Dr. Tillman’s research and the application of many practical Decision Science methods in consulting is an impor-tant contribution to the methods applied and discussed within the framework of this book.
—Frank A. Tillman, Ph.D. and Deandra Tillman Cassone, Ph.D.
00_9780132869782_FM.indd 12 11/9/11 10:50 AM

About the Authors
Frank A. Tillman has had a varied and full career teaching and doing research in academia for more than 30 years, starting and managing two consulting firms, IBES, Inc. (government agencies) and HTX International, Inc. (private firms), and developing com-mercial and residential real estate. He served as department head at Kansas State University for more than 20 years where he published 50+ professional articles, published two books, and advised a number of M.S. and Ph.D. theses candidates. This book is a compilation of his consulting experiences noting which approach works best to solve real problems that result in solutions that can be implemented.
Deandra T. Cassone currently teaches as an adjunct professor at Missouri University of Science and Technology in its graduate sys-tems engineering program and is in management at a Fortune 100 company. She has spent more than 25 year in the industry, serving in consulting, technical, and management roles. Her interests lie in building structured decision-making models that encompass the application of the concepts in this book. She has also submitted and been awarded a number of business process patents.
00_9780132869782_FM.indd 13 11/9/11 10:50 AM

Preface
Executives must know how well their company operates com-pared to others in the industry. By looking at industry benchmarks, you can learn where companies excel and where improvement is needed. The approach in this book can help you pinpoint specific areas that show the most promise for improvement and how they can ultimately impact upstream and downstream functions. It is vital that lower-level decisions support the overall corporate goals. You can evaluate the product line in regard to which product should be put into the product line and which should be dropped. You can access the supply chain to determine areas in which performance improve-ments should be focused. You can weight mergers for their impact on current operations and whether the merger is the right move. This book presents a unique approach for the first time and the included case studies provide insights into how you can apply the steps of the approach.
This book integrates new and existing methods to provide a com-prehensive and holistic approach for assessing company performance and identifying areas for corporate improvement efforts. Many times, you look at the problem in a stove pipe manner and try to solve what appear to be key issues from a singular perspective. You must take a global, holistic approach to understand the overall impact a problem has on the entire organization. All organizations have multiple inter-actions, so you must look at the upstream interactions and the impact on the downstream functions before any decisions are made.
This process is geared toward all levels of an organization. The goal is to get people to think of the big picture and understand the tools and techniques that they can use to solve corporate-wide prob-lems. The difficulty is to know when and where you should use these concepts. Understanding the problem and the environment, and ana-lyzing the information and quantifying results involve putting the con-ceptual and analytical pieces together to solve the presented problem. You can use this basic process from the production floor to the board room. It is based on applying the right solution approach to the prob-lem and generating a sound, implementable solution.
00_9780132869782_FM.indd 14 11/9/11 10:50 AM

PrefACe xv
In general, corporate planning approaches are based on estab-lishing a vision, doing a situation analysis, setting objectives, and developing strategies. This new approach incorporates some of these characteristics; however, it focuses on structured analysis processes that you can use to quantify, explore, and solve problems from a cross-functional perspective. Depending on the executive, a traditional strategic planning approach may be conducted by a vice president for a given functional area. The traditional approach would focus on optimizing this particular area. It is crucial, however, to ensure that the optimization of one functional area does not negatively impact another. This is why the integrated, cross-functional approach to problem solving is critical to benefit the company as a whole.
If organizations approach problem solving from a corporate per-spective, the organization will undoubtedly become an effective and more efficient operation. The solution then is based on an overall objective approach, and not on individual agendas, and a well-oper-ating environment such as this is a true measure of the future success of a company.
The breadth of problems that this approach can address is large, including new product development, inventory level optimization, logistics modeling, manpower planning, budget allocation, and many other applications. Knowing where to begin, what to assess, how to look for workable solutions, and what to measure provides effective solutions that can be implemented by the entire organization and is the key objective of this book.
It is easy to get mired into details, overlook key elements of the problem, and not know what techniques are most appropriate. Time is always of the essence, so solutions must be quickly developed to solve problems in an ever changing environment.
Experienced employees are important to any organization. The knowledge they possess provides valuable insight into the opera-tion of the organization. Individuals with different educational back-grounds and experiences have a variety of ideas and perspectives in how the organization should operate. Experience must be part of the decision process along with the available data to make sound business decisions. Different opinions can lead to a wide variety of approaches in solving problems and accomplishing the company’s strategic goals.
00_9780132869782_FM.indd 15 11/9/11 10:50 AM
xvi A ProfessionAl’s Guide to deCision sCienCe And Problem solvinG
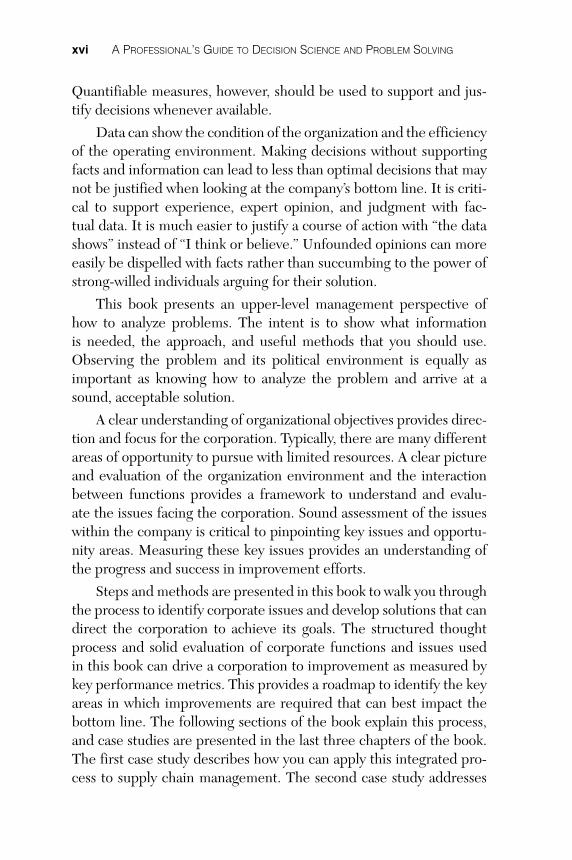
Quantifiable measures, however, should be used to support and jus-tify decisions whenever available.
Data can show the condition of the organization and the efficiency of the operating environment. Making decisions without supporting facts and information can lead to less than optimal decisions that may not be justified when looking at the company’s bottom line. It is criti-cal to support experience, expert opinion, and judgment with fac-tual data. It is much easier to justify a course of action with “the data shows” instead of “I think or believe.” Unfounded opinions can more easily be dispelled with facts rather than succumbing to the power of strong-willed individuals arguing for their solution.
This book presents an upper-level management perspective of how to analyze problems. The intent is to show what information is needed, the approach, and useful methods that you should use. Observing the problem and its political environment is equally as important as knowing how to analyze the problem and arrive at a sound, acceptable solution.
A clear understanding of organizational objectives provides direc-tion and focus for the corporation. Typically, there are many different areas of opportunity to pursue with limited resources. A clear picture and evaluation of the organization environment and the interaction between functions provides a framework to understand and evalu-ate the issues facing the corporation. Sound assessment of the issues within the company is critical to pinpointing key issues and opportu-nity areas. Measuring these key issues provides an understanding of the progress and success in improvement efforts.
Steps and methods are presented in this book to walk you through the process to identify corporate issues and develop solutions that can direct the corporation to achieve its goals. The structured thought process and solid evaluation of corporate functions and issues used in this book can drive a corporation to improvement as measured by key performance metrics. This provides a roadmap to identify the key areas in which improvements are required that can best impact the bottom line. The following sections of the book explain this process, and case studies are presented in the last three chapters of the book. The first case study describes how you can apply this integrated pro-cess to supply chain management. The second case study addresses
00_9780132869782_FM.indd 16 11/9/11 10:50 AM
PrefACe xvii
the assessment and decision making surrounding new product devel-opment decisions. The last case study addresses key areas that should be assessed and analyzed in a corporate merger. The goal is for you to not only read the book, but also to apply these concepts to your own organization.
Following is a summary of the chapters:
• Chapter 1, “Define the Objectives and Identify Metrics” —You need to clearly articulate and document the objectives of a corporation. Each of the multiple functions within a company has different objectives with varying importance, and many of the high-level objectives of the corporation may conflict. It is vital for senior management to articulate these objectives and reach an overall consensus of the weighted importance so that these objectives can be included into the corporate decision process at all levels.
• Chapter 2, “Explore the Environment”—This chapter pres-ents a new approach to integrated corporate planning. Assess-ments are made with key corporate functions to determine the closeness or dependence of the functional relationships that you can use as a guide to identify the scope of functional areas for improvement. Additionally, benchmarking, variability anal-ysis, and budget contributions are assessed to expand beyond the relationships to evaluate how well these functions perform against industry competitors.
• Chapter 3, “Explore the Scope of the Problem and Its Importance”—Critical in this analysis is not only identifying the corporate issues, but also determining the upstream and downstream process and operational impact associated with improving these processes. High-level business process model-ing is discussed. Often fixing one problem can cause an issue in another area, and this step ensures that you address the various operational impacts in the analysis.
• Chapter 4, “Data Mining and Statistical Analysis”—This chapter highlights the importance of data analysis. Recogniz-ing the problems and determining where improvements should be made is critical. Understanding the information that can quantify and support improvements provides a factual basis for justifying changes to operations and processes. This chap-ter presents a number of methods to analyze data with further detail of the methods provided in the appendices.
00_9780132869782_FM.indd 17 11/9/11 10:50 AM

xviii A ProfessionAl’s Guide to deCision sCienCe And Problem solvinG
• Chapter 5, “Solve the Problem and Measure the Results”—After the analysis is performed, as shown in Chap-ters 1 through 4, the approach to solving the problem is devel-oped. Often, assessing the environment and performing the data analysis can lead to a clear solution. In other cases, you might require computer-based solutions or more sophisti-cated methods. The best solution is one that the decision maker understands and uses. This chapter focuses on determining the best methods that the data and environment can support.
• Chapter 6, “Evaluate the Results and Do Sensitivity Analysis”—This chapter discusses how to use the decision model to explore the results and determine their economic viability. A well-defined model has the functional capability to change key parameters and constraints and determine the impact of those changes on the final solution. “What-if” analysis is a key ingredient in the decision process. The sensitivity of the variables in the solution must be tested to ensure that the best solution is reached.
• Chapter 7, “Summary of Part I”—This chapter brings together the approach and highlights the key points from the analyses.
• Chapter 8, “Logistics Service Provider”—This chapter applies the process described in this book to a full-service supply chain provider. The step-by-step analysis is performed to show how to implement this approach in the logistics environment.
• Chapter 9, “New Product Development”—This chapter applies the process to a company with its core competencies and how new products can be developed. A structured approach to decision making is developed based on the interrelationships and performance of the company.
• Chapter 10, “Airline Merger”—This chapter addresses some of the key considerations to analyze and assess when merging two companies. Performance and functional interactions of the companies are assessed, which is key to evaluating the activities for the airlines.
• Appendix A, “Overview of Methodologies”—This appen-dix provides a high level overview of various analytical and deci-sion science methodologies which can be used to evaluate and formulate problem solutions.
• Appendix B, “Detailed Methodologies”—This appendix provides the mathematical background for methods that are useful in model development.
00_9780132869782_FM.indd 18 11/9/11 10:50 AM

01_9780132869782_PT1.indd 2 11/9/11 11:04 AM

3
1Define the Objectives
and Identify Metrics
1.1 Chapter TopicThis chapter discusses the importance of clearly articulating and
documenting the objectives of a corporation. Each of the multiple functions within a company has different objectives with differing importance. Many of the high-level objectives of the corporation may be conflicting. Senior management must articulate these objectives and reach an overall consensus of the weight of importance of these objectives if the corporation is to improve and measure the success of meeting them. This chapter also discusses the development of deci-sion criteria and metrics. This involves defining specific quantifiable measures to determine whether the objectives are met. You need to capture the weights or importance of these decision criteria and met-rics to appropriately measure improvement.
1.2 Key Corporate ParticipantsSenior executives identify the problem and establish the task force
to work on the problem with an executive-level cross-functional team of representatives. Executive management articulates the corporate objectives and communicates these objectives to the organization so that it can form a workforce team for the cross-functional problem solving. The executive-level task force representatives then update the management by progress reports and findings.
02_9780132869782_ch01.indd 3 11/9/11 11:03 AM
4 A ProfessionAl’s Guide to decision science And Problem solvinG
1.3 Management Steps Required to Execute the Approach
You need to follow some basic steps to solve difficult cross-func-tional problems, as shown in Figure 1.1. Throughout this book, you can see the details surrounding this approach. You need to establish upfront that this approach requires executive-level commitment and buy-in to be successful. A primary goal of the process is to drive the corporate objectives into a cross-functional analysis that best solves problems for the company as a whole. To accomplish this, senior executives must establish or communicate the objectives and support the overall approach so that the appropriate executives, managers, and subject matter experts also engage in the process.
Next to each of the steps listed in Figure 1.1, you can identify the management level required for the process. Each level of manage-ment serves an important part in the process. The executive levels of vice president and director must be committed to contribute so that the issues important to their organization and the interactions between the cross-functional organizations are represented in the process. Managers and subject matter experts conduct the actual analyses and assessments based on the overall organizational goals. When gathering the data used in the analysis, it requires involving those that gather and use this data at each level of the organization. Each layer of management and individual contributors play a part in driving corporate objectives into the solutions developed at each level through this process.
A project manager (with a Project Management Professional [PMP] certification) or an internal project manager should coordinate the effort. This project manager can coordinate the meetings with the task force and core team; establish time lines; ensure that the activity remains within scope, schedule, and cost; and provide status updates to executives. Additionally, the project manager must facilitate the definition of functional and system requirements and provide those requirements to the appropriate executing organization, such as IT or various operational groups. Project management techniques provide an excellent way to coordinate an activity such as this.
02_9780132869782_ch01.indd 4 11/9/11 11:03 AM

Chapter1 • DefinetheObjeCtivesanDiDentifyMetriCs 5
Identifying the goals and objectives of the organization requires upper management involvement in setting goals and communicating these goals to the decision makers at all levels of the organization. Upper management is interviewed by facilitators who utilize Group Decision-Making techniques to help determine a consensus of the corporate objectives. This involves discussing the corporate and
Figure 1.1 Overview of Integrated Corporate Planning Approach
02_9780132869782_ch01.indd 5 11/9/11 11:03 AM

6 A ProfessionAl’s Guide to decision science And Problem solvinG
departmental objectives and goals with all the business components, such as operations, sales, marketing, and finance.
To understand the problem, you must understand the decisions that must be made at each level. This includes defining the questions so that the answers are consistent with the corporate and individual goals. The answers to the following questions should support overall corporate goals.
• How much should I produce of a product in each of the product lines?
• What research items should be funded? • What are my warehousing requirements? • How does my production affect my inventory requirements? • What should I plan to produce to meet customer demand? • How can I optimize scheduling delivery vehicles? • And, many others.
You must also determine what you can actually change and what you cannot change within the organization. For example, if an organi-zation wants to determine products to keep in a product line, it is not likely that the flagship items should be removed from the product line without considering their impact on all products.
Fixed operating constraints that you cannot change may also exist. This may include any number of constraints on current opera-tions such as plant capacities, warehouse space, and the amount of resources available for spending in a given year. Usually a whole range of operating constraints exists from manufacturing, warehousing, dis-tribution, and other areas of the company that affect the decision lati-tude that can be made.
You need to define the operating constraints and the variables associated with the actual decisions to be made, such as things that can be rationally changed in the normal course of business opera-tions. This may include things such as plant throughput, funding of programs, sales commission structures, and others. The idea here is to determine what decisions can be made or changed and what cannot be changed. Understanding the decision limitations within an organi-zation defines the operating constraints of the decision process.
02_9780132869782_ch01.indd 6 11/9/11 11:03 AM

Chapter1 • DefinetheObjeCtivesanDiDentifyMetriCs 7
This part of the process involves determining the best criteria or means to measure the success of meeting the objectives and goals in the model. These criteria with their measures or metrics provide the decision maker with a quantification of the degree of success in achieving the goals of the organization. Based on the goals and objec-tives established previously, this part of the process involves deter-mining the data sources and potential data elements that you can use as measures of success for the organization. You can gather these metrics from organizational data sources or from experts within the organization. First identifying those criteria that specifically measure the objectives is a key step before determining if data is available for the associated metric. Sometimes, a good metric may not have data that you can easily obtain to support it.
Maintaining metrics can be cumbersome. Keeping the number of criteria small, say around 5, should be sufficient. Decisions are usually made on only one or two key criteria, and the rest don’t actually influ-ence the decision. Perform sensitivity analysis to determine which of the metrics are the key metrics.
The result of this are the definition of the objectives and then the decisions to be made and the metrics used to measure the success of the proposed decisions.
1.4 Solving the Right ProblemThe process of organizational decision making is complex because
executives have their own goals independent of the corporate goals. The challenge is to balance the individual objectives and goals with the corporate objectives and goals both in the short and long term.
Traditionally, decisions are made in a stovepipe fashion. That is, each functional area makes decisions that are best for it without regard to the needs of the other functions; for example, manufactur-ing is not concerned with marketing or distribution or finance. The reason for this is the reward system for each functional area focuses only on the efficiency for that system. That is, the plant manager or operations manager is rewarded for such things as utilization of assets, return on assets, throughput, quality, minimum labor cost, and scrap
02_9780132869782_ch01.indd 7 11/9/11 11:03 AM

8 A ProfessionAl’s Guide to decision science And Problem solvinG
for the units produced. None of these factors measure marketing effi-ciencies or any other functions. Marketing, for example, is basically measured and rewarded for total sales and not on specific products or product mix. When each function goes its separate way and decisions are made that improve that single function, who is looking out for the company as a whole? It begs the question, “Who is running the com-pany?” Is it running by default where the strongest personality drives the company from their functional perspective? How, then, can you develop an overall plan for the good of the company where individual functions are sacrificed a little for the overall good? This may result in manufacturing making products that don’t fully utilize the produc-tion assets; where marketing doesn’t maximize the total volume sales but sells an optimum mix of products that maximize customer service and maximize profitability. You can then see it would be much better overall if there were a combined reward system so that the overall good of the organization is achieved in place of individual goals in the short and long term.
This leads to the issue of how best to manage the many objectives and how to trade off between them so that the entire organization prospers now and in the future. To do this you must first state the organization’s goals and objectives. You must first specifically deter-mine what these goals are in the short term and for the future and then set up metrics to measure how well you accomplish them. One way to do this is to ask some difficult questions. What are you trying to accomplish within the company? What are you trying to accom-plish at each organizational level? Unfortunately, most firms do not spend time asking these questions, or if they do, they don’t imple-ment the answers into their everyday operations. Why does this hap-pen in nearly all the corporations, large and small and at every level? Although everyone’s intentions are good in setting corporate objec-tives, the major problem is that with today’s approach to manage-ment, the objectives are ill-defined and consequently impossible to implement. How then can you ensure the corporate objectives are implemented throughout the organization, and how can you measure their success? The primary reason corporate objectives are not imple-mented at the operations level (which is the only place they can make an impact) is that they usually are subservient to individual managers’ objectives.
02_9780132869782_ch01.indd 8 11/9/11 11:03 AM

Chapter1 • DefinetheObjeCtivesanDiDentifyMetriCs 9
Thus you must ask, “How can we get there if we don’t know where we are going?” More specifically, what are you trying to accomplish at the corporate level, at the functional level, and most important at the individual or action level? A great deal of effort goes into establishing a 3-year plan and identifying a number of corporate objectives with everyone pretending to agree, knowing full well the plan will be put on the shelf and promptly forgotten after the exercise is over.
1.5 Developing an Understanding of the Problem
This phase of the process is focused on developing an understand-ing of what the organization wants to accomplish. In this process you ask the difficult questions and correctly interpret the answers that reveal the correct problems.
Answering these questions requires getting key individuals to look closely at what they each want to accomplish individually and companywide. This process takes thought and reflection by manage-ment. Starting this type of thought process makes management focus on its individual needs and then integrate them into the overall needs of the organization. Many times, individuals are not overtly aware of how solving their problems impacts the other divisions within their company. Bringing these individuals together and addressing the problems forces them to look at their problems as total organizational problems.
1.6 Defining Goals and Objectives of a Company or Organization
You can use a number of different methods and approaches to define corporate goals and objectives, using formal and informal pro-cedures. Doing this can provide the organization with a definition of its goals and objectives that represent its current thinking. These goals and objectives can then be integrated into the decision-making process so that decisions made with the decision model are struc-tured to impact all levels of the organization and are quantifiable and defensible.
02_9780132869782_ch01.indd 9 11/9/11 11:03 AM

10 A ProfessionAl’s Guide to decision science And Problem solvinG
In establishing corporate goals and objectives, consider using management to get a group consensus. Available group decision-mak-ing techniques vary in degrees of formality and you can use them to facilitate this process. Techniques range from simple brainstorming to more sophisticated methods. The end result should be a clear defi-nition of what a corporation views as its goals and objectives. When defined, these goals and objectives can then be built into the decision process. Following is a sequence of steps that you can use to establish the goals and objectives of an organization.
1.6.1 Establish Goals and Objectives
The first step involves establishing the objectives for the orga-nization. Primary decision makers should meet together to ensure that all the components of the organization are represented in the decision process and are represented in the objectives. One approach is to provide to the group a “straw man” list of corporate objectives as a starting point in the development of the final list of objectives. The straw man list is based on the objectives that have historically been deemed important to the group and may include objectives such as maximizing profitability, minimizing risk, mini-mizing cost, or maximizing growth. The executive group can then use these as a starting point and brainstorm to add or delete from the list. As part of this process, the group should also provide a high-level definition of the objectives so that all involved under-stand what is meant by them.
Another method, the Nominal Group Technique (NGT), which utilizes a written form for the generation of ideas, is a more formal-ized method that you can use to develop corporate objectives. This method attempts to minimize conforming influences and maintain social-emotional relationships in the process. It provides for equality of participation and for all members to influence the group decision through voting and ordering of priorities. Appendix A, “Overview of Methodologies,” provides a description of this method, along with several others that can be used in this process.
Managers may not have the authority to affect high-level deci-sions; however, the establishment of these objectives and the
02_9780132869782_ch01.indd 10 11/9/11 11:03 AM

Chapter1 • DefinetheObjeCtivesanDiDentifyMetriCs 11
development of the subsequent decision criteria and metrics give managers a defensible position in their decisions. The objectives established in this manner can provide the building blocks for establishing the decision criteria and metrics used within the deci-sion model.
It is also beneficial to establish a mission statement for the orga-nization. A mission statement is a succinct statement, typically one sentence that summarizes the purpose of the organization. A mission statement describes why the organization is in business and what it wants to accomplish.
When any group of individuals meets to conduct activities such as this, it is difficult to arrive at complete agreement. You need to under-stand upfront that this may be the case. In this process, you must leave the latitude to “agree to disagree.” That is, it is okay if there is not complete agreement on all the objectives. Not all objectives may have the same importance to each function of an organization. Weighting the objectives, as described in the next section, provides a means to address that not all individuals may feel the same about the importance of each objective, which can be handled in the modeling process.
Examples of corporate objectives by different industries are shown here.
• Service companies • Improve contract performance. • Minimize operating costs. • Improve customer management.
• Manufacturing companies • Minimize manufacturing costs. • Maximize customer service. • Minimize distribution costs.
• Distribution companies • Minimize operating costs. • Reduce inventory levels. • Improve operating cycle time.
02_9780132869782_ch01.indd 11 11/9/11 11:03 AM

12 A ProfessionAl’s Guide to decision science And Problem solvinG
• Insurance companies • Maximize customer service. • Streamline information technology. • Improve service delivery margin.
• Food Industry companies • Improve profitability. • Increase market share. • Increase sales. • Reduce manufacturing costs. • Reduce distribution costs.
These objectives are broad in nature and can focus management on organizational-level goals. Objectives are weighted to further focus corporate management on key operating areas within the company. Specific decision criteria and metrics further refine the key attributes that constitute the corporate measurement of the objectives. The objectives provide the starting point for the decomposition of strate-gic goals into actionable activities and problem solving.
1.6.1.1 Expert Judgment/Group Participation
The problem of group decision making can be broadly classified into two categories in this field: expert judgment and group consen-sus. The expert judgment process entails making a decision by using expertise gained through experience. Specifically, it is concerned with making judgments and constructing new solutions to the problem. On the other hand, the group consensus process involves groups that have common interests, such as executive boards and organizations, making a decision.
Expert judgment and group consensus methods involve meth-ods commonly utilized in the group decision-making process. Cre-ative methods used to extract, generate, and stimulate new ideas may include brainstorming, brainwriting, or Nominal Group tech-nique. Techniques that are used to explore and clarify existing issues might include surveys, conferences, and the Successive Proportional
02_9780132869782_ch01.indd 12 11/9/11 11:03 AM
Chapter1 • DefinetheObjeCtivesanDiDentifyMetriCs 13
Additive Numeration (SPAN) technique. For planning and execution, you can use techniques such as Gantt charts, PERT, and CPM. (Refer to Appendix B, “Detailed Methodologies,” for a detailed description of methods.)
1.6.1.2 Weight the Objectives to Determine Their Importance
Many times goals and objectives can be stated as being important to an organization but the relative importance of them is not quanti-fied. In addition, there are typically conflicting objectives in which the improvement in one area may adversely impact another area. For example, improvements in information technology may also lead to increases in capital costs. This step is to generate an overall impor-tance for each of the established goals and objectives. This is accom-plished by having each of the team members weigh the objectives established in the previous step for their view of overall importance in decisions. You can use the Normalized Direct Weighting scheme described next to weigh the objectives. You can also use a more com-plex weighing scheme such as SPAN or Borda, but they require auto-mation to be practical. (Refer to Appendix B for a detailed description of methods.)
A weighting scheme for the example objectives of Maximize Cus-tomer Satisfaction, Minimize Logistics Costs, Maximize Growth, and Maximize Sales is shown in Table 1.1. This weighting scheme was generated by the Normalized Direct Weighting scheme. A set of weights should be generated by each of the team members. These can then be averaged to determine a group weighting of the objectives. In this example, each of the four individuals weighted the objectives on a scale of 1 to 10, where 10 was the most important. These then are totaled and normalized for the individuals and the group overall.
Objective weighting can come from senior management’s view of corporate strategic direction. Another approach to weighting objec-tives is to determine the percent of budget that falls within a given corporate functional area. Weighting objectives using the number of dollars quantifies the magnitude of financial importance associated with a functional area. This provides a view of the potential impacts of improvement opportunities for a given functional area.
02_9780132869782_ch01.indd 13 11/9/11 11:03 AM

14 A ProfessionAl’s Guide to decision science And Problem solvinG
Tabl
e 1.
1 G
roup
Con
sens
us W
eigh
ting
of O
bjec
tives
OB
JEC
TIV
E
Exp
ert
#1
Inpu
t
Exp
ert
#1
Wei
ghts
Exp
ert
#2
Inpu
t
Exp
ert
#2
Wei
ghts
Exp
ert
#3
Inpu
t
Exp
ert
#3
Wei
ghts
Exp
ert
#4
Inpu
t
Exp
ert
#4
Wei
ghts
Tot
al
Inpu
t
Val
ues
Ove
rall
Wei
ght
Max
imiz
e C
usto
mer
Sa
tisfa
ctio
n9
28.1
0%10
30.3
0%10
33.3
0%9
30.0
0%38
30.4
0%
Min
imiz
e L
ogis
tics
Cos
ts6
18.8
0%7
21.2
0%3
10.0
0%4
13.3
0%20
16.0
0%
Max
imiz
e G
row
th9
28.1
0%7
21.2
0%7
23.3
0%9
30.0
0%32
25.6
0%
Max
imiz
e Sa
les
825
.00%
927
.30%
1033
.30%
826
.70%
3528
.00%
TO
TA
L32
3330
3012
5
02_9780132869782_ch01.indd 14 11/9/11 11:03 AM

Chapter1 • DefinetheObjeCtivesanDiDentifyMetriCs 15
Assigning an overall importance weighting to the objectives gives the decision makers an idea of what the group as a whole views as the importance of the objectives for the organization. These objectives and their importance also provide the necessary direction and focus in the decision modeling process. You now have a better idea of what you can accomplish as an organization.
1.7 Defining the Framework for the Decisions Being Made
You need to know what the organization wants to accomplish, the purpose of the decisions being made, and the operating environ-ment of the organization. You can then develop the decision model to reflect the conditions and characteristics of the organization. Use the following questions to aid in defining the framework for the model.
• What specific decisions need to be made? • What are the business environment and constraints in which
decisions are made? • What are the firm constraints within which to achieve the goals
and objectives? • What is the flexibility of the decision to be made to achieve the
goals?
Use various fact-finding efforts to answer these questions. Depending on the breadth of the model, this may require that you conduct interviews with individuals in various departments and lev-els within the organization. Individuals currently responsible for the decisions and individuals that have been previously responsible for the decisions are good starting points to gain information. At this point in the development, this should still only be general information that you can use to outline the model being developed.
Decisions to be made with the model would dictate the structure of the model. Some examples of decisions might include the following:
• Establish budgets for the divisions and corporation as a whole. • Determine which products should be in the product line. • List the warehouse requirements.
02_9780132869782_ch01.indd 15 11/9/11 11:03 AM

16 A ProfessionAl’s Guide to decision science And Problem solvinG
• Compile the least-cost production scheduling options. • Assess the facility conditions. • Examine the personnel management and number and skill mix
of employees.
Part of answering these questions and the nature of the infor-mation gathered in the modeling process may provide additional information that you can use to make decisions. For example, use a decision model to allocate resources. However, this can also pro-vide an opportunity to standardize the submission format of budget requests and potentially do various database queries on the submitted budget data to determine how well you make the budget.
The business environment in which the decisions are made is also important in the decision process. In an organizational environment that is dictatorial, no matter what the justification for the decision, the model may be of no use. If it is a group consensus organization, the model should reflect that type of decision-making process so that it is representative of the organization. The model should be focused for-ward and adaptable to changes. For example, if a division combines with another division in the next 3 months, this should be accounted for in the model structure. These types of events should be investi-gated in the model development process.
To determine the framework for the model, you need to identify what elements of the operating environment are fixed and what ele-ments of the environment can change. Fixed constraints would include those elements that have permanent limitations or restrictions in the decision process. In a production environment, it could be limitations on quantities that can be produced, steps in the manufacturing pro-cess required to create an item, warehouse limitations, and others. In budget decisions, this could involve the resource limits, limits on cer-tain types of projects or programs funded, and others. In manpower planning, there may be limitations on the mix of skills required to per-form certain activities or restrictions based on union requirements. A general overall understanding of what cannot change is as important as understanding what can be changed in the model.
Understanding the decision variables that represent the deci-sions to be made by the organization is equally important. Again, these variables are dependent upon the business environment of an
02_9780132869782_ch01.indd 16 11/9/11 11:03 AM
Chapter1 • DefinetheObjeCtivesanDiDentifyMetriCs 17
organization and impact the type of model being built. With a model in a production environment, variables might include the amount of safety stock that is kept in-house or at remote locations or quantities of various products produced. With a model used for resource alloca-tion, the decision may be which research and development projects you should fund.
The accuracy of the model is also an important consideration in the model development process. If a model must be accurate to a high level, such as 99 percent, the level of detail required will be much greater than for a model that must be accurate to 95 percent or 90 percent. The type of data and information processing will be dif-ferent for these two modeling scenarios.
Overall, Group Decision-Making techniques can be useful in many consensus-building situations within the organizational envi-ronment. These techniques are used (as shown in the next chapter) to facilitate the establishment of corporate goals and objectives and in building decision models. Your goal here is to determine what is important to the organization and what is your future direction.
1.8 Metrics for Measuring SuccessWhen an organization has defined and agreed upon its goals and
objectives, decision makers should then develop a means to track and measure the accomplishment of these objectives. Often within an organization, a strategic plan, short-range plan, or long-range plan is developed and published as an edict to the organization. These plans may, however, end up on a shelf with no real meaning in the day-to-day operation of the organization. To drive these goals into the operat-ing decision levels within the organization, these goals and objectives must be translated to meaningful measures of success that are used within the decision process and tracked within the organization. This is key to ensuring that the organizational goals are met. In the last sec-tion you saw how to integrate these organizational goals and weight their importance for all to follow. You now need to track their success.
Because so much data is currently available, you need to deter-mine those measures (metrics) that provide a meaningful measure in
02_9780132869782_ch01.indd 17 11/9/11 11:03 AM

18 A ProfessionAl’s Guide to decision science And Problem solvinG
achieving success within the organization. This process involves iden-tifying criteria that are important to the organization. Typically deci-sions are made based on one or two criteria, so the metrics to support the decision process should be kept to a minimum. An approach is described in this chapter for identifying decision criteria and deter-mining their overall importance in the decision process and measur-ing their success.
Based on identifying the important criteria, then data sources are assessed to determine whether this information can be relatively eas-ily obtained, processed, and maintained. Data should be assessed to determine what level of detail should be maintained for it to be used as a metric to measure success. It may be tracked, for example, on a plant-by-plant basis or rolled up across the organization as a whole. Data can come from both automated sources or from assessments made by experienced executives or experts in the field. The process to establish, track, and maintain metrics and measures of success for an organization provides meaningful information in achieving success and understanding the organization’s operations at every level.
1.9 Definition of a MetricA metric is a standard measure to assess performance in a particu-
lar activity. A metric is a composite of measures that yield systematic insight into the state of the process or products and drives appropriate action. Metrics can be composed of both objective data such as his-torical data reported in a database and subjective data such as expert opinions by senior management or experts in the business.
Metrics are important for a number of reasons. You can use them to defend and justify decisions, to provide objective assessment of progress toward goals, and for problem solving and to validate process improvement. Successful enterprises constantly assess themselves and improve in all dimensions of their enterprise. Metrics provide a foundation for the assessment of success of an activity or enterprise.
A good metric is built upon an organization’s missions, goals, and objectives. A metric must be meaningful and understandable for management and workers alike. The best metrics derive natu-rally from the process in which the data is relevant to the process
02_9780132869782_ch01.indd 18 11/9/11 11:03 AM

Chapter1 • DefinetheObjeCtivesanDiDentifyMetriCs 19
and its collection becomes part of the process. The metric itself must be easily measurable. The requirement for new systems and data to implement a metric should be minimal because if not, data will not be gathered to support it.
Suppose you have established a corporate objective to improve the company’s financial position. Following are metrics you can use to support that objective.
Improve the Company’s Financial Position
• EBIT/EBITDA—Earnings before interest and taxes, and earnings before interest, taxes, depreciation, and amortization
• FCF—Free cash flow; the sum of operating cash flow, financ-ing cash flow, and investment cash flow
• EPS—Earning per share; net earnings or profit divided by the total number of shares issued
• P/E Ratio—Price to earnings ratio; the price of one share of a company divided by its earnings per share
• Net Working Capital—Current assets minus current liabilities • Debt Ratio—Total debt divided by total assets • Debt/Equity Ratio—Total debt divided by shareholder equity • Return on Assets (ROA)—Net earnings divided by total
assets • Return on Equity (ROE)—Net earnings divided by share-
holders’ equity • Operating Margin—Operating earnings divided by total
revenue • EV/EBITDA—Enterprise value (price of the share times total
shares issued) divided by EBITDA
A number of these are related; that is, Debt Ratio (Total debt divided by total assets) and Return on Assets (Net earnings divided by total assets). Key decision criteria and metrics should be limited to the critical metrics so that they are manageable and definitive goals that specific problem solving and improvement activities can be measured against. A resulting subset of metrics that may be used to measure the improvement of a company’s financial position could be EBIT/EBITDA, FCF, EPS, or Debt Ratio.
02_9780132869782_ch01.indd 19 11/9/11 11:03 AM

20 A ProfessionAl’s Guide to decision science And Problem solvinG
A company may choose any number of decision criteria and met-rics to measure project success and evaluate the achievement of its goals. It is better, however, to measure against a few critical criteria rather than try to measure against interrelated criteria or less critical measures.
1.10 Developing Decision Criteria and Metrics
Numerous private sector and government applications provide us an approach to developing decision criteria and metrics. This approach to metrics development is to relate metrics directly to the accomplishment of the goals and objectives of the organization. This process requires the management team to critically examine goals and objectives to ensure the decisions directly relate to these objectives. Decision makers must first establish the goals and objectives and their relative importance in the final decision process. The development of goals and objectives is mentioned in the previous section.
Decision criteria and metrics are then established to support these established goals and objectives. Group decision-making tech-niques are also utilized to provide a means for developing the deci-sion criteria and weighting their importance. All the decision makers should have a say in the final selection of decision criteria to ensure objectivity and avoid having dominant personalities overly control the process. The steps involved in this time-tested approach follows:
Step 1. Establish overall objectives and goals.
Step 2. Weight the objectives to determine their importance.
Step 3. Select the decision criteria.
Step 4. Weight the criteria to determine their importance.
Step 5. Develop metrics.
Overall, this approach provides a consistent, traceable, and defen-sible basis for making decisions. This avoids the “I feel this is what should be done” without any justification. The following is an example
02_9780132869782_ch01.indd 20 11/9/11 11:03 AM

Chapter1 • DefinetheObjeCtivesanDiDentifyMetriCs 21
of the five steps of this process for developing goals, criteria, and metrics.
1.10.1 Step 1: Establish Overall Objectives and Goals
The first step is establishing objectives and goals for an organiza-tion. Goals and objectives are established, noting their common basis and required common theme to represent these objectives. These objectives are then used in the development of the preliminary met-rics schema. The initial cut is continued to be refined until a final set of goals and objectives are established that satisfies the group. Group decision-making techniques are used to gain this consensus (see Sec-tion 1.6.1).
Through a series of meetings and the use of the Nominal Group Technique, a corporation has arrived at the following senior executive corporate objectives.
• Improve customer management. • Improve financial soundness. • Improve market position. • Enhance technology development.
These objectives may be consistent on a year-to-year basis, or may shift on a yearly basis based on corporate strategy.
1.10.2 Step 2: Weight the Objectives to Determine Their Importance
The goals and objectives are then weighted to assess the relative importance of the selected goals and objectives. Group decision-mak-ing techniques are also utilized to facilitate this process. A resulting importance weighting scheme is then developed and reviewed with the decision makers. In each step of the process, the decision makers must understand and agree to the methodologies used in the process.
Table 1.2 is an example of input importance weighting and overall corporate weighting for the four objectives previously identified.
02_9780132869782_ch01.indd 21 11/9/11 11:03 AM

22 A ProfessionAl’s Guide to decision science And Problem solvinG
Tabl
e 1.
2 Ex
ampl
e of
Impo
rtanc
e W
eigh
ting
by E
xecu
tives
OB
JEC
TIV
E
VP
O
pera
tion
s In
put
VP
O
pera
tion
s W
eigh
ts
VP
Sal
es/
Mar
keti
ng
Inpu
t
VP
Sal
es/
Mar
keti
ng
Wei
ghts
VP
C
usto
mer
M
anag
emen
t In
put
VP
C
usto
mer
M
anag
emen
t W
eigh
t
Tot
al
Inpu
t
Val
ues
Ove
rall
Wei
ght
Max
/Im
prov
e C
us-
tom
er M
anag
emen
t9
28.1
0%10
30.3
0%10
33.3
0%29
31%
Max
/Im
prov
e F
inan
-ci
al S
ound
ness
618
.80%
721
.20%
310
.00%
1617
%
Max
/Im
prov
e M
arke
t Po
sitio
n9
28.1
0%7
21.2
0%7
23.3
0%23
24%
Max
/Enh
ance
Tec
h-no
logy
Dev
elop
men
t8
25.0
0%9
27.3
0%10
33.3
0%27
28%
TO
TA
L32
3330
95
02_9780132869782_ch01.indd 22 11/9/11 11:03 AM

Chapter1 • DefinetheObjeCtivesanDiDentifyMetriCs 23
1.10.3 Step 3: Select the Decision Criteria
For each of the objectives established in step 1, the group must establish a hierarchy of decision criteria to represent the various objec-tives. Define the decision criteria so that there is a clear understand-ing of the criteria used and what metrics will be used to measure the criteria. This definition phase provides the framework for establish-ing the metrics associated with each of the decision criteria. A “first cut” of the overall decision criteria will be developed, reviewed, and revised as necessary by the decision makers and senior management. Table 1.3 shows an example of the corporate goals with their associ-ated decision criteria and metrics.
Table 1.3 Develop the Decision CriteriaCorporate Objectives Decision Criteria and Metrics
Customer Calls
Customer Turn Over
Improve Customer Management Customer Satisfaction
OBIDA
Free Cash Flow
Improve Financial Soundness Debt
Market Share
Brand Loyalty
Improve Market Position Ability to Attract New Customers
First to Market
Technology Development
Enhance Technology Development Innovation
1.10.4 Step 4: Weight the Criteria to Determine Their Importance
Team members then weight the criteria established in step 3 for their relative importance in the decision process. Again, use group decision-making techniques to facilitate this process. The team must develop a “first cut” of the decision criteria weights and review and revise their findings to ensure reasonableness. Table 1.4 shows an
02_9780132869782_ch01.indd 23 11/9/11 11:03 AM
24 A ProfessionAl’s Guide to decision science And Problem solvinG
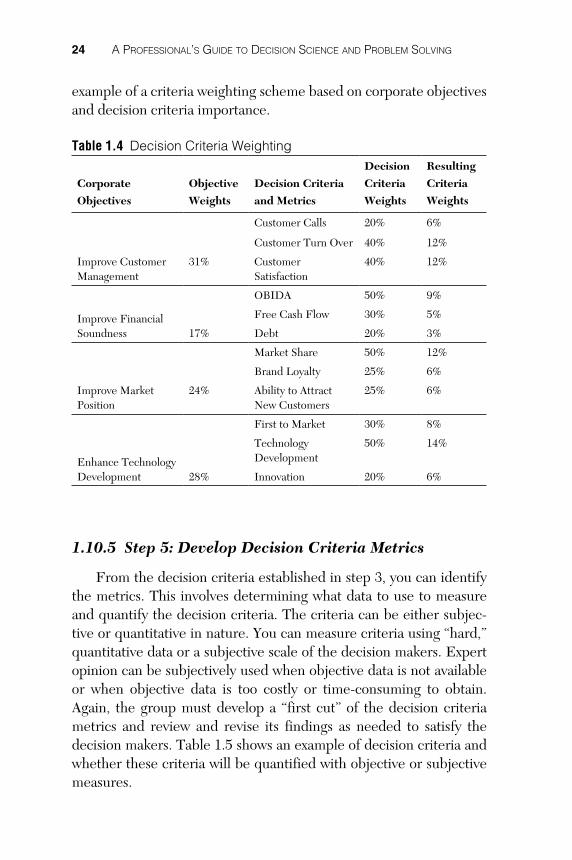
example of a criteria weighting scheme based on corporate objectives and decision criteria importance.
Table 1.4 Decision Criteria Weighting
Corporate
Objectives
Objective
Weights
Decision Criteria
and Metrics
Decision
Criteria
Weights
Resulting
Criteria
Weights
Customer Calls 20% 6%
Customer Turn Over 40% 12%
Improve Customer Management
31% Customer Satisfaction
40% 12%
OBIDA 50% 9%
Improve Financial Soundness
Free Cash Flow 30% 5%
17% Debt 20% 3%
Market Share 50% 12%
Brand Loyalty 25% 6%
Improve Market Position
24% Ability to Attract New Customers
25% 6%
First to Market 30% 8%
Enhance Technology Development
Technology Development
50% 14%
28% Innovation 20% 6%
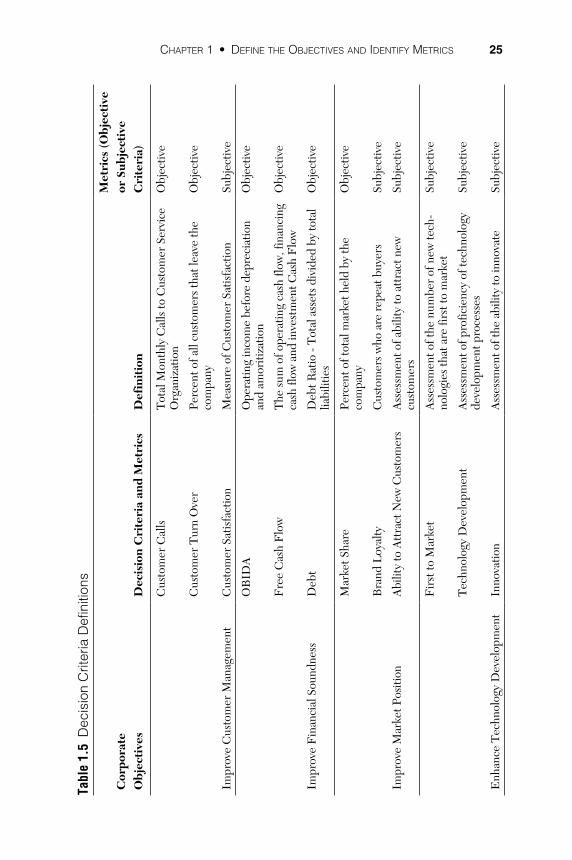
1.10.5 Step 5: Develop Decision Criteria Metrics
From the decision criteria established in step 3, you can identify the metrics. This involves determining what data to use to measure and quantify the decision criteria. The criteria can be either subjec-tive or quantitative in nature. You can measure criteria using “hard,” quantitative data or a subjective scale of the decision makers. Expert opinion can be subjectively used when objective data is not available or when objective data is too costly or time-consuming to obtain. Again, the group must develop a “first cut” of the decision criteria metrics and review and revise its findings as needed to satisfy the decision makers. Table 1.5 shows an example of decision criteria and whether these criteria will be quantified with objective or subjective measures.
02_9780132869782_ch01.indd 24 11/9/11 11:03 AM
Chapter1 • DefinetheObjeCtivesanDiDentifyMetriCs 25
Tabl
e 1.
5 D
ecis
ion
Crit
eria
Def
initi
ons
Cor
pora
te
Obj
ecti
ves
Dec
isio
n C
rite
ria
and
Met
rics
Def
init
ion
Met
rics
(O
bjec
tive
or
Sub
ject
ive
C
rite
ria)
Cus
tom
er C
alls
Tot
al M
onth
ly C
alls
to C
usto
mer
Ser
vice
O
rgan
izat
ion
Obj
ectiv
e
Cus
tom
er T
urn
Ove
rPe
rcen
t of a
ll cu
stom
ers
that
leav
e th
e co
mpa
nyO
bjec
tive
Impr
ove
Cus
tom
er M
anag
emen
tC
usto
mer
Sat
isfa
ctio
nM
easu
re o
f Cus
tom
er S
atis
fact
ion
Subj
ectiv
e
OB
IDA
Ope
ratin
g in
com
e be
fore
dep
reci
atio
n an
d am
oriti
zatio
nO
bjec
tive
Fre
e C
ash
Flo
wT
he s
um o
f ope
ratin
g ca
sh fl
ow, f
inan
cing
ca
sh fl
ow a
nd in
vest
men
t Cas
h F
low
Obj
ectiv
e
Impr
ove
Fin
anci
al S
ound
ness
Deb
tD
ebt R
atio
- T
otal
ass
ets
divi
ded
by to
tal
liabi
litie
sO
bjec
tive
Mar
ket S
hare
Perc
ent o
f tot
al m
arke
t hel
d by
the
com
pany
Obj
ectiv
e
Bra
nd L
oyal
tyC
usto
mer
s w
ho a
re r
epea
t buy
ers
Subj
ectiv
e
Impr
ove
Mar
ket P
ositi
onA
bilit
y to
Att
ract
New
Cus
tom
ers
Ass
essm
ent o
f abi
lity
to a
ttra
ct n
ew
cust
omer
sSu
bjec
tive
Fir
st to
Mar
ket
Ass
essm
ent o
f the
num
ber
of n
ew te
ch-
nolo
gies
that
are
firs
t to
mar
ket
Subj
ectiv
e
Tec
hnol
ogy
Dev
elop
men
tA
sses
smen
t of p
rofic
ienc
y of
tech
nolo
gy
deve
lopm
ent p
roce
sses
Subj
ectiv
e
Enh
ance
Tec
hnol
ogy
Dev
elop
men
tIn
nova
tion
Ass
essm
ent o
f the
abi
lity
to in
nova
teSu
bjec
tive
02_9780132869782_ch01.indd 25 11/9/11 11:03 AM
26 A ProfessionAl’s Guide to decision science And Problem solvinG
1.11 Data Used to Support MetricsYou can use either objective or subjective data to represent metrics
used in the decision process. Objective data usually can be described as data that can be quantified by some measure of known commonal-ity. This may be data such as the number of items produced, number of trucks in a location, population of a city, and so on. This data is usually available in some form in company databases and information systems. Typically, statistics such as averages and trends are gener-ated based on a record of this objective data over some period in time. Objective or quantitative data represents a history of activities of a company that has been operating during a given time period.
Qualitative or subjective data can be easily used in a number of different situations. Surveys are good examples of subjective data used to represent a rating of a product or service. Use scales from 1 to 5 or 1 to 10 to represent high, medium, and low assessments for given metrics. Use assessments such as red, yellow, and green in other situations in which individuals (such as military personnel) might find more meaning in rating conditions. Numerical values with their verbal description provide the type of information that can be captured and utilized in a decision model when other information is not available.
Subjective data is data based on someone’s opinion or best guess of a condition or a future event. Subjective data is more qualitative in nature in that it defines a situation or condition without specific data points. Subjective data can be generated by individuals within or out-side of a company or experts within a given field of operation.
Typically, subjective data or opinions provide insights into a sub-jective assessment of a metric. Subjective data and expert opinions are typically forward looking in nature trying to predict what will hap-pen in the future. Individuals make assessments based on what has happened in the past and what may happen in the future. Objective data, especially in the form of statistics, however, is based on historical data, thus projecting the future, what has happened in the past, which assumes that the future will behave much like the past. The entire business environment may have changed; thus, what has happened in the past may be a poor representation of the future; thus, a new source of data is required.
02_9780132869782_ch01.indd 26 11/9/11 11:03 AM
Chapter1 • DefinetheObjeCtivesanDiDentifyMetriCs 27
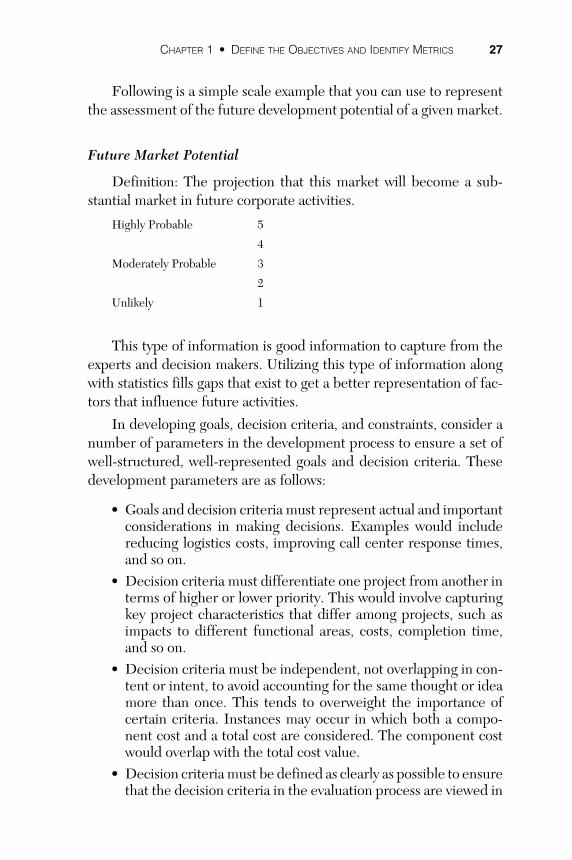
Following is a simple scale example that you can use to represent the assessment of the future development potential of a given market.
Future Market Potential
Definition: The projection that this market will become a sub-stantial market in future corporate activities.
Highly Probable 5
4
Moderately Probable 3
2
Unlikely 1
This type of information is good information to capture from the experts and decision makers. Utilizing this type of information along with statistics fills gaps that exist to get a better representation of fac-tors that influence future activities.
In developing goals, decision criteria, and constraints, consider a number of parameters in the development process to ensure a set of well-structured, well-represented goals and decision criteria. These development parameters are as follows:
• Goals and decision criteria must represent actual and important considerations in making decisions. Examples would include reducing logistics costs, improving call center response times, and so on.
• Decision criteria must differentiate one project from another in terms of higher or lower priority. This would involve capturing key project characteristics that differ among projects, such as impacts to different functional areas, costs, completion time, and so on.
• Decision criteria must be independent, not overlapping in con-tent or intent, to avoid accounting for the same thought or idea more than once. This tends to overweight the importance of certain criteria. Instances may occur in which both a compo-nent cost and a total cost are considered. The component cost would overlap with the total cost value.
• Decision criteria must be defined as clearly as possible to ensure that the decision criteria in the evaluation process are viewed in
02_9780132869782_ch01.indd 27 11/9/11 11:03 AM

28 A ProfessionAl’s Guide to decision science And Problem solvinG
the same context. Individuals have different perspectives asso-ciated with various terms and definitions. The definitions must be clear.
• Measures and scales developed for the decision criteria must be meaningful in the evaluation process and the data to perform the evaluation easily accessible. Objective data provides a basis for a relatively clear scale or measure. The use of subjective criteria requires that the scale components are clearly defined and represent a natural language intention and meaning.
• Constraints that represent types of mixes, qualifiers, and condi-tions that would be applied to a prioritized list of items must be identified and differentiated from the evaluation decision criteria. You must define the operating parameters. This may be total budget, capacity constraints, and manpower avail-ability. All of these components put bounds around the issue addressed.
1.12 Structure and Definition of the Problem
The steps and analysis described provide a basis for the defini-tion of the problem and structure of the information. The information gathered as part of the analysis performed in the process provides the basis for further development of the example model. This framework is used to illustrate the process and for assessing and developing the required data to be used for the study and selecting the best method-ologies to use in the model.
1.13 Key Concepts in Defining the Objectives
Following are the key points of this chapter:
• Groundwork in understanding and defining the problems fac-ing a corporation is essential to bring to light functional areas requiring improvement. They need to determine the scope of functional areas that may be impacted.
02_9780132869782_ch01.indd 28 11/9/11 11:03 AM

Chapter1 • DefinetheObjeCtivesanDiDentifyMetriCs 29
• It is necessary to establish corporate objectives to strategically define the direction of a company. This requires consensus among decision makers.
• A corporation has multiple conflicting objectives that require the balancing of cross-function activities.
• Decision criteria and metrics provide quantifiable measures that can be driven down into the corporate decisions so that activities meet the corporate objectives.
• Understanding the data required and data available to support corporate metrics facilitates the measurement of the key met-rics and contribution to accomplishing corporate objectives.
• Subjective data or opinions provide insights into a subjective assessment of a metric. Subjective data and expert opinions are typically forward looking in nature, trying to predict what will happen in the future as opposed to statistical analysis that deals with historical data.
• It is important to weight the objectives and metrics across all executives to gain a consensus in the direction of the company.
• Senior executives must be involved in this initial step of the process to establish the corporate objectives that can drive the cross-functional problem solving effort.
02_9780132869782_ch01.indd 29 11/9/11 11:03 AM

02_9780132869782_ch01.indd 30 11/9/11 11:03 AM

241
Index
AAccess, 64activities. See Activity Relationship
Diagram; Activity Relationship Matrix
Activity Relationship Diagramcase study: new product
development, 143-144explained, 39-43, 105-107
Activity Relationship Matrixcase study: airline merger, 169-170case study: logistics service provider,
104-105case study: new product
development, 140-141closeness rating scale, 36developing, 35-37reasons for closeness value, 36relationship chart, 36
AI (artificial intelligence)explained, 68, 210-211 methods, 212-211
airline merger (case study), 159-161decision criteria, developing,
163-168decision criteria metrics,
166-168identifying objectives and
goals, 163selecting decision criteria,
164-165weighting criteria, 165-166weighting objectives, 163-164
integrated corporate planning approach
Activity Relationship Diagram, 173-174
Activity Relationship Matrix, 169-170
industry benchmarks, 170-173scope of problem, assessing, 169specific problem areas to
improve, 174-182objectives, defining, 161-162problem solving, 192-195results, evaluating, 195-201scope of problem, assessing,
182-186data that supports
measurement of objectives, 186-187
defining sphere of control, 183identifying problem areas,
182-1834upstream and downstream
interactions, 186sensitivity analysis, 194-199statistical analysis, 195-201
alternatives, evaluating, 75, 126-127analysis. See data analysis; statistical
analysis; what-if analysisanalytical hierarchy process, 223-224artificial intelligence. See AI (artificial
intelligence)
16_9780132869782_index_revised.indd 241 11/9/11 11:13 AM
242 Index
assessing scope of problem, 34-35, 47, 92business process modeling, 48-50case study: airline merger, 169,
182-186case study: logistics service
provider, 104case study: new product
development, 140, 144-147 key activities, identifying, 54-55key corporate participants, 47metrics, 56panoramic view, 50-51problem areas, identifying, 51-53role in overall business process, 48sphere of control, identifying, 54unique application of techniques
and methods, 56upstream and downstream
interactions, 54-55automation (model), 77-79averages
moving averages, 216, 233-234weighted moving averages, 216-217,
234-235
Bbenchmarks
case study: airline merger, 170-173case study: logistics service
provider, 105case study: new product
development, 142-143functional area benchmark
improvements, 84industry benchmarks, 37-38
Borda's function, 225-226brainstorming, 232brainwriting, 232-233business process modeling, 48-50
Ccase studies
airline merger, 159-161decision criteria, developing,
163-168decision criteria metrics,
166-168integrated corporate planning
approach, 169-182 objectives, defining, 161-162 problem solving, 192-195results, evaluating, 195-201scope of problem, assessing,
182-183sensitivity analysis, 195-201 statistical analysis, 187-192
logistics service provider, 97Activity Relationship Diagram,
105-107Activity Relationship Matrix,
104-105decision criteria, developing,
99-102economic analysis, 125industry benchmarks, 105metrics, 99-102objectives, defining, 98-99performance evaluations, 105,
122-123problem solving, 115-121ranking of alternatives, 126-127results, measuring, 115-121scope of problem, assessing,
104, 109-114sensitivity analysis, 127-128specific problem areas to
improve, 109statistical analysis, 104-115variability of metrics, 107
new product development, 131decision criteria, developing,
132-136decision criteria metrics,
134-140
16_9780132869782_index_revised.indd 242 11/9/11 11:13 AM

Index 243
integrated corporate planning approach, 140-144
objectives, 131-132problem solving, 148-153results, evaluating, 153-155results, measuring, 148-153scope of problem, assessing,
144-147sensitivity analysis, 153-154statistical analysis, 147-148
Central Limit Theorem, 66changing importance weights, 88closeness rating scale, 36, 41corporate objectives
defining, 9-12weighting, 13-15
corporate planning. See integrated corporate planning approach
Cost Breakdown Structure, 83-85
Ddata analysis, 59
AI (artificial intelligence), 68data summarization
data groupings, 65-68explained, 62-63queries and summaries, 63-65
decision methodologies, 68expert opionion, 68forecasting, 68fuzzy logic, 68group decision making, 68key corporate participants, 59modeling process, 59-62multiple criteria decision making, 68multiple objective decision
making, 69statistical analysis, 68
data groupings, 65-68data mining. See data analysis;
statistical analysisdata summarization
data groupings, 65-68explained, 62-63queries and summaries, 63-65
databases, 78debt ratio, 19debt/equity ratio, 19decision criteria
case study: airline merger, 163-168decision criteria metrics,
166-168identifying objectives and
goals, 163 selecting decision criteria,
164-165weighting criteria, 165-166weighting objectives, 163-164
case study: logistics service providerdecision criteria metrics, 101identifying objectives and
goals, 99selecting decision criteria, 100weighting criteria, 101-102weighting objectives, 100
case study: new product development, 132-136
decision criteria metrics, 134-140
identifying objectives and goals, 133
selecting decision criteria, 134-135
weighting criteria, 134-136weighting objectives, 133-134
decision criteria metrics, 24developing, 20-21objectives
defining, 21weighting, 21-22
selecting, 23weighting, 23-24
decision methodologies, 68. See also specific methodologies
decision process model, 73-77corporate decision criteria, 74development and economic benefit
scoring scale, 75evaluation of alternatives, 75model automation, 77-79
16_9780132869782_index_revised.indd 243 11/9/11 11:13 AM

244 Index
performance indicators targeted for improvement, 73
defining. See also identifyingframework, 15-17objectives, 91
case study: airline merger, 161-162
case study: logistics service provider, 98-99
case study: new product development, 131-133
corporate objectives, 9-12integrated corporate planning
approach, 4-7key concepts, 28-29solving the right problem, 7-9understanding the problem, 9weighting scheme, 13-15
degree of success, measuring, 81-83functional area benchmark
improvements, 84performance improvements, 82
developing Activity Relationship Matrix, 35-37closeness rating scale, 36reasons for closeness value, 36relationship chart, 36
development and economic benefit scoring scale, 75
diagramsActivity Relationship Diagram,
39-43, 105-107case study: airline merger,
173-174case study: new product
development, 143-144Cost Breakdown Structure, 83-85
distribution, normal, 65distribution companies, corporate
objectives of, 11downstream interactions, 54-55
case study: airline merger, 186case study: logistics service
provider, 113case study: new product
development, 146-147
Eearnings per share (EPS), 19EBIT, 19EBITDA, 19economic analysis
case study: logistics service provider, 125
explained, 83-85Eigenvector method, 223-224EPS (earnings per share), 19evaluating results, 92
case study: airline merger, 195-201case study: logistics service provider
economic analysis, 125performance evaluations,
122-123ranking of alternatives, 126-127sensitivity analysis, 127-128
case study: new product development, 153-155
economic analysis, 83-85key concepts, 90key corporate participants, 81measuring degree of success, 81-83
functional area benchmark improvements, 84
performance improvements, 82sensitivity analysis, 86-89what-if analysis, 86-89
analyzing impact of evaluation scores, 89
changing importance weights, 88
evaluation of alternatives, 75evaluation scores, analyzing impact
of, 89EV/EBITDA, 19Excel, 64expert opinion, 12-13, 68, 218-219 expert systems, 210exponential smoothing, 217, 235-237
16_9780132869782_index_revised.indd 244 11/9/11 11:13 AM

Index 245
FFCF (free cash flow), 19financial contribution of individual
functions, 43-44financial metrics, 19-20food industry companies, corporate
objectives of, 12forecasting, 68, 216
exponential smoothing, 217, 235-237moving averages, 216, 233-234regression analysis, 217-218,
237-238weighted moving averages, 216-217,
234-235framework, defining, 15-17free cash flow (FCF), 19frequency distribution, 215functional area assessments, 40future market potential, 27-28fuzzy logic, 68, 210, 219-220
GGeneral Regression Neural Network
(GRNN), 211Genetic Algorithms, 210GRNN (General Regression Neural
Network), 211group consensus, 12-13group decision making, 68, 213
Borda's function, 225-226brainstorming, 232SPAN technique, 230
grouping data, 65-68
Hhigh, 214histograms, 214-215Hwang, C. L., 224
Iidea generation
brainstorming, 232brainwriting, 232-233
identifying. See also definingfinancial contribution of individual
functions, 43-44key activities, 54-55key corporate functions, 34-35problem areas, 44-46, 51-53
case study: logistics service provider, 110-112
case study: new product development, 144-146
specific problem areas to improvecase study: airline merger,
174-182case study: logistics service
provider, 109case study: new product
development, 144sphere of control, 54
case study: airline merger, 183case study: logistics service
provider, 112variability of metrics, 43-44
industry benchmarks, 37-38case study: airline merger, 170-173case study: logistics service
provider, 105case study: new product
development, 142-143insurance companies, corporate
objectives of, 12integrated corporate planning
approachActivity Relationship Diagram,
39-43Activity Relationship Matrix, 35-37
closeness rating scale, 36reasons for closeness value, 36relationship chart, 36
16_9780132869782_index_revised.indd 245 11/9/11 11:13 AM

246 Index
case study: airline mergerActivity Relationship Diagram,
173-174Activity Relationship Matrix,
169-170industry benchmarks, 170-173scope of problem, assessing, 169specific problem areas to
improve, 174-182case study: logistics service provider
data that supports measurement of objectives, 113-114
key activities, 112-113problem areas, 110-112scope of problem, assessing,
109-114sphere of control, 112upstream and downstream
interactions, 113case study: new product
development, 140-144Activity Relationship Diagram,
143-144Activity Relationship Matrix,
140-141industry benchmarks, 142-143performance evaluations,
142-143scope of problem, assessing, 140specific problem areas to
improve, 144data analysis. See data analysisexplained, 4-7, 32-34, 91-92financial contribution of individual
functions, 43-44industry benchmarks, 37-38key corporate participants, 31performance evaluations, 40problem solving, 71
decision process model, 73-77key corporate participants,
71-72model automation, 77-79selecting method for, 72-73
scope of problem, assessing, 34-35, 47, 92
business process modeling, 48-50
key activities, identifying, 54-55
key corporate participants, 47metrics, 56panoramic view, 50-51problem areas, identifying,
51-53role in overall business process,
48sphere of control, identifying,
54unique application of
techniques and methods, 56upstream and downstream
interactions, 54-55sensitivity analysis, 81
economic analysis, 83-85key corporate participants, 81measuring degree of success,
81-83what-if analysis, 86-89
specific problem areas to improve, 44-46
variability of metrics, 43-44
Kkey activities, identifying, 54-55key corporate functions
financial contribution, 43-44identifying, 34-35
Llogic, fuzzy, 219-220logistics service provider (case
study), 97Activity Relationship Diagram,
105-107Activity Relationship Matrix,
104-105
16_9780132869782_index_revised.indd 246 11/9/11 11:13 AM

Index 247
decision criteria, developingidentifying objectives and
goals, 99selecting decision criteria, 100weighting criteria, 101-102weighting objectives, 100
decision criteria metrics, 101economic analysis, 125industry benchmarks, 105integrated corporate planning
approach, 104data that supports
measurement of objectives, 113-114
key activities, 112-113problem areas, 110-112scope of problem, assessing,
109-114sphere of control, 112upstream and downstream
interactions, 113objectives, defining, 98-99performance evaluations, 105,
122-123problem solving, 115-121ranking of alternatives, 126-127results, measuring, 121-122specific problem areas to
improve, 109statistical analysis, 104-115variability of metrics, 107
low, 214
Mmanagement steps required to
execute approach, 4-7manufacturing companies, corporate
objectives of, 11mean, 214measuring success with metrics, 91
case study: airline merger, 195-201case study: logistics service provider,
121-122
case study: new product development, 148-153
corporate financial position metrics, 19-20
data used to support metrics, 26-28 decision criteria metrics, 24degree of success, 81-83
median, 214methodologies. See specific
methodologiesmetrics, 56
corporate financial position metrics, 19-20
data used to support metrics, 26-28decision criteria metrics, 24
case study: airline merger, 166-168
case study: logistics service provider, 101
case study: new product development, 134-140
explained, 17-18functional area assessments, 40industry benchmarks, 37-38measuring success with, 91variability of
case study: logistics service provider, 107
explained, 43-44Microsoft Access, 64Microsoft Excel, 64mission statements, 11mode, 214model automation, 77-79moving averages, 216, 233-234Multiple Attribute Decision Making
(Hwang), 224multiple criteria decision making, 68
overview, 206taxonomy of methods, 207
multiple objective decision making, 69overview, 208taxonomy of methods, 209
16_9780132869782_index_revised.indd 247 11/9/11 11:13 AM

248 Index
TOPSIS (Technique for Order Preference by Similarity to Ideal Solution)
explained, 226-228sensitivity analysis, 229
Nnetworking capital, 19neural networks, 211new product development (case
study), 131decision criteria, developing,
132-136identifying objectives and
goals, 133selecting decision criteria,
134-135weighting criteria, 134-136weighting objectives, 133-134
decision criteria metrics, 134-140integrated corporate planning
approach, 140-144Activity Relationship Diagram,
143-144Activity Relationship Matrix,
140-141industry benchmarks, 142-143performance evaluations,
142-143scope of problem, assessing, 140specific problem areas to
improve, 144objectives, defining, 131-132problem solving, 148-153results
evaluating, 153-155measuring, 148-153
scope of problem, assessing, 144-147data that supports
measurement of objectives, 147
problem areas, 144-146
sphere of control, 146upstream and downstream
interactions, 146-147sensitivity analysis, 153-154statistical analysis, 147-148
NGT (Nominal Group Technique), 10, 221-222
Nominal Group Technique (NGT), 10, 221-222
normal distribution, 65normalized direct weighting, 13,
222-223
Oobjectives
decision criteria objectivesdefining, 21weighting, 21-22
defining, 91case study: airline merger,
161-162case study: logistics service
provider, 98-99case study: new product
development, 131-133corporate objectives, 9-12experts judgement/group
participation, 12-13integrated corporate planning
approach, 4-7key concepts, 28-29solving the right problem, 7-9understanding the problem, 9weighting scheme, 13-15
weightingcase study: airline merger,
163-164explained, 13-15
object-oriented programming (OOP), 211
OOP (object-oriented programming), 211operating margin, 19
16_9780132869782_index_revised.indd 248 11/9/11 11:13 AM

Index 249
Ppanoramic view, 50-51P/E ratio, 19performance evaluations, 40
case study: logistics service provider, 105
case study: new product development, 142-143
problem areas, identifyingcase study: new product
development, 144-146explained, 51-53
problem solving, 71, 92case study: airline merger, 192-195case study: logistics service provider,
115-121case study: new product
development, 148-153decision process model, 73-77
corporate decision criteria, 74development and economic
benefit scoring scale, 75evaluation of alternatives, 75model automation, 77-79performance indicators targeted
for improvement, 73key corporate participants, 71-72selecting method for, 72-73solving the right problem, 7-9, 91
production variability, 215-216
Q-Rqueries and data summaries, 63-65
reasons for closeness value, 36regression analysis, 217-218, 237-238relationship chart (activities), 36, 41results, evaluating, 92
case study: airline merger, 195-201case study: logistics service provider
economic analysis, 125
performance evaluations, 122-123
ranking of alternatives, 126-127sensitivity analysis, 127-128
case study: new product development, 153-155
economic analysis, 83-85key concepts, 90key corporate participants, 81measuring degree of success, 81-83
functional area benchmark improvements, 84
performance improvements, 82sensitivity analysis, 86-89what-if analysis, 86-89
analyzing impact of evaluation scores, 89
changing importance weights, 88
return on assets (ROA), 19return on equity (ROE), 19ROA (return on assets), 19ROE (return on equity), 19
Ssafety stock, 215-216SAW (Simple Additive Weighting)
method, 224-225scope of problem, assessing, 34-35,
47, 92business process modeling, 48-50case study: airline merger, 169,
182-183data that supports
measurement of objectives, 186-187
defining sphere of control, 183identifying problem areas,
182-184upstream and downstream
interactions, 186
16_9780132869782_index_revised.indd 249 11/9/11 11:13 AM

250 Index
case study: logistics service provider, 104, 109-114
data that supports measurement of objectives, 113-114
key activities, 112-113problem areas, 110-112upstream and downstream
interactions, 113case study: new product
development, 140, 144-147data that supports
measurement of objectives, 147
problem areas, 144-146upstream and downstream
interactions, 146-147key activities, identifying, 54-55key corporate participants, 47metrics, 56panoramic view, 50-51problem areas, identifying,
51-53role in overall business process, 48sphere of control, 146sphere of control, identifying, 54unique application of techniques
and methods, 56upstream and downstream
interactions, 54-55selecting decision criteria, 23
case study: airline merger, 164-165case study: logistics service
provider, 100case study: new product
development, 134-135sensitivity analysis
case study: airline merger, 194-199case study: logistics service provider,
127-128case study: new product
development, 153-154TOPSIS (Technique for Order
Preference by Similarity to Ideal Solution), 229
service companies, corporate objectives of, 11
Simple Additive Weighting (SAW) method, 224-225
simulation, 220solving problems. See problem
solvingSPAN technique, 230specific problem areas to improve,
identifying, 44-46case study: airline merger, 174-182case study: logistics service
provider, 109case study: new product
development, 144sphere of control, identifying, 54
case study: airline merger, 183case study: logistics service
provider, 112spreadsheets, 77standard deviation, 214standard statistics, 214statistical analysis, 68, 214
case study: airline merger, 195-201case study: logistics service provider,
104-115case study: new product
development, 147-148expert opionion, 218-219forecasting, 216
exponential smoothing, 217, 235-237
moving averages, 216, 233-234regression analysis, 217-218,
237-238weighted moving averages, 216-
217, 234-235frequency distribution, 215fuzzy logic, 210, 219-220histograms, 214-215safety stock and production
variability, 215-216simulation, 220standard statistics, 214
16_9780132869782_index_revised.indd 250 11/9/11 11:13 AM

Index 251
straw man lists, 10success, measuring with metrics, 91
case study: airline merger, 195-201case study: logistics service provider,
121-122case study: new product
development, 148-153corporate financial position metrics,
19-20data used to support metrics, 26-28decision criteria metrics, 24
summarizing datadata groupings, 65-68explained, 62-63queries and summaries, 63-65
TTechnique for Order Preference
by Similarity to Ideal Solution (TOPSIS)explained, 226-228sensitivity analysis, 229
TOPSIS (Technique for Order Preference by Similarity to Ideal Solution)explained, 226-228sensitivity analysis, 229
Uunderstanding the problem, 9upstream interactions, 54-55
case study: airline merger, 186case study: logistics service
provider, 113case study: new product
development, 146-147
Vvariability of metrics
case study: logistics service provider, 107
explained, 43-44variance, 214
Wweighted moving averages, 216-217,
234-235weighting
changing importance weights, 88decision criteria, 23-24
case study: airline merger, 165-166
case study: logistics service provider, 101-102
case study: new product development, 134-136
normalized direct weighting, 13, 222-223 objectives, 13-15
case study: airline merger, 163-164
case study: logistics service provider, 100
decision criteria objectives, 21-22
Simple Additive Weighting (SAW) method, 224-225
weighted moving averages, 234-235what-if analysis, 86-89
analyzing impact of evaluation scores, 89
changing importance weights, 88
16_9780132869782_index_revised.indd 251 11/9/11 11:13 AM


